Article

Effects of Flow Spillage Strategies on the Aerodynamic Characteristics of Diverterless Hypersonic Inlets

1
School of Mechanical and Materials Engineering, North China University of Technology, Beijing 100144, China
2
China Academy of Launch Vehicle Technology, Beijing 100076, China
3
College of Energy and Power Engineering, Nanjing University of Aeronautics and Astronautics, Nanjing 210016, China
*
Authors to whom correspondence should be addressed.
Aerospace 2022, 9(12), 771; https://doi.org/10.3390/aerospace9120771
Submission received: 3 November 2022 / Revised: 25 November 2022 / Accepted: 26 November 2022 / Published: 29 November 2022
(This article belongs to the Special Issue Hypersonics: Emerging Research)

Abstract

:
This paper compares the aerodynamic characteristics of a central-spillage diverterless hypersonic inlet (i.e., bump inlet, Form 1) with a side-spillage inlet (Form 2) under on/off design conditions when faced with non-uniform inflow. Both forms are designed for a flight Mach number of 6.0 and a cruise altitude of 24.0 km. Numerical methods are introduced and validated. Integrated design results indicate that based on identical contraction ratios, Form 2 is 27.8% lower in height, 28.3% shorter in length, and 34.4% smaller in the windward projection area than Form 1. This provides the evidence that the side-spillage strategy will suppress the external drag less. Then, the aerodynamic performance is investigated under various upstream/downstream boundary conditions (inflow speed range: Mach 2.0~6.0; backpressure fluctuation range: 1~110.0 times the freestream static pressure). The evaluation methods for non-uniform flow fields are first introduced in this paper. Form 2 has a relatively stronger shock system, which allows it to suppress 4.52% more of the pressure fluctuation from the downstream combustion chamber than Form 1. The inlet start margin is widened by approximately 250% due to the self-adaptive flow spillage ability established by the side-spillage strategy. Furthermore, the compression efficiency, internal shock system, spillage ability, etc., are analyzed in detail. In summary, the side-spillage flow organization strategy has better potential for designing wide-ranging air-breathing flight vehicles.

1. Introduction

The main components of a ramjet or scramjet are the inlet, combustion chamber, and nozzle [1,2]. The inlet decelerates and compresses the airflow [3] for the downstream combustion chamber and nozzle, respectively. The external flow field of the aircraft’s forebody and the internal flow field of the inlet are highly coupled. Hence, numerous studies have been conducted to organize the external and internal flow fields, also known as inlet–airframe integrated design [1,4,5].
According to different flow organization strategies, the integrated design methods can be summarized into three categories: the non-forebody design method (NFDM), the coupled integrated design method (CIDM), and the decoupled integrated design method (DIDM). The NFDM situates the inlet at the aircraft’s leading edge. This is commonly applied in the early-stage theoretical design for some hypersonic aircraft, such as the LAPCAT-MR2 [6,7], the HSGTS [8,9,10], the FALCON-HCV [11,12,13], etc. The airflow in front of the inlet is purely uniform when adopting this strategy. Therefore, the aerodynamic characteristics of the inlet are kept identical to the theoretical design, due to the absence of any external flow influence. Nevertheless, the external shock system of the aircraft will be seriously affected by the inlet’s incident shock under off-design conditions. This will bring extra external drag due to the increase in shock strength. Subsequently, the CIDM and DIDM were introduced to better organize the external and internal flow fields. In the CIDM strategy, the forebody is regarded as part of an external compression surface. The forebody and the inlet combine to form a mixed-compression intake. The NASA X-43 [14] aircraft was the first to realize the CIDM strategy. The whole intake system is highly integrated with the upstream ramp forebody and the downstream supersonic inlet. Later, by combining the waverider concept [15] with osculating flow theory [16], the so-called dual-waverider concept [17,18] was proposed, which can improve both the lift-to-drag ratio of the aircraft (external flow property) and the compression ratio of the inlet (internal flow property). The main challenge for the CIDM is boundary layer diversion problems [19,20,21]. The boundary layer develops along the forebody, while the concave waverider forebody creates a V-shaped crosswise pressure gradient—that is, the pressure of the central position is lower than that on both sides. Most of the boundary layer has to be swallowed into the inlet and inevitably decreases the propulsion efficiency.
In contrast with the above two strategy, the DIDM shows more merits in organizing external and internal flows. The core component of the DIDM is a bump configuration [15,22]. This is a three-dimensional (3D) surface with a caret crosswise pressure distribution (caret: the middle pressure of the surface is higher than the side pressure at a crosswise section). By adopting a bump design technique, the DIDM has the following three merits: (1) The bump is a low-drag surface to achieve a smooth transition between the inlet and airframe (as proven in an ACIS project [23]). (2) The bump diverts the boundary layer via its caret crosswise pressure distribution, which provides a high-kinetic inflow for the inlet [24]. (3) The bump is a waverider configuration, which can produce extra lift by attaching the shock on its leading edge [15]. The merits of bump design have been proven through its application in many supersonic aircraft, such as the F-35 (USA), J-20 (China), etc. Subsequently, the design method of a pressure-controllable bump [25] was proposed to generate the bump inversely via pressure distribution. A ridge-type pressure distribution [26] was then proposed to guide the surface pressure assignment at hypersonic speeds. By adopting the ridge-type pressure distribution in the pressure-controllable bump design, the new bump manages to divert an identical boundary layer with a smaller height, inducing less external drag. This extends the bump application fields from supersonic speeds to hypersonic speeds. As presented above, the previous integrated design mainly aims to avoid the interaction of external and internal shock waves. However, the inlet flow spillage strategy is also an important aspect of the integrated design. The inlet’s aerodynamic performance under off-design conditions is closely related to the spillage strategy, which merits detailed investigation.
This paper compares two kinds of flow spillage strategy for diverterless hypersonic inlet design. The remaining contents are structured as follows: Different spillage strategies are reported in Section 2. The numerical methodology and turbulence model are described in Section 3. The results of the comparative investigation are presented in Section 4. Concluding remarks are presented in Section 5.

2. Flow Organization Strategies and Evaluation Methods for Non-Uniform Flow Fields

2.1. Side-Spillage and Central-Spillage Flow Organization Strategies

For the purpose of comparison, two bump inlets with different spillage strategies are presented in this section. The design methodology of the bump inlets has been presented in the authors’ previous works [24,27]. The whole configuration is integrated with a pressure-controllable bump and inward-turning inlets. The bump is inversely designed by a prescribed pressure distribution through an improved permeable-boundary method [26]. The inward-turning inlets are designed based on the osculating flow theory [28], which simplifies the design of complex 3D compression inlet geometry into a series of simple 2D compressed basic flow fields. Considering the non-uniform inflow conditions, the inlet lip is separately modified by adopting an inverse 3D method of characteristics [25], which can design the inlet lip surface via a given shock shape. The geometric results are demonstrated in Figure 1 and Table 1. For simplicity, Form 1 represents the central-spillage bump inlet, while Form 2 represents the side-spillage bump inlet. For the sake of comparison, the width of the bump (1166 mm) and inlet (200 mm) is kept identical, as is the external/internal contraction ratio of the bump inlet (CRx = 3.85). The external/internal contraction ratio CRx is calculated as follows:
C R x = C R e x C R i n
According to the original design methodology of the internal waverider inlet [28,29,30], the external contraction ratio CRex is ratio of the free-flow tube to the throat tube (Figure 1: S1/S2). The internal contraction ratio CRin is the ratio of the throat tube to the outlet tube (Figure 1: S2/S3). It should be noted that there are apparent geometric differences between the two forms when using the same bump inlet design technique: (1) The height of Form 2 is 27.8% lower than that of Form 1. (2) The length of Form 2 is 28.3% shorter than that of Form 1. (3) Szoy represents the windward projection area of the whole bump inlet. The Szoy of Form 2 is 34.4% smaller than that of Form 1. The main reason for this difference in Szoy is the spillage strategy. Form 2 adopts side-spillage instead of central-spillage for the flow compression task. The longitudinal length of the inlet lip of Form 2 is shorter than that of Form 1. The total height of Form 2 is therefore lower than that of Form 1. For the purpose of integration, the bump of Form 1 has to be higher. The difference in height ultimately leads to the difference in Szoy. (4) The Rinlet of Form 2 is 9.8% higher than that of Form 1, where the parameter Rinlet is the usage of the inlet that is calculated by dividing the projection area of the inlet by that of the whole bump inlet, as follows:
R i n l e t = S i n l e t , z o y + S c o w l , z o y S z o y
(5) Furthermore, the wet specific surface area Rwet is calculated. This is the ratio of the wet surface to the volume, which indicates the impacts of the inlet on the downstream combustion chamber. The Rwet of Form 2 is 23.5% higher than that of Form 1. This proves that there will be relatively less impact on friction and heat losses for Form 2. The geometric discrepancy indicates that Form 2 will suppress the external drag less than Form 1. To aerodynamically evaluate the performance of non-uniform bump inlet flow fields in detail, the evaluation methods for uniform flow fields need modification. This is discussed in the following section.

2.2. Evaluation Methods for Non-Uniform Flow Fields of Bump Inlets

The flow capacity, the inlet start ability, and the compression efficiency are discussed in this section considering the effects of non-uniform flow.

2.2.1. Mass Capture Ratio

The mass capture ratio φ represents the flow capacity of an inlet. The definition of φ is as follows:
φ = m ˙ i n l e t m ˙ i d e a l c o n d i t i o n
  • Calculation of φ in uniform inflow conditions (Figure 2: left subplot):
When the mass flow is fully captured (i.e., ideal conditions), the incident shock attaches to the inlet lip (point d). The streamline near the inlet lip is a straight line (b′c′d). The ideal captured tube is the boundary abb′. The mass flow passing through abb′ is assigned as the m ˙ i d e a l c o n d i t i o n . Hence, the φ equation is described as follows:
φ = m ˙ 3 m ˙ a b b
  • Calculation of φ in non-uniform inflow conditions (Figure 2: right subplot):
The streamlines near the inlet lip in the ideal conditions are not straight lines (i.e., line hd″, ea″, fb″, gc″). Due to the expanded flow field around the bump surface, the boundary abcd is the ideal captured tube while inversely tracing the streamlines from the inlet lip (a″b″c″d″). Hence, the φ equation needs to be modified as follows:
φ = φ r c a p t u r e d
where the rcaptured is the ratio of Sabcd to Sefgh.
r c a p t u r e d = S a b c d S e f g h

2.2.2. Inlet Start Ability

The essence of the inlet start is to provide adequate and steady flow for the downstream combustor through highly efficient deceleration/compression [31,32]. The mass flow at the throat section is equal to the captured flow at the entrance when the inlet starts. The captured flow at the inlet entrance is the mass flow at the ideal captured tube (see Section 2.2.1) multiplied by the mass capture ratio φ. According to the conservation relation of the mass flow, the equation can be derived as follows:
φ K P i n T i n q ( M i n ) A i n = K P t h r o a t T t h r o a t q ( M t h r o a t ) A t h r o a t
where K is the coefficient for mass flow calculation. The value of K is 0.04042 s K / m . Then, the above equation is simplified by introducing the inlet contraction ratio (CR = Ain/Athroat) and total pressure recovery coefficient (σin-throat = P*throat/P*in),
q ( M i n ) q ( M t h r o a t ) C R σ i n t h r o a t φ = 1
For a fixed-geometry inlet under a certain inflow condition, the Min and CR are already determined; that is, the φ/(σin-throat·q (Mthroat)) is kept as a constant when the inlet starts. When φ/(σin-throat·q (Mthroat)) > 1, the captured mass flow exceeds the flow capacity to induce the inlet unstart. The flow spillage technique, along with the boundary-layer bleeding [33] and the variable-geometry technique [34], is an approach to improve the inlet start ability by enlarging the effective flow path. The method to determine the effective flow path of inlets is presented in Section 4.2.

2.2.3. Compression Efficiency

The most common parameter to evaluate inlet performance is the total pressure recovery (σ). The total pressure is positively correlated with the mechanical energy, which consists of the kinetic energy and the pressure potential energy. The flow kinetic energy is converted to pressure, potential energy, and internal energy in the inlet. Part of the internal energy dissipates through heat transfer with the wall, and the other part of the internal energy is converted into kinetic energy again in the combustion chamber. The convertible part of internal energy is useful for the whole propulsion system. In contrast with σ, the kinetic energy efficiency (ηKE) [35] reflects useful internal energy, which is a more reasonable coefficient to evaluate non-uniform flow fields with thick boundary layers. The definition of ηKE is as follows:
η K E = 1 γ 1 2 M 2 T T 1 + γ 1 2 M 2 σ 1 γ γ ,
where γ is the specific heat ratio. Van Wie [36,37,38] proposed the use of ηKE-RM distribution to evaluate the inlet efficiency. An empirical relationship was determined on the basis of 2D inlet wind tunnel tests. The RM is the ratio of the freestream Mach number to the Mach number at exit. According to Van Wie’s definition, this ratio represents the flow deceleration degree of an inlet.
η K E ( 1 ) = 1 0.4 ( 1 R M ) 4
Kouichiro [3] established another ηKE-RM relationship based on the experiment of a typical side-compression inlet:
η K E ( 2 ) = 1 0.528 ( 1 R M ) 3.63

3. Methodology of Numerical Simulation

3.1. Numerical Method for the External–Internal Flow Fields

The flow fields of bump inlets are obtained by 3D viscous numerical simulations. The fluid is modelled as compressible steady flow using Reynolds-averaged Navier–Stokes equations, which are demonstrated as follows:
t Ω U d V + Ω F c n d S Ω F v n d S = 0
where U, Fc, Fv, n, t, Ω, and S are the conservative vector, convective flux vector, viscous flux vector, unit normal vector, time, control volume, and control volume surface, respectively. The definitions of the vectors U, Fc, and Fv are given as follows:
U = ρ ρ u ρ v ρ w E , F c = ρ u i + ρ v j + ρ w k ( ρ u 2 + p ) i + ρ u v j + ρ u w k ρ u v i + ( ρ v 2 + p ) j + ρ v w k ρ u w i + ρ v w j + ( ρ w 2 + p ) k ( E + p ) u i + ( E + p ) v j + ( E + p ) w k , F v = 0 τ x x i + τ x y j + τ x z k τ y x i + τ y y j + τ y z k τ z x i + τ z y j + τ z z k Π x i + Π y j + Π z k
where ρ, u/v/w, x/y/z, E, p, and τ are the density, velocity, coordinate, total energy per unit mass, pressure, and viscous stress tensor, respectively. Πxz are defined as follows:
Π x = u τ x x + v τ x y + w τ x z + λ T x , Π y = u τ y x + v τ y y + w τ y z + λ T y , Π z = u τ z x + v τ z y + w τ z z + λ T z ,
In the above equations, T is the temperature and λ is the thermal conductivity.

3.2. Three-Dimensional-Structured Mesh for Bump Inlet Flow Fields

The 3D-structured meshes for the two bump inlets are presented in Figure 3. The flat plate in front of the bump inlet is intended to produce the boundary layer. As a result, the boundary layer’s thickness occupies approximately 23.4% of the inlet’s height. The mesh topology of the two bump inlets obeys the same principles: (1) Two sets of C-grids surround the bump edge to accurately fit the curved edge profile of the bump. (2) There is a set of O-grids in the inlet internal domain to accurately fit the complex 3D surface of the inlet wall. (3) The O-grid of the inlet’s internal domain is extended forward to the external flow field, so as to achieve a good transition between the external and internal mesh. According to the verification of the k–ε turbulence model (see Appendix A), the near-wall grid is 0.15 mm in height, which ensures that the non-dimensional y+ is kept in the range of 1~10 to satisfy the k–ε turbulence model. The grids in the y-direction are stretched with the increasing ratio of 1.2 refined with the geometric proportion rule, in order to accurately predict the boundary layer during simulation. The mesh density of the inlet lip region is refined to capture the incident shock shape accurately. The total mesh in the whole domain is approximately 9.0 million.

3.3. Setup for Numerical Simulation

The surrounding surfaces of the bump inlet are set to the pressure far-field condition. For the simulation case with no sideslip, only half of the flow field needs to be calculated. In this case, the central plane of the bump inlet is set to a symmetric condition. The entire wall surfaces—including the inlet wall and the wall for developing the boundary layer—are set to no-slip and adiabatic wall conditions. All the results are obtained using the ANSYS CFX software (Canonsburg, PA, USA). The high-resolution scheme based on MUSCL (Monotonic Upwind Scheme for Conservation Laws) reconstruction is adopted to obtain the flux terms. The calculation is judged to be converged when the residuals stay within 1 × 10⁻⁶. The simulation for the mixed external–internal flow field is a special case in the determination of the turbulence model. Zhang et al. [39] investigated the influence of different turbulence models on the numerical results. Both k–ε and k-ω turbulence models matched well with the wind tunnel data of a mixed-compression supersonic inlet. The authors also validated the k–ε turbulence model in an experimental study [24] of a typical central-spillage bump inlet. The detailed verification process is demonstrated in Appendix A. Based on the above results and analysis, the k–ε turbulence model was adopted for numerical simulation in this study. A grid independence test has been verified in previous studies [40]. The inflow conditions for the numerical simulation are shown in Table 2, where H is the cruise altitude, M is the inflow Mach number, V is the inflow speed, P is the freestream static pressure, and Pd is the freestream dynamic pressure.

4. Results and Discussion

In this section, the central- and side-spillage bump inlets are mainly considered in order to enable understanding the impacts of spillage forms on the aerodynamic characteristics.

4.1. Aerodynamic Characteristics under the Cruise Conditions

Under the cruise conditions (M = 6.0, H = 24 km), the effects of the combustion chamber were investigated by assigning a series of backpressure values to the exit plane. The initial flow field was established when the value of πb was set to 1 (πb = Pb/P, Pb: backpressure; P: freestream static pressure). Then, based on the initial flow field, πb was gradually increased in small increments until the inlet unstarted.

4.1.1. Compression Efficiency

The mass-averaged characteristics of the bump inlets at various πb boundary conditions are reported in Table 3. As the πb increases, the terminal shock train [41,42] occurs near the exit and then moves forward. When the terminal shock train passes the throat and interacts with the incident shock, the inlet unstart is induced. As a result, the mass capture ratio will deteriorate substantially, along with other aerodynamic characteristics. It should be noted that Form 1 can suppress 99.6 P backpressure, while Form 2 can suppress 104.1 P backpressure. The maximum anti-backpressure ability of Form 2 is approximately 4.52% higher than that of Form 1 based on identical CRx. The small difference in CRx is caused by differences in the amount of the boundary layer captured. As demonstrated in Figure 1, a part of the inlet lip is integrated with the bump surface. For the purpose of comparison, the foremost point of the inlet lip was situated at the same longitudinal position (x = 700 mm from the bump’s leading edge) for both forms. For Form 1, all of the boundary layer within the inlet-captured area is swallowed downstream, while for Form 2, the boundary layer is continuously diverted away until the flow passes by the rearmost point of the inlet lip on the bump surface. Hence, the boundary layer in Form 2 is thinner than that in Form 1. This leads to a slightly larger available range of backpressures for Form 2.
The compression efficiency at throat and exit positions was evaluated based on the method introduced by Van Wie (see Section 4.2). The results are shown in Figure 4. The blue circles represent Form 1, while the red triangles represent Form 2. The solid blue line is the ηKE(1) relation, while the red dashed line is the ηKE(2) relation. The definition of ηKE is given in Section 2.2.3. The RM is the Mach number ratio of the freestream position to the target position (i.e., throat and exit in this paper). According to the relation between ηKE and RM, the upper-right region of these two curves represents higher efficiency, and vice versa. The analysis is as follows:
  • Comparison of bump inlets with ηKE(1) and ηKE(2) curves:
The compression efficiency of bump inlets is higher than that of typical 2D inlets and similar to that of typical side-compression inlets. It should be noted that the ηKE(1) and ηKE(2) curves were obtained from the cases with uniform inflow conditions, while the results of the present study are based on non-uniform and thick boundary layer (i.e., 23.4% of inlet height) inflow conditions. Hence, the ηKE of the two curves will be lower when faced with more severe inflow conditions.
  • ηKE at the throat and exit positions:
A hypersonic inlet consists of a compression part (from entrance to throat) and an isolator part (from throat to exit). Hence, the flow properties at the throat position reflect the compression efficiency of the compression part, while the flow properties at the exit position reflect the compression efficiency of the isolator part. For both forms, the throat properties are higher than the exit properties. This indicates that the isolator brings extra energy loss, which causes the ηKE to decrease. The ηKE discrepancy of the throat position between two forms (labels beyond the ηKE(2) curve in Figure 4) is approximately 0.51%, while that of the exit position (labels between the ηKE(1) and ηKE(2) curves) is 0.10%. The ηKE of Form 2 decreases by 0.62% at the isolator part. The decrease ratio for Form 1 is 1.0%. It should be noted that there is only a small discrepancy between the two forms, which indicates that the useful compressed flow of the two forms is of equivalent magnitude.

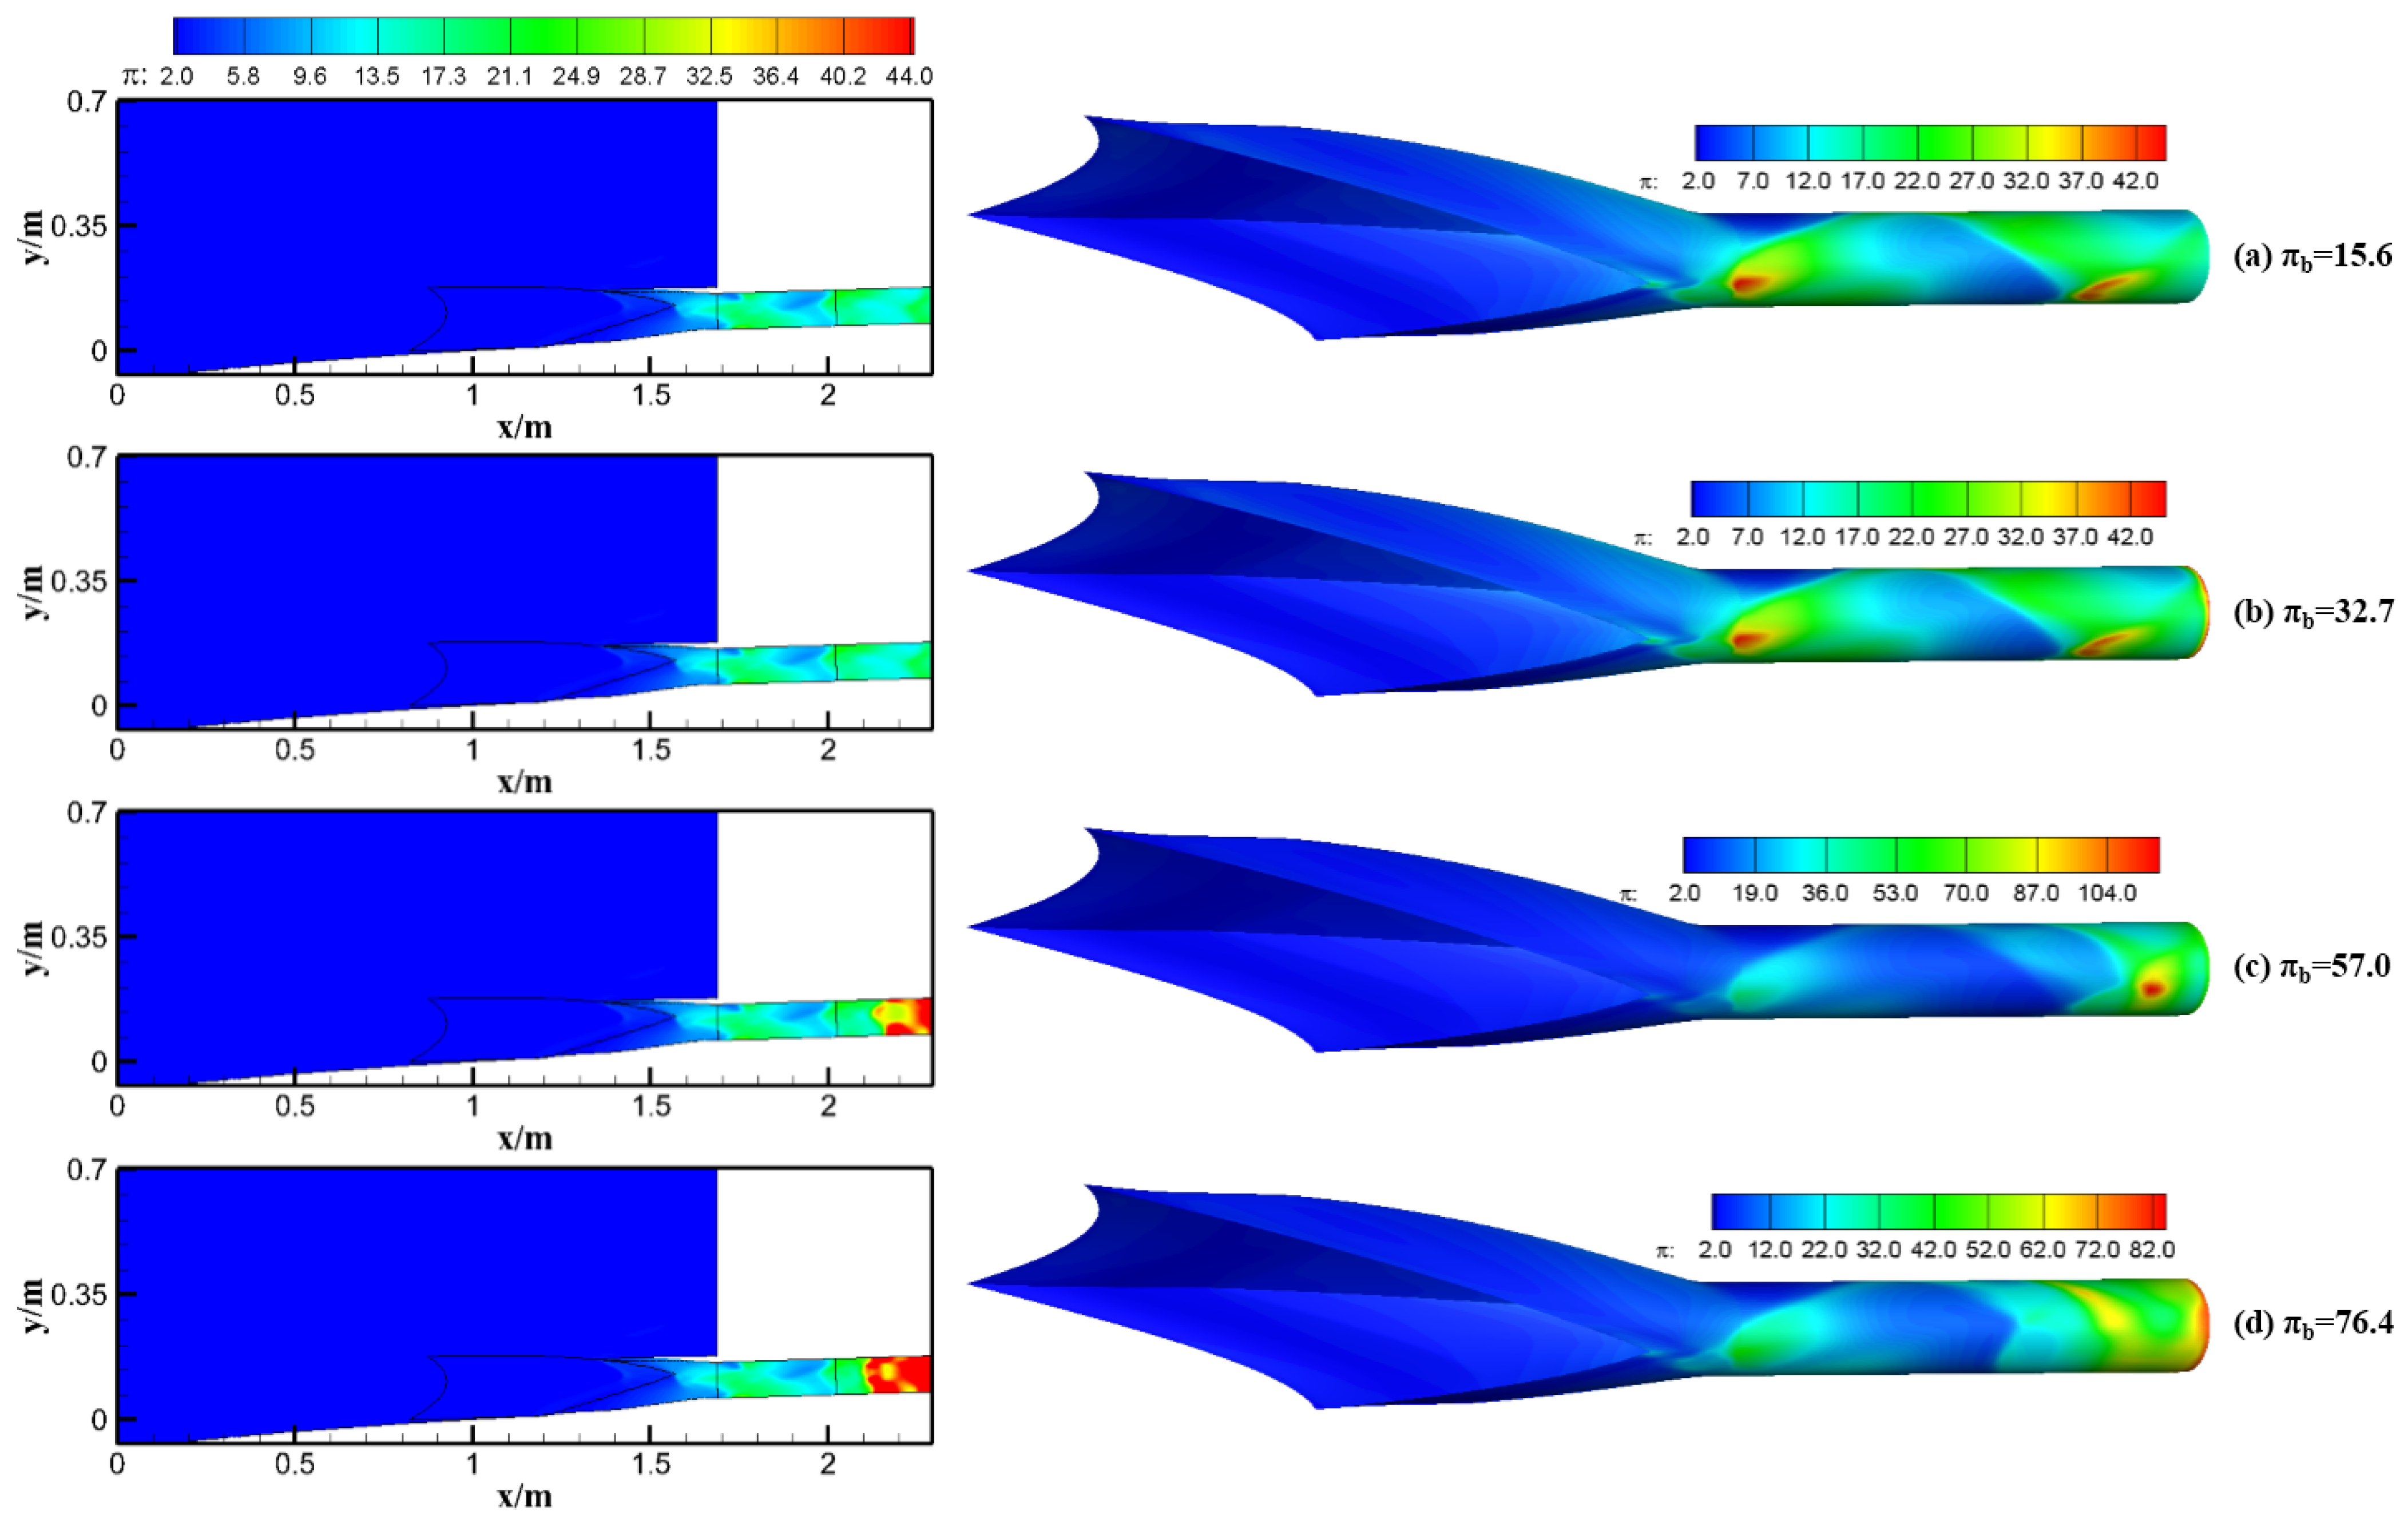
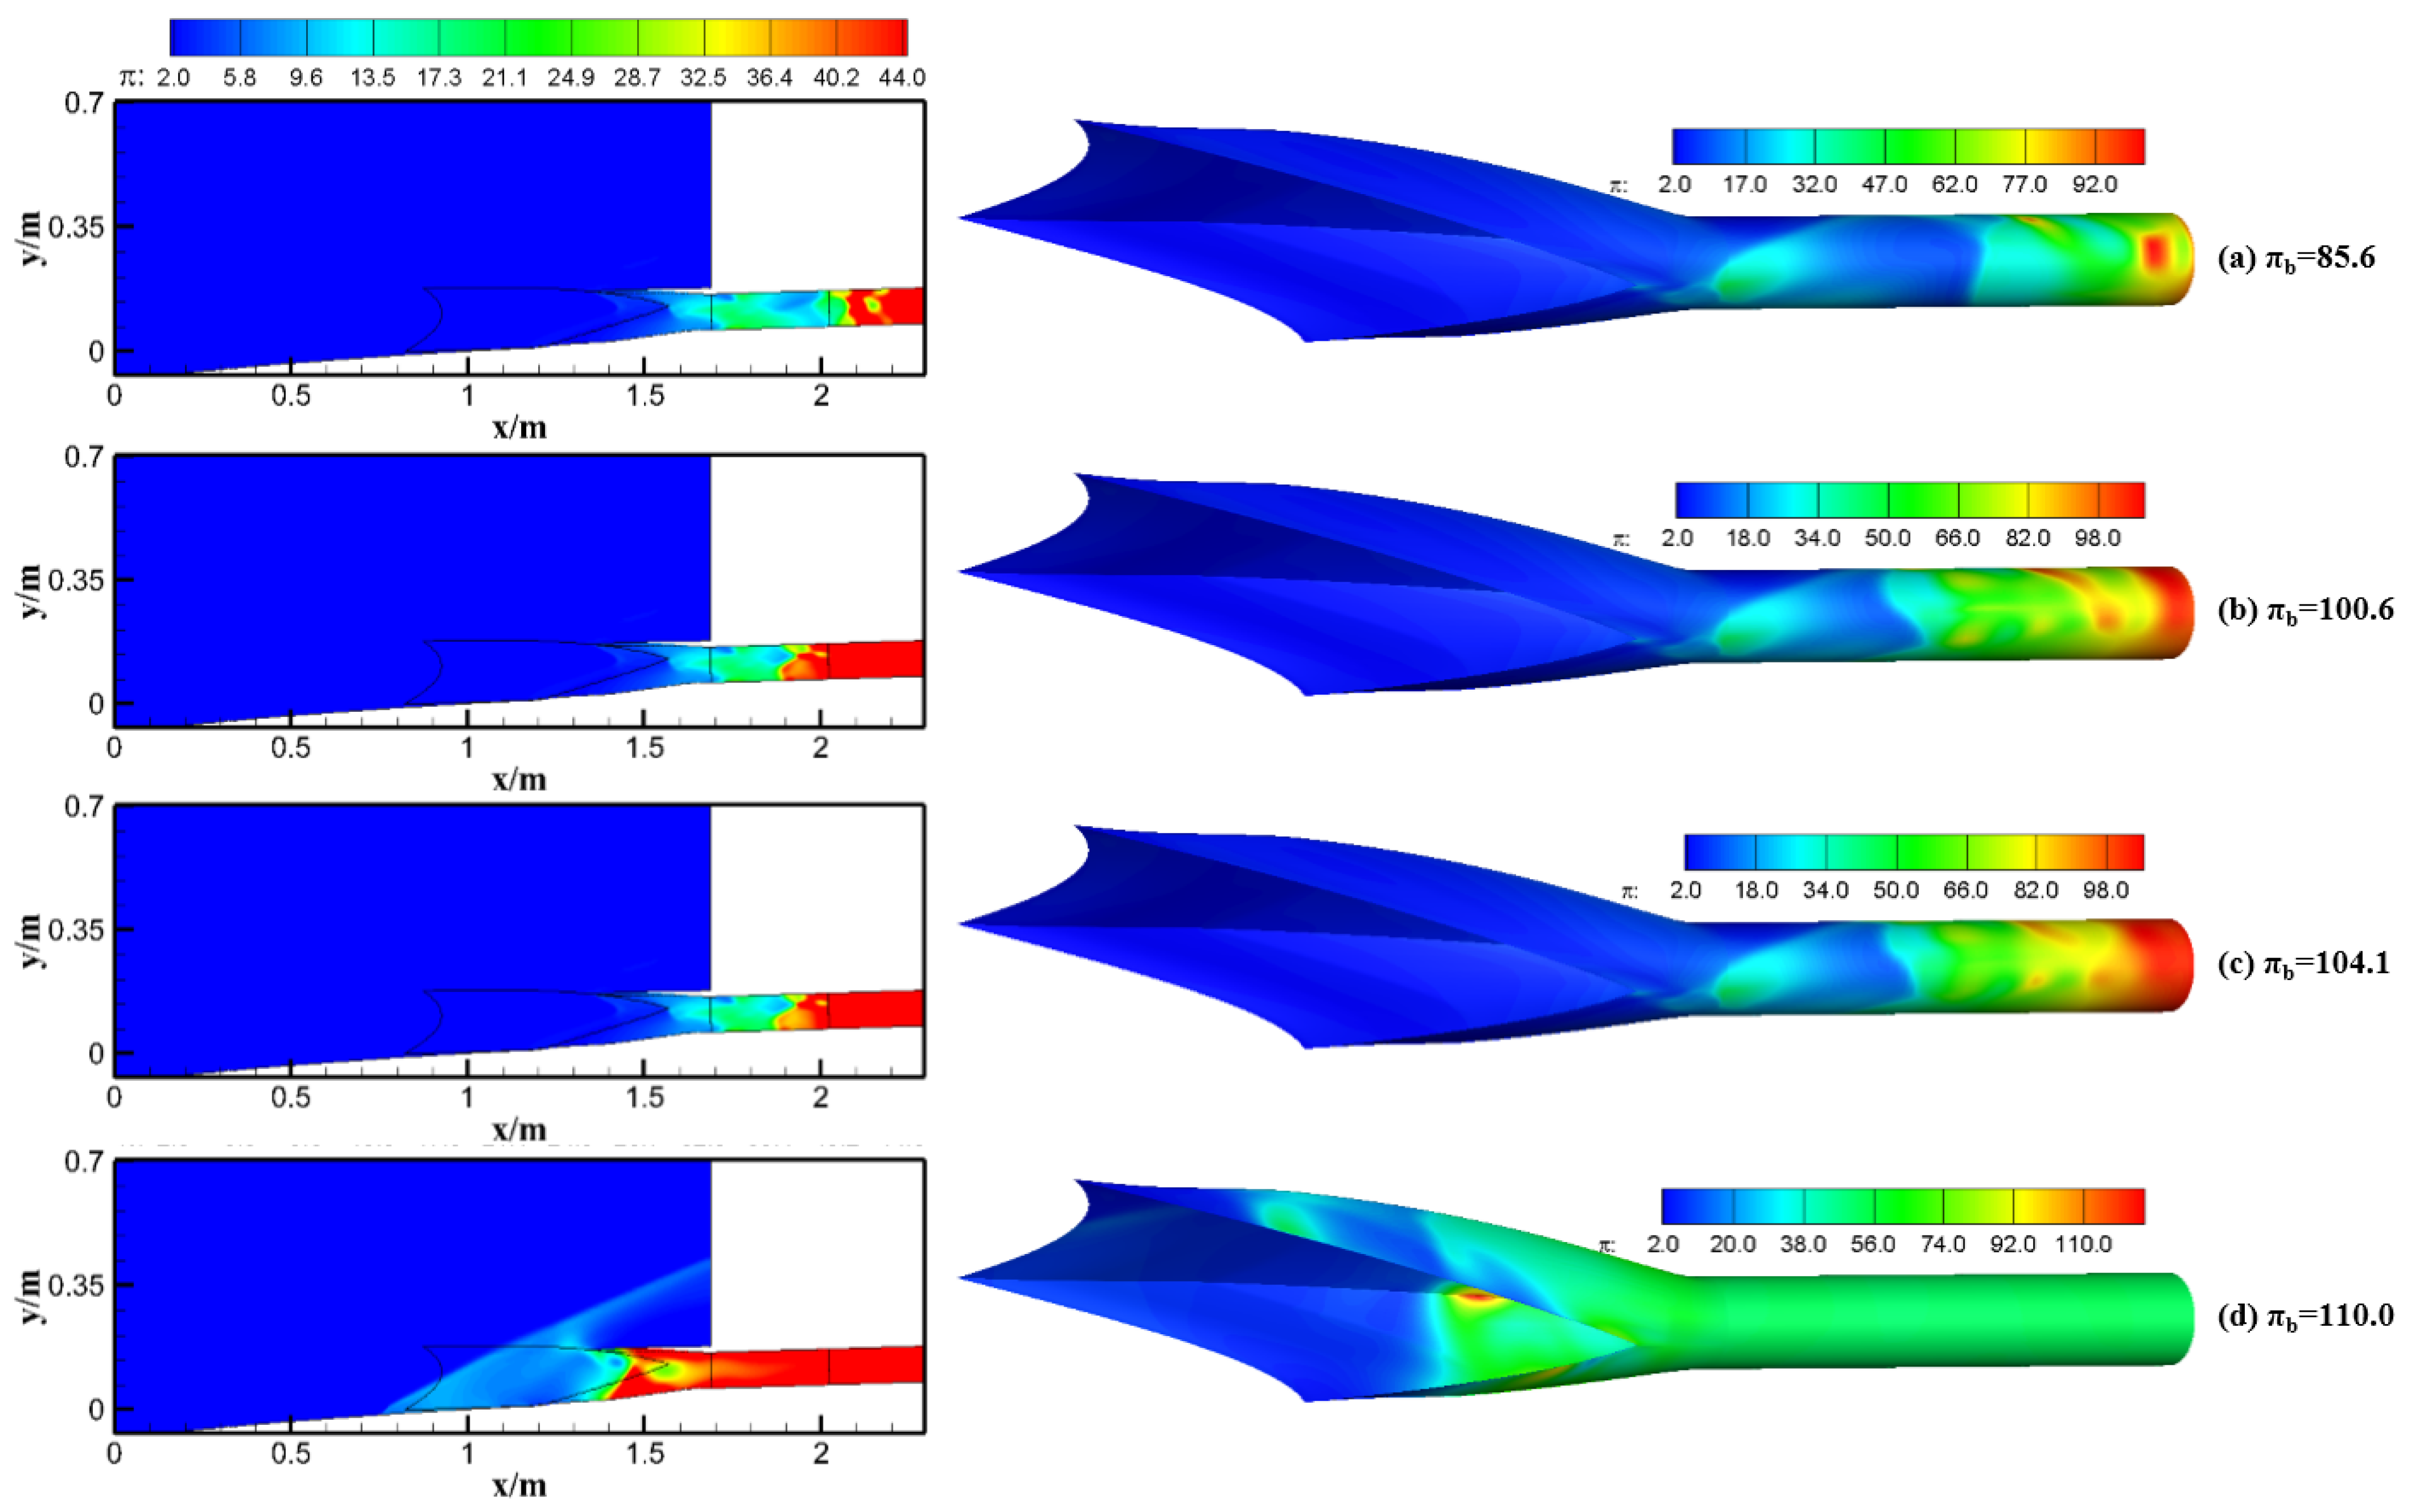
4.1.2. Anti-Backpressure Capability

The pressure contours of Form 1 under different backpressures are demonstrated in Figure 5. The middle section was chosen as an example plane to show the shock system. When πb = 18.5, the backpressure does not affect the internal shock system, as shown in Figure 5a.
The change in the internal shock system with πb was analyzed in detail: (1) When πb = 37.9, a high-pressure region (HPR) occurs at the lower part upstream of the exit (x = 3.2 m). This region is located completely after the last reflection shock, which apparently does not affect the shock system. (2) When πb = 61.8, this region moves forward to the tail of the isolator (x = 3.05 m), where the flow is compressed from M 2.3 to M 1.6. The shock strength is equivalent to an oblique shock with M = 2.3, β = 43°. (3) When πb = 83.3, the end shock moves forward to x = 2.67 m. There is a relatively large pressure gap between the HPR (π ≈ 100) at the upper side and the lower side of the exit, which leads to the flow deflection. (4) When πb = 89.3, the end shock moves forward to x = 2.60 m. The tail region of the isolator is occupied by the high-pressure flow. The pressure decreases in the expansion section. Thus, the pressure upstream is larger than the pressure downstream. This results in reduced sensitivity to the backpressure fluctuation. (5) When πb = 99.6, the end shock moves forward to x = 2.52 m. The HPR with π ≈ 100 occupies the rear part of the isolator. The end shock is observed near the throat, which leads to high sensitivity to the backpressure and causes the inlet to unstart.
The pressure contours of Form 2 are demonstrated in Figure 6. The solid black line in the contours is the profile of the inlet lip.
The change in the internal shock system with πb = 15.6~76.4 was analyzed in detail (see Figure 6): (1) When πb = 15.6, it is effectively in the through-flow condition, where the internal shock system has not been affected by the backpressure. In contrast with Form 1, Form 2 splits the inflow into two paths. The area of the isolator changes correspondingly to half that of Form 1, and the length of the isolator is also shorter. This leads to changes in the frequency of the reflection shocks. There are three reflection shocks for Form 2 and four reflection shocks for Form 1. (2) When πb = 32.7, the HPR occurs at the exit, while the discrepancy in the aerodynamic characteristics between πb = 32.7 and πb = 15.6 is small. (3) When πb = 57.0, the HPR moves forward to x = 2.130 m. Due to the interaction between the backpressure and the reflected shock, the position of the last reflection point moves slightly downstream compared to the through-flow condition. (4) When πb = 76.4, the HPR moves forward to x = 2.107 m. The flow experiences deceleration and compression at x > 2.107 m.
The change in the internal shock system with πb = 85.6~110.0 was analyzed in detail (see Figure 7): (1) When πb = 85.6, the HPR moves to x = 2.072 m. The end shock is pushed upstream to the middle of the isolator at πb ≈ 85.0 for both forms. (2) When πb = 100.6, the HPR is pushed to x = 1.889 m. The ring-like region can be clearly observed at the rear part of the isolator, as shown in red. A relatively high-pressure gap occurs at the upper wall adjacent to the exit, which leads to the non-uniformity of the local flow. (3) When πb = 104.1, the high-pressure area is pushed to x = 1.875 m. Compared with πb = 100.6, the area of the HPR further increases at πb = 104.1. The pressure gap between the reflected shock and the middle of the cross-section restricts the effective flow path, which leads to a decrease in the φ. (4) When πb increases from 104.1 to 110.0, the first reflection shock is not strong enough to withstand the backpressure. The end shock moves from x = 1.875 m to x = 1.402 m. A bow shock is clearly observed in front of the inlet lip. The inlet unstarts at πb = 110.0.
The speed distribution of Form 2 was studied under different backpressure conditions. As demonstrated in Figure 8, a series of streamlines of the near-wall region and the symmetry were obtained. The M distribution for nine longitudinal cross-sections was obtained.
The detailed analysis is as follows: (1) For the front part of the isolator, the intensive distribution of the M isolines is located on the same side of the bump. The 3D incident shock converges at the most downstream part of the inlet lip and reflects at this V-shaped region. This leads to high compression and deceleration of the local flow. The downstream M distribution depends on the location of the reflection shocks. (2) The HPR moves forward with the increase in πb. The rear part of the isolator is affected by the backpressure, and the M distribution becomes relatively uniform. This reveals that the flow distortion varies under different πb conditions. Under the through-flow condition, the distortion is caused by the reflection shock system, whereas under the condition with the backpressure effects, the uniformity of the outflow increases correspondingly. (3) The shape of the reflected shock is determined by the cross-section shape as well as the inflow condition. Form 2 adopts an equal-cross-section circular isolator. Therefore, when the incident shock reflects at the V-shaped compression center and hits the upper wall of the isolator, the shock is split into two reflection shocks. This phenomenon can also be observed from the longitudinal M distribution, where the number of M isolines increases from one to two after the first reflection shock.
The vortex structures under the design conditions based on the Q-criteria [43,44] are demonstrated in Figure 9. The analysis of the vortex is as follows: (1) For the external flow field around the bump, the vortex is mainly located at the near-wall region. For the internal flow field in the inlet, the vortex is located in the whole internal region. (2) The vortex above the bump surface has crosswise features due to the crosswise pressure gradient. The vortex in the inlet has 3D features, while the longitude development of the vortex takes the dominate status. (3) The main difference in the vortex between the two forms is at the inlet compression part. The vortex of Form 2 is significantly less than that of Form 1 at the inlet external compression part. The side-located pattern relieves the side-compression effects, leading to the difference in the vortex distribution in the compression part.

4.2. Aerodynamic Characteristics under a Wide Range of Inflow Speed Conditions

The aerodynamic characteristics under a wide range of inflow speed conditions are demonstrated in Table 4. Form 1 starts at M 5.0–6.0. Form 2 starts at M 2.5–6.0. That is, the inlet start margin is widened by approximately 250% by utilizing the side-spillage strategy. The φspillage is the ratio of the spilled mass flow to the captured mass flow under cruise conditions. The incident shock detaches from the inlet lip when the inflow speed decelerates. Thus, the φspillage increases with the decrease in M. When the spilled mass flow is larger than the decrease in inlet flow capacity, the inlet will start. When the spilled mass flow is not enough to cover the decrease in inlet flow capacity, the inlet will unstart due to the flow congestion. For Form 2, the φspillage–M relation can be described as a quadratic function:
φ s p i l l a g e = 1.99 × 10 2 M 2 3.191 × 10 1 M + 1.1993
where M is the freestream Mach number.
The επ and εM in Table 4 are the compression and deceleration ratios for the decrease in the unit area, respectively. Their definitions are as follows:
ε π = π M o u t / π M C R
ε M = M o u t / M C R
The distribution of επ and εM is demonstrated in Figure 10. As the M decreases, the επ increases and the εM decreases correspondingly. As M decelerates from 6.0 to 5.0, the επ of both forms increases to the same degree, while the επ of Form 2 decreases to a greater extent than that of Form 1. This indicates that the flow spillage is beneficial to the inlet start ability, but the φspillage should be carefully designed to avoid a decrease in the inlet’s compression ability.
In order to estimate the usage of the inlet’s internal path from the obtained results, a parameter εA is proposed. This represents the relative error between the equivalent exit area Aequ and the real exit area Aexit. The definition is as follows:
ε A = A e x i t A e q u A e x i t × 100 %
where Aequ is the equivalent area of the inlet’s exit; it is calculated by the following mass equation:
m ˙ e x i t = K P e x i t T q ( M e x i t ) A e q u
The equation can be deduced further based on the relation between the freestream and the exit:
A e q u = φ σ q ( M e x i t ) q ( M ) C R A e x i t
Then, the εA is finally determined by the following equation:
ε A = 1 φ σ q ( M e x i t ) q ( M ) C R
The εA can reflect the magnitude of the flow distortion. A larger εA means that more of the boundary layer accumulates in the inlet. Except for the friction loss induced by the inlet wall, the flow distortion is the main cause of the accumulation of the boundary layer. Figure 11 demonstrates the impacts of inflow speeds on inlet distortion and flow spillage. The εA decreases with the M due to the boundary layer accumulation. The decrease in the ratio of εA is high at M 3.0–5.0 and relatively low in other speed ranges. The φspillage increases rapidly with the decrease in M. The detailed analysis is as follows:
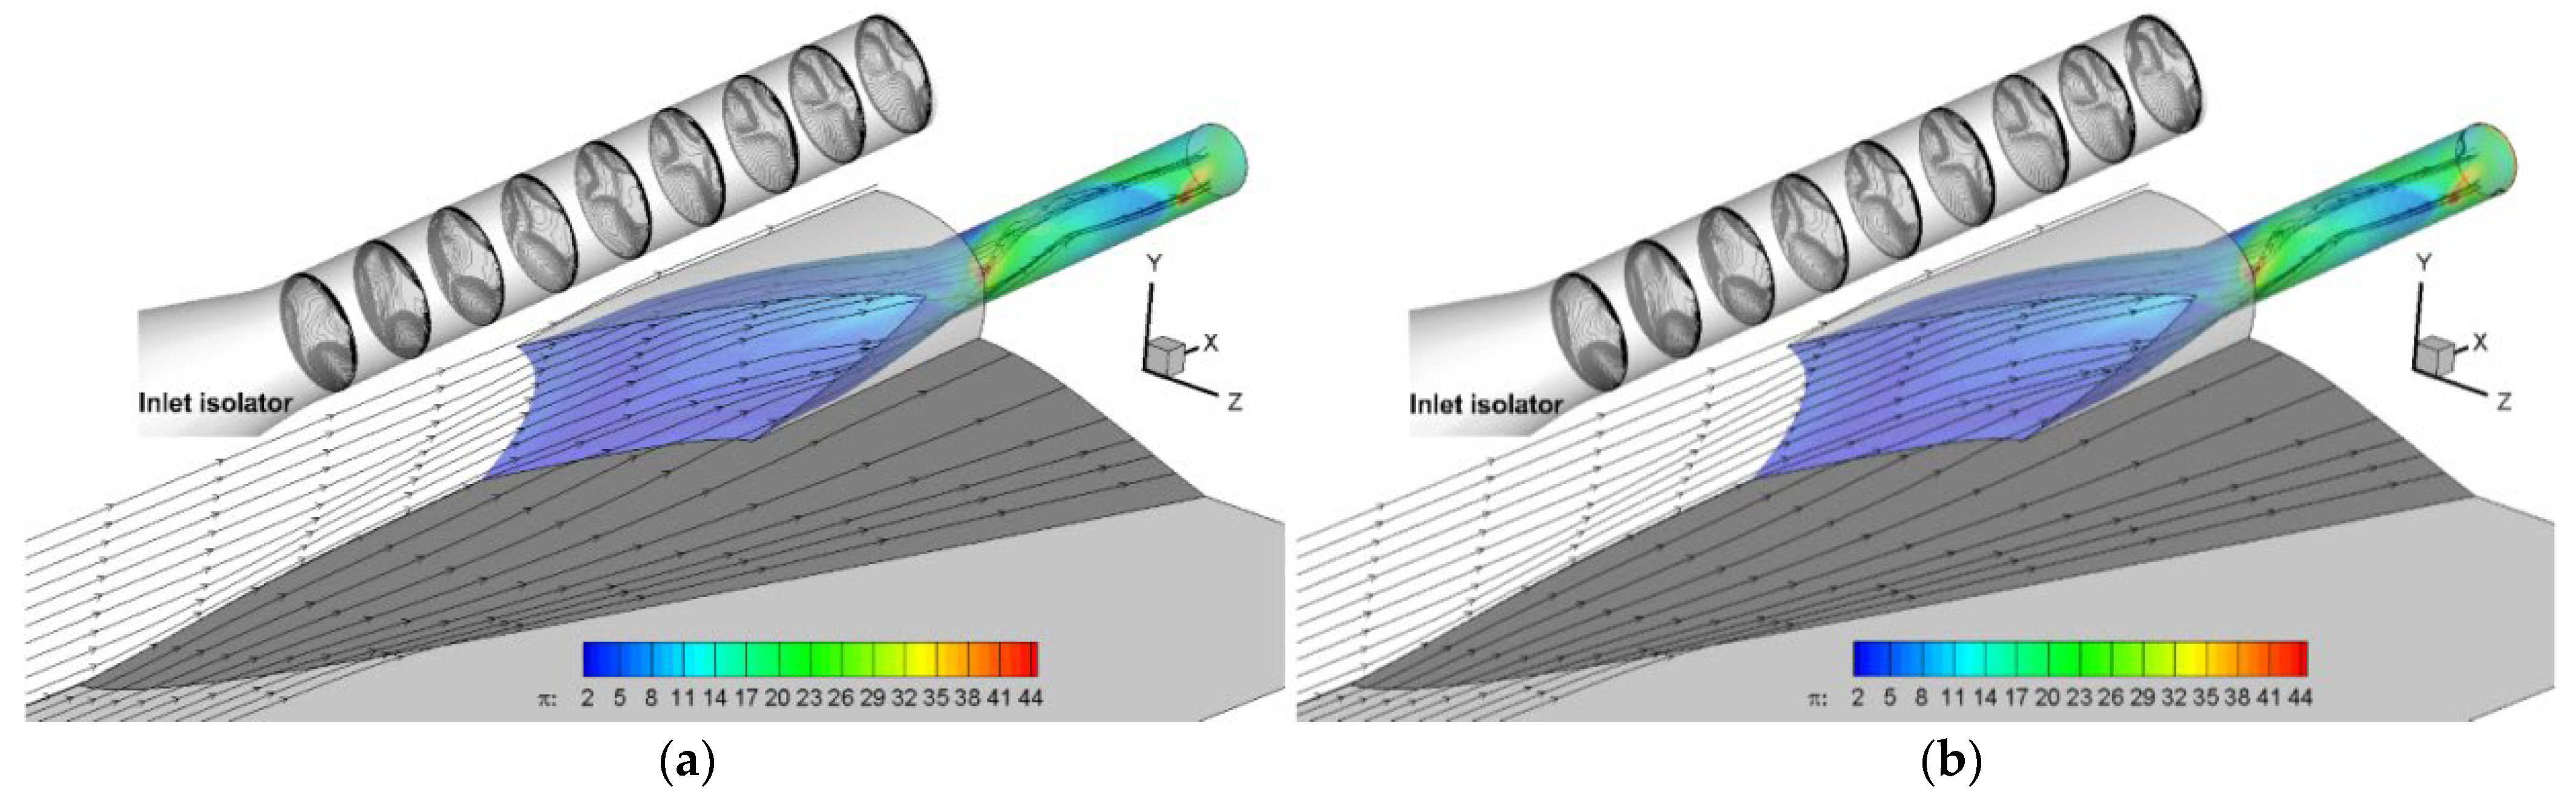
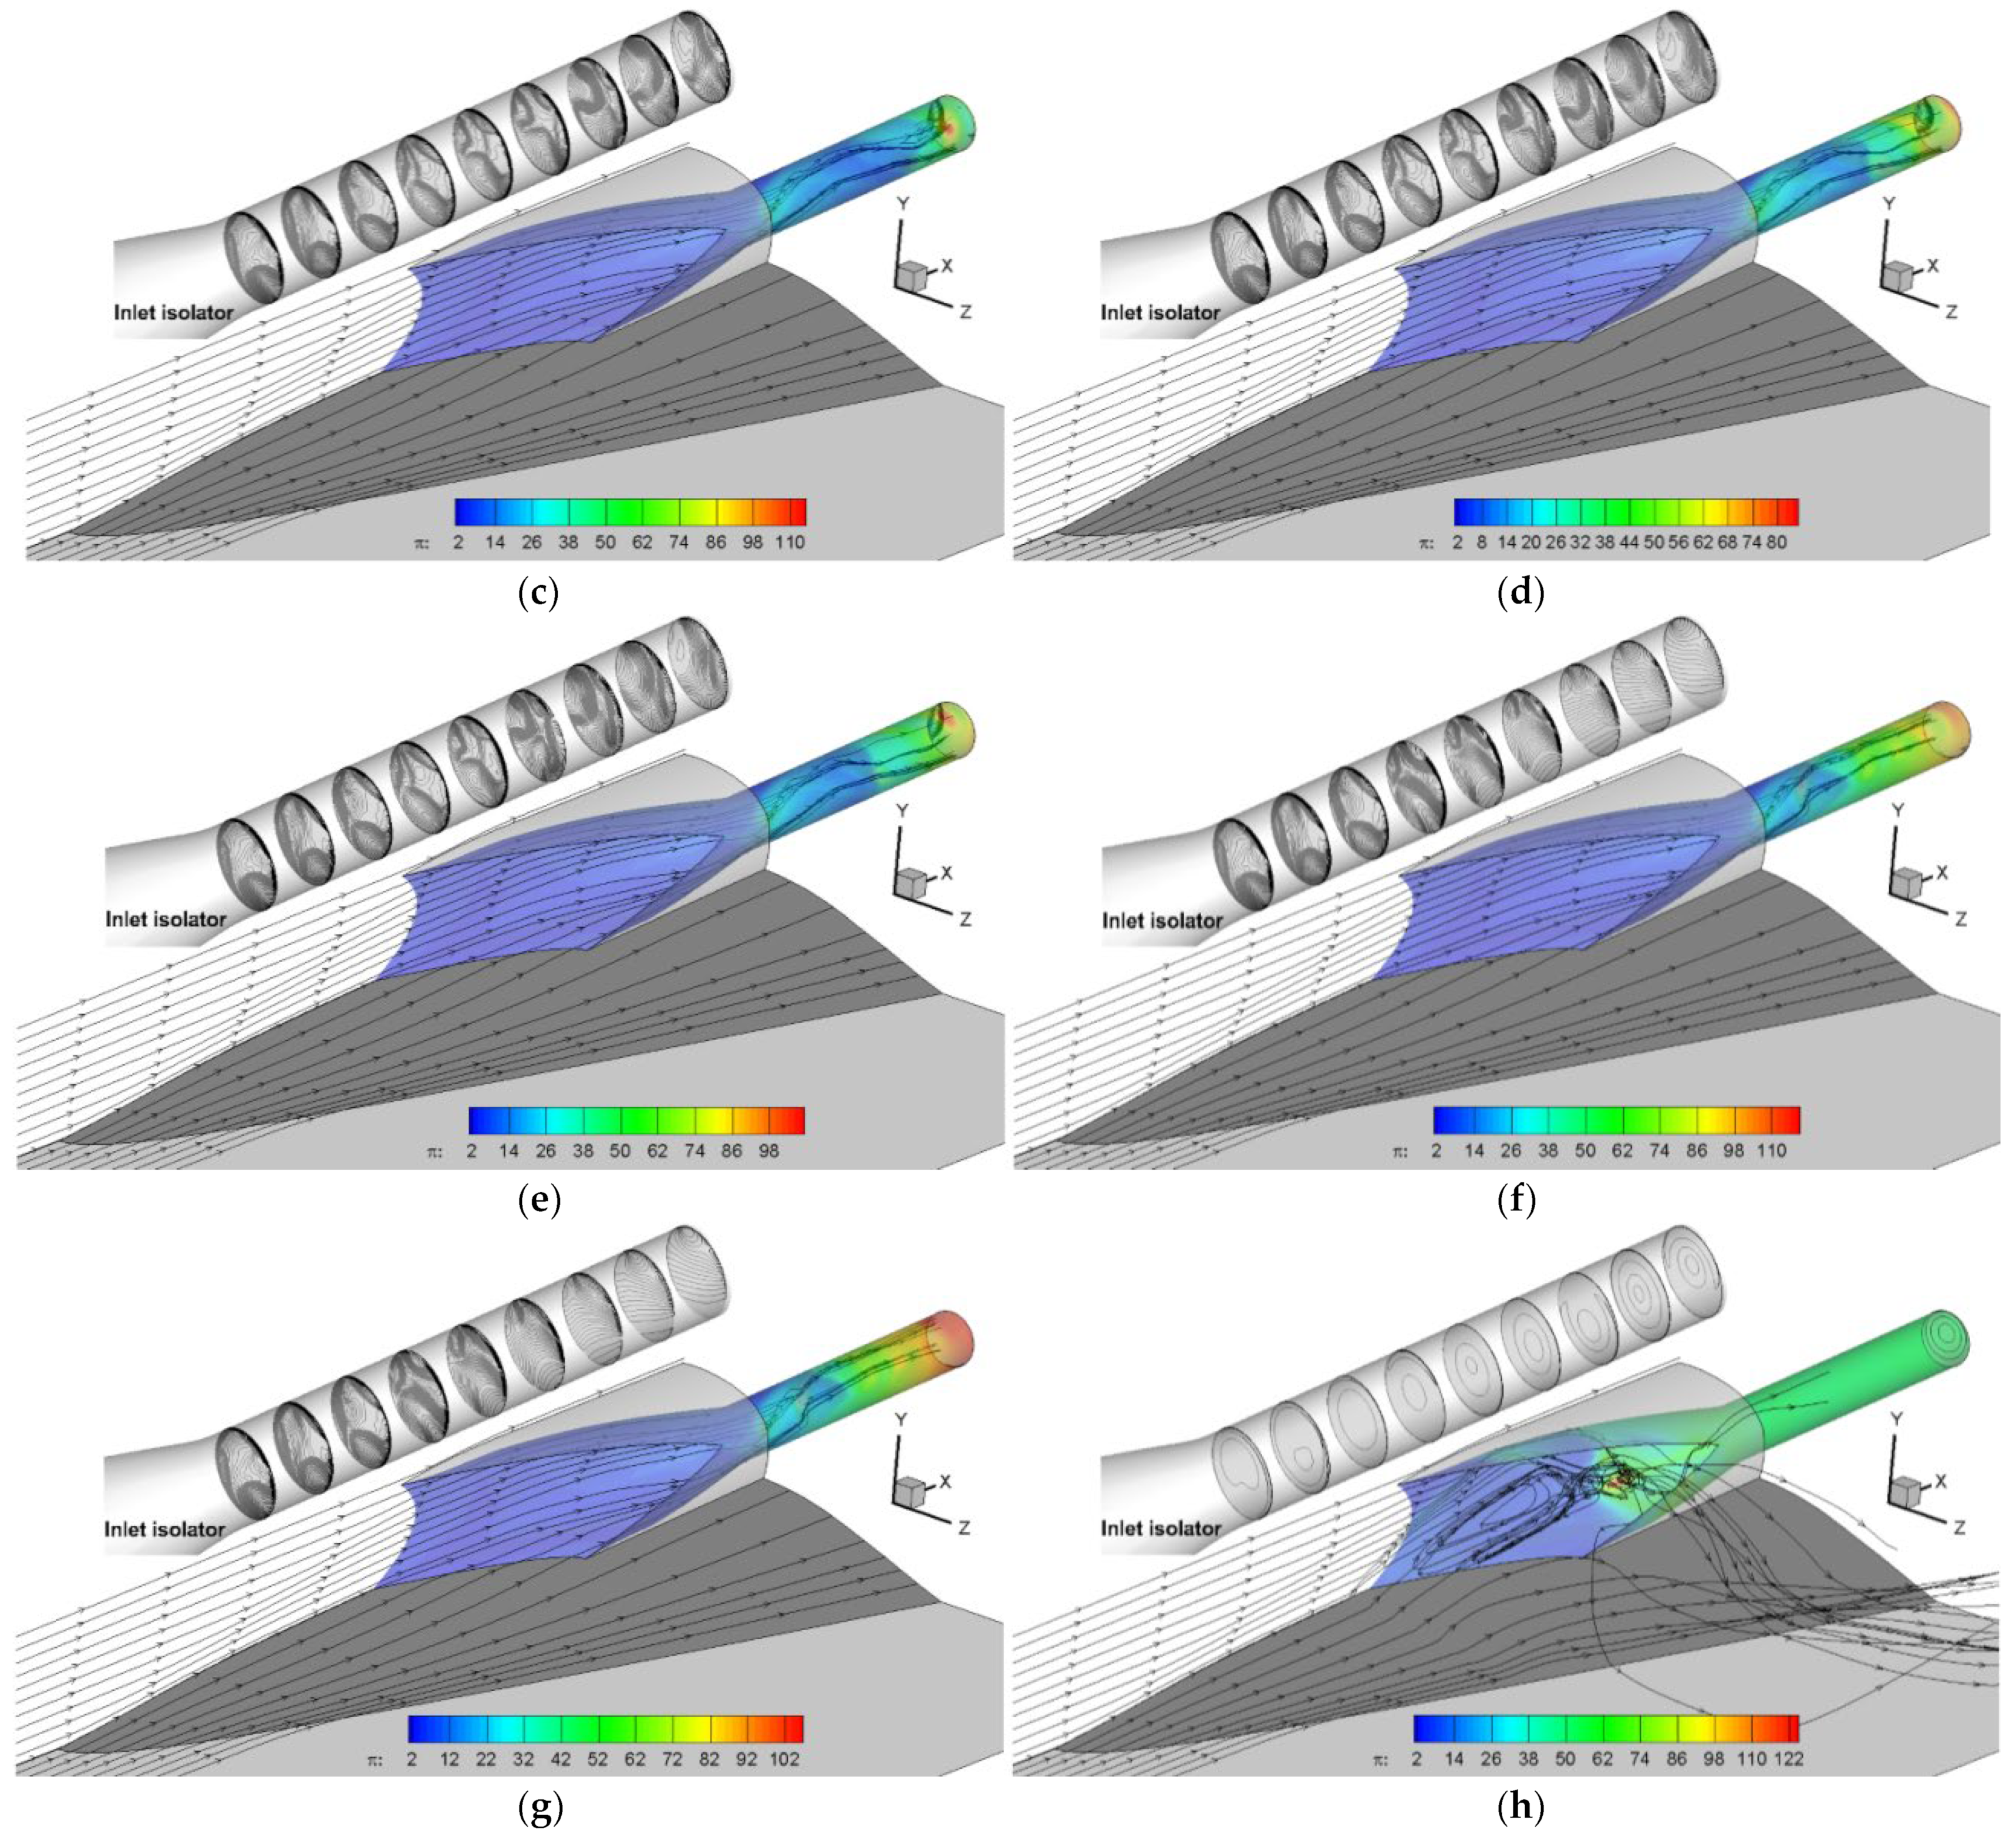
  • Spillage ability of two forms at M ∈ [3.0,6.0]:
The local gradient of εA (∆εA/∆M) is largest at M 3.0–5.0 for Form 1, which reaches approximately 6.18 × 10⁻². This value is similar to the ∆εA/∆M of Form 1 at M 5.0–6.0 (6.00 × 10⁻²), which indicates that the spillage ability of Form 2 at M 3.0–5.0 is similar to that of Form 1 at M 5.0–6.0. For the Mach range of 5.0–6.0, the ∆εA/M of Form 2 is 41% lower than that of Form 1. This shows that Form 1 can maintain a better incident shock shape than Form 2.
  • Explanation for the εA discrepancy:
The εA discrepancy of the two forms at different speeds results from the incident shock system and the spillage pattern. When the inlet flow capacity is large enough to handle the captured inflow, the incident shock system will remain steady at the design point (i.e., M 6.0). For Form 1, there is an evident increase in the corner boundary layer due to the strong side compression, which clearly decreases the actual flow area. Hence, the incident shock distorts from the inlet lip to the mainstream, and the flow is spilled away from the central part of the inlet lip. For Form 2, the incident shock system remains relatively steady at M 5.0–6.0. There is a bow-shaped boundary layer region that occurs around M 4.0. This region becomes larger when the M decreases. The flow in the inlet consists of the near-wall boundary layer and the unspilled mainstream. For Form 2, the φspillage/∆M at M 2.5–3.0 is more than twice that at M 3.0–5.0. This indicates that the mainstream is spilled away under low-Mach conditions, exceeding the flow capacity. Thereby, the ∆εA/∆M decreases at M 2.5–3.0, which shows less change in the actual flow area than that at M 3.0–5.0.
  • Self-adaptive flow spillage feature of the side-spillage form:
The self-adaptive flow spillage is an advantage in achieving a wide working range. The hypersonic inlet start is mainly related to two factors: the flow capacity and the captured inflow. The former factor is determined by the external/internal compression ratio. For most inlet designs at hypersonic speeds, this factor is fixed when the geometry is obtained. The latter factor is controllable by alternative aspects. The boundary-layer bleeding, the variable-geometry techniques, etc., are all effective approaches to restrict the captured inflow. Nevertheless, the above techniques impose an extra burden on the mechanical complexity. The φspillage of Form 2 continuously increases with the M, imparting a self-adaptive feature to the inflow speeds. The amount of captured inflow is then reduced to match the decreased inlet flow capacity, making the inlet start ability better under low-Mach conditions when using a fixed inlet configuration.

4.3. Impacts of Inflow Conditions on the Compression Efficiency

The impacts of inflow conditions on the compression efficiency for the two forms are reported in this section, as demonstrated in Figure 12, where the left subplot is the ηKE-RM-πb distribution and the right subplot is the ηKE-RM-M distribution. The inflow condition remains steady when πb increases. Thereby, the ηKE of both forms increases with πb. Meanwhile, the trend for the right subplot is not monotonic. The ηKE decreases at M 3.5–6.0 and increases at M 2.5–3.5 for Form 2. The impacts of the inflow conditions are mainly determined based on two aspects: the incident shock system and the boundary layer thickness. As the M decreases, the incident shock detaches from the inlet lip and moves forward, which leads to a decrease in the ηKE. As the M decreases, the boundary layer thickness decreases, which leads to an increase in the ηKE. The results reveal that at M 3.5–6.0, the distortion of incident shock is the main reason for the decrease in ηKE. At M 2.5–3.5, the decrease in the boundary layer’s thickness is the main reason for the increase in ηKE.

5. Conclusions

This work investigated the effects of flow spillage strategies on the performance of bump inlets under a wide speed range. The central-spillage Form 1 and the side-spillage Form 2 were designed. The evaluation methods for non-uniform inflow conditions were introduced. In contrast with Form 1, Form 2 has several merits.
  • A more compact configuration: Form 2 is 27.8% lower in height and 28.3% shorter in length. The windward projection area of Form 2 is 34.4% smaller than that of Form 1. The usage of the inlet for Form 2 is 9.8% higher than for Form 1.
  • A steadier performance: The maximum backpressure of Form 2 is 4.52% higher than that of Form 1. The aerodynamic characteristics of the two forms are similar under the cruise conditions, while Form 2 shows more steady performance under off-design conditions, e.g., the decreased effective flow path of Form 2 is 41% lower than that of Form 1 at M 5.0–6.0.
  • A better start ability: Through establishing a self-adaptive flow spillage feature, Form 2 extends the effective operational Mach range by approximately 250% without any boundary-layer bleeding or variable-geometry techniques.
  • A reduced impact on the propulsion system: The wet specific surface area Rwet of Form 2 is 23.5% higher than that of Form 1. As a result, there will be relatively fewer impacts on friction and heat losses for Form 2.
As a result, the new side-spillage flow organization strategy has better potential for designing wide-ranging air-breathing flight vehicles.

Author Contributions

Conceptualization, Z.Y. and G.H.; methodology, Z.Y. and H.H.; validation, R.W.; investigation, Z.Y. and Y.L.; writing—original draft preparation, Z.Y., X.Y. and Z.J.; writing—review and editing, O.M.; supervision, Z.Y.; funding acquisition, Z.Y. All authors have read and agreed to the published version of the manuscript.

Funding

National Natural Science Foundation of China: 12002162; Natural Science Foundation of Jiangsu Province: BK20200449; National Science and Technology Major Project: J2019-II-0007-0027; Postgraduate Research & Practice Innovation Program of Jiangsu Province: KYCX22_0379, SJCX22_0100; Postgraduate Research & Practice Innovation Program of NUAA: xcxjh20210203; Jiangsu Postdoctoral Research Foundation: 2021K307C.

Institutional Review Board Statement

Not applicable.

Informed Consent Statement

Not applicable.

Data Availability Statement

Not applicable.

Acknowledgments

The authors are very grateful to the colleagues of Internal flow research center (IFRC) for their help of the current study.

Conflicts of Interest

The authors declare no conflict of interest.

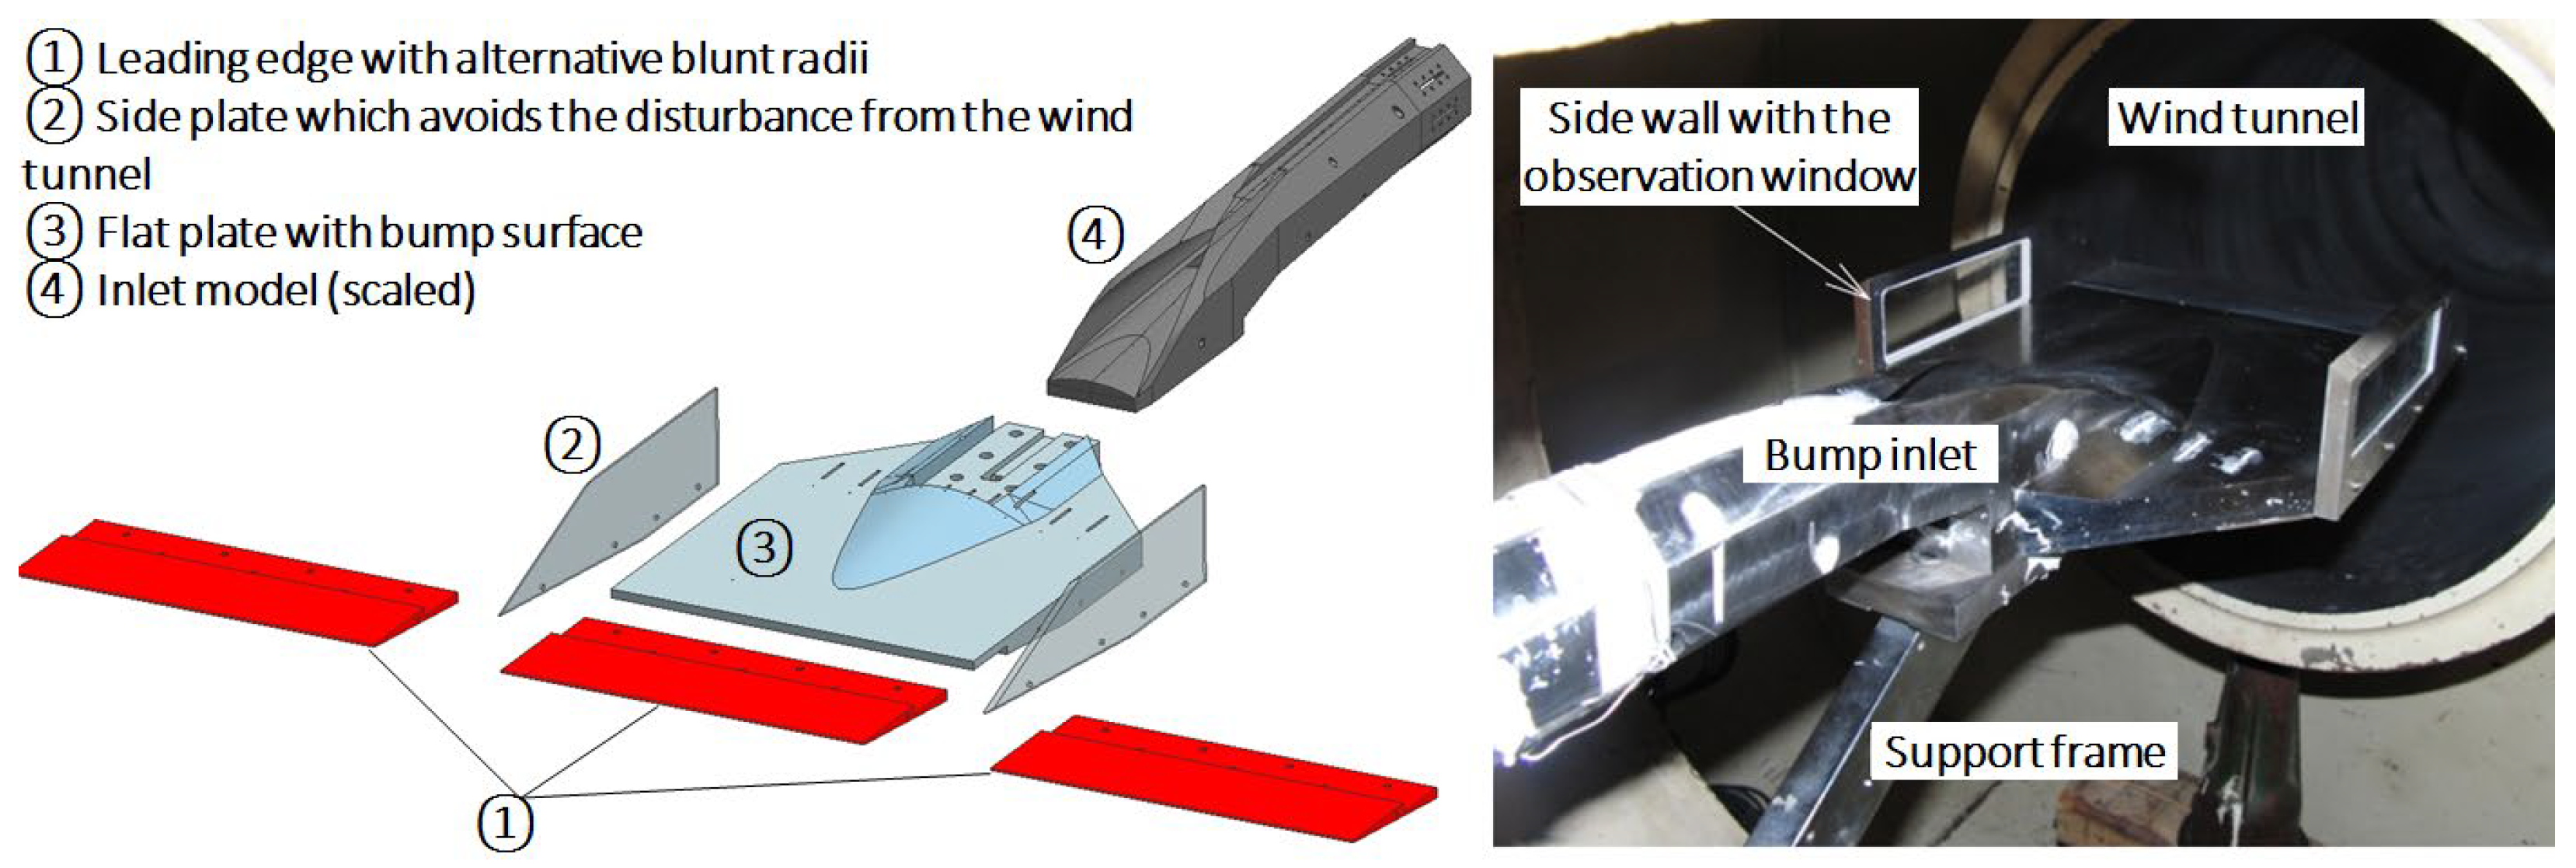
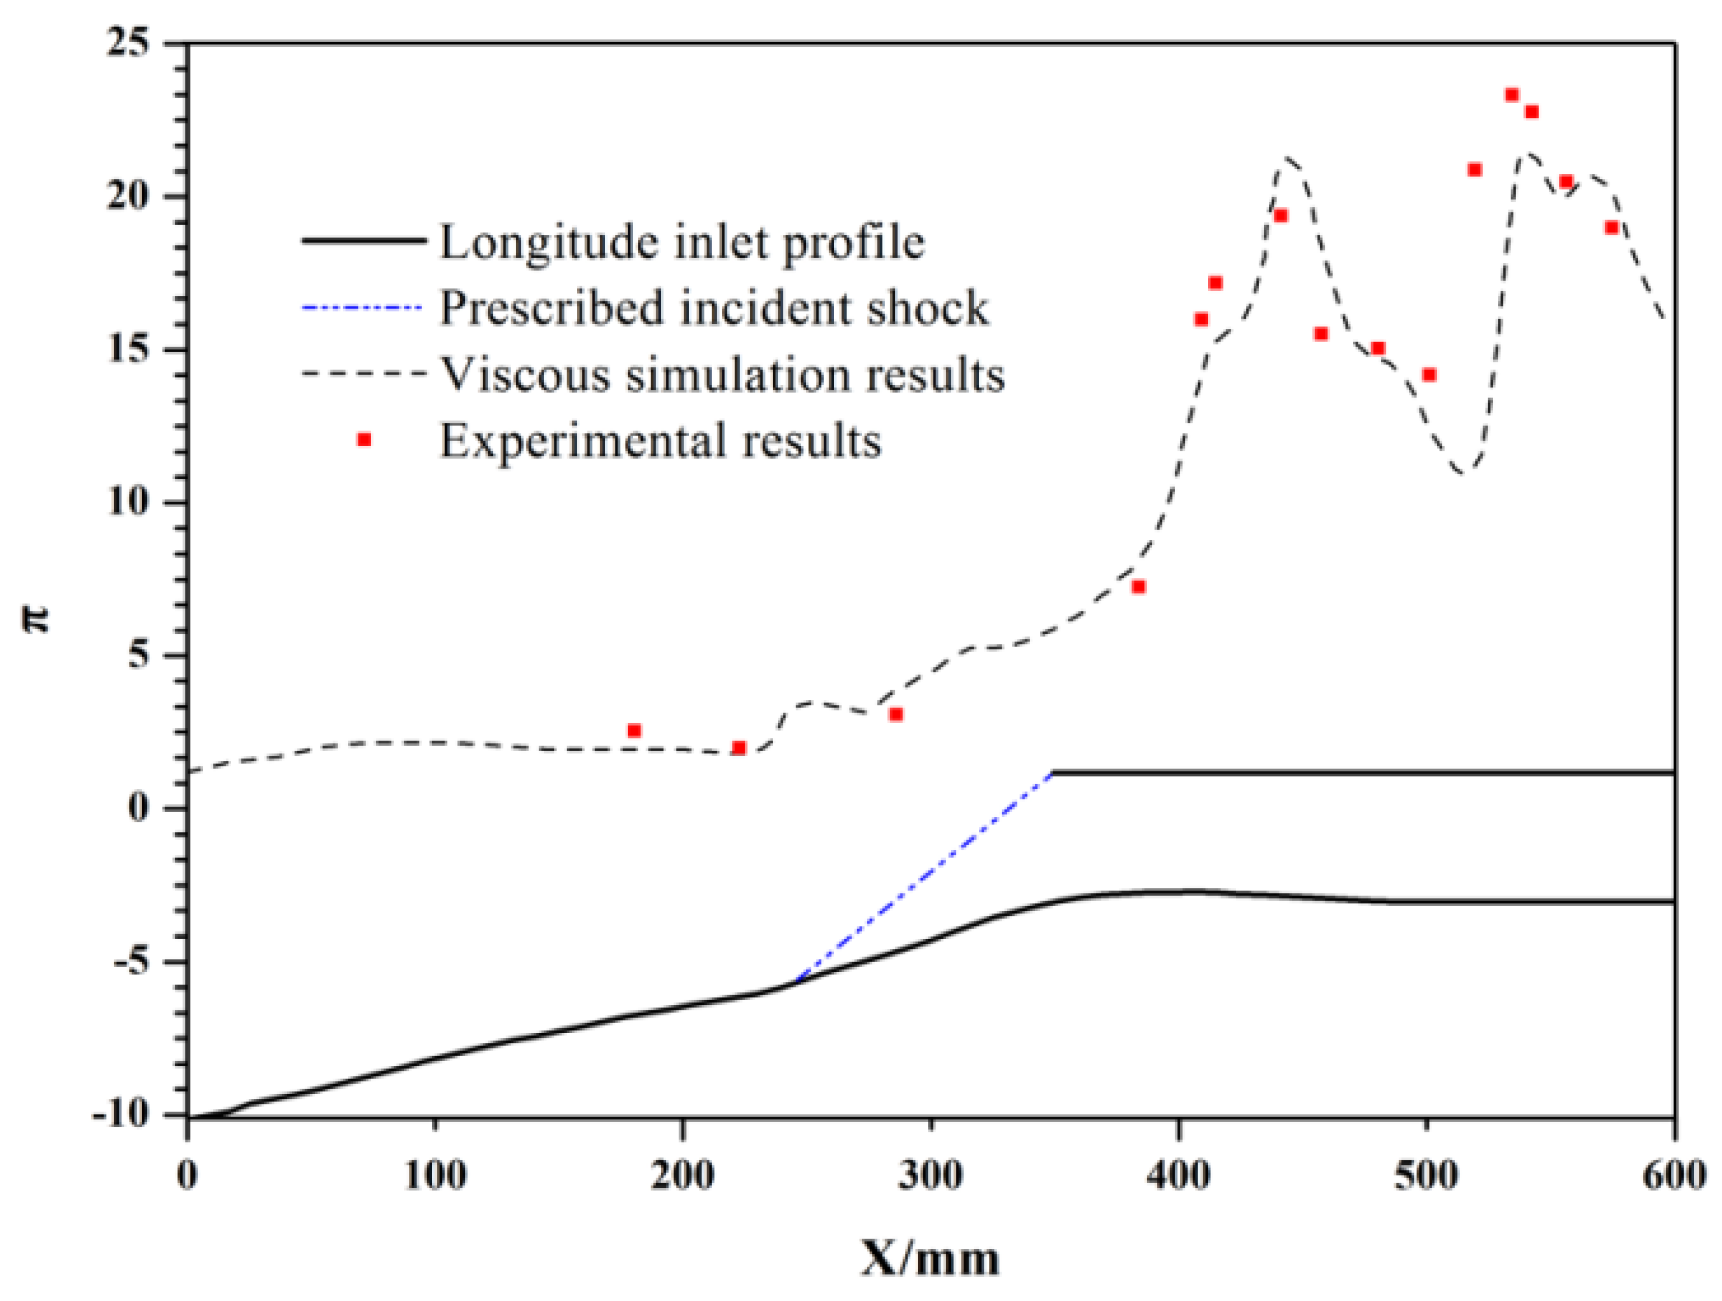
Appendix A. Verification of the k–ε Turbulence Model

In order to verify the accuracy of the k–ε turbulence model for the external–internal flow fields of the bump inlets, an experimental study of a central-spillage bump inlet model was conducted by the authors in the NUAA Hypersonic Wind Tunnel (NHW, NUAA: Nanjing University of Aeronautics and Astronautics). The NHW is a blowdown wind tunnel with a diameter of 0.5 m. It can provide the inflow conditions of M 5.0~8.0. The description and installation view of the wind tunnel model are demonstrated in Figure A1. The wind tunnel model consists of alternative leading edges, a side wall with an observation window, a flat plate with the bump, an inlet, and the support frame that connects the model with the wind tunnel. The alternative leading edges create different boundary layers for the bump inlet. The inflow conditions of the experiment were M = 6.0, P = 531 Pa, and T = 67 K. The bump inlet model was scaled to ensure a throttle ratio ≤ 20%.
Figure A1. Schematic (left) and installation view (right) of a central-spillage diverterless hypersonic inlet.
Aerospace 09 00771 g0a1
The comparison of the CFD results with the experimental data is presented in Figure A2. The pressure distribution at the central line was obtained. The relative error between the CFD and experimental results was kept within 1% in the compression section of the bump inlet. In the downstream isolator region, the relative error was greater than 1%, while the overall trends in CFD and experimental pressure distribution were the same. Moreover, the total pressure recovery coefficients of the CFD and experimental results were both close to 0.47. The above comparison proves that the k–ε turbulence model is able to predict the highly coupled external–internal flow fields of bump inlets.
Figure A2. Experimental and numerical results: the longitudinal static pressure distribution.
Aerospace 09 00771 g0a2

References

  1. Shi, L.; Yang, Y.; Zhao, G.J.; Liu, P.; Zhao, D.; Qin, F.; Wei, X.; He, G. Research and development on inlets for rocket based combined cycle engines. Prog. Aerosp. Sci. 2020, 117, 100639. [Google Scholar] [CrossRef]
  2. Sziroczak, D.; Smith, H. A review of design issues specific to hypersonic flight vehicles. Prog. Aerosp. Sci. 2016, 84, 1–28. [Google Scholar] [CrossRef] [Green Version]
  3. Tai, K.; Kanda, T.; Kudou, K.; Murakami, A.; Komuro, T.; Itoh, K. Aerodynamic performance of scramjet inlet models with a single strut. In Proceedings of the 31st Aerospace Sciences Meeting, Reno, NV, USA, 11–14 January 1993. [Google Scholar]
  4. Ding, F.; Liu, J.; Shen, C.-B.; Huang, W. Novel inlet–airframe integration methodology for hypersonic waverider vehicles. Acta Astronaut. 2015, 111, 178–197. [Google Scholar] [CrossRef]
  5. Zhao, Z.T.; Huang, W.; Yan, L.; Yang, Y.G. An overview of research on wide-speed range waverider configuration. Prog. Aerosp. Sci. 2020, 113, 100606. [Google Scholar] [CrossRef]
  6. Roncioni, P.; Natale, P.; Marini, M.; Langener, T.; Steelant, J. Numerical simulations and performance assessment of a scramjet powered cruise vehicle at Mach 8. Aerosp. Sci. Technol. 2015, 42, 218–228. [Google Scholar] [CrossRef]
  7. Langener, T.; Steelant, J.; Roncioni, P.; Natale, P.; Marini, M. Preliminary Performance Analysis of the LAPCAT-MR2 by means of Nose-to-Tail Computations. In Proceedings of the 18th AIAA/3AF International Space Planes and Hypersonic Systems and Technologies Conference, Tours, France, 24–28 September 2012; p. 5872. [Google Scholar] [CrossRef]
  8. Bowcutt, K.; Bowcutt, K.; Smith, T.; Smith, T.; Kothari, A.; Kothari, A.; Raghavan, V.; Livingston, J.; Tarpley, C.; Livingston, J. The Hypersonic Space and Global Transportation System: A Concept for Routine and Affordable Access to Space. In Proceedings of the 17th AIAA International Space Planes and Hypersonic Systems and Technologies Conference, Tours, France, 24–28 September 2012. [Google Scholar] [CrossRef]
  9. Kothari, A.; Livingston, J.; Tarpley, C.; Raghavan, V.; Bowcutt, K.; Smith, T. A Reusable, Rocket and Airbreathing Combined Cycle Hypersonic Vehicle Design for Access-to-Space. In Proceedings of the AIAA SPACE 2010 Conference & Exposition, Anaheim, CA, USA, 30 August–2 September 2010. [Google Scholar] [CrossRef]
  10. Kothari, A.; Livingston, J.; Tarpley, C.; Raghavan, V.; Bowcutt, K.; Smith, T. Rocket Based Combined Cycle Hypersonic Vehicle Design for Orbital Access. In Proceedings of the 17th AIAA International Space Planes and Hypersonic Systems and Technologies Conference, San Francisco, CA, USA, 11–14 April 2011. [Google Scholar] [CrossRef]
  11. Walker, S.; Sherk, J.; Shell, D.; Schena, R.; Bergmann, J.; Gladbach, J. The DARPA/AF Falcon Program: The Hypersonic Technology Vehicle #2 (HTV-2) Flight Demonstration Phase. In Proceedings of the 15th AIAA International Space Planes and Hypersonic Systems and Technologies Conference, Dayton, OH, USA, 28 April–1 May 2008. [Google Scholar] [CrossRef]
  12. Walker, S.; Rodgers, F. Falcon Hypersonic Technology Overview. In Proceedings of the AIAA/CIRA 13th International Space Planes and Hypersonics Systems and Technologies Conference, Capua, Italy, 16–20 May 2005. [Google Scholar] [CrossRef]
  13. Elvin, J.D. Integrated Inward Turning Inlets and Nozzles for Hypersonic Air Vehicles. U.S. Patent No. 7,866,599, 11 January 2011. [Google Scholar]
  14. Castrogiovanni, A. Review of “The Scramjet Engine, Processes and Characteristics. AIAA J. 2010, 48, 2173–2174. [Google Scholar] [CrossRef]
  15. Wang, Y.; Yang, S.; Zhang, D.; Deng, X. Design of Waverider Configuration with High Lift-Drag Ratio. J. Aircr. 2007, 44, 144–148. [Google Scholar] [CrossRef]
  16. Yu, Z.; Huang, G.; Xia, C.; Huang, H. An Improved Internal-Waverider-Inlet with High External-Compression for Ramjet Engine. In Proceedings of the 20th AIAA International Space Planes and Hypersonic Systems and Technologies Conference, Glasgow, Scotland, 6–9 July 2015. [Google Scholar] [CrossRef]
  17. Li, Y.; Shi, C.; Zheng, X.; You, Y. Dual Waverider to Integrate External and Internal Flows. J. Aircr. 2019, 57, 428–439. [Google Scholar] [CrossRef]
  18. Ding, F.; Liu, J.; Shen, C.; Liu, Z.; Chen, S.; Huang, W. Experimental Investigation of a Novel Airframe–Inlet Integrated Full-Waverider Vehicle. AIAA J. 2019, 57, 2964–2976. [Google Scholar] [CrossRef]
  19. Wartemann, V.; Wagner, A.; Wagnild, R.; Pinna, F.; Miró Miró, F.; Tanno, H.; Johnson, H. High-Enthalpy Effects on Hypersonic Boundary-Layer Transition. J. Spacecr. Rockets 2018, 56, 347–356. [Google Scholar] [CrossRef]
  20. Riley, Z.B.; McNamara, J.J.; Johnson, H.B. Assessing Hypersonic Boundary-Layer Stability in the Presence of Structural Deformation. AIAA J. 2014, 52, 2547–2558. [Google Scholar] [CrossRef]
  21. Guo, P.; Gao, Z.; Zhang, Z.; Jiang, C.; Lee, C.-H. Local-Variable-Based Model for Hypersonic Boundary Layer Transition. AIAA J. 2019, 57, 2372–2383. [Google Scholar] [CrossRef]
  22. Liao, J.-R.; Isaac, K.M.; Miles, J.B.; Tsai, B.-J. Navier-Stokes simulation for cone-derived waverider. AIAA J. 1992, 30, 1521–1528. [Google Scholar] [CrossRef]
  23. Gridley, M.; Cahill, M. ACIS air induction system trade study. In Proceedings of the 32nd Joint Propulsion Conference and Exhibit, Lake Buena Vista, FL, USA, 1–3 July 1996. [Google Scholar] [CrossRef]
  24. Yu, Z.; Huang, G.; Xia, C. 3D inverse method of characteristics for hypersonic bump-inlet integration. Acta Astronaut. 2020, 166, 11–22. [Google Scholar] [CrossRef]
  25. Yu, Z.; Huang, G.; Xia, C. Inverse design and Mach 6 experimental investigation of a pressure controllable bump. Aerosp. Sci. Technol. 2018, 81, 204–212. [Google Scholar] [CrossRef]
  26. Yu, Z.; Huang, G.; Xia, C.; Sesterhenn, J. A pressure-controllable bump based on the pressure-ridge concept. Aerosp. Sci. Technol. 2019, 87, 133–140. [Google Scholar] [CrossRef]
  27. Yu, Z.; Huang, G.; Xia, C. Hypersonic pressure-controllable bump based on an improved permeable-boundary method. Aerosp. Sci. Technol. 2021, 119, 107132. [Google Scholar] [CrossRef]
  28. Zhou, H.; Jin, Z.; Ge, N. Design method for non-axisymmetric generalized internal conical flowfield based on double 3D curved shock waves. Aerosp. Sci. Technol. 2020, 105, 105971. [Google Scholar] [CrossRef]
  29. Qiao, W.; Yu, A.; Yang, D.; Le, J. Integration design of inward-turning inlets based on forebody shock wave. Hangkong Xuebao/Acta Aeronaut. Astronaut. Sin. 2018, 39, 122078. [Google Scholar]
  30. Zhou, H.; Jin, Z. A novel approach for inverse design of three-dimensional shock waves under non-uniform flows. Acta Astronaut. 2020, 176, 324–331. [Google Scholar] [CrossRef]
  31. Liu, J.; Fan, X.; Tao, Y.; Liu, W. Experimental and numerical study on the local unstart mechanism of hypersonic inlet. Acta Astronaut. 2019, 160, 216–221. [Google Scholar] [CrossRef]
  32. Xie, W.Z.; Yang, W.; Jin, Y.; Yang, S.; Guo, S. Prediction of self-starting limit of two-dimensional supersonic inlets considering viscous effects. Aerosp. Sci. Technol. 2020, 106, 106229. [Google Scholar] [CrossRef]
  33. Sepahi-Younsi, J.; Feshalami, B.F.; Maadi, S.R.; Soltani, M.R. Boundary layer suction for high-speed air intakes: A review. Proc. Inst. Mech. Eng. Part G—J. Aerosp. Eng. 2019, 233, 3459–3481. [Google Scholar] [CrossRef]
  34. Tang, H.Y.; Pennycott, A.; Akehurst, S.; Brace, C.J. A review of the application of variable geometry turbines to the downsized gasoline engine. Int. J. Engine Res. 2015, 16, 810–825. [Google Scholar] [CrossRef]
  35. Wie, D.V. Scramjet inlets. Scramjet Propuls. 2000, 189, 447–511. [Google Scholar]
  36. Ault, D.A.; Van Wie, D.M. Experimental and computational results for the external flowfield of a scramjet inlet. J. Propuls. Power 1994, 10, 533–539. [Google Scholar] [CrossRef]
  37. Van Wie, D. Techniques for the measurement of scramjet inlet performance at hypersonic speeds. In Proceedings of the AlAA 4th International Aerospace Planes Conference, Orlando, FL, USA, 1–4 December 1992. [Google Scholar] [CrossRef]
  38. Van Wie, D.M.; Ault, D.A. Internal flowfield characteristics of a scramjet inlet at Mach 10. J. Propuls. Power 1996, 12, 158–164. [Google Scholar] [CrossRef]
  39. Zhang, J.; Yuan, H.; Wang, Y.; Huang, G. Experiment and numerical investigation of flow control on a supersonic inlet diffuser. Aerosp. Sci. Technol. 2020, 106, 106182. [Google Scholar] [CrossRef]
  40. Yu, Z.H.; Huang, G.P.; Wang, R.L.; Musa, O. Spillage-Adaptive Fixed-Geometry Bump Inlet of Wide Speed Range. Aerospace 2021, 8, 340. [Google Scholar] [CrossRef]
  41. Kong, C.; Zhang, C.; Wang, Z.; Li, Y.; Chang, J. Efficient Prediction of Supersonic Flowfield in an Isolator Based on Pressure Sequence. AIAA J. 2022, 60, 2826–2835. [Google Scholar] [CrossRef]
  42. Qin, B.; Chang, J.; Jiao, X.; Bao, W. Unstart Margin Characterization Method of Scramjet Considering Isolator–Combustor Interactions. AIAA J. 2015, 53, 493–500. [Google Scholar] [CrossRef]
  43. Jeong, J.; Hussain, F. On the identification of a vortex. J. Fluid Mech. 2006, 285, 69–94. [Google Scholar] [CrossRef]
  44. Wang, S.; Zhang, X.; He, G.; Liu, T. Lift enhancement by dynamically changing wingspan in forward flapping flight. Phys. Fluids 2014, 26, 169–230. [Google Scholar] [CrossRef]
Figure 1. Configurations of two bump inlets (upper side: side-spillage inlet, Form 2; lower side: central-spillage inlet, Form 1).
Aerospace 09 00771 g001
Figure 2. Schematic of obtaining the inlet’s mass capture ratio: left, uniform inflow condition; right, non-uniform inflow condition.
Aerospace 09 00771 g002
Figure 3. Three-dimensional-structured meshes for bump inlets (left: Form 1; right: Form 2).
Aerospace 09 00771 g003
Figure 4. Compression efficiency of the two forms under the design conditions (M = 6.0, H = 24 km).
Aerospace 09 00771 g004
Figure 5. Pressure contours of the central-spillage integrated form under different backpressures (Form 1). (a) πb = 18.5, (b) πb = 37.9, (c) πb = 61.8, (d) πb = 83.3, (e) πb = 89.3, (f) πb = 99.6.
Aerospace 09 00771 g005
Figure 6. Pressure contours of the side-spillage integrated form (πb = 15.6~76.4, Form 2).
Aerospace 09 00771 g006
Figure 7. Pressure contours of the side-spillage integrated form (πb = 85.6~110.0, Form 2).
Aerospace 09 00771 g007
Figure 8. Streamlines and M isolines of the new side-spillage integrated form (Form 2). (a) πb = 15.6, (b) πb = 32.7, (c) πb = 57.0, (d) πb = 76.4, (e) πb = 85.6, (f) πb = 100.6, (g) πb = 104.1, (h) πb = 110.0.
Aerospace 09 00771 g008aAerospace 09 00771 g008b
Figure 9. Vortex structures under design conditions based on the Q-criteria (Q = 7 × 10⁶).
Aerospace 09 00771 g009
Figure 10. Compression and deceleration ratios in a wide Mach range.
Aerospace 09 00771 g010
Figure 11. Impacts of M on the inlet distortion and flow spillage.
Aerospace 09 00771 g011
Figure 12. Compression efficiency under different backpressures and inflow conditions.
Aerospace 09 00771 g012
Table 1. Geometric parameters of two diverterless hypersonic inlets (unit of length: m; unit of area: m2).
FormLtotalWbumpWinletCRxHtotalSzoyRinletRwet
13.3071.1660.20.3850.3670.2240.370.026
22.3711.1660.20.3850.2650.1470.410.034
Table 2. Inflow conditions for numerical simulation.
H (km)MV (m/s)P (Pa)Pd (Pa)
24.06.01786.712930.6773,852.9
22.95.51633.653487.1373,840.0
21.75.01481.014218.4373,822.6
20.34.51328.795205.9673,852.5
18.84.01180.296594.9273,862.7
17.13.51032.758615.6173,862.2
15.23.0887.9311,652.873,863.5
12.92.5737.6816,882.273,849.5
10.02.0598.7926,372.673,843.0
Table 3. Mass-averaged characteristics of bump inlets under various πb boundary conditions.
FormπbMStatusφMexitσRMηKE
11.06.0Start0.7452.940.480.4870.968
118.56.0Start0.7452.860.450.4730.966
137.96.0Start0.7452.300.360.3800.954
161.86.0Start0.7371.710.230.2830.930
164.96.0Start0.7461.650.250.2730.934
183.36.0Start0.7341.480.250.2450.933
189.36.0Start0.7401.320.200.2180.920
199.66.0Start0.7631.110.160.1830.907
1105.06.0Unstart0.031----
21.06.0Start0.7483.020.490.4990.969
215.66.0Start0.7482.900.440.4790.964
232.76.0Start0.7482.900.440.4790.964
257.06.0Start0.7461.970.350.3260.952
276.46.0Start0.7481.970.290.3260.942
285.66.0Start0.7481.730.250.2860.933
2100.66.0Start0.7481.240.150.2050.904
2104.16.0Start0.7471.120.140.1850.899
2110.06.0Unstart0.023----
Table 4. Aerodynamic characteristics under a wide range of inflow speed conditions.
FormMStatusσφspillageεAεMεπηKE
16.0Start0.48053.7%0.5144.3070.968
15.0Start0.518.80%47.7%0.5183.6780.958
14.0Unstart------
26.0Start0.49053.4%0.5284.8940.969
25.0Start0.539.50%49.9%0.5343.4570.961
24.0Start0.4526.80%39.6%0.5982.9520.921
23.5Start0.5332.10%36.5%0.6082.6330.920
23.0Start0.6438.60%34.0%0.6542.4470.927
22.5Start0.7554.60%33.3%0.8212.1810.933
22.0Unstart------
Publisher’s Note: MDPI stays neutral with regard to jurisdictional claims in published maps and institutional affiliations.

