Review

Statistics and Machine Learning in Aviation Environmental Impact Analysis: A Survey of Recent Progress

Daniel Guggenheim School of Aerospace Engineering, Georgia Institute of Technology, Atlanta, GA 30332, USA
*
Author to whom correspondence should be addressed.
Current address: Aerospace Systems Design Laboratory (ASDL), 275 Ferst Dr NW No. 3, Atlanta, GA 30332-0150, USA.
Aerospace 2022, 9(12), 750; https://doi.org/10.3390/aerospace9120750
Submission received: 10 September 2022 / Revised: 23 November 2022 / Accepted: 23 November 2022 / Published: 25 November 2022
(This article belongs to the Special Issue Aircraft Emissions and Climate Impact)

Abstract

:
The rapid growth of global aviation operations has made its negative environmental impact an international concern. Accurate modeling of aircraft fuel burn, emissions, and noise is the prerequisite for informing new operational procedures, technologies, and policies towards a more sustainable future of aviation. In the past decade, due to the advances in big data technologies and effective algorithms, the transformative data-driven analysis has begun to play a substantial role in aviation environmental impact analysis. The integration of statistical and machine learning methods in the workflow has made such analysis more efficient and accurate. Through summarizing and classifying the representative works in this intersection area, this survey paper aims to extract prevailing research trends and suggest research opportunities for the future. The methodology overview section presents a comprehensive development process and landscape of statistical and machine learning methods for applied researchers. In the main section, relevant works in the literature are organized into seven application themes: data reduction, efficient computation, predictive modeling, uncertainty quantification, pattern discovery, verification and validation, and infrastructure and tools. Each theme contains background information, in-depth discussion, and a summary of representative works. The paper concludes with the proposal of five future opportunities for this research area.

1. Introduction

With the rapid growth of global air traffic operations in the past five decades, the aviation industry has grown to become an integral part of the global economy. While the global air transportation operations at scale have greatly facilitated people’s travel and business, their negative environmental impact, also identified by some entities as the most significant adverse impact of aviation [1], has emerged as a major concern internationally. The three primary aspects of aviation’s negative impacts on the environment are: (1) local air quality impacts that can exacerbate health-harming air pollution, (2) climate change impacts that can accelerate global warming, and (3) community noise impacts that can undermine affected population’s mental well-being [2]. Undoubtedly, the aviation industry must keep the development momentum to meet the needs of a growing economy while simultaneously being more environmentally sustainable. The system must operate harmoniously within the constraints imposed by requisites such as clean air and water, limited noise impacts, and a livable climate.
Aircraft, ground vehicles, Ground Support Equipment (GSE), and other stationary sources at the airport produce emissions as a result of the combustion of fuel. Aircraft engines mainly produce carbon dioxide (CO 2 ), which comprises around 70% of the exhaust, and water vapor (H 2 O), which comprises around 30% of the exhaust. Less than 1% of the emissions is composed of nitrogen oxides (NO x ), carbon monoxide (CO), sulfur oxides (SO x ), partially combusted or unburned hydrocarbons (HC), particulate matter (PM), other trace compounds, soot and sulfate aerosols, and increased cloudiness due to contrail formation [2,3]. These emissions undergo complex interactions among themselves and with the changing background atmosphere [4]. Among the aircraft pollutant emissions, around 10% are emitted near the surface of earth (below 3000 ft above ground level) while the remaining 90% are emitted at above 3000 ft, mostly at cruise altitudes within the Upper Troposphere and the Lower Stratosphere (UTLS). While aviation technologies have become more fuel efficient, the overall emissions from aviation has risen due to the rapidly increasing volume of air travel. Statistics reveal that the annually averaged growth rate in global aviation CO 2 emissions was 2.2% per year over the period 1970 to 2012 and 5% per year for 2013 to 2018. In 2018, global aviation CO 2 emissions exceeded 1000 million tonnes per year for the first time, which accounts for approximately 2.4% of all anthropogenic emissions of CO 2 (including land use change) [3]. These observations indicate that aviation emissions remains a challenging issue towards a more sustainable future of aviation.
Aircraft noise pollution refers to the “unwanted sound” produced by aircraft or its components in flight. In general, aircraft noise is produced by three main sources. Engine noise is the main source of aircraft noise. For propeller aircraft and helicopter, engine noise includes both aerodynamically induced noise from the propeller and mechanically induced noise from other moving parts of the engine. For jet aircraft, engine noise is dominated by jet noise from the gas turbine engines, which is responsible for much of the aircraft noise during takeoff and climb. Jet noise is caused by the high speed flow leaving the exhaust of the engine which is highly unstable and turbulent. Aerodynamic noise is the second source of aircraft noise. Aerodynamic noise arises from airflow around the aircraft fuselage and control surfaces and increases with aircraft speed and air density. Supersonic aircraft, such as fighter jets, often creates intense aerodynamic noise called sonic boom due to the formation of shock waves during supersonic flight. Aerodynamic noise can sometimes be mitigated by designing the shape of airframe. The third source of aircraft noise is the aircraft systems. Some examples include noises from the Auxiliary Power Unit (APU) and the cabin pressurization and conditioning systems. Aircraft noise can disrupt sleep, cause community annoyance, adversely affect academic performance of children, and could increase the risk for cardiovascular disease of people living in the vicinity of airports [5].
Accurate modeling of aircraft environmental impacts—mainly fuel burn, emissions, and noise, is crucial in informing a number of new operational procedures, technologies, and policies to abate negative aviation environmental impacts. In the past decade, key breakthroughs in data-driven analysis have been catalyzed by (1) advances in data quantity and quality, (2) effective and scalable algorithms from applied mathematics and computer science, and (3) high-performance computation [6]. The introduction of big data technologies in aviation industry has brought a good opportunity for aviation environmental impact modeling to more precisely reflect real-world operations. Two typical examples of rich datasets in aviation are Flight Operational Quality Assurance (FOQA) data and Automatic Dependent Surveillance—Broadcast (ADS–B) data [7]. FOQA data consist of regularly recorded aircraft sensor measurements and switch settings. The data collected are a multivariate time series consists of thousands of parameters (numerical, discrete, categorical, text, etc.) recorded at a frequency of up to 16 Hz (typically at 1 Hz). ADS–B data collects the aircraft’s identification, altitude, position, and velocity in a lower resolution than FOQA. The data determined by satellite navigation or other sensors is periodically transmitted by the aircraft to ground-based stations. According Federal Aviation Administration (FAA) website, “Automatic Dependent Surveillance-Broadcast (ADS-B)”, because ADS-B improves the safety and efficiency of aviation infrastructure and operations, real-time ADS-B is now the preferred method of surveillance for air traffic control in the National Airspace System (NAS). A report from Oliver Wyman, “MRO Big Data—A Lion or a Lamb?”, estimates that the global fleet is likely to generate over 98 million terabytes of data by end of 2026, about ten times that of 2018, due to the increase in global fleet size and the deployment of new technologies to collect and transmit data. In this context, analytical methods from statistics, machine learning, and computing will keep playing an increasingly critical role to make future air transportation more environmentally friendly, more efficient, more predictable, and safer.
This paper is a survey of recent works which employ statistical and machine learning methods to make aviation environmental impact analysis more efficient and accurate [8]. After years of progress, the opportunity to fill in this gap of the existing literature has matured. Through summarizing and classifying representative works in this area, the objective is to extract prevailing research trends regarding how statistical and machine learning methods function in advancing aviation environmental impact modeling and suggest research opportunities for the future. As a survey paper at the intersection of methodology and application, its content is planned to have the following features:
  • Summary of methodology: On the summary of methods from statistics and machine learning, the emphasis is to present a comprehensive landscape and development process for each field. There are many excellent textbooks and review papers in the literature which introduce the mathematical foundation, detailed algorithms, and experimental analysis of of the these methods. The summary of methodology in this paper is not an attempt to replicate or elevate those existing methodology-oriented review papers. Instead, from an engineering researcher’s perspective, the aim of this part is to clearly convey the basic ideas in the methods and the differences between them such that applied researchers can have a clearer big picture.
  • Organization of representative works: Most similar survey papers focusing on other application areas group relevant works in the literature by the type of method used. In that manner, the existing literature on aviation environmental impact analysis would be divided into, for example, the applications of regression analysis, clustering, dimensionality reduction, feature selection, neural networks, etc. In our approach, representative works in the literature are grouped by the purpose of applying statistical and machine learning methods, i.e., for what reasons were these method used to tackle different problems. Thus, the main section of this paper is organized into seven themes: data reduction, efficient computation, predictive modeling, uncertainty quantification, pattern discovery, verification and validation, and infrastructure and tools. For each theme, we present both the necessary background and the representative papers.
  • Diversity: This paper is by no means an exhaustive list of every relevant work in this area. The overarching objective is to summarize the overall research trends through representative works/projects. Under the premise that each selected work has enough quality and correct scope, we hope to present a diverse research portfolio which covers different methods, different application directions, and even different regions in the world (although with lower priority than the previous two aspects). For example, on the methodology side we cover from basic statistical analysis and regression models to unsupervised learning approaches such as clustering and dimensionality reduction, different types of neural networks (ordinary, convolutional, recurrent), and graphical model. On the application side we cover the modeling of fuel burn, emissions, and noise, for fixed-wing aircraft, helicopter, airport, and air transportation system. The selection range also covers works from different entities and regions to reflect the fact that sustainable aviation is a global effort.
While the focus of this paper is on the application of statistics and machine learning methods to make aviation environmental impact analysis more efficient, accurate, and interpretable, there are certain “closely-related” aspects that we do not cover. The following three topics are not included:
  • Optimization: There are three facets of analytics: descriptive, predictive, and prescriptive analytics. On the methodology side we only cover the former two facets of analytics. Optimization is at the kernel of prescriptive analytics. Although it also belongs to data-driven approaches, it is not covered here simply because it is a rich area that is worthy of an independent survey paper. Optimization methods have been used to design aircraft operations that reduce environmental impacts. A sample of such works include [9,10,11,12]. Reference [13] is a recent survey paper on climate optimal aircraft trajectory planning.
  • Aircraft design: Since sustainable aviation became a major research area in the aerospace community, novel methods in aircraft design and Multidisciplinary Design Optimization (MDO) have started to incorporate environmental considerations into aircraft conceptual and preliminary design phases. An early work of this type [14] dates back to almost two decades ago. Examples of some more recent works include [15,16,17].
  • Physics-based methods: Under the category of efficient and accurate modeling of aviation environmental impacts, some recent progresses/capabilities are physics-based which do not involve much data-driven components discussed in this paper. This type of approaches is also a crucial and indispensable part of aviation environmental impact modeling. Interested readers can refer to [18,19,20,21] as starting point.
The remainder of the paper is organized as follows. Section 2 contains a brief overview of methods from statistics and machine learning. Section 3 introduces the seven main application themes of statistical and machine learning methods in aviation environmental impact analysis. Each subsection in Section 3 includes an overview of an application theme and summarizes at most ten representative papers under the theme. Section 4 discusses some future avenues of the research area before Section 5 concludes the paper.

2. A Brief Overview of Methods from Statistics and Machine Learning

2.1. Statistical Methods

Statistics is the mathematical science of developing theories and methods for collecting, presenting, analyzing, and interpreting empirical data. There is also an opinion that statistical inference is at the triple point of mathematics, empirical science, and philosophy [22]. Statistics is a highly interdisciplinary field which finds applications in virtually all types of scientific disciplines. The advancements of new statistical theories and methods have also been motivated by research questions from disciplines such as science, medicine, engineering, economics, and business. Statistical thinking particularly concerns the relation of quantitative data to a real-world problem in the presence of uncertainty and variability [23,24]. Therefore, probability is the language used by statistics and plays a key role in the field. Statisticians map problems of interest into formal probability models, compute inferences from the data and models, and explore the adequacy of the inferences [25].
Inductive inference is one of the core ideas in statistics. Inductive inference uses sample data to derive results that extend beyond the data, such as predictions over future data and information about the population [26]. Unlike deductive inference which is logically certain, inductive inference is uncertain in nature. In a typical survey problem, inductive inference needs to go through four stages: (1) raw data, (2) study sample, (3) study population, and (4) target population. From (1) to (2) is the problem of measurement, i.e., how accurate (honest) the observations are; from (2) to (3) needs internal validity, i.e., that the sample must be a representative random sample, which is also the most challenging step; from (3) to (4) requires external validity, i.e., that the sample covers the complete population, which can be ensured by careful experimental design. Another core idea is to claim discovery through hypothesis testing. The null hypothesis H 0 of a question refers to a working conjecture until there is sufficient evidence against it [27]. It always denies differences, progresses, and changes. To test the null hypothesis, a test statistic is chosen and its sampling distribution is generated given that H 0 is true. If the observed statistic turns out to be extreme enough (lies in the tails of the distribution), the test supports the rejection of H 0 . The result is declared statistically significant if the p-value ( P ( Observation | H 0 = True ) ) is below some critical threshold.
Statistics has many branches, depending on the angle of classification. Descriptive statistics collects data from experiment and describes the properties of data. Inferential statistics then uses those properties to test hypotheses and draw conclusions. The two key elements in this process are (1) designing the right experiment to obtain a small sample, and (2) applying the right approach/model to draw predictions and generalizations on how the population behaves. Stringent scientific approaches are required in both steps to obtain reliable results. Frequentist statistics considers a parameter to estimate θ as a fixed unknown and draws conclusions from only the sample data. Through methods such as design of experiments and regression analysis, Frequentist inference constructs hypothesis testing and confidence interval. Bayesian statistics, on the other hand, considers the parameter of interest θ as a random variable with a certain probability distribution, also known as the prior distribution. The prior distribution represents the external knowledge/belief of the problem outside of data. Bayesian inference then utilizes Bayes’ theorem to update the prior distribution using likelihood function and observed data, resulting in the posterior distribution. Since there might not exist a ‘true’ prior distribution, the analysis should include the sensitivity to multiple alternative choices, encompassing a range of different candidate opinions [27]. Causal inference, as opposed to just statistical inference, is another crucial topic in statistics as identifying causal rather than associative relationships is one of the foundational tasks in science. It analyzes the response of an effect variable when a cause variable is changed. Because correlation does not imply causation, such causal questions cannot be addressed from observational data alone and require certain knowledge of the data-generating process [28]. Experimental data from a well-designed randomized experiments (natural or artificial) can provide a basis for investigating causal relations and drawing valid causal conclusions. One can refer to [28,29] for more details on causal inference from a statistics point of view.
In recent decades, the field of statistics has also been evolving to accommodate the latest trends, capabilities, and needs. Those changes can be summarized into two main facets. First, it has been changing from a focus on mathematical methods to one that covers the entire problem-solving cycle. For example, the PPDAC problem-solving cycle shown in Figure 1 goes from Problem (definition), Plan (design), Data (collection and processing), Analysis, to Conclusion, and starts to repeat another cycle. Even though the PPDAC cycle seems to not emphasize the more theoretical side of statistics, each step is in fact technical and can inspire the development of innovative methodologies. Second, it has been adapting to the change in computational power, which was originally the bottleneck of statistical analysis [22]. Computational statistics has become more significant and covered a large part of topics in twenty-first-century statistics. Because the rising field of data science emphasizes algorithmic thinking rather than inferential justification, large-scale prediction algorithms have become the focus of many statisticians today. This causes a blurring of the boundary between computational statistics and one of the hottest field in the present, machine learning. Nevertheless, the interplay between computational methodologies and inferential theories, or the justification of the ambitious algorithms, has become the new task of modern statistical inference [22].

2.2. Machine Learning Methods

Machine learning is the science of automatically learn programs from data [30]. The term encompasses techniques, automated tools, and the entire process of intelligently transforming data into important knowledge and making predictions on future, yet-to-be-seen data. Machine learning algorithms can learn to perform complex tasks by generalizing from examples and are widely used in computer science and beyond. There exists a bewildering variety of machine learning tasks and algorithms. Despite this, at the kernel of all learning algorithms are a combination of three components, i.e., learning = representation + evaluation + optimization.
  • Representation: In the first step, a learner must be represented in a format for computer to handle. Selecting a set of representations for a learner forms the hypothesis space of the learner. A learner cannot be learned if it is not in the hypothesis space.
  • Evaluation: An evaluation function, also referred to as the objective function, is needed to distinguish good learners from bad ones. The construction of the objective function must consider issues in optimization such that it may differ from the direct objective one wants to optimize.
  • Optimization: An optimization method searches through the space of possible hypotheses for one with the best performance. The choice of optimization method is key to both the efficiency and efficacy of the learner. Table 1 includes typical examples of each of the three components.
Table 1. Examples of the three components of learning algorithm (Original structure from [30]).
ComponentExamples
RepresentationInstance-based: k-nearest Neighbor, Support Vector Machines
Hyperplanes: Naive Bayes, Logistic Regression
Trees-based: Classification and Regression Trees, Boosted Trees
Rule-based: Association Rules
Neural Networks: Artificial Neural Networks
Graphical Models: Bayesian Networks, Markov Random Fields
EvaluationMean Squared Error, Likelihood, R 2
Accuracy, Precision, Recall
Mutual Information, Homogeneity
Posterior Probability, K-L Divergence, Cost/Utility
OptimizationDiscrete: Greedy Search, Branch-and-bound, Beam Search
Continuous (Unconstrained): Gradient Descent, Newton’s Method
Continuous (Constrained): Linear Programming, Augmented Lagrangian
The landscape of machine learning described in the remainder of this section is shown in Figure 2. A diverse set of machine learning algorithms tackle different types of learning, among which the three primary types of learning problems are supervised, unsupervised, and reinforcement learning. Supervised learning is a category of problem that learns a mapping f ( x ) from labeled data, i.e., training data comprised of both input and output vectors. Two common supervised learning problems are classification and regression, which involve the predictions of class label and numerical label respectively. By contrast, unsupervised learning involves learning to make sense of unlabeled data where only input vectors are available. Four common unsupervised learning problems include clustering which groups similar examples in the data, density estimation which determines the distribution of data, dimensionality reduction which finds a low-dimensional representation of data, and anomaly detection which identifies rare patterns. The third type of learning problem, reinforcement learning, learns how to operate (map situations to actions) in an environment so as to maximize numerical reward [31]. Reinforcement learning algorithms do not rely on fixed training data and instead interact with an environment to gain feedback from its experiences. Outside of these three main paradigms, deep learning is a family of learning algorithms based on large deep neural networks, whose performance could outperform traditional machine learning algorithms on massive datasets. With the scalability of neural networks, the learning outcome gets better with more data, larger models, and more computation. Another appealing aspect of deep learning is representation learning, where deep learning models can perform hierarchical feature learning to extract features at multiple levels of abstraction. Some complex algorithms, however, may lack transparency and interpretability. When the performance of a particular learning problem is good enough, it may be worthy of trading off small performance increases for simplicity.
A few other learning algorithms use a hybrid of different learning types above to tackle certain scenarios. Semi-supervised learning is useful when the training data includes very few labeled data and a significant number of unlabeled data because of the high expense for labeling data. Semi-supervised learning attempts to combine labeled and unlabeled data and improve the performance of supervised learning tasks. The success of a semi-supervised learning algorithm depends critically on the underlying assumption [32]. Examples of semi-supervised learning approaches include self-training, mixture models, co-training, and graph-based learning. Self-supervised learning frames an unsupervised learning problem as a supervised learning problem such that supervised learning algorithms apply to solve the problem. One common example of self-supervised learning algorithm is the autoencoder. An autoencoder is a feed-forward neural network that is trained to reproduce its input at the output [33]. It consists of an encoder network h e n c ( x ) which creates a compact representation of the input and a decoder network x = f d e c ( h ) which reconstructs it back to the original. Generative Adversarial Networks (GANs) [34] is another example of self-supervised learning. Multi-instance learning deals with problems in which the individual data are unlabeled, and the label information is associated with bags or groups of data. Machine learning algorithms can also be categorized by different paradigms for inference. Inductive learning fits general models or rules from examples (data); deductive inference applies the model to make predictions; transductive learning makes predictions directly based on specific examples without generalization (e.g., k-NN algorithm).
Aside from the different types of learning problems mentioned above, some more advanced learning techniques or strategies have also become game changers. Ensemble learning uses multiple learning algorithms to achieve better predictive performance than any individual learning algorithm alone. In cases where an optimal hypothesis is difficult to find, an ensemble represents a single hypothesis that allows better flexibility among the set of alternative hypotheses. A machine learning ensemble can be either homogeneous or heterogeneous, depending on whether it contains multiple hypotheses with the same base learner (e.g., random forest) or from different base learners. The general objectives of ensemble methods are three-fold: (1) decreasing variance through voting (in classification) and averaging (in regression); (2) decreasing bias through giving greater weights to more accurate learners; and (3) improving predictions through meta-classifier or meta-regressor. Ensembles tend to perform even better when there exists a significant diversity (low correlation) among the learning algorithms. In the ideal case, the base learners are both maximally accurate and diverse. Common ensemble learning methods include Bayes optimal classifier, bootstrap aggregating (bagging), boosting, and stacking. The two main disadvantages of ensemble learning are reduction in interpretability and increase in computational time. Multi-task learning learns a shared model/representation across multiple related tasks to improve generalization, efficiency, and potentially accuracy as well. Transfer learning learns multiple tasks sequentially and uses an existing model as the starting point for continued training on another relevant task. Active learning distinguishes itself from “passive learning” because it can adaptively or interactively query a user during the learning process to resolve ambiguity. It can choose which data to label and learn from and therefore can achieve better accuracy with fewer training labels [35], making it particularly attractive to cases where labels are expensive to obtain. Compared to traditional machine learning methods which are offline, online learning is performed incrementally on streaming data to update the model as new data arrives [36]. Online learning is appropriate for problems where observations are collected and changing over time.
The discussion now moves from learning algorithms, problem types, and techniques to the entire machine learning workflow and production system. There are five aspects that are crucial for the successful training of a machine learning algorithm. First, generalization is the fundamental goal of a machine learning task, i.e., to generalize beyond the observations in the training set. This can be achieved by either using both training and test sets or using cross-validation which mitigates the reduction in training data. Second, the bias-variance trade-off is a central problem in supervised machine learning. The objective is to simultaneously avoid both bias (an error source caused by underfitting) and variance (an error source caused by overfitting). Especially in the case of insufficient data, overfitting is prone to happen. Common remedies for overfitting include cross-validation, regularization, and statistical significance tests. Third, feature engineering is one of the most important factors for the success of a machine learning project. The original features in the raw data are often not at the best conditions for learning, which favors independent features that each correlate well with the outputs [30]. Construction of features often requires most of the effort in a machine learning project, because it needs intuition, creativity, and expertise in both machine learning algorithms and the application domain. Fourth, a learner which incorporates data with knowledge can make a good solution on the specific problem, because every learner (representation) embodies some knowledge or assumptions. Lastly, apart from the algorithm perspective (design and use), a machine learning task is still centered around data. Gathering a large amount of high quality data can even enable a simple algorithm to beat a clever algorithm with less data. Therefore, the performance of a machine learning task can always be further improved by ameliorating the quantity and/or quality of data.
The deployment of machine learning algorithms is only one component in the entire end-to-end machine learning workflow (also called machine learning engineering), which is depicted in Figure 3. A similar concept in data mining literature is the Knowledge Discovery from Data (KDD) process, which consists of seven steps from data cleaning to knowledge representation [37]. The end-to-end workflow consists of various components of a data intensive project. In industry, such an end-to-end machine learning production system which transforms theoretical knowledge into production-ready capabilities is referred to as machine learning engineering in production (MLOps). The MLOps system is comprised of four primary blocks: project scoping, data engineering, machine learning model engineering, and deployment. In scoping, practitioners identify the most valuable problems, ask initial questions, evaluate the project’s feasibility, set up overall objectives, and integrate resources to start the project. Then, data engineering is about acquiring the right raw data for the problem and transforming it into structured data to apply machine learning algorithms. Data engineering mainly consists of data selection, initial exploratory analysis, data cleaning (wrangling), data integration, feature extraction and engineering, feature selection, and feature transformation. Machine learning model engineering is the phase of applying machine learning algorithms to obtain a high performing machine learning model. The modeling engineering includes multiple operations such as model training, model evaluation, hyperparameter tuning, and evaluation to arrive at a final model. In the end, the machine learning model is integrated into existing software and deployed as part of an application in business, engineering, and scientific research. The deployment phase includes the determination of deployment pattern (full automation, partial automation with human in the loop, etc.) and system monitoring to potentially update and improve the model.

3. The Main Application Themes

In this section, we analyze representative papers in the literature which apply statistical and machine learning methods for efficient and/or accurate analysis of aviation environmental impacts. Here, instead of using traditional approach which groups the selected papers by the type of method involved (regression, clustering, neural networks, etc.), we classify representative papers by the application theme, i.e., the actual purpose those methods are used for. The seven resulting themes are: data reduction, efficient computation, predictive modeling, uncertainty quantification, pattern discovery, verification and validation, and infrastructure and tools. The discussion of each theme includes the introductory background information, primary research trends under the theme, and a summary table containing details of at most 10 featured papers for each theme. Please note that some selected papers may span across multiple themes. For example, a paper could belong to both data reduction and efficient computation. We discuss such papers in a theme that can best complement other papers in the theme and complete the narrative.

3.1. Data Reduction

Performing complex analysis and computation on large datasets can be impractical or infeasible. In such cases, data reduction is applied to obtain a reduced representation of the dataset that is much smaller in volume, yet still closely maintains the integrity of the original dataset [37]. Applying a reduced dataset in analysis and computation trades accuracy for speed in response to the need of obtaining quick approximate answers to queries on large datasets. The development of data reduction techniques for science and engineering applications has gained increasing interest in the community. The motivation behind the trend is that contemporary operations, scientific observations, experiments, and simulations are generating unwieldy amounts of data which are beyond people’s capacity to store, stream, analyze, and archive. In the meantime, these massive datasets almost always contain redundancies and trivialities.
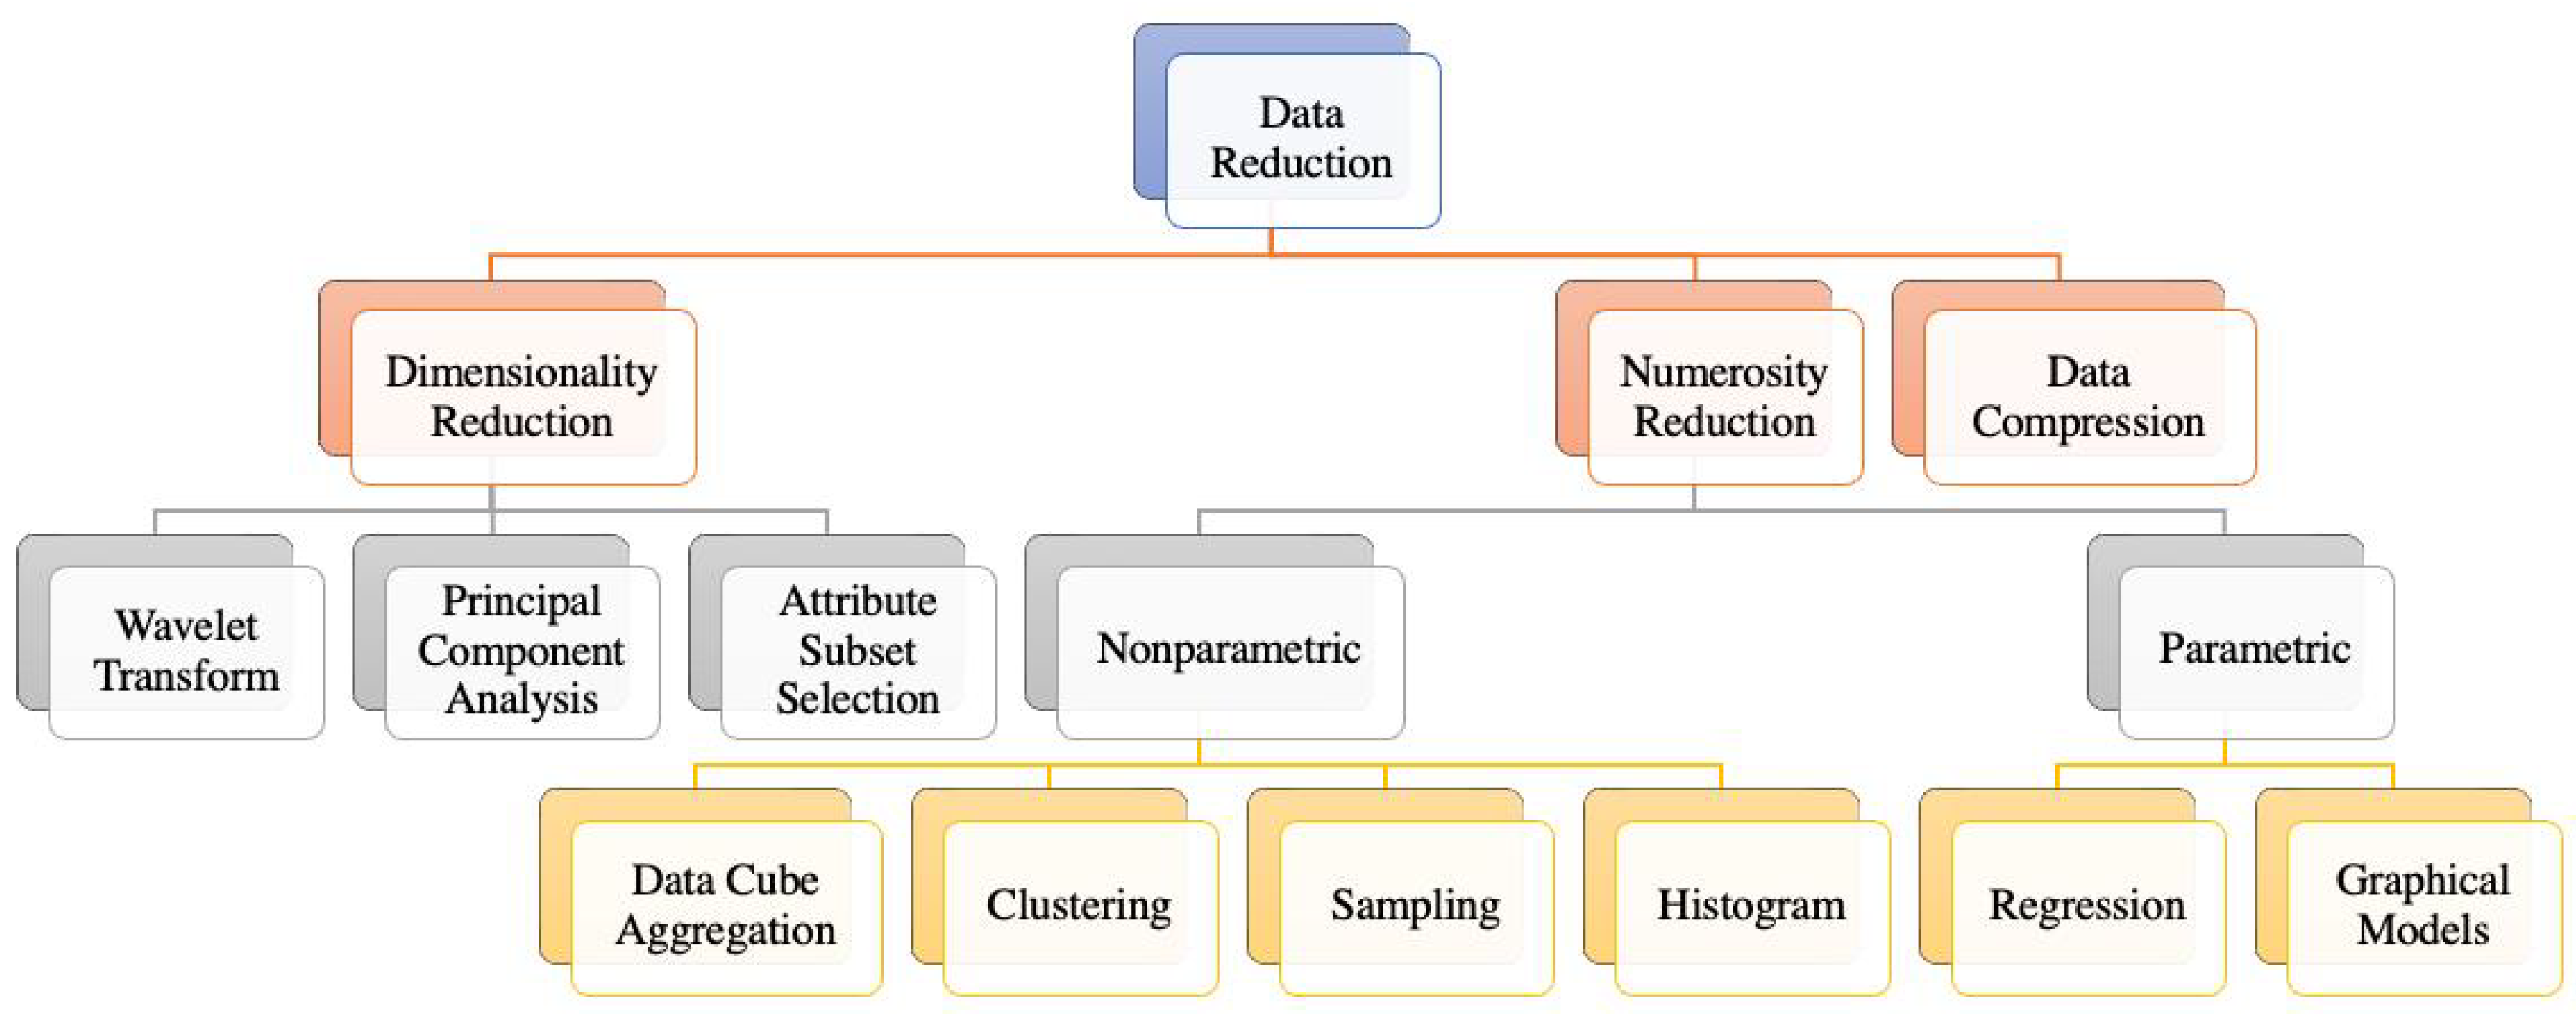
As shown in Figure 4, data reduction strategies mainly include three broad categories: dimensionality reduction, numerosity reduction, and data compression. Dimensionality reduction techniques reduce the number of attributes/features p under consideration. Some dimensionality reduction methods, such as Principal Components Analysis (PCA) and wavelet transform, aim to transform or project the original data onto a lower-dimensional space. Other methods such as attribute subset selection detect and remove non-informative, irrelevant, and redundant attributes from the full feature set. Numerosity reduction, on the other hand, reduces the number of data points n in the original dataset. Numerosity reduction can be classified as either parametric or nonparametric. For parametric methods, the data is represented by a parametric model which consists of model form and model parameters. After the modeling process, only the model parameters are stored instead of the actual dataset, thus reducing the size of the data. Some examples of parametric data reduction methods include regression models, log-linear models, and graphical models. For nonparametric methods, the data reduction process does not assume a specific parametric model for the data. Therefore, nonparametric methods are overall more flexible yet more challenging. Some typical examples of nonparametric data reduction methods include histogram, clustering, sampling, and data cube aggregation. Data compression is the third category of methods which first transforms the original data into a compressed representation, then reconstructs the data in a later recovery process. Data compression belongs to either lossless or lossy, depending on whether the original data can be reconstructed from the compressed representation without any information loss. In general, the computational time of a data reduction process should not outweigh the amount of time saved by analyzing the reduced dataset.
A summary of representative papers in data reduction is given in Table 2. In most cases, data reduction is a step before data-driven simulation for estimating aviation environmental impacts, on either the aircraft-level or the fleet-level. The data-driven simulation relies on aircraft flight data to ensure that the simulation result can closely reflect real-world operations. Nevertheless, conducting computation and evaluation for a massive amount of operations and models can be infeasible. Therefore, data reduction is necessary to extract a small amount of representative data and models for efficient yet accurate analysis. Overall, there have been three primary usages of data reduction in aviation environmental impact analysis: representative data, representative models, and representative operations. Representative data refers to a small subset of data points which can closely maintain certain characteristics of the population. For example, in probabilistic analysis and many common scenarios, the small subset should retain the same data distribution as the complete dataset. Reference [38] proposes a distributional data reduction method PREM which outperforms random sampling at very small sample sizes. PREM enables efficient simulation-based uncertainty propagation in the uncertainty quantification of aircraft fuel burn and emissions in real-world operations. Representative models involve both numerosity reduction and dimensionality reduction. The need for numerosity reduction is due to the fact that there exists a substantial amount of aircraft types to model, where each aircraft type is a unique combination of airframe and engine. Because building aircraft noise and performance (ANP) model for each aircraft type takes a long and rigorous process, Reference [39] selects a small proportion of representative aircraft models that can sufficiently cover the richness and complexity in the population for detailed modeling. References [40,41] select representative aircraft types for efficient fleet-level noise contour and emissions computation. On dimensionality reduction, Reference [42] conducts a feature selection study to find a reduced set of aircraft features which are most influential to different environmental impact metrics. Representative operations refer to the flight procedures, trajectories, or profiles that can be utilized to model aircraft fuel burn, emissions, and noise. References [40,43,44,45] apply clustering on large datasets to group flight trajectories and extract the most representative trajectories. Some works, such as [43,44], take a step forward to convert the representative flight profiles into parameterized forms. Reference [46] also applies probabilistic modeling on the representative mission profiles and account for uncertainty in the process. These representative information from real-world operations have made aviation environmental impact modeling closer to the reality in an efficient manner.

3.2. Efficient Computation

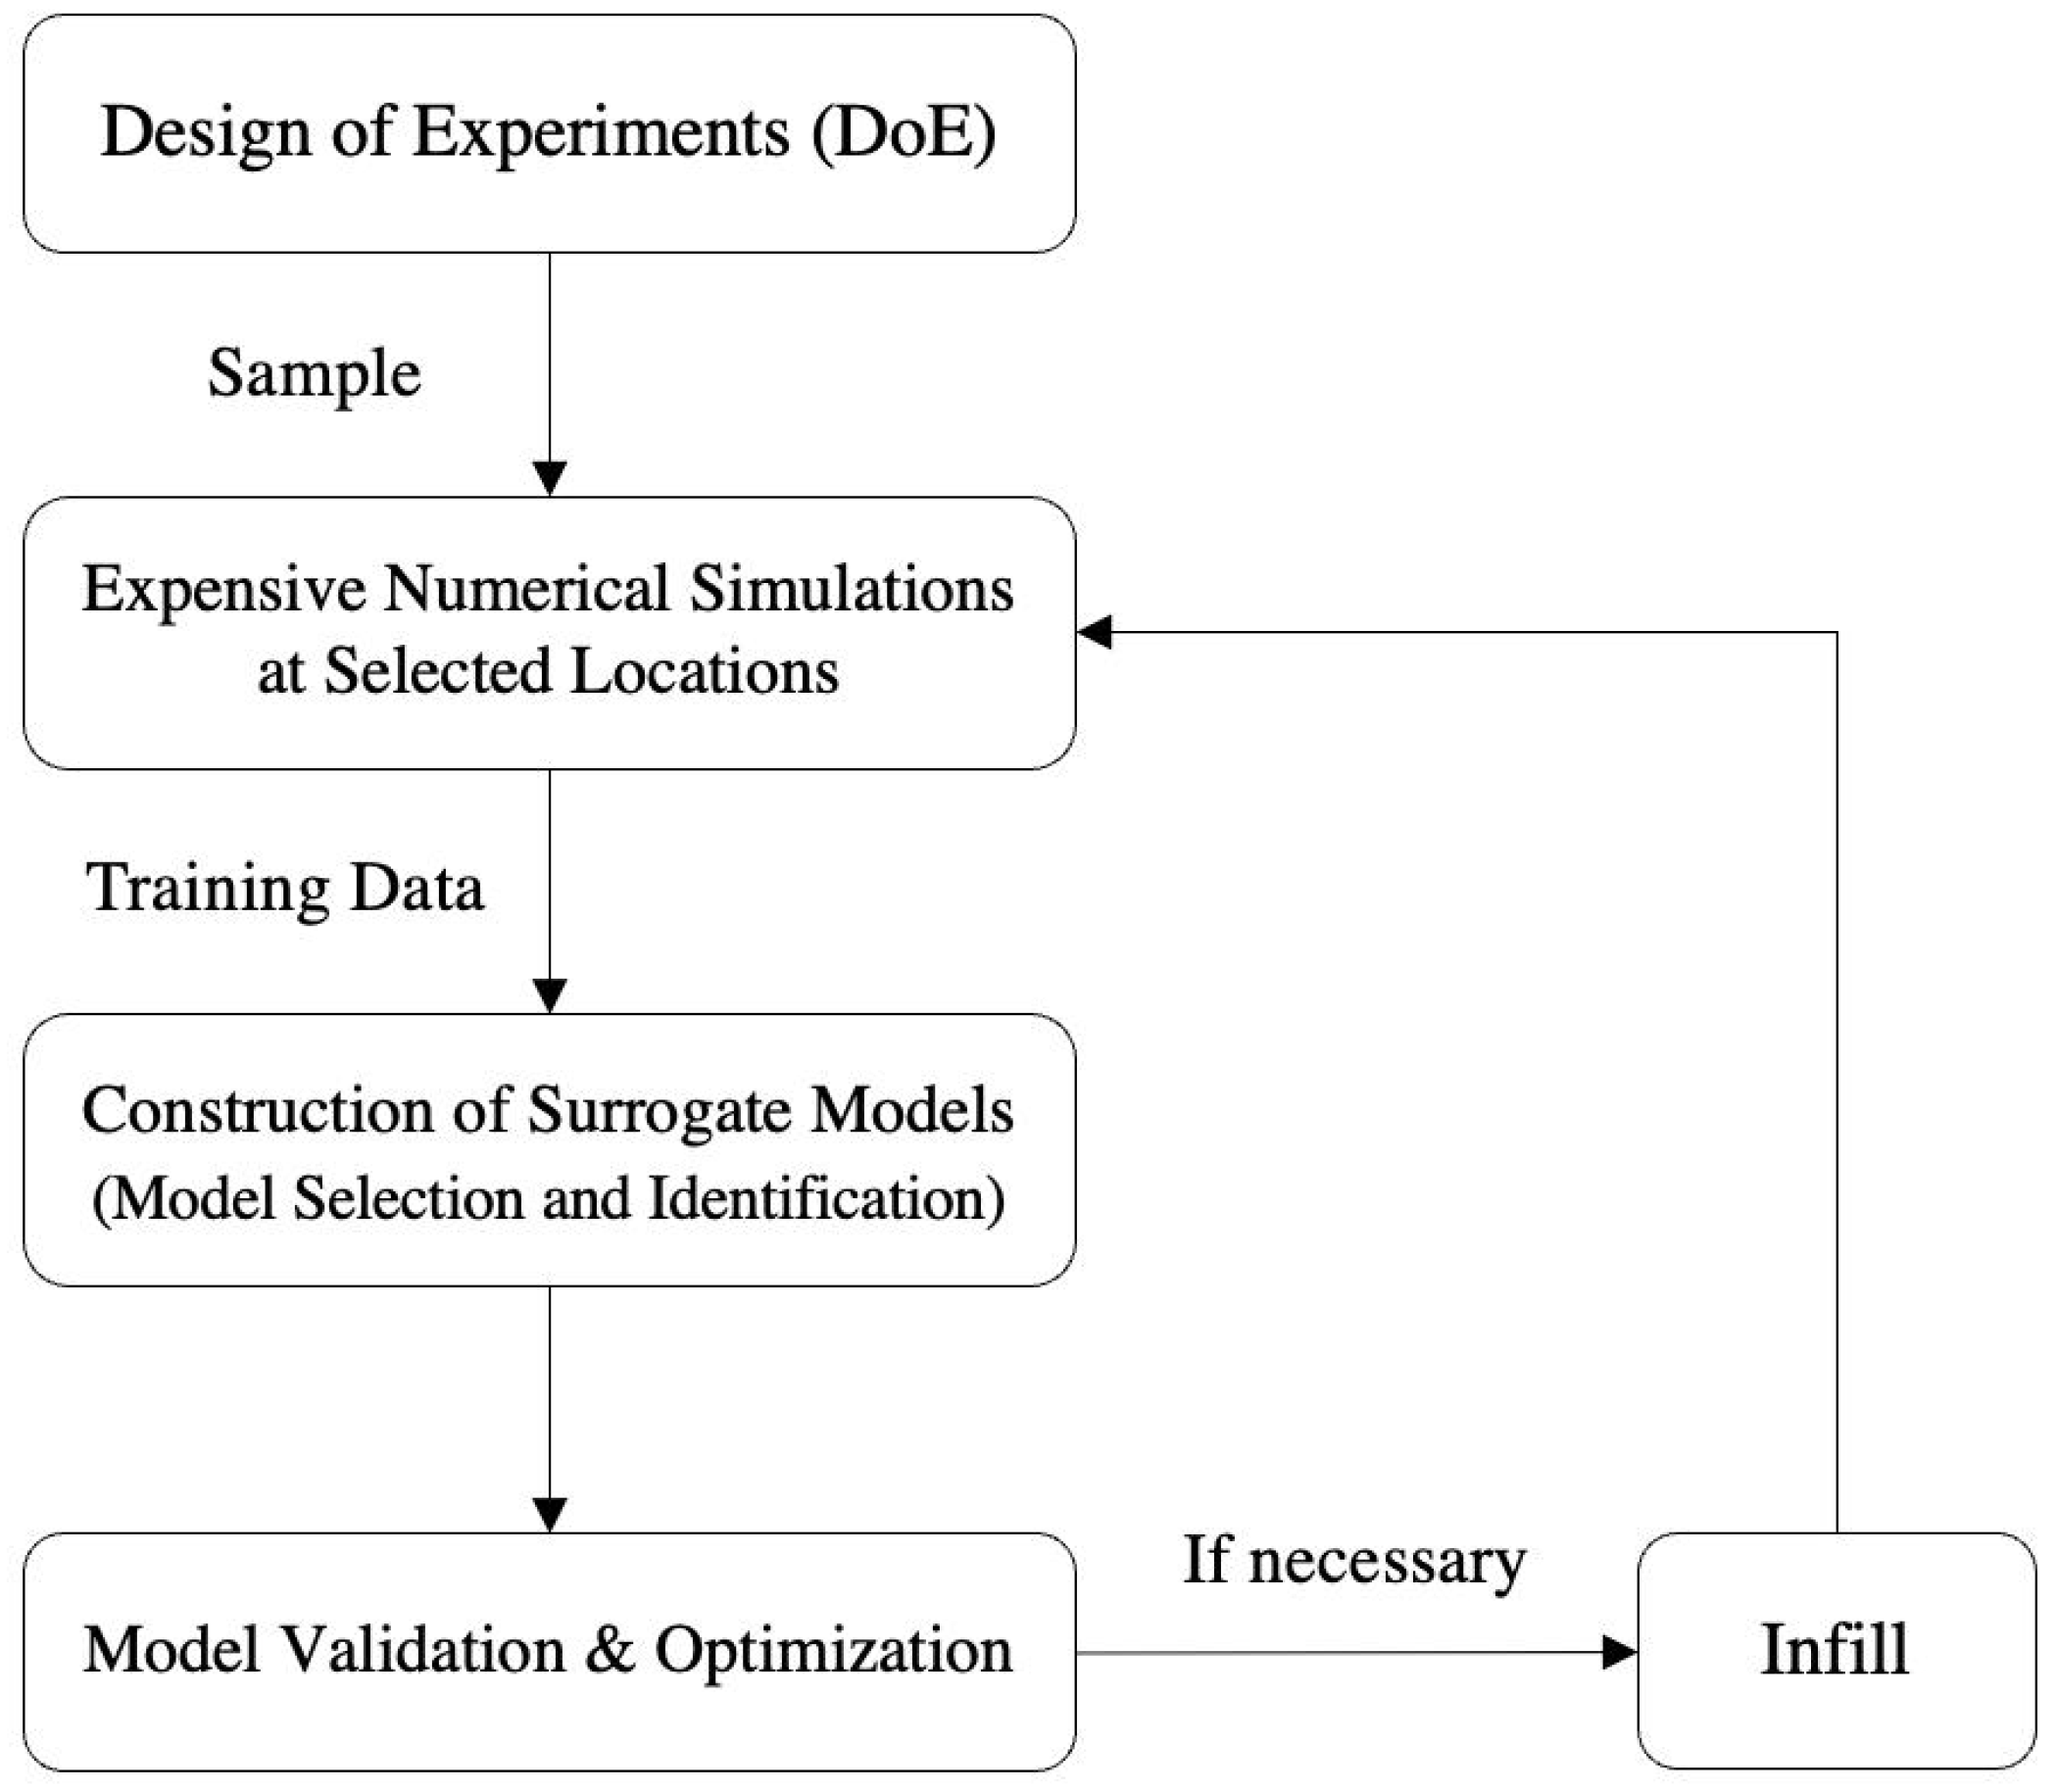
Since computer simulation/experiment became an indispensable part in contemporary engineering design optimization and systems analysis problems, computational efficiency has been a major concern in such processes due to two main reasons. First, high-fidelity simulation and analysis models are typically computationally expensive and time consuming. One common approach to tackle this challenge is the Surrogate-Based Analysis and Optimization (SBAO) [48] approach depicted in Figure 5 which relies on surrogate models to provide fast approximations of the sophisticated high-fidelity models. Second, the design optimization of a complex system inevitably involves the exploration of a broad design space. This usually translates to a large number of candidate design points and simulation runs, depending on the actual size of the design space and the number of design parameters. Some statistical and data-driven approaches can further reduce the number of simulation runs to improve the efficiency. Overall, these two facts can lead to excessive computational costs and prohibitive run times in engineering design and analysis process. Two typical examples of the computationally expensive simulations in the design and analysis of aerospace systems are Computational Fluid Dynamics (CFD) and multidisciplinary vehicle modeling.
Aviation environmental impact analysis can also be computationally expensive, because performing high-fidelity fuel burn, emissions, and noise analyses for a air transportation system is a massive task. Take aircraft noise modeling as an example, depending on factors such as the number of aircraft operations, the size of the region, the length of the time interval, and the fidelity level of the models, the current state-of-the-art noise modeling capabilities could require long setup and computational times for a single case study. A previous study [49] reported that running the high-fidelity Integrated Noise Model (INM) to perform airport-level noise study for a four-parallel-runway airport in crossflow takes between two days to two weeks to finish. Another example is the Aviation Environmental Design Tool (AEDT), a software system that models aircraft performance in space and time to estimate noise, fuel consumption, emissions, and air quality consequences [50]. A study [51] reported that on the AEDT, a national-level noise study comprising a moderate number of airports and flights could take several days to complete.
A summary of representative papers in efficient computation is given in Table 3. These representative works involving efficient computation can be classified into three generic groups. The first group employs surrogate models or reduced-order models (ROMs) to reduce the computational complexity of the complicated models and therefore reducing the computational time. In some literature, this is also referred to as “meta modeling”. The authors of [52] construct a response surface model to approximate the computationally expensive Community Multiscale Air Quality (CMAQ) modeling system for fast evaluations of aviation’s impacts on air quality. The authors of [51] apply ROM on AEDT’s noise model to develop a rapid noise prediction capability. The second group builds rapid integrated analysis capabilities for fleet-level aviation environmental impact modeling. Such rapid fleet-level analysis capabilities could consist of elements such as simplified models, generic aircraft and operations (with connections to data reduction), and some pre-computed outcomes. The authors of [49] develop the airport noise grid integration method (ANGIM) which uses simplified methods and offline computational results for generic aircraft operations to enable rapid fleet-level noise modeling. The authors of [53] propose the GENERICA method which leverages methods such as classification algorithms, designs of experiments, surrogate models, and multi-criteria decision-making to identify better baseline models than the traditional representative-in-class vehicles, also called “average generic vehicles”, for more realistic approximation of fleet-level environmental impact results. The authors of [54] develop the Rapid Environmental impact on Airport Community Tradeoff (REACT) environment to conduct rapid tradeoff by modeling different noise mitigation strategies’ noise exposure on the airport community. The third group is hybrid data-driven approaches for efficient modeling. The authors of [55] use performance and acoustic data from flight and wind tunnel tests to develop an efficient analytical model for helicopter Blade–Vortex Interaction (BVI) noise during maneuvering flight. The authors of [56] combine physics-based model and aircraft performance data to build an efficient and accurate “data-enhanced surrogate model” for aircraft fuel consumption. The authors of [57] develop Fuel Estimation in Air Transportation (FEAT), a rapid analysis framework, by using a high fidelity flight profile simulator and a reduced order fuel burn model. These efficient models have contributed to the aviation environmental analysis tool-suite that enable rapid assessment and evaluation, which is crucial especially for preliminary analysis.

3.3. Predictive Modeling

With the ultimate objective of making accurate predictions, predictive modeling is one of the most typical tasks of machine learning. In contrast to the specific machine learning or data mining techniques which uncover patterns in data, predictive modeling encompasses the entire process of developing a mathematical model in a way that we can understand and quantify the model’s accuracy on predicting future, yet-to-be-seen data [
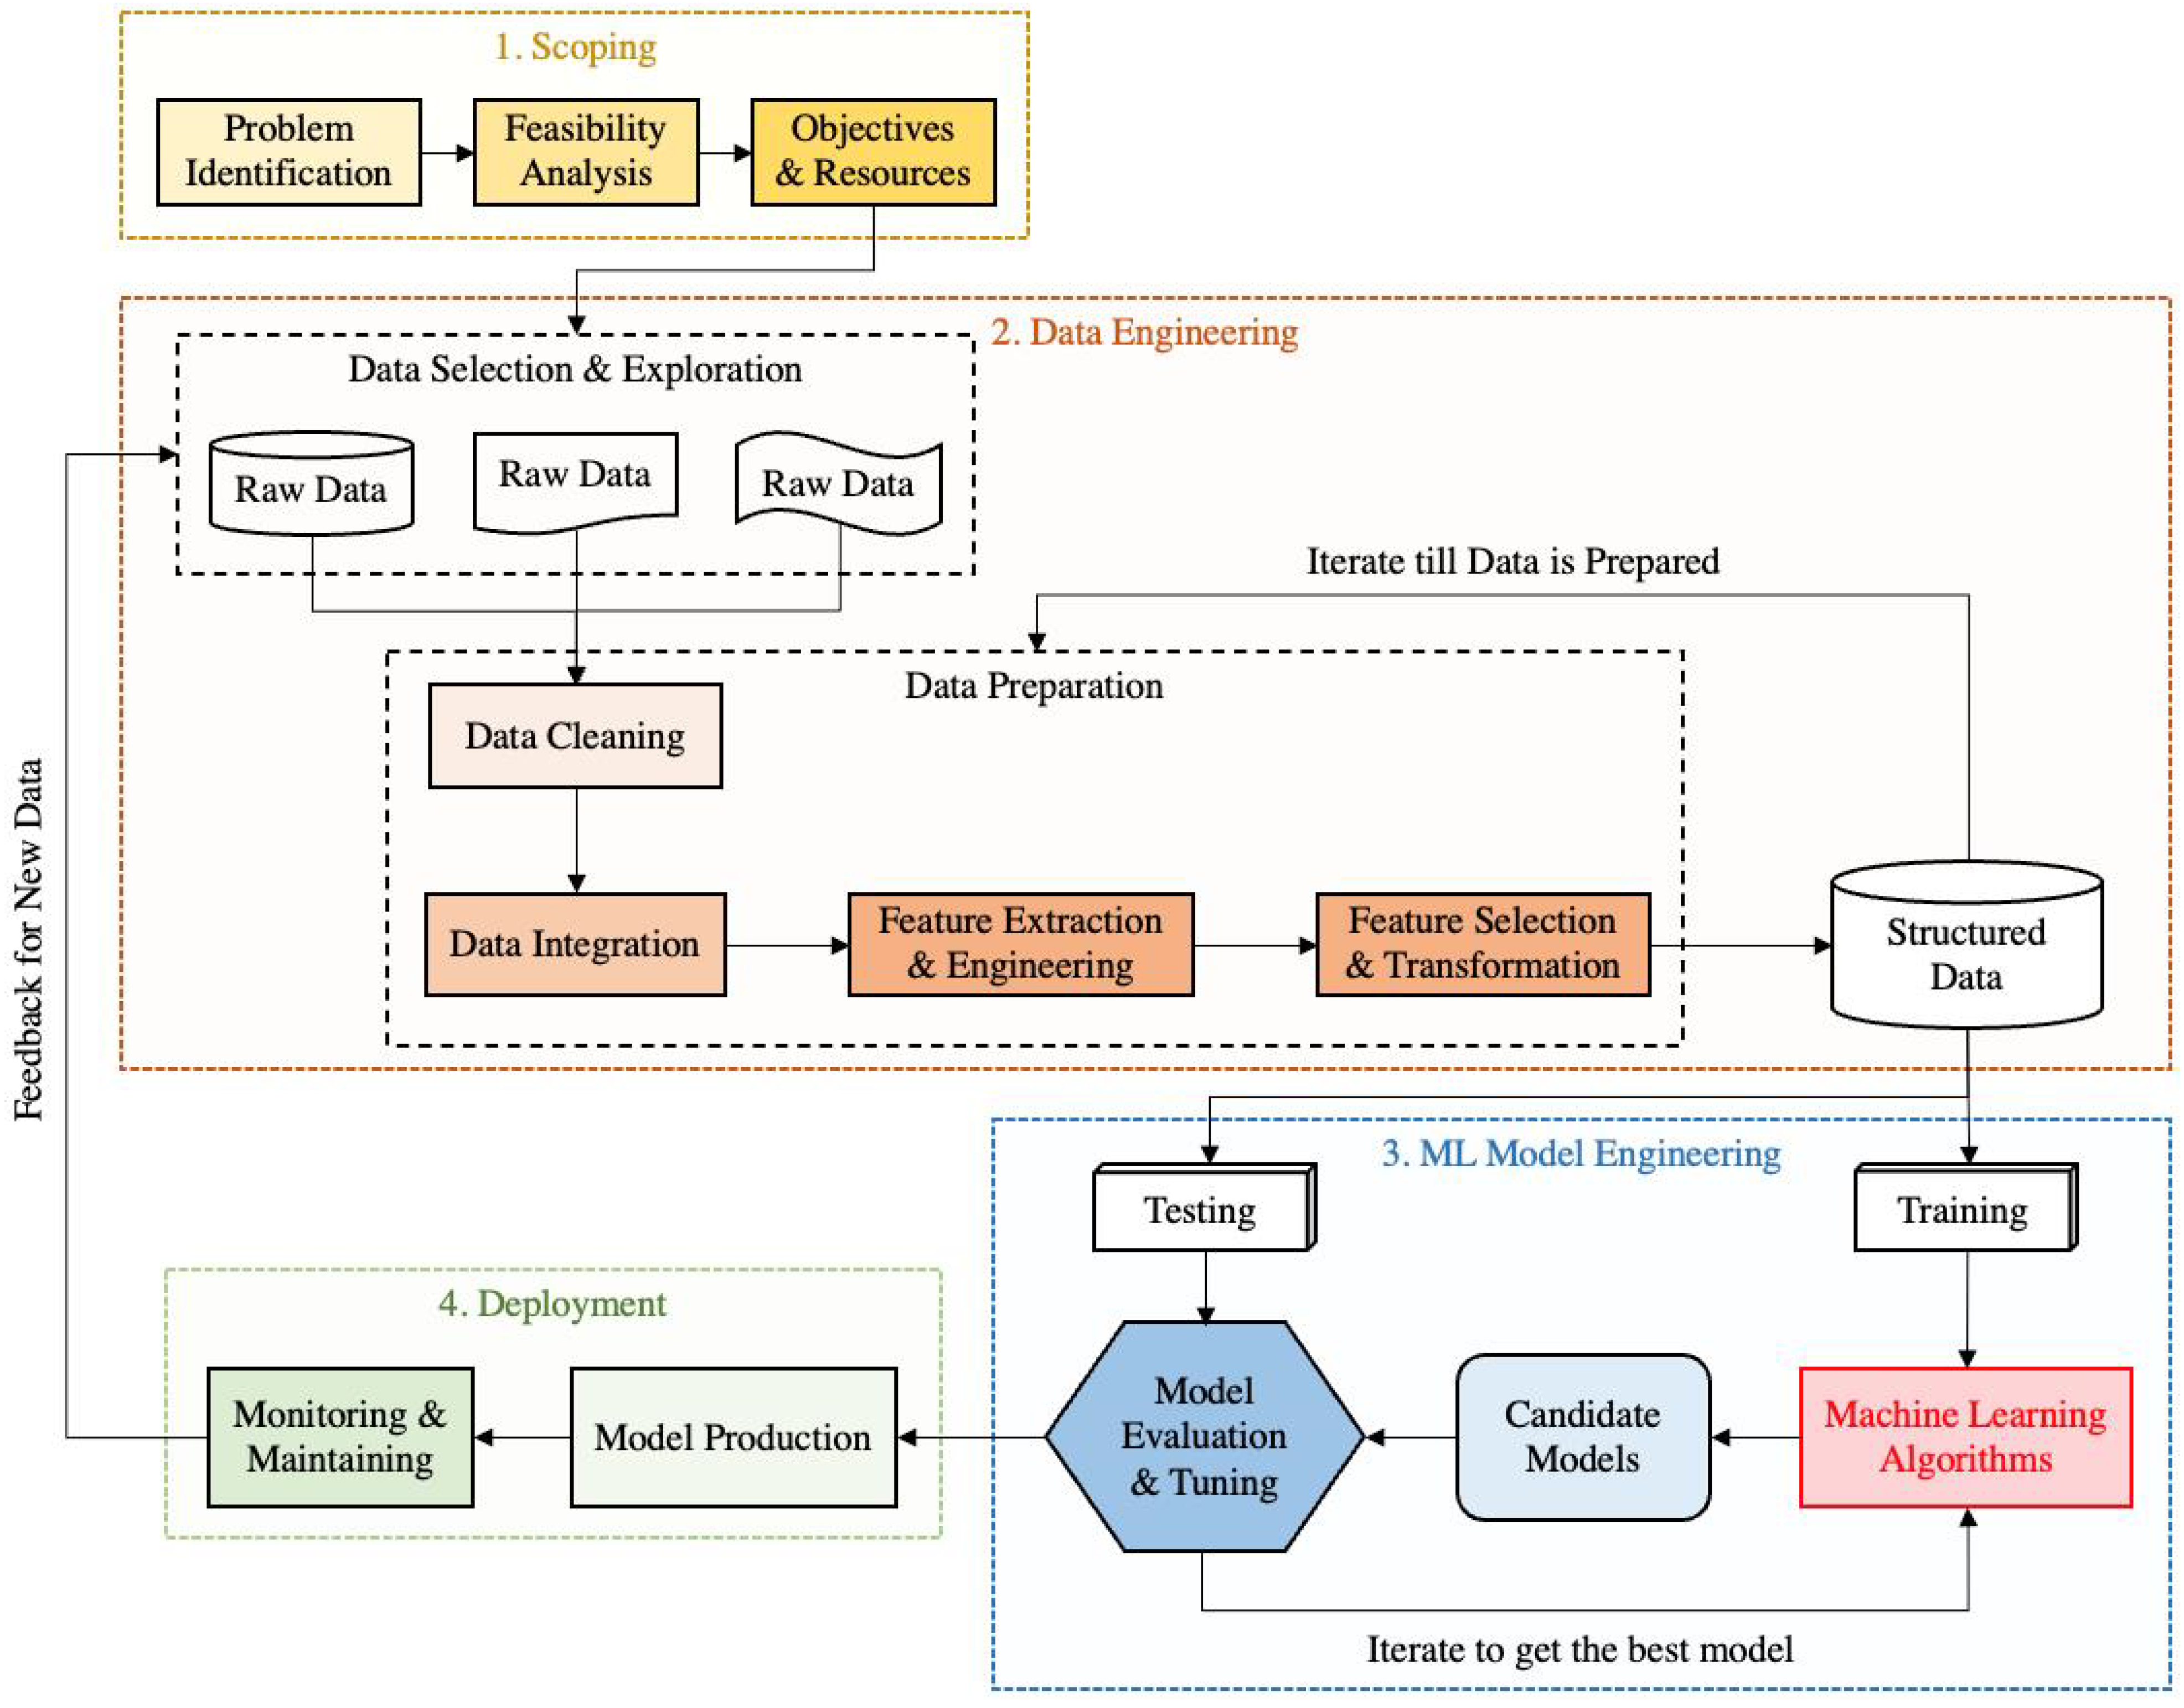
58]. Steps such as data pre-processing, model tuning, performance measurement, and model selection are of critical importance in the predictive modeling process. Therefore, to a certain degree, predictive modeling is highly similar to the machine learning engineering process depicted in Figure 3. Although the foremost objective of predictive modeling is to make accurate predictions, a secondary interest is to interpret the model and understand how it makes prediction. On certain problems, interpretation could be just as important, and this involves a tradeoff between accuracy and interpretation. Overall, a more accurate model is often associated with higher model complexity and lower interpretability. More discussions on the model interpretability can be found later in Section 4.
Predictive models mainly include regression models and classification models, which predict continuous and categorical responses, respectively. Under each category, depending on whether a model is based on linear combinations of the predictors, different models can be further divided into linear models and nonlinear models. Although different models differ by the model form, number of parameters, and overall complexity, no predictive model is universally superior in every problem. Practitioners are encouraged to explore a diverse set of models for any given problem and identify the best predictive model [58]. A key foundation to the success of predictive modeling is the practitioner’s domain knowledge and deep understanding of the problem. When predictive signal exists in a dataset, even a naive model can capture some degree of predictive power. The domain knowledge applied to the modeling process is what distinguishes a great model from good models. In a serious decision making process, neither data-driven predictive model nor expert intuition will do better than a combination of both.
A summary of representative papers in predictive modeling is given in Table 4. Most of these representative papers were published after year 2018. Although classification models can find applications in many data-driven analysis tasks in aerospace and transportation domains (e.g., flight risk identification), the predictive models for aviation environmental impact analysis are mostly regression models. Some recent works have started to adopt advanced model architectures on more complex data forms to predict aircraft fuel burn, emissions, and noise. Among some of the earlier works, Reference [59] uses Gaussian Process Regression (GPR) and Probabilistic Graphical Model (PGM) to develop a wind forecasting model, which informs improved flight route planning to reduce environmental impact of aviation. Some advanced set-ups in statistics and machine learning are used to more accurately estimate aircraft fuel consumption. In a series works to improve aircraft fuel efficiency, Reference [60] first applies ensemble learning to improve the prediction of discretionary fuel and construct uncertainty intervals for the predictions. After that, Reference [61] utilizes quantile regression to estimate the Statistical Contingency Fuel (SCF) from a large fuel burn dataset from airline. The rest of the papers adopt different types of deep learning models. To minimize transport aircraft emissions and save fuel, Reference [62] applies neural network whose topology is optimized by genetic algorithm on flight data to predict fuel consumption. The authors of [63] use a type of feedforward neural network called covariance bidirectional extreme learning machine (CovB-ELM) to predict aircraft trajectory and the associated fuel consumption. There is also a significant trend which employs Recurrent Neural Network (RNN) to model sequences of data. The authors of [64] apply Long Short Term Memory (LSTM) neural network on Flight Data Monitoring (FDM) data records to estimate aircraft on-board parameters such as the fuel flow rate for enhancing the system’s efficiency. The authors of [65] apply sequence-to-sequence LSTM on large radar and noise datasets to predict ground level aviation noise and evaluates the model using real-world noise measurements. The authors of [66] use a combination of LSTM and extreme gradient boosting (XGBoost) to predict short-term flight emissions within enroute airspace. The last two papers apply the more advanced physics-informed learning approaches which combine data-driven model with physical model to predict specific problems more effectively. The authors of [67] use physics-guided deep learning to model aircraft fuel burn. To outperform both the traditional physics-based models and the common supervised learning approaches, the authors: (1) guide the neural network with fuel flow dynamics equations, and (2) embed physical knowledge as extra losses in the model training process. The authors of [68] use physics-guided neural networks to predict propeller tonal noise with less experimental data, which can be difficult to collect. In some other works, even applying methods like ordinal regression and neural network can achieve satisfactory results on certain problems. Yet the more advanced more architectures and considerations have opened the door for a wider variety of problems.

3.4. Uncertainty Quantification

Uncertainties related to imprecise assumptions, natural variability, and the presence of unknowns is not only an unavoidable part of the real-world, but also a significant factor that could determine the success or failure of a decision or system. At the intersection of mathematics, statistics, and engineering, Uncertainty Quantification (UQ) is an interdisciplinary field that addresses the problems associated with incorporating real-world variability and probabilistic behavior into the design and analysis of complex systems. UQ provides uncertainty information about the Quantities of Interest (QoI) through characterizing, propagating, and managing uncertainties in a computational or real-world system. The high degree of complexity and uncertainty associated with aviation environmental impact analysis have driven practitioners towards the use of UQ in the modeling process.
Different sources of uncertainty can be generally categorized as either epistemic uncertainty or aleatory uncertainty. The former is caused by a lack of knowledge and is possible to be reduced by collecting more information. Aleatory uncertainty, on the other hand, results from the intrinsic randomness of nature. Therefore, it is beyond people’s ability to reduce aleatory uncertainty through gathering additional information. Some previous research efforts [69,70] explore how to deal with both types of uncertainties. Common sources of uncertainty can be classified into four categories:
  • Inputs uncertainty: The inputs of a model/system may have inherent uncertainty and substantial variation around a deterministic value.
  • Model uncertainty: All models are “wrong” because they inevitably include assumptions, approximations, and errors and are therefore not exact representations of reality. Two aspects of uncertainties related to model are model-form uncertainty and uncertainty about parameters within the model.
  • Computational and numerical uncertainty: Normally numerical errors from running simulations or solving mathematical models, including simplified equations, convergence error, truncation, etc.
  • Physical testing uncertainty: A result of uncontrolled or unknown inputs, measurement errors, and limitations in the design and implementation of tests.
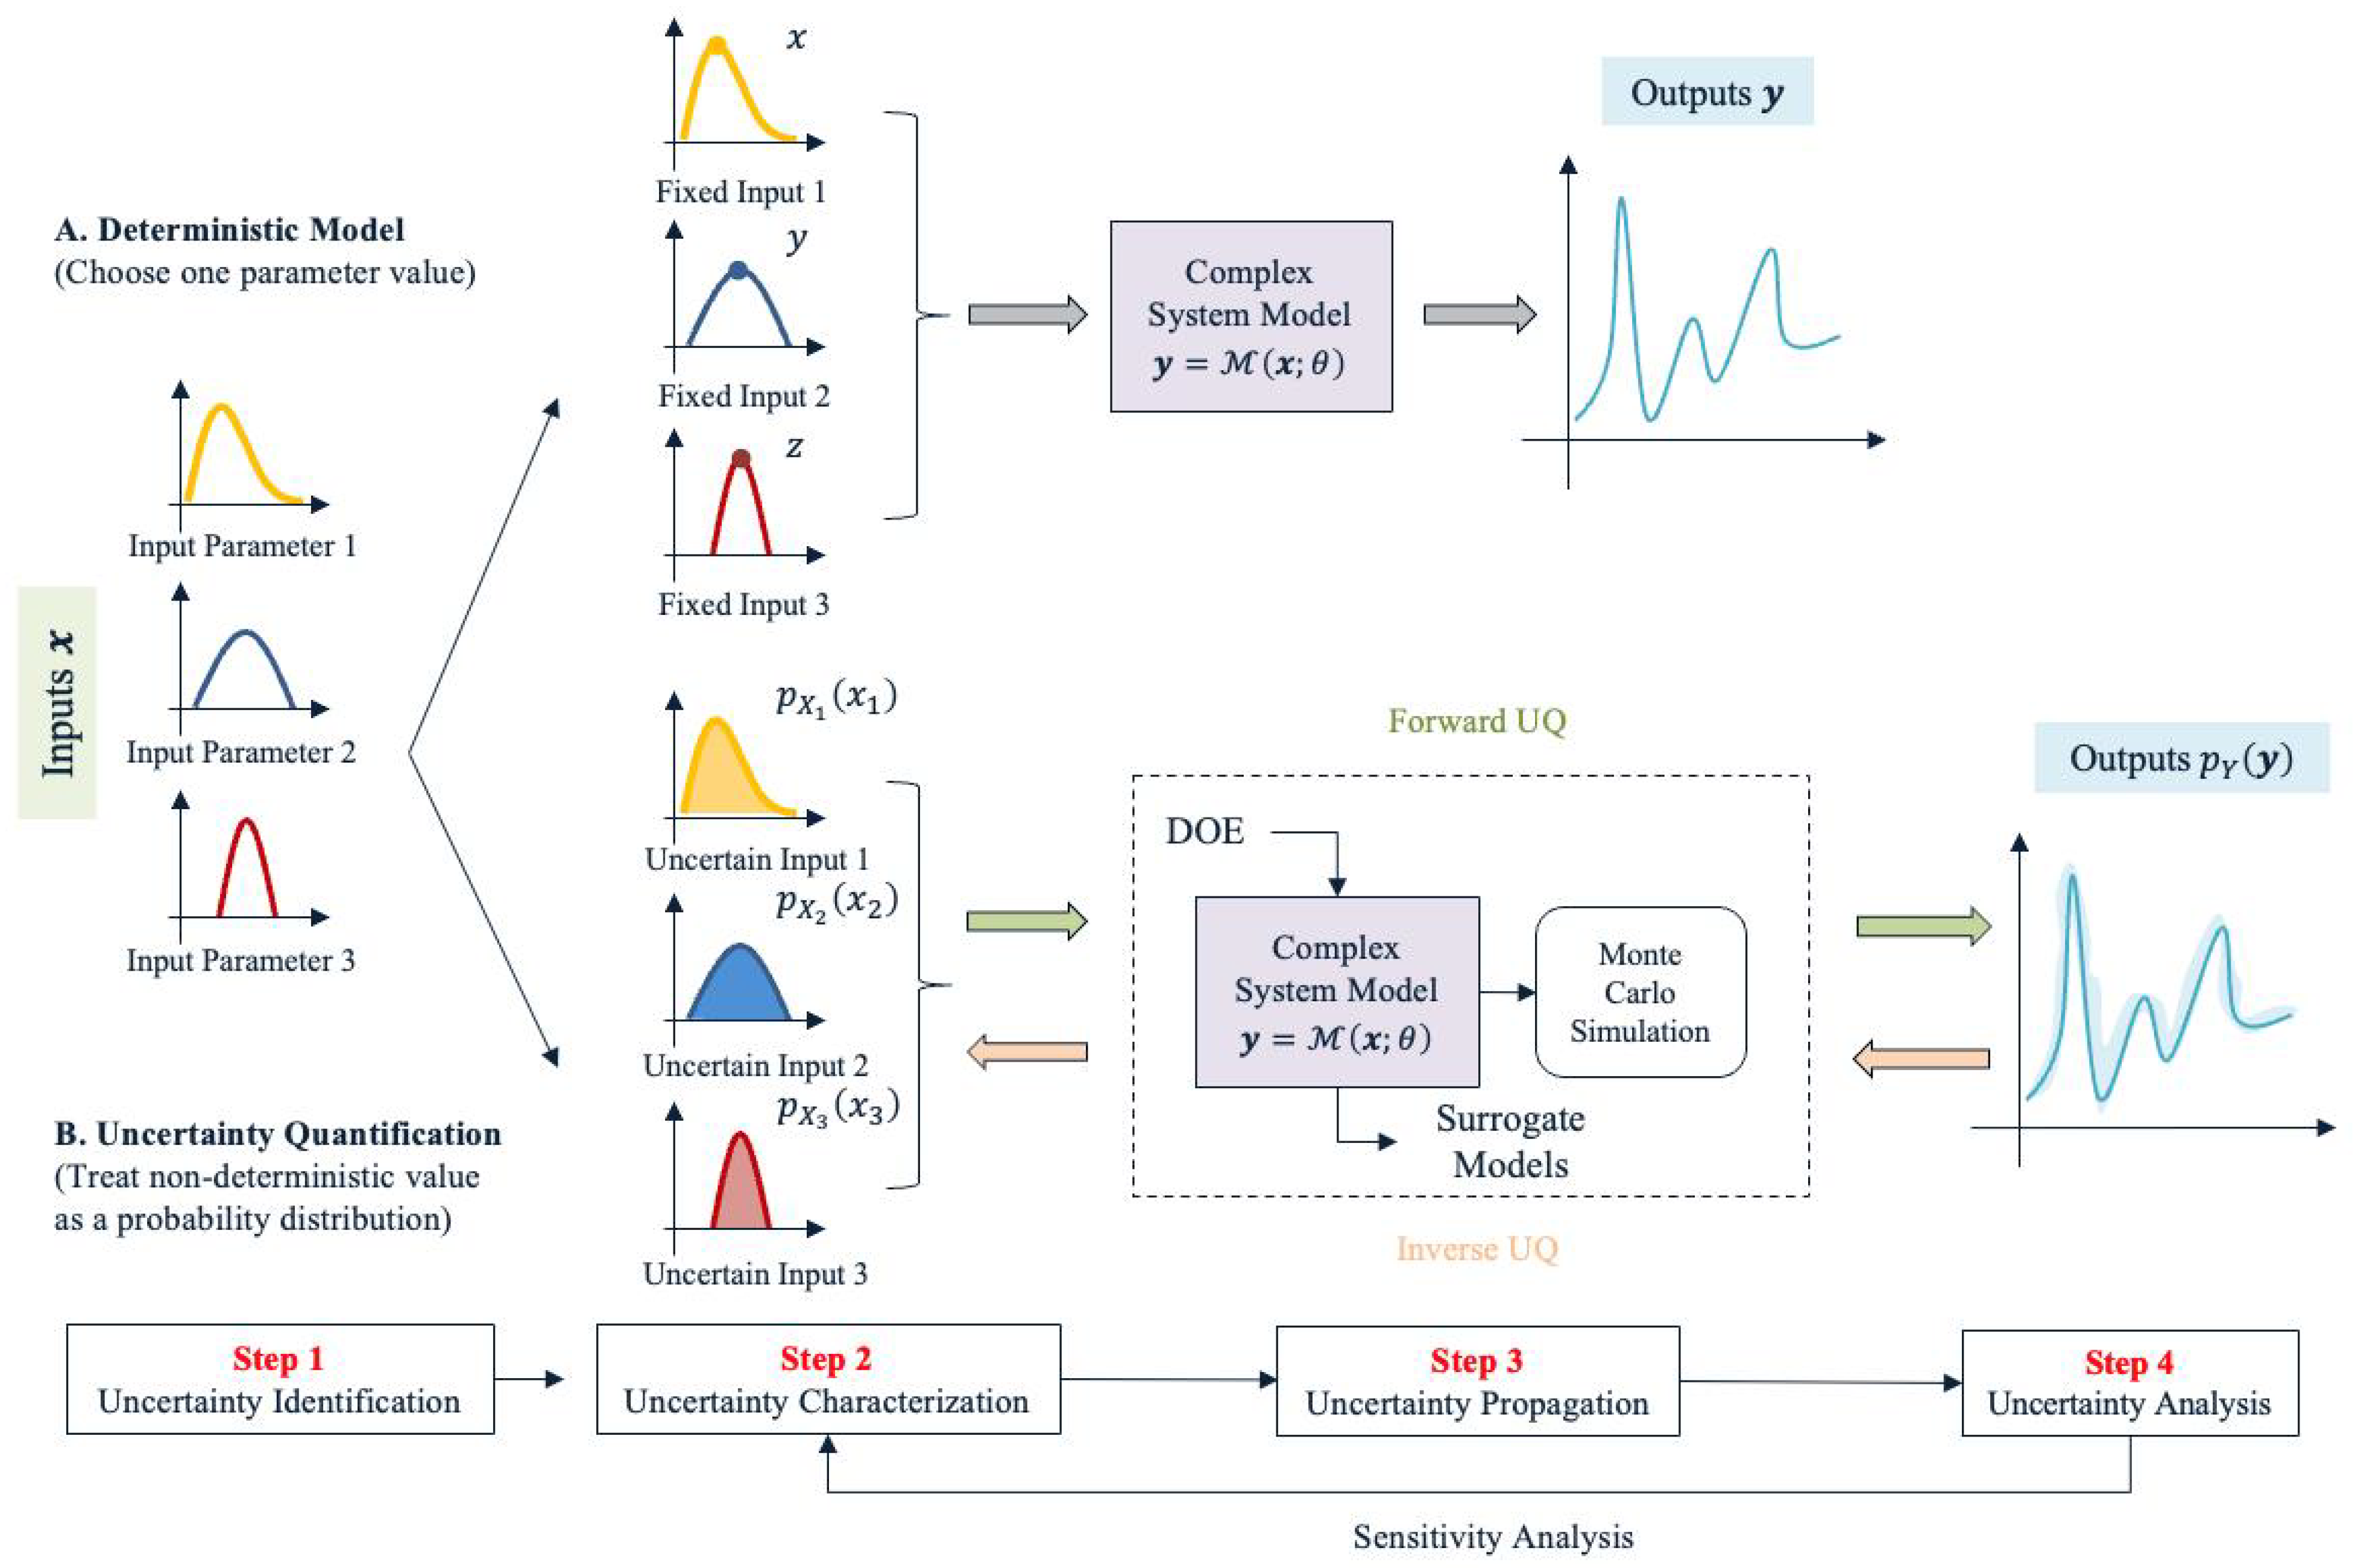
A standard uncertainty quantification step consists of four main steps: uncertainty identification, uncertainty characterization, uncertainty propagation, and uncertainty analysis. Figure 6 displays a standard UQ process and compares it with the traditional deterministic modeling procedure. As a starting point, uncertainty identification refers to a step of identifying potential uncertain sources in a simulation or analysis process. The subsequent uncertainty characterization is a step to mathematically represent all the uncertain sources. In uncertainty propagation, uncertainties in all levels of the model/system are mathematically mapped to the uncertainties in the outputs [71]. When the sophisticated system analysis code is computationally expensive, surrogate models can be used to reduce the complexity of the original model while retaining the physics-based relationships between the inputs and outputs. The uncertainty propagation process in Figure 6 is simulation-based, in which Monte Carlo Simulation (MCS) is utilized. The last step, uncertainty analysis, involves using statistical analysis and visualization to study the uncertainties inherent in the system’s outputs for making better decisions.
In aviation environmental impact analysis, UQ is generally used to: (1) understand the uncertainties inherent in a complex model or software systems, (2) predict system responses across uncertain inputs and quantify confidence intervals, (3) understand the key contributors to model output variations, and (4) inform researchers of directions for future model development and enhancement. A summary of representative papers in uncertainty quantification is given in Table 5. Several works in Table 5, such as [72], encompass surrogate modeling in their UQ approach as well, because it is common to use simulation-based methods, such as MCS, for uncertainty propagation. This process learns the distributions of the nondeterministic outputs through a large number of experiment runs on the sophisticated analysis code and is impractical without surrogate model. Hence, surrogate model is a vital enabler to efficient UQ and design optimization. Some earlier works perform a complete UQ process on a complex aviation environmental model. Both [73,74] conduct a UQ study on AEDT to better understand the uncertainties in AEDT estimations and identify priority aspects for future research and development. Also based on AEDT, Reference [75] conducts a sensitivity analysis for fleet-level environmental impacts to changes in operational uncertain factors for the optimization of flight operations to mitigate aviation environmental impacts. The authors of [76] perform rapid computation and UQ on the global fleet-wide simulation of aviation emissions for rapid and robust policy analysis. On the data-driven approach, Reference [77] uses Gaussian Process Regression (GPR) to quantify uncertainty in a data-driven 4D flight trajectory prediction problem and gain insights on uncertainty reduction—an important objective of UQ. Some works focus on novel UQ methodologies and make contributions in methodology development. Inspired by multidisciplinary analysis and optimization, Reference [78] proposes a decomposition-based approach to quantify uncertainty in multi-component systems and applies the method to perform uncertainty analysis and sensitivity analysis for the environmental impacts of new aircraft technologies and operations. When only limited data is available for UQ, Reference [79] develops a nonparametric approach to characterize and propagate uncertainty, which is more flexible and does not introduce unwarranted assumptions into the process. Some latest works initiate the trend of performing UQ on the environmental impact of future aircraft configurations. The authors of [80] perform UQ on the noise of a Hybrid Wing–Body (HWB) aircraft configuration at the noise certification locations. The authors of [81] perform system noise assessment and UQ for a conceptual supersonic aircraft and identifies factors that could significantly affect the concept’s Landing and Takeoff noise (LTO) noise. Since robustness is a key consideration in the design and analysis of complex aerospace systems, UQ will continue to play a substantial role in the design and analyze of sustainable aviation system.

3.5. Pattern Discovery

Pattern discovery (or knowledge discovery) is a term commonly seen in data mining. A pattern generally refers to some useful information in the data that can guide action or decision-making. Some simple patterns include total, ratio, correlation, variation, etc. Examples of the (slightly) more complex patterns include emerging trend, receding signal, alternating behaviour, and spatiotemporal variation. Statistical and machine learning methods provide techniques to discover patterns from data. The following types of non-chaotic patterns can be found in data:
  • Descriptive patterns: The identification of these patterns usually do not involve advanced algorithms. They are obtained through descriptive statistics or sometimes the direct results of data collection.
  • Associative patterns: These patterns are mainly about co-occurring phenomena. A typical statement of associative pattern is: “If A happens, then B is also likely to happen”.
  • Periodic patterns: These patterns repeat themselves with a specific period, which can be found in time series data, sequence data, and spatiotemporal data.
  • Structural patterns: These patterns are extracted summary information represented in terms of a structure that can be reasoned about. There are different structural forms such as graphs, trees, sets, clusters, etc.
  • Abnormal patterns: A substantial divergence from normal behaviour is considered abnormal. These abnormalities could be signals of risk or opportunities for novel discoveries.
In aviation environmental impact analysis, the discovered patterns on aircraft fuel burn, emissions, and noise can provide insights for aviation and environmental analysts to make decisions and plans for mitigating aviation’s environmental impact and achieving sustainable air traffic growth. Some patterns can be directly discovered by analyzing existing datasets on aviation environmental impact. Most of the time, however, the dataset for a target study is not available. For example, if a researcher wants to obtain the quantity and distribution of a certain emission type over a continent, it would be impractical to obtain such measurements via sensors and instruments. In such cases, data-driven flight simulation become a key enabler for computation and pattern discovery. Data-driven flight simulation utilizes real-world flight operations data, such as ADS-B, and “flies” the aircraft in an computational environment. The aircraft furn burn, emissions, and noise are computed using aircraft performance models, such as Base of Aircraft Data (BADA), and noise models. Since the real-world flight data reflects how aircraft operate in time and space, with reliable performance and noise models it is possible to obtain decent approximations of the real-world situations. The estimations resulting from data-driven flight simulations are then ready to be analyzed by statistical and machine learning methods to discover useful patterns.
A summary of representative papers in pattern discovery is given in Table 6. Many selected papers under this theme also encompass elements from efficient computation and predictive modeling. One thing the papers in Table 6 have in common is a strong emphasis on the actual findings of the study. Data-driven flight simulation is widely applied in pattern discovery for aviation environmental impact. In one of the pioneering works, Reference [82] develops an aviation emission inventory and discovers the disparity of CO 2 concentration in different parts of Australia. The authors of [83] use flight track data and fast noise approximation model to observe the variability in noise patterns on evolving airport runway configuration at Boston Logan International Airport (KBOS). The authors of [84] use ADS-B data and OpenAP emission models to obtain cruise-level flight emissions for different airlines, geographic regions, altitudes, and timeframe. The authors of [85] employ ADS-B and flight performance model to study aviation emissions at altitude and finds out that NO x and water vapour emissions concentrate around tropospheric altitudes only for long-range flights. The authors of [86] use similar approach to analyze fuel burn and emissions for a network of short-haul commuter flights in Europe. Through analyzing fuel burn and emissions as function of distance, altitude, city pair, the conclusion is that flight range is the most significant discriminator in emissions. The authors of [87,88] extend such simulations to global-scale. Together with a clustering step, Reference [87] studies the transport patterns and climate impacts of aviation-emitted NO x and highlights the spatially and temporally heterogeneous nature of the NO x –O 3 chemistry in different regions and seasons around the globe. The authors of [88] estimate global emissions from aircraft operations between 2017–2020 and quantifies the impact from COVID-19. Deep learning is a powerful tool in finding aircraft emissions patterns in a more complex setting. The authors of [89] apply Convolutional Neural Network (CNN) on satellite images to detect aircraft contrails—a contributor of climate warming effect. The project estimates that contrails cover an average of 0.55% of the contiguous U.S. and discovers detailed patterns of contrail coverage. The above findings are key information for people to understand the status and patterns of regional and global aviation environmental impact. With continued advancements in data quantity, aircraft performance models, and analytical techniques, such data-driven approaches can make even better contributions to sustainable aviation.

3.6. Verification and Validation

Verification and validation (V&V) are evaluation procedures throughout the development phase to assess whether a system, product, or process meets the requirements and specifications that are initially set in the proposal. V&V are an integral part of the systems engineering processes to ensure the success of a project. Sometimes such procedures need to be executed by a disinterested third party and are referred to as Independent Verification and validation (IV&V). Verification is the procedure of comparing the solution to the requirements. Verification uses examination, demonstration, analysis, and testing to answer the query “are you building it correctly?”. A verification procedure takes as input a system/product/process A and the requirements Q, and returns whether A is satisfactory (all behaviors of A meet Q) or unsatisfactory (at least one behavior of A violates Q). Data-driven verification is a novel research area that combines numerical simulation with sensitivity analysis to provide bounds on how much the states of a system/product/process can change in a non-deterministic setting [90]. In contrast, validation is the procedure of checking whether a system/product/process meets the needs of the user and other stakeholders. Validation involves review, demonstration, and testing to answer the query “are you building the correct thing?”. Validation is of vital importance because the cost of fixing a user requirement error is very higher—usually much higher than fixing an implementation error.
V&V has become an essential part in the development of a complex model or software, especially for a field that is safety-critical in nature. Because of the complexities in modeling the environmental impact of aircraft and air transportation system, relevant computational tools are complex and multi-module systems as well. The computational models for aviation environmental impact could leverage data processing, flight simulation, aircraft performance models, emissions models, noise models, large aircraft databases, Geographic Information System (GIS), and extensive system databases cover airports, airspace, and fleet information for accurate modeling. Therefore, it is indispensable to conduct V&V in all levels of the system to make sure that the environment functions properly.
A summary of representative papers in V&V is given in Table 7. Enabled by data-driven simulation and statistical analysis, two common practices are seen in these works: (1) comparing the predictions between different models, and (2) comparing the model predictions with real-world measurements. The results of V&V can guide actions to further enhance the analysis capabilities. Among these works, Reference [91] performs a V&V study on AEDT’s emission inventory and air quality modeling capability and investigates causes behind the deviation between AEDT and the legacy tool Emissions and Dispersion Modeling System (EDMS). Still on AEDT, Reference [92] provides a structured and repeatable framework for validating AEDT’s noise model using detailed airline flight data records, weather data, and noise monitoring data from stations around airport. The authors of [93] compare thousands of the actual single flight noise exposure measurements with predictions from three noise models: AEDT, FLULA2, and sonAIR. To understand a helicopter noise prediction system’s limitations, Reference [94] compares its Sound Exposure Level (SEL) noise contours with the acoustic flight test data for a range of flight conditions. The authors of [95] conduct a validation for an integrated aircraft environmental simulation software’s acoustic and engine exhaust emissions modules using the microphone field measurements at Manchester airport for a range of aircraft types. The authors of [96] compare predictions from the “Dutch aircraft noise model” to measured values from the NOise MOnitoring System (NOMOS) around Amsterdam Airport Schiphol between 2012 and 2018 and observes how the model accuracy has changed overtime. The authors of [97] conduct a sensitivity analysis on semi-empirical noise models and compares the predictions to flyover measurements of A320, A330, and B777. The authors of [98] present a validation methodology for the noise impact of delayed deceleration approach, a new procedure, using ground-noise-monitor measurements and radar data for several aircraft types. Most of these studies confirm that the aviation environmental impact models can achieve satisfactory accuracy on their predictions. Some works also identify reasons behind the mismatch and modify the models accordingly to obtain better agreement between modeled and measured values.

3.7. Infrastructure and Tools

The research outcomes from all the previous themes have direct impacts on the methodology and/or actual findings of aviation environmental impact analysis. This theme devoted to infrastructure and tools is special because the relevant efforts may not lead to immediate breakthroughs on the more efficient and accurate models of aviation environmental impact. Instead, they lay the foundations for data-driven researches and make them happen. Undeniably, the efforts on building infrastructure and tools to collect, integrate, clean, and process data (the majority of the “data engineering” block in Figure 3) are an indispensable part of the ecosystem and have notably streamlined data-driven analysis in aviation.
A summary of representative papers in infrastructure and tools is given in Table 8. Different types of works under this theme can be classified into: (1) hardware system, (2) data repository, and (3) data integration and pre-processing tools. Even these infrastructures and tools are built for aviation researchers and data scientists to perform more complex analyses, such as machine learning tasks, most of them are also capable of preliminary data analysis and data visualization. On the hardware design side, Reference [99] presents the system architecture, design, and capabilities of a modern hardware/software infrastructure called the Metroplex Overflight Noise Analysis (MONA). MONA is a system to measure, analyze, and archive the ground noise data from aircraft overflights for a variety of purposes, such as V&V of improved noise prediction methods. It also has a strong data visualization capability. The authors of [100] propose DV8—an interactive data visualization framework which provides visualized aviation-oriented insights for capacity planning, flight route prediction, and fuel consumption. Data repository is another crucial part of the infrastructure. Threaded Track [101] integrates radar trajectory data from a variety of surveillance sources to produce an optimal representation of an aircraft’s end to end trajectory. Since its inception, Threaded Track has facilitated data-driven analyses for aviation safety and environmental impact. WRAP [102] is an open-source database which includes extracted full-flight aircraft performance parameters from large scale open ADS-B data. Apart from the aircraft performance parameters, WRAP also provides the first set of open parametric performance models for common aircraft types. Flight DNA [103] is one of the latest aviation data repositories. It is a common database with anonymized data on aviation components, systems, technologies, and operations. On the data pre-processing tools, there has been a significant trend to convert them into open-source libraries for popular programming languages such as Python and R. traffic [104] is a Python toolbox for pre-processing and analyzing aircraft trajectories data so that they are better prepared for statistical modeling and machine learning. pyModeS [105] is another open-source library in Python. The focus of pyModeS is to decode the Mode-S Comm-B replies and provide researchers broader access to accurate aircraft state updates that are transmitted via Enhanced Mode-S. openSkies [106] is the first R package for processing public air traffic data. It has an interface to resources in the OpenSky Network, standardized data structures, and functionalities to analyze and visualize data. In the future, continued development of infrastructures and tools for aviation data analytics is a key to promoting data-driven transformation for mitigating aviation environmental impact.

4. Future Opportunities

The previous section serves to provide a review of the seven main themes on how statistics and machine learning have been leveraged to make aviation environmental impact modeling more efficient and accurate. The content under each theme includes background information, connection to aviation environmental impact analysis, and a summary of representative papers and their contributions. Based on the current development status of this research area, the characteristics of aviation environmental impact analysis, and the remaining potential of data-driven approaches, below we suggest five future research opportunities from the perspective of methodology: advanced statistical modeling and data mining, physics-informed learning, explainable/interpretable models, Bayesian methods, and data-driven optimization. Some of these methodologies are already mature in their respective fields or in other application domains, yet their applications in aviation environmental impact analysis have been limited so far. For some research opportunities, one can see the appearance of progress in some latest advances; for other research opportunities, they are proposed in a more speculative manner.

4.1. Future Opportunity 1: Advanced Statistical Modeling and Data Mining

Even though machine learning is a hotter topic today, there is still much left in the tank for statistical modeling. We observe that most relevant works in the literature choose basic statistic models for statistical analysis (although basic models are not necessarily bad models). The more advanced statistical models, which are designed to tackle certain challenges/settings, also have their own advantages on analyzing aviation data and aviation environmental impact. For example, Reference [61] applies quantile regression in a fuel consumption estimation problem, which is an interesting method that is not widely spread in the community yet. The advantages of nonparametric data analysis and mix effects models on analyzing unconventional and complex data also have not been adequately explored by the aerospace/aviation community. Below we first highlight two areas of advanced statistical modeling and data mining that could further contribute to data-driven aviation environmental impact analysis:
  • High-dimensional data analysis: Dataset size n and dimension p are two primary indicators to choose among data analysis frameworks. Many real-world aviation datasets are high-dimensional in nature. For such datasets with a large number of attributes, traditional statistical theories and methodologies are inadequate and can break down in unexpected ways. A main challenge here is the Curse of Dimensionality (CoD) [107], which refers to a set of phenomena and challenges that do not normally occur in low-dimensional spaces yet arise when the data has too many attributes/features. Modern advances in high-dimensional data analysis can perform statistical inference and prediction in high-dimensional settings. A key assumption behind most such analyses is that high-dimensional data typically concentrates on low-dimensional, sparse, or degenerate structures. Dimensionality reduction is a common way to transform high-dimensional data into a lower dimensional representation while preserving the intrinsic properties of the data. The other two categories of methods that can find applications in aviation environmental impact analysis are Functional Data Analysis (FDA) and tensor data analysis. FDA [108,109] deals with the analysis and theory of data that are in the form of functions or curves. FDA can also be thought of as the statistical analysis of samples of curves and surfaces. With the deployment of big data technologies, more and more aviation data are being recorded continuously during a time interval or intermittently at discrete time points. Section 3 highlights the use of flight operation and performance data, a typical example of functional data, for accurate environmental impact analysis. Some popular FDA techniques include Functional Principal Component Analysis (FPCA), functional regression, and clustering/classification of functional data. Tensor data in the form of multi-dimensional array can be found in the analysis of for example image streams, or aircraft noise or emissions data measured at different locations in a two-dimensional plane (two-dimensional data) sampled over different times (the third dimension, leading to three-dimensional data). Tensor decomposition [110] techniques can be applied to process and analyze tensor data.
  • Spatio-temporal data analysis: Some representative works in the literature have started to explore the spatial, temporal, and spatio-temporal patterns of aviation emissions and noise. Because aviation environmental impacts have inherently spatial or temporal context, the modeling process must take into account the space and/or time component to better understand and interpret the data. Spatio-temporal data differ from relational data in that both spatial and temporal attributes are available in addition to the actual measurements/attributes, which introduces additional challenges and requires novel formulations to analyze. Of note, References [111,112] are two good references for the statistics and data mining for spatio-temporal data. Temporal data analysis applies to events ordered by one or more dimensions of time [113]. Within temporal data analysis, the discovery of similar patterns within the same time sequence or among different time sequences relies on time series analysis—an active research field of statistics. On the other hand, spatial statistics [114] provides techniques and tools to analyze data that has a spatial characteristic to it. Since the future of aviation is likely to incorporate emerging components such as Urban Air Mobility (UAM) and Unmanned Aerial Vehicles (UAV), research topics at the intersection of aeronautics and urban and regional studies can contribute to the integration of such disruptive concepts into the existing transportation system. This includes the design of UAM and UAV operations with maximum efficiency and minimum societal (including environmental) impacts. Methods from spatial statistics can play a pivotal role in this interdisciplinary area.

4.2. Future Opportunity 2: Physics-Informed Learning

Since machine learning became a dominant tool for accurately and efficiently recognizing complex patterns from data [115,116], it has been applied to model challenging problems in physical sciences and engineering and make predictions. However, those “off-the-shelf” machine learning models do not necessarily obey the fundamental governing laws of physical systems, which prevents them from generalizing well to scenarios on which they have not been trained [116]. When modeling certain complex systems/effects, it is likely that neither purely data-driven model nor physics-based model alone can achieve the best performance. Through incorporating physics and domain knowledge into machine learning models, physics-informed machine learning [117] is referred to by many as the “ultimate solution” for the application of machine learning to phenomena governed by physical principles. As a representative of the physics-informed machine learning approaches, Physics-Informed Neural Networks (PINNs) is a deep learning framework that enables the synergistic combination of mathematical models and (noisy) data [118]. In areas related to aeronautics, PINNs have been applied to model problems in fluid mechanics [119,120] and solid mechanics [121]. In addition, it is also possible to design specialized network architectures that automatically satisfy some of the physical invariants. Overall, physics-informed machine learning have the following advantages [116,117]:
  • Greater physical consistency: Purely data-driven models may fit training data very well, but predictions may be physically inconsistent or implausible. Through integrating governing physical laws in the learning process, the model produce predictions that respect the underlying physical principles.
  • Improved trainability: Physics-informed learning can find meaningful solutions even when the problem is not perfectly well posed—with incomplete models and incomplete data. Specific to physics-informed learning, there are also effective ways to accelerate training.
  • Better generalization: Normal deep learning methods require big data for training, which may not be available for problems in science and engineering. Physics-informed learning performs well in the small data regime and has strong generalization capability from small data.
  • Uncertainty quantification: There are multiple ways of quantifying the uncertainties due to physics, data, and learning models. One such example is Bayesian PINNs (B-PINNs), which integrates the Bayesian approach with physics-informed learning for uncertainty quantification.
On aviation environmental impact modeling, some works reviewed in the previous section, such as [67,68], have started to apply physics-guided neural networks for modeling aircraft fuel burn and noise. However, overall, such explorations are still at an early stage. There is still a lot of untapped potential in the interaction of physics-informed learning and aviation environmental impact analysis. The first research direction here is data-driven aircraft performance modeling, which is a requisite for environmental impact modeling. Aircraft performance models span across multiple disciplines, such as aerodynamics, flight dynamics, etc. For models that are governed by physical laws, physics-informed Learning is a potential enabler for improved modeling. Second, the aircraft fuel burn, emissions, and noise have their respective physics-based models as well. Most of the previous researches have considered either data-oriented or physics-oriented approaches to tackle the estimation problems and produced fruitful outcomes. Nevertheless, the convergence of the two aspects has not materialized yet.

4.3. Future Opportunity 3: Explainable/Interpretable Models

State-of-the-art data-driven methods, especially machine learning and deep learning models, have demonstrated exceptional capabilities in learning a wide variety of complex patterns from data and making predictions about unobserved data. However, in addition to obtaining models with high performance, the interpretability of the models is also critical in the design and analysis of complex systems. Interpretation is defined as the extraction of knowledge about domain relationships either contained in data or learned by the model [122]. The extracted knowledge can be represented by formats such as mathematical equations, visualizations, or natural language, depending on the particular audience and problem. A literature review of the interpretability methods in machine learning can be found in [123]. Overall, the interpretable results can be used in three ways: fundamental knowledge discovery, actionable items, and effective communications.
The use of data-driven methods for fundamental knowledge discovery can find its root in numerous science and engineering disciplines. Researchers from those scientific disciplines often aim to gain fundamental understanding of a chosen problem through analyzing massive datasets produced by scientific experiments, simulations, and observations. In aviation environmental impact analysis, one of the research questions is: “what factors contribute most to the levels of aircraft fuel burn, emissions, and noise?”. In such problems, people either attempt to understand casual relationships, i.e., statements that changing one variable will cause a change in another [122], through experiments and statistical modeling, or capture correlations from observed data. In addition, an effective model needs to convert the result into insights and actionable items. More specifically, outputs produced by a data-driven model must be clearly explained and understood by a human Subject Matter Expert (SME). Here we further illustrate this necessity with two example applications in aviation: predictive maintenance and safety analysis. Methods like the Deep Neural Networks (DNNs) have shown their superiority in a large variety of predictive modeling tasks and are promising in predicting maintenance measures such as Time-To-Failure (TTF) and Remaining Useful Life (RUL) [124]. However, conventional DNNs are considered black-box models which lack transparency. For use cases like aircraft maintenance which is safety critical and heavily regulated, being able to fully understand the decision-making process is vital. The inability to trust black-box models has limited the usability of those complex models in aircraft predictive maintenance [124]. The similar logic also applies to data-driven safety analysis, where explainable models [125,126] are vital. When applying predictive models to aviation safety assurance, the objective is to not only accurately predict unsafe events and identify anomalies, but also yield insights on why they arise (precursors identification) and how to mitigate safety-related risks in the future. Lastly, interpretable models can be used to guide communication between people from different backgrounds. In one scenario, it enables data scientists who extract knowledge from data to clearly communicate with domain experts who will then make sense of the knowledge and put it into practice. In a second scenario, policy makers can use the result to communicate with the public and make the policy-making process more transparent and understandable. Going forward, there will be concrete needs for the complex models in aviation environmental impact analysis to guide knowledge discovery, actionable items, and effective communications.

4.4. Future Opportunity 4: Bayesian Methods

Bayesian methods have not be utilized by the representative works considered in this survey paper to tackle challenges in aviation environmental impact analysis. The Bayesian paradigm can construct powerful and flexible statistical models within a rigorous and coherent probabilistic framework [127]. Based on Bayes’ theorem, the Bayesian approach updates the available background knowledge about parameters in a statistical model with new information from observational data. The conventional Bayesian workflow consists of three primary steps: (1) use the available knowledge to determine the prior distribution about a given parameter in a statistical model; (2) select the likelihood function by specifying a statistical model that stochastically generates the data; and (3) combine the prior distribution and the likelihood function via Bayes’ theorem to determine the posterior distribution. The posterior distribution reflects the updated knowledge and can be used to make predictions about future events. Compared to the frequentist methods, Bayesian methods include available knowledge into the modelling process as prior and use probability statements on the unknown parameters. In problems related to aircraft performance modeling and aviation environmental impact analysis, Bayesian methods have the following two merits:
  • Combination of expert knowledge and data: in some problems, people seek approaches which can combine both SME knowledge/opinions and collected data to make better decisions. Bayesian methods incorporate background information, knowledge, or beliefs into the modeling process through prior elicitation—the translation of background information into a suitable prior distribution. Common strategies for prior elicitation include asking an expert or a panel of experts for judgements, or analyzing historical data. The result from Bayesian modelling (posterior) can also be regarded as a compromise or balancing between the prior knowledge (prior) and the observed data (likelihood).
  • Uncertainty quantification: Bayesian methods are a natural fit for uncertainty quantification. When a Bayesian framework is used for model fitting, probability distributions are assigned to the model parameters to describe the associated uncertainties. The uncertainty in the resulting posterior is jointly determined by the the informativeness (or variance) of the prior, and the sample size of the observed data. For a weakly informative prior, the posterior result is weighted more by the observed data. When the sample size is small, Bayesian methods often require more informative priors to output appropriate results.
The selections of both the prior distribution and the likelihood function in Bayesian modeling are important choices that can substantially affect the final results. Procedures such as prior predictive checking can assess the appropriateness of the selections. In the meantime, since the prior distribution and underlying data-generating model is not always known, it is always vital to conduct comprehensive sensitivity analyses to fully understand the influences that different priors and likelihood settings have on the posterior estimates. For further readings, Reference [128] provides a discussion of the philosophy behind Bayesian statistics and argues that Bayesian inference accords better with hypothetico-deductivism rather than inductive inference. Reference [129] provides an introductory course in Bayesian statistics.

4.5. Future Opportunity 5: Data-Driven Optimization

Even though optimization is out of the scope of this survey paper, the more accurate modeling of aviation environmental impact is meant to eventually pave the way for better mitigation solutions. Then, optimization comes into play in designing environmental-friendly operations and policies. Data-driven optimization is where machine learning (or predictive modeling) meets mathematical programming for better decision-making. A framework of data-driven optimization typically consists of two stages. The first stage is data-driven, where machine learning or data mining approaches are applied on real-world datasets to extract useful information/pattern. The second stage is model-based, where mathematical programming approaches, such as Mixed-Integer Linear Programming (MILP), are employed to derive the optimal decisions from the pattern. Some latest advances can further “close the loop” for the data-driven optimization paradigm by adding an additional information feedback component to couple downstream optimization and upstream machine learning to improve the performance. The authors of [130] provide a review of data-driven optimization with emphasis on decision-making under uncertainty. In recent years, data-driven optimization has been applied to many problems in the transportation domain as well [131,132]. Of note, Reference [133] is a recent example in aviation which performs flight path optimization based on weather prediction. On research topics related to sustainable aviation, the coupling between machine learning and optimization is still a gap that awaits further research efforts. In fact, this multidisciplinary research area still have a lot of space for innovations on the methodology side. For example, in a latest study, Reference [134] proposes a Smart “Predict, then Optimize” (SPO) framework which attempts to improve the standard predict-then-optimize paradigm by leveraging the downstream optimization problem structure (objective and constraints) for designing better upstream prediction models. Such innovations could become game changers and potentially bring many new research opportunities.

5. Conclusions

The popularity of data-driven methods and the availability of rich datasets have changed the landscape of aviation environmental impact analysis, an important ingredient towards a sustainable future of aviation. In the past decade, researchers from the aerospace community have started to actively leverage methods from statistics and machine learning to make aviation environmental impact analysis more efficient and accurate. The fruitful research outcomes in this area have begun to make positive impacts to the aviation industry and the society. Through reviewing representative papers, this papers aims to sort out the important development trends of data-driven aviation environmental impact analysis and explore research opportunities for the future. The paper starts with a primer on statistics and machine learning. In the review of statistical methods, we sketch out the development of the subject from basic statistical inference to modern aspects which focus on the entire problem-solve cycle and computation. In the review of machine learning, we discuss the main components of a machine learning algorithm and presents the landscape of machine learning. In the analysis of representative works, we first classify them into seven objective-oriented themes. The content under each theme includes detailed discussion on how data-driven approaches function in that specific scene to facilitate aviation environmental impact analysis and summary of representative papers. Last but not least, a section devoted to future opportunities proposes five high-potential research directions. Some of these research directions have already aroused people’s interest or can be seen in the state-of-the-art development of a related area. Other research directions are suggested based on the concrete needs for the future or the convergence of data and methodology in a more speculative manner. In addition to the opportunities, there are still some critical challenges facing the integration of data-driven approaches and aviation environmental impact modeling. Three typical examples here are methodologies for analyzing high-dimensional and heterogeneous datasets, more interpretable machine learning models, and data sharing and open science. Continued research efforts are needed to tackle both fundamental machine learning problems and the application of novel methods in the aviation domain.

Author Contributions

Conceptualization, Z.G. and D.N.M.; methodology, Z.G.; formal analysis, Z.G.; investigation, Z.G.; resources, D.N.M.; data curation, Z.G.; writing—original draft preparation, Z.G.; writing—review and editing, Z.G. and D.N.M.; visualization, Z.G.; supervision, D.N.M.; project administration, D.N.M. All authors have read and agreed to the published version of the manuscript.

Funding

This research received no external funding.

Institutional Review Board Statement

Not applicable.

Informed Consent Statement

Not applicable.

Data Availability Statement

Not applicable.

Conflicts of Interest

The authors declare no conflict of interest.

References

  1. Waitz, I.; Townsend, J.; Cutcher-Gershenfeld, J.; Greitzer, E.; Kerrebrock, J. Aviation and the Environment, A National Vision Statement, Framework for Goals and Recommended Actions; United States Congress: Washington, DC, USA, 2014.
  2. FAA (Federal Aviation Administration). Aviation Emissions, Impacts and Mitigation: A Primer; Federal Aviation Administration: Washington, DC, USA, 2015.
  3. Lee, D.; Fahey, D.; Skowron, A.; Allen, M.; Burkhardt, U.; Chen, Q.; Doherty, S.; Freeman, S.; Forster, P.; Fuglestvedt, J.; et al. The contribution of global aviation to anthropogenic climate forcing for 2000 to 2018. Atmos. Environ. 2021, 244, 117834. [Google Scholar] [CrossRef] [PubMed]
  4. Brasseur, G.P.; Gupta, M.; Anderson, B.E.; Balasubramanian, S.; Barrett, S.; Duda, D.; Fleming, G.; Forster, P.M.; Fuglestvedt, J.; Gettelman, A.; et al. Impact of Aviation on Climate: FAA’s Aviation Climate Change Research Initiative (ACCRI) Phase II. Bull. Am. Meteorol. Soc. 2016, 97, 561–583. [Google Scholar] [CrossRef] [Green Version]
  5. Basner, M.; Clark, C.; Hansell, A.; Hileman, J.; Janssen, S.; Shepherd, K.; Sparrow, V. Aviation Noise Impacts: State of the Science. Noise Health 2017, 19, 41–50. [Google Scholar] [PubMed]
  6. Brunton, S.L.; Nathan Kutz, J.; Manohar, K.; Aravkin, A.Y.; Morgansen, K.; Klemisch, J.; Goebel, N.; Buttrick, J.; Poskin, J.; Blom-Schieber, A.W.; et al. Data-Driven Aerospace Engineering: Reframing the Industry with Machine Learning. AIAA J. 2021, 59, 2820–2847. [Google Scholar] [CrossRef]
  7. Mangortey, E.; Monteiro, D.; Ackley, J.; Gao, Z.; Puranik, T.G.; Kirby, M.; Pinon-Fischer, O.J.; Mavris, D.N. Application of Machine Learning Techniques to Parameter Selection for Flight Risk Identification. In Proceedings of the AIAA Scitech 2020 Forum, Orlando, FL, USA, 6–10 January 2020; American Institute of Aeronautics and Astronautics: Reston, VA, USA, 2020; p. 1850. [Google Scholar]
  8. Gao, Z. Representative Data and Models for Complex Aerospace Systems Analysis. Ph.D. Thesis, Georgia Institute of Technology, Atlanta, GA, USA, 2022. [Google Scholar]
  9. Sölveling, G.; Solak, S.; Clarke, J.P.B.; Johnson, E.L. Scheduling of runway operations for reduced environmental impact. Transp. Res. Part D Transp. Environ. 2011, 16, 110–120. [Google Scholar] [CrossRef]
  10. Park, S.G.; Clarke, J.P. Vertical trajectory optimization to minimize environmental impact in the presence of wind. J. Aircr. 2016, 53, 725–737. [Google Scholar] [CrossRef] [Green Version]
  11. Matthes, S.; Grewe, V.; Lee, D.; Linke, F.; Shine, K.; Stromatas, S. ATM4E: A concept for environmentally-optimized aircraft trajectories. In Proceeding of the Greener Aviation 2016 Conference, Brussels, Belgium, 11–13 October 2016. [Google Scholar]
  12. Tian, Y.; Wan, L.; Han, K.; Ye, B. Optimization of terminal airspace operation with environmental considerations. Transp. Res. Part D Transp. Environ. 2018, 63, 872–889. [Google Scholar] [CrossRef]
  13. Simorgh, A.; Soler, M.; González-Arribas, D.; Matthes, S.; Grewe, V.; Dietmüller, S.; Baumann, S.; Yamashita, H.; Yin, F.; Castino, F.; et al. A Comprehensive Survey on Climate Optimal Aircraft Trajectory Planning. Aerospace 2022, 9, 146. [Google Scholar] [CrossRef]
  14. Antoine, N.E.; Kroo, I.M. Aircraft optimization for minimal environmental impact. J. Aircr. 2004, 41, 790–797. [Google Scholar] [CrossRef] [Green Version]
  15. Henderson, R.P.; Martins, J.R.; Perez, R.E. Aircraft conceptual design for optimal environmental performance. Aeronaut. J. 2012, 116, 1–22. [Google Scholar] [CrossRef]
  16. Ilario da Silva, C.R.; Orra, T.H.; Alonso, J.J. Multi-objective aircraft design optimization for low external noise and fuel burn. In Proceedings of the 58th AIAA/ASCE/AHS/ASC Structures, Structural Dynamics, and Materials Conference, Grapevine, TX, USA, 9–13 January 2017; p. 1755. [Google Scholar]
  17. Proesmans, P.J.; Vos, R. Airplane design optimization for minimal global warming impact. J. Aircr. 2022, 59, 1363–1381. [Google Scholar] [CrossRef]
  18. Zaporozhets, O.; Tokarev, V.; Attenborough, K. Aircraft Noise: Assessment, Prediction and Control; CRC Press: Boca Raton, FL, USA, 2011. [Google Scholar]
  19. Filippone, A. Aircraft noise prediction. Prog. Aerosp. Sci. 2014, 68, 27–63. [Google Scholar] [CrossRef]
  20. Torija, A.J.; Self, R.H.; Flindell, I.H. A model for the rapid assessment of the impact of aviation noise near airports. J. Acoust. Soc. Am. 2017, 141, 981–995. [Google Scholar] [CrossRef] [PubMed] [Green Version]
  21. Torija, A.J.; Self, R.H.; Flindell, I.H. Airport noise modelling for strategic environmental impact assessment of aviation. Appl. Acoust. 2018, 132, 49–57. [Google Scholar] [CrossRef] [Green Version]
  22. Efron, B.; Hastie, T. Computer Age Statistical Inference: Algorithms, Evidence, and Data Science; Institute of Mathematical Statistics Monographs; Cambridge University Press: Cambridge, UK, 2016. [Google Scholar]
  23. Chatfield, C. Statistics for Technology: A Course in Applied Statistics; CRC Press: Boca Raton, FL, USA, 1983; Volume 3. [Google Scholar]
  24. Mallows, C. The Zeroth Problem. Am. Stat. 1998, 52, 1–9. [Google Scholar]
  25. Brown, E.N.; Kass, R.E. What Is Statistics? Am. Stat. 2009, 63, 105–110. [Google Scholar] [CrossRef]
  26. Romeijn, J.W. Statistics as Inductive Inference. In Philosophy of Statistics; North-Holland: Amsterdam, The Netherlands, 2011; Volume 7, pp. 751–774. [Google Scholar]
  27. Spiegelhalter, D. The Art of Statistics: Learning from Data; Penguin UK: London, UK, 2019. [Google Scholar]
  28. Pearl, J. Causal inference in statistics: An overview. Stat. Surv. 2009, 3, 96–146. [Google Scholar] [CrossRef]
  29. Holland, P.W. Statistics and Causal Inference. J. Am. Stat. Assoc. 1986, 81, 945–960. [Google Scholar] [CrossRef]
  30. Domingos, P. A Few Useful Things to Know about Machine Learning. Commun. ACM 2012, 55, 78–87. [Google Scholar] [CrossRef] [Green Version]
  31. Sutton, R.S.; Barto, A.G. Reinforcement Learning: An Introduction; MIT Press: Cambridge, MA, USA, 2018. [Google Scholar]
  32. Zhu, X.; Goldberg, A.B. Introduction to Semi-Supervised Learning Synthesis Lectures on Artificial Intelligence and Machine Learning; University of Wisconsin: Madison, WI, USA, 2009; Volume 3, pp. 1–130. [Google Scholar]
  33. Liu, X.; Zhang, F.; Hou, Z.; Mian, L.; Wang, Z.; Zhang, J.; Tang, J. Self-supervised Learning: Generative or Contrastive. IEEE Trans. Knowl. Data Eng. 2021, 14, 1–20. [Google Scholar] [CrossRef]
  34. Goodfellow, I.; Pouget-Abadie, J.; Mirza, M.; Xu, B.; Warde-Farley, D.; Ozair, S.; Courville, A.; Bengio, Y. Generative Adversarial Nets. In Proceedings of the Advances in Neural Information Processing Systems, Montreal, QC, Canada, 5–10 December 2014; Curran Associates, Inc.: Red Hook, NY, USA, 2014; Volume 27. [Google Scholar]
  35. Settles, B. Active Learning Literature Survey; University of Wisconsin-Madison Department of Computer Sciences: Madison, WI, USA, 2009. [Google Scholar]
  36. Murphy, K.P. Machine Learning: A Probabilistic Perspective; MIT Press: Cambridge, MA, USA, 2012. [Google Scholar]
  37. Han, J.; Pei, J.; Kamber, M. Data Mining: Concepts and Techniques; Elsevier: Amsteradm, The Netherlands, 2011. [Google Scholar]
  38. Gao, Z.; Puranik, T.G.; Mavris, D.N. Probabilistic REpresentatives Mining (PREM): A Clustering Method for Distributional Data Reduction. AIAA J. 2022, 60, 2580–2596. [Google Scholar] [CrossRef]
  39. Gao, Z.; Li, Y.; Puranik, T.G.; Mavris, D.N. Minimax and Multi-Criteria Selection of Representative Model Portfolios for Complex Systems Analysis. AIAA J. 2022, 60, 1505–1521. [Google Scholar] [CrossRef]
  40. Jensen, L.; Thomas, J.; Brooks, C.; Brenner, M.; Hansman, R.J. Development of Rapid Fleet-Wide Environmental Assessment Capability. In Proceedings of the AIAA Modeling and Simulation Technologies Conference, London, UK, 23–27 September 2017; p. 3339. [Google Scholar]
  41. Torija, A.J.; Self, R.H. Aircraft classification for efficient modelling of environmental noise impact of aviation. J. Air Transp. Manag. 2018, 67, 157–168. [Google Scholar] [CrossRef] [Green Version]
  42. Gao, Z.; Kampezidou, S.I.; Behere, A.; Puranik, T.G.; Rajaram, D.; Mavris, D.N. Multi-level aircraft feature representation and selection for aviation environmental impact analysis. Transp. Res. Part C Emerg. Technol. 2022, 143, 103824. [Google Scholar] [CrossRef]
  43. Pagoni, I.; Psaraki-Kalouptsidi, V. Calculation of aircraft fuel consumption and CO2 emissions based on path profile estimation by clustering and registration. Transp. Res. Part D Transp. Environ. 2017, 54, 172–190. [Google Scholar] [CrossRef]
  44. Sun, J.; Ellerbroek, J.; Hoekstra, J. Flight extraction and phase identification for large automatic dependent surveillance–broadcast datasets. J. Aerosp. Inf. Syst. 2017, 14, 566–572. [Google Scholar] [CrossRef] [Green Version]
  45. Murca, M.C.R.; Hansman, R.J. Identification, characterization, and prediction of traffic flow patterns in multi-airport systems. IEEE Trans. Intell. Transp. Syst. 2018, 20, 1683–1696. [Google Scholar] [CrossRef]
  46. Kadyk, T.; Schenkendorf, R.; Hawner, S.; Yildiz, B.; Römer, U. Design of fuel cell systems for aviation: Representative mission profiles and sensitivity analyses. Front. Energy Res. 2019, 7, 35. [Google Scholar] [CrossRef] [Green Version]
  47. Gao, Z.; Behere, A.; Li, Y.; Lim, D.; Kirby, M.; Mavris, D.N. Development and Analysis of Improved Departure Modeling for Aviation Environmental Impact Assessment. J. Aircr. 2021, 58, 847–857. [Google Scholar] [CrossRef]
  48. Queipo, N.V.; Haftka, R.T.; Shyy, W.; Goel, T.; Vaidyanathan, R.; Kevin Tucker, P. Surrogate-based analysis and optimization. Prog. Aerosp. Sci. 2005, 41, 1–28. [Google Scholar] [CrossRef] [Green Version]
  49. Bernardo, J.E.; Kirby, M.; Mavris, D. Development of a Rapid Fleet-Level Noise Computation Model. J. Aircr. 2015, 52, 721–733. [Google Scholar] [CrossRef]
  50. Lee, C.; Thrasher, T.; Hwang, S.; Shumway, M.; Zubrow, A.; Hansen, A.; Koopmann, J.; Solman, G. Aviation Environmental Design Tool (AEDT) User Manual Version 3c; Technical Report; Federal Aviation Administration: Washington, DC, USA, 2020.
  51. Kim, S.; Lim, D.; Lee, K. Reduced-order modeling applied to the aviation environmental design tool for rapid noise prediction. J. Aerosp. Eng. 2018, 31, 04018056. [Google Scholar] [CrossRef]
  52. Ashok, A.; Lee, I.H.; Arunachalam, S.; Waitz, I.A.; Yim, S.H.; Barrett, S.R. Development of a response surface model of aviation’s air quality impacts in the United States. Atmos. Environ. 2013, 77, 445–452. [Google Scholar] [CrossRef]
  53. LeVine, M.J.; Bernardo, J.E.; Kirby, M.; Mavris, D.N. Average generic vehicle method for fleet-level analysis of noise and emission tradeoffs. J. Aircr. 2018, 55, 929–946. [Google Scholar] [CrossRef]
  54. Monteiro, D.J.; Prem, S.; Kirby, M.; Mavris, D.N. React: A rapid environmental impact on airport community tradeoff environment. In Proceedings of the 2018 AIAA Aerospace Sciences Meeting, Kissimmee, FL, USA, 8 January 2018; p. 263. [Google Scholar]
  55. Greenwood, E.; Schmitz, F.H.; Sickenberger, R.D. A semiempirical noise modeling method for helicopter maneuvering flight operations. J. Am. Helicopter Soc. 2015, 60, 1–13. [Google Scholar] [CrossRef] [Green Version]
  56. Yanto, J.; Liem, R.P. Aircraft fuel burn performance study: A data-enhanced modeling approach. Transp. Res. Part D Transp. Environ. 2018, 65, 574–595. [Google Scholar] [CrossRef]
  57. Seymour, K.; Held, M.; Georges, G.; Boulouchos, K. Fuel Estimation in Air Transportation: Modeling global fuel consumption for commercial aviation. Transp. Res. Part D Transp. Environ. 2020, 88, 102528. [Google Scholar] [CrossRef]
  58. Kuhn, M.; Johnson, K. Applied Predictive Modeling; Springer: New York, NY, USA, 2013; Volume 26. [Google Scholar]
  59. Kapoor, A.; Horvitz, Z.; Laube, S.; Horvitz, E. Airplanes aloft as a sensor network for wind forecasting. In Proceedings of the IPSN-14 13th International Symposium on Information Processing in Sensor Networks, Berlin, Germany, 8–11 April 2014; IEEE: Piscatway, NJ, USA, 2014; pp. 25–33. [Google Scholar]
  60. Kang, L.; Hansen, M. Improving airline fuel efficiency via fuel burn prediction and uncertainty estimation. Transp. Res. Part C Emerg. Technol. 2018, 97, 128–146. [Google Scholar] [CrossRef]
  61. Kang, L.; Hansen, M. Quantile Regression–Based Estimation of Dynamic Statistical Contingency Fuel. Transp. Sci. 2021, 55, 257–273. [Google Scholar] [CrossRef]
  62. Baklacioglu, T. Modeling the fuel flow-rate of transport aircraft during flight phases using genetic algorithm-optimized neural networks. Aerosp. Sci. Technol. 2016, 49, 52–62. [Google Scholar] [CrossRef]
  63. Khan, W.A.; Ma, H.L.; Ouyang, X.; Mo, D.Y. Prediction of aircraft trajectory and the associated fuel consumption using covariance bidirectional extreme learning machines. Transp. Res. Part E Logist. Transp. Rev. 2021, 145, 102189. [Google Scholar] [CrossRef]
  64. Jarry, G.; Delahaye, D.; Feron, E. Approach and landing aircraft on-board parameters estimation with lstm networks. In Proceedings of the 2020 International Conference on Artificial Intelligence and Data Analytics for Air Transportation (AIDA-AT), Singapore, 3–4 February 2020; IEEE: Piscataway, NJ, USA, 2020; pp. 1–6. [Google Scholar]
  65. Vela, A.E.; Oleyaei-Motlagh, Y. Ground level aviation noise prediction: A sequence to sequence modeling approach using LSTM recurrent neural networks. In Proceedings of the 2020 AIAA/IEEE 39th Digital Avionics Systems Conference (DASC), San Antonio, TX, USA, 11–16 October 2020; IEEE: Piscataway, NJ, USA, 2020; pp. 1–8. [Google Scholar]
  66. Wan, J.; Zhang, H.; Lyu, W.; Zhou, J. A Novel Combined Model for Short-Term Emission Prediction of Airspace Flights Based on Machine Learning: A Case Study of China. Sustainability 2022, 14, 4017. [Google Scholar] [CrossRef]
  67. Uzun, M.; Demirezen, M.U.; Inalhan, G. Physics Guided Deep Learning for Data-Driven Aircraft Fuel Consumption Modeling. Aerospace 2021, 8, 44. [Google Scholar] [CrossRef]
  68. Wiedemann, A.; Fuller, C.; Pascioni, K. Constructing a physics-guided machine learning neural network to predict tonal noise emitted by a propeller. In Proceedings of the INTER-NOISE and NOISE-CON Congress and Conference Proceedings, Seoul, Republic of Korea, 23–26 August 2022; Institute of Noise Control Engineering: Washington, DC, USA, 2022; Volume 264, pp. 151–162. [Google Scholar]
  69. Kiureghian, A.D.; Ditlevsen, O. Aleatory or Epistemic? Does It Matter? Struct. Saf. 2009, 31, 105–112. [Google Scholar] [CrossRef]
  70. Guo, J.; Du, X. Sensitivity Analysis with Mixture of Epistemic and Aleatory Uncertainties. AIAA J. 2007, 45, 2337–2349. [Google Scholar] [CrossRef]
  71. Roy, C.J.; Oberkampf, W.L. A Comprehensive Framework for Verification, Validation, and Uncertainty Quantification in Scientific Computing. Comput. Methods Appl. Mech. Eng. 2011, 200, 2131–2144. [Google Scholar] [CrossRef]
  72. Allaire, D.; Willcox, K. Surrogate modeling for uncertainty assessment with application to aviation environmental system models. AIAA J. 2010, 48, 1791–1803. [Google Scholar] [CrossRef] [Green Version]
  73. Allaire, D.; Noel, G.; Willcox, K.; Cointin, R. Uncertainty quantification of an aviation environmental toolsuite. Reliab. Eng. Syst. Saf. 2014, 126, 14–24. [Google Scholar] [CrossRef]
  74. Lim, D.; Li, Y.; LeVine, M.J.; Kirby, M.; Mavris, D.N. Parametric uncertainty quantification of aviation environmental design tool. In Proceedings of the 2018 Multidisciplinary Analysis and Optimization Conference, Atlanta, GA, USA, 25–29 June 2018; p. 3101. [Google Scholar]
  75. Behere, A.; Lim, D.; Li, Y.; Jin, Y.C.D.; Gao, Z.; Kirby, M.; Mavris, D.N. Sensitivity Analysis of Airport level Environmental Impacts to Aircraft thrust, weight, and departure procedures. In Proceedings of the AIAA Scitech 2020 Forum, Orlando, FL, USA, 23–27 January 2020; p. 1731. [Google Scholar]
  76. Simone, N.W.; Stettler, M.E.; Barrett, S.R. Rapid estimation of global civil aviation emissions with uncertainty quantification. Transp. Res. Part D Transp. Environ. 2013, 25, 33–41. [Google Scholar] [CrossRef]
  77. Graas, R.; Sun, J.; Hoekstra, J. Quantifying accuracy and uncertainty in data-driven flight trajectory predictions with gaussian process regression. In Proceedings of the 11th SESAR Innovation Days, Online Conference, 7–9 December 2021. [Google Scholar]
  78. Amaral, S.; Allaire, D.; Blanco, E.D.L.R.; Willcox, K.E. A decomposition-based uncertainty quantification approach for environmental impacts of aviation technology and operation. AI EDAM 2017, 31, 251–264. [Google Scholar] [CrossRef] [Green Version]
  79. Gao, Z.; Lim, D.; Schwartz, K.G.; Mavris, D.N. A nonparametric-based approach for the characterization and propagation of epistemic uncertainty due to small datasets. In Proceedings of the AIAA Scitech 2019 Forum, San Diego, CA, USA, 7 January 2019; p. 1490. [Google Scholar]
  80. June, J.C.; Thomas, R.H.; Guo, Y. System Noise Prediction Uncertainty Quantification for a Hybrid Wing–Body Transport Concept. AIAA J. 2020, 58, 1157–1170. [Google Scholar] [CrossRef]
  81. Akatsuka, J.; Ishii, T. System Noise Assessment and Uncertainty Analysis of a Conceptual Supersonic Aircraft. Aerospace 2022, 9, 212. [Google Scholar] [CrossRef]
  82. Van Pham, V.; Tang, J.; Alam, S.; Lokan, C.; Abbass, H.A. Aviation emission inventory development and analysis. Environ. Model. Softw. 2010, 25, 1738–1753. [Google Scholar] [CrossRef]
  83. Jansson, M. Development of a Fast Method to Analyze Patterns in Airport Noise. Master’s Thesis, Massachusetts Institute of Technology, Cambridge, MA, USA, 2021. [Google Scholar]
  84. Sun, J.; Dedoussi, I. Evaluation of aviation emissions and environmental costs in Europe using OpenSky and OpenAP. Eng. Proc. 2021, 13, 5. [Google Scholar]
  85. Filippone, A.; Parkes, B.; Bojdo, N.; Kelly, T. Prediction of aircraft engine emissions using ADS-B flight data. Aeronaut. J. 2021, 125, 988–1012. [Google Scholar] [CrossRef]
  86. Filippone, A.; Parkes, B. Evaluation of commuter airplane emissions: A European case study. Transp. Res. Part D Transp. Environ. 2021, 98, 102979. [Google Scholar] [CrossRef]
  87. Maruhashi, J.; Grewe, V.; Frömming, C.; Jöckel, P.; Dedoussi, I.C. Transport Patterns of Global Aviation NOx and their Short-term O3 Radiative Forcing–A Machine Learning Approach. Atmos. Chem. Phys. Discuss. 2022, 22, 14253–14282. [Google Scholar] [CrossRef]
  88. Quadros, F.D.; Snellen, M.; Sun, J.; Dedoussi, I.C. Global Civil Aviation Emissions Estimates for 2017–2020 Using ADS-B Data. J. Aircr. 2022, 35, 1–11. [Google Scholar] [CrossRef]
  89. Kulik, L. Satellite-Based Detection of Contrails Using Deep Learning. Ph.D. Thesis, Massachusetts Institute of Technology, Cambridge, MA, USA, 2019. [Google Scholar]
  90. Fan, C. Formal Methods for Safe Autonomy: Data-Driven Verification, Synthesis, and Applications. Ph.D. Thesis, University of Illinois at Urbana-Champaign, Champaign, IL, USA, 2019. [Google Scholar]
  91. Li, Y.; Lim, D.; Kirby, M.; Mavris, D.N.; Noel, G. Uncertainty Quantification Analysis of the Aviation Environmental Design Tool in Emission Inventory and Air Quality Modeling. In Proceedings of the 2018 Aviation Technology, Integration, and Operations Conference, Reston, VA, USA, 25–29 June 2018; p. 3050. [Google Scholar]
  92. Gabrielian, A.B.; Puranik, T.G.; Bendarkar, M.V.; Kirby, M.; Mavris, D.; Monteiro, D. Noise Model Validation using Real World Operations Data. In Proceedings of the AIAA Aviation 2021 Forum, Online Conference, 2–6 August 2021; p. 2136. [Google Scholar]
  93. Meister, J.; Schalcher, S.; Wunderli, J.M.; Jäger, D.; Zellmann, C.; Schäffer, B. Comparison of the aircraft noise calculation programs sonAIR, FLULA2 and AEDT with noise measurements of single flights. Aerospace 2021, 8, 388. [Google Scholar] [CrossRef]
  94. Botre, M.; Brentner, K.S.; Horn, J.F.; Wachspress, D. Validation of helicopter noise prediction system with flight data. In Proceedings of the Vertical Flight Society 75th Annual Forum & Technology Display, Held, Ukraine, 13–16 May 2019; Volume 13. [Google Scholar]
  95. Filippone, A.; Zhang, M.; Bojdo, N. Validation of an integrated simulation model for aircraft noise and engine emissions. Aerosp. Sci. Technol. 2019, 89, 370–381. [Google Scholar] [CrossRef]
  96. Simons, D.G.; Besnea, I.; Mohammadloo, T.H.; Melkert, J.A.; Snellen, M. Comparative assessment of measured and modelled aircraft noise around Amsterdam Airport Schiphol. Transp. Res. Part D Transp. Environ. 2022, 105, 103216. [Google Scholar] [CrossRef]
  97. Vieira, A.; von den Hoff, B.; Snellen, M.; Simons, D.G. Comparison of Semi-Empirical Noise Models with Flyover Measurements of Operating Aircraft. J. Aircr. 2022, 1–14. [Google Scholar] [CrossRef]
  98. Huynh, J.L.; Mahseredjian, A.; John Hansman, R. Delayed Deceleration Approach Noise Impact and Modeling Validation. J. Aircr. 2022, 59, 1–13. [Google Scholar] [CrossRef]
  99. Jackson, D.C.; Rindfleisch, T.C.; Alonso, J.J. A System for Measurement and Analysis of Aircraft Noise Impacts. Eng. Proc. 2021, 13, 6. [Google Scholar]
  100. Omidvar-Tehrani, B.; Nandi, A.; Meyer, N.; Flanagan, D.; Young, S. Dv8: Interactive analysis of aviation data. In Proceedings of the 2017 IEEE 33rd International Conference on Data Engineering (ICDE), San Diego, CA, USA, 19–22 April 2017; IEEE: Piscatway, NJ, USA, 2017; pp. 1411–1412. [Google Scholar]
  101. Eckstein, A.; Kurcz, C.; Silva, M. Threaded Track: Geospatial Data Fusion for Aircraft Flight Trajectories; Technical Report; MITRE Corporation: McLean, VA, USA, 2012. [Google Scholar]
  102. Sun, J.; Ellerbroek, J.; Hoekstra, J.M. WRAP: An open-source kinematic aircraft performance model. Transp. Res. Part C Emerg. Technol. 2019, 98, 118–138. [Google Scholar] [CrossRef]
  103. NREL (National Renewable Energy Laboratory). Flight DNA: An Anonymized Aviation Data Tool and Repository; NREL: Golden, CO, USA, 2022.
  104. Olive, X. Traffic, a toolbox for processing and analysing air traffic data. J. Open Source Softw. 2019, 4, 1518. [Google Scholar] [CrossRef] [Green Version]
  105. Sun, J.; Vû, H.; Ellerbroek, J.; Hoekstra, J.M. pymodes: Decoding mode-s surveillance data for open air transportation research. IEEE Trans. Intell. Transp. Syst. 2019, 21, 2777–2786. [Google Scholar] [CrossRef]
  106. Ayala, R.; Ayala, D.; Vidal, L.S.; Ruiz, D. openSkies-Integration of Aviation Data into the R Ecosystem. R J. 2021, 13, 590–599. [Google Scholar] [CrossRef]
  107. Verleysen, M.; François, D. The curse of dimensionality in data mining and time series prediction. In Proceedings of the International Work-Conference on Artificial Neural Networks, Athens, Greece, 10–14 September 2005; Springer: New York, NY, USA, 2005; pp. 758–770. [Google Scholar]
  108. Wang, J.L.; Chiou, J.M.; Müller, H.G. Functional data analysis. Annu. Rev. Stat. Its Appl. 2016, 3, 257–295. [Google Scholar] [CrossRef] [Green Version]
  109. Kokoszka, P.; Reimherr, M. Introduction to Functional Data Analysis; Chapman and Hall/CRC: Boca Raton, FL, USA, 2017. [Google Scholar]
  110. Kolda, T.G.; Bader, B.W. Tensor decompositions and applications. SIAM Rev. 2009, 51, 455–500. [Google Scholar] [CrossRef]
  111. Cressie, N.; Wikle, C.K. Statistics for Spatio-Temporal Data; John Wiley & Sons: Hoboken, NJ, USA, 2015. [Google Scholar]
  112. Atluri, G.; Karpatne, A.; Kumar, V. Spatio-temporal data mining: A survey of problems and methods. ACM Comput. Surv. (CSUR) 2018, 51, 1–41. [Google Scholar] [CrossRef]
  113. Roddick, J.F.; Spiliopoulou, M. A bibliography of temporal, spatial and spatio-temporal data mining research. ACM SIGKDD Explor. Newsl. 1999, 1, 34–38. [Google Scholar] [CrossRef]
  114. Ripley, B.D. Spatial Statistics; John Wiley & Sons: Hoboken, NJ, USA, 2005. [Google Scholar]
  115. Kutz, J.N. Deep learning in fluid dynamics. J. Fluid Mech. 2017, 814, 1–4. [Google Scholar] [CrossRef]
  116. Kashinath, K.; Mustafa, M.; Albert, A.; Wu, J.; Jiang, C.; Esmaeilzadeh, S.; Azizzadenesheli, K.; Wang, R.; Chattopadhyay, A.; Singh, A.; et al. Physics-informed machine learning: Case studies for weather and climate modelling. Philos. Trans. R. Soc. A 2021, 379, 20200093. [Google Scholar] [CrossRef] [PubMed]
  117. Karniadakis, G.E.; Kevrekidis, I.G.; Lu, L.; Perdikaris, P.; Wang, S.; Yang, L. Physics-informed machine learning. Nat. Rev. Phys. 2021, 3, 422–440. [Google Scholar] [CrossRef]
  118. Raissi, M.; Perdikaris, P.; Karniadakis, G.E. Physics-informed neural networks: A deep learning framework for solving forward and inverse problems involving nonlinear partial differential equations. J. Comput. Phys. 2019, 378, 686–707. [Google Scholar] [CrossRef]
  119. Mao, Z.; Jagtap, A.D.; Karniadakis, G.E. Physics-informed neural networks for high-speed flows. Comput. Methods Appl. Mech. Eng. 2020, 360, 112789. [Google Scholar] [CrossRef]
  120. Cai, S.; Mao, Z.; Wang, Z.; Yin, M.; Karniadakis, G.E. Physics-informed neural networks (PINNs) for fluid mechanics: A review. Acta Mech. Sin. 2022, 37, 1727–1738. [Google Scholar] [CrossRef]
  121. Haghighat, E.; Raissi, M.; Moure, A.; Gomez, H.; Juanes, R. A physics-informed deep learning framework for inversion and surrogate modeling in solid mechanics. Comput. Methods Appl. Mech. Eng. 2021, 379, 113741. [Google Scholar] [CrossRef]
  122. Murdoch, W.J.; Singh, C.; Kumbier, K.; Abbasi-Asl, R.; Yu, B. Definitions, methods, and applications in interpretable machine learning. Proc. Natl. Acad. Sci. USA 2019, 116, 22071–22080. [Google Scholar] [CrossRef] [Green Version]
  123. Linardatos, P.; Papastefanopoulos, V.; Kotsiantis, S. Explainable AI: A Review of Machine Learning Interpretability Methods. Entropy 2021, 23, 18. [Google Scholar] [CrossRef] [PubMed]
  124. Shukla, B.; Fan, I.S.; Jennions, I. Opportunities for Explainable Artificial Intelligence in Aerospace Predictive Maintenance. In Proceedings of the PHM Society European Conference, Sanya, China, 12–14 November 2020; Volume 5, p. 11. [Google Scholar]
  125. Grushin, A.; Nanda, J.; Tyagi, A.; Miller, D.; Gluck, J.; Oza, N.C.; Maheshwari, A. Decoding the Black Box: Extracting Explainable Decision Boundary Approximations from Machine Learning Models for Real Time Safety Assurance of the National Airspace. In Proceedings of the AIAA Scitech 2019 Forum, San Diego, CA, USA, 7–11 January 2019. Number AIAA 2019-0136. [Google Scholar]
  126. Memarzadeh, M.; Matthews, B.; Templin, T. Multi-Class Anomaly Detection in Flight Data Using Semi-Supervised Explainable Deep Learning Model. In Proceedings of the AIAA Scitech 2021 Forum, Online Conference, 19–21 January 2021. Number AIAA 2021-0774. [Google Scholar]
  127. van de Schoot, R.; Depaoli, S.; King, R.; Kramer, B.; Märtens, K.; Tadesse, M.G.; Vannucci, M.; Gelman, A.; Veen, D.; Willemsen, J.; et al. Bayesian statistics and modelling. Nat. Rev. Methods Prim. 2021, 1, 1–26. [Google Scholar] [CrossRef]
  128. Gelman, A.; Shalizi, C.R. Philosophy and the practice of Bayesian statistics. Br. J. Math. Stat. Psychol. 2013, 66, 8–38. [Google Scholar] [CrossRef] [PubMed]
  129. Hoff, P.D. A First Course in Bayesian Statistical Methods; Springer: New York, NY, USA, 2009; Volume 580. [Google Scholar]
  130. Ning, C.; You, F. Optimization under uncertainty in the era of big data and deep learning: When machine learning meets mathematical programming. Comput. Chem. Eng. 2019, 125, 434–448. [Google Scholar] [CrossRef] [Green Version]
  131. Yang, J.; Dong, J.; Hu, L. A data-driven optimization-based approach for siting and sizing of electric taxi charging stations. Transp. Res. Part C Emerg. Technol. 2017, 77, 462–477. [Google Scholar] [CrossRef] [Green Version]
  132. Van Nguyen, T.; Zhang, J.; Zhou, L.; Meng, M.; He, Y. A data-driven optimization of large-scale dry port location using the hybrid approach of data mining and complex network theory. Transp. Res. Part E Logist. Transp. Rev. 2020, 134, 101816. [Google Scholar] [CrossRef]
  133. Kim, J.; Justin, C.; Mavris, D.; Briceno, S. Data-Driven Approach Using Machine Learning for Real-Time Flight Path Optimization. J. Aerosp. Inf. Syst. 2022, 19, 3–21. [Google Scholar] [CrossRef]
  134. Elmachtoub, A.N.; Grigas, P. Smart “predict, then optimize”. Manag. Sci. 2022, 68, 9–26. [Google Scholar] [CrossRef]
Figure 1. Elements in the PPDAC problem-solving cycle.
Aerospace 09 00750 g001
Figure 2. Taxonomy of the landscape of machine learning.
Aerospace 09 00750 g002
Figure 3. The machine learning engineering workflow.
Aerospace 09 00750 g003
Figure 4. Taxonomy of common classes of data reduction methods.
Aerospace 09 00750 g004
Figure 5. The process of building surrogate model.
Aerospace 09 00750 g005
Figure 6. A standard uncertainty quantification process.
Aerospace 09 00750 g006
Table 2. Summary of representative papers in data reduction.
YearPaperTopicKey Contributions
2017[40]Development of Rapid Fleet-Wide Environmental Assessment CapabilityDevelops a methodology for rapid analysis of fleet-level noise and emissions. The method extracts representative flight trajectories from large operations (ASDE-X) data and uses a subset of representative aircraft types to reduce the computational cost.
2017[43]Calculation of Aircraft Fuel Consumption and CO 2 Emissions based on Path Profile Estimation by Clustering and RegistrationCalculates typical aircraft fuel burn and CO 2 emissions on the Climb-Cruise-Descent (CCD) cycle using representative flight paths and aircraft performance model. The method applies clustering on large dataset to extract flight characteristics and converts them into representative flight profiles.
2017[44]Flight Extraction and Phase Identification for Large Automatic Dependent Surveillance–Broadcast DatasetsPerforms flight extraction and phase identification on the large ADS-B datasets. The flight extraction part utilizes clustering to extract continuous flights. The flight phase identification part then applies fuzzy logic to segment flight data into different phases.
2018[41]Aircraft Classification for Efficient Modelling of Environmental Noise Impact of AviationConducts rapid fleet-level noise contour computation through aircraft classification. The method reduces the UK commercial aircraft fleet to four representative-in-class aircraft using aircraft physical, emissions, and noise features.
2018[45]Identification, Characterization, and Prediction of Traffic Flow Patterns in Multi-Airport SystemsPresents a data-driven framework to identify, characterize, and predict traffic flow patterns in complex airspace. The methods applies machine learning methods, mainly multi-layer clustering and multi-way classification, on historical flight and weather data.
2019[46]Design of Fuel Cell Systems for Aviation: Representative Mission Profiles and Sensitivity AnalysesSpecifies requirements for the design of fuel cell systems for passenger aircraft. The work extracts representative mission profiles through statistical analysis on flight data and construction of probabilistic model for the mission profile.
2021[47]Development and Analysis of Improved Departure Modeling for Aviation Environmental Impact AssessmentDevelops representative aircraft departure procedures from real-world flight operations data for simulating aircraft takeoff environmental impacts. The simulation results are then evaluated through statistical analysis and statistical learning to uncover patterns.
2022[38]Probabilistic REpresentatives Mining (PREM): A Clustering Method for Distributional Data ReductionDevelops a methodology for distributional data reduction which is effective and consistent at small sample sizes. The method enables the use of only a very small subset of aircraft operations data for efficient uncertainty propagation in environmental impact modeling.
2022[39]Minimax and Multi-Criteria Selection of Representative Model Portfolios for Complex Systems AnalysisDevelops a methodology which utilizes minimax and multi-criteria considerations to select a small subset of representative aircraft types to cover the richness and complexity in entire population for building the costly aircraft noise and performance models. Multiple machine learning and data visualization techniques are involved.
2022[42]Multi-level Aircraft Feature Representation and Selection for Aviation Environmental Impact AnalysisConducts a comprehensive aircraft feature selection study on aviation environmental impacts. The result provides improved (and reduced) aircraft representation for the aircraft grouping problem and generates insights on aircraft features that are influential on different levels of environmental impacts.
Table 3. Summary of representative papers in efficient computation.
YearPaperTopicKey Contributions
2013[52]Development of a Response Surface Model of Aviation’s Air Quality Impacts in the United StatesConstructs a response surface model (RSM) to evaluate the air quality impacts of aviation in the U.S. for present-day and future scenarios. The surrogate model is a rapid version which approximates the computationally expensive Community Multiscale Air Quality (CMAQ) modeling system.
2015[49]Development of a Rapid Fleet-level Noise Computation ModelPresents a rapid fleet-level noise computation model that leverages the fidelity of detailed models. The simplified method performs generic aircraft operations upfront and recombines events later to evaluate the impact of new technologies and perform trades of different noise mitigating strategies.
2015[55]A Semiempirical Noise Modeling Method for Helicopter Maneuvering Flight OperationsDevelops a semi-empirical noise model for helicopter blade–vortex interaction (BVI) noise during maneuvering flight. The methods uses performance and acoustic data from both flight and wind tunnel tests to build a computationally efficient analytical model for acoustic mission planning.
2018[53]Average Generic Vehicle Method for Fleet-level Analysis of Noise and Emission TradeoffsProposes a method named generating emissions and noise, evaluating residuals, and using inverse methods for choosing the best alternatives (GENERICA). The method uses surrogate models to model average generic vehicles for fleet-level analysis of technology impacts on environmental metrics.
2018[54]REACT: A Rapid Environmental Impact on Airport Community Tradeoff EnvironmentProposes a rapid computational environment named Rapid Environmental Impact on Airport Community Tradeoff (REACT). The environment has a user interface and can rapidly tradeoff various noise mitigation strategies to manage airport community noise exposure in current and future airport scenarios.
2018[51]Reduced-Order Modeling Applied to the Aviation Environmental Design Tool for Rapid Noise PredictionDevelops a rapid approximation of the aviation environmental design tool (AEDT) noise model via reduced-order modeling (ROM). The method uses proper orthogonal decomposition (POD) for orthonormal basis extraction and kriging for basis coefficient prediction.
2018[56]Aircraft Fuel Burn Performance Study: A Data-enhanced Modeling ApproachDevelops a data-enhanced surrogate model for aircraft fuel burn. The method improves the efficiency and accuracy of fuel burn modeling by combining a low-fidelity physics-based model with aircraft operation and performance data. A sample-based linear regression model is built for each aircraft type.
2020[57]Fuel Estimation in Air Transportation: Modeling Global Fuel Consumption for Commercial AviationDevelops a framework named Fuel Estimation in Air Transportation (FEAT). It is a rapid analysis capability which consists of (1) a high fidelity flight profile simulator based on EUROCONTROL’s aircraft performance model, and (2) a reduced order fuel burn model with airport pair and aircraft type as inputs.
Table 4. Summary of representative papers in predictive modeling.
YearPaperTopicKey Contributions
2014[59]Airplanes Aloft as a Sensor Network for Wind ForecastingApplies machine learning on aircraft air and ground speeds data to develop a wind forecasting model for reducing the environmental impact of aviation. The method involves the use of Probabilistic Graphical Model (PGM) and Gaussian Process Regression (GPR) for wind prediction.
2016[62]Modeling the Fuel Flow-rate of Transport Aircraft During Flight Phases using Genetic Algorithm-optimized Neural NetworksDevelops a deep learning model to predict the fuel consumption of transport aircraft for minimizing emissions and saving fuel. The method develops from real flight data a genetic algorithm-optimized neural network topology that is specifically designed for the fuel flow rate problem.
2018[60]Improving Airline Fuel Efficiency via Fuel Burn Prediction and Uncertainty EstimationProposes a discretionary fuel prediction method for reducing the discretionary fuel loading by dispatchers while maintaining the same safety level and saving fuel. The method applies ensemble learning to improve the prediction of fuel burn and construct uncertainty intervals for the model predictions.
2020[64]Approach and Landing Aircraft On-Board Parameters Estimation with LSTM NetworksDevelops a model to estimate aircraft on-board parameters such as the fuel flow rate for enhancing the system’s safety and efficiency. The method applies Long Short Term Memory (LSTM) neural network on Flight Data Monitoring (FDM) data records to estimate target parameters.
2020[65]Ground Level Aviation Noise Prediction: A Sequence to Sequence Modeling Approach Using LSTM Recurrent Neural NetworksDevelops a deep learning model to predict ground level aviation noise. The method applies Sequence-to-sequence Long Short Term Memory (LSTM) Recurrent Neural Network (RNN) on large radar and noise datasets to predict aviation noise at a ground location near Washington National Airport.
2021[61]Quantile Regression–Based Estimation of Dynamic Statistical Contingency FuelApplies machine learning to estimate the Statistical Contingency Fuel (SCF) for reducing fuel consumption. The method employs quantile regression on a large fuel burn dataset from a major U.S.-based airline to estimate the SCF and account for uncertainties.
2021[67]Physics Guided Deep Learning for Data-Driven Aircraft Fuel Consumption ModelingPresents a framework which uses physics-guided deep learning to model aircraft fuel burn. The method guides the neural network with fuel flow dynamics equations and embeds physical knowledge as extra losses in the model training to outperform other model-based and supervised learning approaches.
2021[63]Prediction of Aircraft Trajectory and the Associated Fuel Consumption using Covariance Bidirectional Extreme Learning MachinesApplies deep learning to predict aircraft trajectory and the associated fuel consumption. The method uses covariance bidirectional extreme learning machine (CovB-ELM) to achieve a more accurate and robust performance than the existing methods.
2022[66]A Novel Combined Model for Short-Term Emission Prediction of Airspace Flights Based on Machine Learning: A Case Study of ChinaApplies machine learning to predict short-term flight emissions within enroute airspace. The method uses an adaptive weighting approach on results from a Long Short Term Memory (LSTM) prediction model and an extreme gradient boosting (XGBoost) prediction model to improve the performance.
2022[68]Constructing a Physics-guided Machine Learning Neural Network to Predict Tonal Noise Emitted by a PropellerApplies deep learning to predict propeller tonal noise in the time domain over a broad range of flight conditions. The method uses physics-guided neural networks to improve the prediction performance while alleviating the dataset size requirement for experimental data.
Table 5. Summary of representative papers in uncertainty quantification.
YearPaperTopicKey Contributions
2010[72]Surrogate Modeling for Uncertainty Assessment with Application to Aviation Environmental System ModelsProposes a surrogate modeling methodology designed specifically for uncertainty propagation and sensitivity analysis. The method is demonstrated on a large-scale aviation environmental model and can provide fast predictions with confidence intervals to support environmental policy-making.
2013[76]Rapid Estimation of Global Civil Aviation Emissions with Uncertainty QuantificationDevelops a methodology and open source code for rapidly computing global aviation emissions with uncertainty quantification. The method enables global fleet-wide simulations for rapid policy analyses and quantification of uncertainties from operational factors, scientific knowledge, and model fidelity.
2014[73]Uncertainty Quantification of an Aviation Environmental ToolsuiteDescribes uncertainty quantification of a complex computational tool for aviation environmental impact. The method consists of surrogate modeling to overcome the complexities of long run times and sensitivity analysis to identifying high priority areas for future research.
2017[78]A Decomposition-based Uncertainty Quantification Approach for Environmental Impacts of Aviation Technology and OperationProposes a divide-and-conquer approach, similar to the decomposition-based approaches in multidisciplinary analysis and optimization, to quantify uncertainty in multicomponent systems. Performs uncertainty analysis and global sensitivity analysis for environmental impacts of enhanced aviation technologies and operations.
2018[74]Parametric Uncertainty Quantification of Aviation Environmental Design ToolConducts parametric uncertainty quantification at the vehicle level for Aviation Environmental Design Tool (AEDT). The study to identifies the main contributors to AEDT output uncertainties and gains better insights on the areas of future AEDT improvements.
2019[79]A Nonparametric-based Approach for the Characterization and Propagation of Epistemic Uncertainty due to Small DatasetsProposes a nonparametric framework to characterize and propagate uncertainty when only small datasets are available. The approach requires less assumption on the type of probability distribution of the uncertainty sources and brings greater flexibility into the UQ process.
2020[75]Sensitivity Analysis of Airport Level Environmental Impacts to Aircraft Thrust, Weight, and Departure ProceduresConducts sensitivity analysis for fleet-level fuel burn, noise, and emissions to changes in uncertain factors such as aircraft takeoff weight, thrust, and departure profiles. The result underlines the importance of these factors when optimizing aircraft departure operations for environmental impact mitigation.
2020[80]System Noise Prediction Uncertainty Quantification for a Hybrid Wing–Body Transport ConceptPerforms uncertainty quantification on the noise of a hybrid wing–body aircraft configuration. The method propagates element-level uncertainties through Monte Carlo simulation to the system level for noise predictions at the three certification locations and provides future research directions.
2021[77]Quantifying Accuracy and Uncertainty in Data-Driven Flight Trajectory Predictions with Gaussian Process RegressionPerforms uncertainty quantification on data-driven 4D flight trajectory predictions using a two-stage Gaussian Process Regression (GPR). The study also evaluates and quantifies how flight-plan and meteorological information can help reducing the prediction error and uncertainty.
2022[81]System Noise Assessment and Uncertainty Analysis of a Conceptual Supersonic AircraftPerforms system noise assessment, uncertainty analysis, and validation tests for a conceptual supersonic aircraft using Monte Carlo simulation. The result also identifies the noise factors that have significant impact on the landing and takeoff noise (LTO) noise.
Table 6. Summary of representative papers in pattern discovery.
YearPaperTopicKey Contributions
2010[82]Aviation Emission Inventory development and analysisDevelops a 4D aviation emission inventory using air traffic trajectory data from Australian Airspace for spatial and temporal emission analysis. The result shows the disparity of CO 2 concentration in different parts of Australia and the impact of NO x emission on different layers of the atmosphere.
2019[89]Satellite-based Detection of Contrails using Deep LearningTrains a Convolutional Neural Network (CNN) on satellite images for the automated detection of aircraft contrails, a major source of climate warming effect by aviation emissions. The result estimates that contrails cover an average of 0.55% of the contiguous U.S. and discovers the relationship between contrail coverage and air traffic as a function of time and location.
2021[83]Development of a Fast Method to Analyze Patterns in Airport NoiseUses large quantity of flight track data and a fast noise approximation model on airport noise modeling. The result highlights the variability in noise patterns depending on evolving airport runway configuration at Boston Logan International Airport (KBOS).
2021[84]Evaluation of Aviation Emissions and Environmental Costs in Europe Using OpenSky and OpenAPProposes a data-driven approach for rapid estimations of cruise-level flight emissions over Europe using open data (ADS-B data) and open models (OpenAP emission models). The result shows cruise-level flight emissions by different airlines, geographic regions, altitudes, and timeframe.
2021[85]Prediction of Aircraft Engine Emissions using ADS-B Flight DataCombines real-time flight data from ADS-B and flight performance model to predict aviation emissions at altitude – greater than 3,000 ft and exclude takeoff and landing. The result shows that NO x and water vapour emissions concentrate around tropospheric altitudes only for long-range flights.
2021[86]Evaluation of Commuter Airplane Emissions: A European Case Study Author Links Open Overlay PanelSimulates flights using ADS-B/Mode-S data to evaluate commuter airplane emissions in Europe. It studies a network of short-haul commuter flights (less than 300 n-miles) and analyzes fuel burn and emissions as function of distance, altitude, city pairs. It finds out that flight range is the biggest clear discriminator in emissions.
2022[87]Transport Patterns of Global Aviation NO x and their Short-term O 3 Radiative Forcing – A Machine Learning ApproachUses global-scale simulations and the unsupervised QuickBundles clustering approach to study the transport patterns of emitted NO x and their associated climate impacts in different regions and seasons. The result highlights the spatially and temporally heterogeneous nature of the NO x –O 3 chemistry from a global perspective.
2022[88]Global Civil Aviation Emissions Estimates for 2017–2020 Using ADS-B DataUses ADS-B data, Base of Aircraft Data (BADA) aircraft performance model, and ICAO’s Engine Emissions Databank to estimate global emissions from aircraft operations for the years 2017–2020. The result quantifies global aviation emissions and the evolution of the fleet average emission indices over time, including impact from COVID-19.
Table 7. Summary of representative papers in verification and validation.
YearPaperTopicKey Contributions
2018[91]Uncertainty Quantification Analysis of the Aviation Environmental Design Tool in Emission Inventory and Air Quality ModelingConducts an uncertainty quantification analysis on AEDT provide verification and validation of AEDT’s emission inventory and air quality modeling. It investigates causes that lead to the differences between AEDT and the legacy tool Emissions and Dispersion Modeling System (EDMS).
2019[94]Validation of Helicopter Noise Prediction System with Flight DataConducts a validation exercise for a helicopter noise prediction system to understand its limitations. It compares the Sound Exposure Level (SEL) noise contours between the model predictions and the acoustic flight test data for a range of flight conditions and concludes the predictions are overall satisfactory.
2019[95]Validation of an Integrated Simulation Model for Aircraft Noise and Engine EmissionsConducts a validation exercise for an integrated aircraft environmental simulation software’s acoustic and engine exhaust emissions modules. It compares between the microphone field measurements at Manchester airport and numerical predictions for 12 common commercial airplanes.
2021[93]Comparison of the Aircraft Noise Calculation Programs sonAIR, FLULA2 and AEDT with Noise Measurements of Single FlightsCompares the actual noise exposure measurements with calculations of several thousand single flights using three noise calculation programs: sonAIR, FLULA2, and AEDT. It mentions that all three programs show good result, yet sonAIR can perform better in modeling single flights.
2021[92]Noise Model Validation using Real World Operations DataProvides a structured and repeatable framework for noise model validation using real-world operations data. The validation utilizes multiple types of real-world data including detailed airline flight data records, noise monitoring data from stations around airport, and historical weather data.
2022[98]Delayed Deceleration Approach Noise Impact and Modeling ValidationPresents a validation methodology for delayed deceleration approach using noise measurements and radar data for several aircraft types. The method is demonstrated through comparing modeled sound exposure levels of these new procedures with available ground-noise-monitor data at two major airports.
2022[96]Comparative Assessment of Measured and Modelled Aircraft Noise around Amsterdam Airport SchipholCompares the “Dutch aircraft noise model” predictions to measured values from the NOise MOnitoring System (NOMOS) around Amsterdam Airport Schiphol between 2012 and 2018. It finds out that the model prediction improved throughout the years due several factors.
2022[97]Comparison of Semi-Empirical Noise Models with Flyover Measurements of Operating AircraftInvestigates the sensitivity of semi-empirical models of engine and airframe noise to uncertainties in geometrical parameters and aircraft operating conditions, and compares the predictions to measurements of A320, A330, and B777. It identifies reasons behind the mismatch and improves the model.
Table 8. Summary of representative papers in infrastructure and tools.
YearPaperTopicKey Contributions
2012[101]Threaded Track: Geospatial Data Fusion for Aircraft Flight TrajectoriesPresents the threaded track repository: a robust and efficient capability of fusing radar trajectories from a variety of surveillance sources based on their temporal and spatial proximity to produce a synthetic track with the best possible coverage and fidelity. The Threaded Track represents the optimal representation of an aircraft’s end to end trajectory to support a wide range of safety, security, and efficiency analyses.
2017[100]DV8: Interactive Analysis of Aviation DataProposes DV8: an interactive data visualization framework for providing visualized aviation-oriented insights, with a focus on evaluating the deviations among flights by route, type, airport, and aircraft performance. DV8 can be utilized in areas such as capacity planning, flight route prediction, and fuel consumption.
2019[104]traffic: A Toolbox for Processing and Analyzing Air Traffic DataPresents traffic: a Python toolbox for preprocessing and analyzing trajectories data evolving in airspaces. The tool can prepare data for aviation researchers and data scientists needing to compute statistics, performance indicators and building datasets for common machine learning tasks.
2019[102]WRAP: An Open-source Kinematic Aircraft Performance ModelPresents WRAP: a comprehensive set of methods for extracting different aircraft performance parameters from large scale open ADS-B data. This open-source data includes a set of more than 30 parameters from 7 distinct flight phases for 17 common commercial aircraft types and the fitted parametric models.
2020[105]pyModeS: Decoding Mode-S Surveillance Data for Open Air Transportation ResearchProposes pyModeS: an open-source library and new heuristic-probabilistic method to decode the Mode-S Comm-B replies and to check the correctness of the messages. It fills the gap of handling interrogation-based surveillance data and gives researchers broader access to accurate aircraft state updates that are transmitted through Enhanced Mode-S.
2021[99]A System for Measurement and Analysis of Aircraft Noise ImpactsPresents the system architecture, design, and current set of capabilities of the Metroplex Overflight Noise Analysis (MONA) system. The MONA project seeks to measure, analyze, and archive the ground noise data from aircraft overflights for a variety of purposes, such as an openly-available database for V&V of improved noise prediction methods.
2021[106]openSkies: Integration of Aviation Data into the R EcosystemPresent openSkies: the first R package for processing public air traffic data. The package provides an interface to resources in the OpenSky Network, standardized data structures to represent the different entities involved in air traffic data, and functionalities to analyze and visualize such data.
2022[103]Flight DNA: An Anonymized Aviation Data Tool and RepositoryIntroduces Flight DNA: a common database with anonymized data on aviation components, systems, technologies, and operations. It includes planning and analysis tools, and repository for aviation emissions, energy consumption, and performance profiles.
Publisher’s Note: MDPI stays neutral with regard to jurisdictional claims in published maps and institutional affiliations.

