
Aerodisk Effect on Hypersonic Boundary Layer Transition and Heat Transfer of HIFiRE-5 Vehicle

1
Key Laboratory of Traffic Safety on Track of Ministry of Education, School of Traffic & Transportation Engineering, Central South University, Changsha 410075, China
2
Joint International Research Laboratory of Key Technology for Rail Traffic Safety, Central South University, Changsha 410075, China
3
National & Local Joint Engineering Research Centre of Safety Technology for Rail Vehicle, Central South University, Changsha 410075, China
4
Research Institute of Aerospace Technology, Central South University, Changsha 410083, China
*
Authors to whom correspondence should be addressed.
Aerospace 2022, 9(12), 742; https://doi.org/10.3390/aerospace9120742
Submission received: 16 October 2022
/
Revised: 18 November 2022
/
Accepted: 21 November 2022
/
Published: 23 November 2022
(This article belongs to the Special Issue Hypersonics: Emerging Research)
Abstract
:The substantial aerodynamic drag and severe aerothermal loads, which are closely related to boundary layer transition, challenge the design of hypersonic vehicles and could be relieved by active methods aimed at drag and heat flux reduction, such as aerodisk. However, the research of aerodisk effects on transitional flows is still not abundant. Based on the improved k-ω-γ transition model, this study investigates the influence of the aerodisk with various lengths on hypersonic boundary layer transition and surface heat flux distribution over HIFiRE-5 configuration under various angles of attack. Certain meaningful analysis and results are obtained: (i) The existence of aerodisk is found to directly trigger separation-induced transition, moving the transition onset near the centerline upstream and widening the transition region; (ii) The maximum wall heat flux could be effectively reduced by aerodisk up to 52.1% and the maximum surface pressure can even be reduced up to 80.4%. The transition shapes are identical, while the variety of growth rates of intermittency are non-monotonous with the increase in aerodisk length. The dilation of region with high heat flux boundary layer is regarded as an inevitable compromise to reducing maximum heat flux and maximum surface pressure. (iii) With the angle of attack rising, first, the transition is postponed and subsequently advanced on the windward surface, which is in contrast to the continuously extending transition region on the leeward surface. This numerical study aims to explore the effects of aerodisk on hypersonic boundary layer transition, enrich the study of hypersonic flow field characteristics and active thermal protection system considering realistic boundary layer transition, and provide references for the excogitation and utilization of hypersonic vehicle aerodisk.
1. Introduction
In recent years, the attention of international research has been attracted by hypersonic vehicles owing to its fast flight speed and high penetration success rate [1]. With decades of explorations, the configurations of hypersonic vehicle have been greatly enriched, and an extensive range of flight tests has been implemented. However, few of these tests achieved success owing to the inaccurate evaluation of extremely complicated characteristics of the flow field without boundary layer transition focused upon [2,3,4].
The flow transition indicates the transformation of flow from stable and methodical laminar to shambolic turbulence, which is interrelated closely with the flow field characteristics around the vehicle and remains a key question for hypersonic vehicles [5]. Furthermore, as the heat flux and friction drag in the turbulent boundary layer can be several times that in laminar, considering the peak heat flux generally emerges in the transition region, the drag reduction, and the thermal protection system of hypersonic vehicles also depends on the boundary layer transition in a great measure. In addition, as known, the fuel consumption is closely related to the drag overcoming and payload. Consequently, the accurate prediction and regulation of boundary layer transition are eagerly demanded for designing hypersonic vehicles and promoting properties, that is, reducing drag and heat flux, decreasing fuel wastage, and elevating payload [6]. NASA also emphasized in CFD (Computational Fluid Dynamics) Vision 2030 Study that, in the design and analysis of aerospace systems, accurate prediction of transition is still a key scientific problem and direction of CFD until 2030 [7]. Accordingly, in the sphere of CFD, based on the wind tunnel experiments and the flight tests, some transition models have been constructed, among which the k-ω-γ transition model established by Wang and Fu [8,9,10] was regarded as an effective predicting hypersonic transition model. Thereafter, the k-ω-γ transition model has been improved and rectified by some researchers for the enhanced capability and better accuracy of transition prediction [11,12].
Furthermore, considering the severe aerodynamic heat and drag caused by the hypersonic condition and strong bow shock, drag and heat flux reduction has been regarded as a crucial question [13]. At present, based on the blunt body, which is recognized as the typical configuration for thermal protection [14], several active methods aiming at drag and heat flux reduction have been developed, including aerodisk, reverse/lateral jet, energy deposition and windward cavity, and their certain combination schemes [15,16,17,18,19]. Among them, the aerodisk, which is deemed as one of the most effective methods [20] and has been successfully applied to the Trident missile and Russian 51T6 long-range interceptor missile [21]. The efficiency of drag and thermal reduction of aerodisk depends on numerous factors, including geometrical parameters, freestream conditions, and the characteristics of flow field [22]. Ahmed and Qin [23], Sun et al. [24], Huang et al. [25], and Karimi Mohammad [26] have reviewed and discussed comprehensively the effect factors of capabilities of aerodisk drag and thermal reduction, and indicated that heightened attention should be paid on the aerodisk length [27] (L) and angle of attack [28,29,30,31] (α). This conclusion has been confirmed by several studies. For instance, Crowford et al. [32] discovered that both the drag and heat flux of a blunted head decreased with a raise in the ratio of aerodisk length (L) and diameter of blunt body (D). Huang et al. [33] found that the reduction in drag of the blunt body is proportional to the length and diameter of the aerodisk. Fan and Huang [34] discovered that, with the increase of the L, the change rates of drag, pressure, heat flux, and temperature decreased gradually. Kalimuthu et al. [35] demonstrated that the influence of α on the aerodisk drag reduction behavior was extremely apparent. The drag coefficient was stable with small α, and then increased sharply once α is larger than 3°, with the difference being up to 2–3 times.
Unfortunately, nearly all studies on the aerodisk mentioned above are based on turbulent flows, while the boundary layer transition, which is crucial for heat flux, has nearly been ignored. The boundary layer transition is inevitable during the hypersonic voyage; however, the specific influence of aerodisk upon boundary layer transition still remains unknown, which is a major obstacle for the design and optimization of aerodisk. As the aerodisk is more and more widely used in designing hypersonic vehicle, it is necessary to explore the effect of aerodisk on the boundary layer transition.
Therefore, in this paper, the hypersonic transitional flows over HIFiRE-5 vehicle with and without aerodisk were compared and expounded in detail based on the improved k-ω-γ transition model. The purpose of this study is to reveal the effect of aerodisk on hypersonic boundary layer transition, particularly the effect of aerodisk length and angle of attack, to enrich the comprehension of hypersonic flow field characteristics and active thermal protection system with consideration of a realistic boundary layer transition, and provide references for the excogitation and utilization of the hypersonic vehicle aerodisk.
2. Transition Model
This study employed the improved k-ω-γ transition model to perform calculations. The original k-ω-γ transition model, established by Wang and Fu [8,9,10], has been validated for the hypersonic boundary layer transition prediction. Zhou et al. [11] improved this model aiming at the construction of cross-mode unstable disturbance, Reynolds number correction, and nosetip bluntness correction. Zhao et al. [12] further extended the model for separation-induced transition prediction and successfully applied it to the complex configuration [36]. The framework of the improved k-ω-γ transition model is expressed as:
where ρ represents density, k denotes turbulent kinetic energy, and ω is the specific turbulence dissipation rate. μeff refers to effective viscosity, which represents the superposition of non-turbulent viscosity and turbulent fluctuation viscosity, expressed as:
where non-turbulent viscosity μnt is directly correlated to boundary layer unstable models. The linear stability theory states that the boundary layer unstable model is dominated by first mode unstable disturbance when the velocity at the outer margin of boundary layer is relatively low. In contrast, in high speed, high order models dominated by second mode unstable disturbance emerge with a supersonic boundary layer compared to phase velocity. Thus, μnt is expressed as:
where sgn(x) = |x|/x is the sign function, and the local relative Mach number Mrel = (U-cr)/c can differentiate the region where the second mode unstable disturbance is prominent. U is freestream velocity. cr and c are disturbance wave phase velocity and local acoustic velocity representatively.
Pγ and Dγ are the production and destruction terms of the intermittency factors transport equation, respectively, with construction based on dimensional analysis, and are expressed as:
where Fonset is the equation of transition onset, d represents the distance to nearest wall surface, μ stands for the molecular dynamic viscosity coefficient, Eu is the average kinetic energy of local fluid relative to wall surface, Ci is model constant, and ζeff_mod is the amended effective length scale constructed by:
where fss is a damping function considering the relation between the timescales of molecular diffusion and rapid pressure–strain, and Css is a constant. Simultaneously, based on the constructed ζeff, the characteristic timescale of first mode unstable disturbance, second mode unstable disturbance, and cross-mode unstable disturbance are expressed as:
where ReCF indicates the crossflow Reynolds number, ωmax is the largest crossflow velocity in the boundary layer, δ is the thickness of the boundary layer, and γg represents the specific heat ratio. Furthermore, considering the influence of pressure gradient in separation-induced transition, the pressure gradient parameter (λζ) is proposed as:
Thus, the effective intermittency is constructed as:
where the γsep is the separation intermittency based on λζ, Freattach is the control function precenting flow reattachment, and Fθt is the blending function that confines the modification inside boundary layer flows.
With the consideration of the discretization, the inviscid fluxes are discretized by the Roe upwind scheme with second order MUSCL reconstruction and minmod limiter, and the second order central difference scheme is employed for viscous fluxes. This study employed the LUSGS scheme for time marching in order to attain numerical stability.
3. Computational Details
3.1. HIFiRE-5 Configuration and Freestream Conditions
The initial goal of the HIFiRE-5 Vehicle experiment was to attain the data and rules of transition and turbulent boundary layer heat transfer on an elliptical blunt cone [37]. The HIFiRE-5 configuration in this study was set to 0.381 times scale experimental configuration in a Boeing/AFOSR Mach 6 wind tunnel by Juliano et al. [38]. Furthermore, the length from nosetip to base of the configuration after scaling is 328 mm, the semimajor axis of the base surface was 82 mm, and the semiminor axis of the base surface was 41 mm. The nosetip semiminor axis was 0.95 mm maintaining an elliptical cross-section with 2:1 ratio to the base surface. In addition, the half cone angle was 7 degrees. The freestream condition is presented in Table 1.
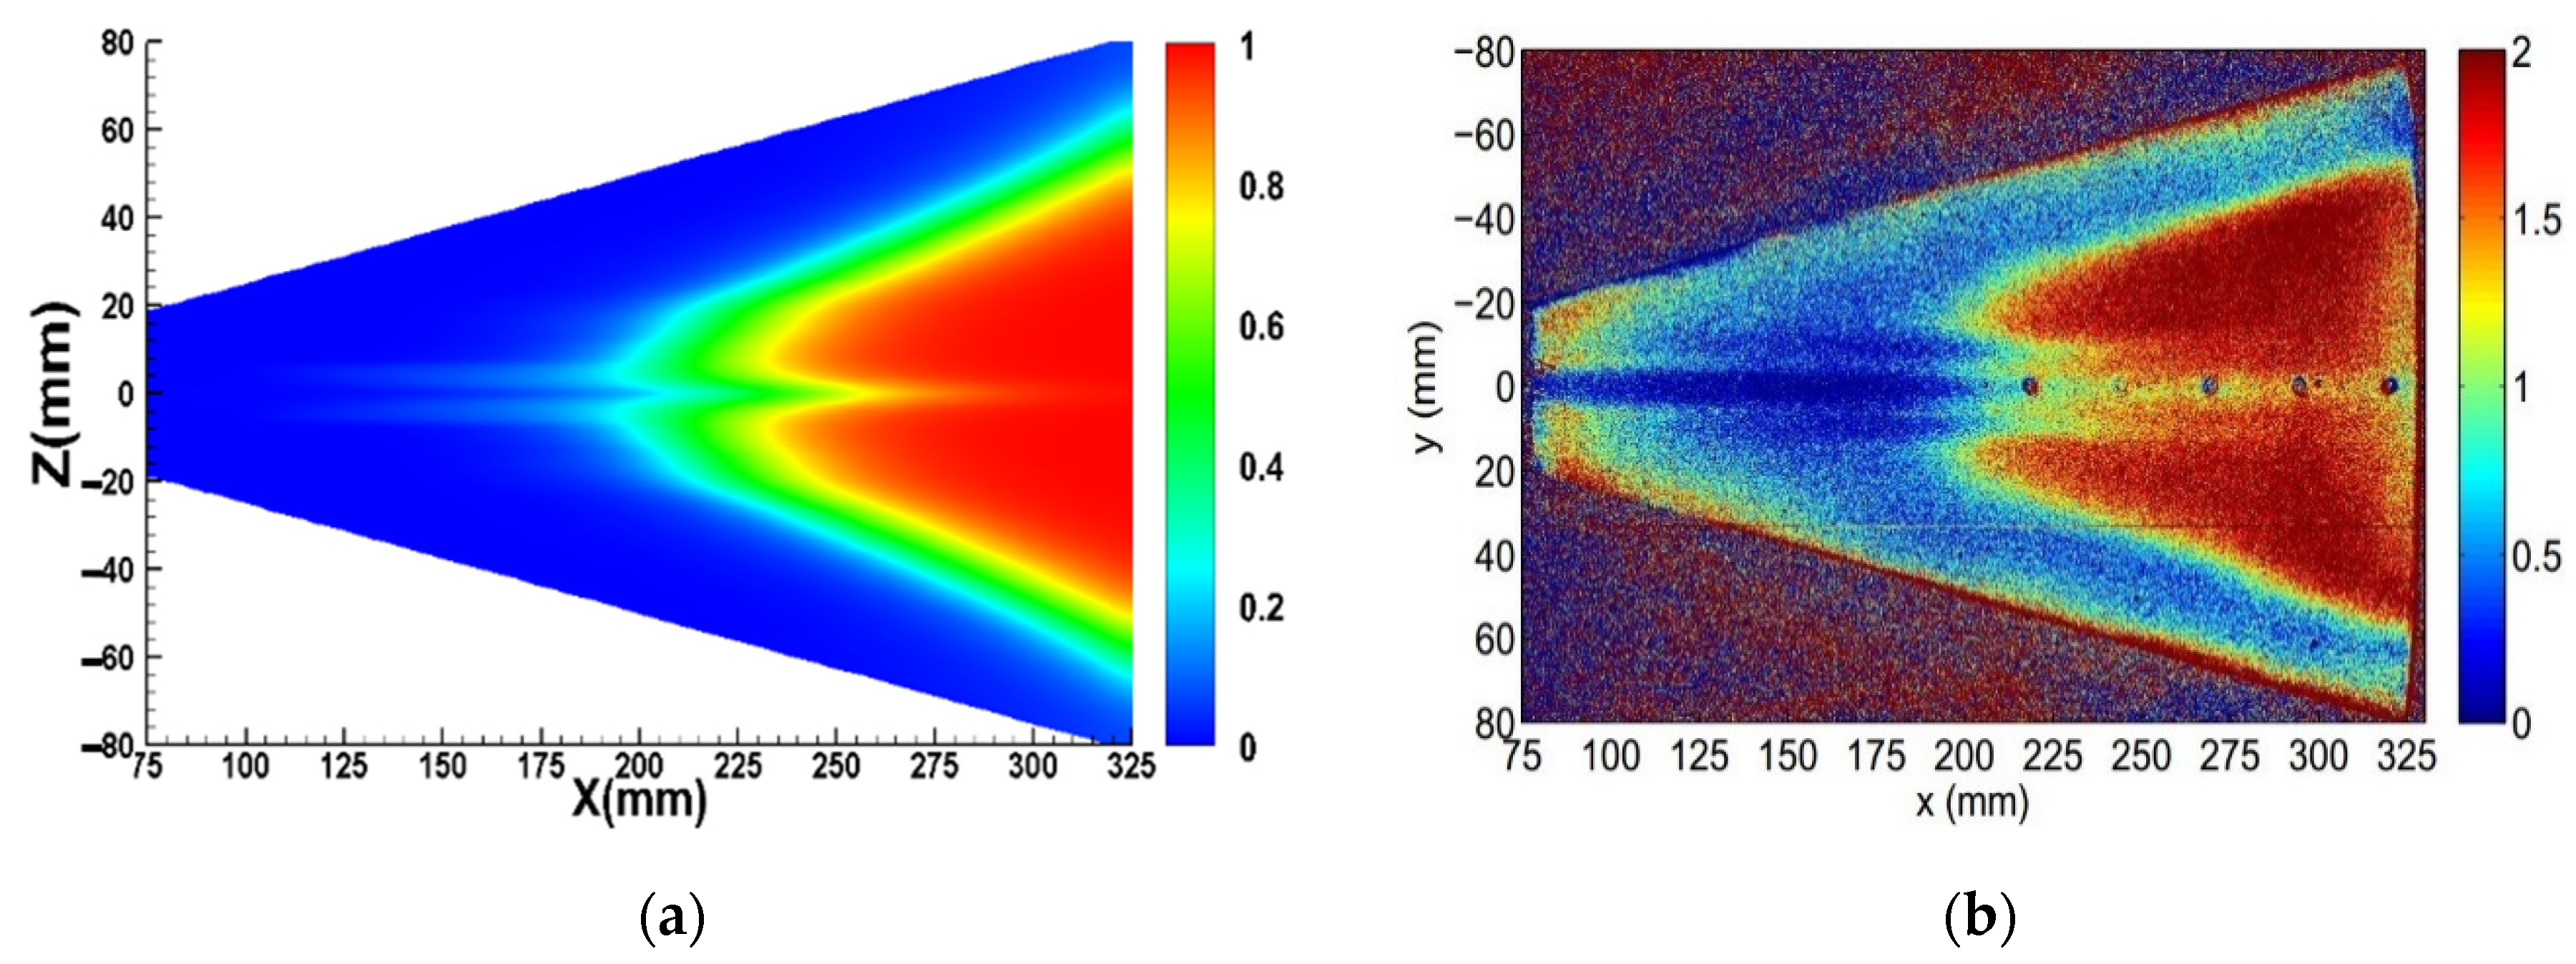
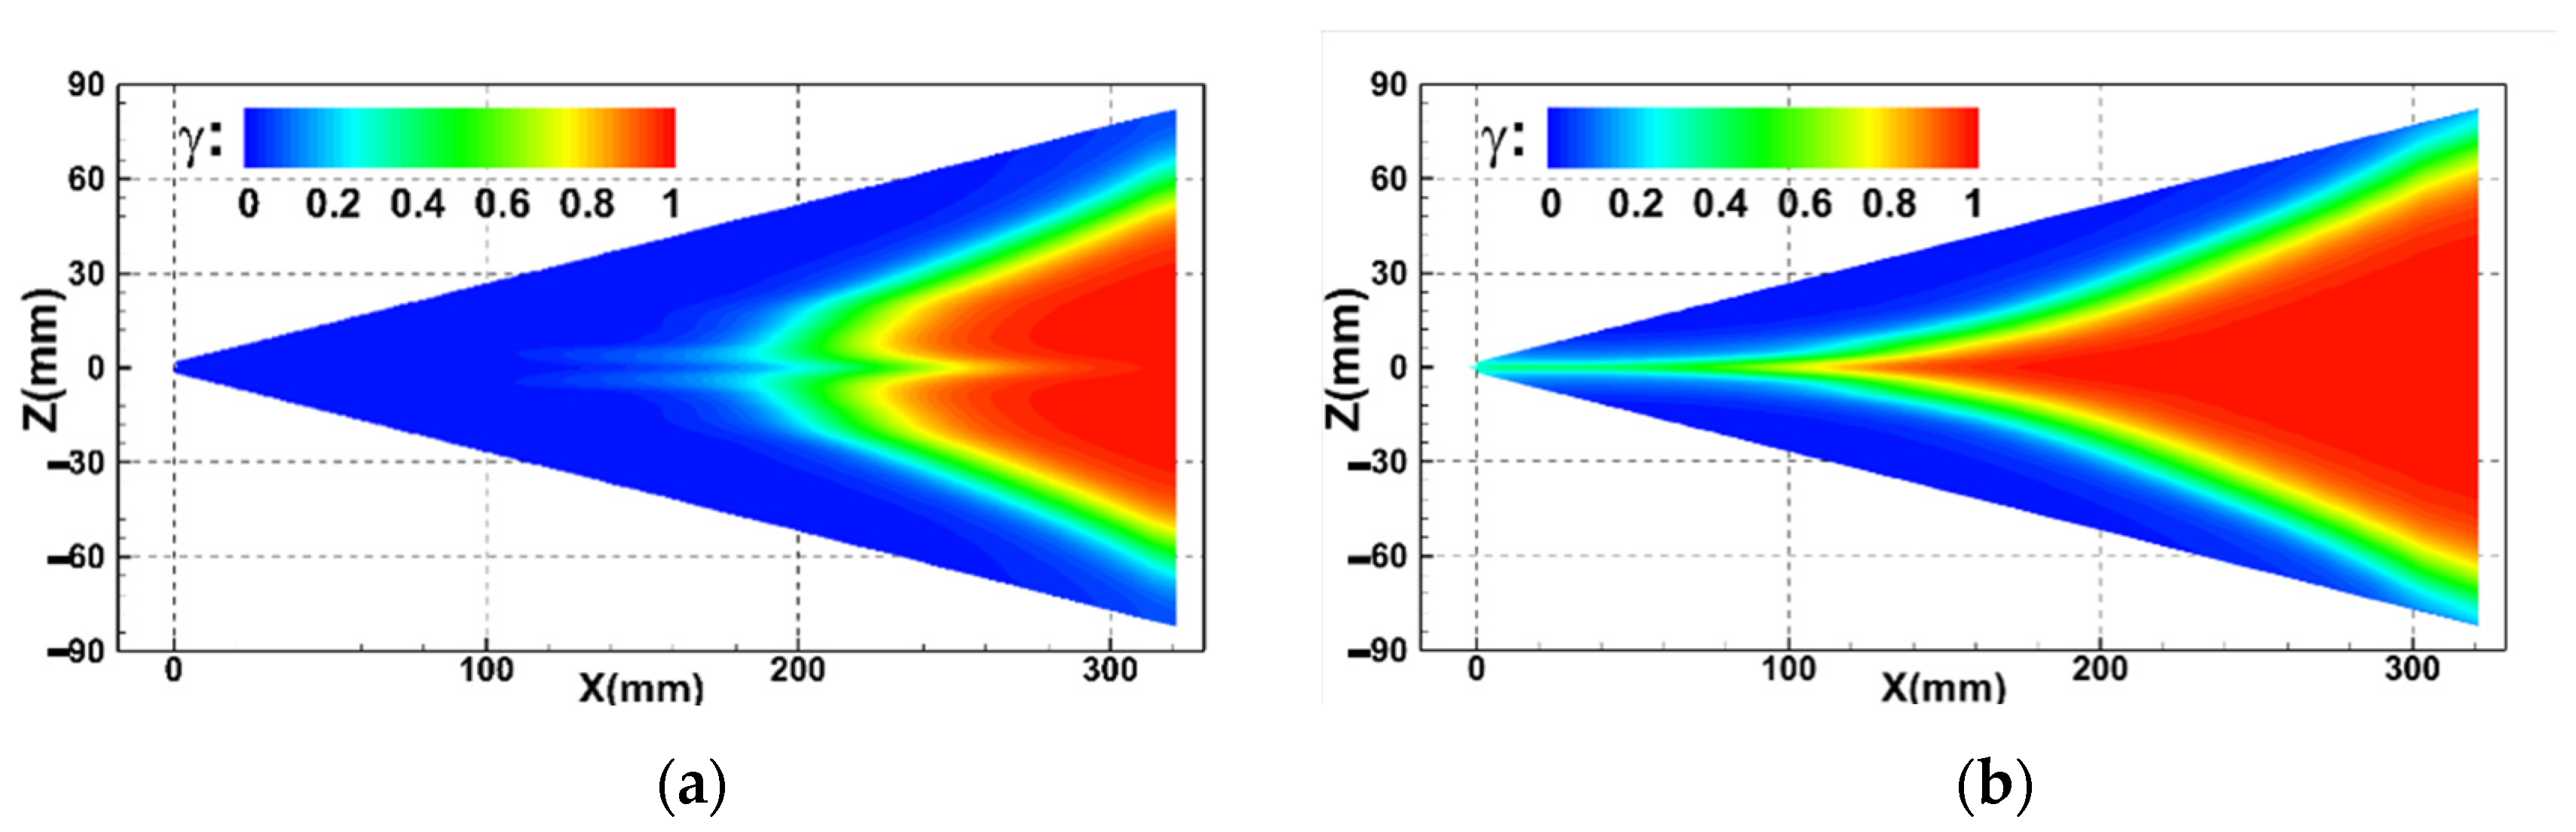
Figure 1a shows the distribution of wall intermittency (γ), whose value of 0 indicates laminar, and the value of 1 indicates turbulence. Figure 1b delineates the experimental results based on Temperature-Sensitive Paint (TSP), which enables a global measurement of the temperature distribution and detection of the transition front. It should be emphasized that different variables presented in Figure 1a,b lead to different numerical ranges in two figures. However, the transition onset is defined as either the position where the wall temperature starts to increase remarkably or the position with intermittency starting to deviate zero [8,38]. Therefore, both TSP and γ results can describe the boundary layer transition, which means that the similar distributions of TSP and γ represent the same boundary layer transition despite the different numerical ranges. It is evident that the boundary layer transition occurs both on the centerline and off the centerline, leading to a two-lobed transition front. The numerical simulation results of shape and position of transition onset were consistent with the experimental measurements in wind tunnel, verifying the validation of the improved k-ω-γ model.
3.2. HIFiRE-5 Model with Aerodisk
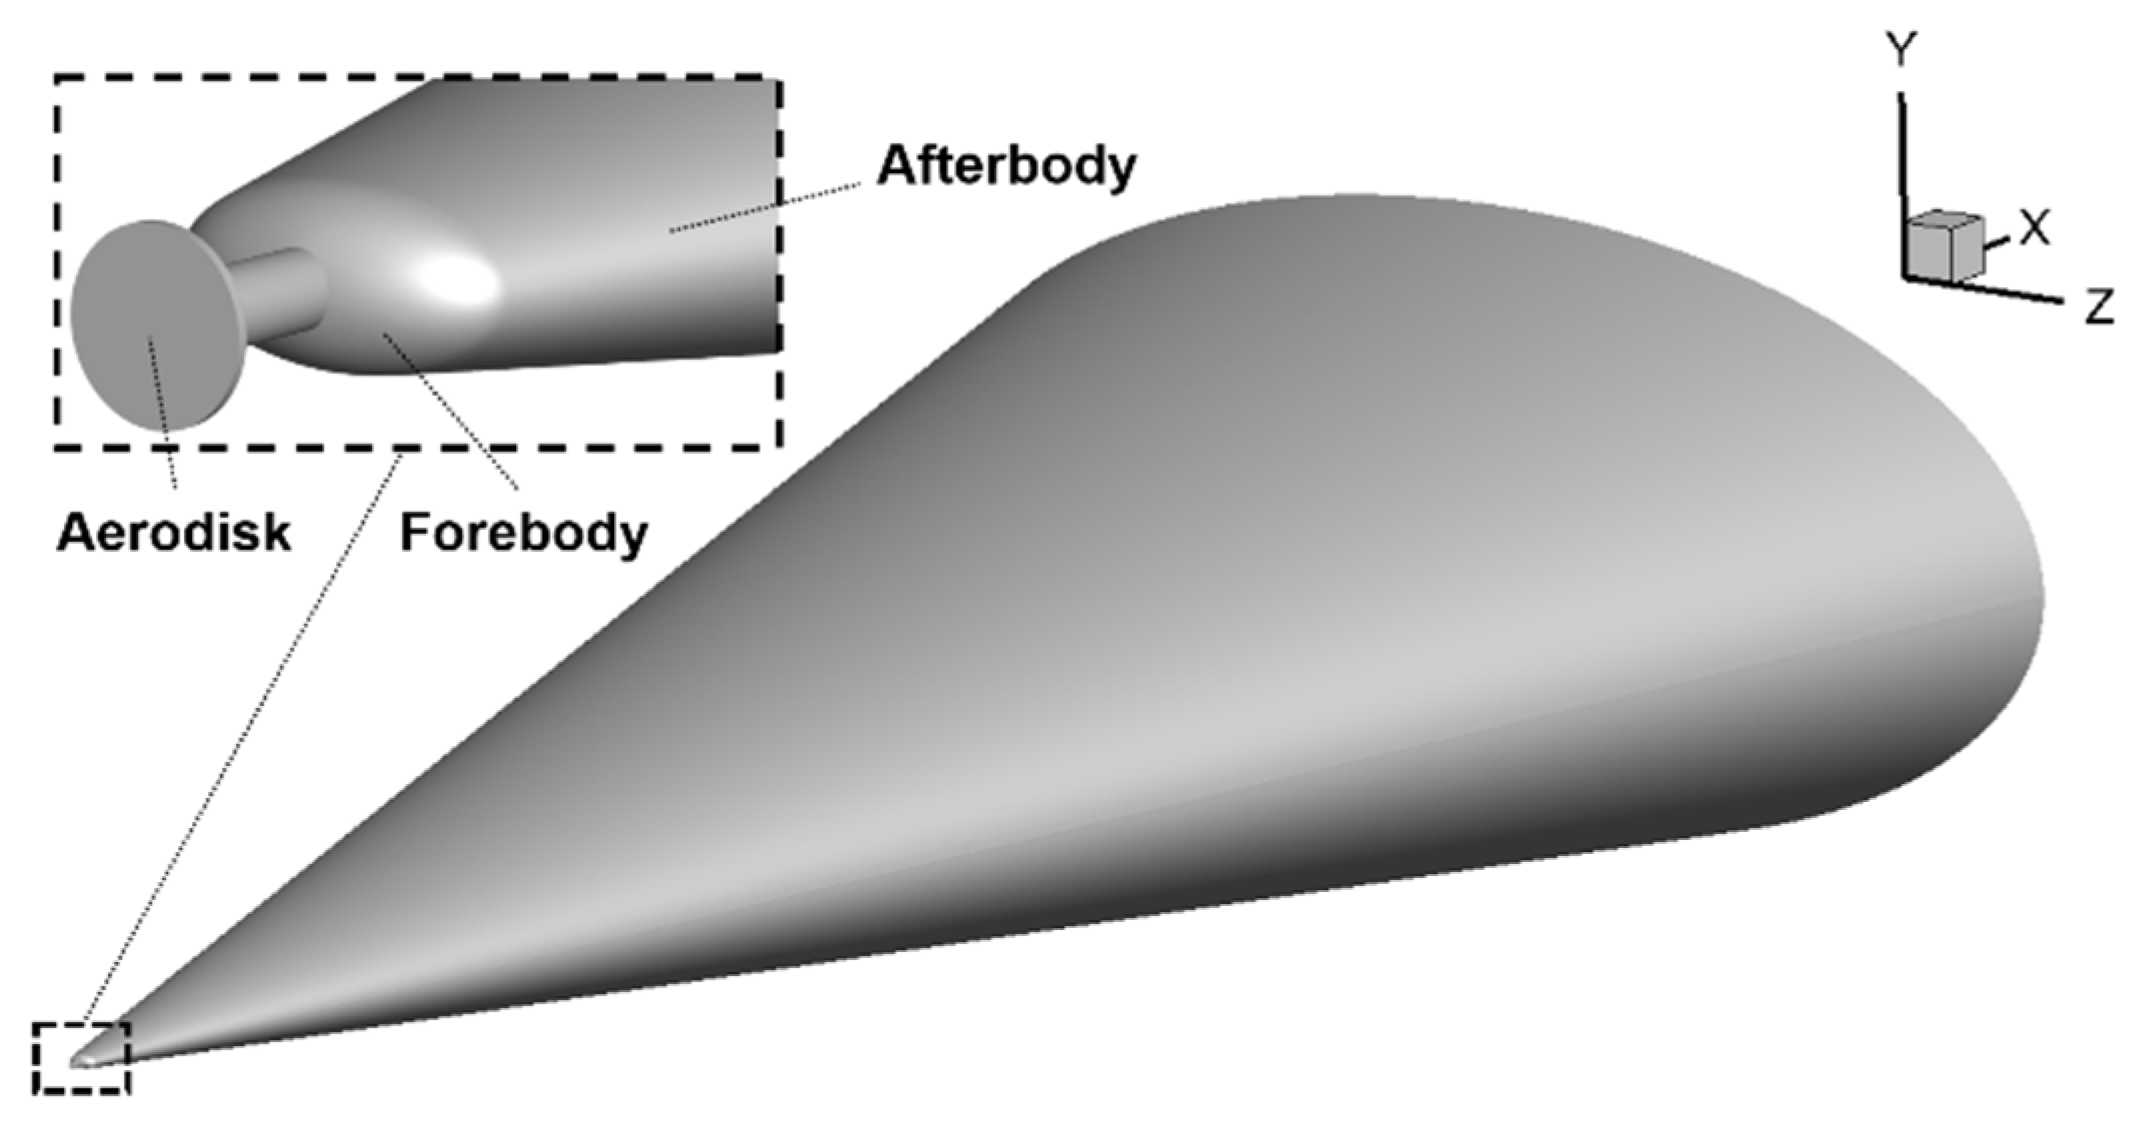
With the sphere center of blunt ellipsoid considered as the Cartesian coordinate origin, the nosetip semiminor and semimajor were 0.95 and 1.8 mm, respectively. Considering the large taper and small nosetip size of HIFiRE-5 configuration, the diameter of aerospike was set as 0.8 mm to gain a striking effect of drag and heat flux reduction after comparing several scales. Simultaneously, comprehensively considering wall heat flux and aerodynamic characteristics, five aerodisk lengths were opted for as L = 2, 4, 6, 8, and 12 mm to perform calculations, and the radius of the aerodisk was 1 mm. Figure 2 shows the model of the HIFiRE-5 configuration containing the forebody, the afterbody, and a 2 mm long aerospike with aerodisk.
3.3. Grid Sensitivity Analysis
On studying the optimal grid height of the first mesh cell off the wall (Δx) and the corresponding grid Reynolds number (ReΔx) in the numerical calculation of hypersonic aerodynamic heat flux, the influence of Δx on the wall heat flux was found to be much greater than that on the wall force. Consequently, Δx must comprehensively consider freestream conditions and wall temperature to simulate the heat flux rationally. In addition, the numerical experiments demonstrated that ReΔx ≈ 10 is appropriate for the reasonable prediction of aerodynamic heat flux [39].
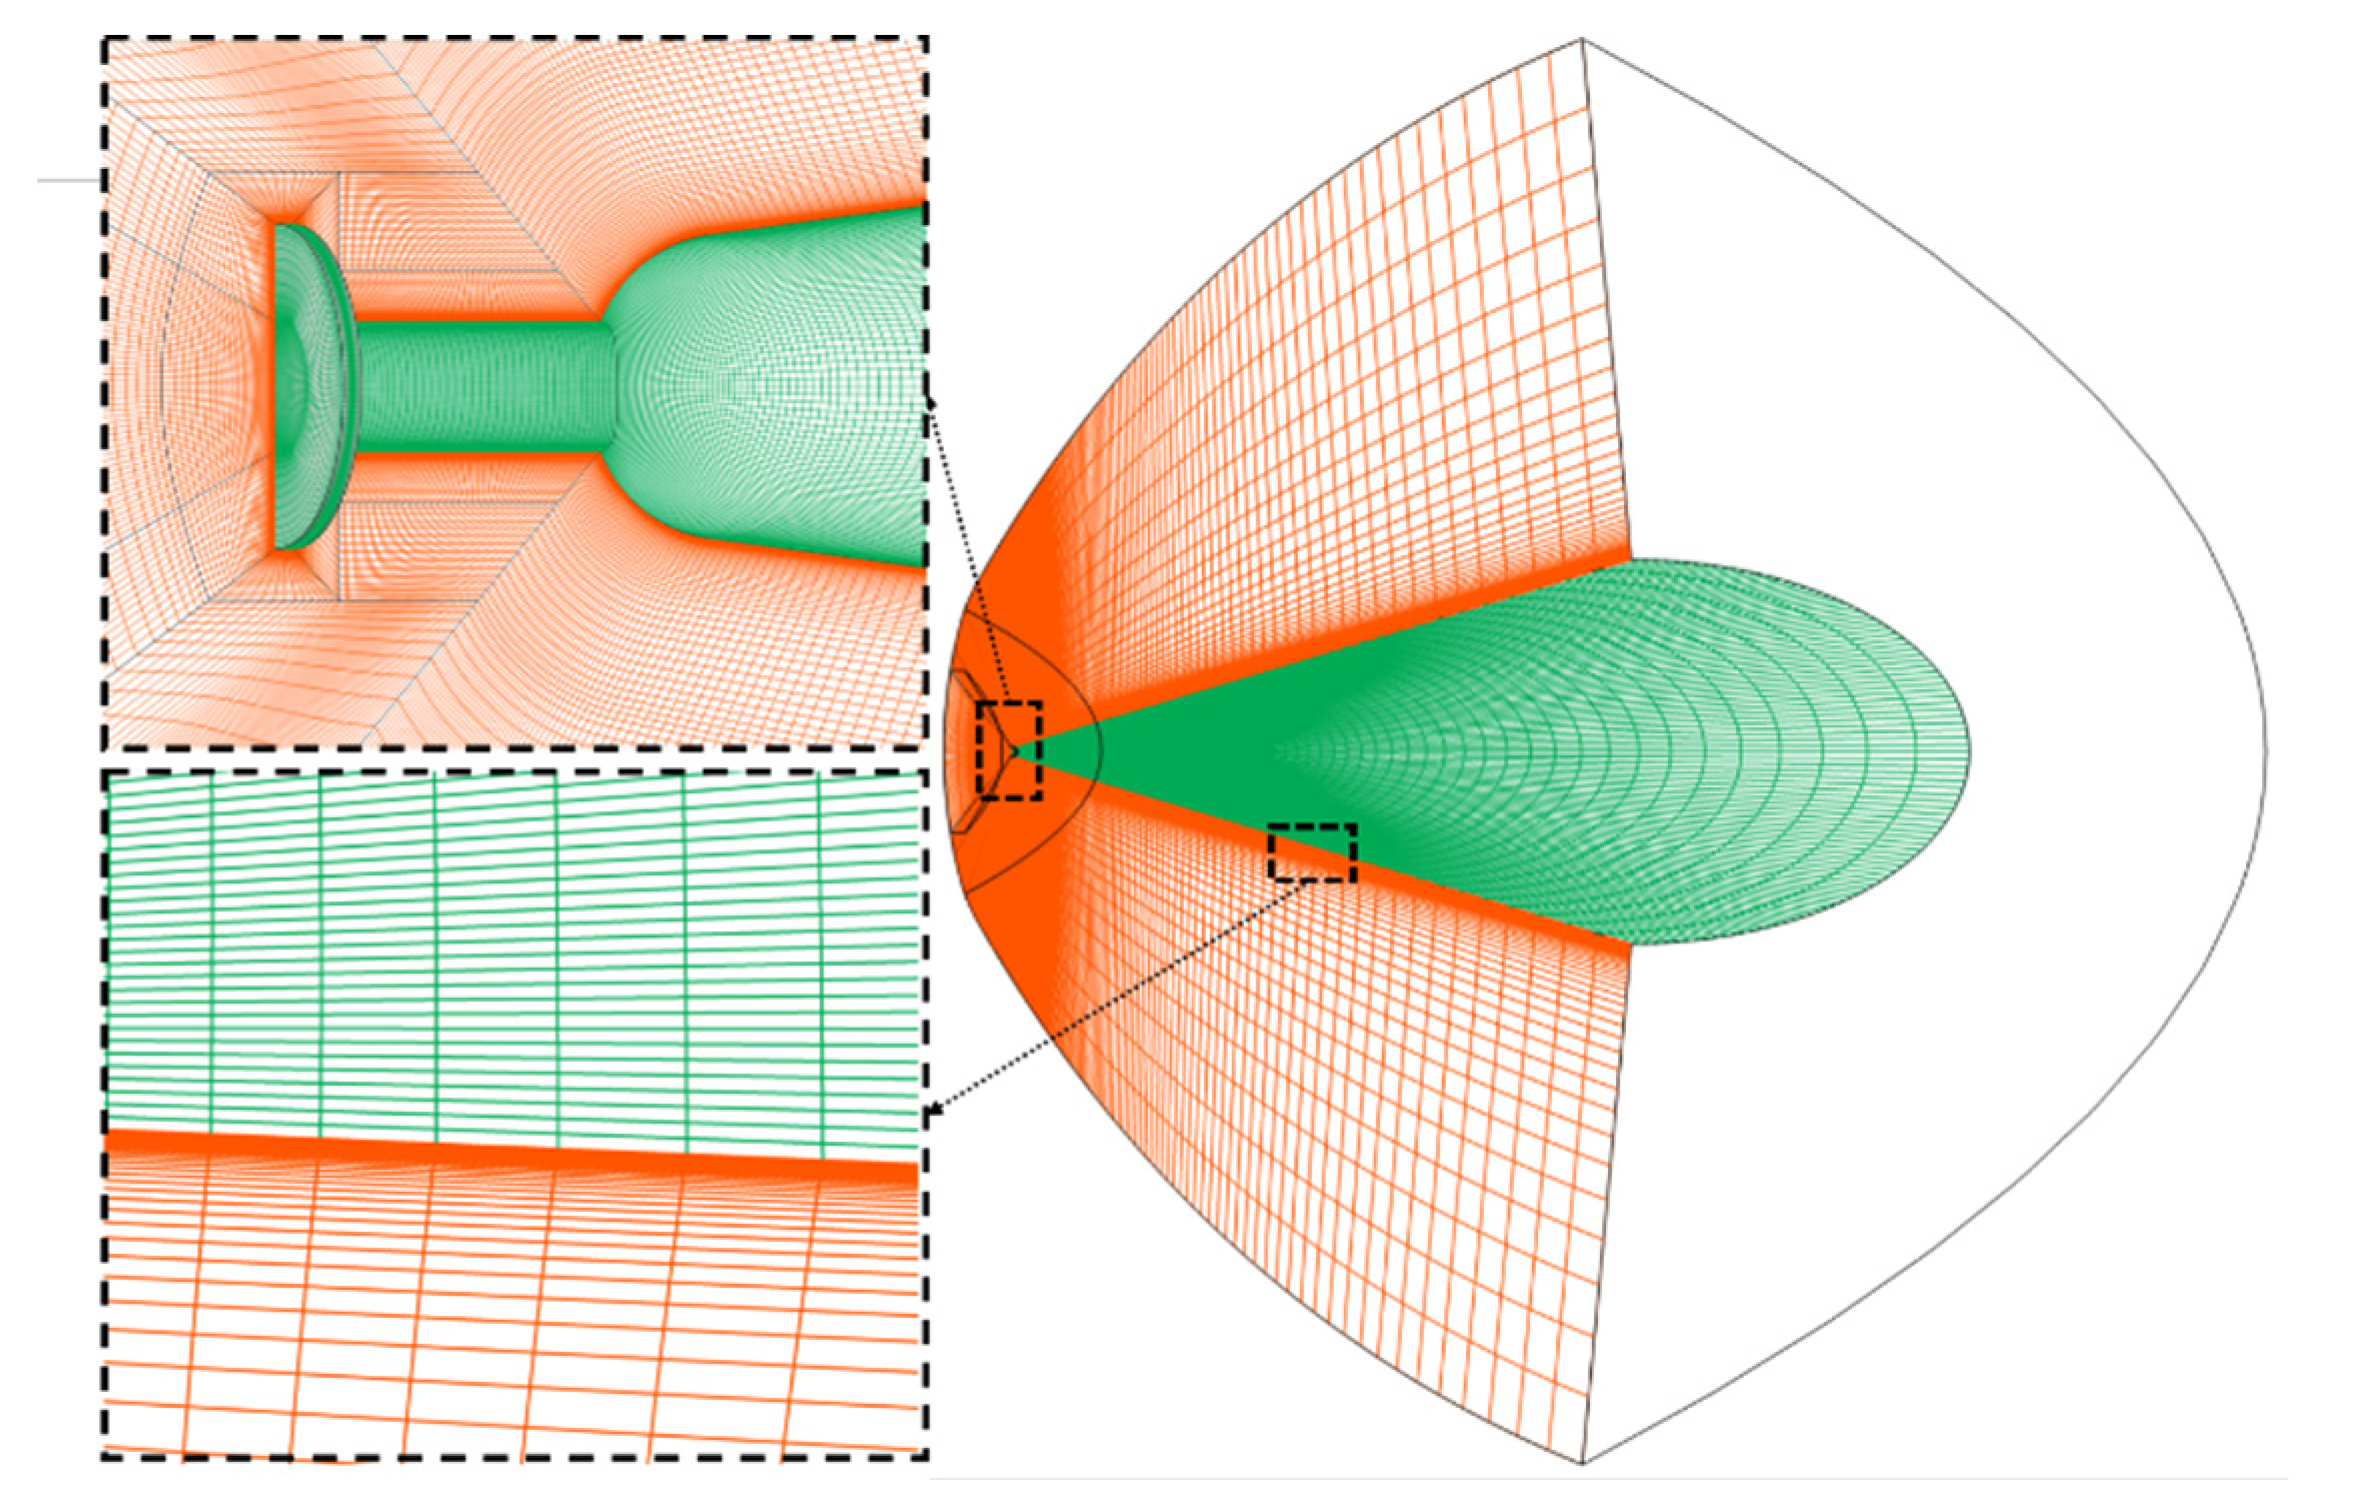
This study generated three multi-block structured grids (named G1~G3), and they were half-geometry meshes due to the flow symmetry. In order to capture the shock and recirculation zone, the meshes close to the aerodisk and solid wall are generated with elaborate refinement. Furthermore, Δx was generated based on non-dimensional parameter ReΔx ranging from 6 to 20. The details of three grids are tabulated in Table 2. The mesh on symmetry plane and wall surface, further offering the magnified sights of the aerodisk, nosetip, and the area near the wall are presented in Figure 3. The simulation freestream conditions were identical to the aforementioned conditions.
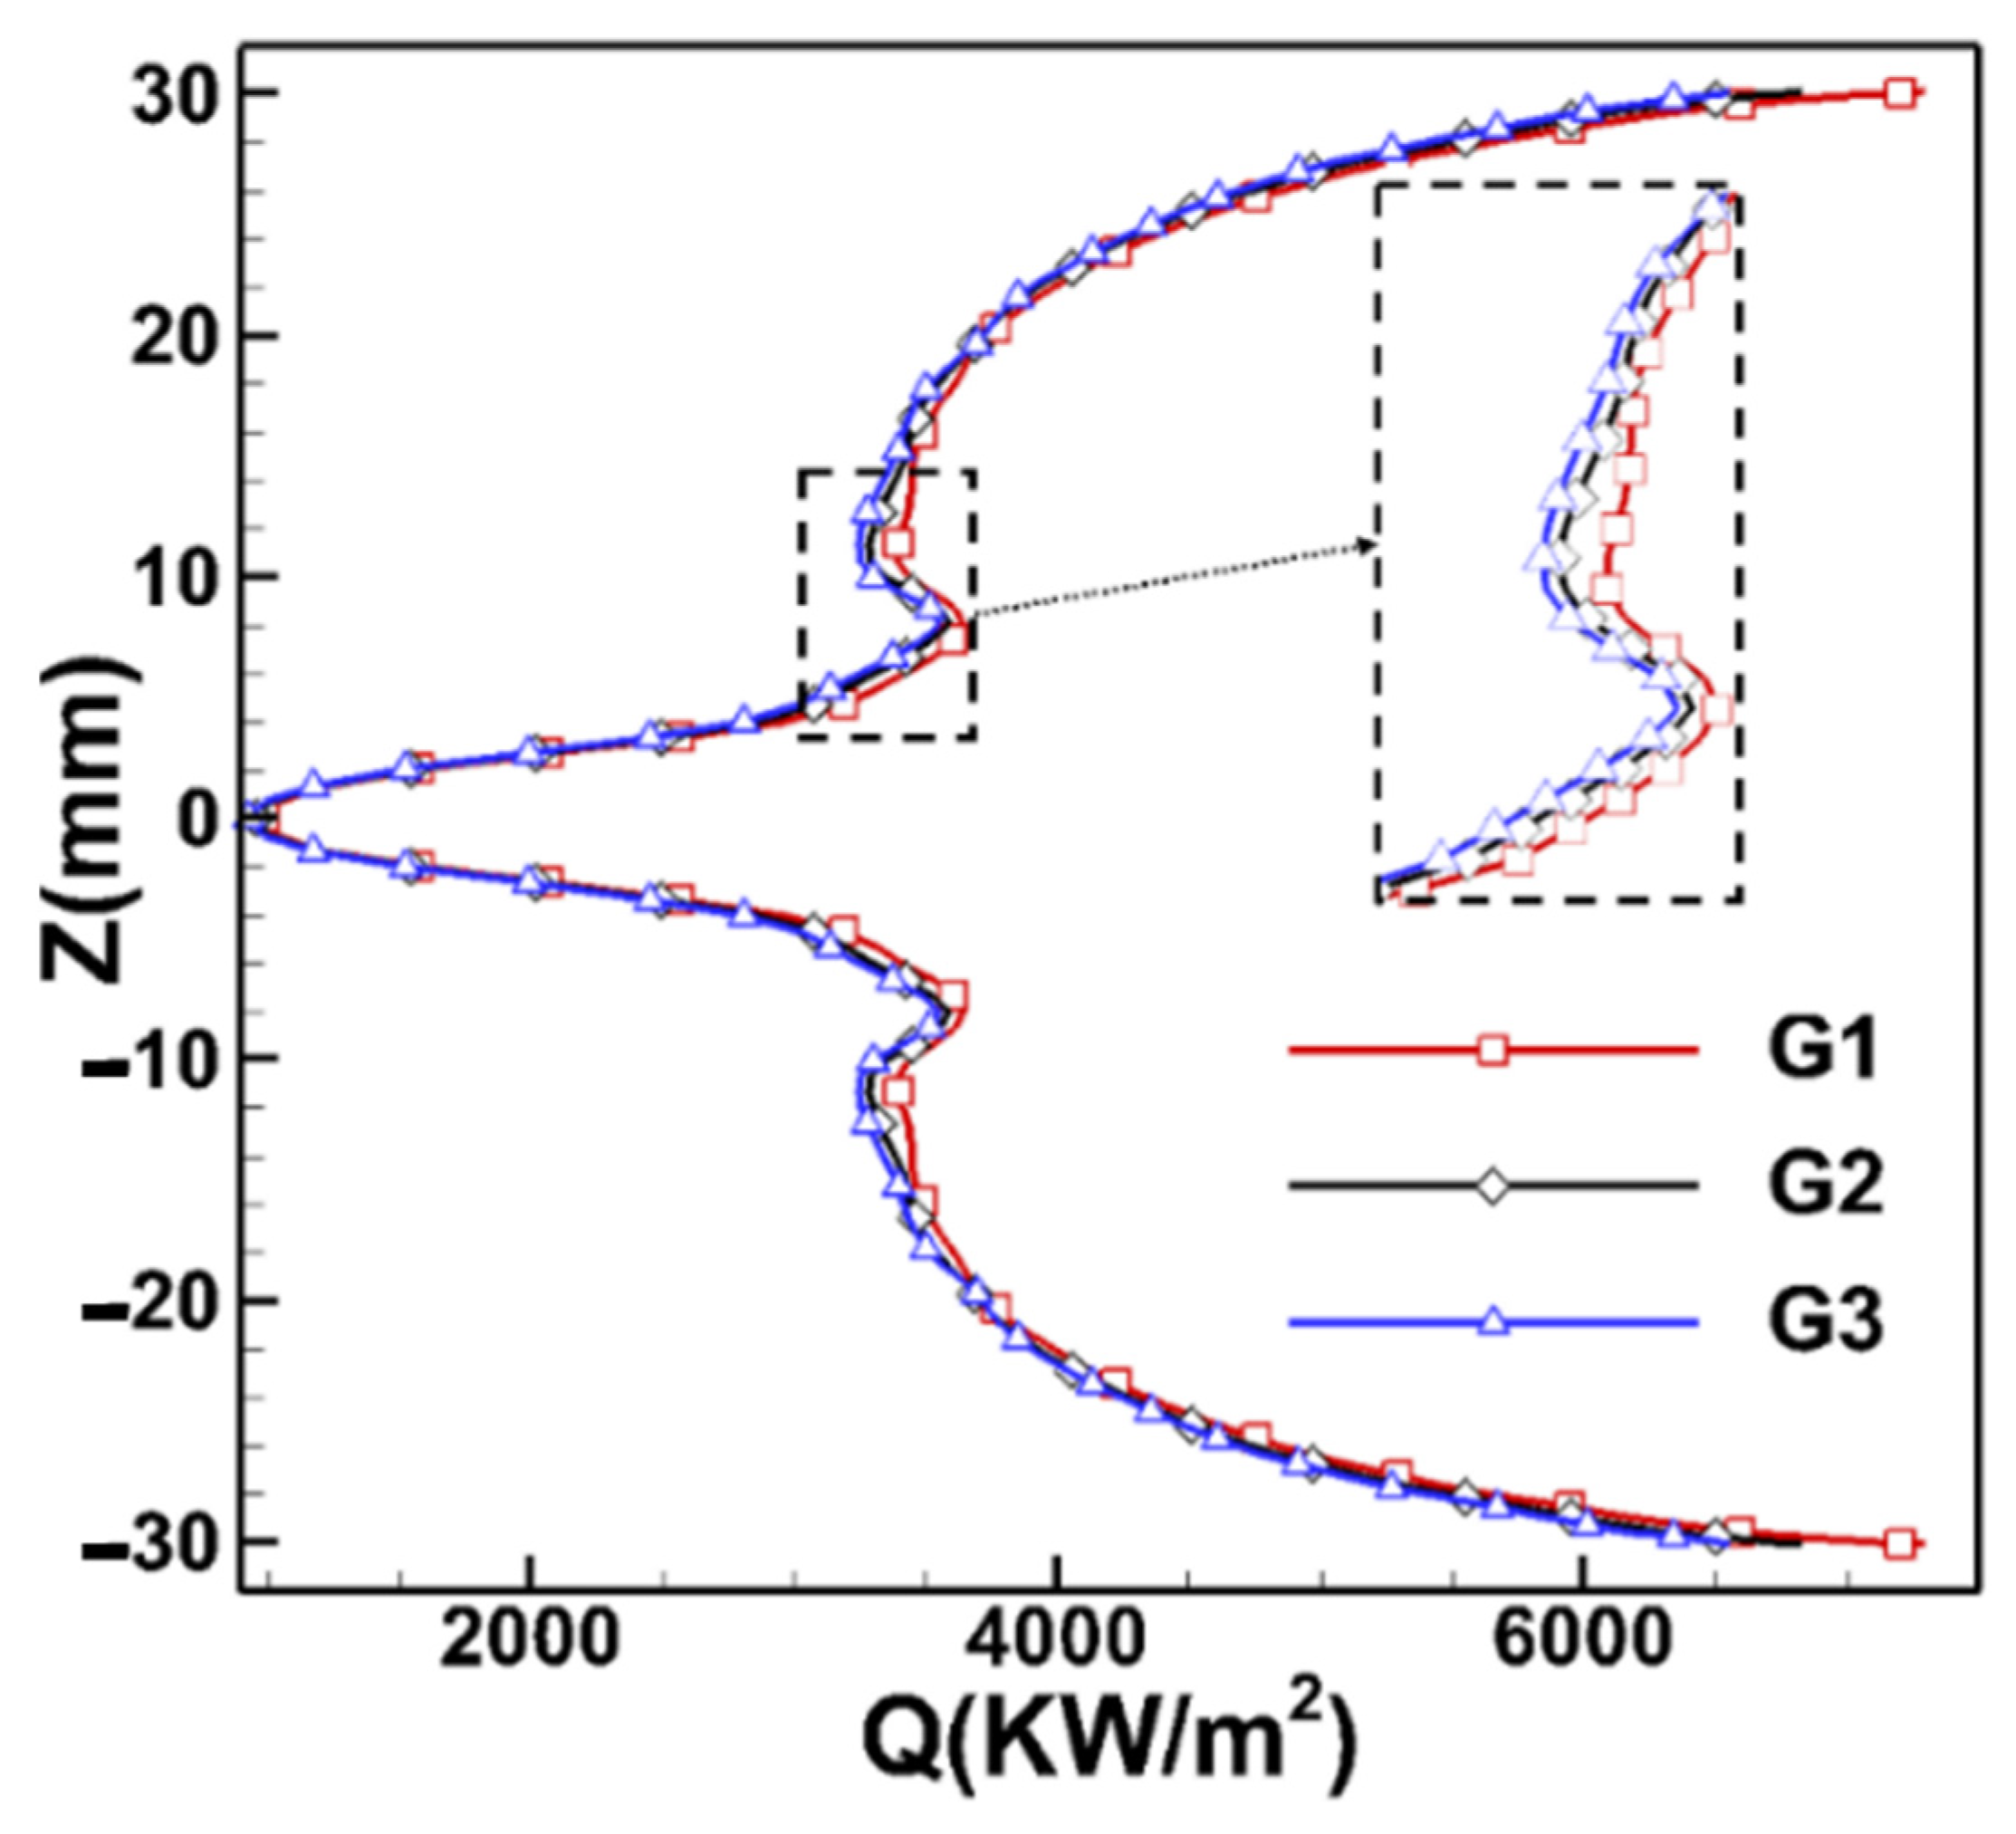
Figure 4 illustrates the distributions of blunt body wall heat flux for three types of grids standing at X = 120 mm. Grid G1 was abandoned due to the largest difference compared to other grids. Negligible discrepancies were observed in the numerical results calculated by grids G2 and G3, thus indicating that grid G2 has sufficient accuracy to assurance the mesh independency. Owing to the smaller number of meshes, the grid G2 was employed for the follow-up numerical simulations to economize the computing resources and time. In addition, considering the error accumulation, the ration coefficient Rs > 1.0 proposed by Smirnov et al. [40,41] was selected in the following cases.
4. Results and Discussion
4.1. Analysis of Basic Flow Field
A deep insight into the flow characteristics around a typical HIFiRE-5 configuration is the basis for further study. The Mach number contours of cross section perpendicular to the flow direction can be seen in Figure 5. Owing to the profile of the cross section of HIFiRE-5 configuration being elliptical, the intensity of conical shock wave is nonuniformly distributed under the hypersonic incoming flow condition. Furthermore, the angle of the surface deflection is different, thereby rendering a stronger shock wave near the side edge (x–z plane) that is closer to the surface than the shock wave near the centerline (x–y plane). Consequently, the spanwise pressure gradient is generated, which results in the crossflow with the streamlines deflecting from the side edge to the centerline. Eventually, a mushroom-shaped longitudinal vortex is generated along the centerline. Generally, the inflected point of the velocity profile in the boundary layer is generated owing to the longitudinal vortex structure, which leads to the boundary layer transition. Hence, the first and second unstable disturbances dominate the boundary layer transition of HIFiRE-5 configuration near the centerline, whereas in the area between the side edge and centerline, the cross-mode disturbance has a leading role.
4.2. Influence of the Aerodisk
The comparison of wall intermittency (γ) distribution of the HIFiRE-5 configuration without an aerodisk and with a 2 mm long aerodisk could be seen in Figure 6. It is evident that the existence of aerodisk results in the transition onset near the centerline moving forward considerably, and broadens the overall transition range.
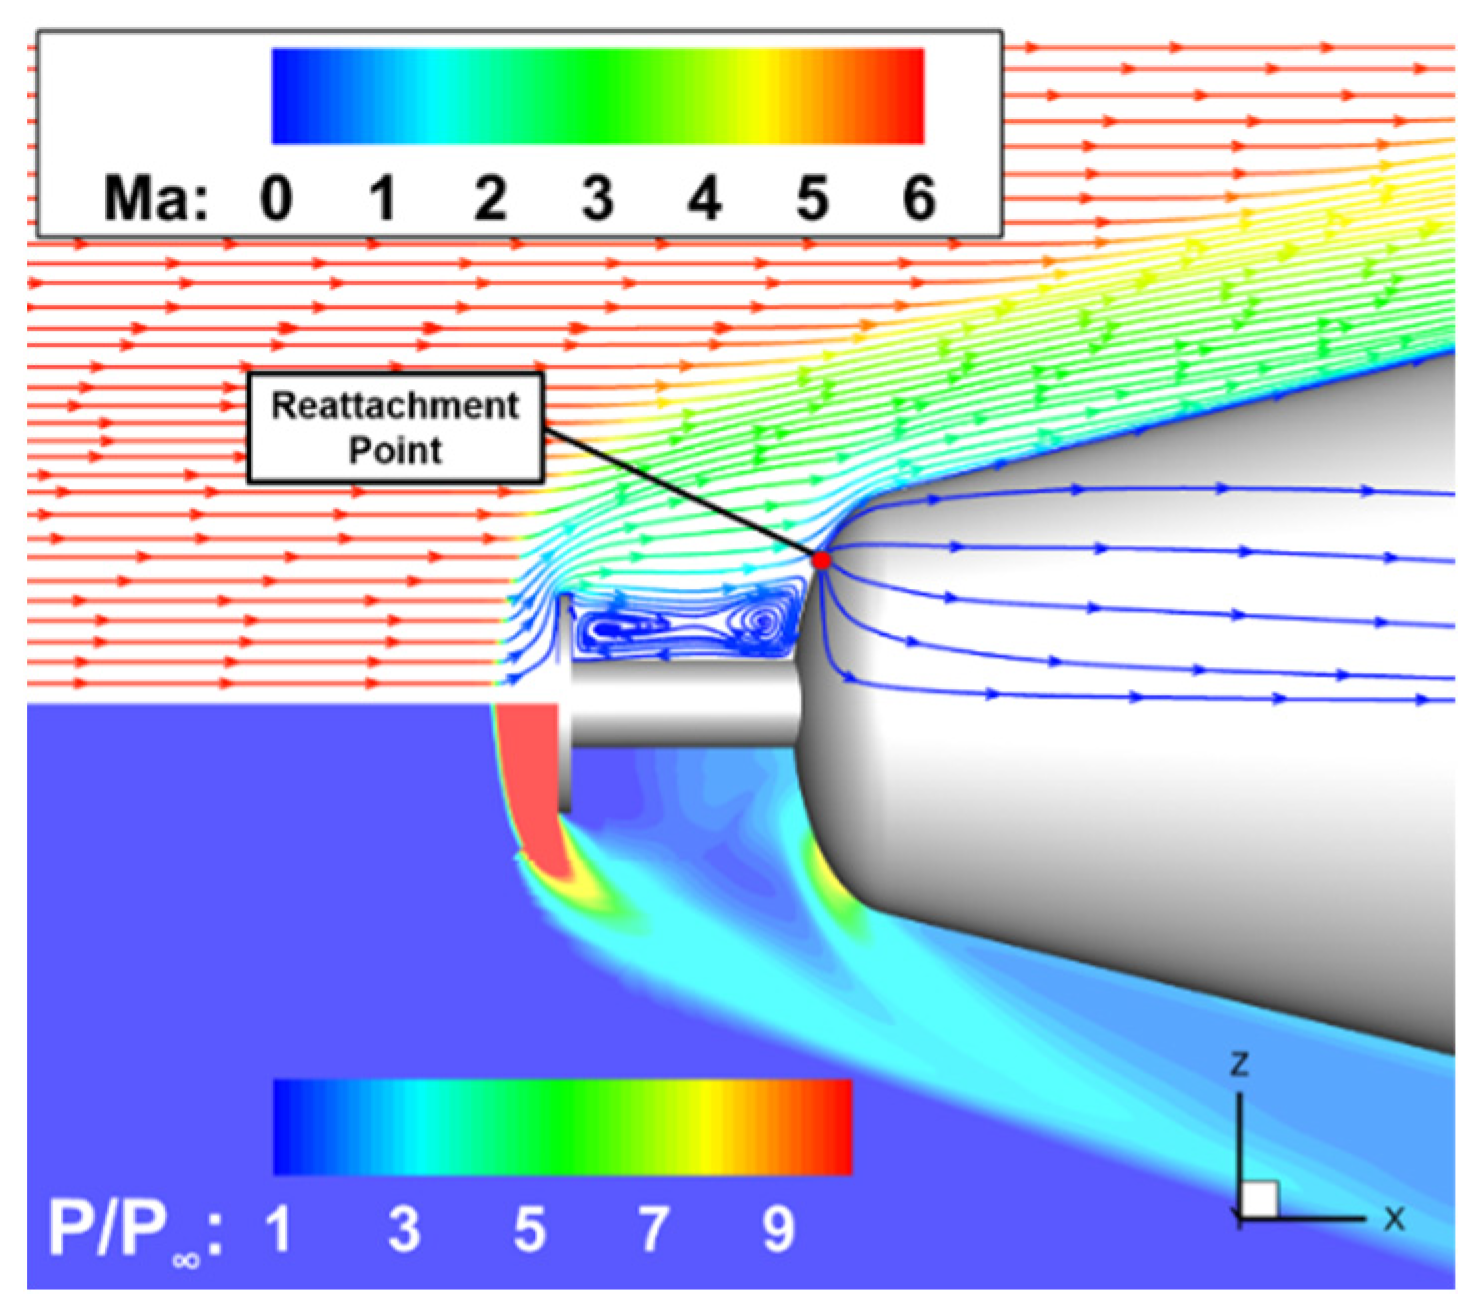
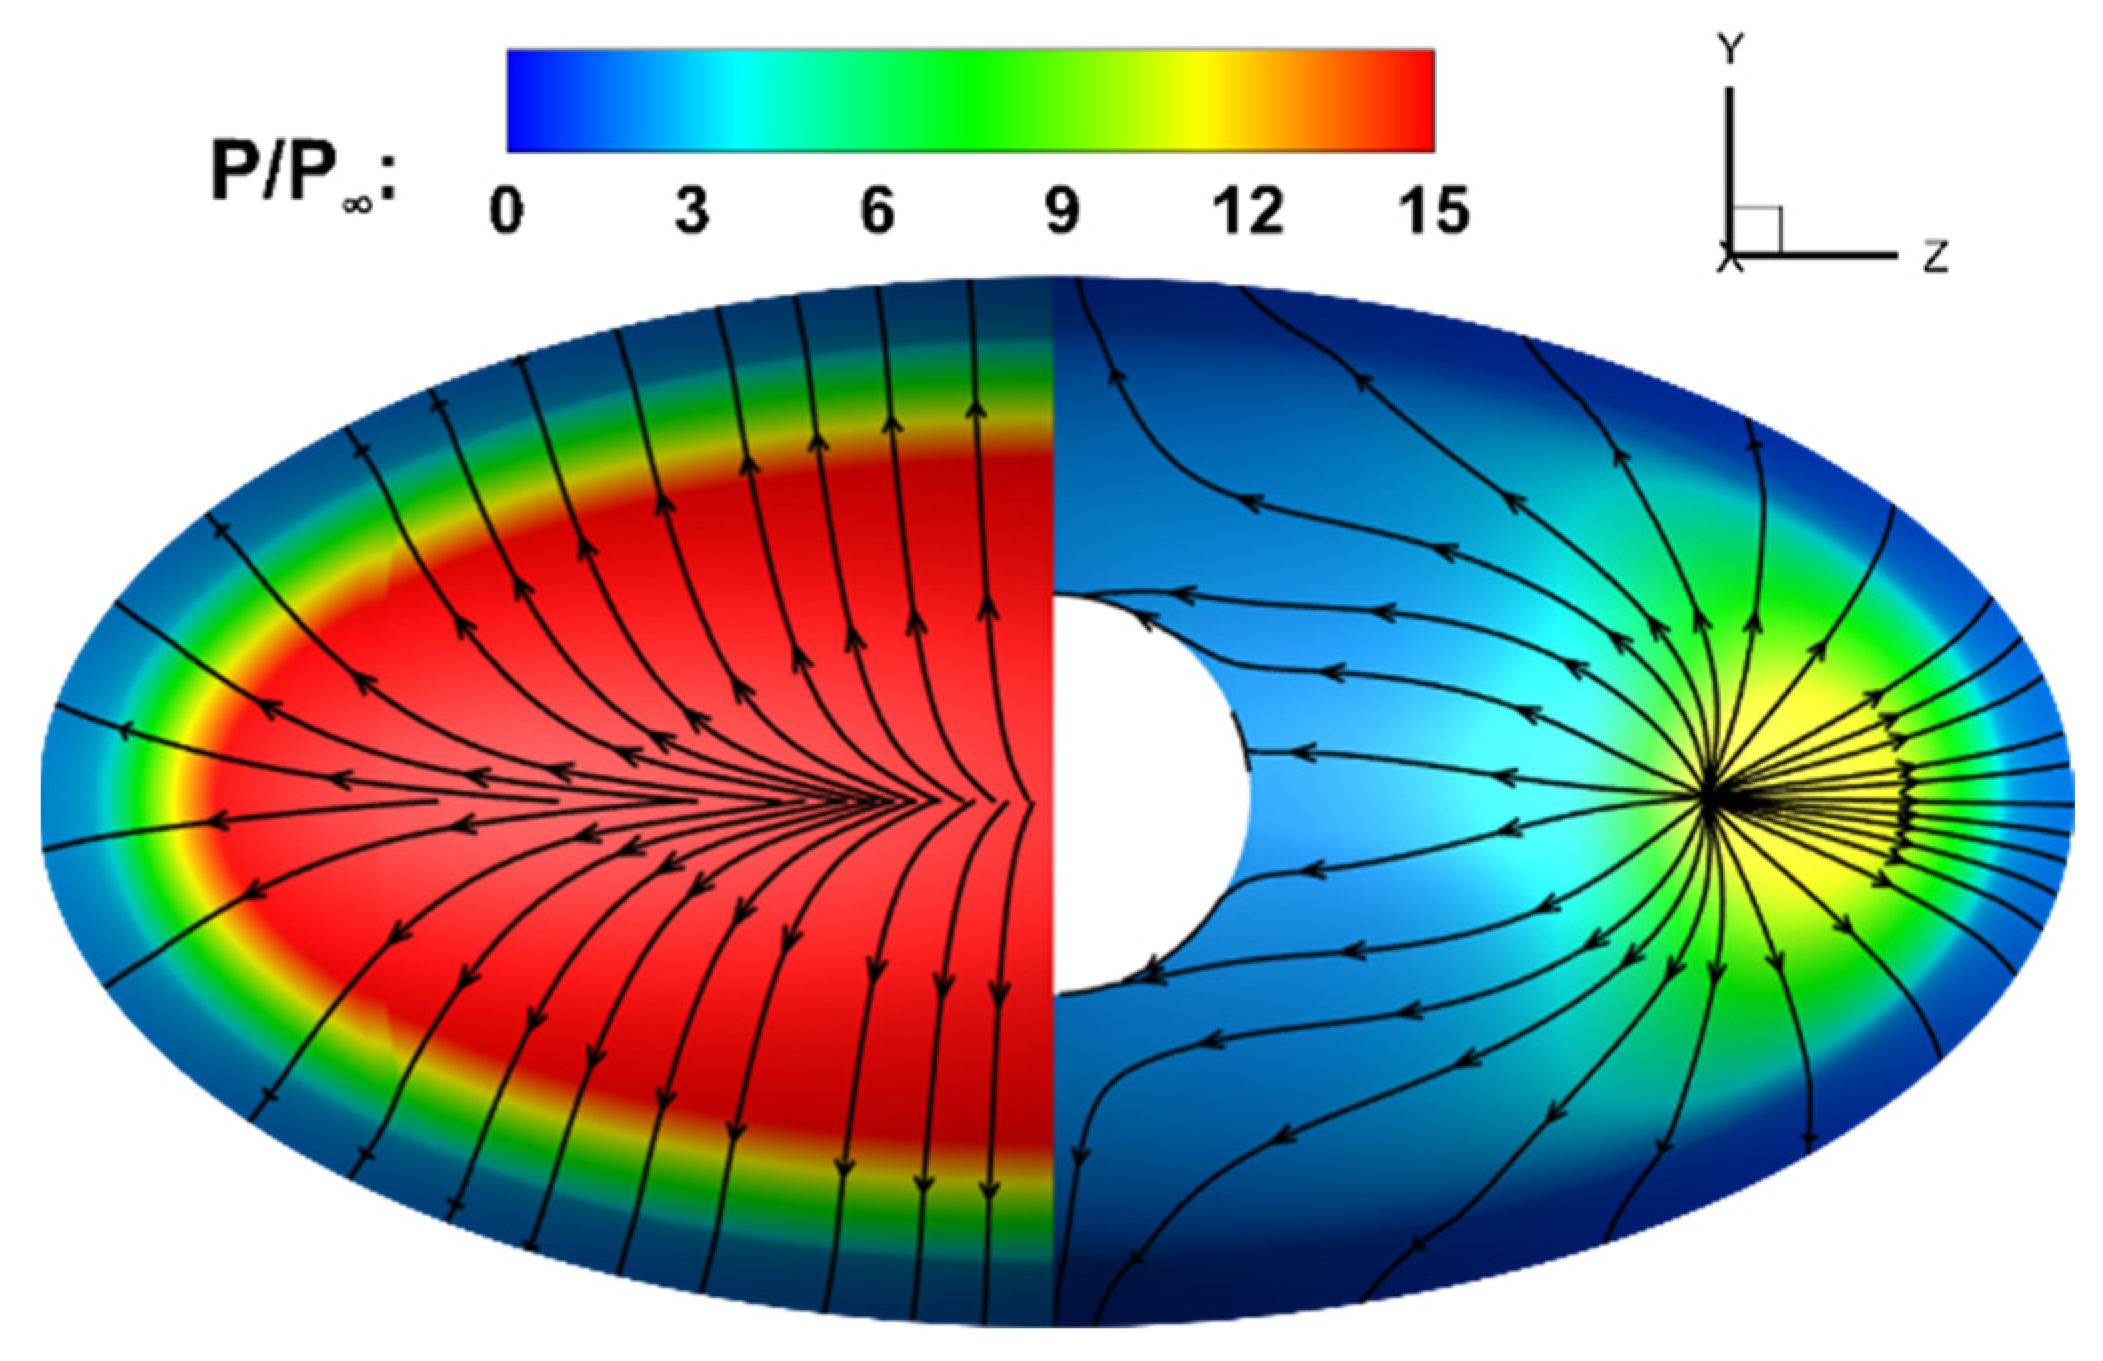
Concerning the γ distribution, the transition onset is discovered at the root of the aerodisk, and the transition develops rapidly along the centerline. Figure 7 delineates the streamlines and the non-dimensional pressure (P/P∞) contours near the aerodisk in the symmetry plane. Conspicuously, owing to the existence of aerodisk, the recirculation zone with low pressure is created around the aerodisk, and the reattachment shock leads to a reattachment point lying on the shoulder of the forebody. The comparison of surface P/P∞ and limiting surface streamlines on the nose are shown in Figure 8. Through quantitive analysis, the peak point of surface pressure is discovered a little downstream from the reattachment point. The peak pressure is reduced about 70.91% and is much lower compared to that without an aerodisk. Furthermore, as the reattachment shock generates the peak pressure point and its strength dominates the pressure drag, the peak surface pressure could reflect the drag reduction effects of aerodisk to a certain extent. Moreover, as delineated in Figure 9a, it is observed along the side edge that the surface pressure drops first in the recirculation region and then rises rapidly to the maximum point a little downstream from the reattachment point, which stimulates a large adverse pressure gradient before the shoulder of the forebody. Previous studies have shown that a positive pressure gradient can generally stabilize the flow, whereas the adverse pressure gradient disturbs the flow. Consequently, the separation-induced transition that happens in the separated shear layer at the rear half of the aerodisk can be facilitated.
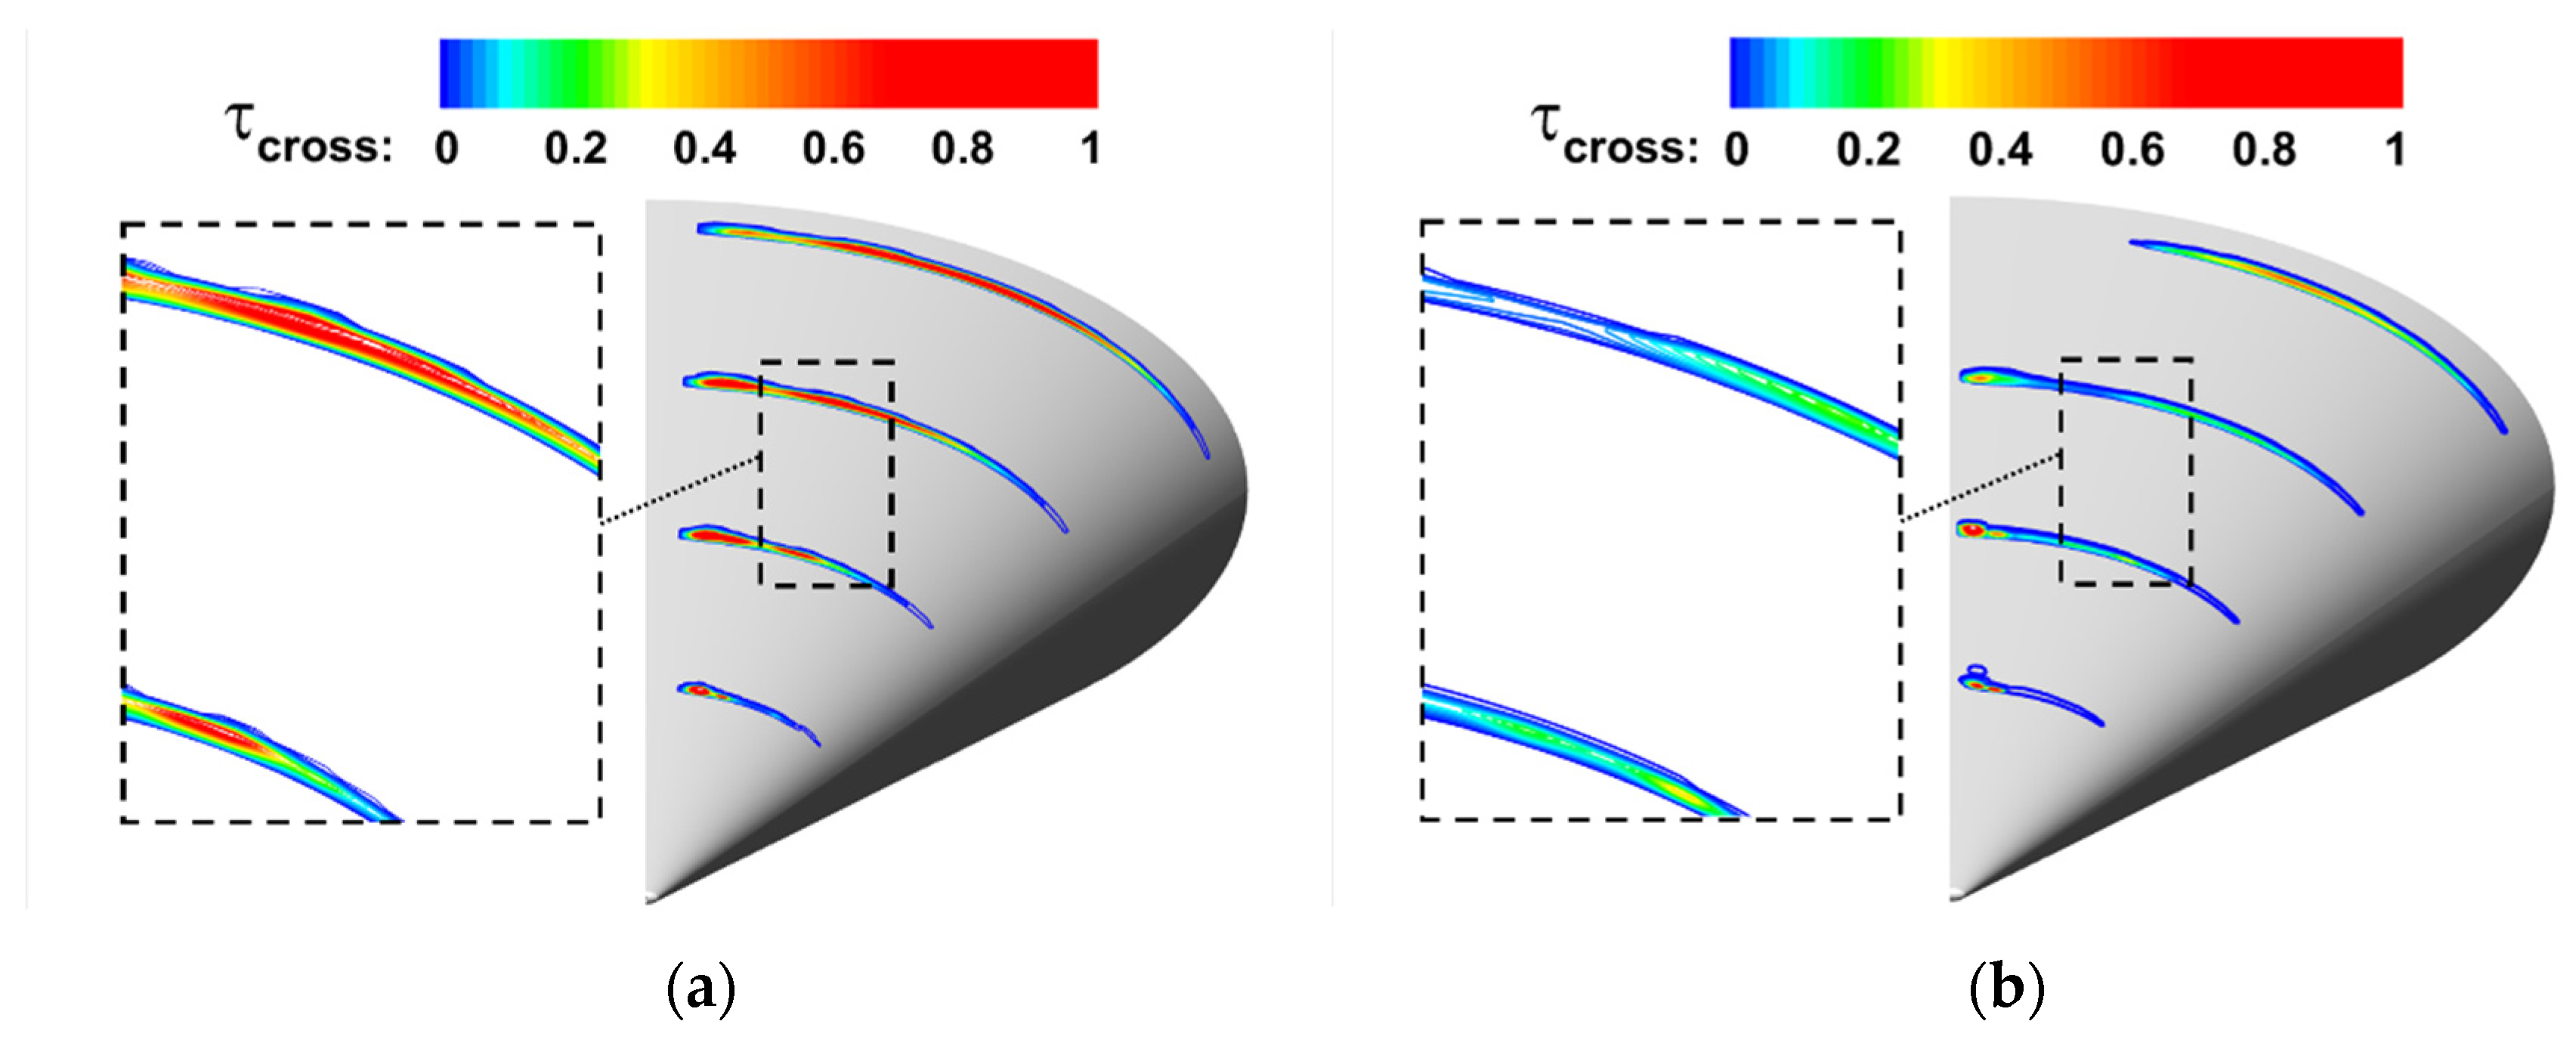
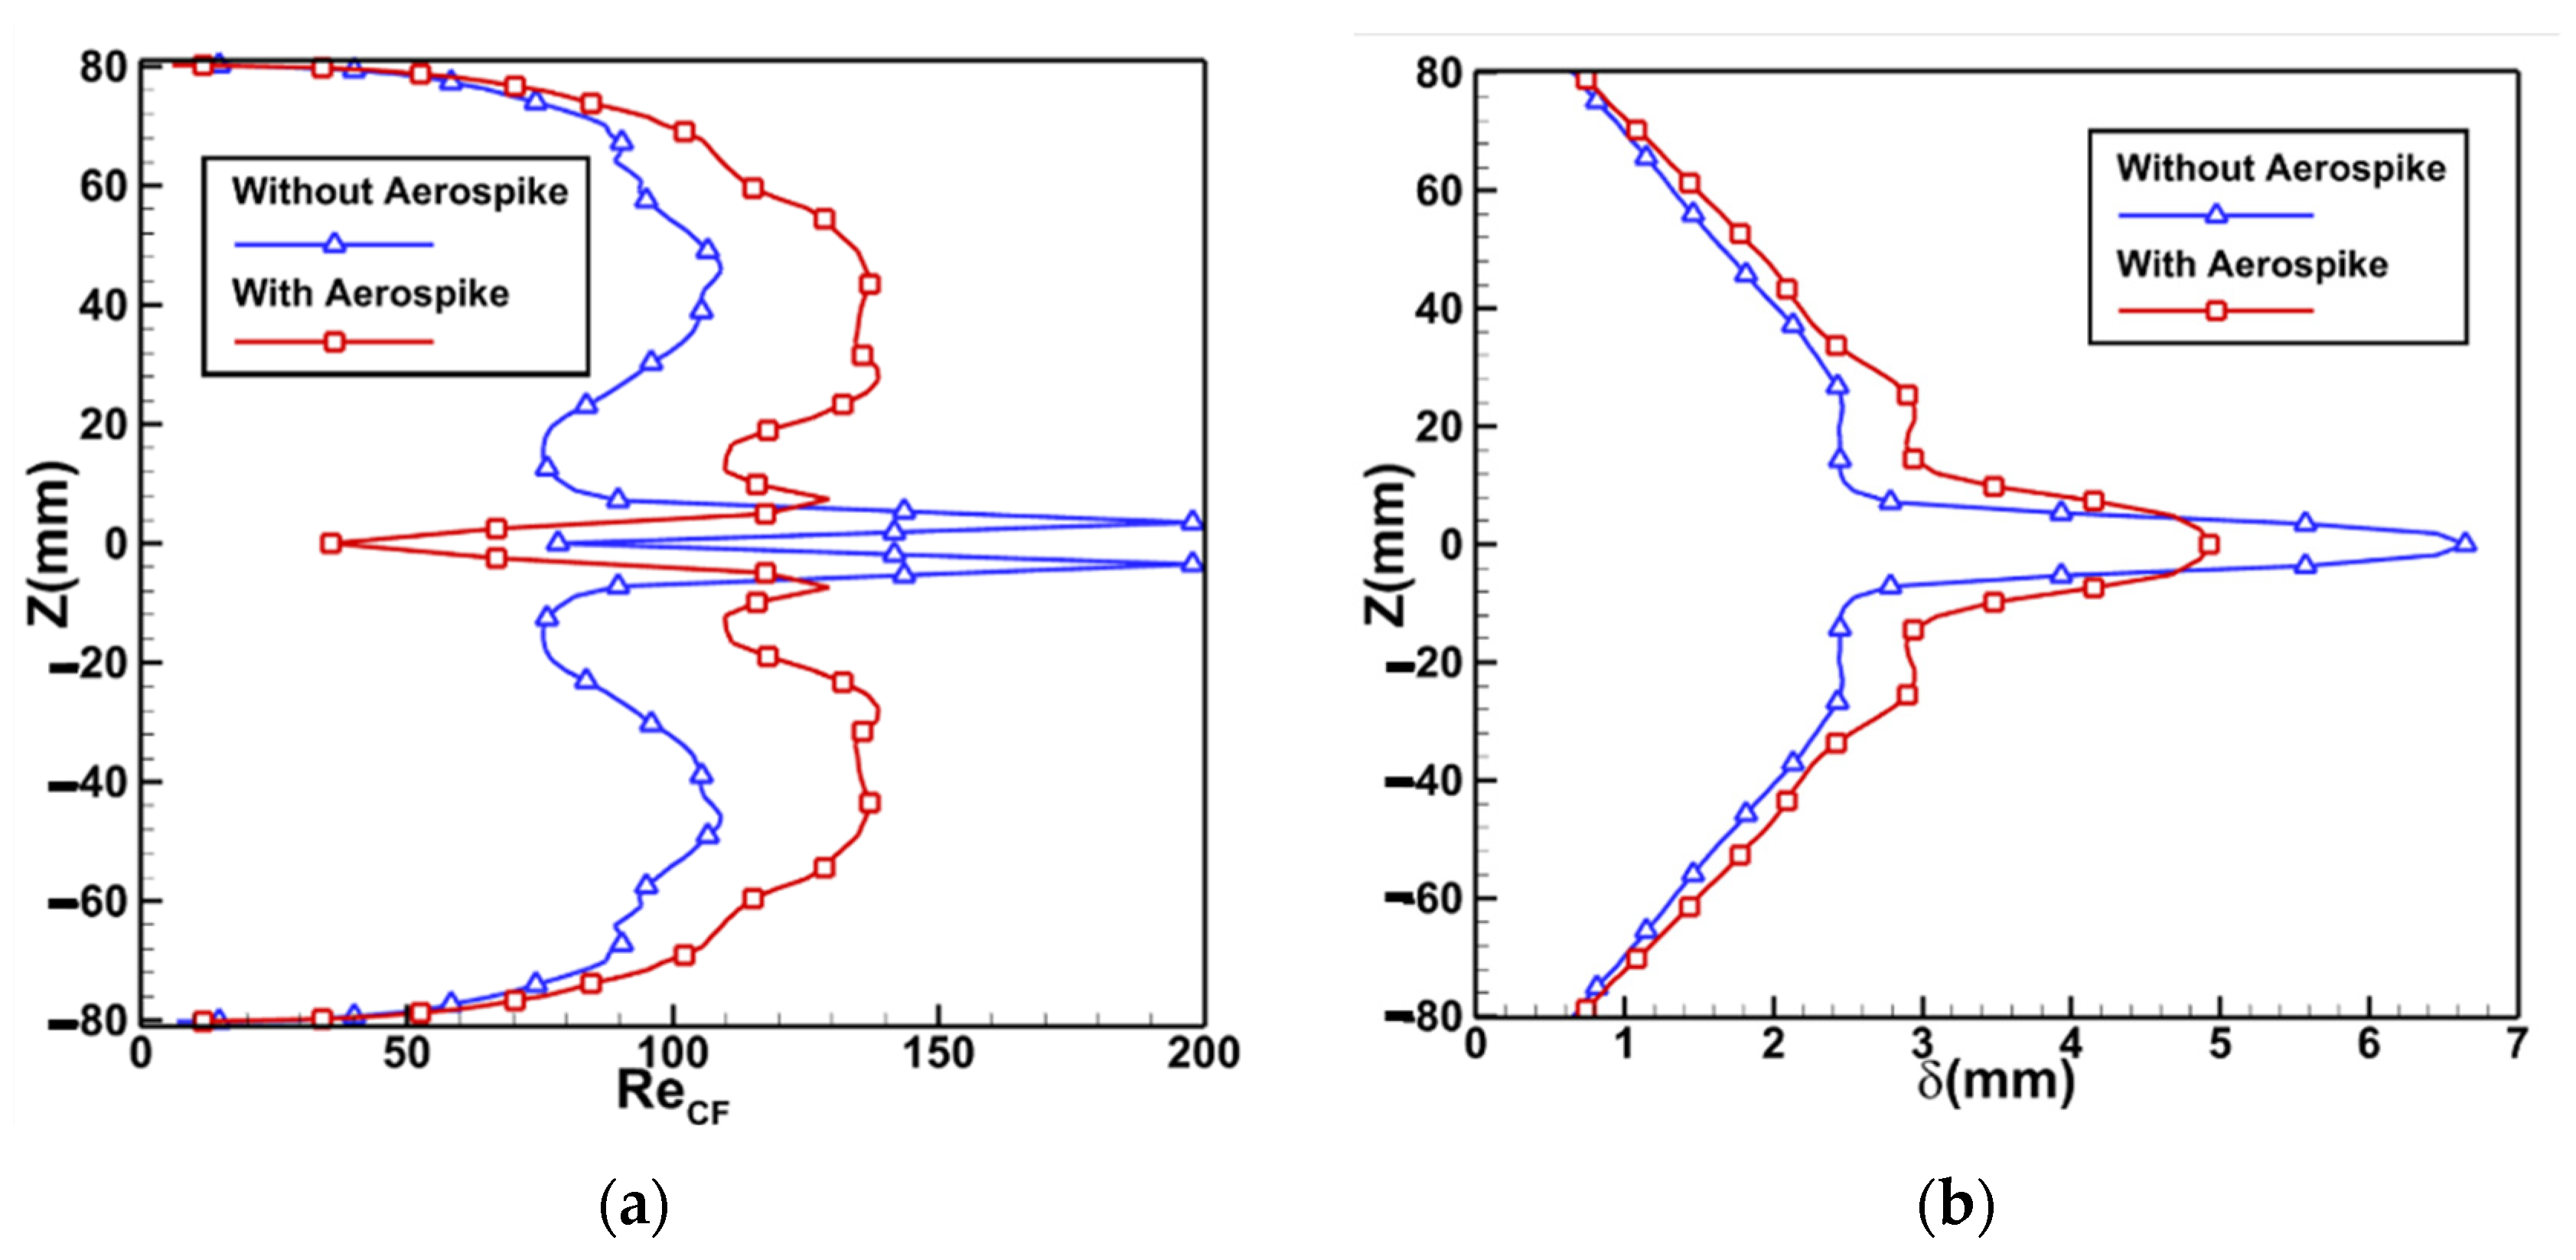
Furthermore, the transition shape becomes wider owing to the existence of the aerodisk. As already mentioned, the transition between the centerline and side edges is dominated by crossflow. Figure 10 shows the distribution of the cross-mode characteristic timescale (τcross) at the specific x-axis sections as X = 100, 170, 240, 310 mm, which is defined in Equation (15). It is evident that the τcross increases following the installation of the aerodisk, which widens the transition region (see Figure 6). For quantitative comparison, as the crossflow Reynolds number (ReCF) is defined in Equation (18) and designed as a feasible crossflow strength indicator, the distribution of ReCF along X = 300 mm is displayed in Figure 11a. By analyzing the construction of ReCF, although the maximum nondimensional crossflow velocity (|ω/Ue|max) decreases due to the lower spanwise pressure gradient after installing the aerodisk, the boundary layer thickness (δ) increases significantly in the area between the leading edge and the centerline, which is regarded as the reason of the increase of ReCF for the case with an aerodisk, and directly promotes the increase of τcross. Obviously, as seen in Figure 11b, owing to the non-axisymmetric nose, the aerodisk weakens the conical shock unequally, which thins δ on the centerline, while δ aside the centerline obtains the capacity to remain thicker correspondingly. It is also noticed in Figure 11a that ReCF shows a rapid increase near the centerline. As noticed before, the longitudinal vortex is generated near the centerline. Therefore, the rapid increasement of δ owing to the existence of longitudinal vortex (see Figure 11b) leads to the excessively large ReCF. Moreover, as the crossflow velocity decreases near the centerline, ReCF is decreased again close to the centerline. In addition, as δ would grow thicker with the flow along the wall, the aerodisk provides the extra length, which gives rise to a thicker δ of the HIFiRE-5 afterbody with an aerodisk compared to that without an aerodisk in the same place and increases ReCF correspondingly.
4.3. Influence of Aerodisk Length
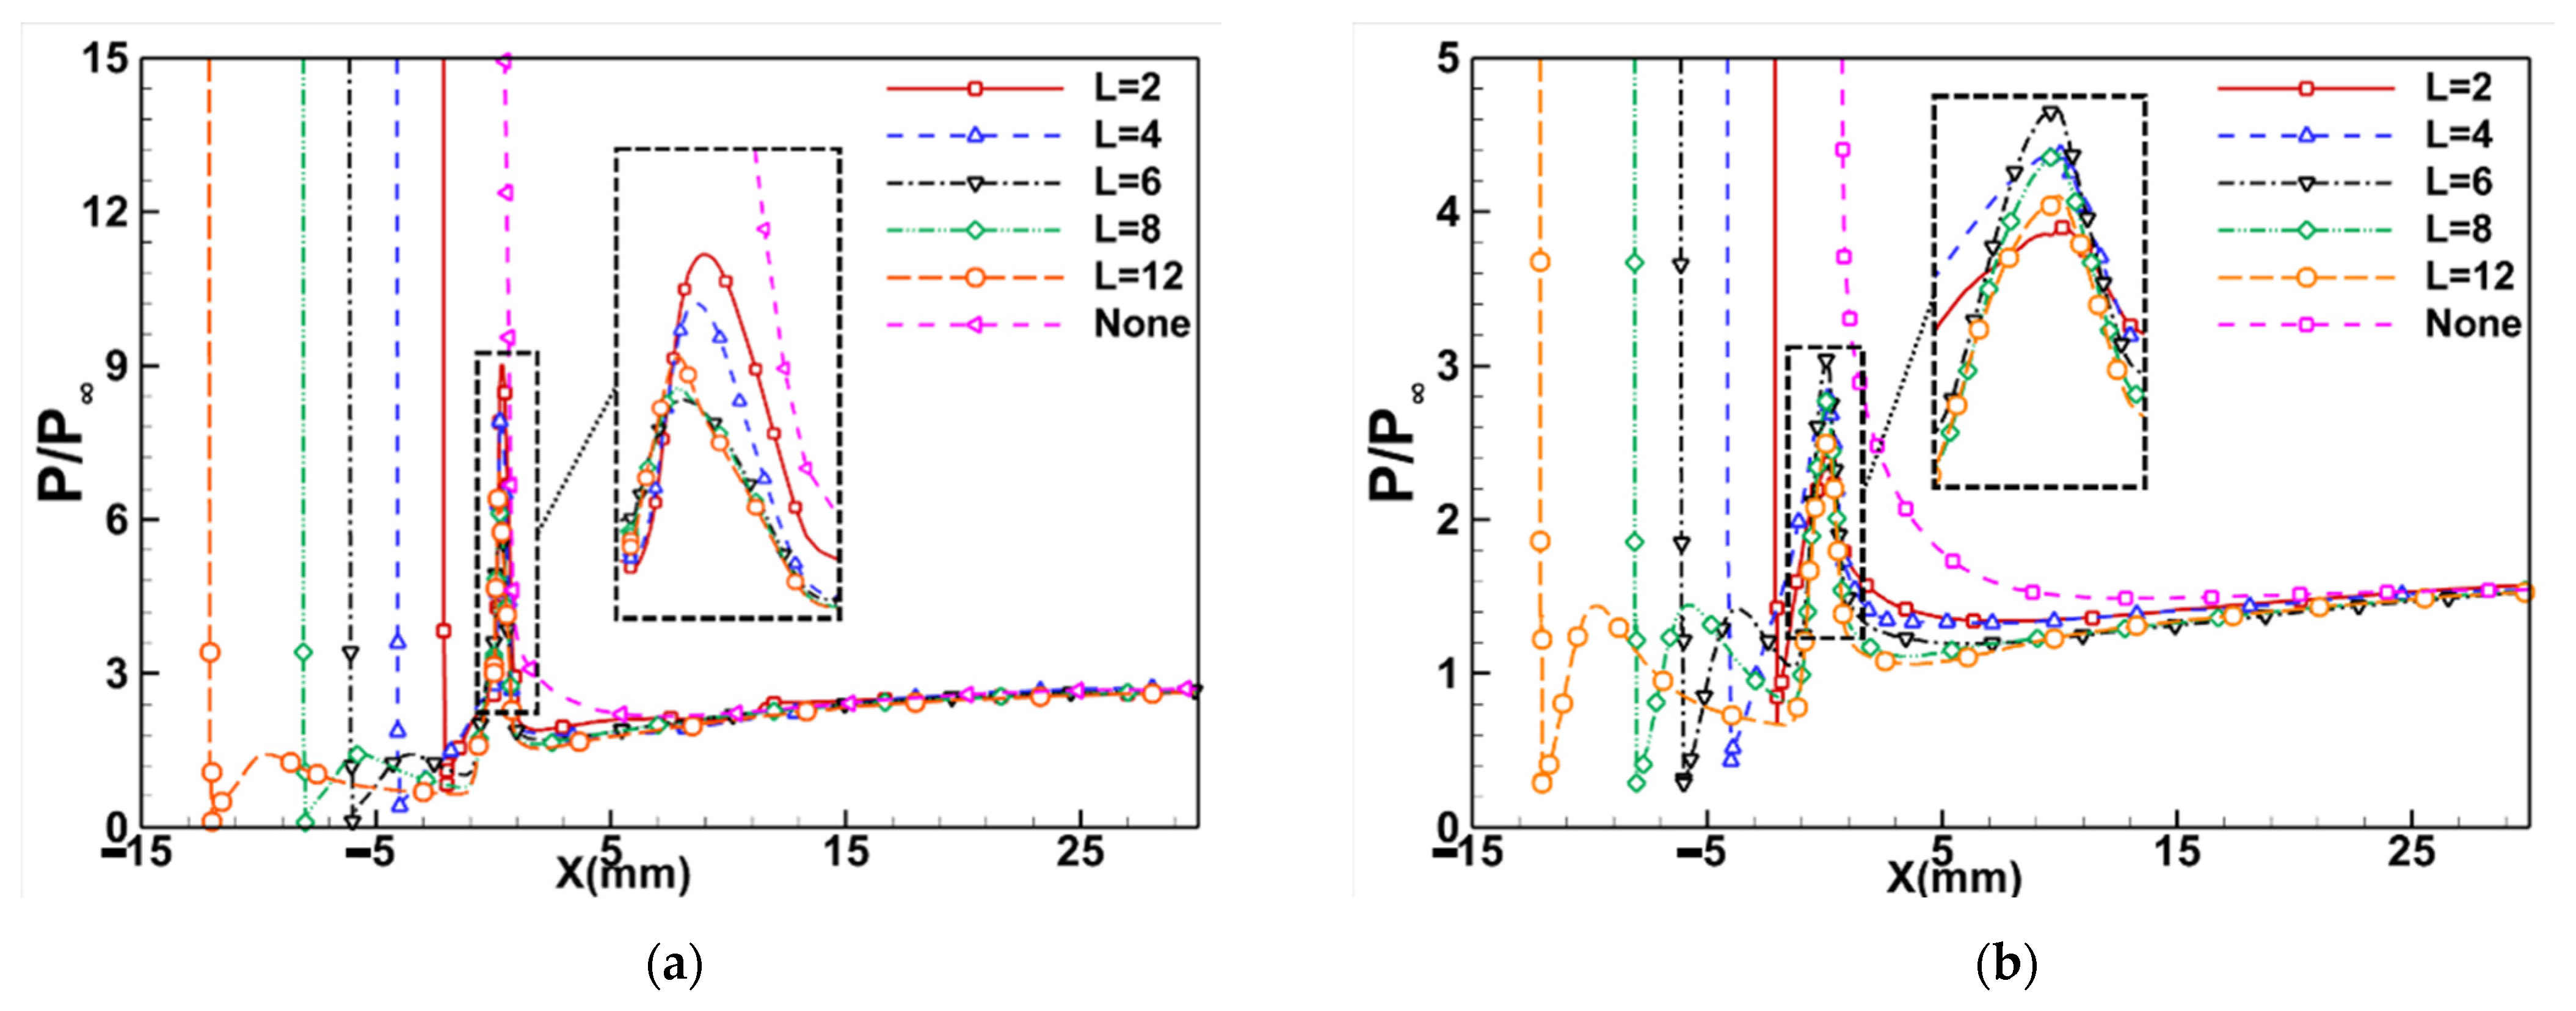
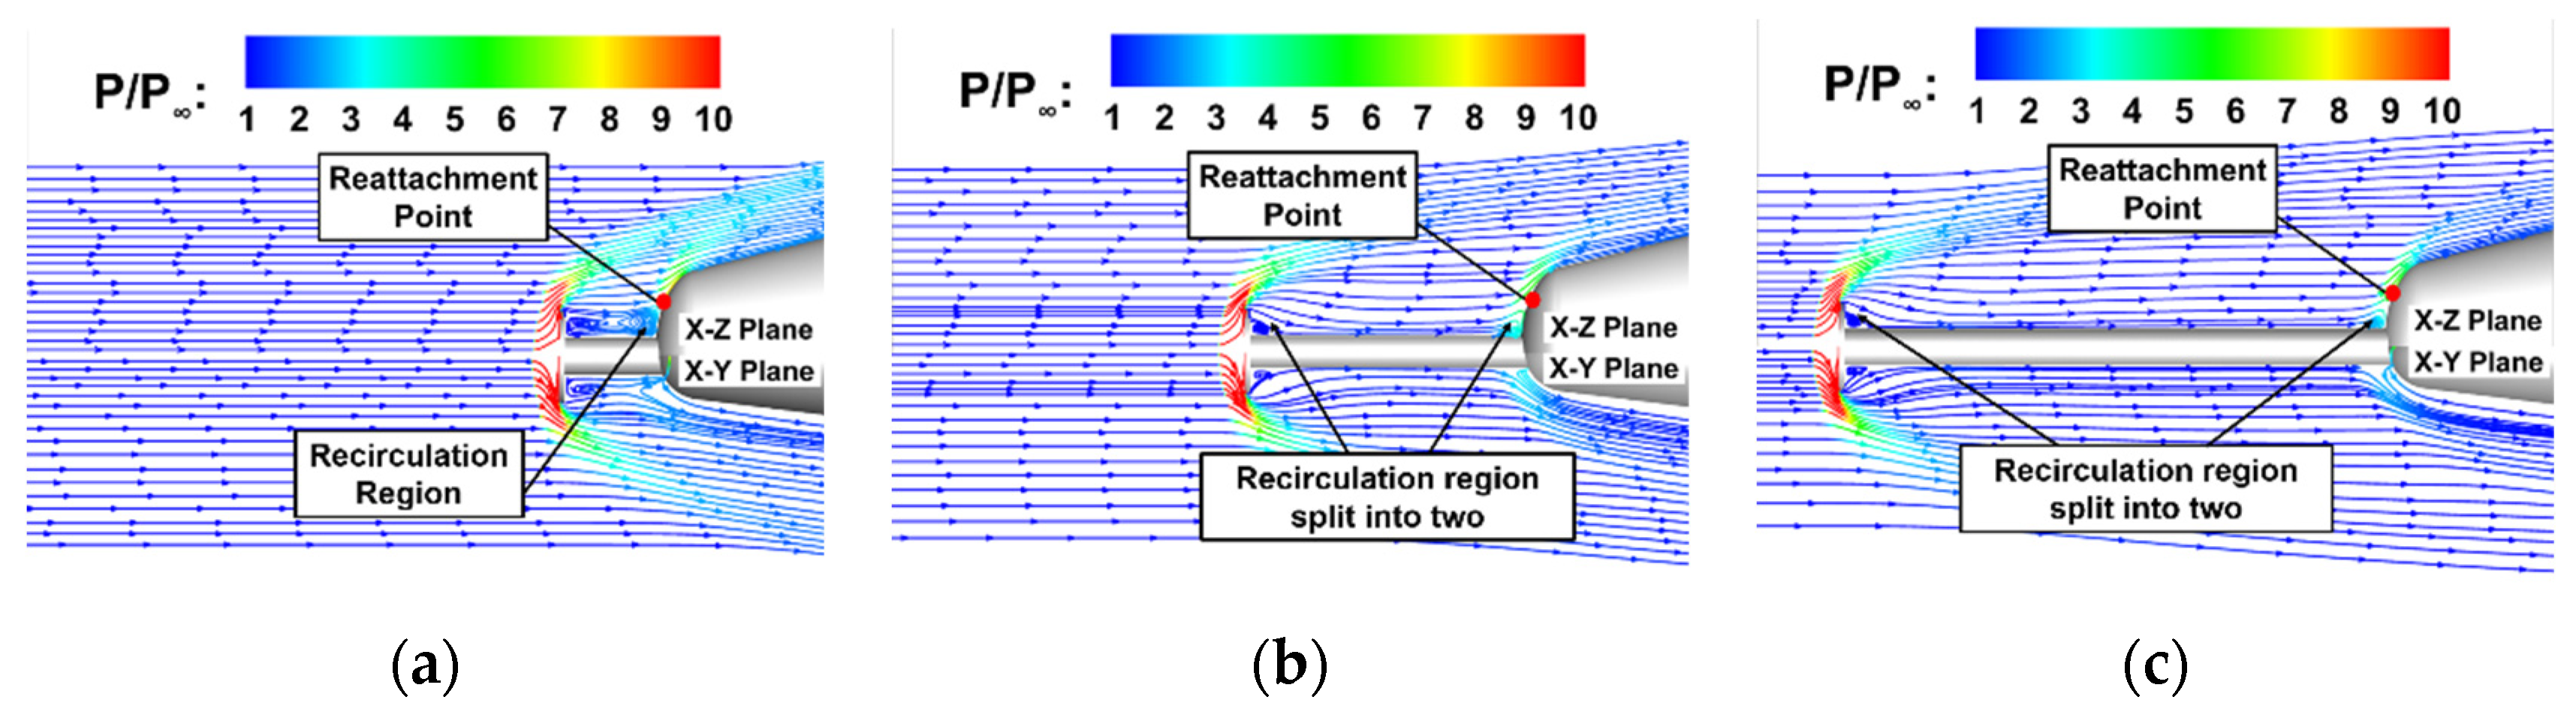
For maximum benefit of reducing drag and heat flux, research of the aerodisk length effect on transition is required. The influences of the aerodisk length on the boundary layer transition and heat flux are investigated by choosing five aerodisk lengths of L = 2, 4, 6, 8, and 12 mm. The comparisons of surface pressure along the side edge and centerline are delineated in Figure 9. It could be seen in Figure 9a that, with L rising, the peak value of nondimensional pressure ((P/P∞)max) along the side edge first decreases and touches the bottom when L = 6 mm, and then increases slightly again. The non-monotonous variety trend of the peak value is closely related to the strength change of reattachment shock. The reattachment shock weakens first due to shrinking recirculation zone in the range of L = 2 to 6 mm. However, as L keeps increasing to longer than 6 mm, the recirculation region is discovered to split into two (see Figure 12). The first is relatively small and occurs just behind the aerodisk, and the second is before the nose of the forebody. With the increasing aerodisk length, the pressure obtains the ability to reduce due to the flow expansion. Consequently, the flow reattaches to the wall until the next separation happens before the nose, and the separated recirculation region impairs the effect of aerodisk and strengthens the reattachment shock again. Nevertheless, (P/P∞)max on the centerline delineated in Figure 9b reveals a completely opposite trend with that along the side edge, that is, as L increases, (P/P∞)max on centerline reaches its peak at L = 6 mm and then declines. This is likely because of the different flow characteristics between the x–y and x–z plane before the forebody. Specifically, owing to the highly varied forebody semimajor axis and semiminor axis, the reattachment shock and recirculation zone are generated in the x–z plane; however, they are not able to be observed in the x–y plane.
As the reattachment shock is only generated in the x–z plane, the pressure peak value along the side edge is just the maximum pressure on the surface. The maximum point of surface heat flux is observed a little downstream from the reattachment point while upstream from the maximum pressure point (Pmax), and the variety trend of the maximum heat flux (Qmax) is similar to Pmax. As Qmax is generated by the reattachment shock, the change of Qmax is ascribed to the strength variety of the reattachment shock. With aerodisk length increasing from 2 mm to 6 mm, the reattachment shock is weakened. However, as the aerodisk length keeps increasing, the flow velocity behind the aerodisk gets the development path to increase, which strengthens the reattachment shock again. Therefore, the variety trend of Qmax is consistent with the variety trend of reattachment shock. Specifically, as presented in Table 3, the aerodisk contributes to the reduction of Qmax by up to 52.0% with a 6 mm aerodisk, and Pmax without aerodisk is even up to 5.1 times that with a 6 mm aerodisk, which are a benefit for reducing drag and wall heat flux. In addition, as L increases, it should be emphasized that, although the Pmax and Qmax increase a little with an aerodisk longer than 6 mm, they are still much less than those without an aerodisk.
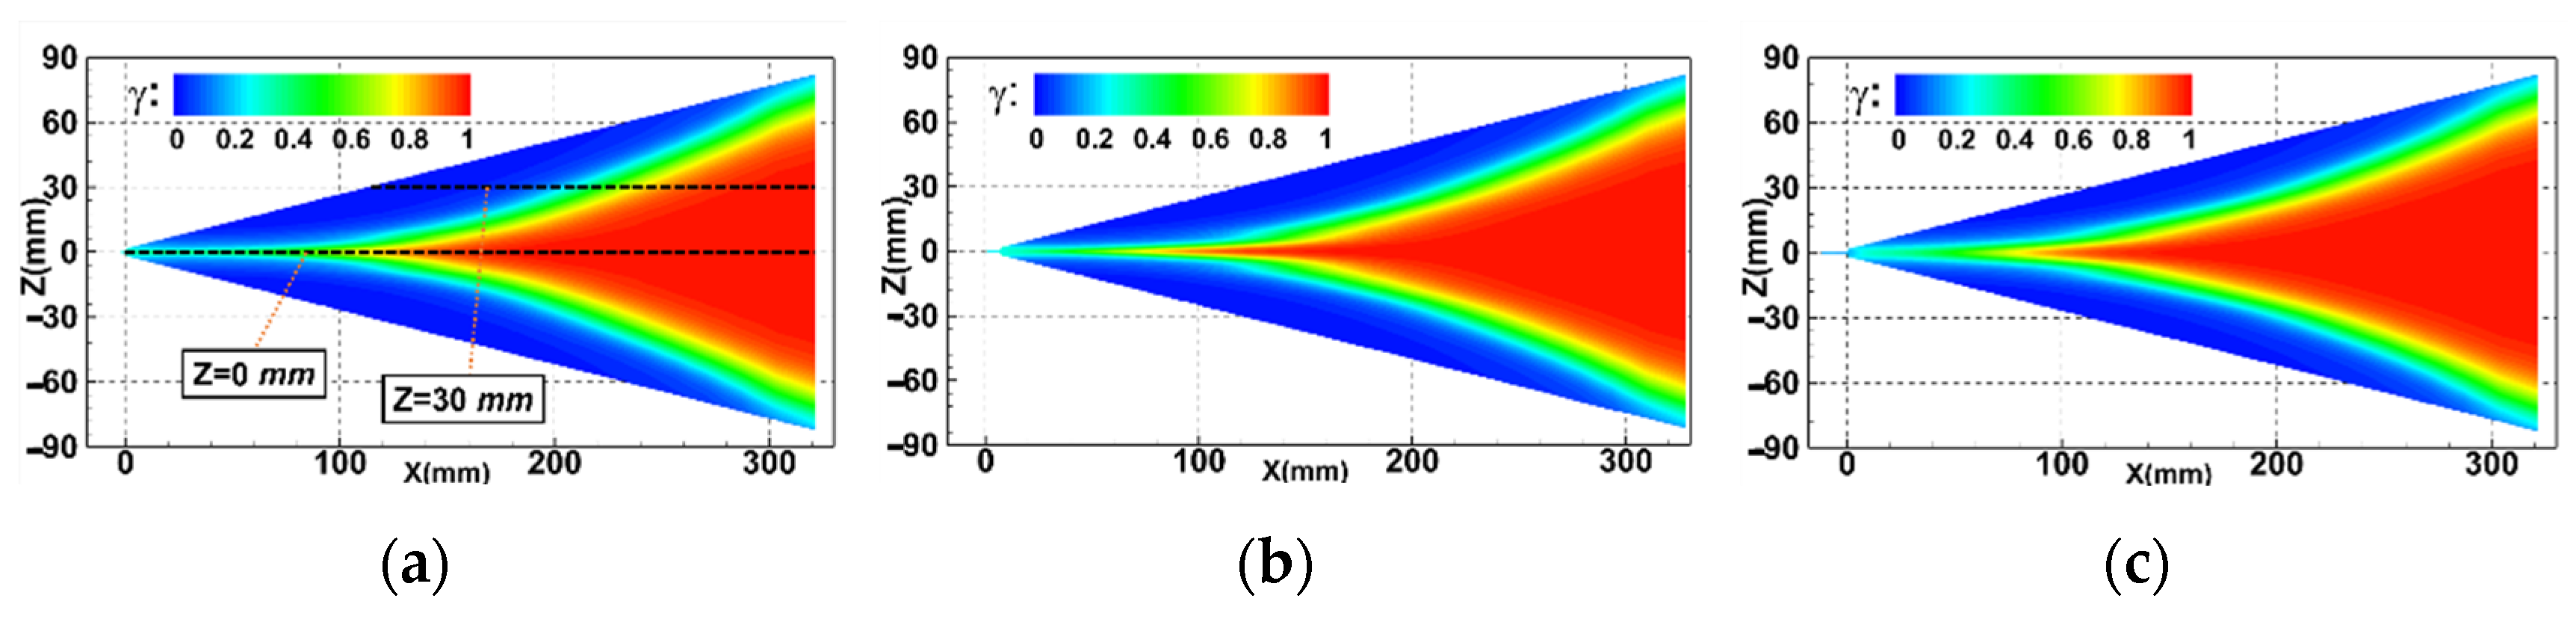
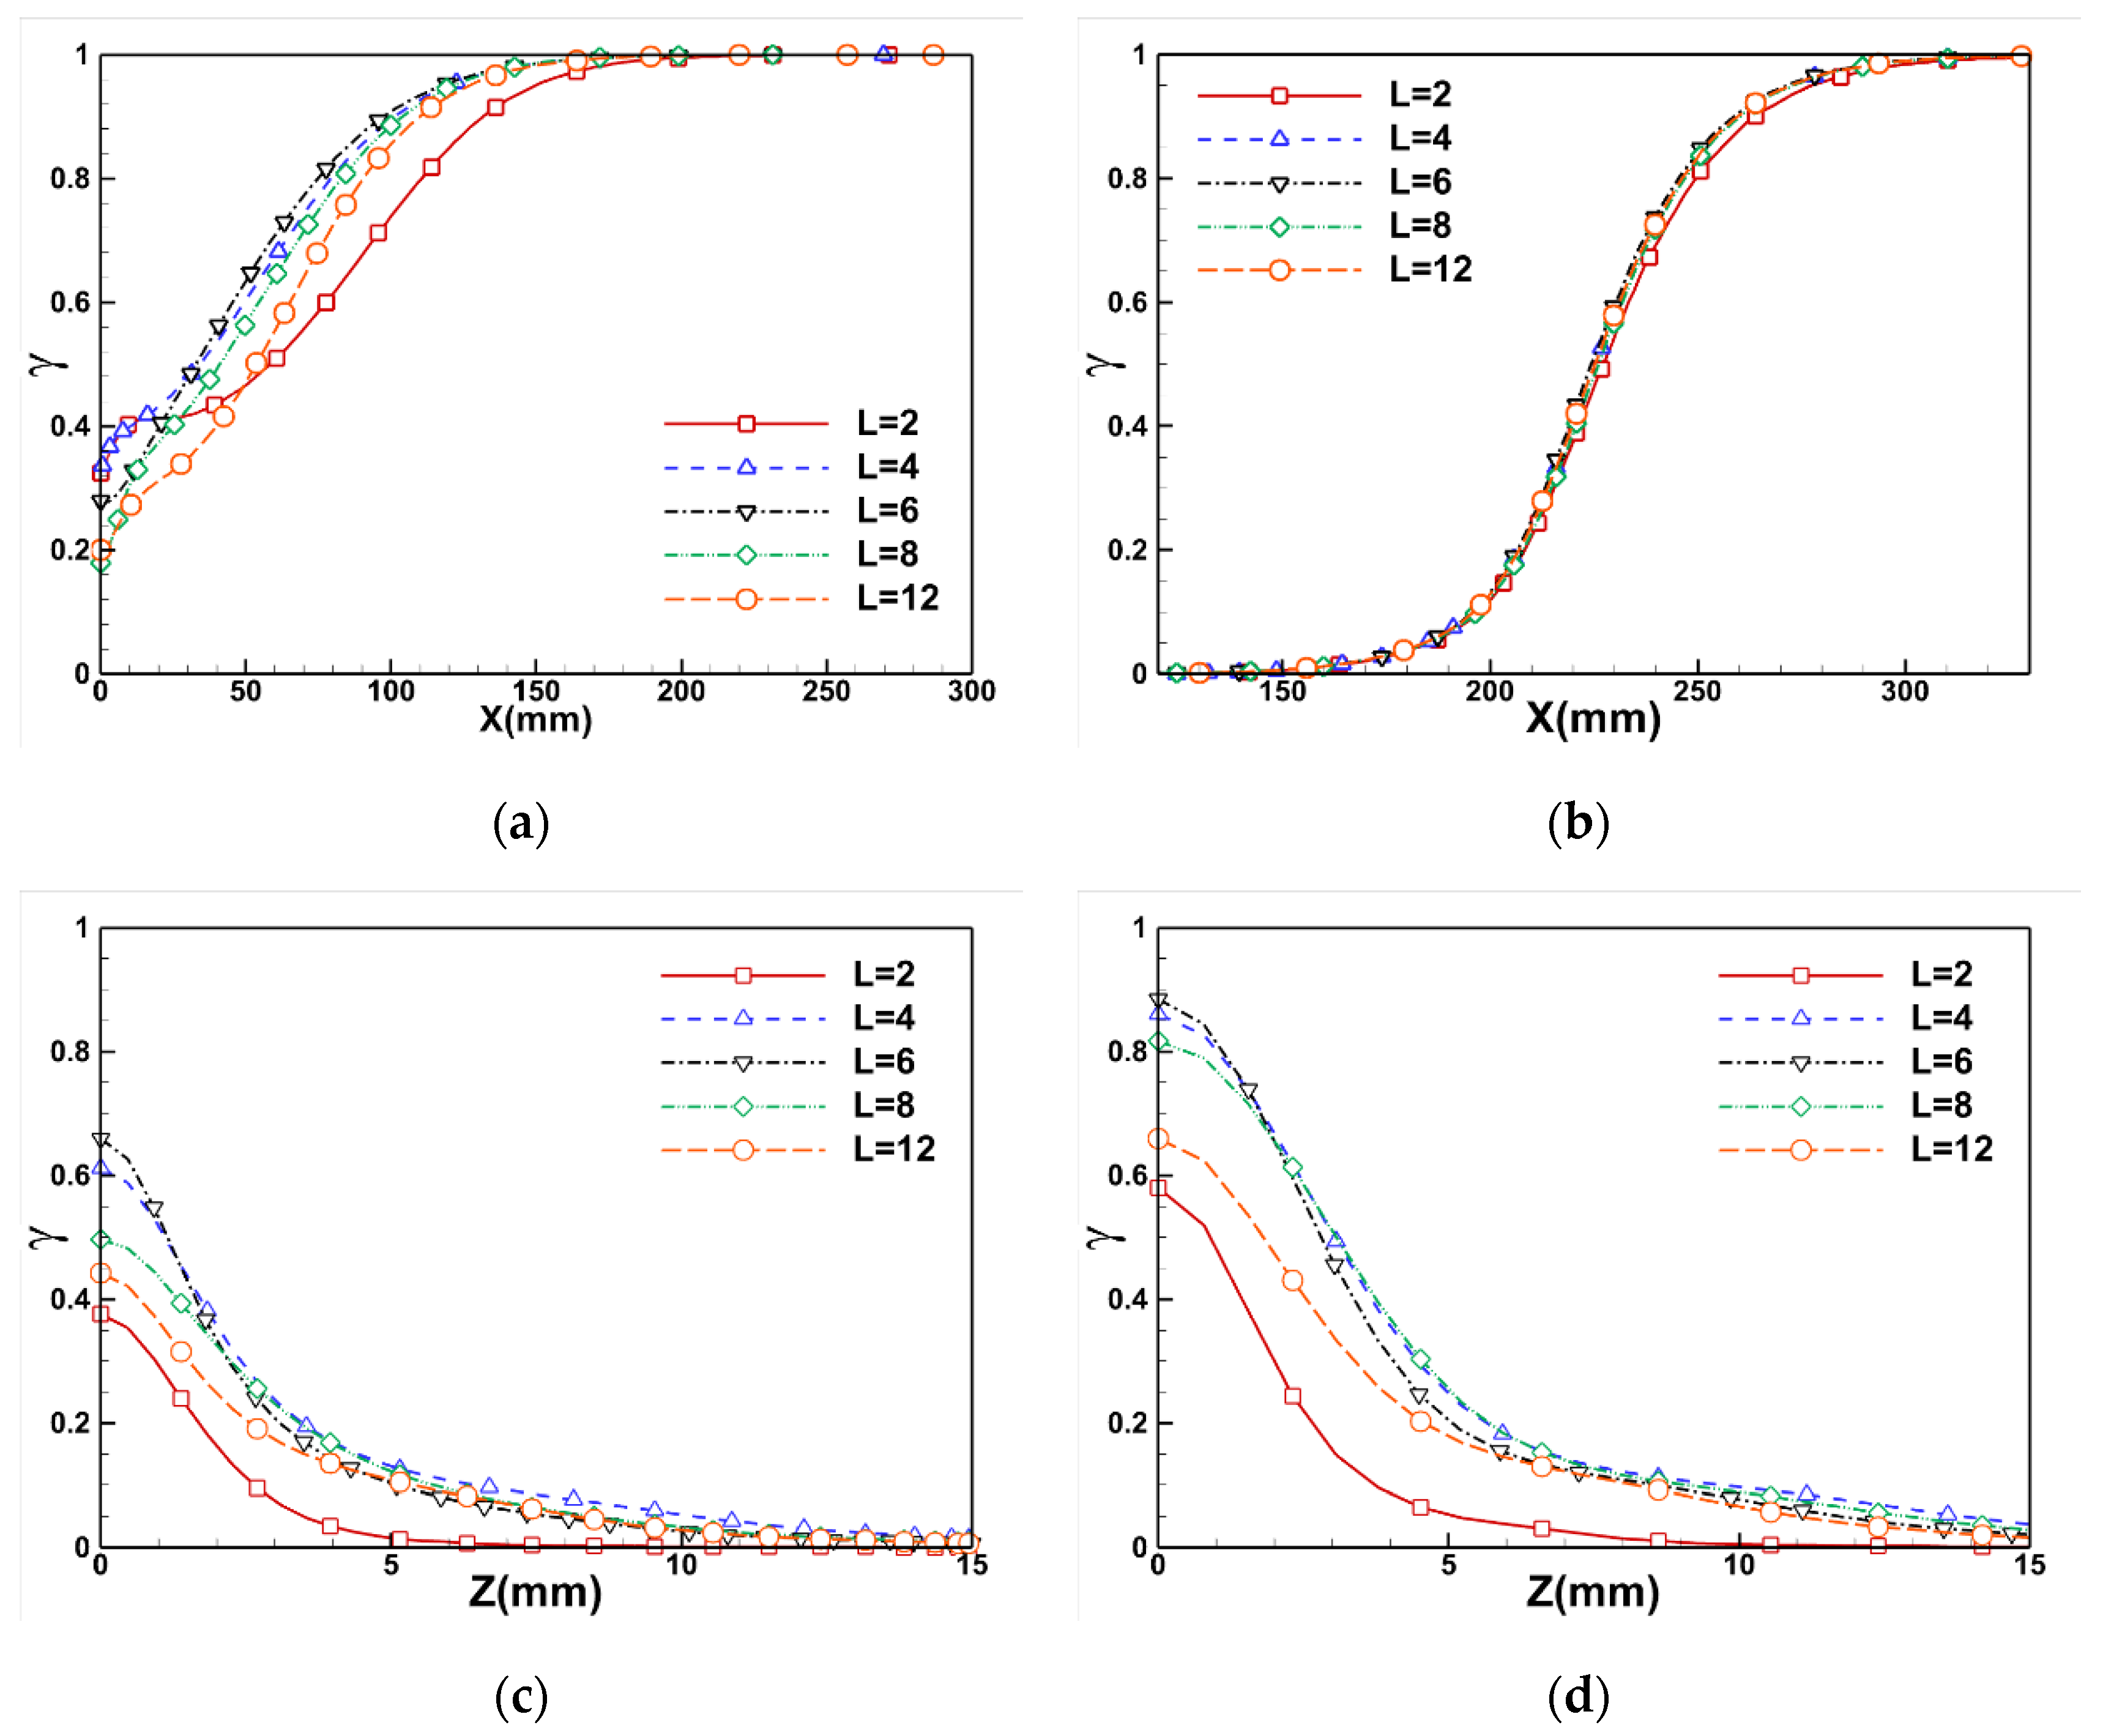
As for the effect on boundary layer transition, the distributions of γ with aerodisk length of 2, 6, and 12 mm are shown in Figure 13 as examples. The quantitative comparisons are shown in Figure 14, which extracts γ along Z = 0 (centerline), Z = 30 mm, and X = 80 mm wall surface section lines. These results demonstrate that, as L increases, although the transition shapes and onsets in the area between centerline and side edge are nearly unchanged, the transition lengths along centerline are varied. Based on the aforementioned variety trend of Pmax, as the length of the aerodisk increases from 2 mm to 6 mm, the adverse pressure gradient decreases, but γ increases. The rising γ is ascribed to the increasing of the development path. As for the transition length, its change trend is closely related to the variation of the adverse pressure gradient, that is, the transition length curtails first and then elongates, which is consistent with the change rate of Pmax along the centerline. In addition, it also reveals that the growth rate of γ with the 12 mm aerodisk is larger than that with a 2 mm aerodisk despite the adverse pressure gradients being almost the same, which is supposed to be relevant to the increasing boundary layer thickness near the centerline. Figure 14b–d present the comparison of γ along Z = 30 mm, X = 60 mm, and X = 80 mm representatively. The first shows that the increasing trends and rates of γ are basically the same along Z = 30 mm. The others indicate that γ dissipates rapidly away from the centerline, and over 80% γ dissipates in the 20% area closest to the centerline. Therefore, comprehensively considering the variety of transition onsets on a side edge with different aerodisk lengths being negligible, the effects of aerodisk length on transition are regarded to largely concentrate near the centerline.
4.4. Influence of Angle of Attack
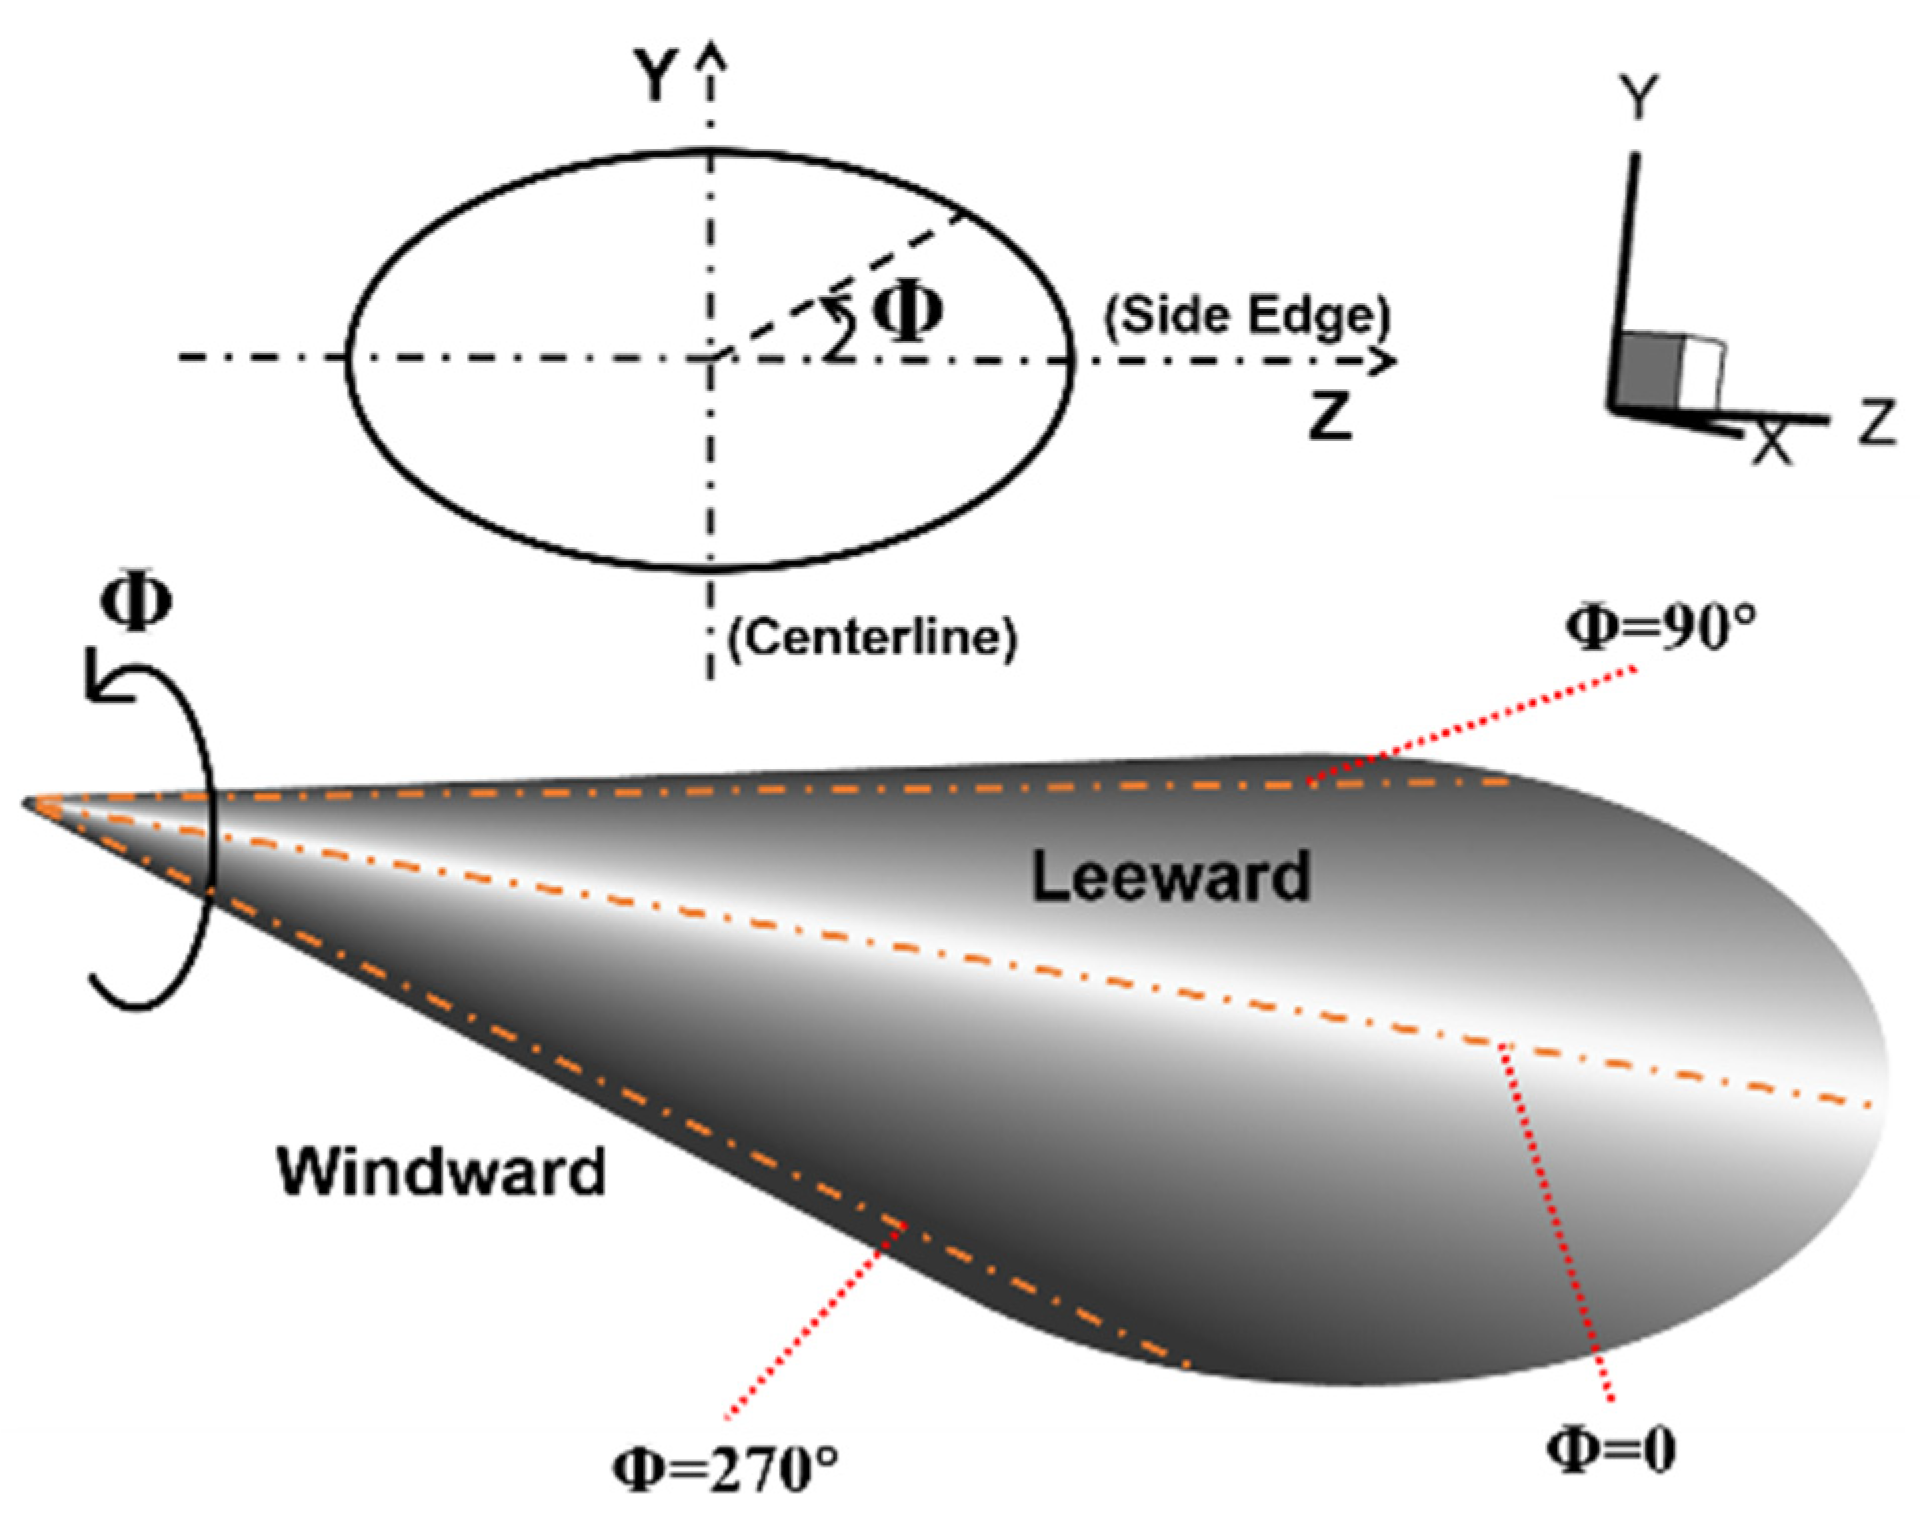
Considering that hypersonic vehicles usually fly with angle of attack in practicality, the exploration of aerodisk effects on boundary layer transition and heat flux with angle of attack is indispensable. Here, azimuth (Φ) is employed to display the complete wall information, where azimuth Φ = 90° and 270° correspond to the centerline of the leeward and windward sides, respectively, and the counterclockwise direction is the positive direction, as sketched in Figure 15. Figure 16 delineates the flow field characteristics of HIFiRE-5 without an aerodisk under three cases of freestream angle of attack (α) given as α = 2°, 4°, and 6°. Obviously, crossflow velocity near the centerline (Φ = 90°, 270°) is 0 because of the flow symmetry. The α causes the windward shock to become more body-fitted than the leeward shock. Given that the shock wave near the side edge is the strongest at an arbitrary cross section, with α increasing, the pressure difference between the side edge and the windward declines, while that between the side edge and the leeward augments. This phenomenon in turn causes the diametrically opposed crossflow strength variation between the windward and leeward, that is, the stronger one on the leeward side while the weaker one on the windward side at a larger α. Moreover, with the increases of α, the separation streamline that coincides with the side edge when α = 0 moves towards the windward meridian, which further strengthens the above change trends.
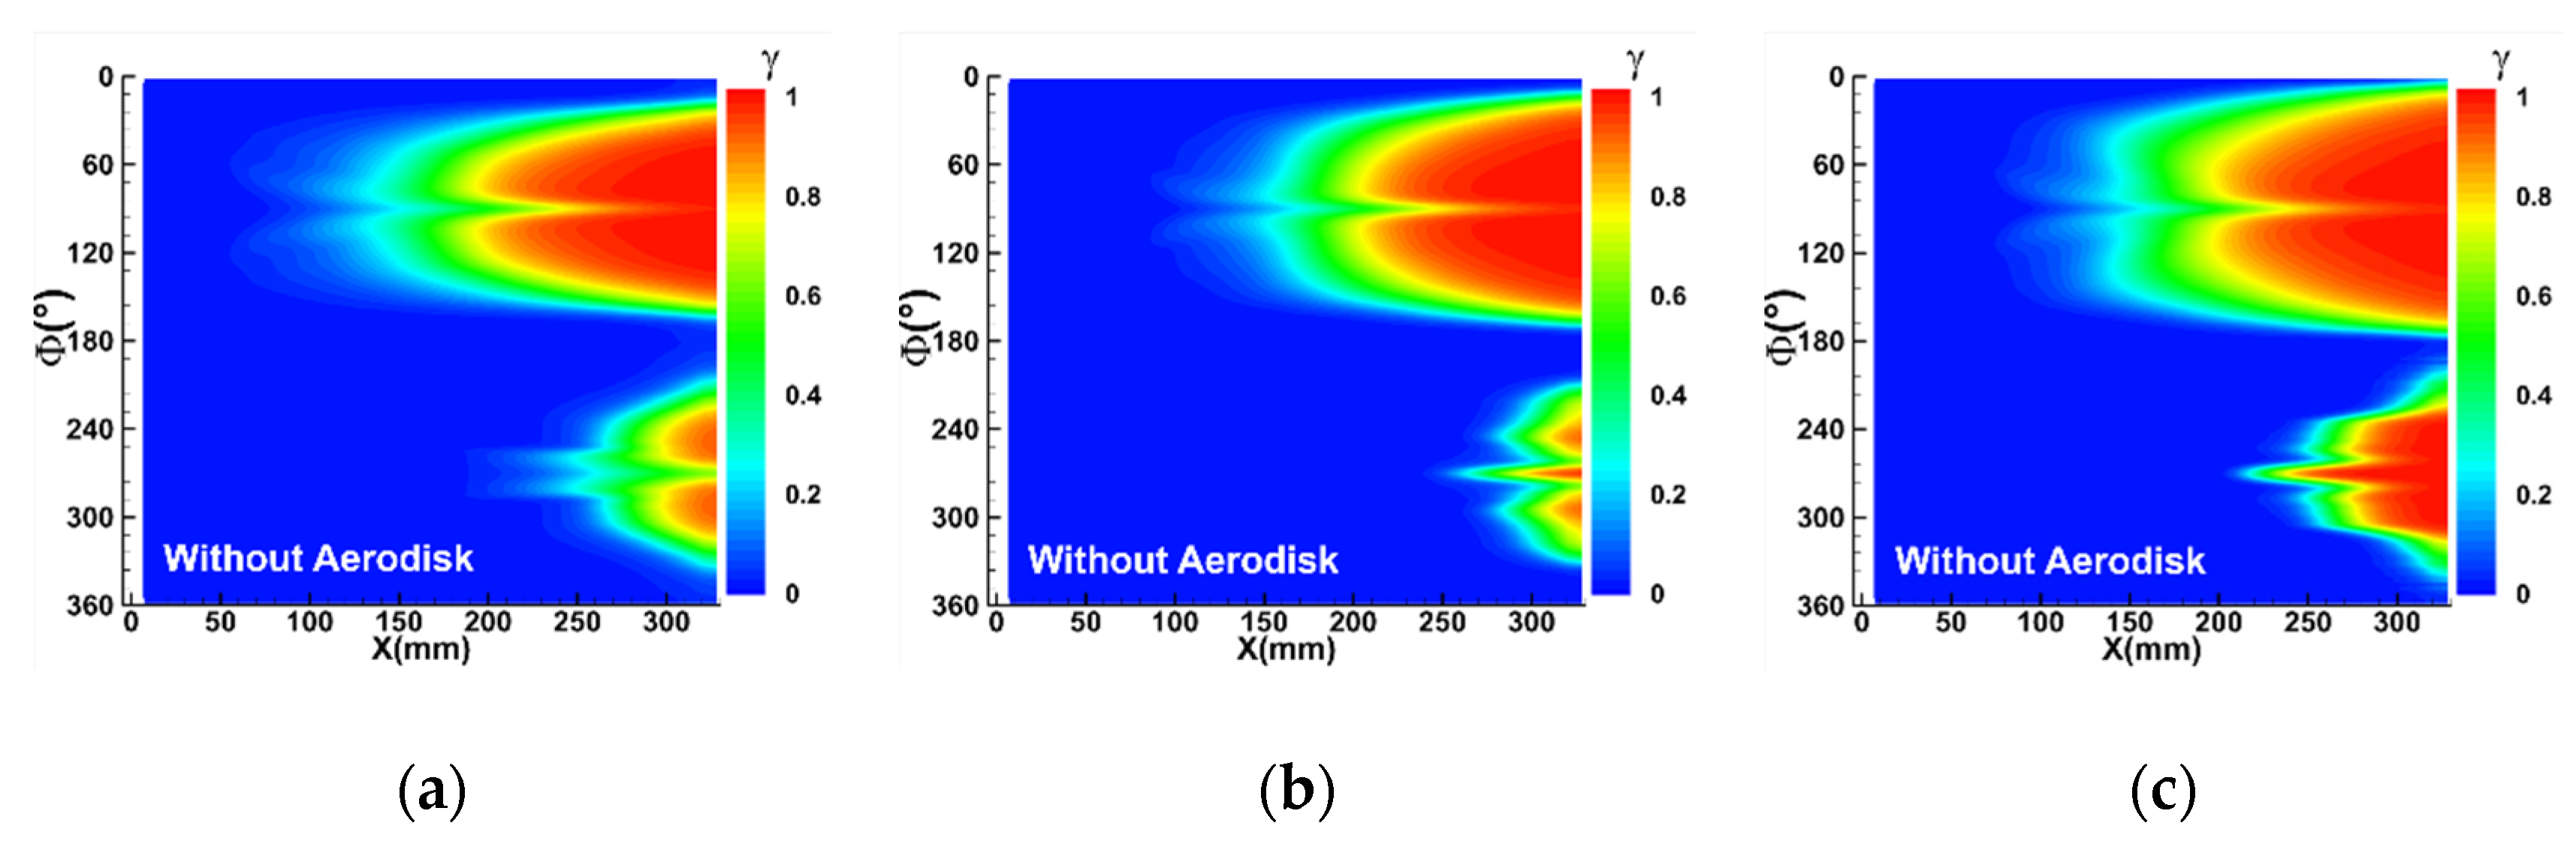
Figure 17 shows the γ distributions of HIFiRE-5 model expanded along the azimuth (Φ). The matte contours signified uncertainties in the edge determination. It is conspicuous that the shapes of transition region on windward and leeward sides are different. As previously analyzed, the transition on leeward between centerline and side edge (0 < Φ < 180°), which still keeps a two-lobed transition front, is dominated by a cross-mode unstable disturbance. Therefore, as the crossflow strength becomes strong with the increase of α, the transition shape broadens. For the windward side (180° < Φ < 360°), the situation becomes more complicated. As the aforementioned reason, with α rising from 0 to 4°, the attenuated windward spanwise gradient weakens the crossflow strength and results in the decayed transition onset, which is in good accordance with the wind tunnel tests results reported by Juliano [38]. Nevertheless, the transition onset moves forward with the continuously amplification of α. In this moment, as the crossflow is too weak to trigger transition (ReCF < 90), the transition is regarded to be dominated by the first and second unstable disturbances. Some experiments indicated that crossflow induced transition can be triggered when ReCF varied in the range of 200–250 on subsonic swept wing [42], and it was observed in the research of Reed et al. [43] and Malik et al. [44] that transition front ReCF requires an even larger value for a hypersonic circular cone. Meanwhile, the entropy layer generated by shock lying between shock and boundary layer would have a great influence. Based on the ideal gas assumption, the local entropy can be calculated as:
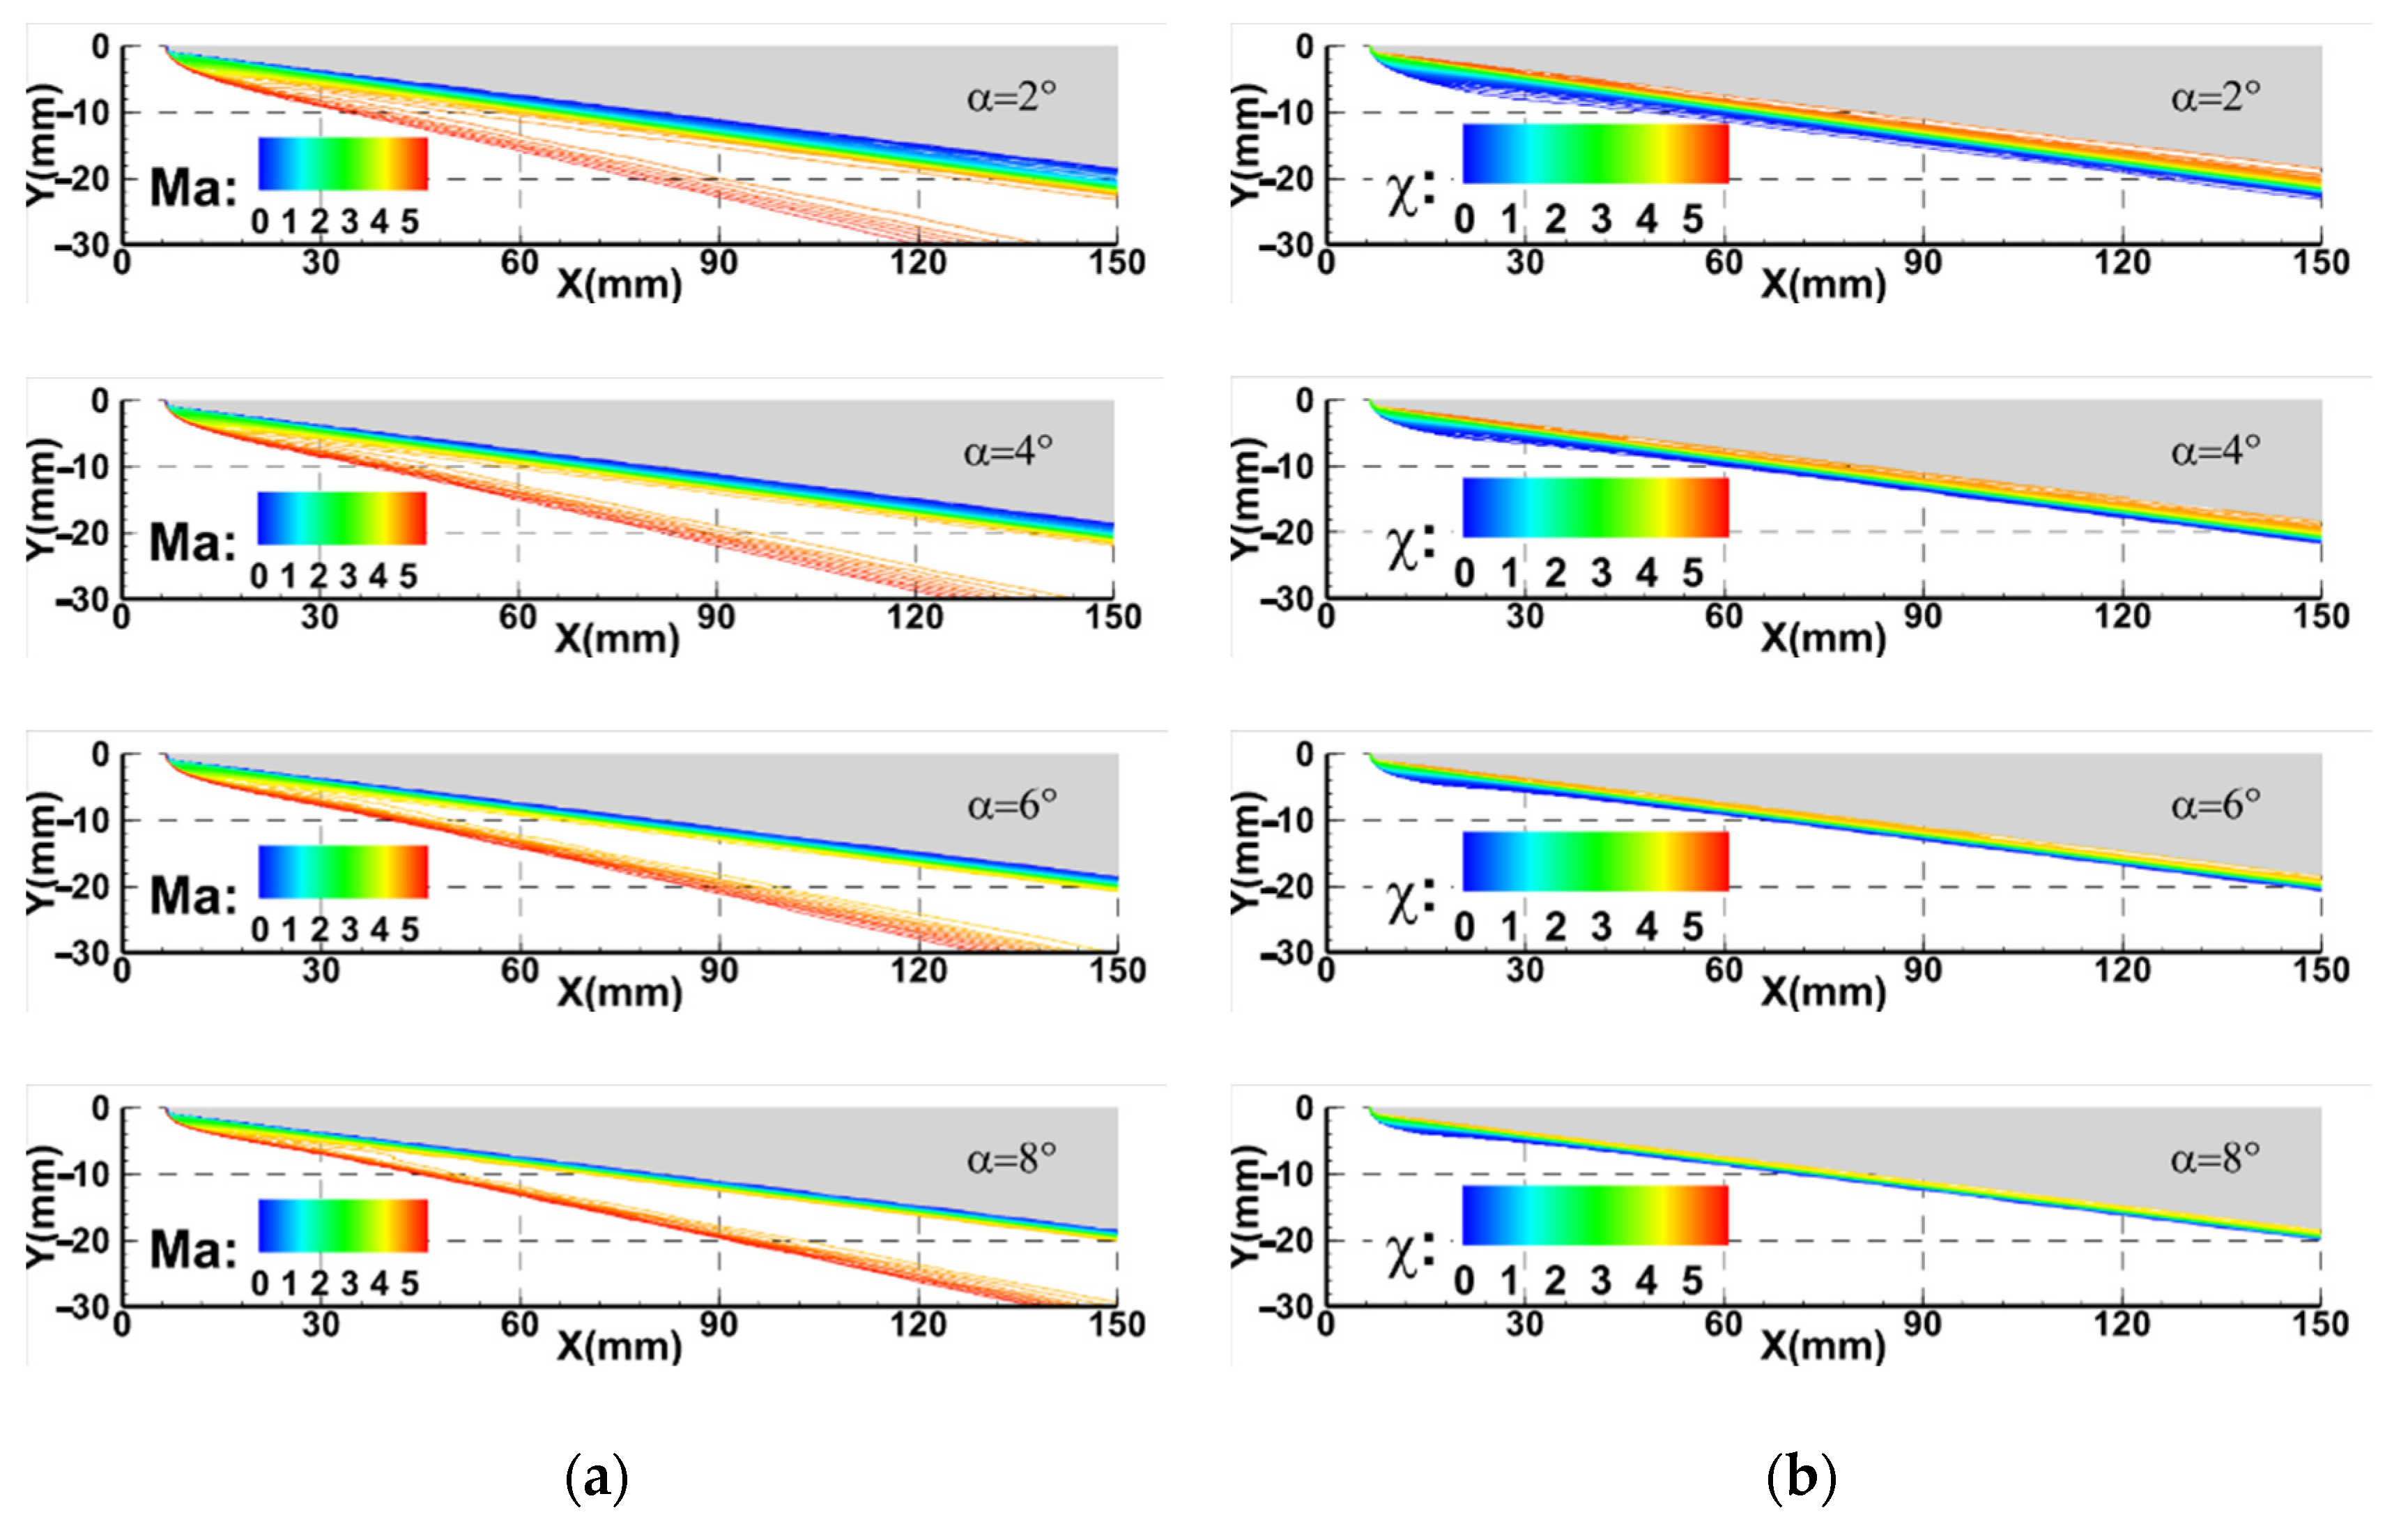
The Ma and χ contours on symmetry plane are delineated in Figure 18. As α increases, the shock is closer to the wall, which leads to a thinner boundary layer and entropy layer. Furthermore, the thickness of the entropy layer decreases rapidly than the boundary layer when α is larger than 4°, which means that the entropy layer would be swallowed by the boundary layer. As the entropy layer has a great reduction influence on the edge Mach number, edge density of boundary layer, and local Reynolds number [45], an earlier swallowed entropy layer means a larger edge Mach number. From the perspective of model construction, the earlier swallowed entropy layer gives birth to a larger ζeff and μt near the wall, and the timescale of the first and second unstable disturbances would increase correspondingly, which stimulates an earlier transition in the end when α > 4°. Furthermore, the more body-fitted shock can raise the edge density and the edge Mach number. Considering the construction of Reynolds number, the local Reynolds number would increase commensurably, which results in an earlier transition onset.
Table 4 shows the comparison of Qmax with and without an aerodisk under different α. Obviously, negligible differences of Qmax are observed under different α without an aerodisk. As for Qmax with an aerodisk, the aerodisk could reduce the Qmax up to 15.2%; however, the effect is less and less noticeable with increasing α. It is easy to comprehend that, as α increases, the bow shock on windward side becomes more and more body fitted. The strengthening shock wave interaction brings a growing wall heat flux near the reattachment point with increasing α, which weakens the influence of an aerodisk on reducing wall heat flux.
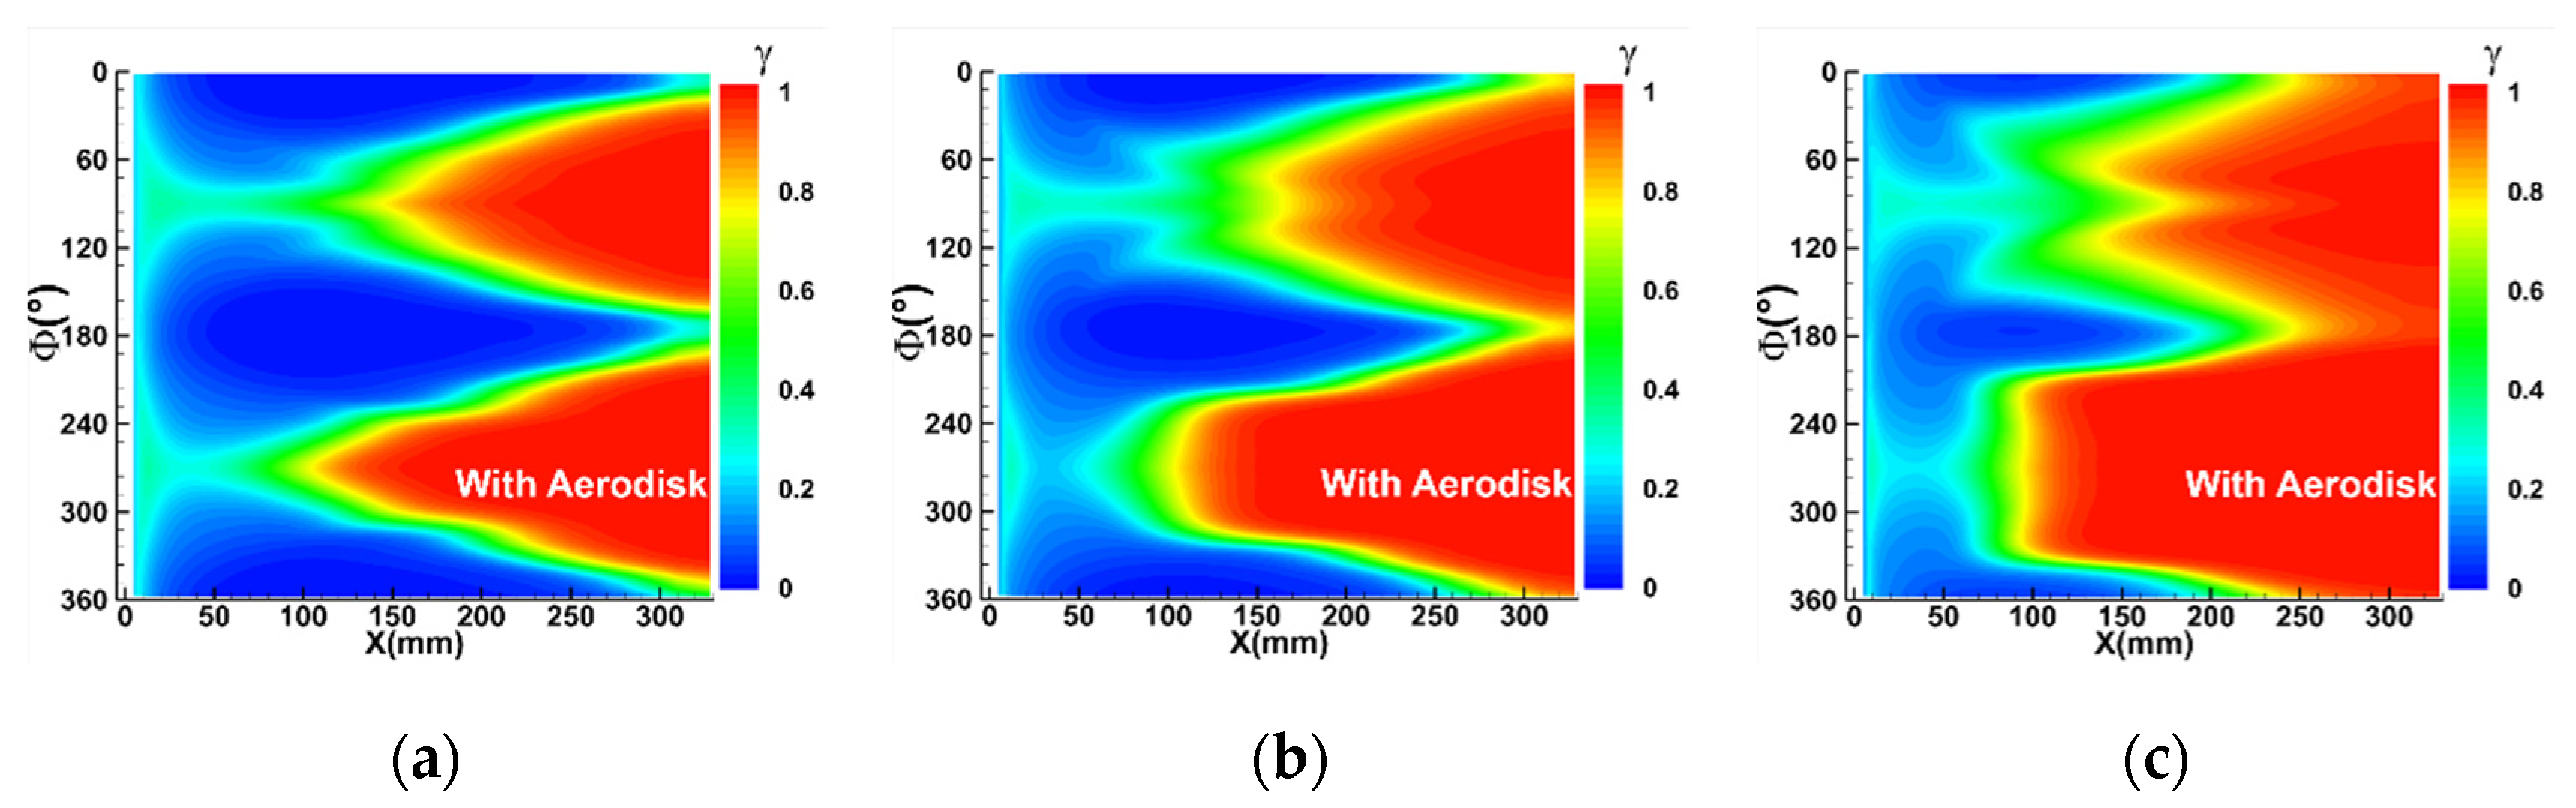
The change rules of boundary layer transition of HIFiRE-5 configuration with an aerodisk are almost identical to that without aerodisk, as shown in Figure 19. Nevertheless, on the one side, the transition shapes with aerodisks are distinct from that without an aerodisk. On the other side, the transition shapes of windward and leeward surface are extremely different with α increasing as the transition on each side is dominated by different unstable disturbances respectively. The transition front is evidently more forward than that without an aerodisk, especially the area near the centerline, which is a phenomenon similar to the conditions with a zero angle of attack. Similarly, the recirculation zones are created in the leading edge owing to the existence of an aerodisk. Furthermore, the reattachment shock wave creates a large adverse pressure gradient between a recirculation zone with low pressure and a reattachment point with high pressure, which results in the boundary layer separation induced transition. Considering the leeward side (0 < Φ < 180°), with the increase of α, the shock before nose is gradually weakened, which reduces the adverse pressure gradient and restrains the separation induced transition to a certain extent. Therefore, the transition length increases with the increasing α. Moreover, the enhancing crossflow widens the transition shape as analyzed in the previous section.
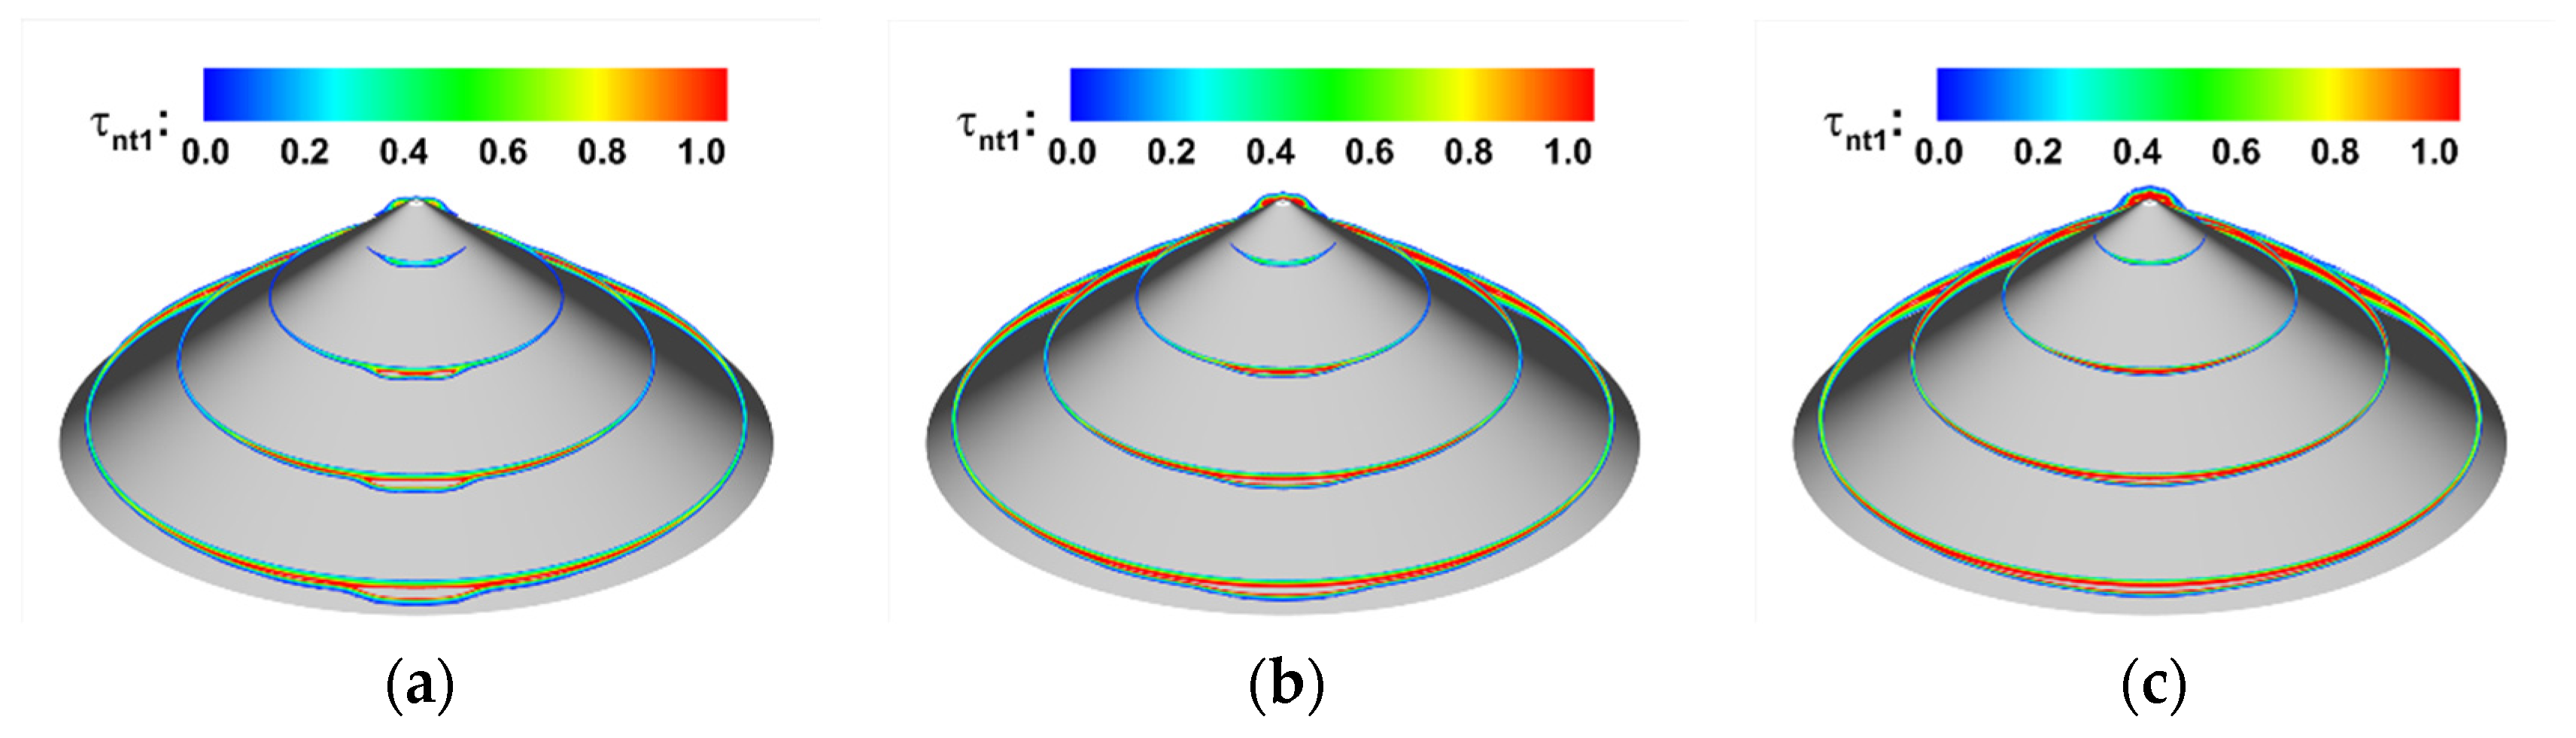
As for the windward side (180° < Φ < 360°), Figure 20 shows the distribution of the first unstable disturbance timescale (τnt1) on the windward surface. According to the previous analysis, the maximum crossflow velocity would be declined owing to the decayed spanwise pressure gradient. Furthermore, the increase of α prevents the windward boundary layer from becoming thicker. Consequently, with small |ω/Ue|max and δ, the cross-mode unstable disturbance is not strong enough to trigger the boundary layer transition with α, and the transition is dominated by the longitudinal vortex which could be expressed by the first and second unstable disturbances as the aforementioned reason. The rapid attenuation of the entropy layer on the windward side promotes the development of the first unstable disturbance, and the region with a large timescale of the first unstable disturbance is dilated. Consequently, the transition shape is relevantly broadened, and the transition onset in the area between centerline and side edge moves upstream with the increasing α. Furthermore, the more body-fitted shock results in the higher density and Mach number of boundary layer edge, which leads to a larger Reynolds number and hence brings about a trend of earlier boundary layer transition.
5. Conclusions
Boundary layer transition is almost ineluctable in the case of a spiked blunt body in hypersonic flow and even dominates the heat flux reduction results of an aerodisk but has rarely been focused upon in current research. Consequently, by considering HIFiRE-5 configuration with conspicuous boundary layer transition, this study explores the influence of an aerodisk on hypersonic boundary layer transition. The effects of aerodisk length (L) and angle of attack (α) on transition and heat flux are explored and discussed in detail. Some meaningful conclusions are summarized:
- (1)
- Owing to the nonuniform distributed conical shock resulting from the elliptical cross section of HIFiRE-5 configuration, the crossflow initiates with streamlines travelling from the side edge to the centerline. Meanwhile, the mushroom-shaped longitudinal vortex is generated near the centerline, and the boundary layer transition near the centerline is dominated by the longitudinal vortex while other regions are dominated by the cross-mode unstable disturbance.
- (2)
- The existence of an aerodisk transforms the flow field characteristic near the nose and creates recirculation regions with low pressure and reattachment shock, which results in an adverse pressure gradient. The separation-induced transition occurring in the shear layer of boundary layer separation position is triggered. Consequently, the transition region dilates and the transition onset near the centerline moves upstream compared to the case without an aerodisk.
- (3)
- By employing five lengths of an aerodisk, it is found that, with aerodisk length increasing, both varieties of maximum pressure (Pmax) and maximum heat flux (Qmax) are non-monotonous, which decrease first in the range of L = 2 mm to 6 mm and then increase. The aerodisk effects on drag and heat reduction are significant, whose aerodisk contributes to the reduction of Qmax by up to 52.0%, and Pmax without an aerodisk is even up to 5.1 times that with an aerodisk. The best drag and heat reduction efficiency is obtained when L = 6 mm. Nevertheless, the transition is triggered earlier by an aerodisk in the meantime, which dilates the region with high heat flux. In other words, the increase of boundary layer heat flux on afterbody is an inevitable compromise on reducing Pmax and Qmax on the forebody, which demands integration considerations during hypersonic vehicle and aerodisk design.
- (4)
- The influence of aerodisk length on boundary layer transition is largely concentrated near the centerline, while the effect on the transition shape in the area between centerline and side edge is nearly negligible. With an increase in the aerodisk length, the variety of γ growth rate along the centerline dominated by an adverse pressure gradient also obeys the non-monotonous trend and reaches its peak at a L = 6 mm aerodisk.
- (5)
- The effect of α is found to weaken the influence of an aerodisk on reducing wall heat flux and result in different shapes of the transition region on the windward and leeward surfaces. With increase in α, the transition onset on leeward side moves forward and crossflow becomes strong with a two-lobed shape. Regarding the windward side, as α increases, the crossflow weakens and the transition is dominated by the longitudinal vortex, which results in the transition front moving downstream first and then upstream.
This study investigates the effect of an aerodisk on hypersonic boundary layer transition over HIFiRE-5 configuration, and provides references for the excogitation and utilization of a hypersonic vehicle aerodisk. However, owing to the highly complex and chaotic nature of the transition mechanism, the profound and integrated studies over multifarious configurations are still required to be conducted in the future.
Author Contributions
Conceptualization, Y.Z. and Z.S.; methodology, Y.Z.; software, Y.Z.; validation, Z.S.; formal analysis, Y.Z. and Z.S.; investigation, Z.S.; resources, Y.Z.; data curation, Z.S.; writing—original draft preparation, Y.Z. and Z.S.; writing—review and editing, Y.Z. and Z.S.; visualization, Z.S.; supervision, H.L.; project administration, H.L. All authors have read and agreed to the published version of the manuscript.
Funding
This research was supported by the National Natural Science Foundation of China (Nos. 11902367 and 12202506), the State Key Laboratory of Aerodynamics, China (No. SKLA-20200202), and the National Natural Science Foundation of Hunan Province, China (No. S2021JJQNJJ2716). This work was supported in part by the High Performance Computing Center of Central South University.
Conflicts of Interest
The authors declare that there is no conflict of interest.
References
- Obinna, U.; Najafi, H. Thermal protection systems for space vehicles: A review on technology development, current challenges and future prospects. Acta Astronaut. 2020, 176, 341–356. [Google Scholar]
- Borg, M.P.; Schneider, S.P. Effect of freestream noise on roughness-induced transition for the X-51A forebody. J. Spacecr. Rocket. 2008, 45, 1106–1116. [Google Scholar] [CrossRef] [Green Version]
- Borg, M.P. Laminar Instability and Transition on the X-51A; Purdue University: West Lafayette, IN, USA, 2009. [Google Scholar]
- Borg, M.P.; Schneider, S.P. Effect of Freestream Noise on Instability and Transition for the X-51A Lee Side. AIAA Pap. 2009, 2009, 396. [Google Scholar]
- Yan, C.; Qu, F.; Zhao, Y.; Yu, J.; Wu, C.; Zhang, S. Review of development and challenges for physical modeling and numerical scheme of CFD in aeronautics and astronautics. Acta Aerodyn. Sin. 2020, 38, 829–857. [Google Scholar]
- Juniper Matthew, P. Triggering in the horizontal Rijke tube: Non-normality, transient growth and bypass transition. J. Fluid Mech. 2011, 667, 272–308. [Google Scholar] [CrossRef] [Green Version]
- Slotnick, J.P.; Khodadoust, A.; Alonso, J.; Darmofal, D.; Gropp, W.; Lurie, E.; Mavriplis, D. CFD Vision 2030 Study: A Path to Revolutionary Computational Aerosciences; NASA: Washington, DC, USA, 2014.
- Wang, L.; Fu, S. Modelling flow transition in a hypersonic boundary layer with Reynolds-averaged Navier-Stokes approach. Sci. China Ser. G Phys. Mech. Astron. 2009, 52, 768–774. [Google Scholar] [CrossRef]
- Wang, L.; Fu, S. Development of an intermittency equation for the modeling of the supersonic/hypersonic boundary layer flow transition. Flow Turbul. Combust. 2011, 87, 165–187. [Google Scholar] [CrossRef]
- Fu, S.; Wang, L. RANS modeling of high-speed aerodynamic flow transition with consideration of stability theory. Prog. Aerosp. Sci. 2013, 58, 36–59. [Google Scholar] [CrossRef]
- Zhou, L.; Li, R.; Hao, Z.; Zaripov, D.I.; Yan, C. Improved k-ω-γ model for crossflow-induced transition prediction in hypersonic flow. Int. J. Heat Mass Transf. 2017, 115, 115–130. [Google Scholar] [CrossRef]
- Zhao, Y.; Chen, J.; Zhao, R.; Liu, X. Assessment and improvement of k-ω-γ model for separation-induced transition prediction. Chin. J. Aeronaut. 2022, 35, 219–234. [Google Scholar] [CrossRef]
- Vignesh, S.; Sundarraj, K.; Kulkarni, P.S. Thermo-fluid analysis of supersonic flow over ballistic shaped bodies with multiple aero-disk spike configurations. Acta Astronaut. 2021, 180, 292–304. [Google Scholar]
- Sebastian, J.J.; Suryan, A.; Kim, H.D. Numerical analysis of hypersonic flow past blunt bodies with aerodisks. J. Spacecr. Rocket. 2016, 53, 669–677. [Google Scholar] [CrossRef]
- Fan, D.; Xie, F.; Qin, N.; Huang, W.; Wang, L.; Chu, H. Drag reduction investigation for hypersonic lifting-body vehicles with aerodisk and long penetration mode counterflowing jet. Aerosp. Sci. Technol. 2018, 76, 361–373. [Google Scholar]
- Zhu, Y.; Peng, W.; Xu, R.; Jiang, P. Review on active thermal protection and its heat transfer for airbreathing hypersonic vehicles. Chin. J. Aeronaut. 2018, 31, 1929–1953. [Google Scholar] [CrossRef]
- Fan, D.; Xie, F.; Huang, W.; Dong, H.; Zhang, D. Numerical exploration on jet oscillation mechanism of counterflowing jet ahead of a hypersonic lifting-body vehicle. Sci. China Technol. Sci. 2018, 61, 1056–1071. [Google Scholar]
- Ou, M.; Yan, L.; Huang, W.; Li, S.-B.; Li, L.-Q. Detailed parametric investigations on drag and heat flux reduction induced by a combinational spike and opposing jet concept in hypersonic flows. Int. J. Heat Mass Transf. 2018, 126, 10–31. [Google Scholar] [CrossRef]
- David, R.; Nelson, H.F.; Johnson, E. Blunt-body wave drag reduction using focused energy deposition. AIAA J. 1999, 37, 460–467. [Google Scholar]
- Sajida, M.; Ahmed, Z.; Afzal, S. Numerical Study of Spike on Blunt Nose Configuration at Supersonic Speed. In Proceedings of the 2021 International Bhurban Conference on Applied Sciences and Technologies (IBCAST), Islamabad, Pakistan, 12–16 January 2021. [Google Scholar]
- Xie, Z.W. The Trident II head configuration. Missiles Space Veh. 1980, 6, 1–15. [Google Scholar]
- Zhang, R.-R.; Huang, W.; Yan, L.; Li, L.-Q.; Li, S.-B.; Moradi, R. Numerical investigation of drag and heat flux reduction mechanism of the pulsed counterflowing jet on a blunt body in supersonic flows. Acta Astronaut. 2018, 146, 123–133. [Google Scholar] [CrossRef]
- Ahmed, M.Y.M.; Qin, N. Recent advances in the aerothermodynamics of spiked hypersonic vehicles. Prog. Aerosp. Sci. 2011, 47, 425–449. [Google Scholar] [CrossRef]
- Sun, X.; Huang, W.; Ou, M.; Zhang, R.; Li, S. A survey on numerical simulations of drag and heat reduction mechanism in supersonic/hypersonic flows. Chin. J. Aeronaut. 2019, 32, 771–784. [Google Scholar] [CrossRef]
- Huang, W.; Chen, Z.; Yan, L.; Yan, B.B.; Du, Z.B. Drag and heat flux reduction mechanism induced by the spike and its combinations in supersonic flows: A review. Prog. Aerosp. Sci. 2019, 105, 31–39. [Google Scholar] [CrossRef]
- Sadegh, K.M.; Oboodi, M.J. Investigation and recent developments in aerodynamic heating and drag reduction for hypersonic flows. Heat Mass Transf. 2019, 55, 547–569. [Google Scholar]
- Qin, Q.; Xu, J.; Guo, S. Fluid-thermal analysis of aerodynamic heating over spiked blunt body configurations. Acta Astronaut. 2017, 132, 230–242. [Google Scholar] [CrossRef]
- Noboru, M.; Mihara, K.; Miyajima, R.; Watanuki, T.; Kubota, H. Thermal protection and drag reduction with use of spike in hypersonic flow. In Proceedings of the 10th AIAA/NAL-NASDA-ISAS International Space Planes and Hypersonic Systems and Technologies Conference, Kyoto, Japan, 24–27 April 2001. [Google Scholar]
- Xue, Y.; Wang, L.; Fu, S. Drag reduction and aerodynamic shape optimization for spike-tipped supersonic blunt nose. J. Spacecr. Rocket. 2018, 55, 552–560. [Google Scholar] [CrossRef]
- Zhong, K.; Yan, C.; Chen, S.-s.; Zhang, T.X.; Lou, S. Aerodisk effects on drag reduction for hypersonic blunt body with an ellipsoid nose. Aerosp. Sci. Technol. 2019, 86, 599–612. [Google Scholar] [CrossRef]
- Julio, S.; Gnemmi, P.; Runne, K.; Seiler, F. High-pressure shock tunnel experiments and CFD calculations on spike-tipped blunt bodies. In Proceedings of the 22nd AIAA Aerodynamic Measurement Technology and Ground Testing Conference, St. Louis, MO, USA, 24–26 June 2002. [Google Scholar]
- Crawford, D.H. Investigation of the Flow over Spiked-Nose Hemisphere-Cylinder at Mach Number of 6.8; National Aeronautics and Space Administration: Washington, DC, USA, 1959.
- Wei, H.; Li, L.; Yan, L.; Zhang, T.T. Drag and heat flux reduction mechanism of blunted cone with aerodisks. Acta Astronaut. 2017, 138, 168–175. [Google Scholar]
- Fan, B.; Huang, J. Coupled Fluid-Thermal Investigation on Drag and Heat Reduction of a Hypersonic Spiked Blunt Body with an Aerodisk. Aerospace 2021, 9, 19. [Google Scholar] [CrossRef]
- Kalimuthu, R.; Mehta, R.C.; Rathakrishnan, E. Experimental investigation on spiked body in hypersonic flow. Aeronaut. J. 2008, 112, 593–598. [Google Scholar] [CrossRef]
- Zhao, Y.; Chen, J.; Liu, H. Application of improved k-ω-γ model to deformed hypersonic Inflatable Aerodynamic Decelerator aeroshell. Appl. Therm. Eng. 2022, 214, 118794. [Google Scholar] [CrossRef]
- Karen, B.; Rufer, S.; Kimmel, R.; Adamczak, D. Aerothermodynamic characteristics of boundary layer transition and trip effectiveness of the HIFiRE flight 5 vehicle. In Proceedings of the 39th AIAA Fluid Dynamics Conference, San Antonio, TX, USA, 22–25 June 2009. [Google Scholar]
- Juliano, T.J.; Matthew, P.B.; Steven, P.S. Quiet tunnel measurements of HIFiRE-5 boundary-layer transition. AIAA J. 2015, 53, 832–846. [Google Scholar] [CrossRef]
- Liu, H.; Zhang, S.; Zou, Y.; Yuan, W.; Liu, T.; Zhao, Y. Uncertainty analysis of turbulence model in capturing flows involving laminarization and retransition. Chin. J. Aeronaut. 2022, 35, 148–164. [Google Scholar] [CrossRef]
- Smirnov, N.N.; Betelin, V.B.; Nikitin, V.F.; Stamov, L.I.; Altoukhov, D.I. Accumulation of errors in numerical simulations of chemically reacting gas dynamics. Acta Astronaut. 2015, 117, 338–355. [Google Scholar] [CrossRef]
- Smirnov, N.N.; Betelin, V.B.; Shagaliev, R.M.; Nikitin, V.F.; Belyakov, I.M.; Deryuguin, Y.N.; Aksenov, S.V.; Korchazhkin, D.A. Hydrogen fuel rocket engines simulation using LOGOS code. Int. J. Hydrogen Energy 2014, 39, 10748–10756. [Google Scholar] [CrossRef]
- Lyttle, I.; Reed, H. Use of Transition Correlations for Three-Dimensional Boundary Layers within Hypersonic Flows; American Institute of Aeronautics and Astronautics: Reston, VA, USA, 1995.
- Reed, H.L.; Haynes, T.S. Transition correlations in three-dimensional boundary layers. AIAA J. 1994, 32, 923–929. [Google Scholar] [CrossRef]
- Malik, M.R.; Balakumar, P. Instability and Transition in Three-Dimensional Supersonic Boundary Layers; American Institute of Aeronautics and Astronautics: Reston, VA, USA, 1992.
- Kara, K.; Balakumar, P.; Kandil, O.A. Effects of Nose Bluntness on Hypersonic Boundary-Layer Receptivity and Stability over Cones. AIAA J. 2011, 49, 2593–2606. [Google Scholar] [CrossRef]
Figure 1.
Comparison of γ and TSP distributions. (a) γ distribution, numerical simulation, (b) TSP image, wind tunnel experiment result.
Figure 1.
Comparison of γ and TSP distributions. (a) γ distribution, numerical simulation, (b) TSP image, wind tunnel experiment result.

Figure 2.
HIFiRE-5 configuration fixed on a 2 mm long aerodisk.

Figure 3.
Grids of HIFiRE-5 with the aerodisk. Green: grids on solid surface, Orange: grids on symmetry plane.
Figure 3.
Grids of HIFiRE-5 with the aerodisk. Green: grids on solid surface, Orange: grids on symmetry plane.

Figure 4.
Q of different grids.

Figure 5.
Ma contour and streamlines dyed by P∞.

Figure 6.
Comparison of γ distributions. (a) without aerodisk, (b) with 2 mm long aerodisk.

Figure 7.
HIFiRE-5 streamlines near the aerodisk.

Figure 8.
Comparison of streamlines over nosetip (left half: without aerodisk; right half: with aerodisk).
Figure 8.
Comparison of streamlines over nosetip (left half: without aerodisk; right half: with aerodisk).

Figure 9.
Comparison of P/P∞ along the side edge and centerline with different aerodisk lengths. (a) along the side edge, (b) along centerline.
Figure 9.
Comparison of P/P∞ along the side edge and centerline with different aerodisk lengths. (a) along the side edge, (b) along centerline.

Figure 10.
Comparison of τcross distribution. (a) with aerodisk, (b) without aerodisk.

Figure 11.
Comparison of crossflow Reynolds number and boundary layer thickness at X = 300 mm. (a) comparison of ReCF, (b) comparison of δ.
Figure 11.
Comparison of crossflow Reynolds number and boundary layer thickness at X = 300 mm. (a) comparison of ReCF, (b) comparison of δ.

Figure 12.
Comparison of P/P∞ in the leading edge. (a) L = 2 mm, (b) L = 6 mm, (c) L = 12 mm.

Figure 13.
Distributions of γ. (a) L = 2 mm, (b) L = 6 mm, (c) L = 12 mm.

Figure 14.
Comparison of γ with different aerodisk lengths. (a) Z = 0 mm, (b) Z = 30 mm, (c) X = 60 mm, (d) X = 80 mm.
Figure 14.
Comparison of γ with different aerodisk lengths. (a) Z = 0 mm, (b) Z = 30 mm, (c) X = 60 mm, (d) X = 80 mm.

Figure 15.
Azimuth diagram of HIFiRE-5.

Figure 16.
Characteristics of flow field of HIFiRE-5 under different α. (a) α = 2°, (b) α = 4°, (c) α = 6°.
Figure 16.
Characteristics of flow field of HIFiRE-5 under different α. (a) α = 2°, (b) α = 4°, (c) α = 6°.

Figure 17.
Distributions of γ without aerodisk at α = 2°,4°,6°. (a) α = 2°, (b) α = 4°, (c) α = 6°.

Figure 18.
Distribution of Ma and χ contour without an aerodisk on the symmetry plane at different α. (a) Ma contour, (b) χ contour.
Figure 18.
Distribution of Ma and χ contour without an aerodisk on the symmetry plane at different α. (a) Ma contour, (b) χ contour.

Figure 19.
Distributions of γ with aerodisks at α = 2°,4°,6°. (a) α = 2°, (b) α = 4°, (c) α = 6°.

Figure 20.
Distribution of the first unstable disturbance on windward surface. (a) α = 2°, (b) α = 4°, (c) α = 6°.
Figure 20.
Distribution of the first unstable disturbance on windward surface. (a) α = 2°, (b) α = 4°, (c) α = 6°.


Table 1.
Freestream conditions.
| Ma∞ | Re∞ (/m) | T∞ (K) | ρ∞ (kg/m3) | Tw (K) | Tu∞ (%) |
|---|---|---|---|---|---|
| 5.8 | 6.1 × 10⁶ | 51.4 | 0.024 | 300 | 0.1 |
Table 2.
Grid resolutions.
| Grid Name | Grid Resolution | Wall Normal Distance of the First Grid Cell Δx (m) | Grid Reynolds Number ReΔx | ||
|---|---|---|---|---|---|
| Block 1 | Block 2 | Block 3 | |||
| G1 | 32 × 51 × 64 | 90 × 121 × 104 | 170 × 52 × 81 | 3.5 × 10⁻⁶ | 20 |
| G2 | 32 × 61 × 84 | 70 × 101 × 84 | 180 × 72 × 101 | 1.6 × 10⁻⁶ | 10 |
| G3 | 32 × 71 × 104 | 50 × 81 × 64 | 190 × 92 × 121 | 9.5 × 10⁻⁷ | 6 |
Table 3.
Comparison of (P/P∞)max and Qmax with different aerodisk lengths.
| Aerodisk Length (mm) | 0 (without Aerodisk) | 2 | 4 | 6 | 8 | 12 |
|---|---|---|---|---|---|---|
| Qmax (kW·m−2) | 121,850.82 | 93,976.25 | 87,560.46 | 58,497.42 | 71,650.69 | 86,419.36 |
| (P/P∞)max | 31.04 | 9.03 | 8.01 | 6.03 | 6.29 | 6.93 |
Table 4.
Comparison of Qmax with different angles of attack.
| Angle of Attack | 2° | 4° | 6° |
|---|---|---|---|
| Qmax (kW·m−2) without Aerodisk | 125,625.01 | 125,641.13 | 125,644.68 |
| Qmax (kW·m−2) with Aerodisk | 106,526.14 | 114,884.95 | 125,453.39 |
Publisher’s Note: MDPI stays neutral with regard to jurisdictional claims in published maps and institutional affiliations. |
© 2022 by the authors. Licensee MDPI, Basel, Switzerland. This article is an open access article distributed under the terms and conditions of the Creative Commons Attribution (CC BY) license (https://creativecommons.org/licenses/by/4.0/).
Share and Cite
MDPI and ACS Style
Zhao, Y.; Shao, Z.; Liu, H. Aerodisk Effect on Hypersonic Boundary Layer Transition and Heat Transfer of HIFiRE-5 Vehicle. Aerospace 2022, 9, 742. https://doi.org/10.3390/aerospace9120742
AMA Style
Zhao Y, Shao Z, Liu H. Aerodisk Effect on Hypersonic Boundary Layer Transition and Heat Transfer of HIFiRE-5 Vehicle. Aerospace. 2022; 9(12):742. https://doi.org/10.3390/aerospace9120742
Chicago/Turabian StyleZhao, Yatian, Zhiyuan Shao, and Hongkang Liu. 2022. "Aerodisk Effect on Hypersonic Boundary Layer Transition and Heat Transfer of HIFiRE-5 Vehicle" Aerospace 9, no. 12: 742. https://doi.org/10.3390/aerospace9120742
Note that from the first issue of 2016, this journal uses article numbers instead of page numbers. See further details here.