Article

The Influence of Steady Air Jet on the Trailing-Edge Shock Loss in a Supersonic Compressor Cascade

College of Aerospace Science and Engineering, National University of Defense Technology, Changsha 410073, China
*
Authors to whom correspondence should be addressed.
Aerospace 2022, 9(11), 713; https://doi.org/10.3390/aerospace9110713
Submission received: 13 September 2022 / Revised: 4 November 2022 / Accepted: 7 November 2022 / Published: 12 November 2022
(This article belongs to the Special Issue Flow Control and Drag Reduction)

Abstract

:
To effectively reduce shock wave loss at the trailing edge of a supersonic cascade under high back-pressure, a shock wave control method based on air jets is proposed. The air jet was arranged on the pressure side of the blade in the upstream of the trailing-edge shock. The flow control mechanism and effects of parameters were analyzed by computational methods. The results show that the air jet formed an oblique shock wave in the cascade passage which decelerated and pressurized the airflow. The resulting expansion wave downstream of the jet slot weakened the strength of the trailing-edge shock. This could effectively change the normal shock into oblique shock and thus weaken the shock loss. Optimal control effect was achieved when the mass flow rate ratio of the jet to the passage airflow remained 0.35–1.11% and the distance from the jet slot to the shock foot of the trailing-edge shock was about five times the thickness of the boundary layer. The proposed method can reduce the total pressure loss of a supersonic cascade, with the maximum improvement effect reaching 7.29% compared to the no-control state.

Graphical Abstract

1. Introduction

The relentless demand for highly loaded compressors with supersonic speed poses great challenges for the design and development of compressor cascades [1,2]. As the design Mach number increases, shock wave structures in the cascade passage tend to become complex and the strength of shock waves increases, which results in increased thickness of the boundary layer, shock wave/ boundary layer interaction (SWBLI) and flow separation, or even a stall [3]. Shock wave losses account for an increasing proportion of total losses in supersonic cascades [4]. In future studies of supersonic cascades, it is likely that shock wave loss will receive more attention. Targeted blade optimization and flow control has been carried out widely.
Much research has focused on numerical optimization. An advanced blade design can lead to greater efficiency [5,6]. Song optimized cascades for a transonic fan stator to control the SWBLI and reduced the losses induced by separation and shock [7]. Liu proposed a rapid analytical shock-loss prediction method for tailoring the shock system, which is practical for a quick search of the optimized shock structure [8]. Sun reduced terminal-passage shock loss by optimizing the cascade profile [9]. Sonoda optimized the 2D DLR-PAV-1.5 supersonic cascade and minimized the shock loss with about 24% reduction of the total pressure loss coefficient [10]. In recent years, with the development of optimization algorithms, more progress has been made in optimizing cascade profiles. Optimization algorithms, such as differential evolution and genetic algorithms, have been combined with CFD to improve computational efficiency and increase the chance of achieving better optimization results [11,12]. In the above-mentioned work, the key factor was to reduce shock loss by optimization.
Flow control technologies are more powerful means, such as vortex generator, bump structure, boundary layer suction, boundary blowing, plasma actuation, and self-sustaining dual synthetic jets [13,14,15,16,17,18,19]. One of the effective control modes is to inject fluid into the mainstream of the cascade. Ma retrained corner separation with a jet flow induced by a blade end slot [20]. The total pressure loss coefficient was decreased by 9.7% and this control method weakened the corner separation after the shock wave. Benini improved the aerodynamic behavior of a transonic compressor rotor with synthetic jets numerically [21]. The flow was less detached and the SWBLI was less detrimental. Klinner applied air jet vortex generators which produced streamwise vorticity and made the boundary layer less prone to separation in a transonic cascade [22]. Meanwhile, injection can play an effective role of the cooling of turbine blade rows [23,24]. Gao arranged a jet slot at the trailing edge of a transonic turbine cascade [25]. The injection filled the momentum deficit of the boundary layer and reduced the strength of the shock wave.
There is less research into the application of jet control on supersonic cascades compared to other traditional control methods. However, the capability of jets to control shock waves and separation induced by SWBLI in the supersonic flow field has been fully verified. Szwaba applied an air jet to control separation induced by normal shock [26,27]. This technique entrained high-momentum fluid into the boundary layer, which counteracted separation. Souverien reduced the size of the separation bubble induced by SWBLI with the air jet [28]. The air was injected into mainstream from a row of holes and had an effect similar to that of a vortex generator. Verma placed an array of steady micro-jets upstream of a compression ramp and reduced the extent of separation effectively [29,30]. Existing studies see the main role of the air jet is to inject high-momentum fluid into the boundary layer, contain separation, and weaken the shock strength. The use of air jets to reduce shock loss by affecting shock structures marks a different approach. Clearly, applying air jets to supersonic cascades is worthy of further study.
In this paper, a shock loss control method for a supersonic cascade is proposed which is based on a steady air jet. The air jet was mounted on the pressure side of a high incoming Mach number supersonic cascade. Influence of different parameters of the air jet on the flow control effect are discussed in detail. This paper is arranged as follows. Section 2 introduces the physical model and numerical method. Section 3.1 compares the flow fields of the baseline and controlled case to discuss the effect of the air jet on the cascade. After that, analysis of parameters is presented in Section 3.2. Finally, Section 4 offers conclusions.

2. Numerical Methods and Validation
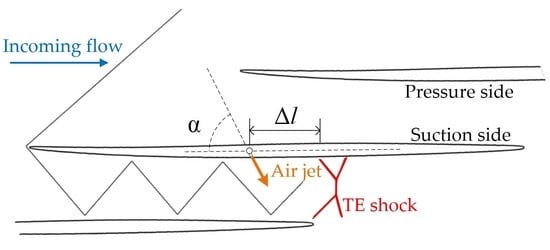
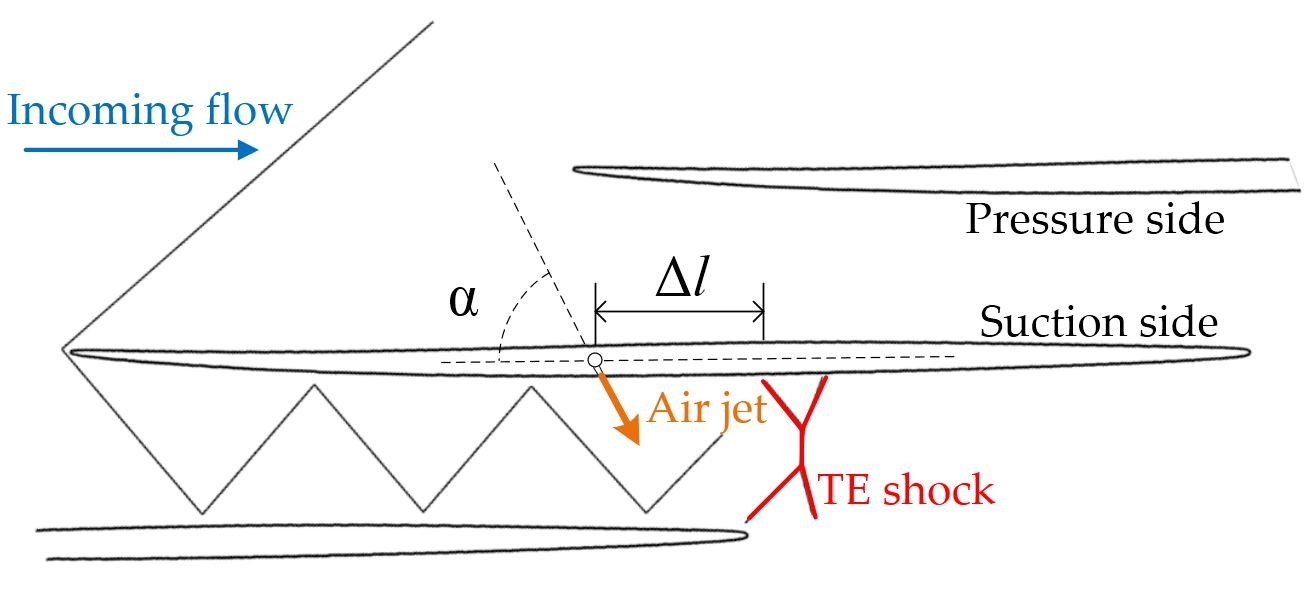
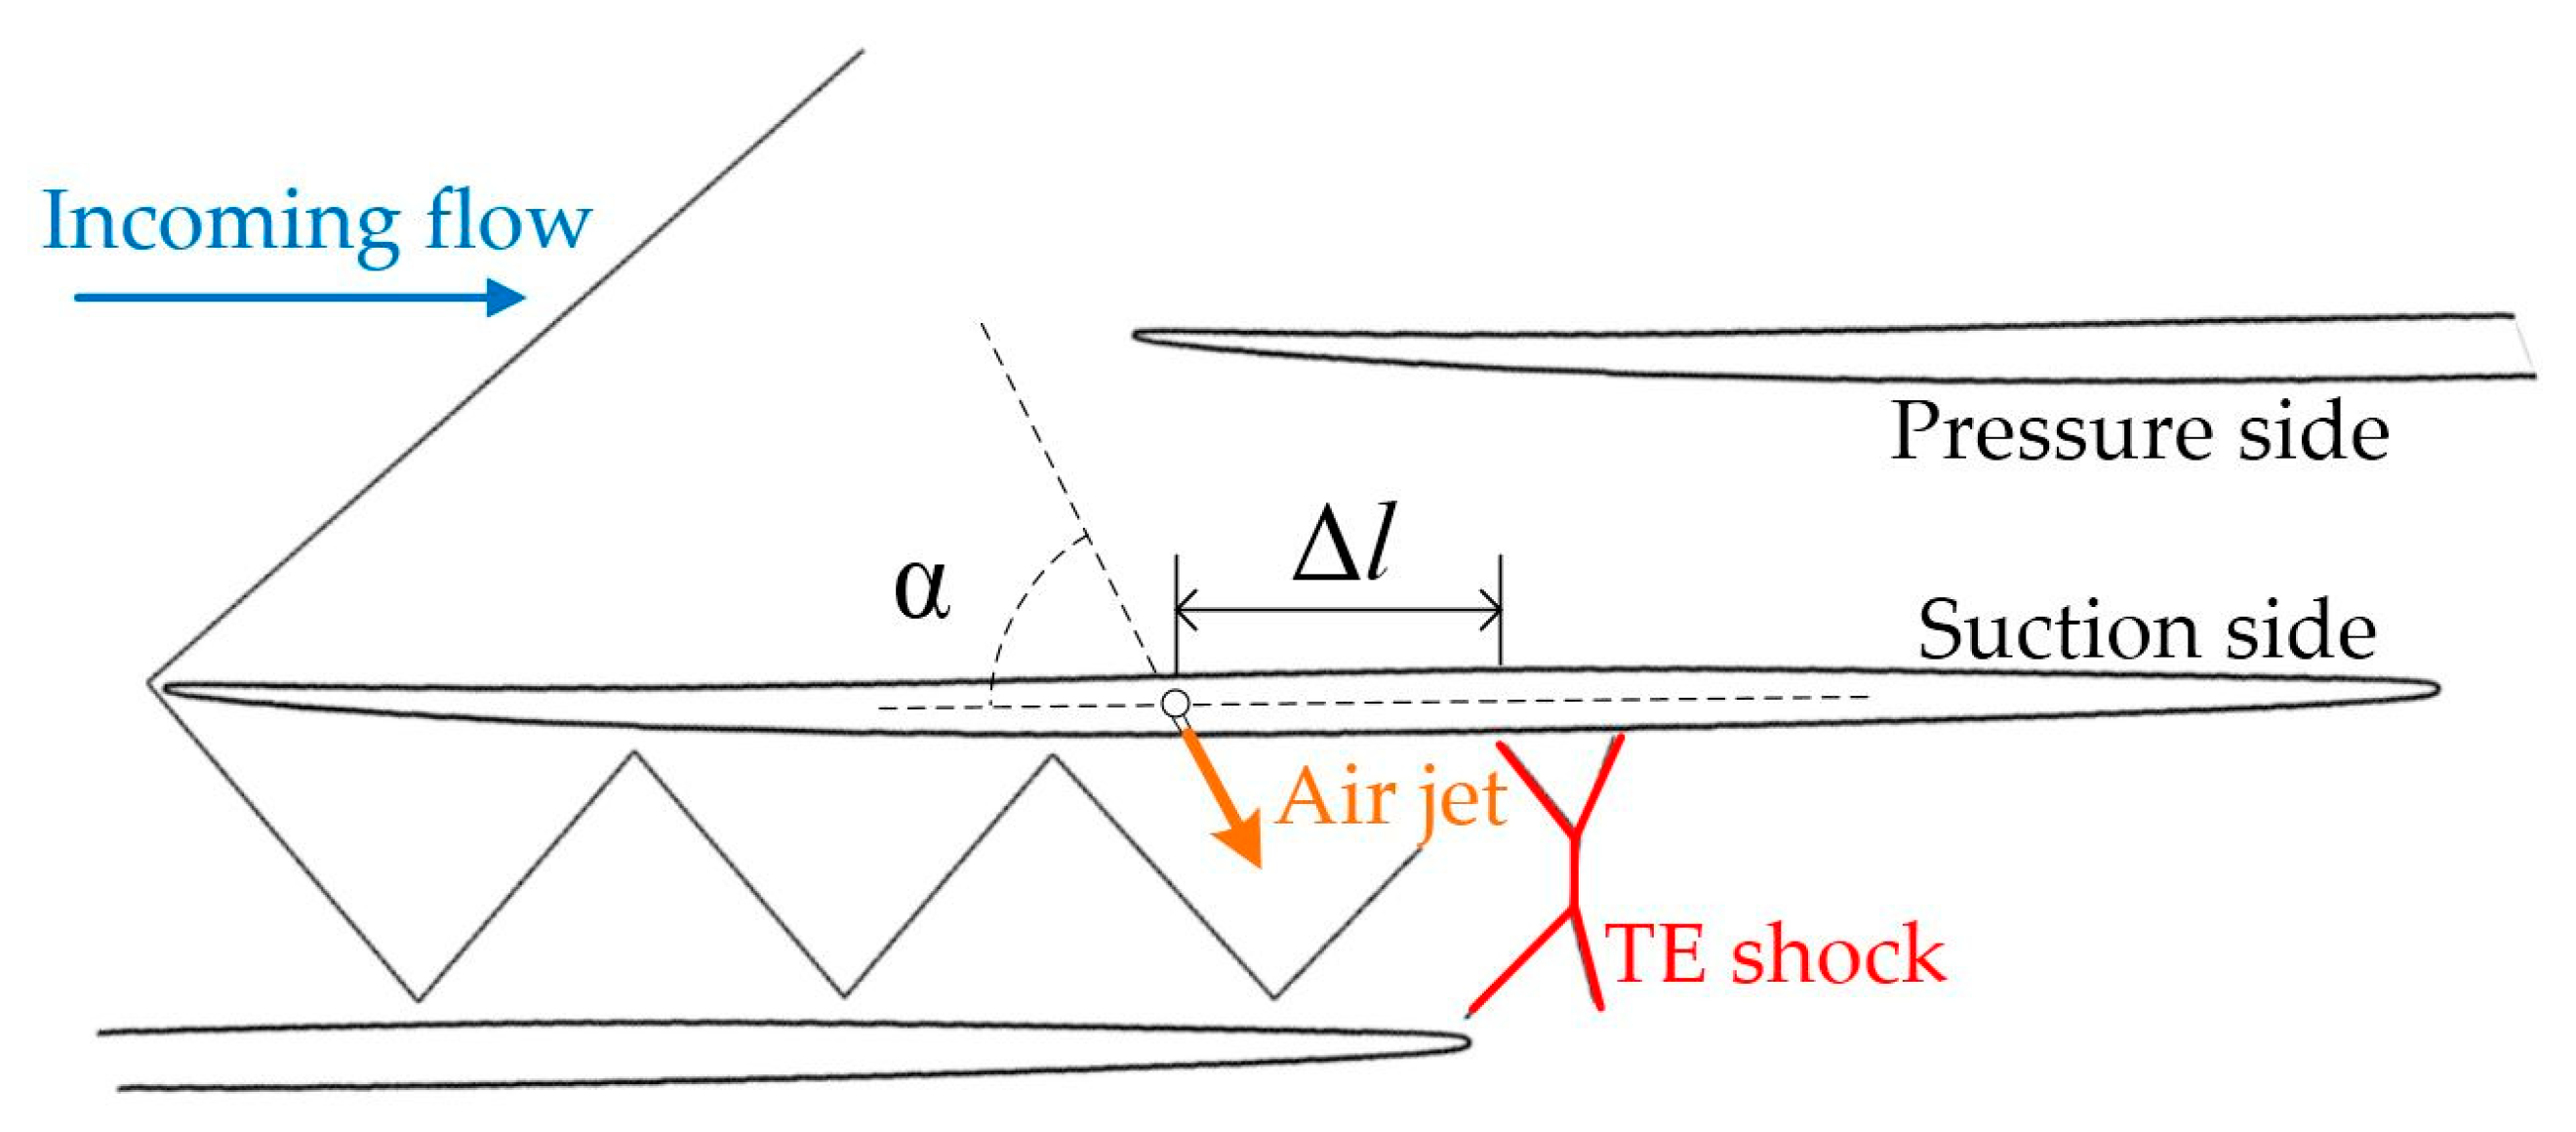
2.1. Physical Model

The study of trailing-edge shock control using an air jet on the pressure side of the supersonic cascade was based on a “shock-in-type” supersonic cascade. The SCM-1.75 supersonic cascade was selected, having been designed for a higher incoming Mach number than conventional supersonic cascades [31]. The SCM-1.75 draws on the design principle of the supersonic inlet in which multiple reflected shock waves are formed after the leading-edge shock wave extends into the cascade passage. The main parameters of the studied cascade are given in Table 1.
A 2D Reynolds-Averaged Navier-Stokes solver of ANSYS Fluent was employed on a single cascade passage with structured grid. Two-dimensional calculation simulates the flow field of the blade with an infinite aspect length. The 3D effect near the end walls is ignored, having little influence on the flow field near the middle spanwise of blade. This helps to focus attention on the influence of the air jet on the boundary layer near the blade surface, and the shock system structure in the blade passage. Grids were built by means of Pointwise. The fluid was assumed to be an ideal gas.
The computational domain contained a single blade with the inlet boundary at 1 time the chord length in front of the cascade and the outlet boundary at 1 time the chord length behind the cascade. The first mesh height of the blade surface was set to 1 × 10⁻⁶ m to ensure that the values of y+ near blade surface were less than 1. Due to the complex shock wave structure near the leading and trailing edges of the blade and the dramatic changes in the flow field parameters, the grid needed to be encrypted. The computational domain and grid are shown in Figure 1. The inlet boundary of the computational domain was the pressure far-field boundary and the outlet boundary was the pressure outlet. The blade wall was an adiabatic non-slip wall surface. The upper and lower boundaries of the domain were set as translational periodic boundaries. The inlet boundary condition was given the same total temperature and pressure as the experimental measurements [31]. The total pressure was given as 380 kPa, the total temperature was given as 320 K, and the incoming Mach number was 1.75, while the inflow angle was set at 70.5°. The pressure inlet was used to simulate the effect of a micro jet. The width of jet slot was 1 mm.
The control scheme of the air jet on the “shock-in-type” supersonic cascade is shown in Figure 2. The jet slot was arranged on the pressure side of the blade located upstream of the trailing-edge (TE) shock. The location of the air jet Δ l is defined as the distance between the jet slot and the front foot of the λ shock wave on the pressure side. The Δ l is dimensionless as the ratio of actual distance to the local boundary layer thickness. The jet angle α is defined as the angle between the direction of the air jet and the chordal direction of the blade. The strength of the jet is measured by the mass-weighted average total pressure at the outlet of the jet slot.

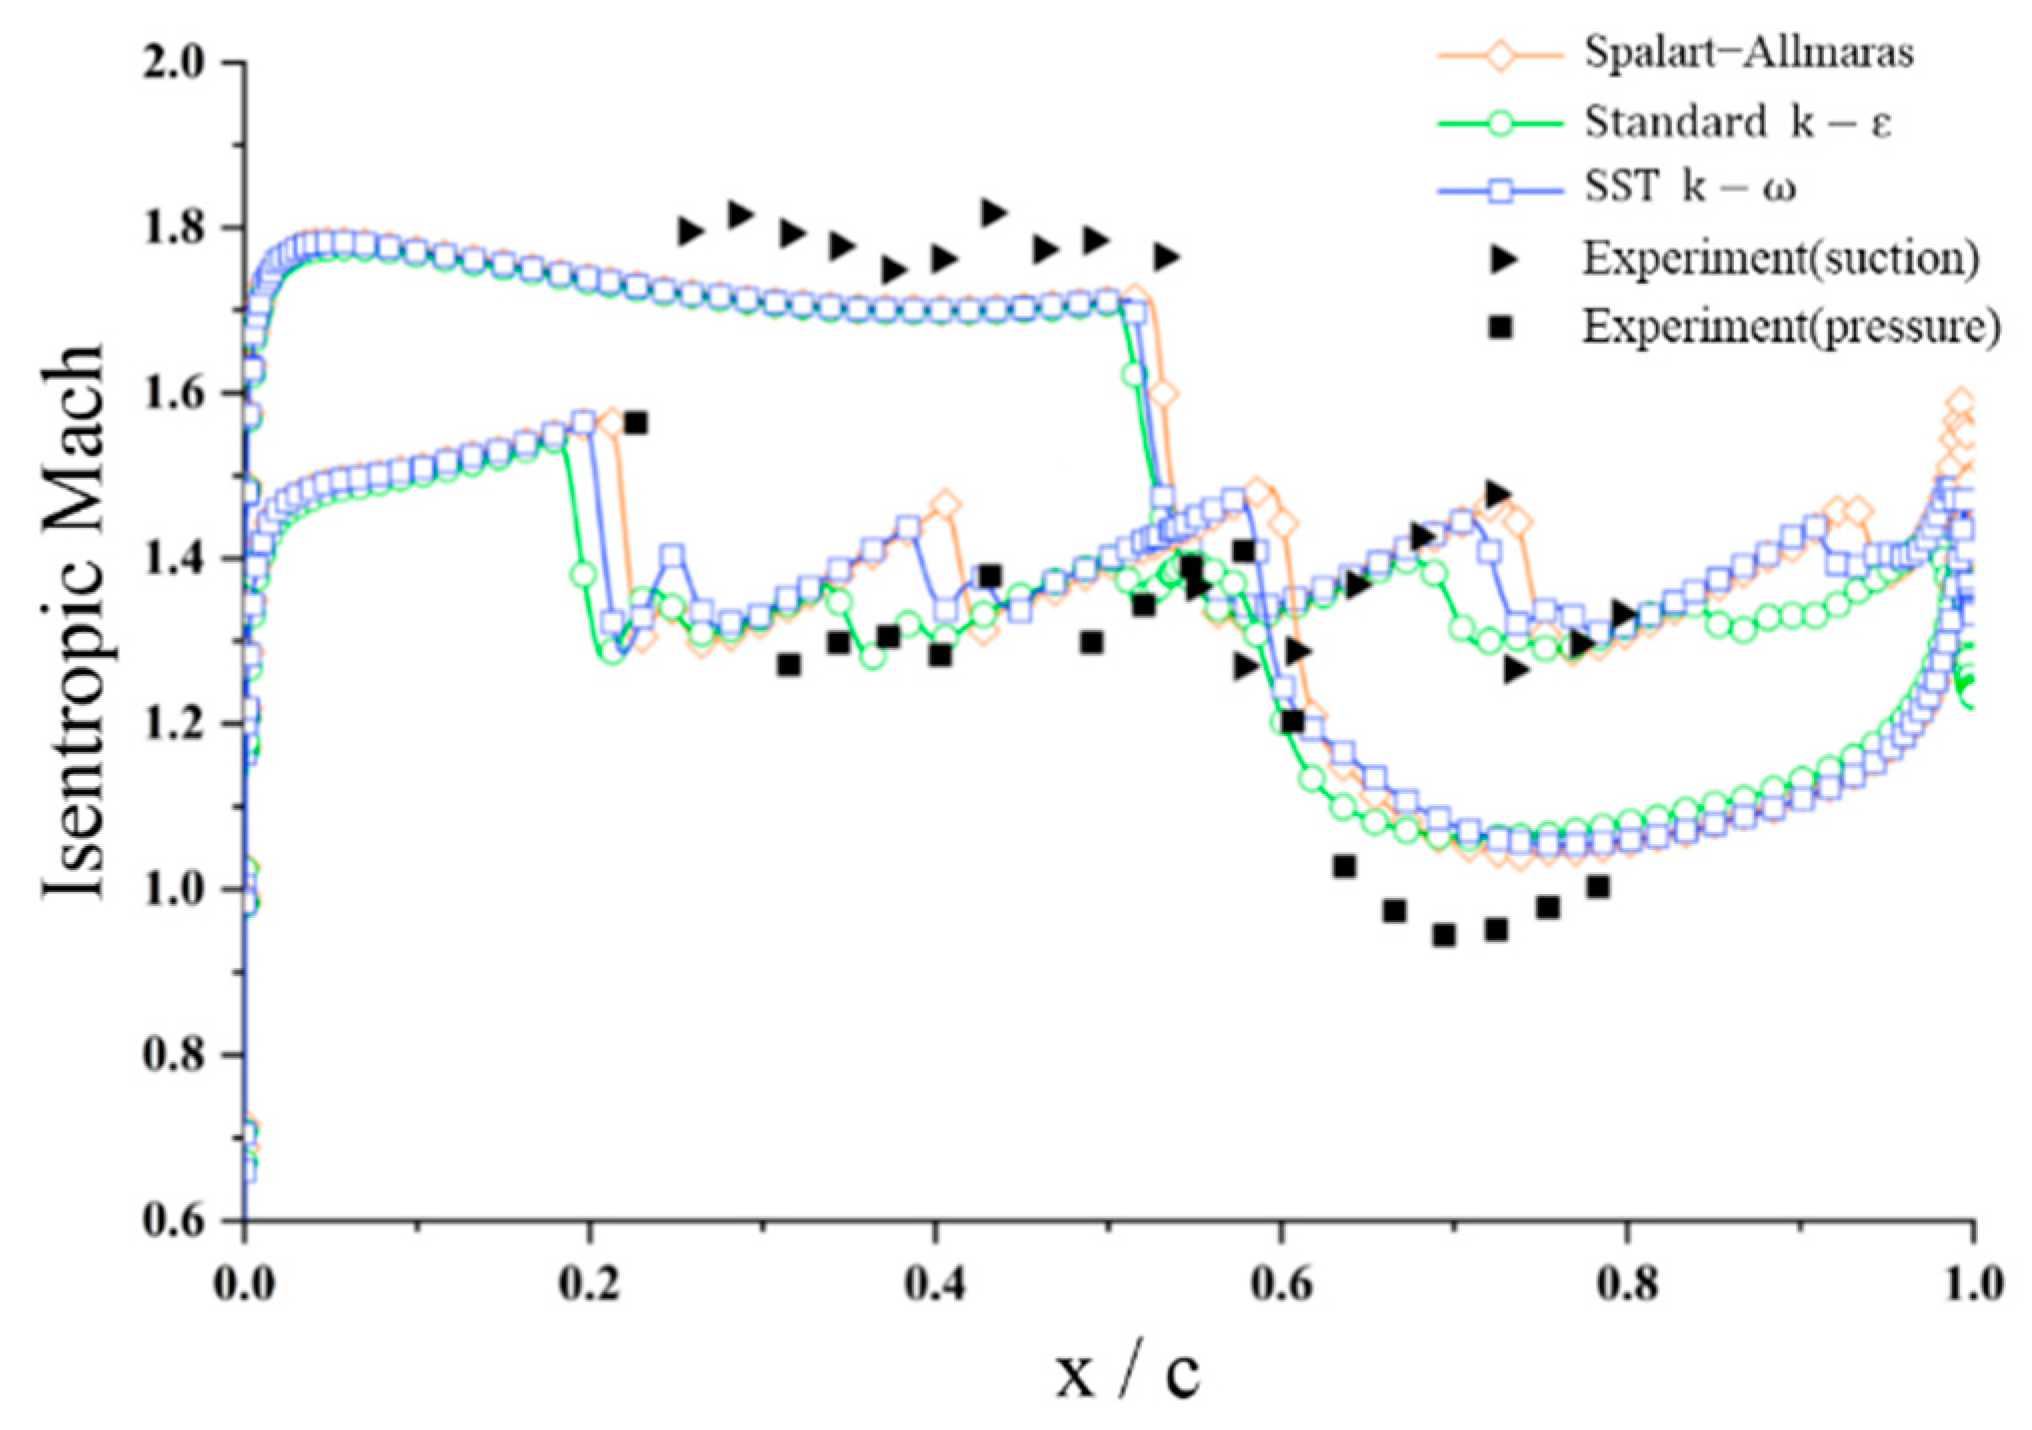
2.2. Turbulence Model Selection and Mesh Independent Validation

The work condition of the supersonic cascade was selected as the incoming Mach number was 1.75 and the static pressure rise at the inlet and outlet pout/pin was 2.5. The Spalart-Allmaras (SA), Standard k-ε (k-ε), and SST k-ω models were used. The standard wall functions were used with the k-ε model. The capability to predict the isentropic Mach number distribution on the blade wall of three different turbulence models was compared, to choose the most suitable turbulence model. The definition of isentropic Mach number is
M a is = p in p local γ 1 γ 1 2 γ 1
where pin, plocal denote the static pressure of inlet and the local static pressure, respectively.
The isentropic Mach number distribution on the wall was consistent with the experiment [31] for all three turbulence models. The step of the wall isentropic Mach number corresponded to the static pressure step on the blade wall. Therefore, the step of the isentropic Mach number implied the flow deflection or even flow separation and reattachment caused by the shock wave/boundary layer interaction. As is shown in Figure 3.
Among the three models, the SA model gave a good prediction of the location of the shock and separation zone, but the predicted pressure step was large. The possible reason was that the wall friction predicted by the SA model was large. The prediction deviation of the k-ε model for shock locations was large because the wall function used in this model predicted turbulence kinetic energy levels that were too high for the boundary, so that the anti-separation capability of the fluid was great. The stress limiter in the SST k-ω model made the model suitable for predicting flow separation induced by shock wave boundary layer interaction. Therefore, subsequent calculations were performed using the SST k-ω model. The total pressure loss coefficient is used to judge the cascade performance and is defined as
ω = p in * p out * p in * p in
where pin*, pout*, pin are the total pressure of inlet and outlet and the static pressure of inlet, respectively. The inlet pressure was taken on the cross-section of 10% axial chord length from the inlet of the computational domain, and the outlet pressure was taken on the cross-section of 10% axial chord length from the outlet of the computational domain. The pressure was taken as the mass-weighted average pressure over the cross-section. Grids of 80,000, 130,000, 200,000 and 240,000 cells were selected, and the total pressure loss coefficient ω obtained from the grid with 240,000 cells was used as a benchmark. The total pressure loss coefficients obtained by the three grids were 16.60%, 16.56%, 16.55% and 16.54%, respectively. When the number of cells reached 130,000, the deviation of ω was less than 0.15%. Taking into account the computational efficiency, the grid of 130,000 cells was used in subsequent work.

3. Results and Discussion

3.1. Analysis of the Effect of the Air Jet Control

Figure 4 shows the distribution of density gradient magnitude in the flow field with and without air jet control. These contours provide a clear view of the structure of the shock wave system and the mutual interference between shocks, as the density gradient magnitude is given by
ρ = ( ( d ρ d x ) 2 + ( d ρ d y ) 2 )
where ρ is the density. The leading-edge shock of the cascade interfered with the blade below, and a reflected shock was formed. Multiple reflected shocks in the passage of the baseline cascade achieved the function of deceleration and pressurization of the incoming airflow. When the blade was under high back-pressure, a strong normal shock was generated at the trailing edge. The normal shock disappeared after the application of the air jet. Figure 5 shows the local enlargement near the trailing-edge shock and the corresponding static pressure distribution on the pressure side of the blade surface. The coordinate system used in Figure 5 is the same coordinate system of the calculation domain. The black curve and the blue curve indicate the baseline and the controlled cases, respectively. The jet slot is highlighted in red. Figure 5a shows that the structure of the normal shock was more complex compared to the usual shock in the inflow field. The normal shock developed into two λ shocks near the trailing edge of the blade and pressure side of the upper blade, respectively. Matsuo defined this structure as a bifurcated shock wave [32]. This structure can also be understood as two shock waves intersecting to form a Mach stem. This implies that the reflected shock in the passage was insufficient to pressurize the airflow and a Mach stem was needed to match the extremely high pressure downstream.
The air jet caused an obstructive effect on the flow field near the wall, deflecting the airflow near the boundary layer and creating an oblique shock in the supersonic flow field. The oblique shock induced by the air jet is referred to here as jet shock. Thus, the jet shock affected the flow field downstream of the blade passage and coupled with the trailing-edge shock. Figure 5b shows that the jet shock penetrated the entire flow field in the blade passage and intersected with the trailing edge. The original bifurcated shock structure became an oblique shock and the λ shock foot on the pressure side disappeared. The Mach stem no longer existed.
The jet shock had a deceleration and pressurization effect on the airflow upstream of the trailing-edge shock, so the strength of the trailing-edge shock was reduced. As can be seen from the static pressure distributions on the pressure side in Figure 5, wall pressure on the windward side of the air jet increased. The static pressure distributions also shows that the static pressure rise on the wall was more moderate and the peak static pressure dropped. It implies that the inverse pressure gradient in the passage near the trailing-edge shock was weakened by the application of the air jet. Comparing the ends of the two curves in Figure 5, the reverse pressure gradient at the trailing edge of the blade was also moderated. As can be seen, the scope of impact of the air jet was enormous and continued up to the trailing edge of the blade. The flow field was supersonic upstream of the trailing-edge shock. Thus, the air jet did not change the structure of the leading-edge shock and the reflected shocks.
The air jet injected additional flow into the flow field, with the total pressure loss coefficient is defined as
ω j = p in * m in + p j * m j p out * ( m in + m j ) ( p in * p in ) m in + ( p j * p j ) m j
where p i n * ,   p o u t * , p j * , p i n ,   p j are the total pressure of inlet, outlet and air jet, the static pressure of inlet and air jet, respectively; m i n , m j are the mass flow rates of inlet and air jet, respectively. From the contours of total pressure loss coefficients in Figure 6, the loss in the blade passage was effectively suppressed with the application of the air jet. The Mach stem resulted in high loss. As the trailing-edge shock turned into an oblique shock, the shock loss fell effectively due to the weakening of the shock strength.
The obstructive effect of the air jet had an influence on the flow field near the blade wall. Combined with the static pressure distribution curves, there was a local inverse pressure gradient on the windward side of the air jet induced by the obstructive effect. As can be seen from Figure 7, the air jet caused an increase in turbulent kinetic energy level near the wall leading to an increase in local loss. Due to the limited proportion of the boundary layer relative to the throughflow area in the entire blade passage, it can be assumed that the local loss was low. In addition, after the air jet was applied, the turbulence kinetic energy level near the trailing edge decreased. The air jet was therefore beneficial to the overall performance of the cascade.

3.2. Effect of Different Parameters

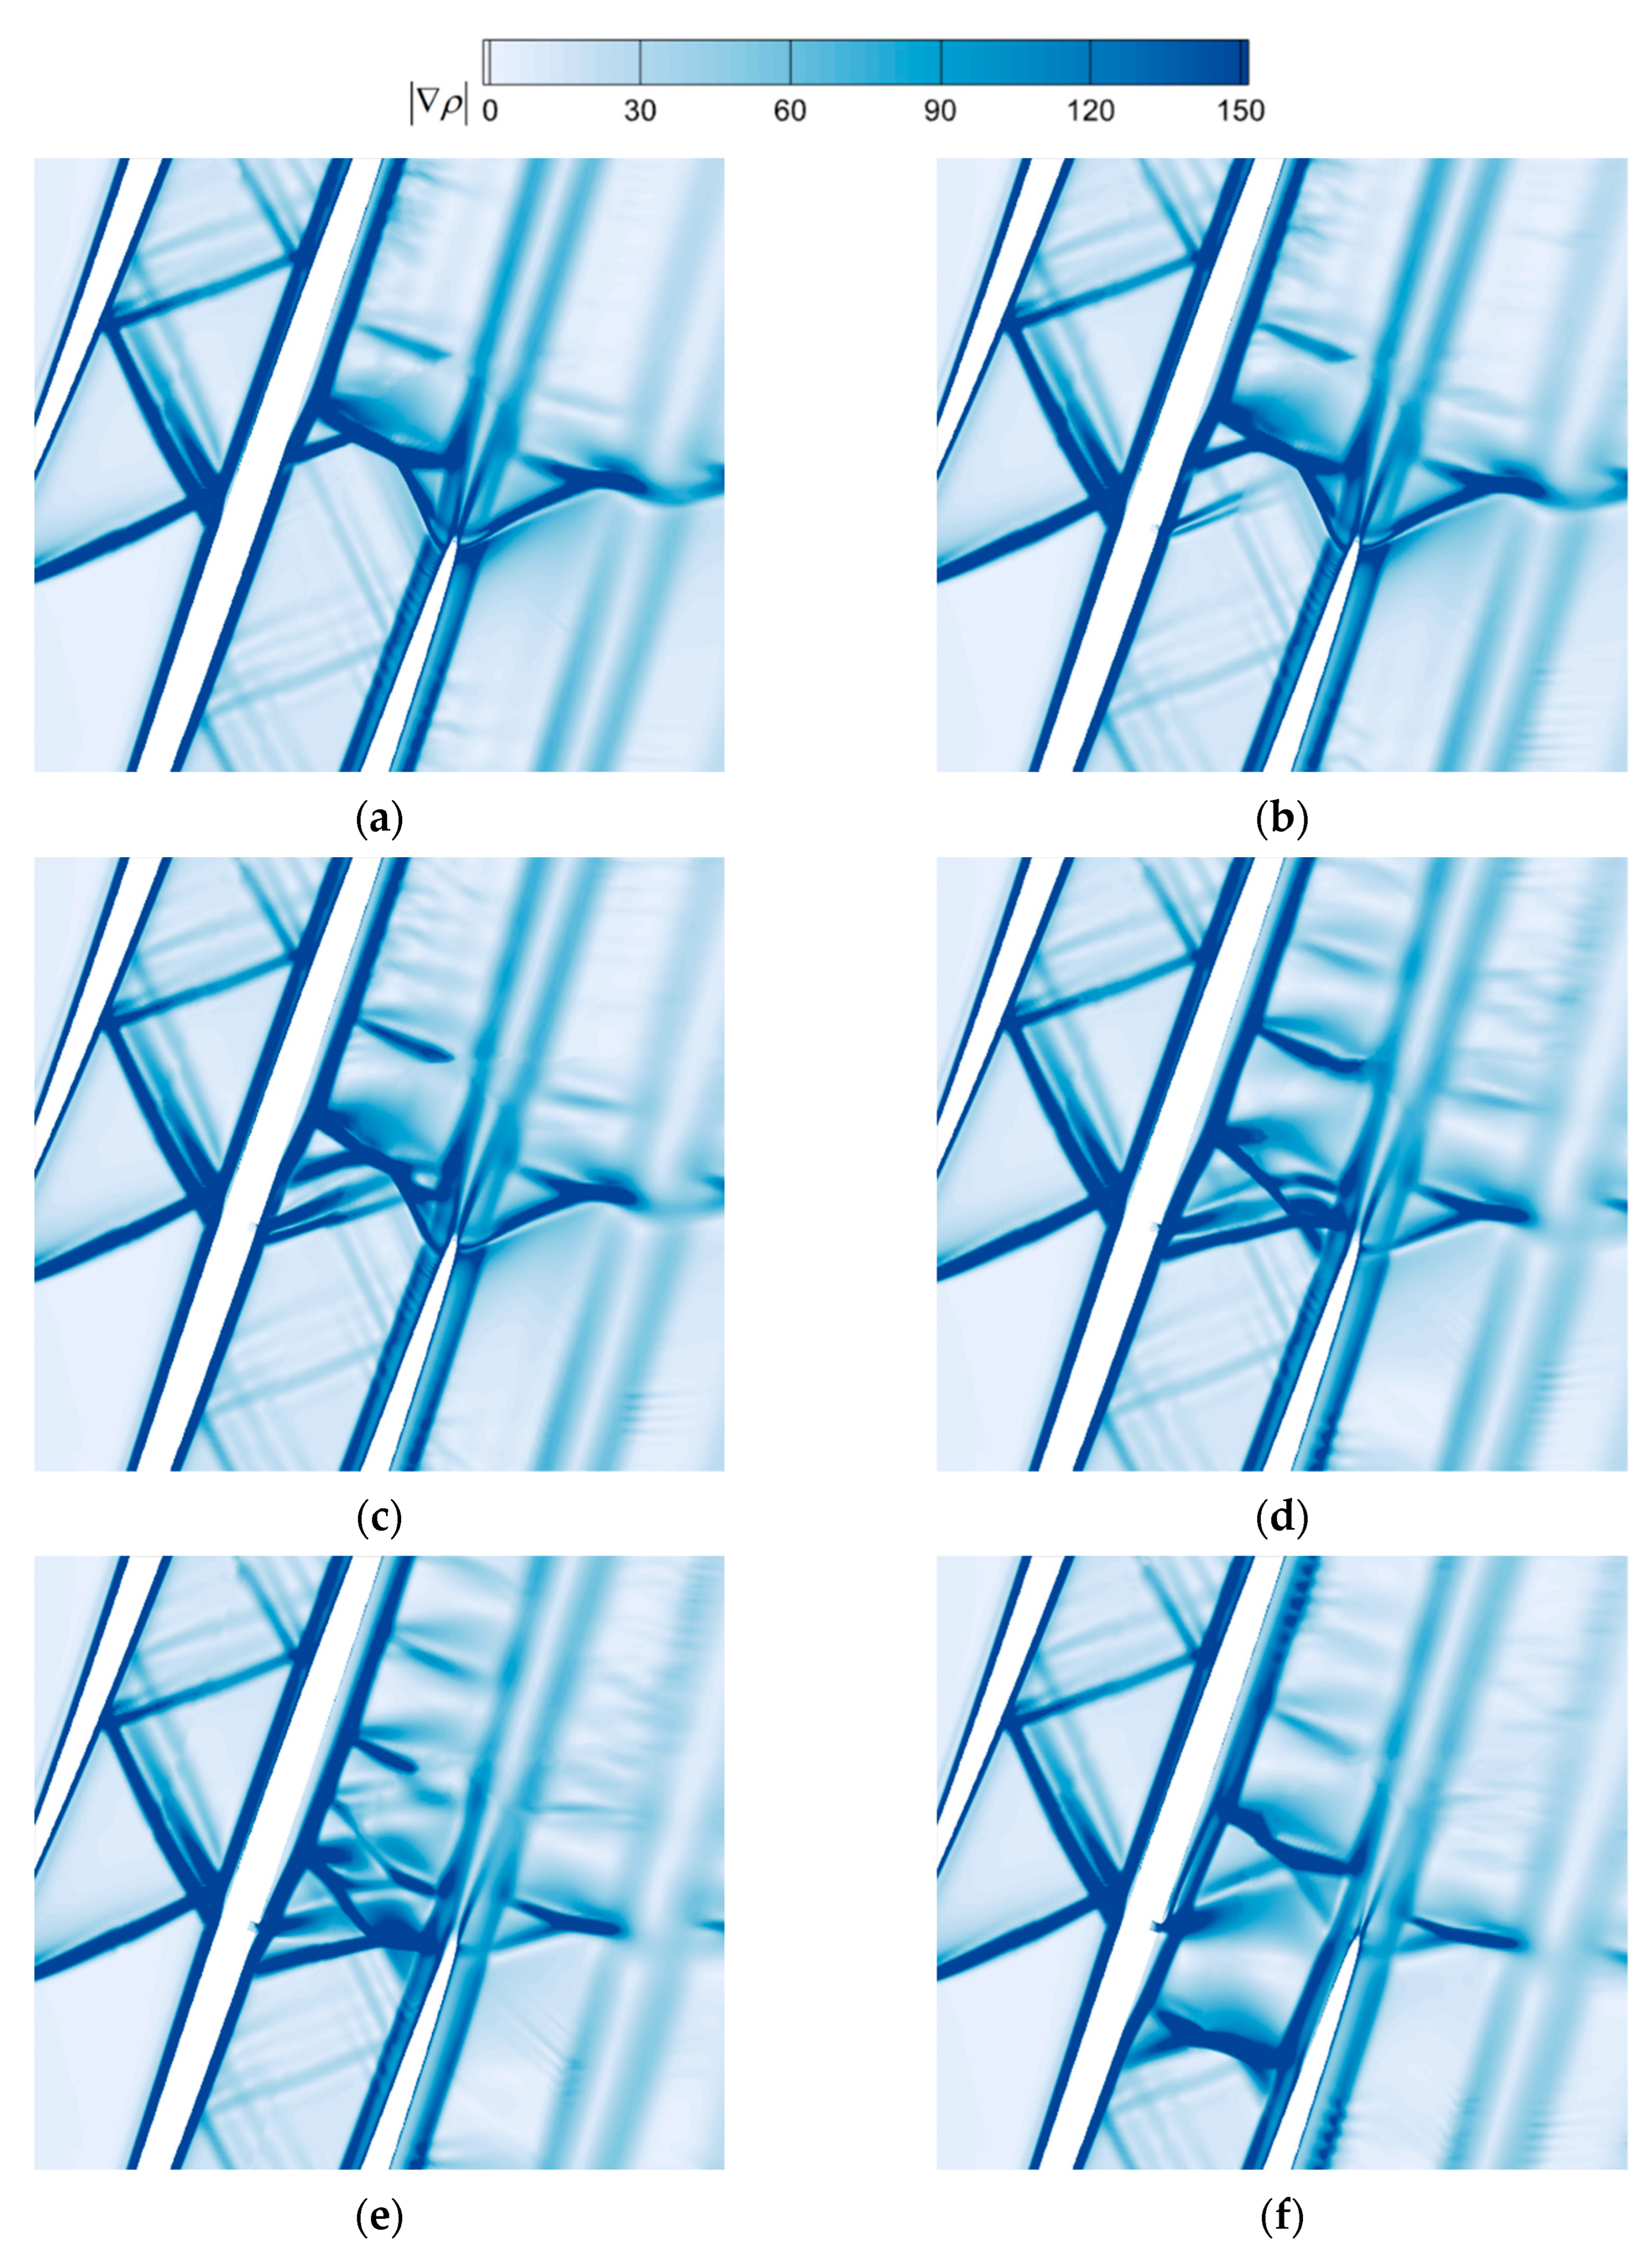
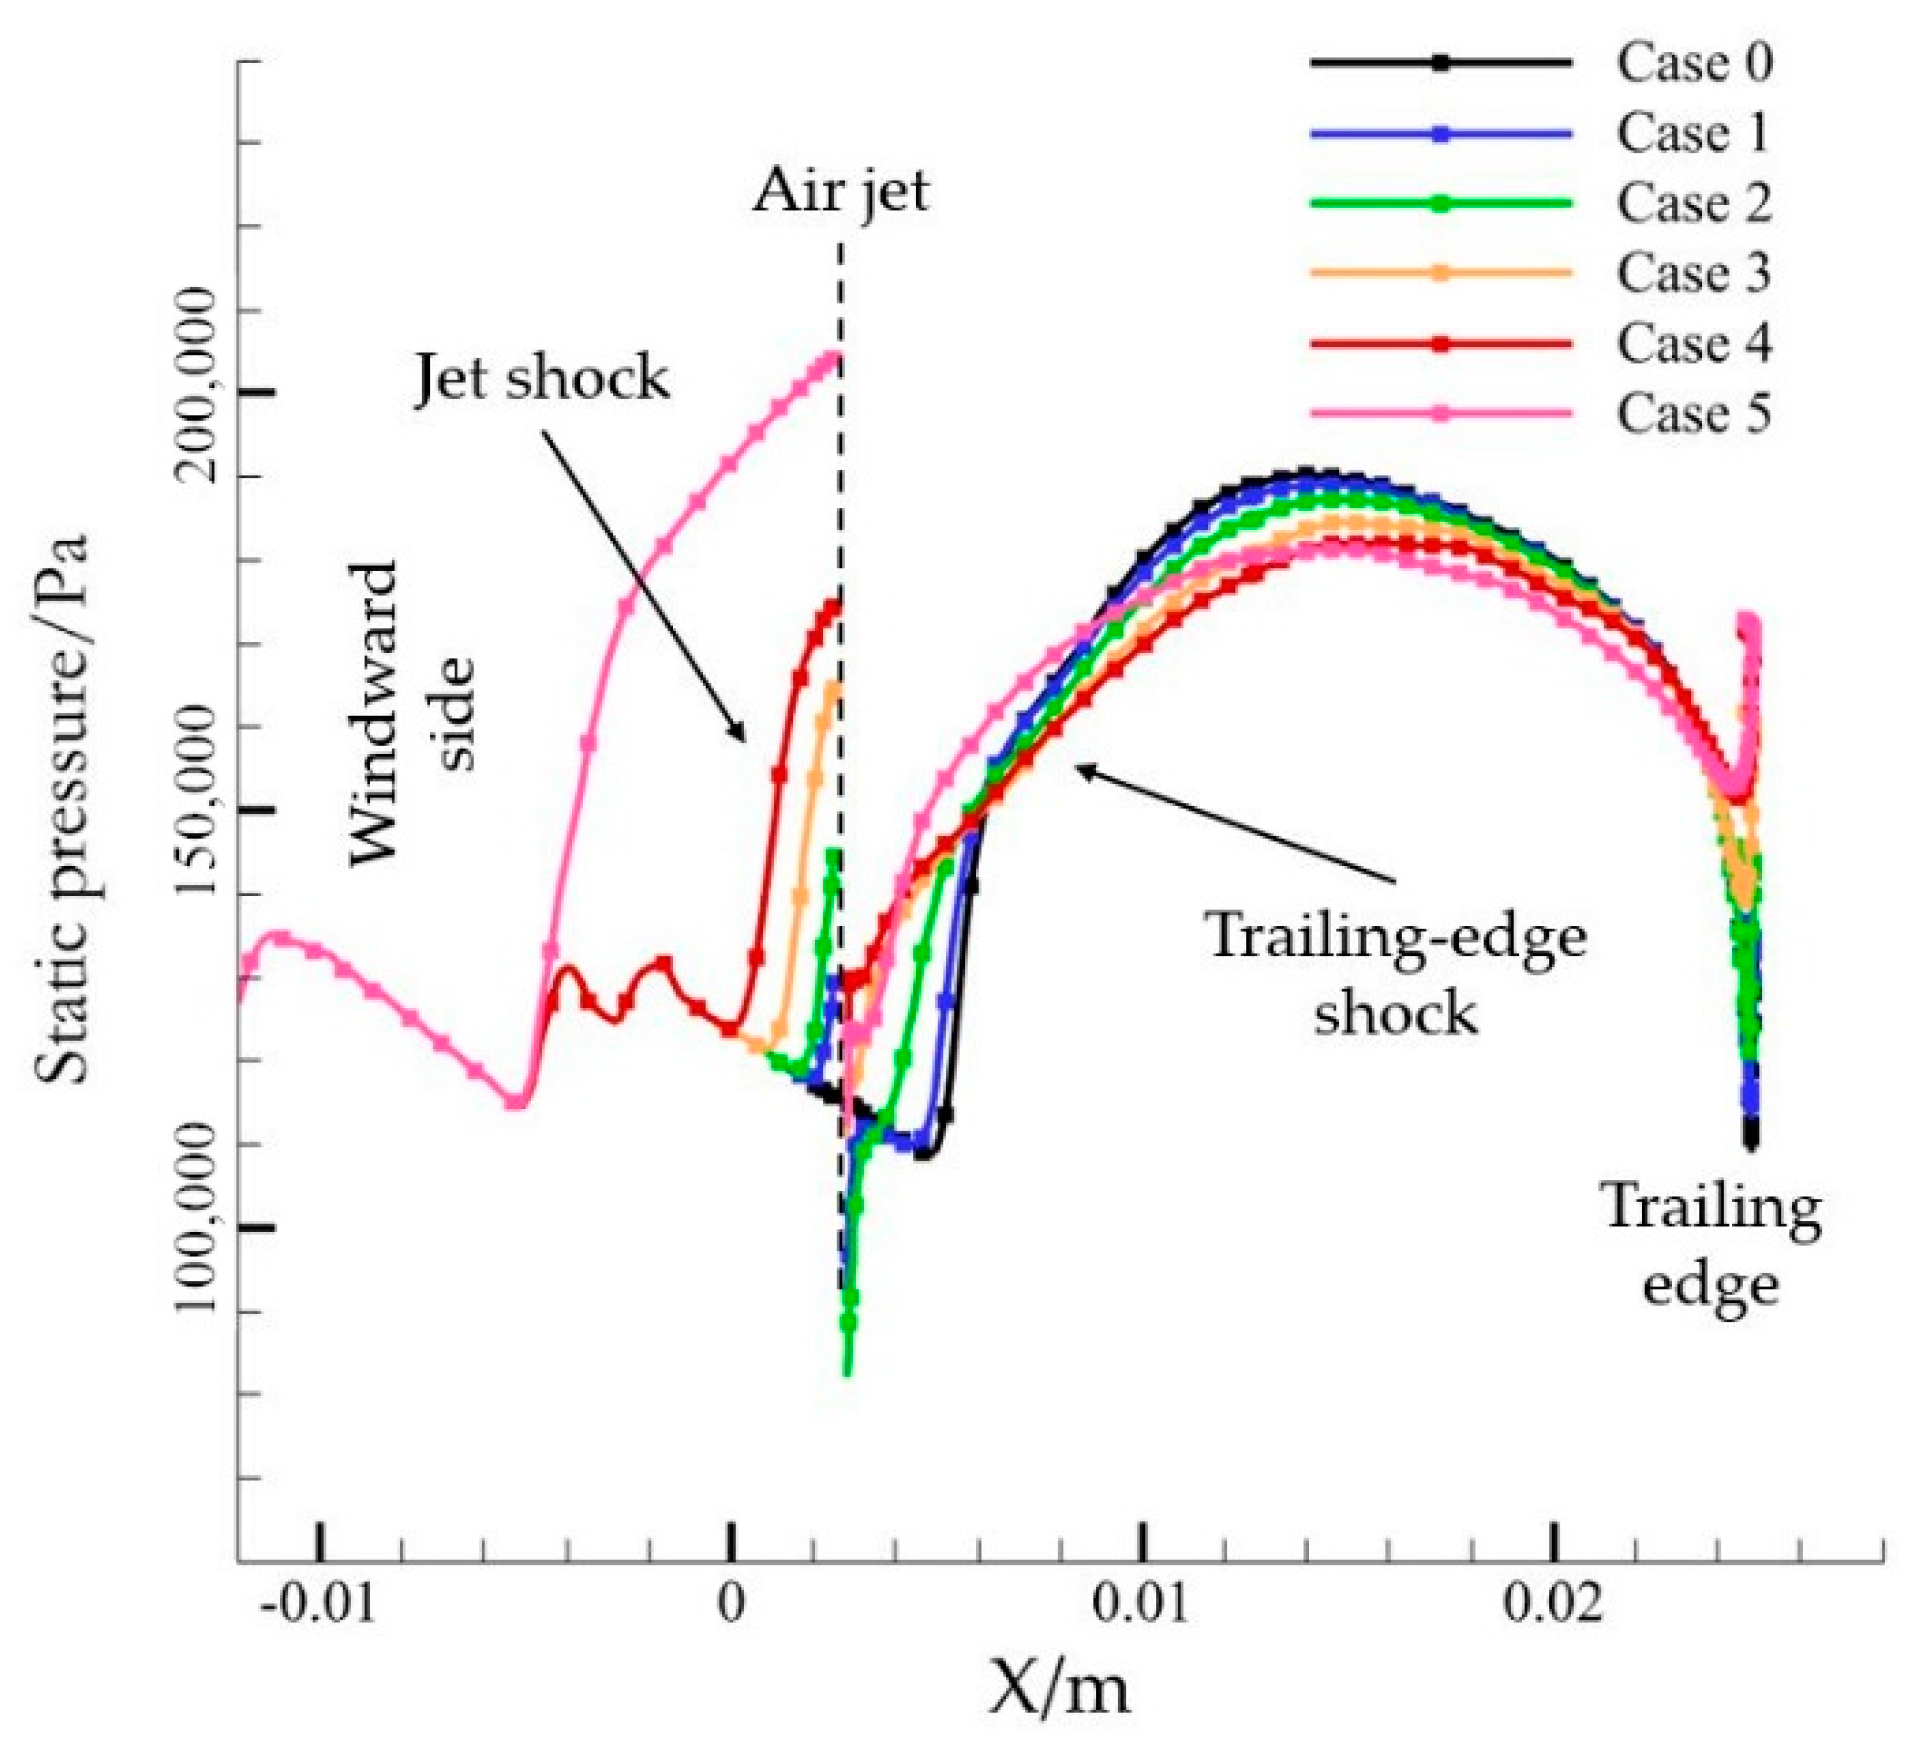
3.2.1. Effect of Strength of Air Jet

In order to investigate the influence of the jet strength, the total pressure of the air jet was varied while the jet location Δ l was 5 δ and jet angle α was vertical to the chordal direction. The effects on the shock structure in the blade passage and the mechanism of improving the loss of flow are analyzed. The working condition of the cascade was the design incoming flow condition with a back-pressure ratio of 2.5.
The total pressure loss coefficients of the cascade with different strengths of air jet are given in Figure 8. The effect of jet strength on the loss of flow was significant. Table 2 shows the jet parameters for typical operating conditions. The mass flow rate ratio of the air jet mr is defined as
m r = m j / m in
where mj is the mass flow rate of the air jet and min is the mass flow rate of the inlet. The momentum flux ratio J [33] is defined as
J = ρ j U j 2 ρ U 2
where the subscript “j” indicates the air jet and “ ” indicates the incoming flow. The improved effect of the air jet Δωj is defined as the reduction in the total pressure loss coefficient considering mass flow-rate variations. Δωj is defined as
Δ ω j = ω 0 ω j ω 0
where ω0 is the total pressure loss coefficient without control and ωj is the coefficient with air jet control.
The flow field could be effectively improved with the application of the air jet. The total pressure loss coefficient decreased as the jet strength increased. When the jet strength reached a certain threshold, the control effect decreased, but the loss coefficient was still lower than the baseline flow field. The optimal total pressure of the air jet was 175 kPa. A noticeable effect could be achieved when the total pressure of the air jet was in the range 160–180 kPa, corresponding to a mass flow rate ratio of 0.35–1.11%.
The shock structure in the flow field of the cascade for typical operating conditions is given in Figure 9. As the jet strength increased, the strength of the jet shock increased. The weak jet shock could not penetrate the entire blade passage, so it could not decelerate and pressurize the airflow anywhere in the entire passage. Thus, its effect on the downstream normal shock wave was very limited. As shown in Figure 9c, the jet shock gradually penetrated the flow field as the jet further strengthened. In this condition, the pressurization effect of the jet shock on the airflow was enhanced and the expansion wave downstream of the jet slot interfered with the trailing-edge shock leading to a shortening of the length of the Mach stem. When the jet shock was strong enough to penetrate the entire passage, it intersected the trailing-edge shock in Figure 9d. In this condition, it can be noticed that the bifurcated shock structure disappeared and evolved into two oblique shocks after coupling with the jet shock. Then, as shown in Figure 9a,e, Mach stem structure was formed at the trailing edge of the blade below, and multiple weak shock structures were formed downstream. As shown in Figure 9f, excessive jet strength caused the jet shock to move further forward and to no longer couple with the trailing-edge shock. Moreover, the jet shock structure was λ -shaped and was no longer an oblique shock. Meanwhile, the strength of the trailing-edge shock increased. Even though the structural changes in the jet shock and the trailing-edge shock had a more significant deceleration and pressurization effect on the flow field, the loss induced by shocks was further increased compared to the previous cases. It can be seen that a reasonable configuration of the strength of the jet shock and the trailing-edge shock is the key to improving cascade performance, so that the airflow is pressurized more gently.
The static pressure distribution on the pressure side of the blade for typical operating conditions is given in Figure 10. The static pressure on the wall in front of the jet slot increased in all cases. The higher the peak of the static pressure, the further forward the starting location of the static pressure rise. This was because the air jet at high strength and perpendicular to the flow direction was more obstructive to the incoming airflow. Thus, the jet shock moved forward and the windward side of the jet slot formed a separation zone accounting for the pressure rise. As the strength of the trailing-edge shock was weakened, two stages of pressure rises with large gradients on the blade wall caused by the trailing-edge shock were more moderate, and the peak value of static pressure was significantly lowered. In addition, as mentioned above, the air jet had a large range of influence shown in Figure 10. The inverse pressure gradient near the trailing edge was also alleviated and the static pressure at the edge was increased.
Combined with the contours of static pressure distribution in Figure 11, it was found that the changes in static pressure before and after the trailing-edge shock were moderated with control of the air jet, thus reducing the loss of mainstream flow. As the strength of the jet shock increased, the difference in static pressure before and after the jet shock was large, which was the reason for the weakening of the control effect after the jet strength exceeded the threshold.

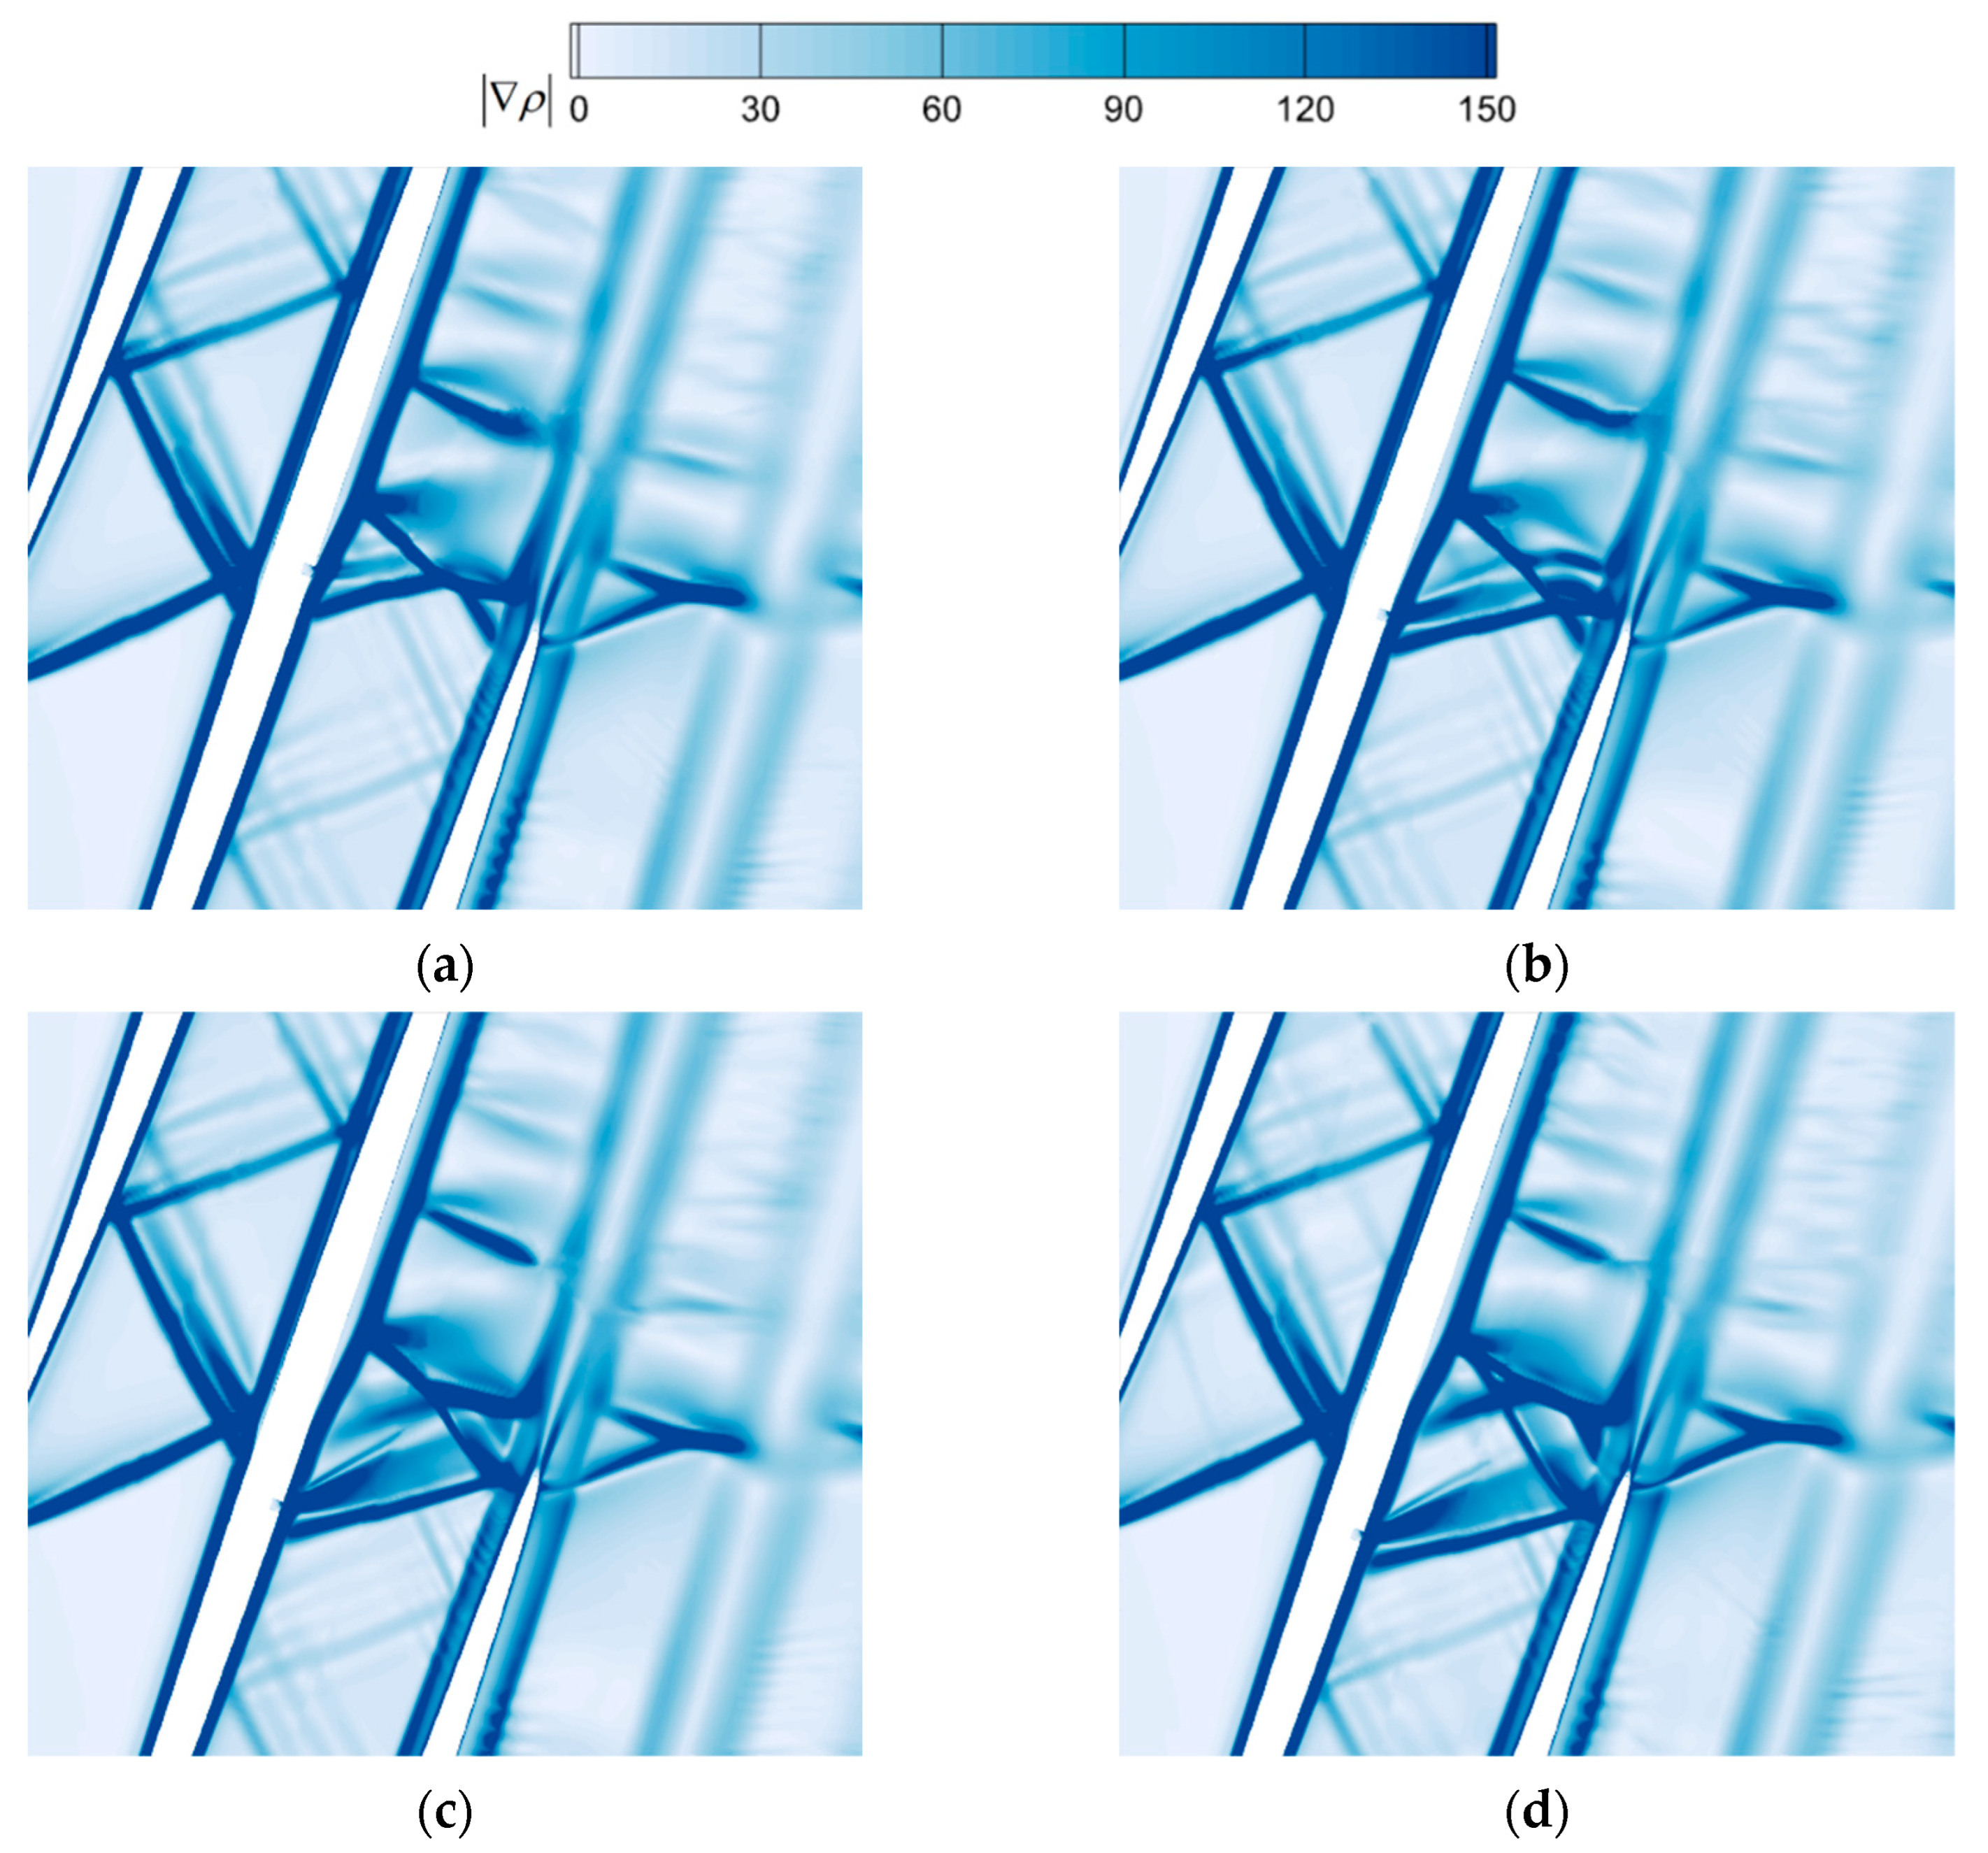
3.2.2. Effect of Air Jet Location

To analyze the effect of the location of the air jet on the blade passage shock structure and the mechanism of total pressure loss improvement, different jet locations are investigated in this section. The flow field environment was at the design incoming flow condition with a back-pressure ratio of 2.5. The jet angle α was at a vertical chordal direction. The locations of the air jet Δ l were, respectively, 2 δ , 5 δ , 8 δ and 10 δ upstream of the front foot of the trailing-edge shock. The effect of the air jet is analyzed for these four operating conditions.
Due to static pressure varying in different locations of the blade surface, the mass flow rate of the air jet varied greatly if the same jet total pressure was selected. Hence, the same jet strength was ensured in this section by adjusting the jet total pressure to make the mass flow rate ratio of injection the same in each location.
Table 3 gives the total pressure loss coefficients of the cascade in different jet locations. The total pressure loss coefficient of the cascade decreased and then increased as the air jet was arranged from a location close to the shock foot to a location away from the shock foot. The best control effect was achieved when the jet location Δ l was 5 δ . The control capability was significantly weaker at longer distances, but the air jet was still effective in reducing the loss of flow in the cascade.
As shown in Figure 12, the air jet in any location could affect the shock structure near the trailing edge. The jet location determined the location of shock induced by the air jet under the same jet strength and thus affected the intersection of the jet shock and the trailing-edge shock.
When the jet location Δ l was 2 δ , the jet shock and trailing-edge shock combined as a λ shock. The intersection point was approximately in the middle of the passage. The Mach stem of the trailing-edge shock almost disappeared, thus weakening the shock strength. As the jet location moved further forward, the shock intersection point moved further away from the pressure side of the blade and closer to the trailing edge of the blade below. The expansion wave induced by the air jet on the leeward side of the slot interfered with the trailing-edge shock, further improving the control effect. Intuitively, the trailing-edge shock was broken down. When the jet location Δ l was 8 δ , the trailing-edge shock was further broken down. However, a λ shock reappeared and the control effect was reduced, judged by the total pressure loss coefficients. When the jet location Δ l reached 10 δ , the same Mach reflection structure as in the baseline flow field reappeared behind two oblique shocks. Mach stem caused greater loss of flow than the oblique shocks, which was the reason why the loss coefficient was higher in this condition compared to other conditions.
Thus, it can be found that as the air jet was arranged farther away from the trailing-edge shock, the airflow had sufficient distance to re-accelerate after the jet shock. The airflow downstream from the air jet reattached to the blade wall and generated an expansion wave. The farther the air jet from the trailing-edge shock, the stronger the expansion wave. Figure 13 shows that the longer distance and the stronger expansion wave fully promoted the airflow decelerated by the jet shock accelerating again. This was the reason why the downstream λ front feet reappeared when Δ l was 8 δ and even the same Mach reflection structure as the baseline case reappeared when Δ l was 10 δ . The reappearance of λ shock and Mach stem was to decelerate the airflow in the blade passage. It can be seen that when the distance between the air jet and the trailing-edge shock was great, the air jet could not play the role of slowing down and pressurizing the airflow. As a result, it was impossible to achieve the purpose of weakening the strength of trailing-edge shock.
Meanwhile, the change in back pressure affected the location of the trailing-edge shock on the blade wall. Then, multiple jet slots could be laid along the chordal direction, enabling the jet slot in the optimal control location to work selectively according to the actual operating conditions.

3.2.3. Effect of Angle of Air Jet

At the design incoming-flow condition with a back-pressure ratio of 2.5, the total pressure and location of air jet were maintained as constants at p j * = 165   kPa and Δ l = 5 δ , respectively. To investigate the influence of the jet angle, Table 4 presents the relative variations of the total pressure loss coefficient with different jet angles varying from 20° to 90° by 10° per condition (the 80° condition is ignored here as it is similar to the 90° result). Figure 14 shows the static pressure distribution at the pressure side for each condition. It was found that the effect of the jet angle on the loss control effect was relatively limited. Meanwhile, the wall static pressure distributions under all conditions were similar. It is probably due to that the momentum flux ratio J was small and the penetration of the jet into the flow field was weak, only lifting the fluid near the wall and thus deflecting the fluid in the passage, so changes in the jet angle could not significantly affect the mainstream flow field.
As the angle between the air jet and the mainstream of the flow field decreased, the direction of the jet gradually deflected towards the incoming flow, which promoted the entry of the jet mass into the flow field. Thus, as the jet angle decreased with the total pressure of injection remaining constant, the mass flow rate of injection increased slightly, which, to a certain extent, increased the shock strength induced by injection and thus improved the control capability. When the jet angle was too small, the mass flow rate dropped steeply. This was probably because the angle between the jet and the wall was too small, and the blocking effect of the wall on the fluid had a greater impact on the air jet.
As can be seen in Figure 14, as the jet gradually shifted towards the downstream direction, the smaller the jet angle, the smaller the static pressure rise on the windward side of the jet. This means that the obstructive effect of the air jet on the upstream flow decreased, due to a decrease in the momentum component of the vertical flow direction of the air jet. In addition, with the slight increase in injection strength and the deflection of the jet direction, the tangential momentum injected by the air jet into the downstream boundary layer increased, which was conducive to reduce the negative impact of the air jet on the boundary layer.
Through the static pressure distribution in Figure 15, it was found that the static pressure on the windward side of the jet in the passage was small when the jet angle α was 20°. This means that the shock induced by the air jet was weak. Thus, shock induced by the air jet had an insufficient deceleration effect on the mainstream, resulting in a more intense pressure increase on the mainstream after the trailing-edge shock. A larger pressure gradient means higher loss. Too small a jet angle led to a decrease in the momentum of injection, which in turn affected the tangential momentum of injection thereby weakening the strength of jet shock. As the shock strength decreased, shock wave foot was further back, so the intersection location of the jet shock and the trailing-edge shock was slightly farther from the tailing edge of the blade. Thus, the weakening effect on the trailing-edge shock was slightly weaker.

3.3. Discussion

As can be seen from Section 3.2, suitable jet parameters can further change the shock structure, thereby reducing shock loss. Shock structure is closely related to boundary layer. Figure 16a shows a simplified model of trailing-edge shock. Near the pressure side of the blade, the trailing-edge shock can be seen as a λ shock. The diffusion length ld is defined as the distance between the starting point of the shock effect on the boundary layer and the location of the Mach stem.
As ld increases, the length of the Mach stem decreases. Thus, the pattern of trailing-edge shock changes. As shown in Figure 16b, the air jet upstream of the trailing-edge shock increases the thickness of the boundary layer on the blade surface. Therefore, the air jet increases ld. If the jet is too close to the trailing-edge shock, the increased ld is not enough to make Mach stem disappear. As shown in Figure 16c, the fluid will reattach to blade wall if the jet is far from the trailing-edge shock. If the distance between the jet shock and trailing-edge shock is large, the expansion wave causes the decelerated fluid to re-accelerate sufficiently. The deceleration effect of the jet shock is impaired.

4. Conclusions

In this paper, the influence of an air jet on a high incoming Mach number supersonic cascade is numerically investigated. The air jet was used to control the trailing-edge shock. Conclusions are drawn as follows.
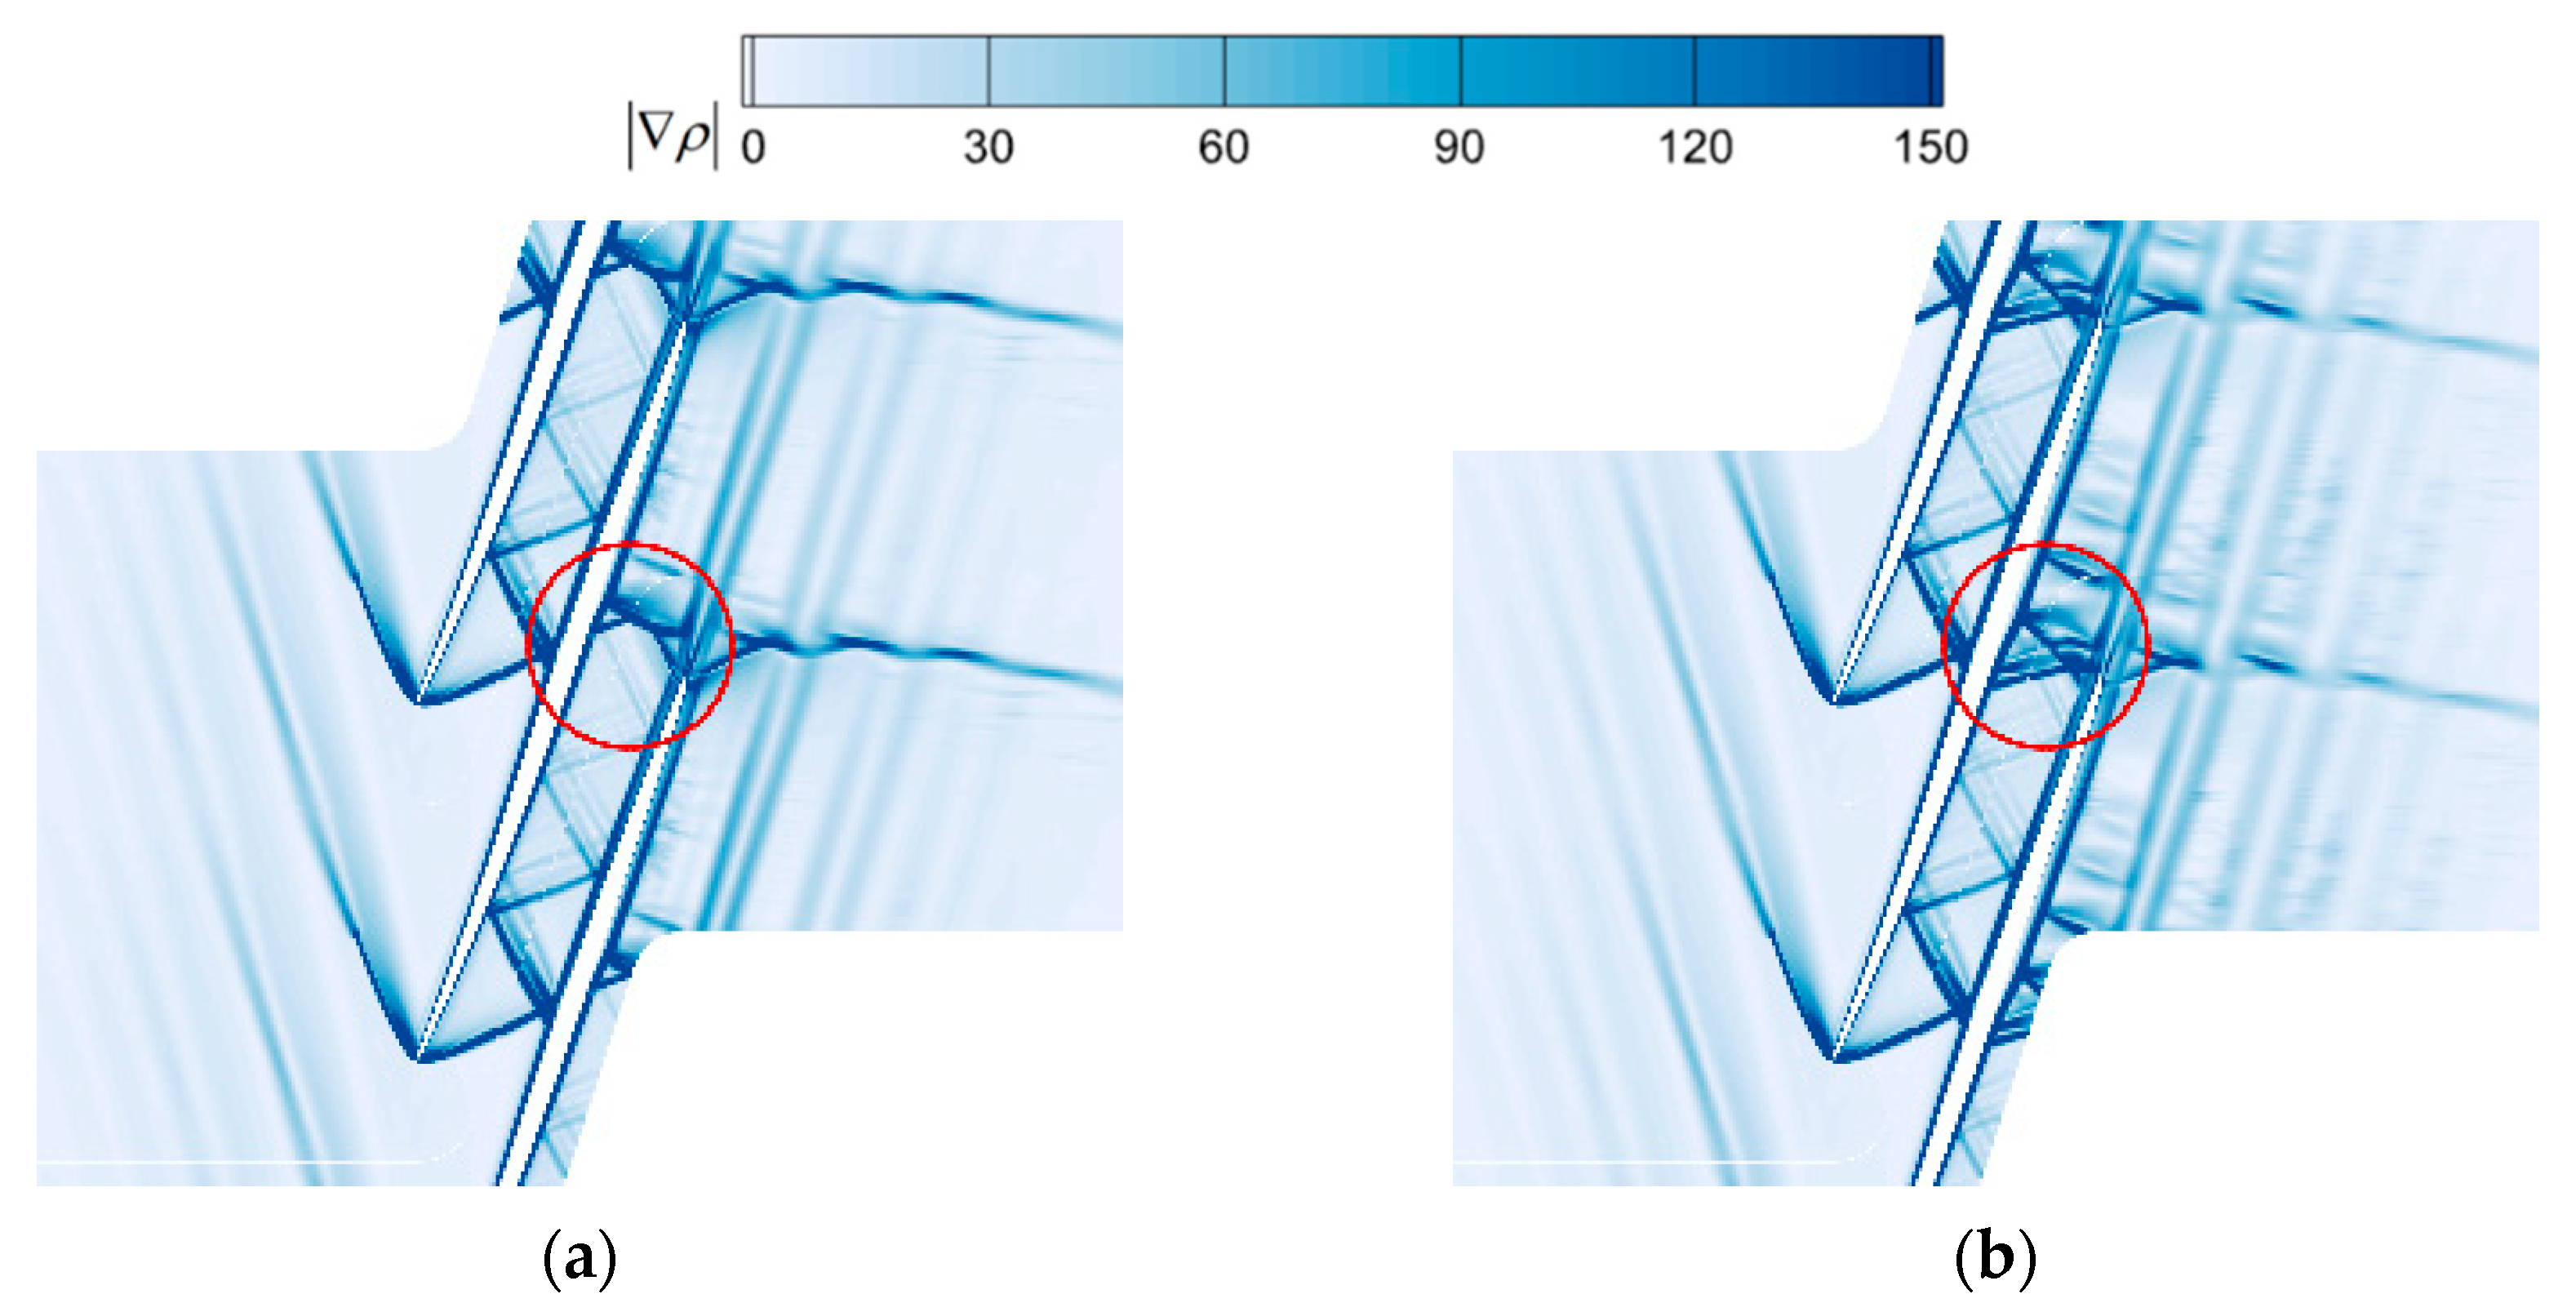
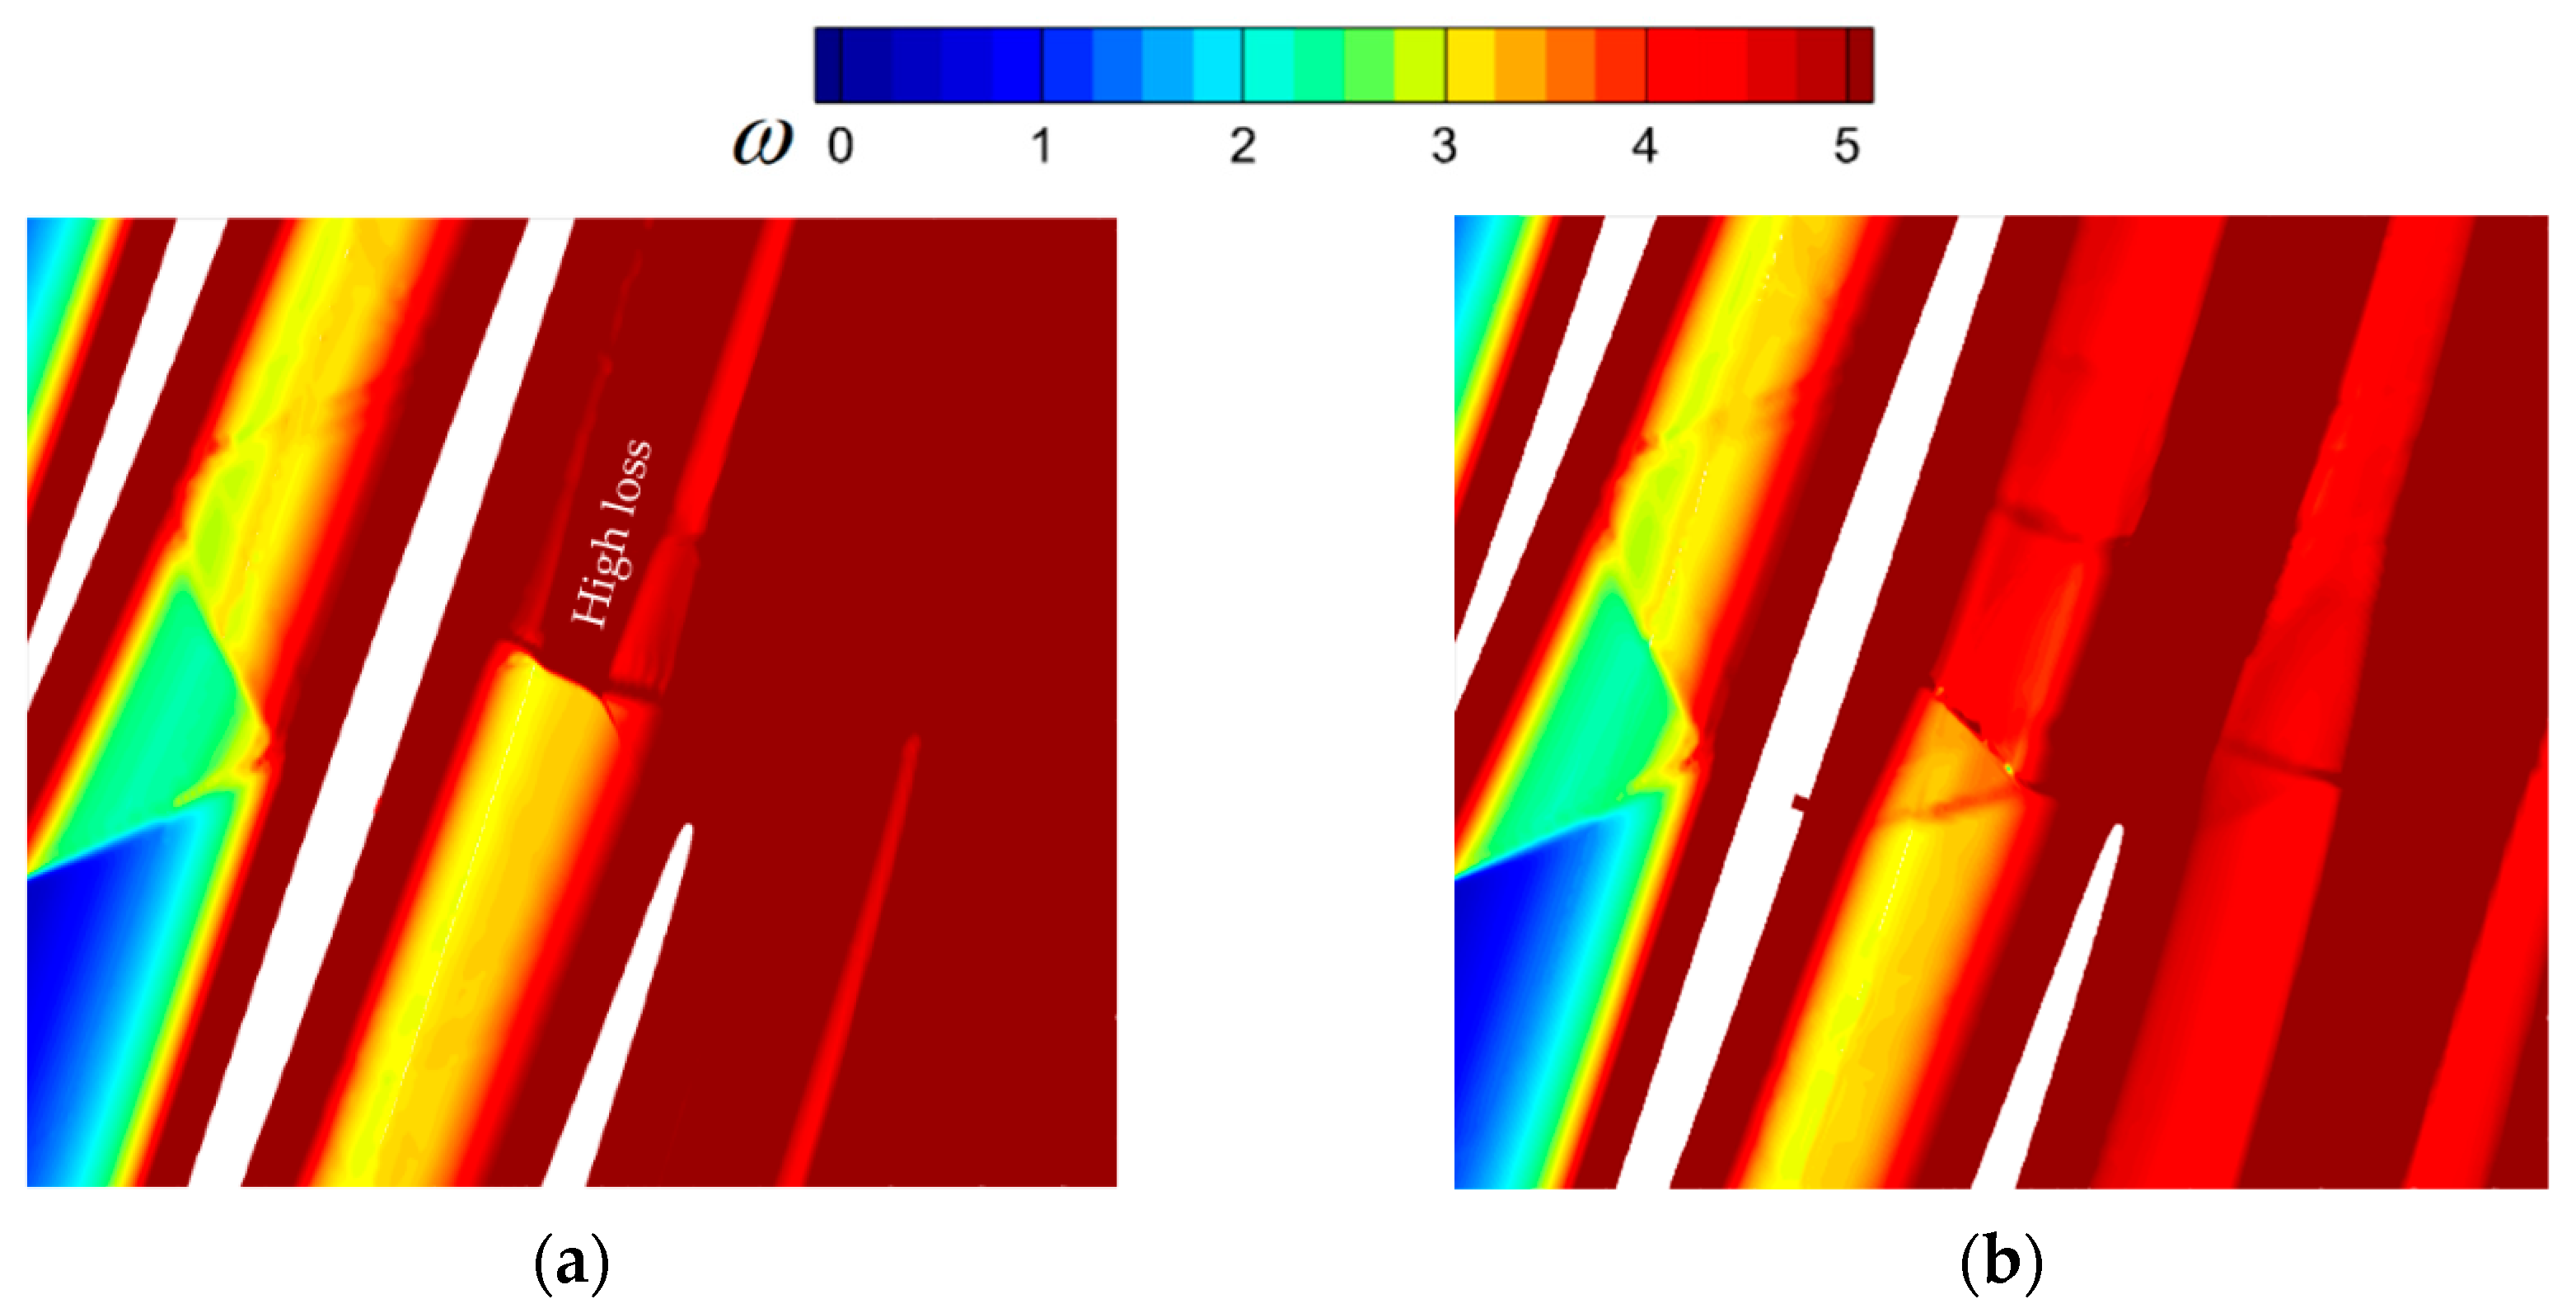
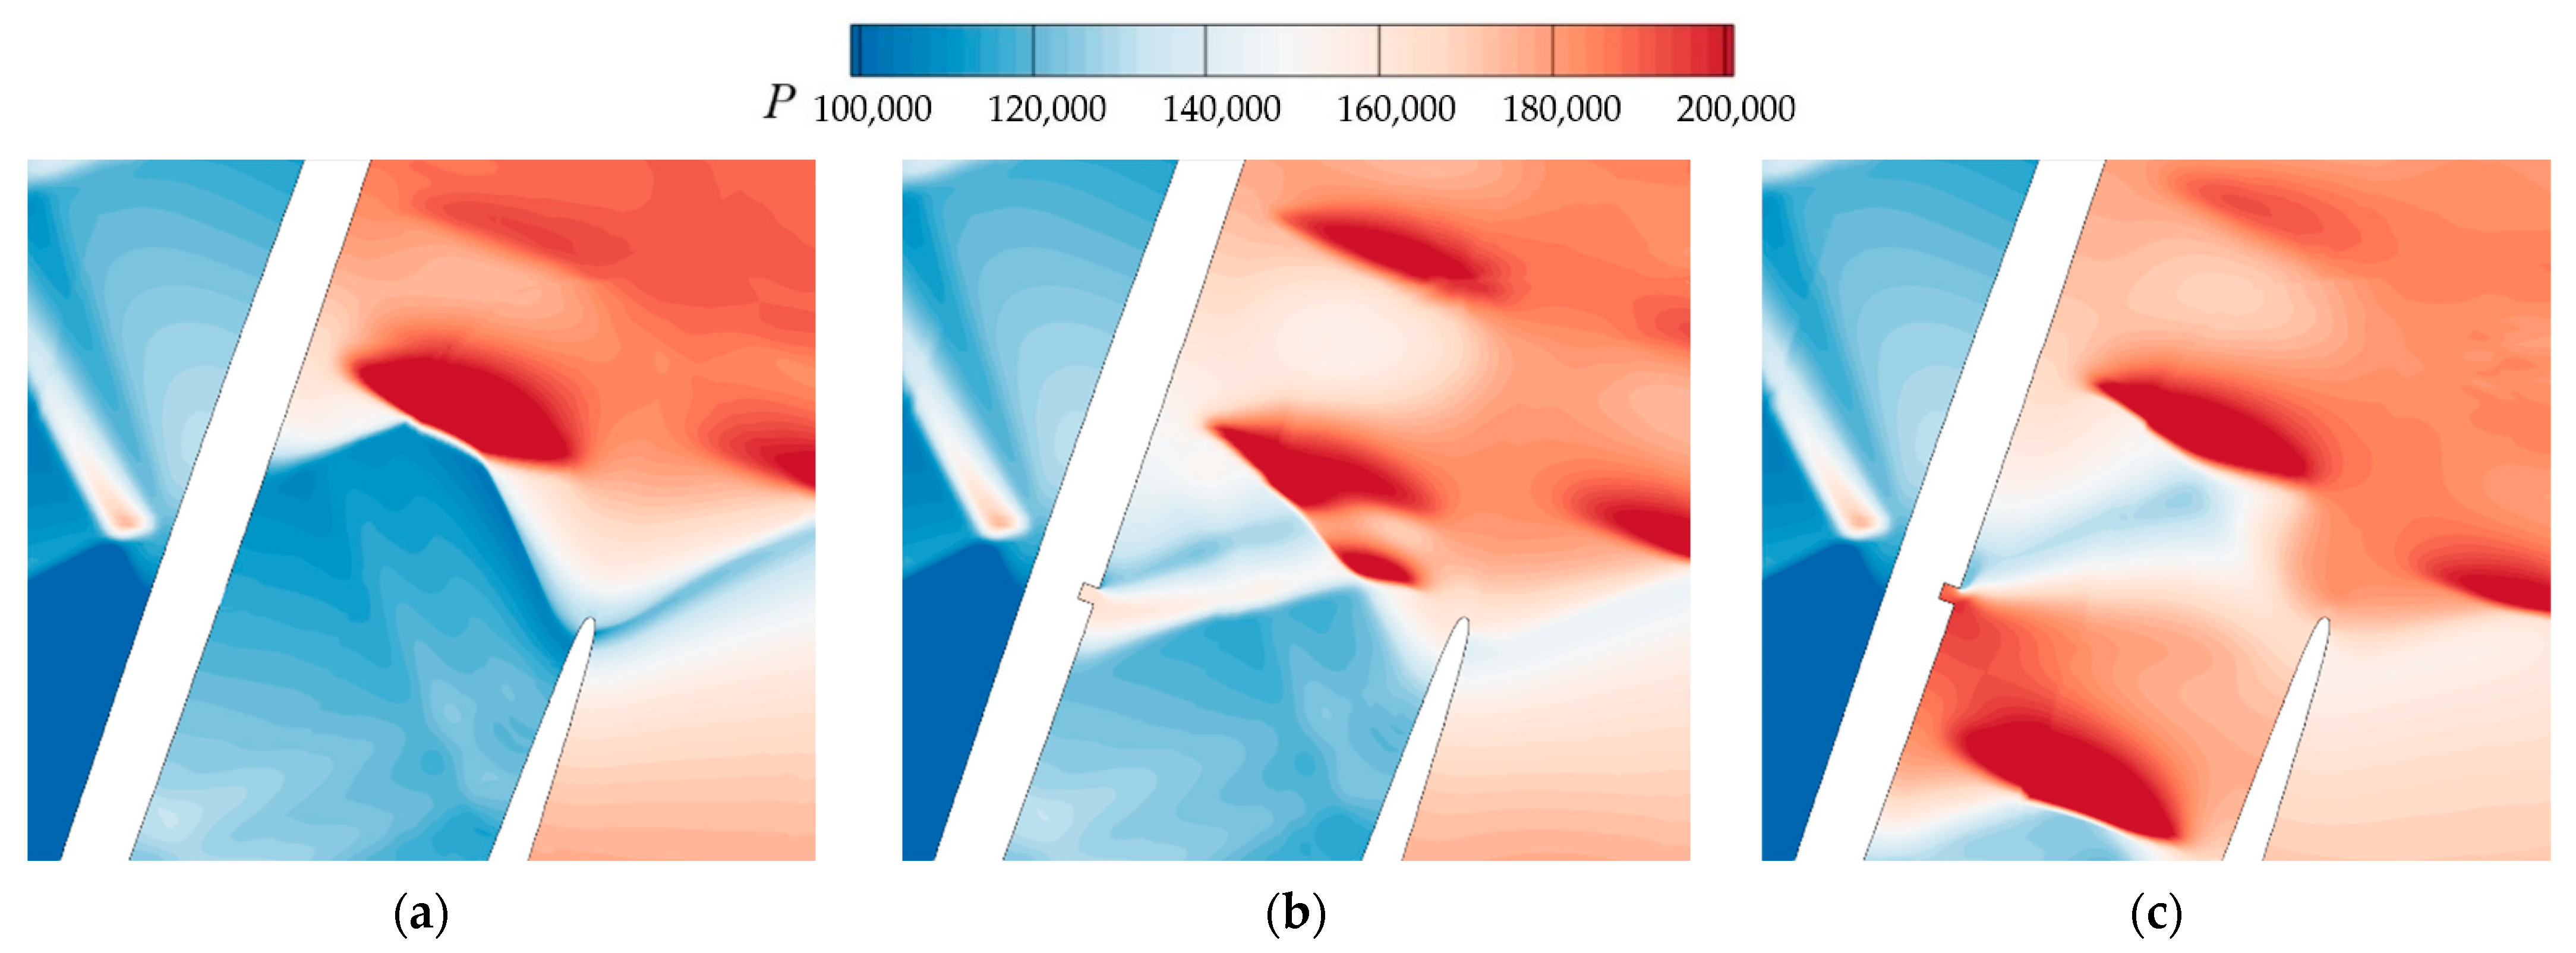
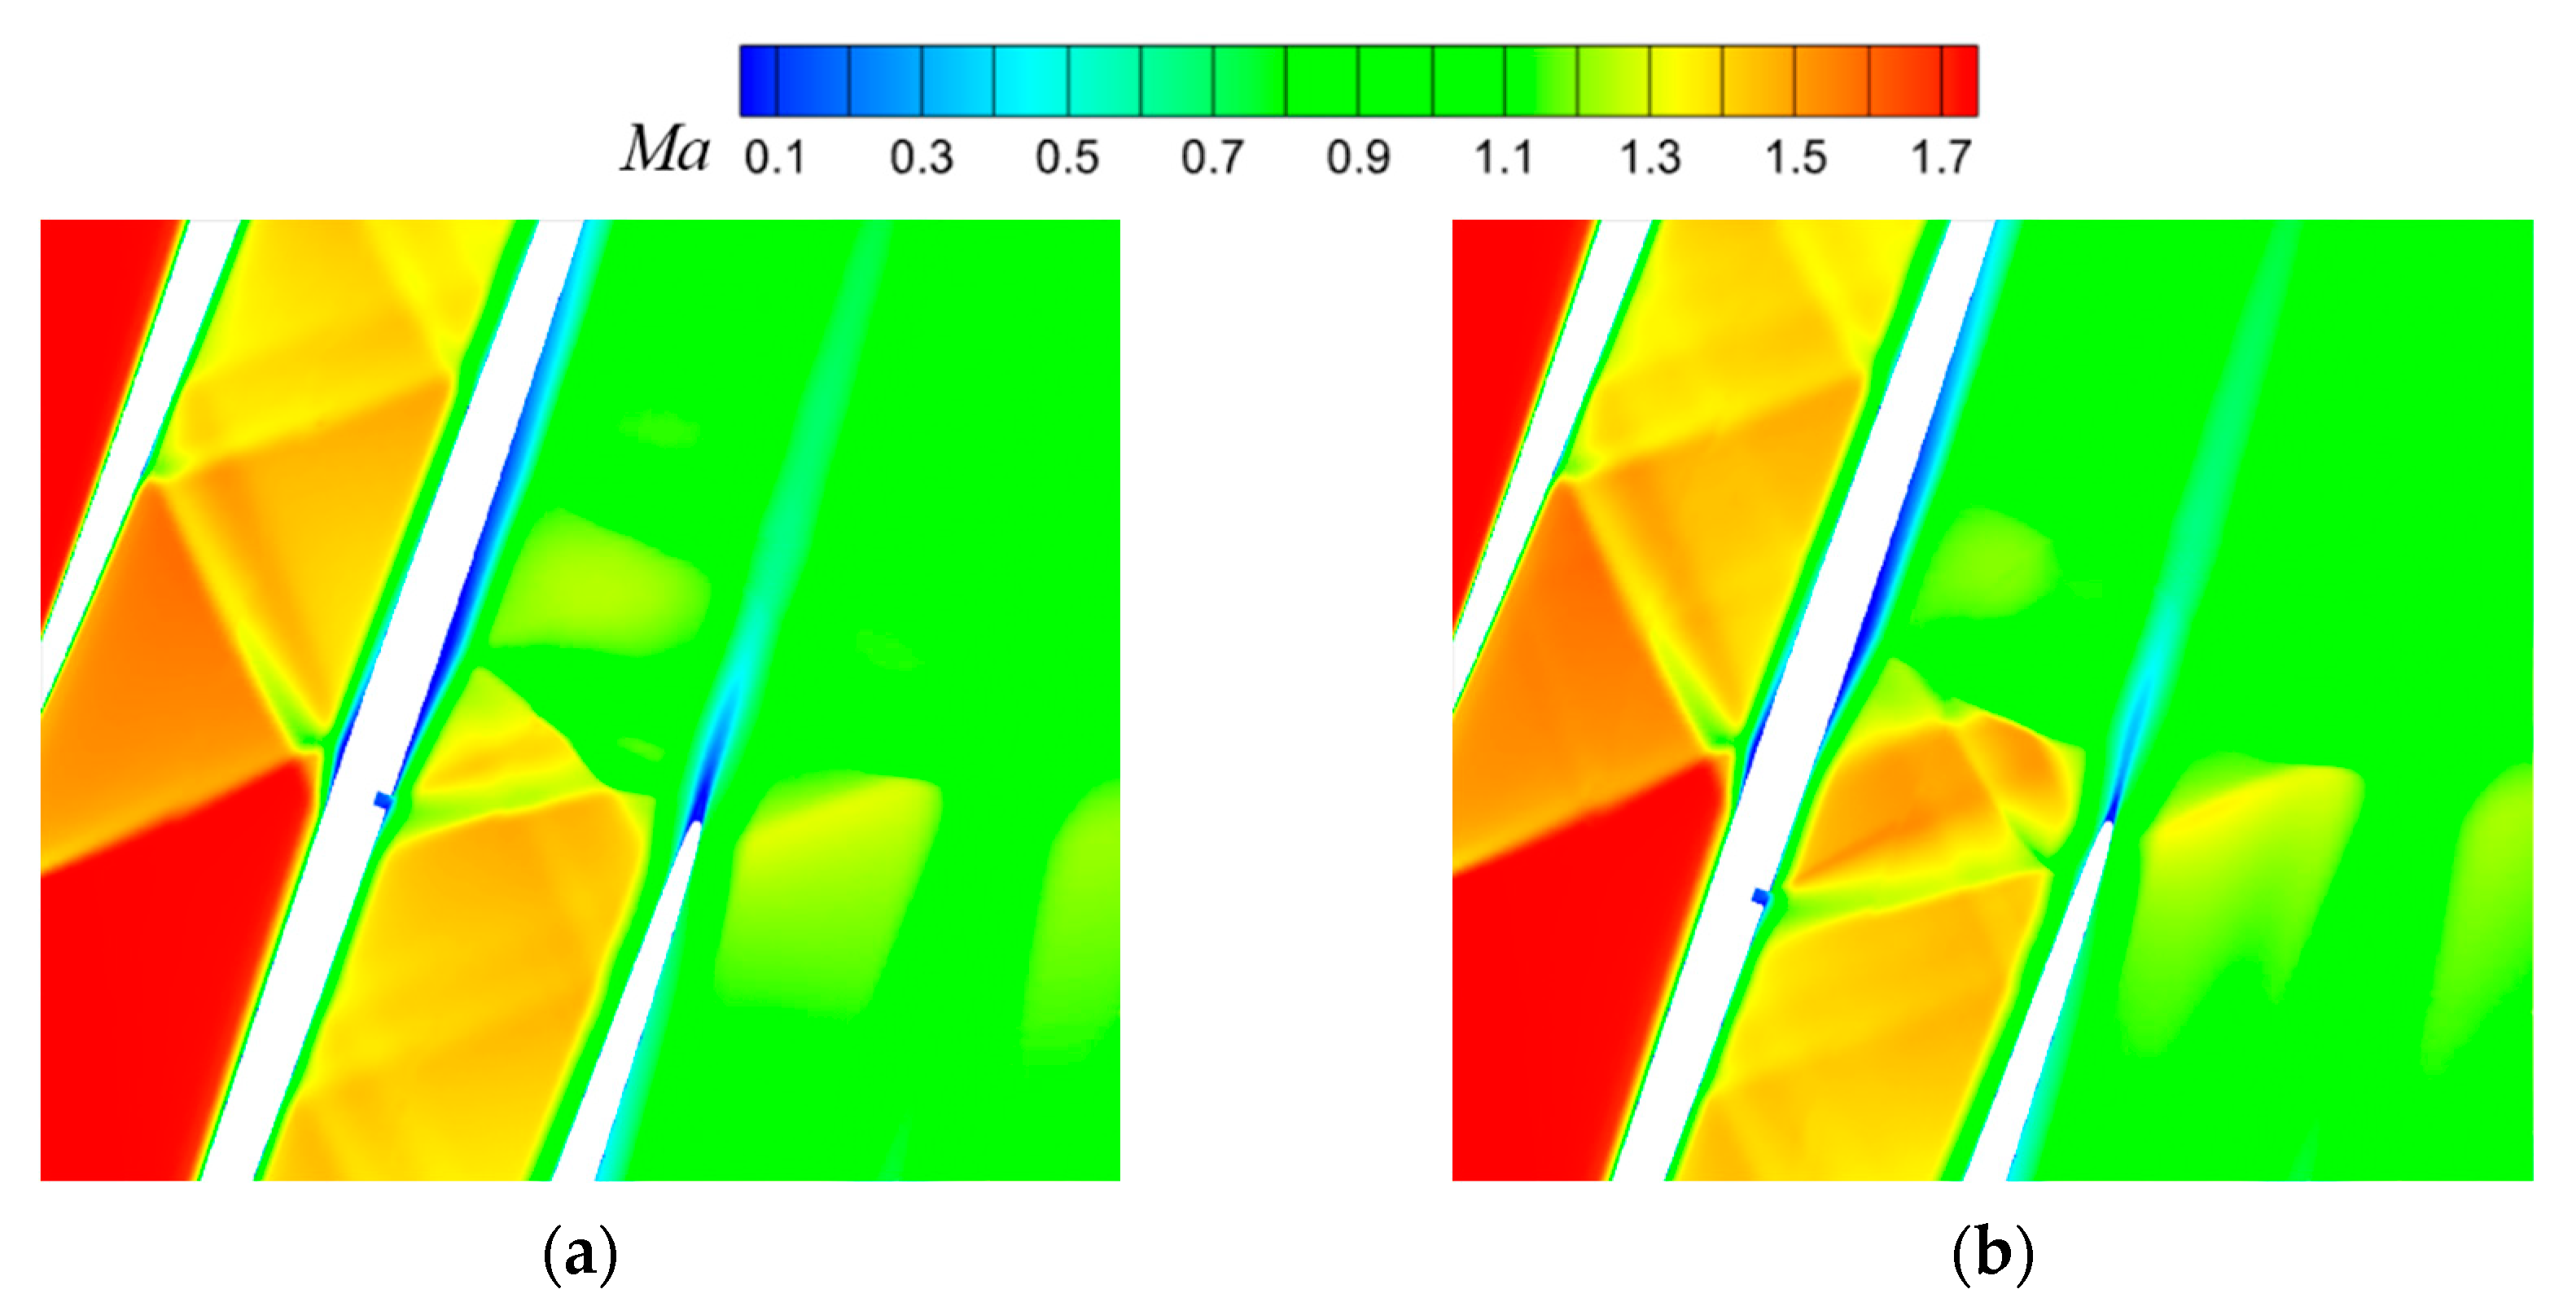
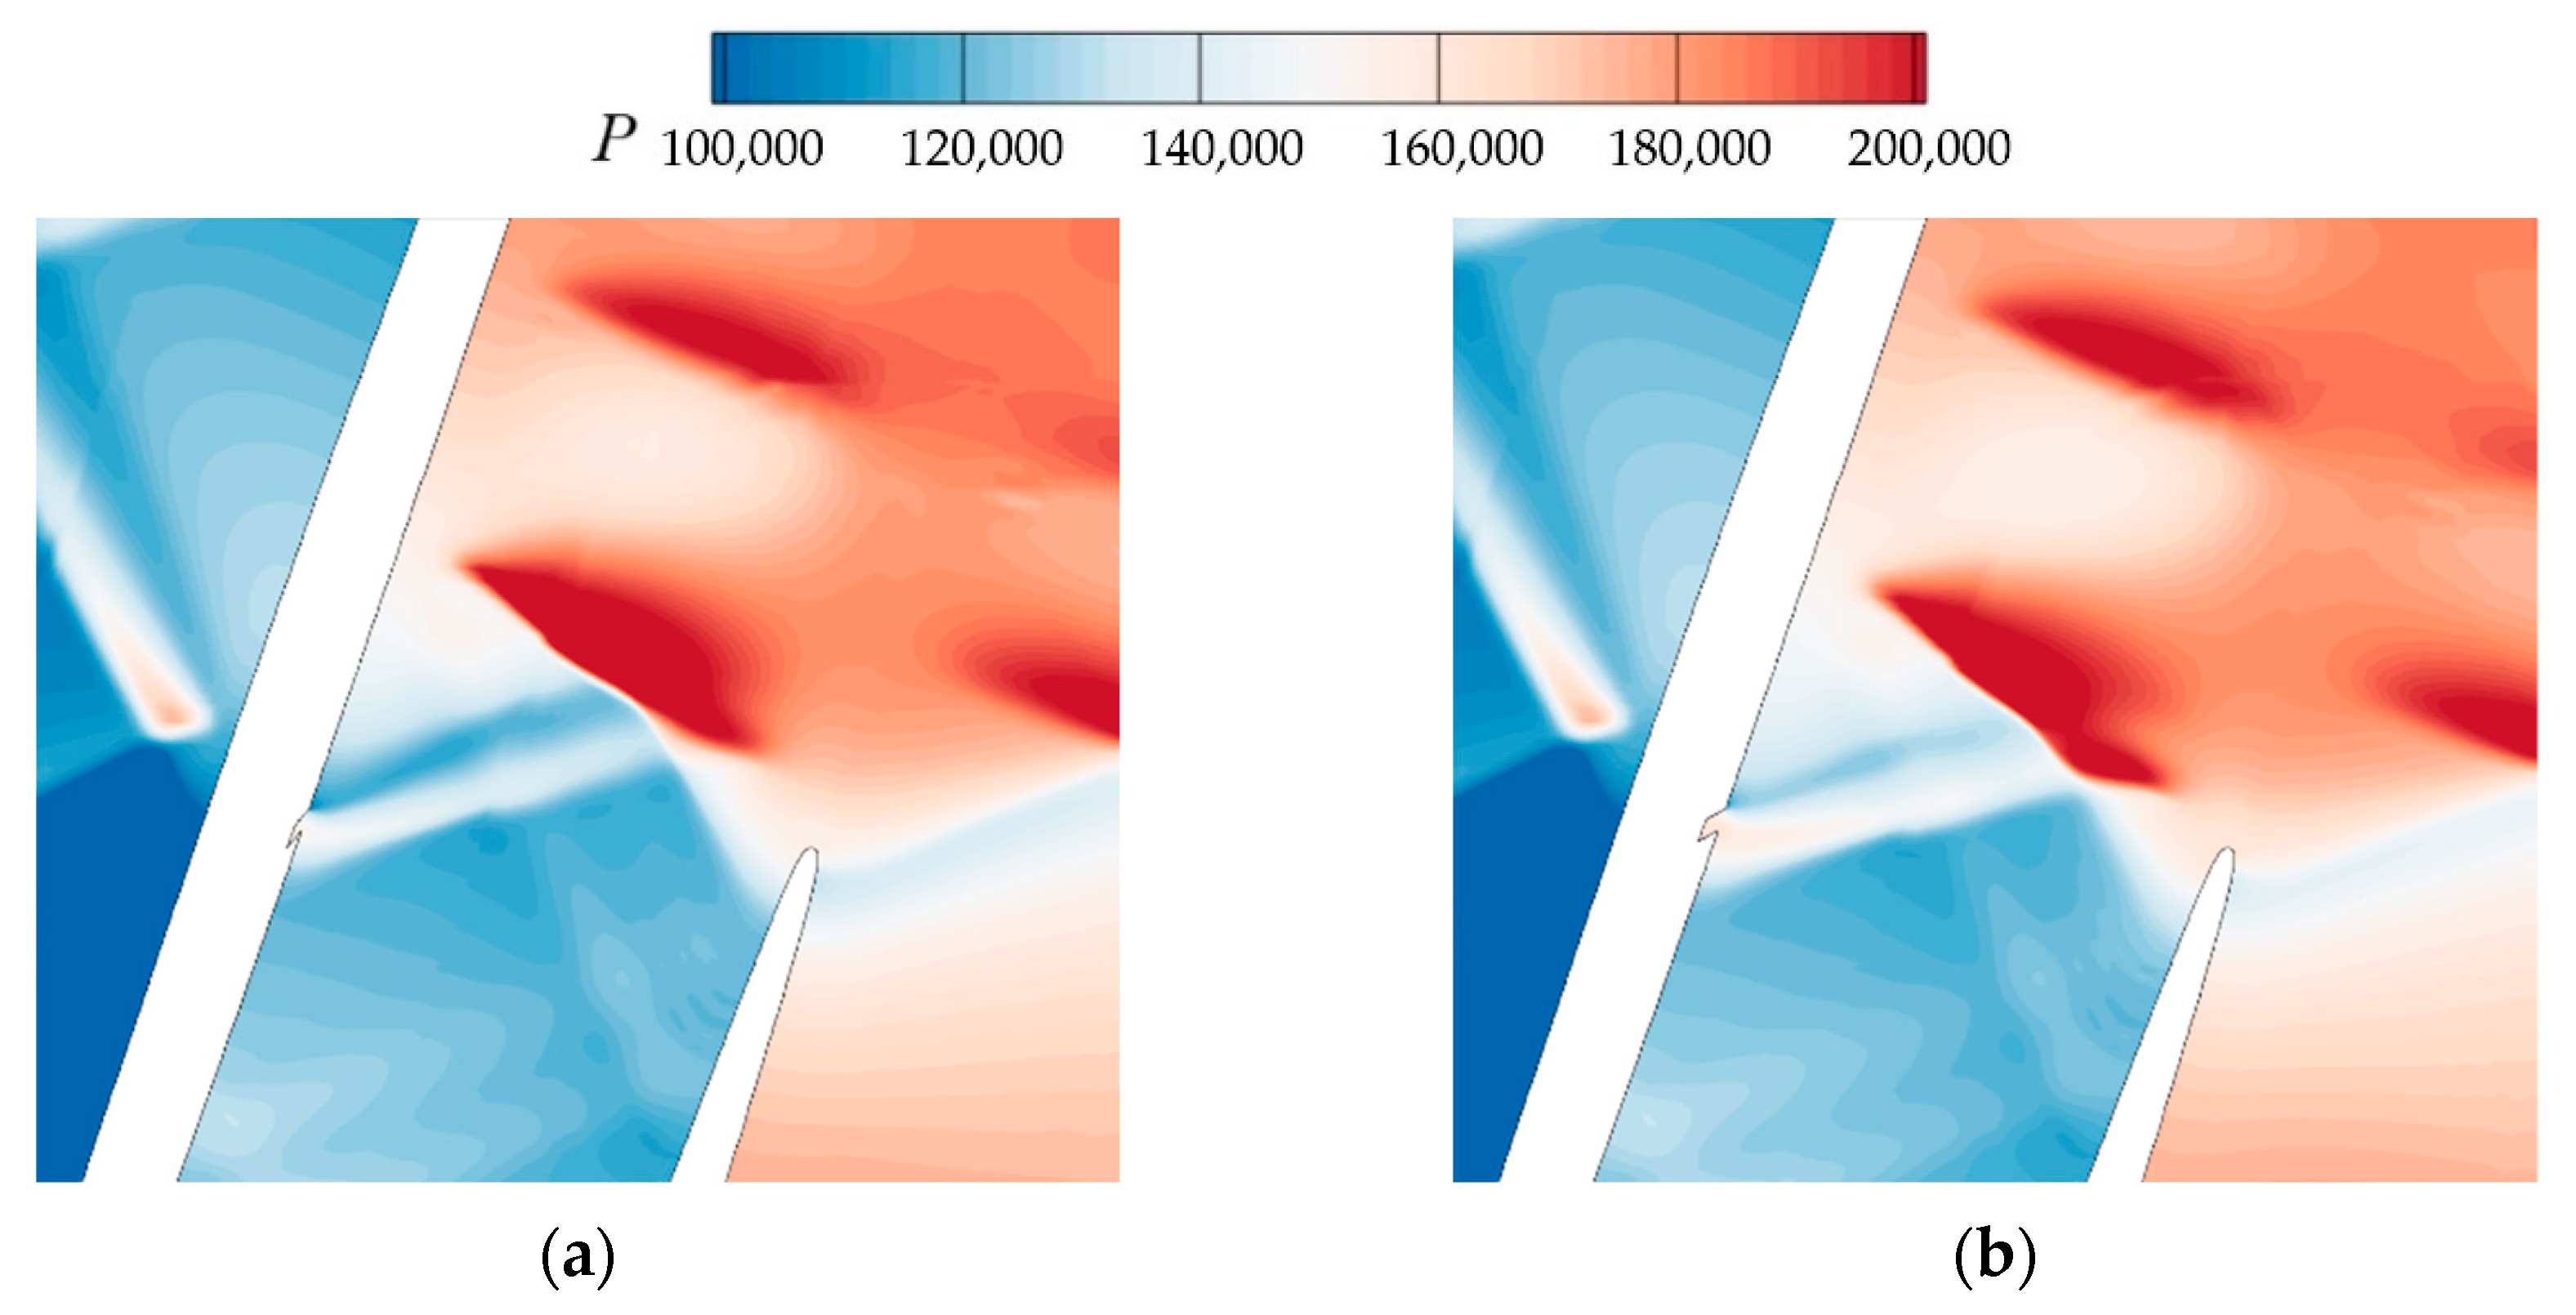
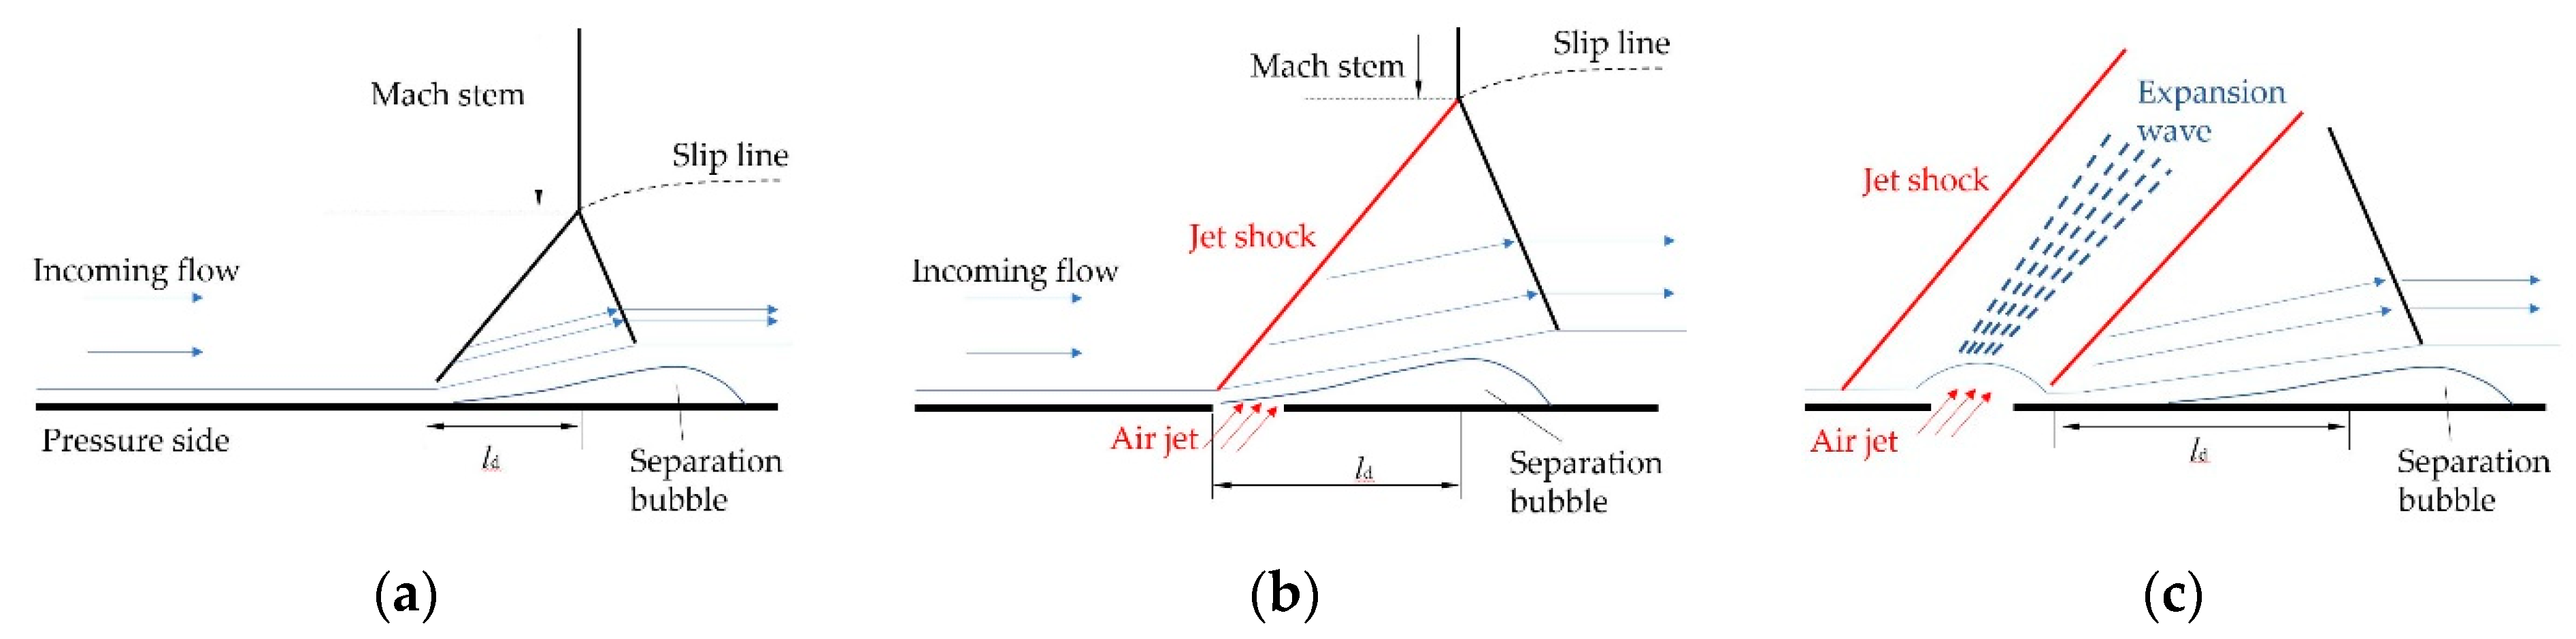
  • Under high back-pressure, a Mach reflection will form near the trailing edge of a “shock-in-type” supersonic cascade. The air jet upstream of the trailing-edge shock can effectively change the pattern of the trailing-edge shock, turning Mach reflection into regular reflection. It forms an oblique shock wave in the cascade passage, so that the airflow is decelerated and pressurized in advance, and the expansion wave downstream of the jet slot interferes with the trailing-edge shock and weakens the strength of the shock. The air jet can reduce the total pressure loss coefficient under the same pressure rise with a total pressure loss improvement effect of 7.29%.
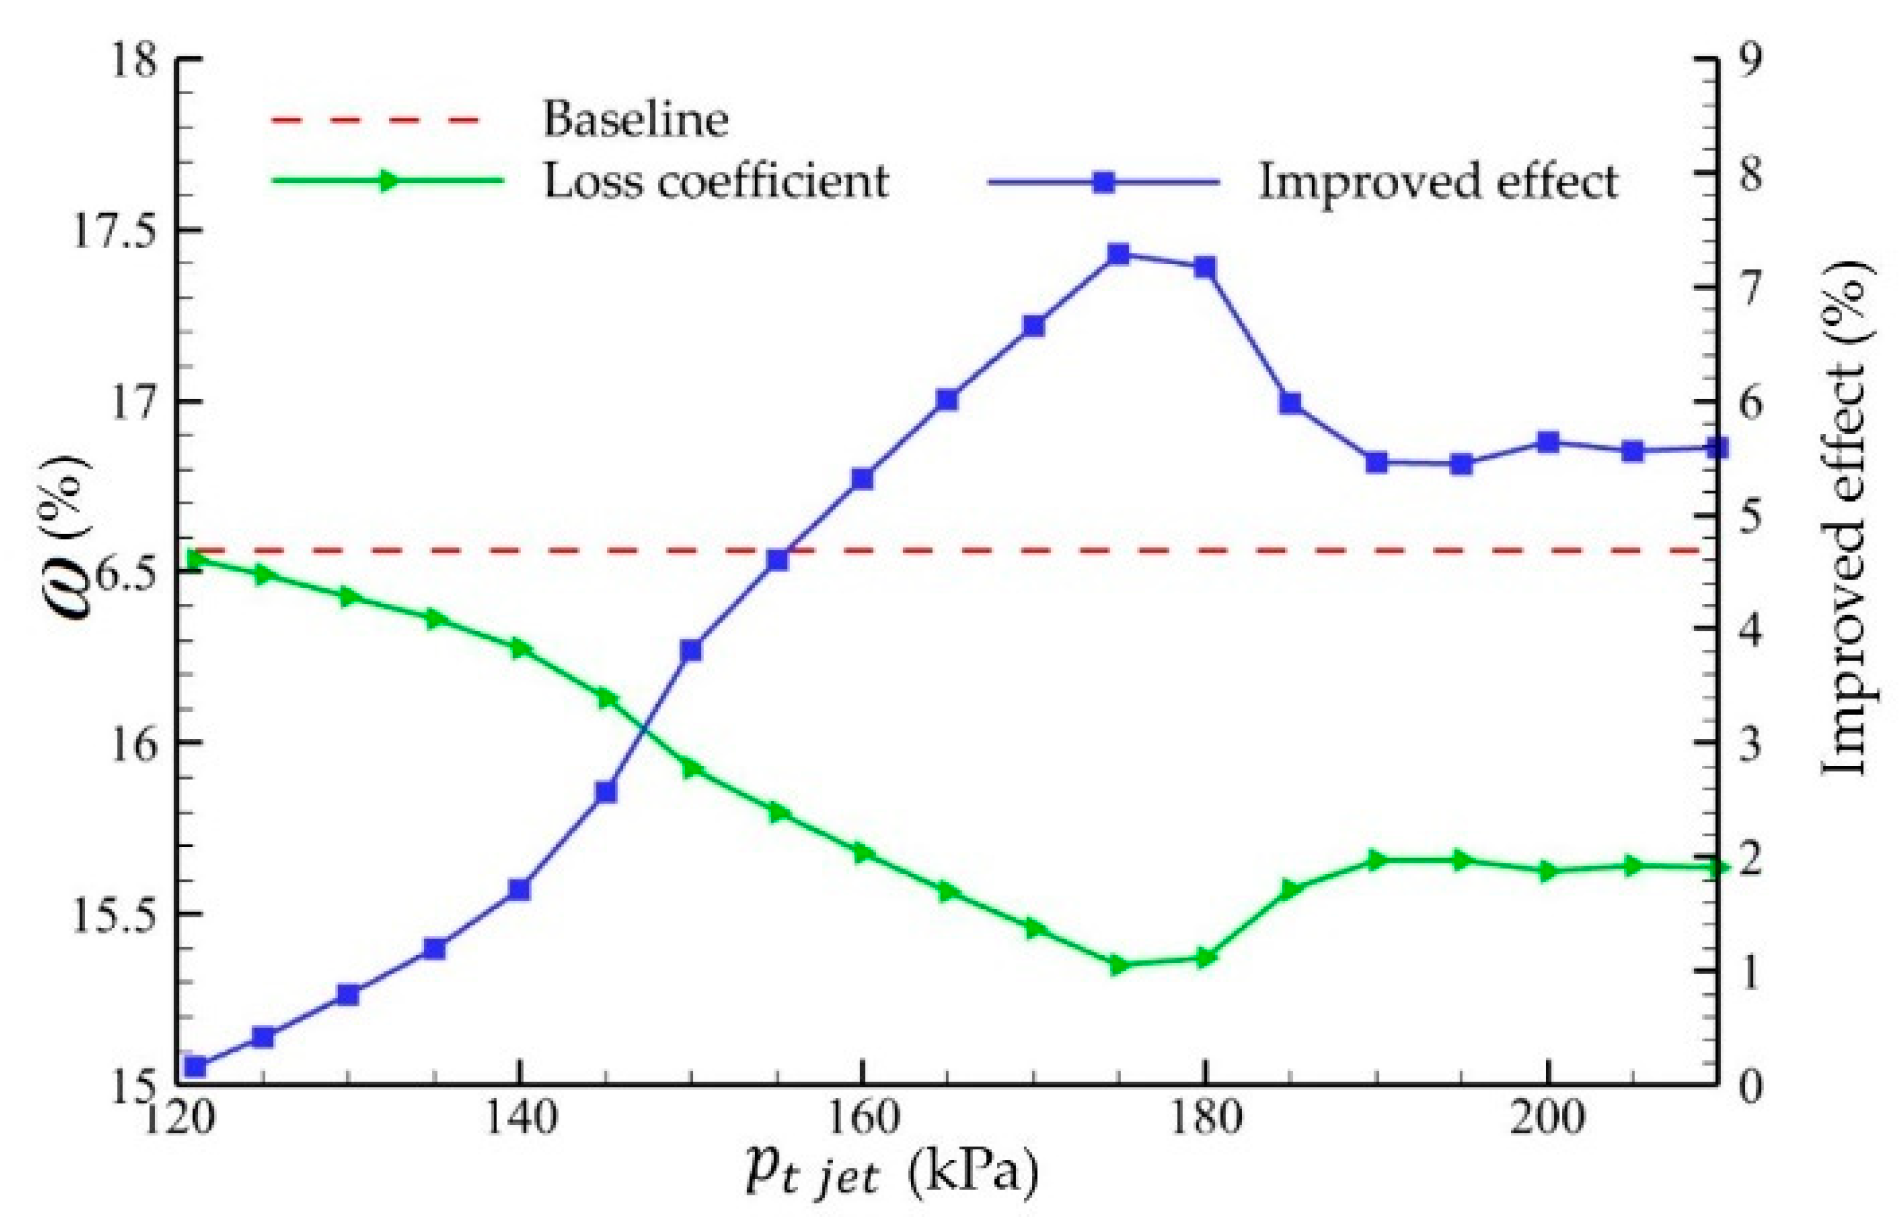
  • There is an optimal range for the strength of the air jet. Noticeable effect can be achieved when the total pressure of the air jet is in the range 160–180 kPa, corresponding to a mass flow rate ratio of 0.35–1.11%. The weak jet shock cannot decelerate and pressurize the airflow in the entire passage. As the strength increases, the pressure rise caused by the trailing-edge shock will be more moderate. Once the strength exceeds the range, the control effect is weakened.
  • The location of the air jet determines the intersection location of the shock induced by the air jet and the trailing-edge shock. If the intersection is in the passage, the air jet cannot affect the trailing-edge fully. If the air jet is arranged far away from the trailing-edge shock, the airflow will re-accelerate after the jet shock and the control effect is weakened. The best control effect can be achieved when the distance from the jet slot to the shock foot of the trailing-edge shock is about five times the thickness of the boundary layer.
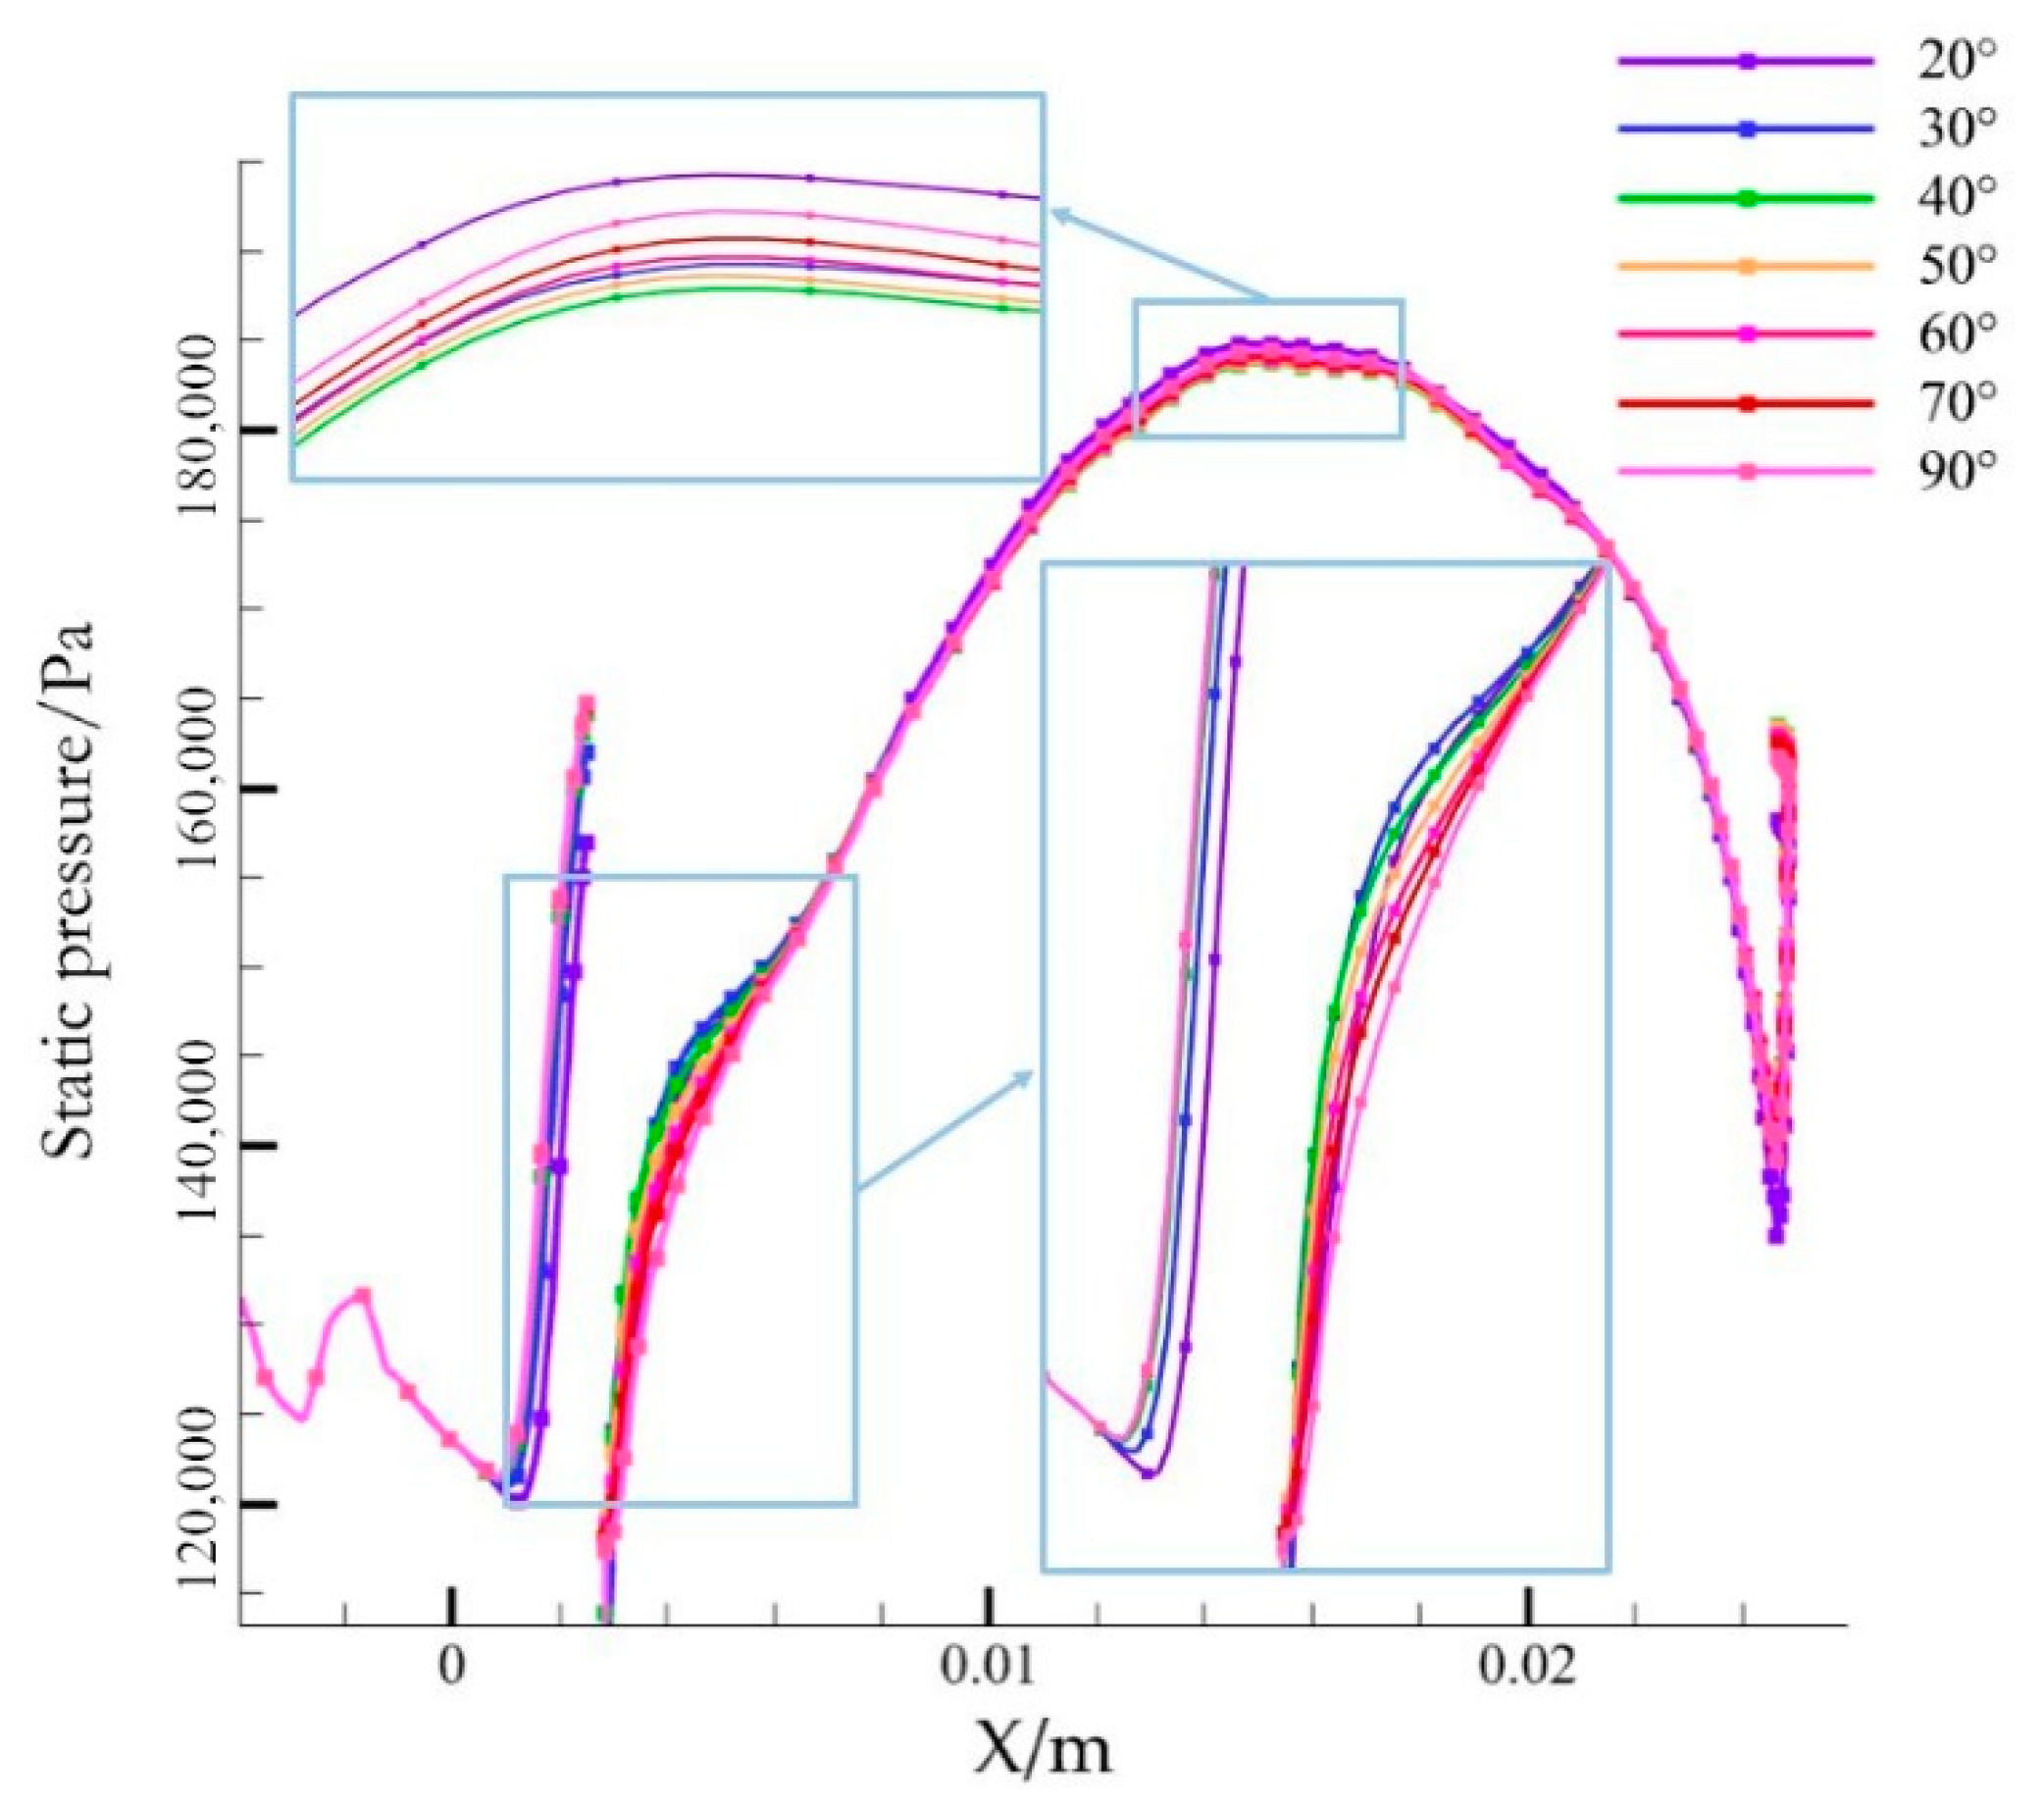
  • The angle of the air jet has limited effect on loss control due to the weak penetration of the jet. As the direction of the air jet gradually deflects towards the incoming flow, the mass flow rate of injection increases slightly and the tangential momentum injected by the air jet into the downstream boundary layer increases. The negative impact of the air jet on the boundary layer decreases. The best control effect can be achieved at 30° to 40°.
Two-dimensional calculation can be approximated as a three-dimensional simulation of the slit air jet, which is difficult to achieve as uniform jet flow in engineering applications. The calculation results of this paper are in an ideal state. The next step will focus on the study of the porous air jet and observation of its three-dimensional effect.

Author Contributions

Conceptualization, Z.L. and W.P.; Formal analysis, Y.Z. (Yinxin Zhu), Q.L. and W.X.; Investigation, Y.Z. (Yinxin Zhu), Z.L., W.P., Q.L., Y.Z. (Yan Zhou), P.C., Z.M. and X.X.; Methodology, Y.Z. (Yinxin Zhu), Z.L., W.P., Z.M. and X.X.; Project administration, Z.L., W.P. and Q.L.; Supervision, Z.L. and W.P.; Validation, Q.L., Y.Z. (Yan Zhou), W.X., P.C., Z.M. and X.X.; Writing—original draft, Y.Z. (Yinxin Zhu), Q.L. and W.X.; Writing—review and editing, Y.Z. (Yinxin Zhu), Z.L., W.P., Q.L., Y.Z. (Yan Zhou), W.X., P.C., Z.M. and X.X. All authors have read and agreed to the published version of the manuscript.

Funding

This research was funded by National Natural Science Foundation of China, grant number 52075538, National Natural Science Foundation of China, grant number 12002377, National Natural Science Foundation of China, grant number 12202488 and National Science and Technology Major Project, grant number J2019-II-0016-0037.

Data Availability Statement

No new data were created or analyzed in this study. Data sharing does not apply to this article.

Acknowledgments

Particular thanks to the Institute of Engineering Thermophysics, Chinese Academy of Sciences for the offer of the geometry of the compressor cascade. Thanks to Yongzhen Liu, Xiaoxiao Zhou and Qiangren Xu for their technical guidance on numerical calculation work.

Conflicts of Interest

The authors declared no potential conflict of interest. The funders had no role in the design of the study; in the collection, analyses, or interpretation of data; in the writing of the manuscript; or in the decision to publish the results.

References

  1. John, A.; Shahpar, S.; Qin, N. Alleviation of Shock-Wave Effects on a Highly Loaded Axial Compressor Through Novel Blade Shaping. In Turbomachinery; American Society of Mechanical Engineers: Seoul, Korea, 2016; Volume 2A, p. V02AT37A040. [Google Scholar] [CrossRef]
  2. Zhu, D.; Zheng, X. Fuel consumption and emission characteristics in asymmetric twin-scroll turbocharged diesel engine with two exhaust gas recirculation circuits. Appl. Energy 2019, 238, 985–995. [Google Scholar] [CrossRef]
  3. Cao, Z.; Gao, X.; Zhang, T.; Liu, B. Flow Mechanism and Aspiration Strategies in an Ultra-Highly Loaded Supersonic Compressor Cascade. Aerosp. Sci. Technol. 2020, 104, 105989. [Google Scholar] [CrossRef]
  4. Hubrich, K.; Bo¨lcs, A.; Ott, P. Boundary Layer Suction via a Slot in a Transonic Compressor: Numerical Parameter Study and First Experiments. In Turbo Expo 2004, Parts A and B; ASMEDC: Vienna, Austria, 2004; Volume 5, pp. 527–536. [Google Scholar] [CrossRef]
  5. Schuler, B.J.; Kerrebrock, J.L.; Merchant, A. Experimental Investigation of a Transonic Aspirated Compressor. J. Turbomach. 2005, 127, 340–348. [Google Scholar] [CrossRef]
  6. Li, Z.; Zheng, X. Review of design optimization methods for turbomachinery aerodynamics. Prog. Aerosp. Sci. 2017, 93, 1–23. [Google Scholar] [CrossRef]
  7. Song, B.; Ng, W.; Sonoda, T.; Arima, T. Loss Mechanisms of High-Turning Supercritical Compressor Cascades. J. Propuls. Power 2008, 24, 416–423. [Google Scholar] [CrossRef]
  8. Liu, B.; Shi, H.; Yu, X. A New Method for Rapid Shock Loss Evaluation and Reduction for the Optimization Design of a Supersonic Compressor Cascade. Proc. Inst. Mech. Eng. Part G J. Aerosp. Eng. 2018, 232, 2458–2476. [Google Scholar] [CrossRef]
  9. Sun, X.; Yang, S.; Zhao, Q. Shock Loss Model and Blade Profile Optimization Design of a Supersonic Cascade. Proc. Inst. Mech. Eng. Part G J. Aerosp. Eng. 2015, 229, 1325–1329. [Google Scholar] [CrossRef]
  10. Sonoda, T.; Olhofer, M.; Arima, T.; Sendhoff, B. A New Concept of a Two-Dimensional Supersonic Relative Inlet Mach Number Compressor Cascade. In Turbomachinery, Parts A and B; ASMEDC: Orlando, FL, USA, 2009; Volume 7, pp. 555–565. [Google Scholar] [CrossRef]
  11. Song, P.; Sun, J. Blade Shape Optimization for Transonic Axial Flow Fan. J. Mech. Sci. Technol. 2015, 29, 931–938. [Google Scholar] [CrossRef]
  12. Razavi, S.R.; Sammak, S.; Boroomand, M. Multidisciplinary Design and Optimizations of Swept and Leaned Transonic Rotor. J. Eng. Gas Turbines Power 2017, 139, 122601. [Google Scholar] [CrossRef]
  13. Cao, Z.; Gao, X.; Zhang, X.; Zhang, F.; Liu, B. Effect of Endwall Passage Vortex Generator on Corner Stall of a Tandem Compressor Cascade. Int. J. Heat Fluid Flow 2022, 94, 108946. [Google Scholar] [CrossRef]
  14. John, A.; Qin, N.; Shahpar, S. Using Shock Control Bumps to Improve Transonic Fan/Compressor Blade Performance. J. Turbomach. 2019, 141, 081003. [Google Scholar] [CrossRef] [Green Version]
  15. Yang, Z.; Mao, X.; Liu, B. Numerical Investigation of Secondary Flow Control by Boundary Layer Suction on the End-Wall in a Highly-Loaded Axial Compressor Cascade. J. Aeronaut. Astronaut. Aviat. 2021, 53, 483–496. [Google Scholar] [CrossRef]
  16. Wang, Z.; Chang, J.; Zhang, J.; Ma, J. Investigations on Flowfield Behavior and Resistance Backpressure Characteristics of Supersonic Cascade with Boundary Layer Suction. Acta Astronaut. 2018, 152, 588–601. [Google Scholar] [CrossRef]
  17. Wang, Y.; Zhang, H.; Wu, Y.; Li, Y.; Zhu, Y. Supersonic Compressor Cascade Flow Control Using Plasma Actuation at Low Reynolds Number. Phys. Fluids 2022, 34, 027105. [Google Scholar] [CrossRef]
  18. Liu, Q.; Luo, Z.; Deng, X.; Wang, D.; Wang, L.; Zhou, Y.; Cheng, P. Fine Structures of Self-Sustaining Dual Jets in Supersonic Crossflow. Acta Astronaut. 2019, 164, 262–267. [Google Scholar] [CrossRef]
  19. Liu, Q.; Luo, Z.; Deng, X.; Zhou, Y.; Wang, L.; Cheng, P. Vortical Structures and Density Fluctuations Analysis of Supersonic Forward-Facing Step Controlled by Self-Sustaining Dual Synthetic Jets. Acta Mech. Sin. 2020, 36, 1215–1227. [Google Scholar] [CrossRef]
  20. Ma, J.; Yang, G.; Zhou, L.; Ji, L.; Zhang, C. Effect of a Blade End Slot on Supersonic Compressor Cascade Hub-Corner Separation. Aerosp. Sci. Technol. 2021, 118, 107032. [Google Scholar] [CrossRef]
  21. Benini, E.; Biollo, R.; Ponza, R. Efficiency Enhancement in Transonic Compressor Rotor Blades Using Synthetic Jets: A Numerical Investigation. Appl. Energy 2011, 88, 953–962. [Google Scholar] [CrossRef]
  22. Klinner, J.; Hergt, A.; Grund, S.; Willert, C.E. Experimental Investigation of Shock-Induced Separation and Flow Control in a Transonic Compressor Cascade. Exp. Fluids 2019, 60, 96. [Google Scholar] [CrossRef]
  23. Telisinghe, J.C.; Ireland, P.T.; Jones, T.V.; Barrett, D.; Son, C. Comparative Study Between a Cut-Back and Conventional Trailing Edge Film Cooling System. In Heat Transfer, Parts A and B; ASMEDC: Barcelona, Spain, 2006; Volume 3, pp. 983–993. [Google Scholar] [CrossRef]
  24. Bernardini, C.; Salvadori, S.; Martelli, F.; Paniagua, G.; Saracoglu, B.H. Pulsating Coolant Ejection Effects Downstream of Supersonic Trailing Edge. Eng. Appl. Comput. Fluid Mech. 2013, 7, 250–260. [Google Scholar] [CrossRef] [Green Version]
  25. Gao, J.; Wei, M.; Fu, W.; Zheng, Q.; Yue, G. Experimental and Numerical Investigations of Trailing Edge Injection in a Transonic Turbine Cascade. Aerosp. Sci. Technol. 2019, 92, 258–268. [Google Scholar] [CrossRef]
  26. Szwaba, R. Influence of Air-Jet Vortex Generator Diameter on Separation Region. J. Therm. Sci. 2013, 22, 294–303. [Google Scholar] [CrossRef]
  27. Szwaba, R. Shock Wave Induced Separation Control by Streamwise Vortices. J. Therm. Sci. 2005, 14, 249–253. [Google Scholar] [CrossRef]
  28. Souverein, L.J.; Debiève, J.-F. Effect of Air Jet Vortex Generators on a Shock Wave Boundary Layer Interaction. Exp. Fluids 2010, 49, 1053–1064. [Google Scholar] [CrossRef] [Green Version]
  29. Verma, S.B.; Manisankar, C. Control of Compression-Ramp-Induced Interaction with Steady Microjets. AIAA J. 2019, 57, 2892–2904. [Google Scholar] [CrossRef]
  30. Verma, S.B.; Manisankar, C. Shockwave/Boundary-Layer Interaction Control on a Compression Ramp Using Steady Micro Jets. AIAA J. 2012, 50, 2753–2764. [Google Scholar] [CrossRef]
  31. Liu, Y.Z. Investigation on the Organization Method of Passage Shock Wave and Control of Leading-Edge Passage Shock Wave/Boundary-Layer Interaction within “Shock-in-Type” Supersonic Compressor; University of Chinese Academy of Sciences, Institute of Engineering: Beijing, China, 2021. (In Chinese) [Google Scholar]
  32. Kazuyasu, M.; Yoshiaki, M.; Heuy-Dong, K. Shock train and pseudo-shock phenomena in internal gas flows. Prog. Aerosp. Sci. 1999, 35, 33–100. [Google Scholar] [CrossRef]
  33. Ahmed, K.A.; Moody, J.K.; Forliti, D.J. The Effect of Slot Jet Size on the Confined Transverse Slot Jet. Exp. Fluids 2008, 45, 13–26. [Google Scholar] [CrossRef]
Figure 1. Computational domain and grid of cascade.
Aerospace 09 00713 g001
Figure 2. Sketch map of the air jet control scheme and its geometrical definitions.
Aerospace 09 00713 g002
Figure 3. Isentropic Mach number distribution on blade surface [31].
Aerospace 09 00713 g003
Figure 4. Density gradient magnitude contours for baseline and controlled cases: (a) baseline case; (b) controlled case.
Aerospace 09 00713 g004
Figure 5. Local enlargement near the trailing-edge shock and the corresponding static pressure distribution on blade surface: (a) baseline case; (b) controlled case.
Aerospace 09 00713 g005
Figure 6. Total pressure loss contours for baseline and controlled cases: (a) baseline case; (b) controlled case.
Aerospace 09 00713 g006
Figure 7. Turbulent kinetic energy contours for baseline and controlled cases: (a) baseline case; (b) controlled case.
Aerospace 09 00713 g007
Figure 8. Profiles of variations of total pressure loss coefficient and improved effect with different strengths of jet.
Aerospace 09 00713 g008
Figure 9. Density gradient magnitude contours with different strength of jet: (a) baseline; (b) p j * = 130   kPa ; (c) p j * = 145   kPa ; (d) p j * = 165   kPa ; (e) p j * = 175   kPa ; (f) p j * = 210   kPa .
Aerospace 09 00713 g009
Figure 10. Static pressure distribution on blade surface with different strengths of jet.
Aerospace 09 00713 g010
Figure 11. Static pressure contours with different strengths of jet: (a) baseline; (b) p j * = 165   kPa ; (c) p j * = 210   kPa .
Aerospace 09 00713 g011
Figure 12. Density gradient magnitude contours with different locations of jet: (a) Δ l = 2 δ ; (b) Δ l = 5 δ ; (c) Δ l = 8 δ ; (d) Δ l = 10 δ .
Aerospace 09 00713 g012
Figure 13. Mach number contours with different locations of jet: (a) Δ l = 5 δ ; (b) Δ l = 10 δ .
Aerospace 09 00713 g013
Figure 14. Static pressure distribution on blade surface with different angles of jet.
Aerospace 09 00713 g014
Figure 15. Static pressure contours with different angles of jet: (a) α = 20 ° ; (b) α = 40 ° .
Aerospace 09 00713 g015
Figure 16. Simplified models of trailing-edge shock near pressure side: (a) no control; (b) air jet close to uncontrolled trailing-edge shock; (c) air jet far from uncontrolled trailing-edge shock.
Aerospace 09 00713 g016
Table 1. Main parameters of the supersonic cascade SCM-1.75.
ParameterValue
Chord (mm)155
Pitch (mm)70
Incoming Mach number1.75
Leading-edge radius (mm)0.2
Trailing-edge radius (mm)0.2
Stagger angle (°)70
Geometric inlet angle (°)70.5
Geometric outlet angle (°)72
Table 2. Related parameters of various strength of air jet.
Case NumberTotal Pressure of Air Jet (kPa)mr (%)Jω (%)ωj (%)Δωj (%)
Case 0///16.5616.56/
Case 11300.070.01416.4716.430.78
Case 21450.180.05116.2416.132.57
Case 31650.450.06615.8215.566.01
Case 41750.840.07015.7915.357.29
Case 52101.840.17216.4415.655.58
Table 3. Related parameters of various locations of air jet.
Case NumberLocation of Air Jet ( δ )mr (%)ω (%)ωj (%)Δωj (%)
Case 620.4515.9915.754.91
Case 350.4515.8215.566.01
Case 780.4516.0215.774.79
Case 8100.4516.2816.033.22
Table 4. Related parameters of various angles of air jet.
Case NumberAngle of Air Jet (°)Total Pressure of Air Jet (kPa)mr (%)ω (%)ωj (%)Δωj (%)
Case 9201655.8315.8215.496.43
Case 10301656.7815.7615.397.09
Case 11401656.6615.7615.397.06
Case 12501656.1715.7715.436.84
Case 13601655.6915.7815.476.59
Case 14701655.2615.7915.506.38
Case 15901654.5415.8215.566.01
Publisher’s Note: MDPI stays neutral with regard to jurisdictional claims in published maps and institutional affiliations.

