
Three-Dimensional ANP Evaluation Method Based on Spatial Position Uncertainty under RNP Operation
1
College of Automation Engineering, Nanjing University of Aeronautics and Astronautics, No. 29 General Avenue, Nanjing 211106, China
2
AVIC the First Aircraft Institute, Xi’an 710000, China
*
Author to whom correspondence should be addressed.
Aerospace 2022, 9(11), 703; https://doi.org/10.3390/aerospace9110703
Submission received: 13 September 2022
/
Revised: 30 October 2022
/
Accepted: 1 November 2022
/
Published: 10 November 2022
(This article belongs to the Special Issue Advances in Air Traffic and Airspace Control and Management)
Abstract
:Performance-based navigation (PBN) operations based on the required navigation performance (RNP) operations are the trend for civil aviation in the future. In order to further ensure the safety and efficiency of civil aviation operation, RNP will transition from 2D to 3D/4D. Accurately evaluating the actual navigation performance in three-dimensional directions (3D ANP) under civil aircraft RNP operation is important to guarantee the safe flight of civil aircraft. However, the traditional two-dimensional ANP evaluation method mainly focuses on plane navigation performance along the track, lacks the evaluation of the vertical direction. Moreover, the traditional three-dimensional accuracy evaluation method is based on the assumption of three-dimensional independence and uniformity, which can only carry out approximate calculation, and the evaluation result is inaccurate. Therefore, this paper constructs a three-dimensional ellipsoid error probability (EEP) evaluation model for the spatial position uncertainty of the navigation output of the flight management system in three-dimensional directions, and gives the three-dimensional accurate ANP calculation results through iterative numerical integration. The simulation results show that the evaluation method proposed in this paper can accurately evaluate the actual navigation performance of the airborne navigation system in all directions of 3D space, and has higher evaluation accuracy and precision than the traditional ANP evaluation method, which is of great significance to ensure the flight safety of civil aircraft under 3D/4D RNP operation in the future.
1. Introduction
The increasing diversification of air transport and the continuous growth of air transport volume have put forward new demands. The air transport system urgently needs to be upgraded and innovated upon. The International Civil Aviation Organization (ICAO), the Federal Aviation Administration (FAA), the European Aviation Safety Agency (EASA) and Civil Aviation Administration of China (CAAC) actively promote the performance-based navigation (PBN) mode based on the required navigation performance (RNP) operations to enhance the management capability of the future air traffic control four-dimensional track (4DT) operation [1,2,3]. The development of RNP operations and the innovation of airborne navigation systems have freed civil aircraft from the dependence on ground-based navigation facilities, made flight procedures more flexible, maximized the use of airspace, further refined the design of flight safety interval standards and further improved the safety, efficiency, capacity, access, flexibility, predictability and resilience of the National Airspace System (NAS). At the same time, these have reduced the impact of air transport on the environment.
The required navigation performance is developed from the rules for implementation of area navigation (RNAV), which is a RNAV flight mode with airborne performance monitoring and warning functions. When implementing RNP procedures, performance monitoring and alarm functions must be provided in different forms according to the different installations, structures and layouts of airborne navigation systems [4]:
- (1)
- Real-time actual navigation performance evaluation and prediction;
- (2)
- Monitor the airborne navigation performance, provide an alarm when it fails to meet the RNP requirements of the current airspace;
RNP uses total system error that includes the navigation system error (NSE), flight technical error (FTE) and, path definition error (PDE) as the measurement standards for navigation capability. In the designated airspace, as long as the aircraft meets the required navigation performance requirements, it is allowed to fly in the airspace. The limit value of RNP is expected to be achieved for at least 95% of the flight time.
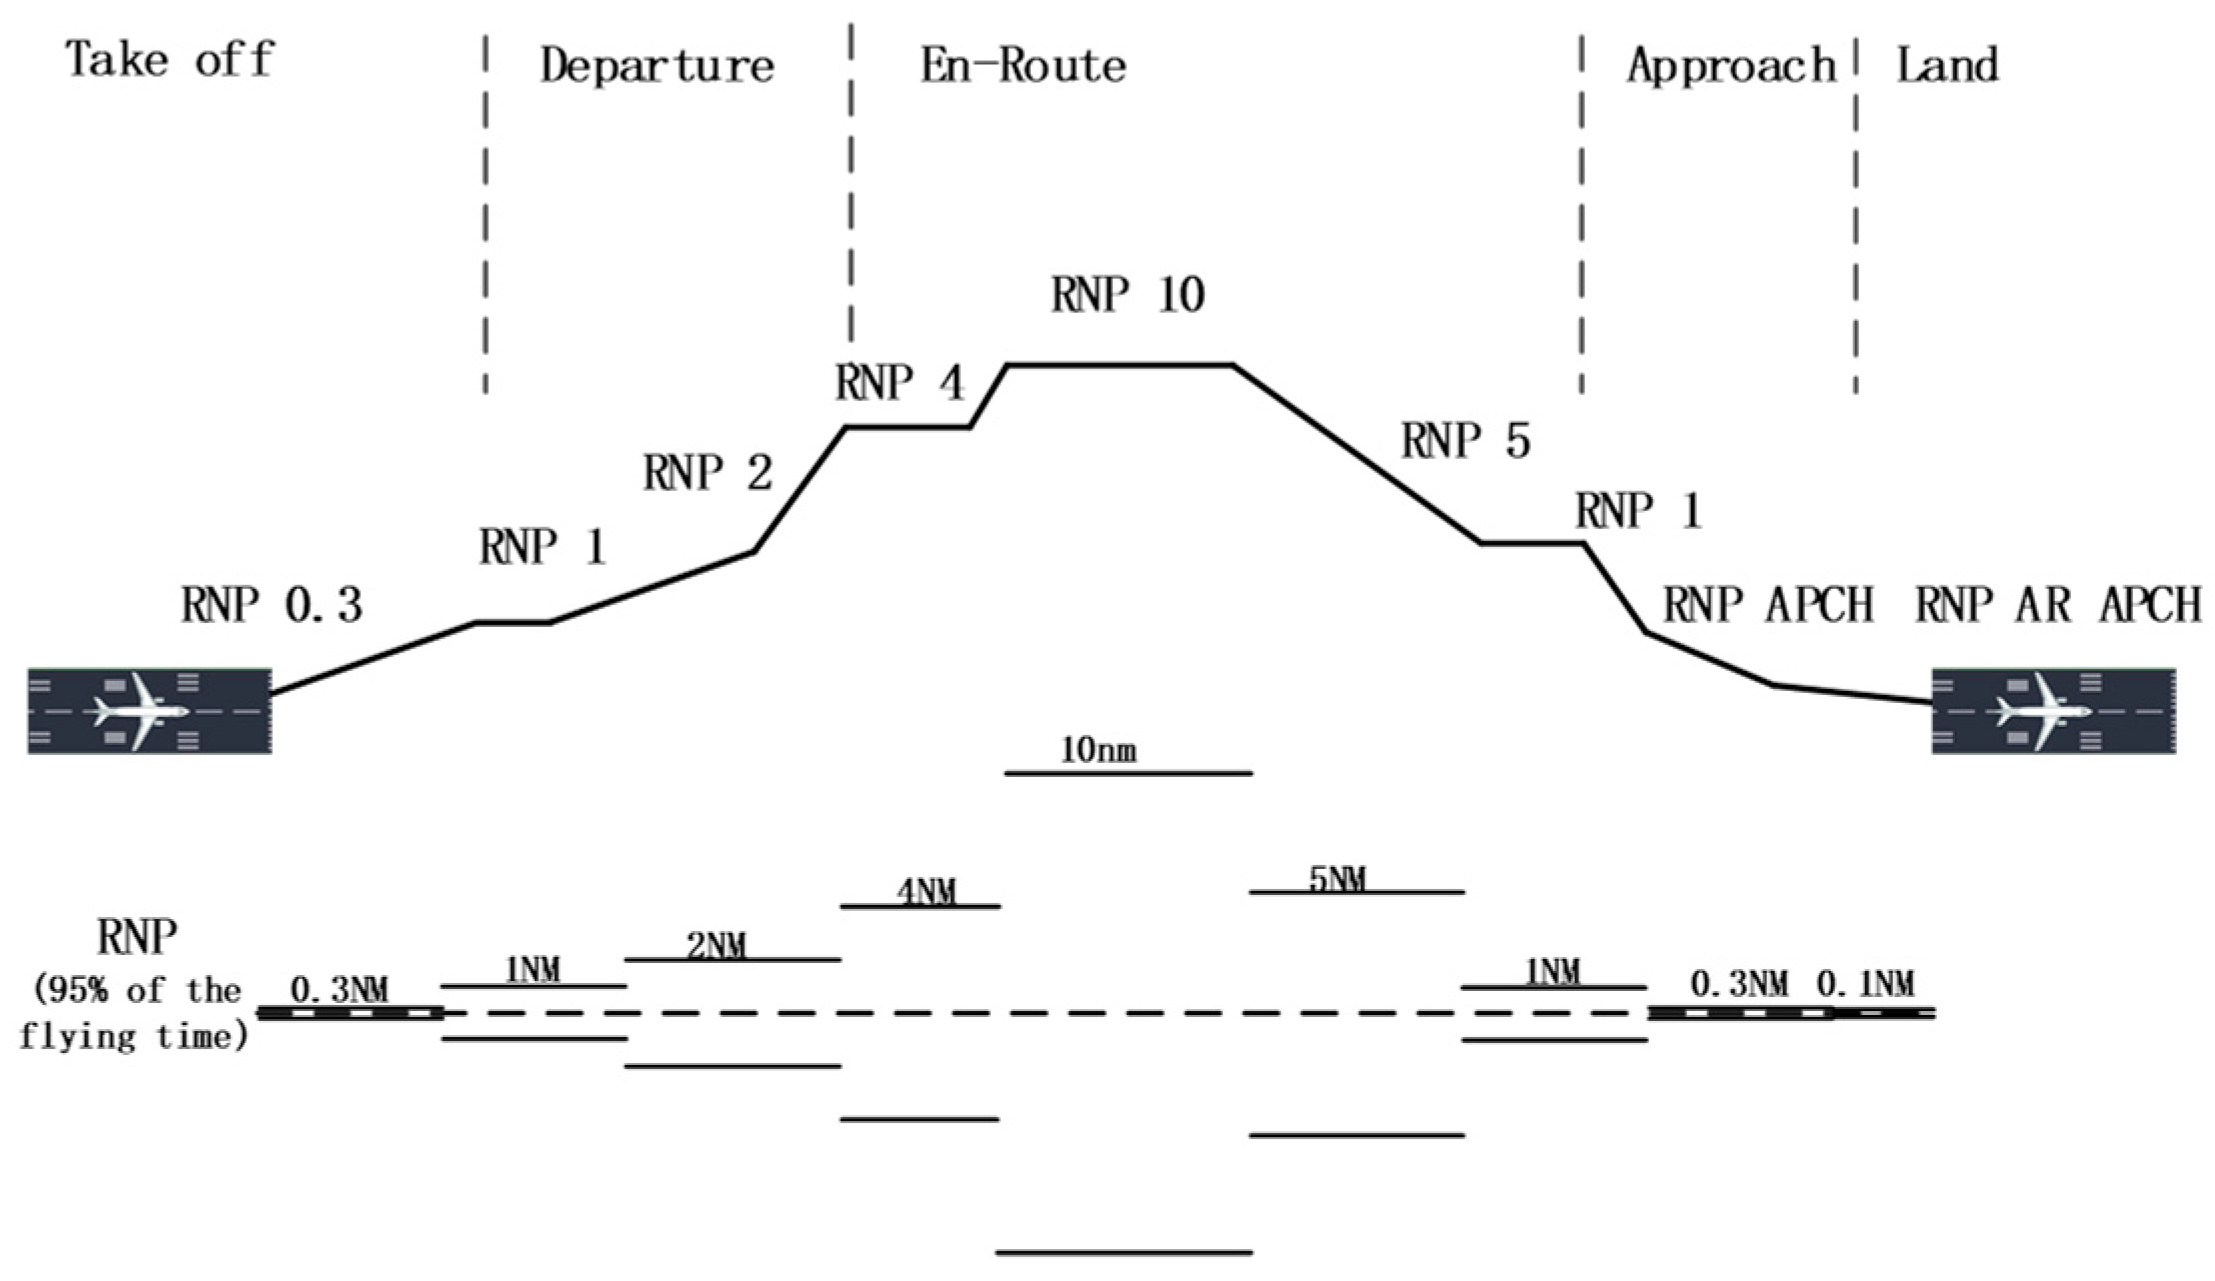
ICAO has specified the minimum navigation performance standard for civil aircraft for different stages of RNP operation [5]. As shown in Figure 1, in the RNP specification, the concept of a safety tunnel is used to quantitatively describe the specific requirements of all flight phases of the aircraft from take-off, climb, cruise, descent, approach and landing, that is, each flight phase has a virtual tunnel, which specifies the vertical and horizonal boundary of the flight path perimeter of the flight phase, and the aircraft navigation performance must meet the RNP requirements of the flight phase.
The flight management system takes the actual navigation performance (ANP) as an index to evaluate the accuracy of the navigation system, so as to judge whether the aircraft is in a safe tunnel [6]. At this stage, the ANP model uses the probability circle radius of estimated position uncertainty (EPU) to represent the actual navigation performance [7], and uses the 95% position error circle radius in the horizontal direction as the actual navigation performance of civil aircraft during RNP flight. This method reduces the three-dimensional position information of civil aircraft to two-dimensional [8,9,10,11,12], which has the problem of lack of vertical information and cannot characterize the three-dimensional actual navigation performance of civil aircraft.
At the same time, at present, the spherical error probability (SEP) model is commonly used to evaluate the spatial position accuracy, that is, 50% of the error sphere radius is used as the evaluation result of the three-dimensional position accuracy. However, during the RNP operation, FMS uses different sensors to provide fusion navigation information. The GNSS outputs three-dimensional position information, but presents different performance in the horizontal and vertical directions due to constellation distribution [13]. The land-based radio navigation system (DME/VOR) only provides horizontal position. The barometric altimeter only provides height information [14]. This results in the unequal variance of the three-dimensional position error of FMS output; the SEP model cannot obtain an accurate solution, so only approximate calculations can be carried out [15]. In addition, the spatial position uncertainty of civil aircraft during RNP flight is also reflected in the correlation of navigation results in the three-dimensional direction. At this time, using the SEP model for ANP evaluation will further reduce the evaluation accuracy and effectiveness.
2. Related Work
2.1. Traditional Two-Dimensional ANP Model and Calculation Method
Traditional ANP calculation only considers the position uncertainty caused by a single sensor and mainly focuses on the navigation and positioning performance of the aircraft along the track direction.
The horizontal ANP evaluation is regarded as the calculation process of the horizontal position error probability circle radius with the estimated position of the main navigation sensor as the center of the circle.
E represents the mean value of the position-estimated error of the FMS along the horizontal plane.
is the covariance matrix of horizontal position estimation error for flight management system.
Then the joint probability density function of horizontal position error can be expressed as:
The correlation coefficient is:
The major and minor axes of the error ellipse after rotation transformation coincide with the coordinate axis. At this time, the joint probability density function can be expressed as:
The covariance matrix becomes:
Within:
The probability P of the real position falling into the two-dimensional normal distribution integral circle is:
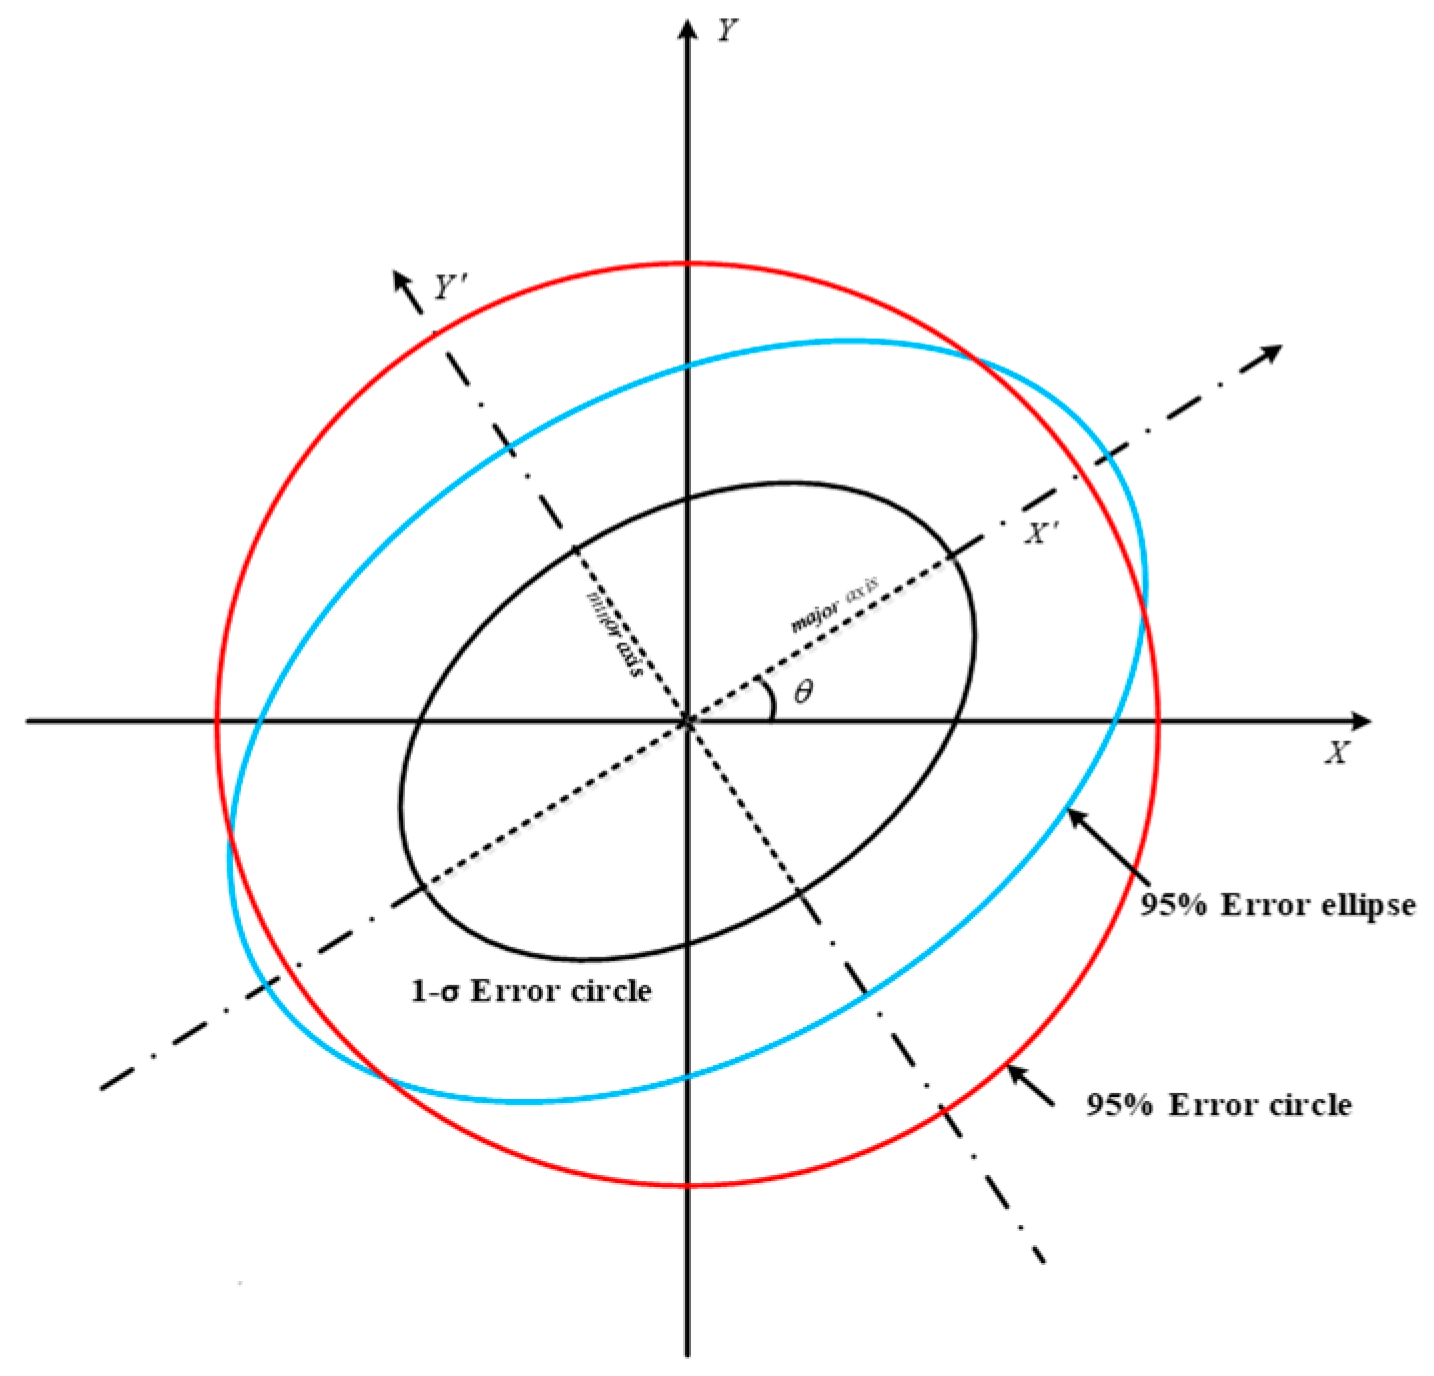
As shown in Figure 2, the ANP value estimated by the position of the flight management system at this time can be obtained by calculating the radius of the integral circle.
Let us consider:
Then Equation (8) becomes:
For specific probability (P = 95%) and given covariance matrix V, the solution of ANP is converted to the solution of scale coefficient k, but Equation (10) can only be obtained through numerical calculation. Therefore, the traditional method approximates k (P = 95%), as follows:
Within:
ANP is expressed as:
2.2. Traditional Three-Dimensional ANP Model and Calculation Method
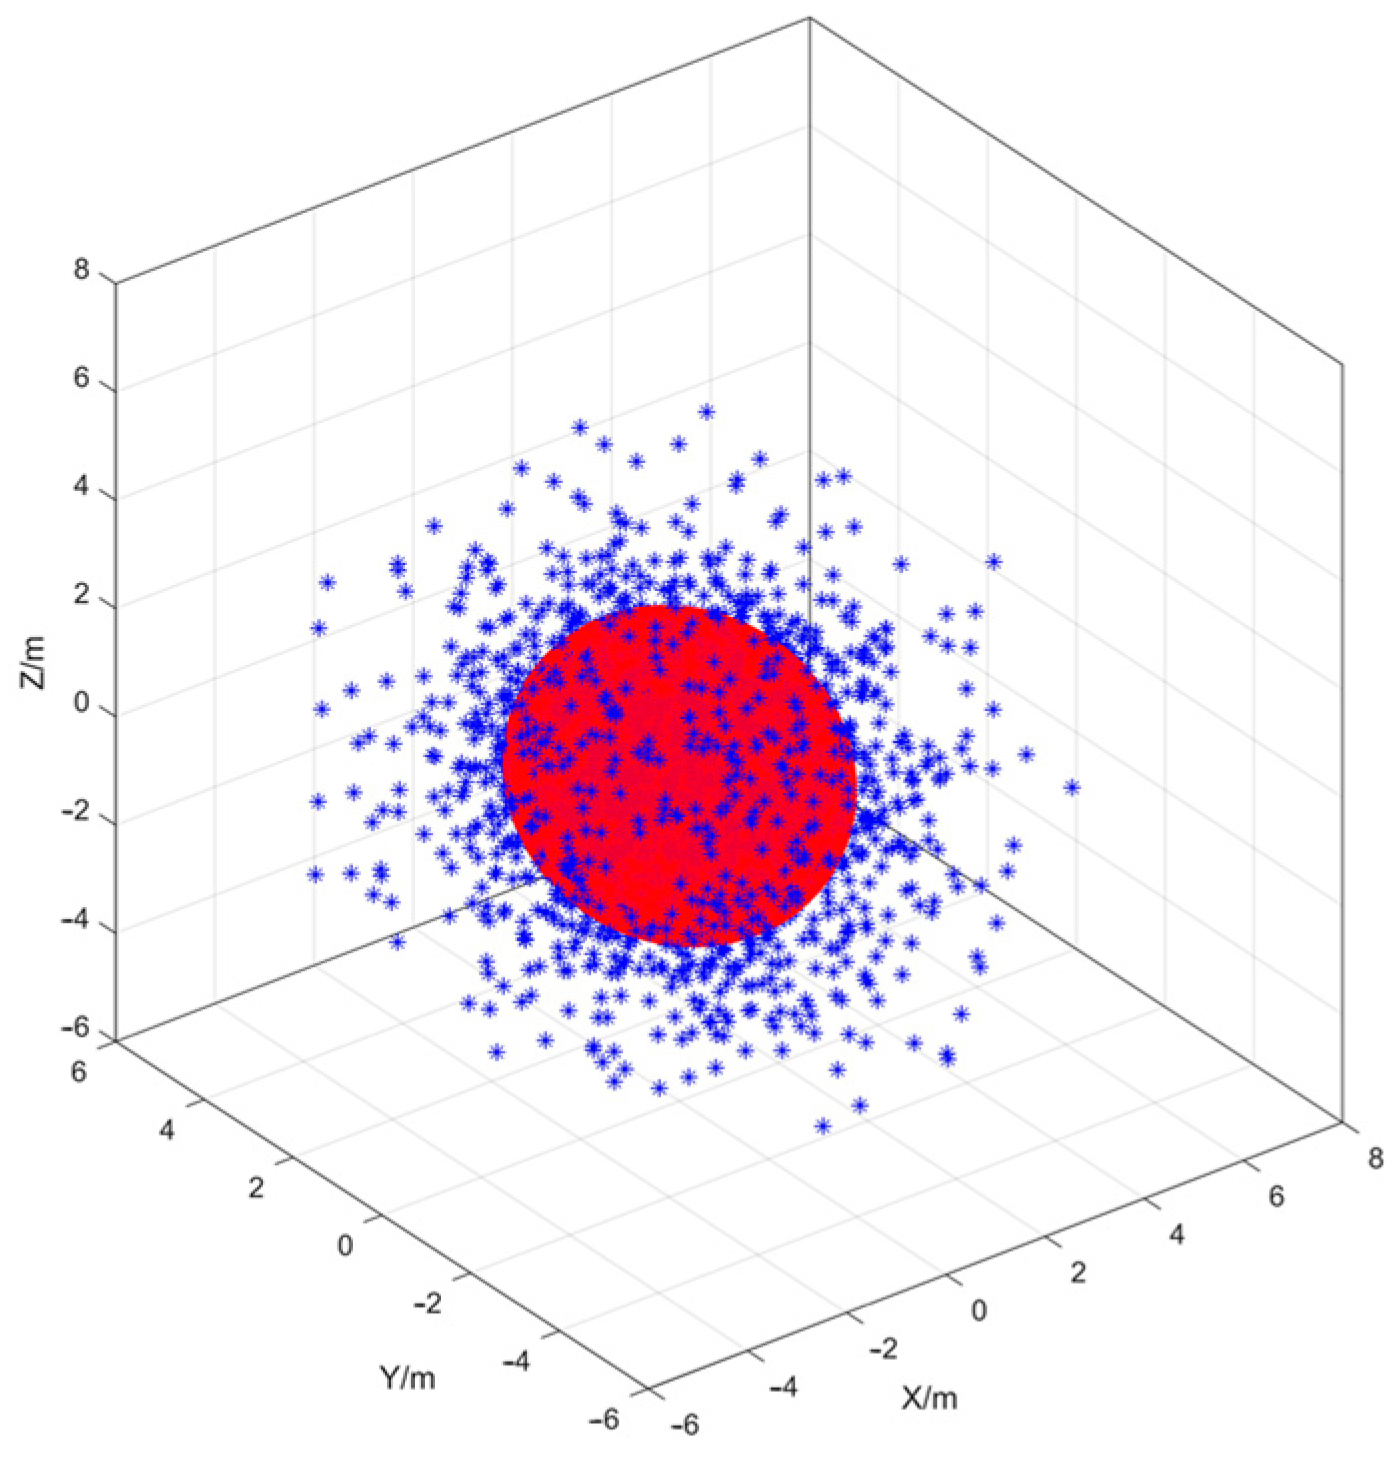
For the RNP operation, FMS needs to monitor the navigation performance in both the horizontal and vertical direction. The spherical error probability (SEP) model is often used to describe the accuracy of the falling point of an object in three-dimensional space, which can be used to evaluate the 3D ANP.
The position estimation error (x, y, z) of the FMS in the X-Y-Z three-dimensional space follows normal distribution , ,.
The spatial three-dimensional joint probability density function is:
The traditional SEP model considers that the variances of the three dimensions are equal and independent of each other, and the mean value is zero, which is , .
Let:
Then the probability is:
The approximate solution of the specified probability can be obtained by numerical integration.
Within:
3. Method
3.1. Three-Dimensional Ellipsoid Error Probability EEP Model
Considering the spatial position uncertainty of civil aircraft flying, this paper establishes a three-dimensional ellipsoidal EEP model and performs three-dimensional ANP calculation on this basis.
Use E to represent the mean value of the FMS estimation error in three-dimensional space:
V is the covariance matrix of the 3D position estimation error of the FMS:
where , , are correlation coefficients:
The joint probability density function of the three-dimensional position error (x, y, z) is:
Similarity transformation is performed on the third-order covariance matrix:
is the similar transformation matrix V, the diagonal matrix can be obtained:
Within are the eigenvalues of the covariance matrix, and the covariance matrix becomes uncorrelated:
The joint probability density function can be expressed as:
The probability P that the real position falls into the three-dimensional normal distribution integral ellipsoid domain is:
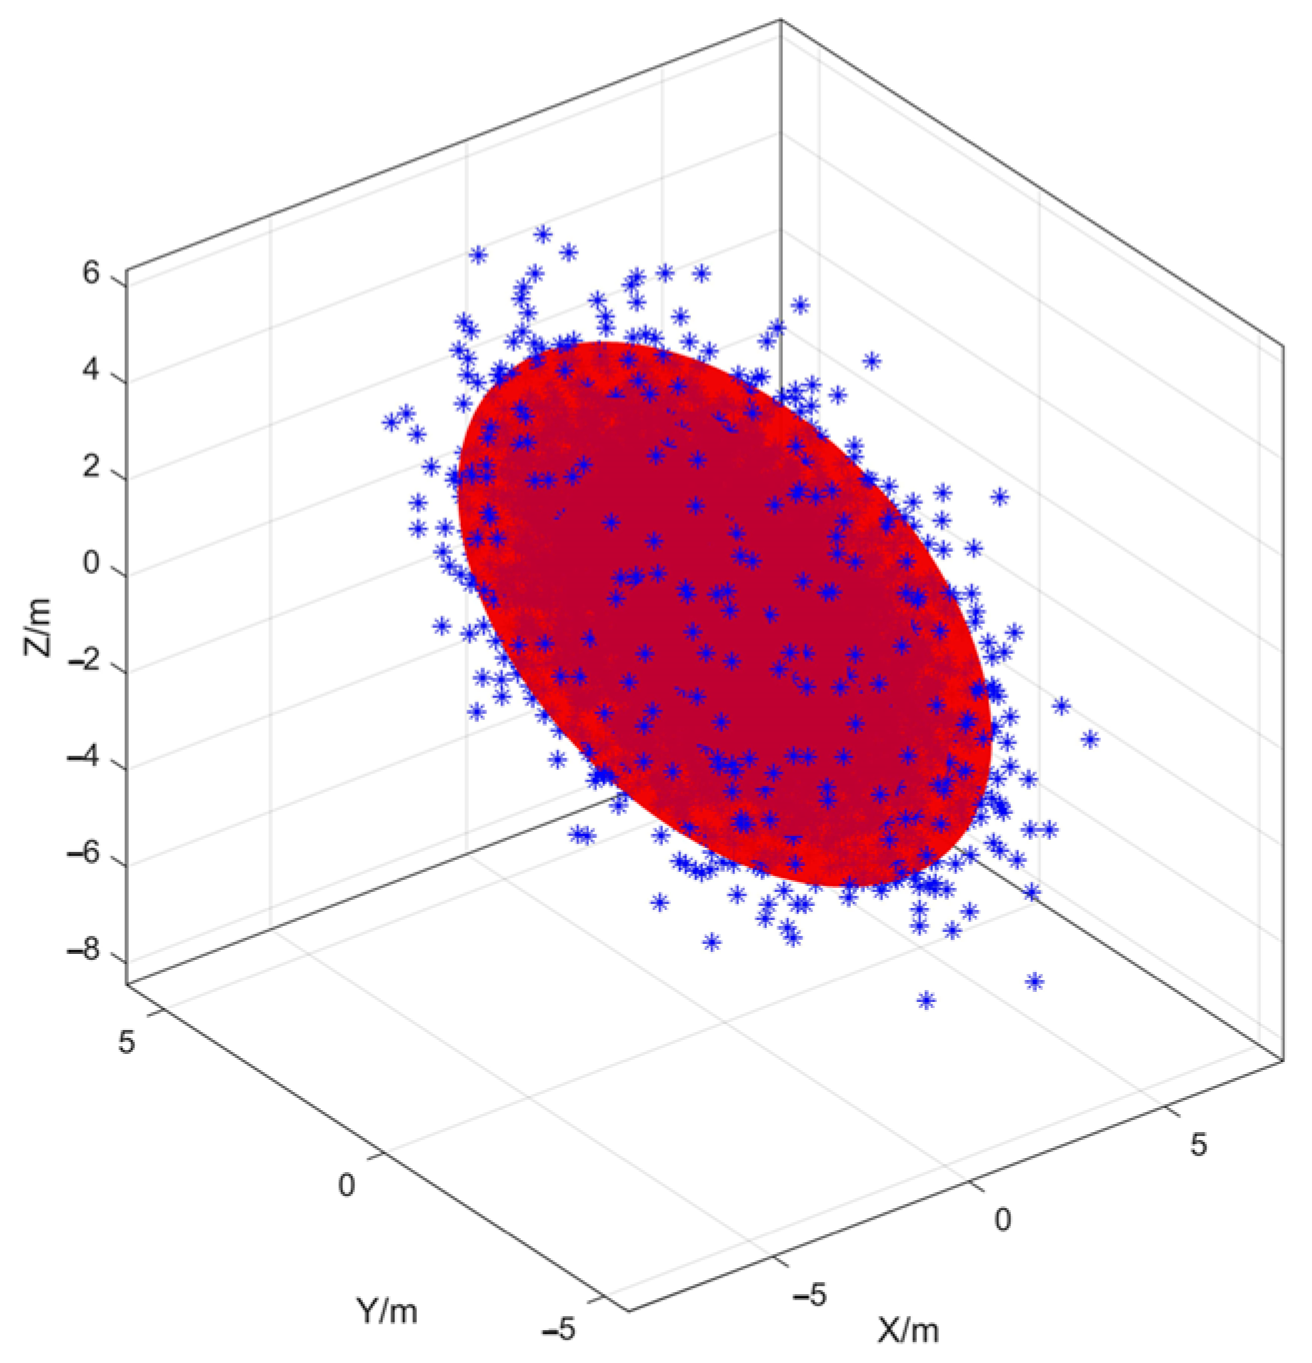
As shown in Figure 4, for a given probability P, the three-dimensional ANP calculation process can be converted into the calculation of the three-axis length of the three-dimensional normal distribution integral ellipsoid Ω.
3.2. Three-Dimensional ANP Calculation Method
FMS provides positioning function based on navigation information fusion. This paper mainly considers the ANP model and calculation method after obtaining the position covariance matrix from the FMS. The influence of time-varying sensor performance on covariance matrix is beyond the scope of this paper.
For a given probability P, the covariance matrix, which considers the contribution of each sensor, can be obtained by the integrated navigation calculation module of the FMS. It can be seen from the Formula (27), when P = 0.95, the ANP is determined by , and :
Within , the joint probability density function is transformed into spherical coordinates:
The probability integration becomes:
Let , then:
where is the standard normal distribution function. For a given P, Equation (32) cannot obtain an analytical solution. In this paper, an approximate solution is obtained by iterative numerical integration, as shown in Figure 5:
.
Take the value to calculate the allowable error (),when , the probability is 95%. It can be obtained that the three-axis radius lengths of the integral ellipsoid domain are: , , . The ANP of the FMS in three-dimensional space can be represented by , and .
As shown in Figure 6, the volume of the EEP model is smaller than that of the SEP model, and the disparity increases rapidly with the increase of the ratio of three-axis standard deviation. That is, under the same probability, the EEP model is closer to the real position error and has higher evaluation accuracy.
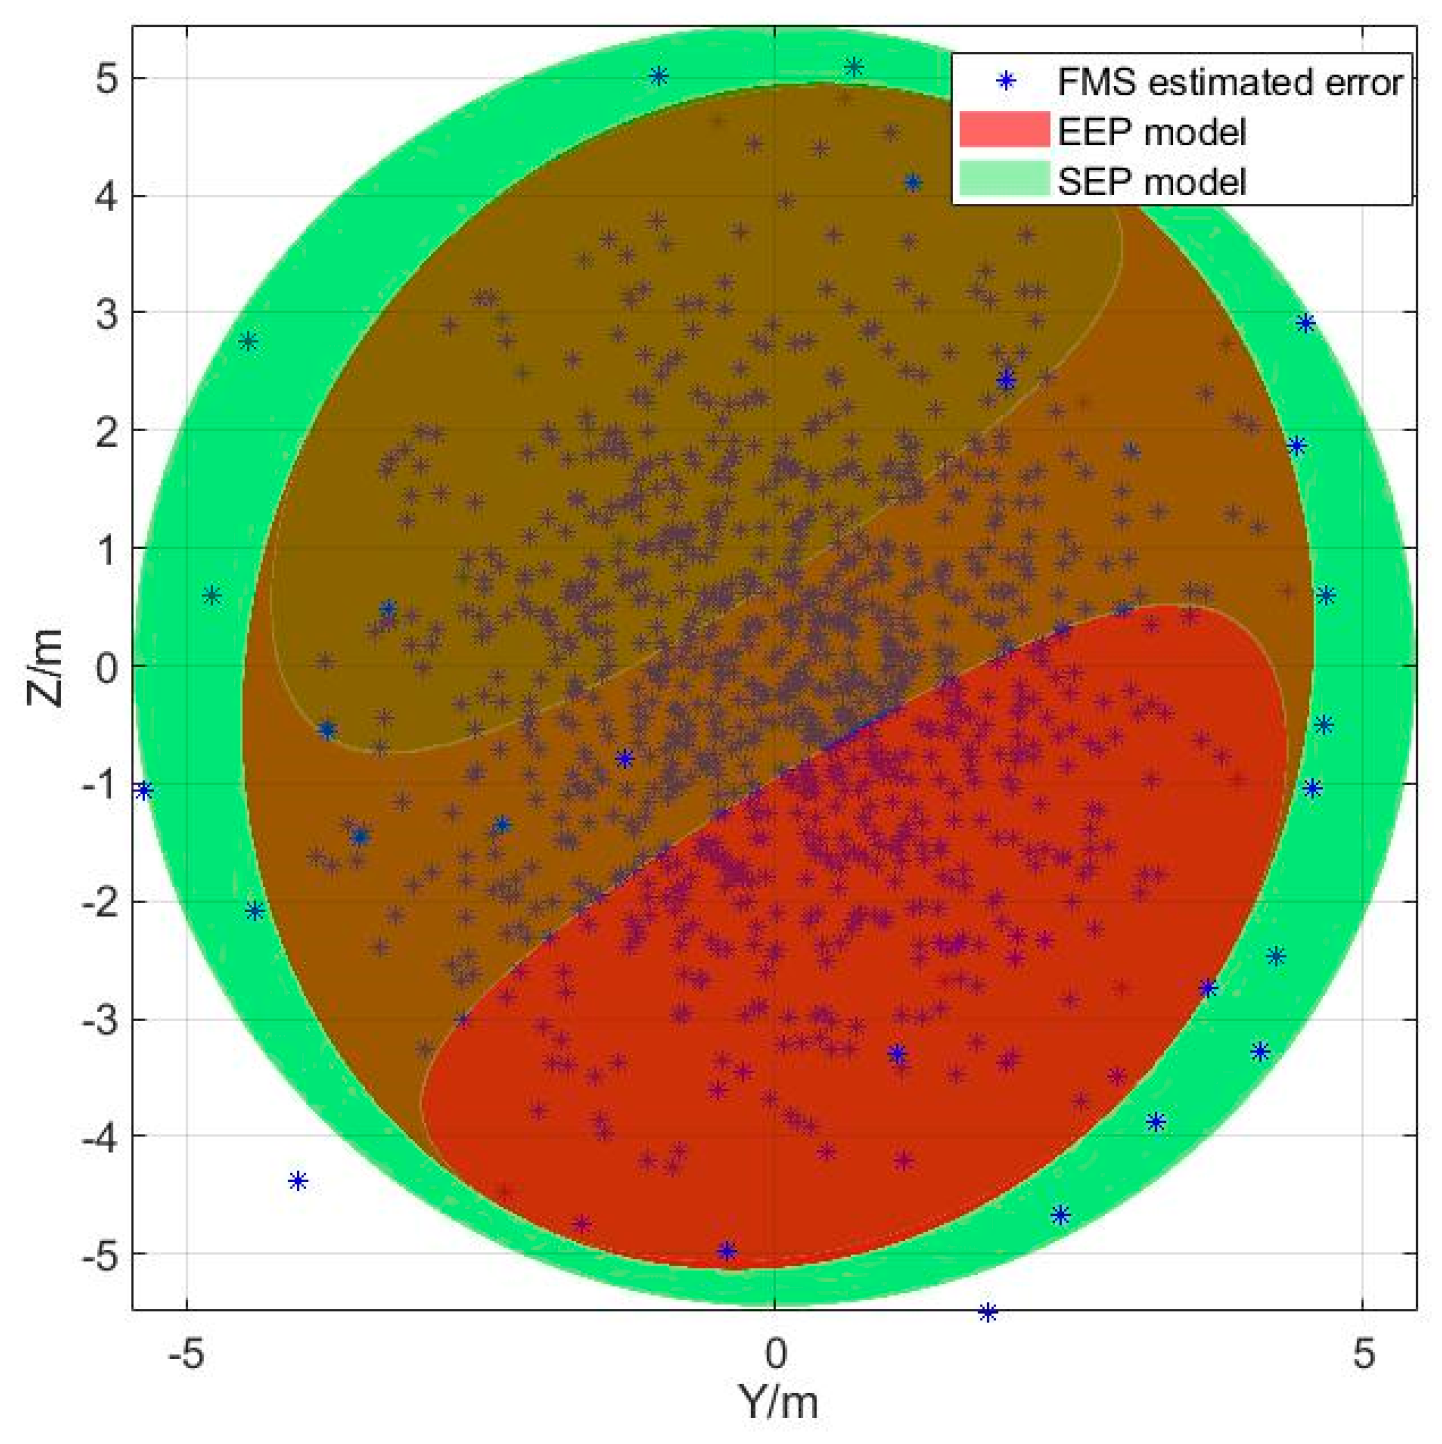
At the same time, the projection of the EEP model and SEP model in the XOY, XOZ, and YOZ planes are compared, respectively. As shown in Figure 7, Figure 8 and Figure 9, the EEP model more accurately represents the difference of position error variance of FMS position estimation in every direction, and realizes the accurate evaluation of the three-dimensional direction of position uncertainty.
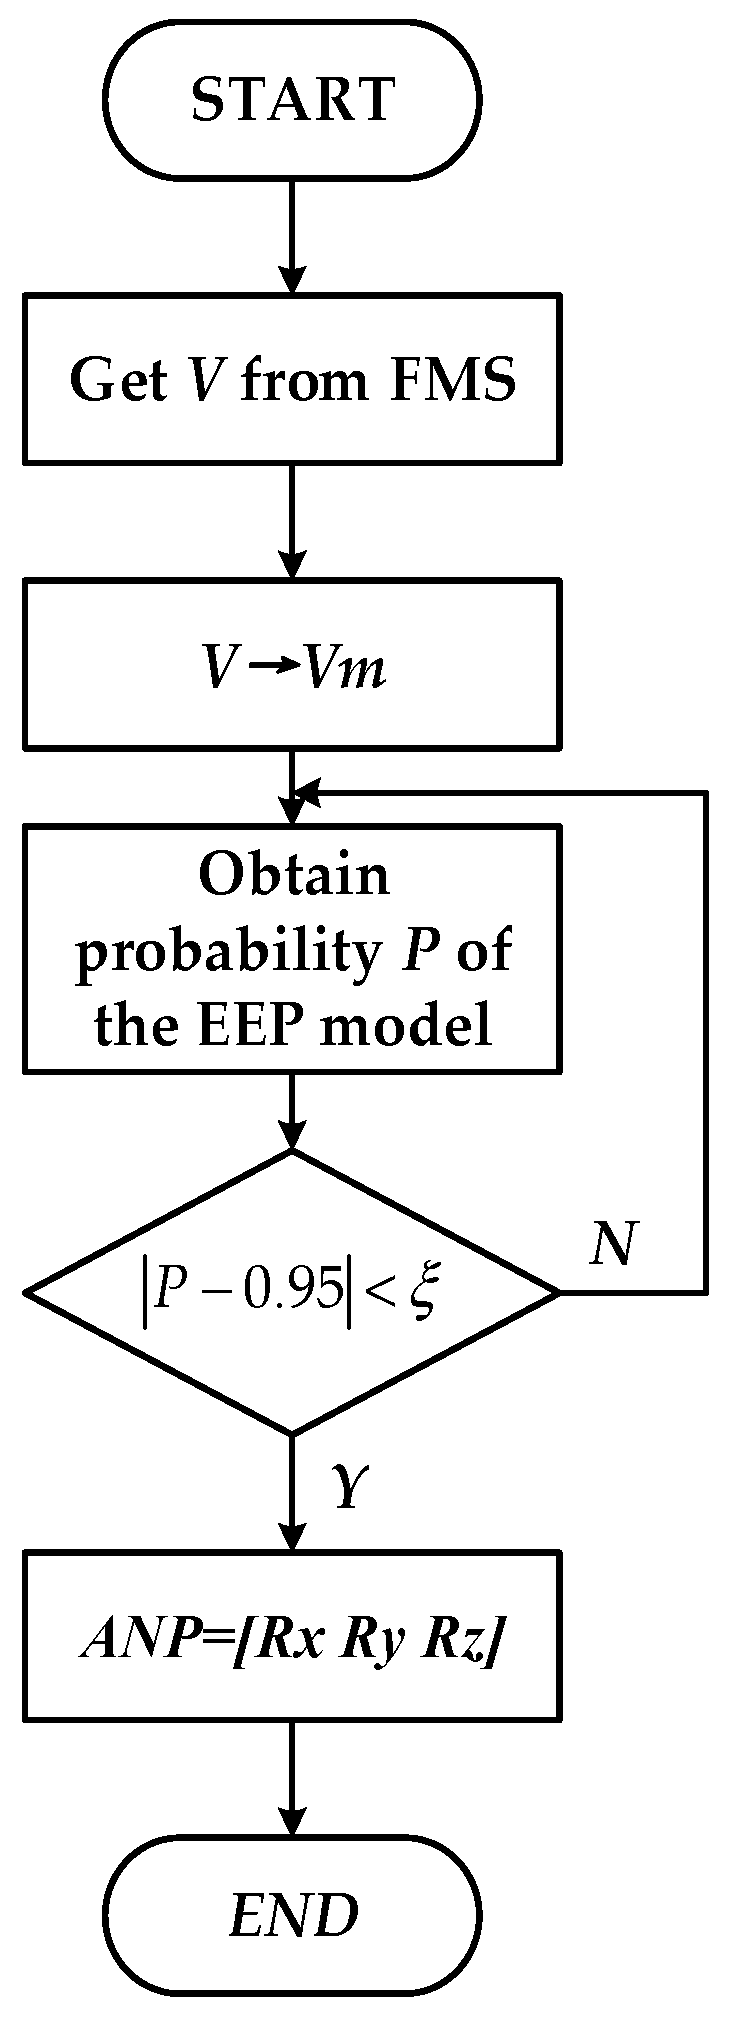
The calculation process of three-dimensional ANP evaluation method based on the EEP model is shown in Figure 10 (Algorithm 1).
| Algorithm 1: Calculation process of three-dimensional ANP evaluation method |
| Step 1: Get the position error covariance matrix V from the FMS. Step 2: Similarity transform the position error covariance V to obtain the positive definite covariance matrix Vm. Step 3: Use numerical integration iterative to obtain the inclusion probability P of the EEP model. Step 4: If , proceed to the next step; otherwise, return to step 3. Step 5: Take the three-axis radius Rx, Ry, Rz of the integrated ellipsoid domain are the ANP of the FMS in three-dimensional directions. |
4. Experimental Setup
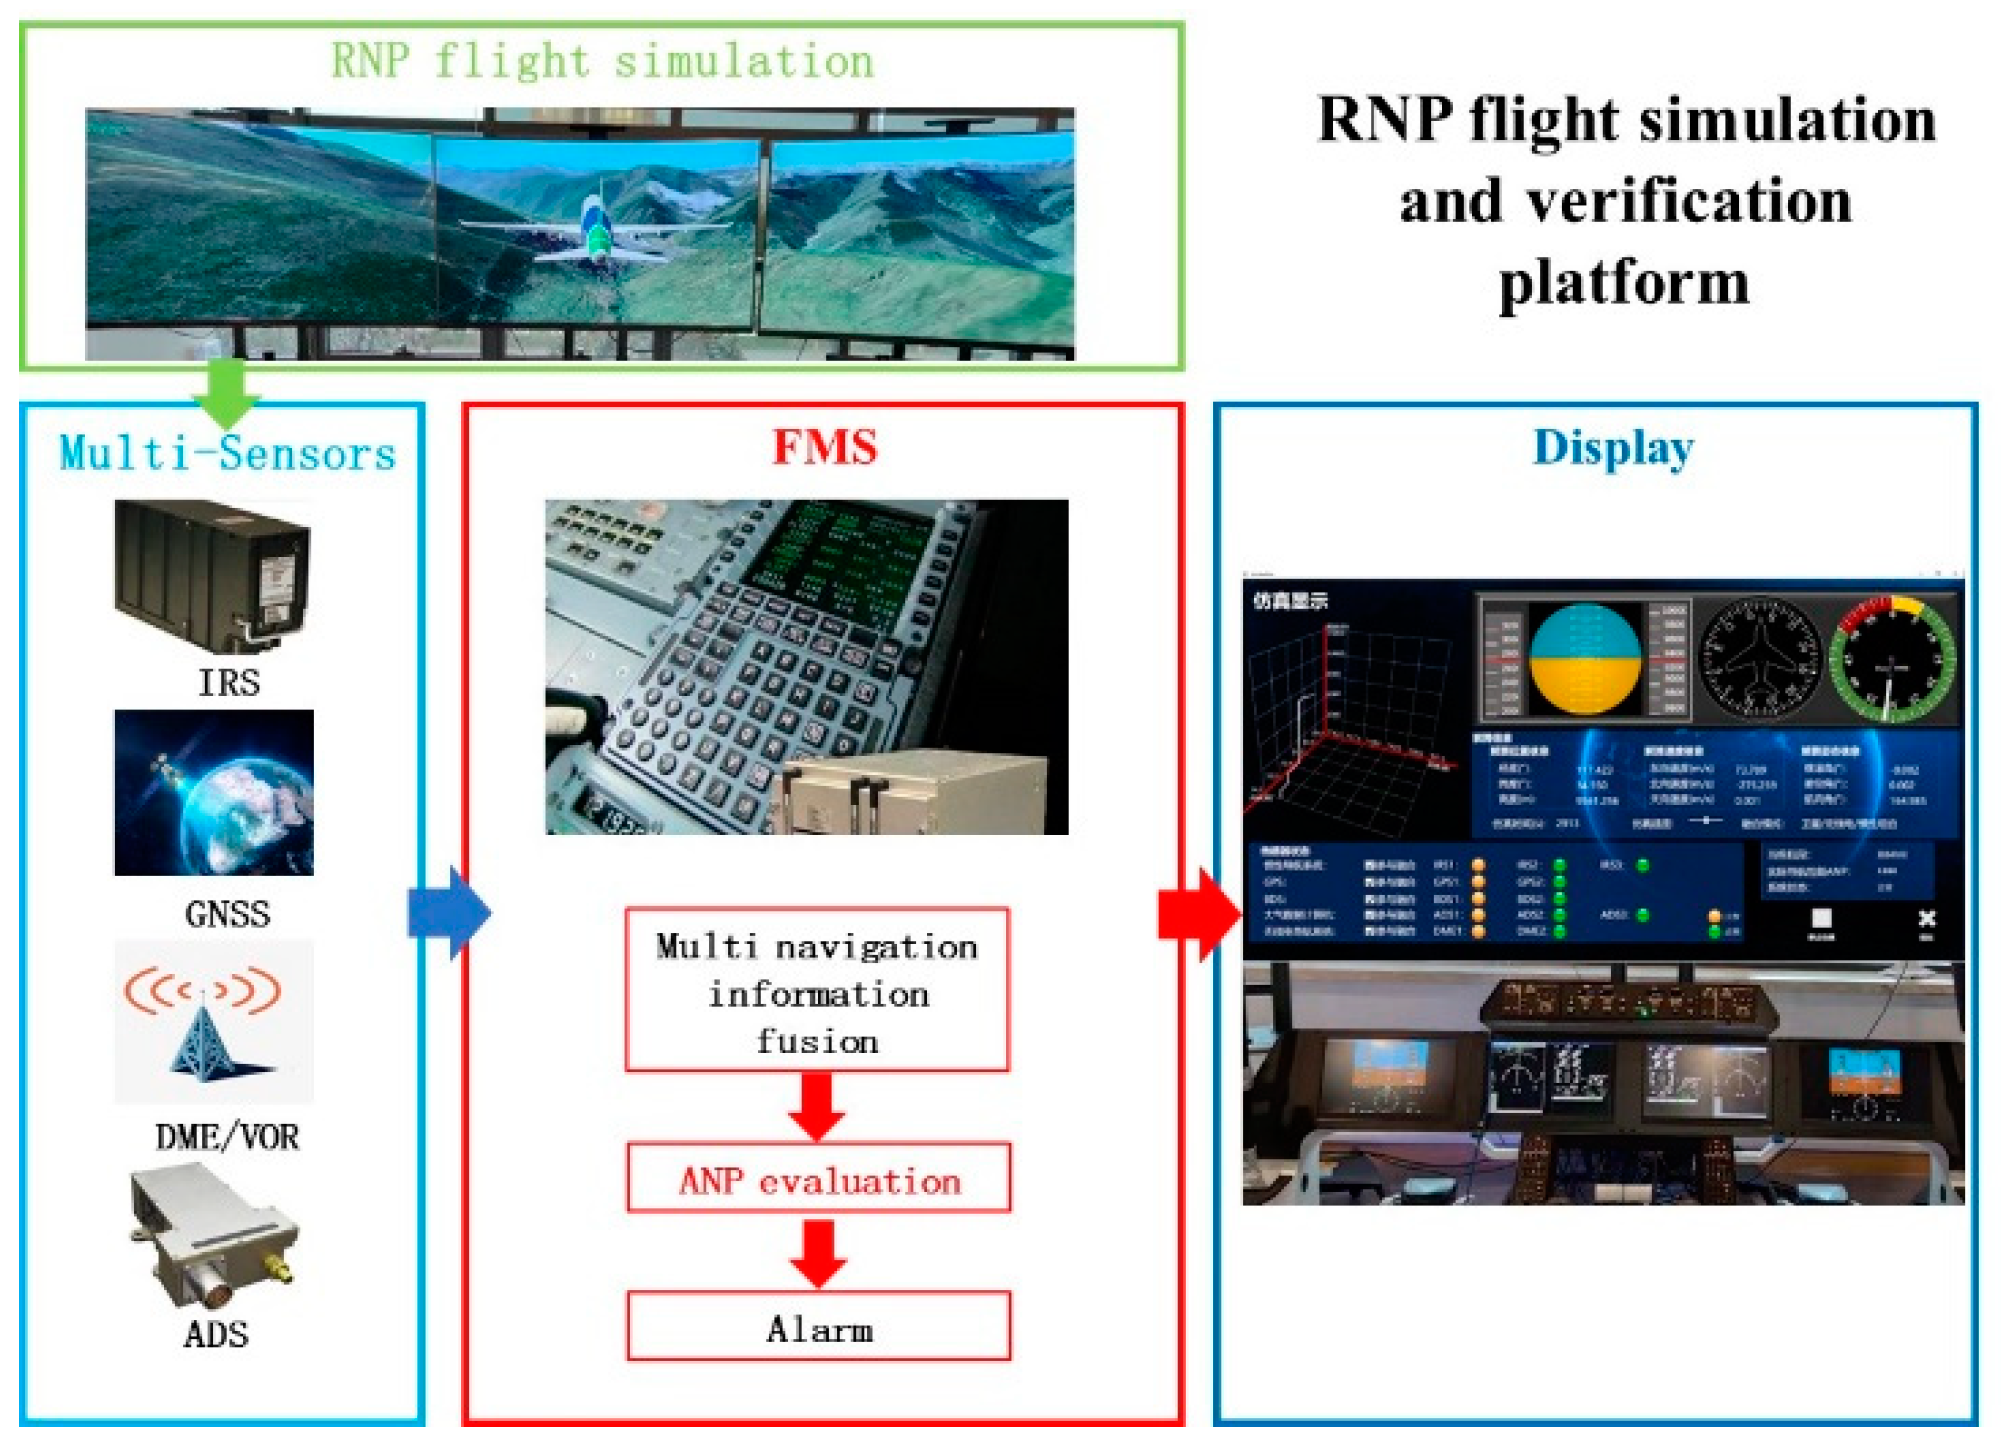
According to the objectives and mission characteristics of the ANP verification, the civil aircraft RNP flight multi-source information fusion simulation and verification platform is constructed, as shown in Figure 11.
The simulation and verification platform was composed of a civil aircraft RNP flight simulation module, multi-sensor navigation data generation module, multi-source navigation information fusion, actual navigation performance evaluation module, and flight display module. It can simulate the output of civil aircraft airborne multi-source redundant configuration sensors under RNP flight, simulate the information processing of FMS, fuse and process the multi-source redundant navigation information, and evaluate the ANP of the FMS so as to verify the method proposed in this paper.
Simulation with actual RNP flight operation [17], which can meet the simulation function requirements of typical civil aviation flight environment.
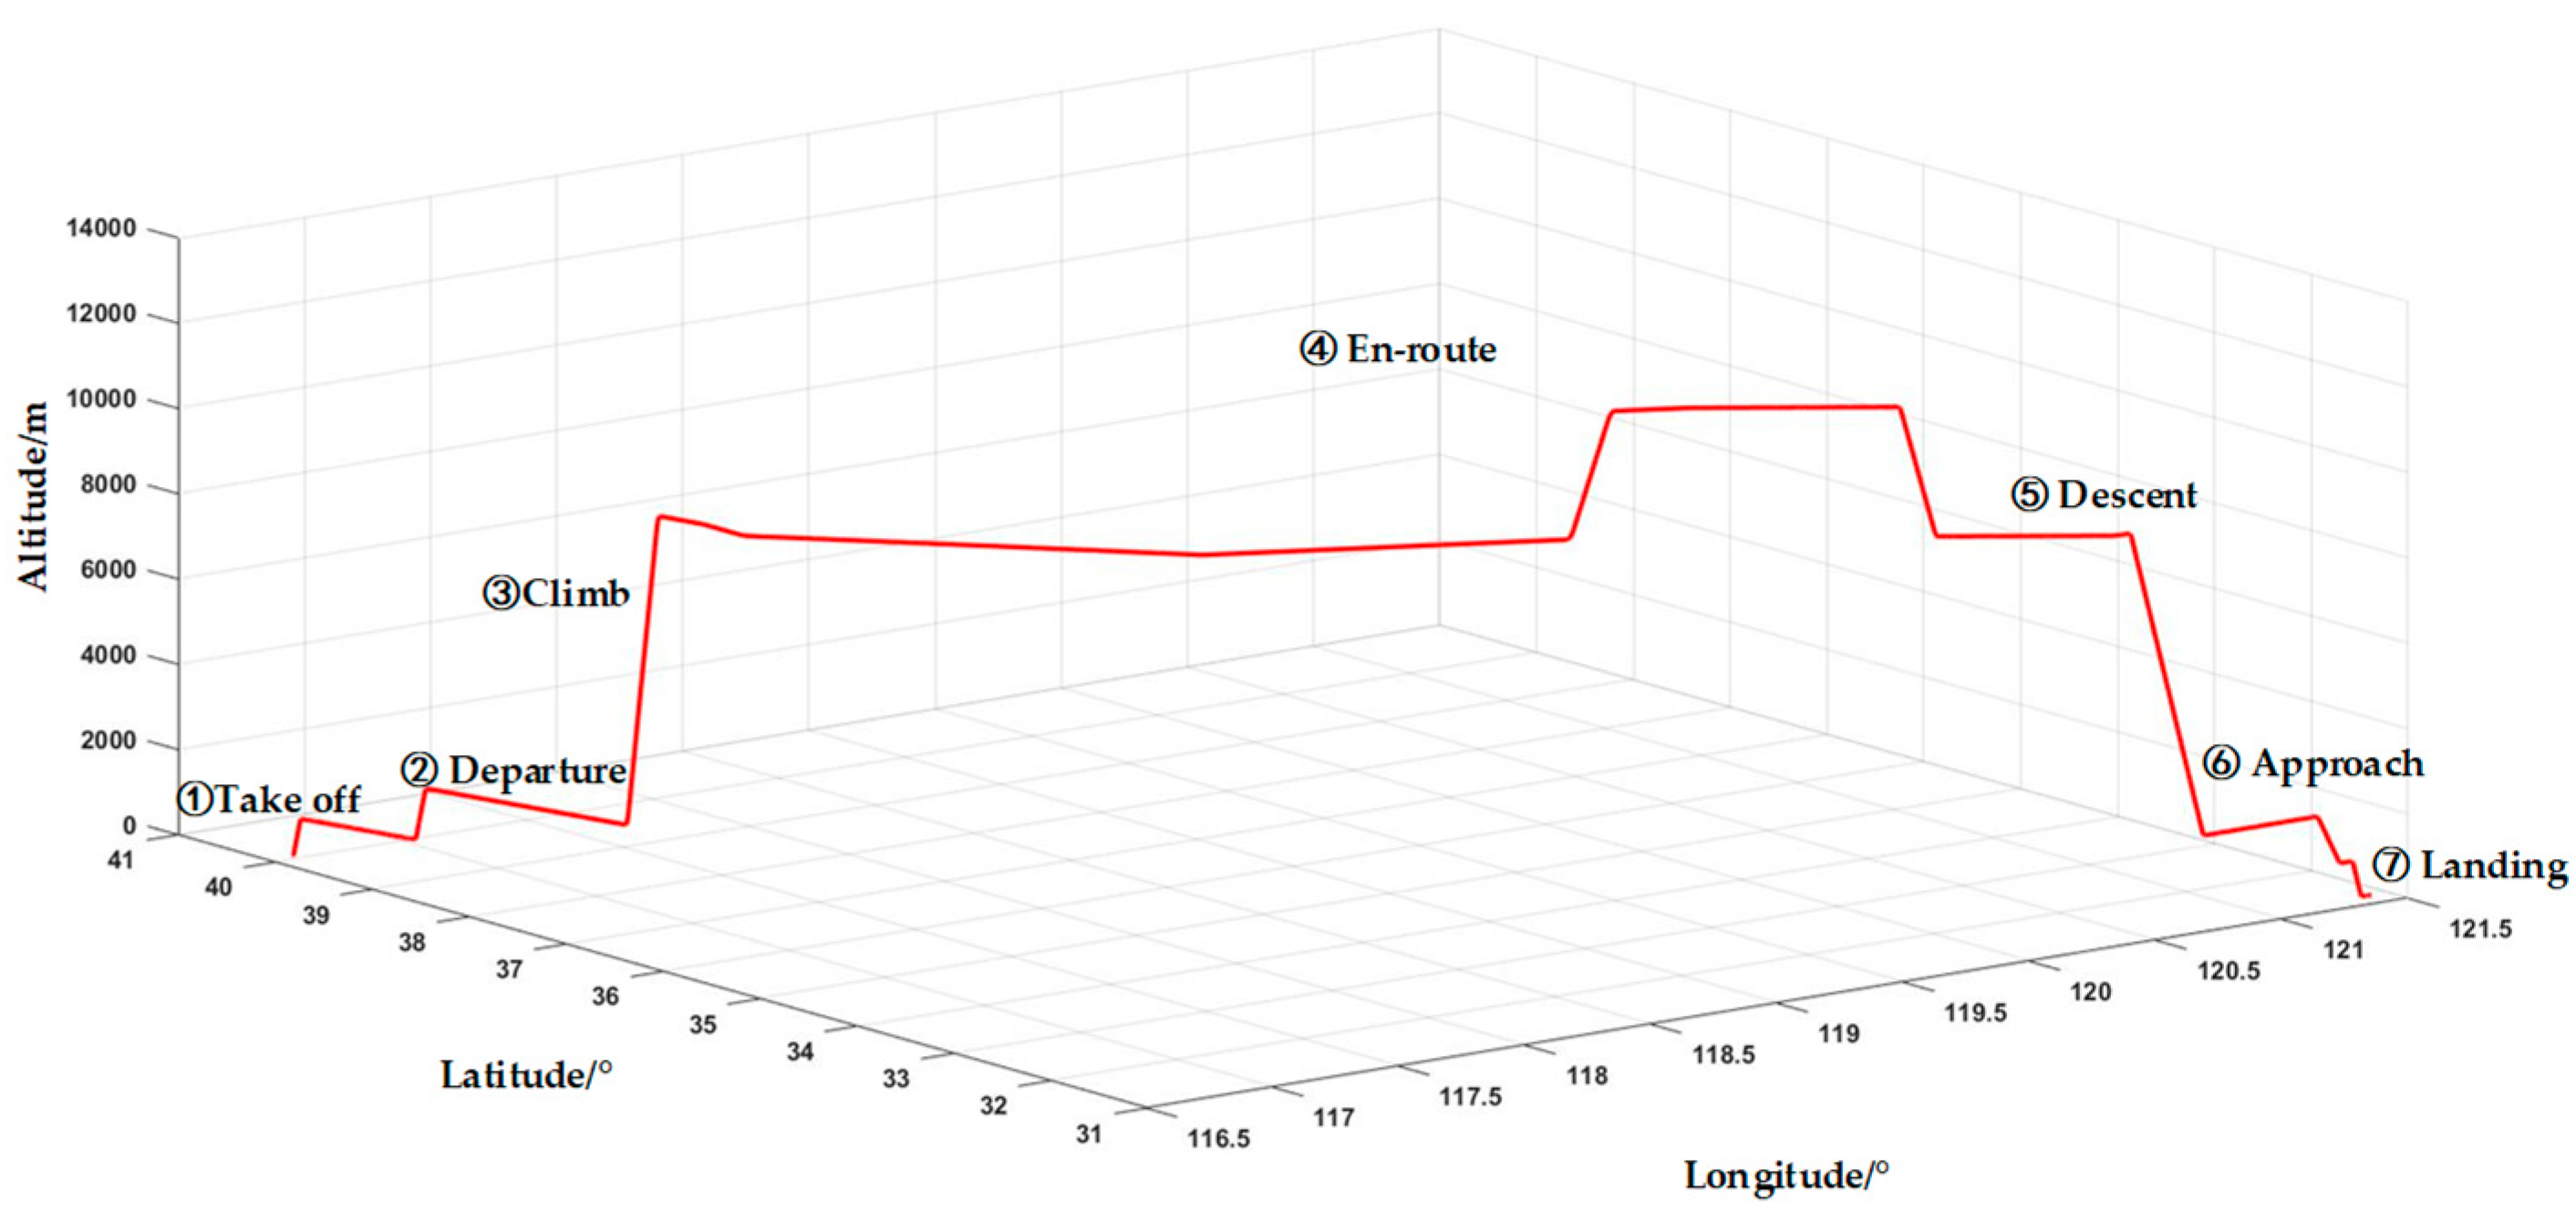
The RNP flight procedure from Beijing Capital Airport (ZBAA) to Shanghai Hongqiao International Airport (ZSSS) is executed in the simulation. The initial position is 40.073333° N, 116.598333° E at an altitude of 30.4 m, the initial heading angle is 175°, and the end point is 31.196667° N, 121.335000° E at an altitude is 8 m. The simulation duration is 7081 s. The corresponding waypoint positions along the route are shown in Table 1, and the fly track simulation output is shown in Figure 12.
The parameters of airborne navigation sensors are set according to the minimum aviation system performance standards for RNP operation [18]. The bias of gyros is set as 0.01°/h and the bias of accelerometers is set as 10−4 g. The GNSS (GPS, Beidou) uses the real ephemeris for simulation. The pseudo range measurement error is set to 10.5 m [19]. The positions of the land-based navigation stations are shown in Table 2. The barometric altimeter is also used to aid vertical navigation [20].
5. Results
The three-dimensional position estimated error of FMS is compared with the traditional ANP method, SEP method, and the EEP method that is proposed in this paper.
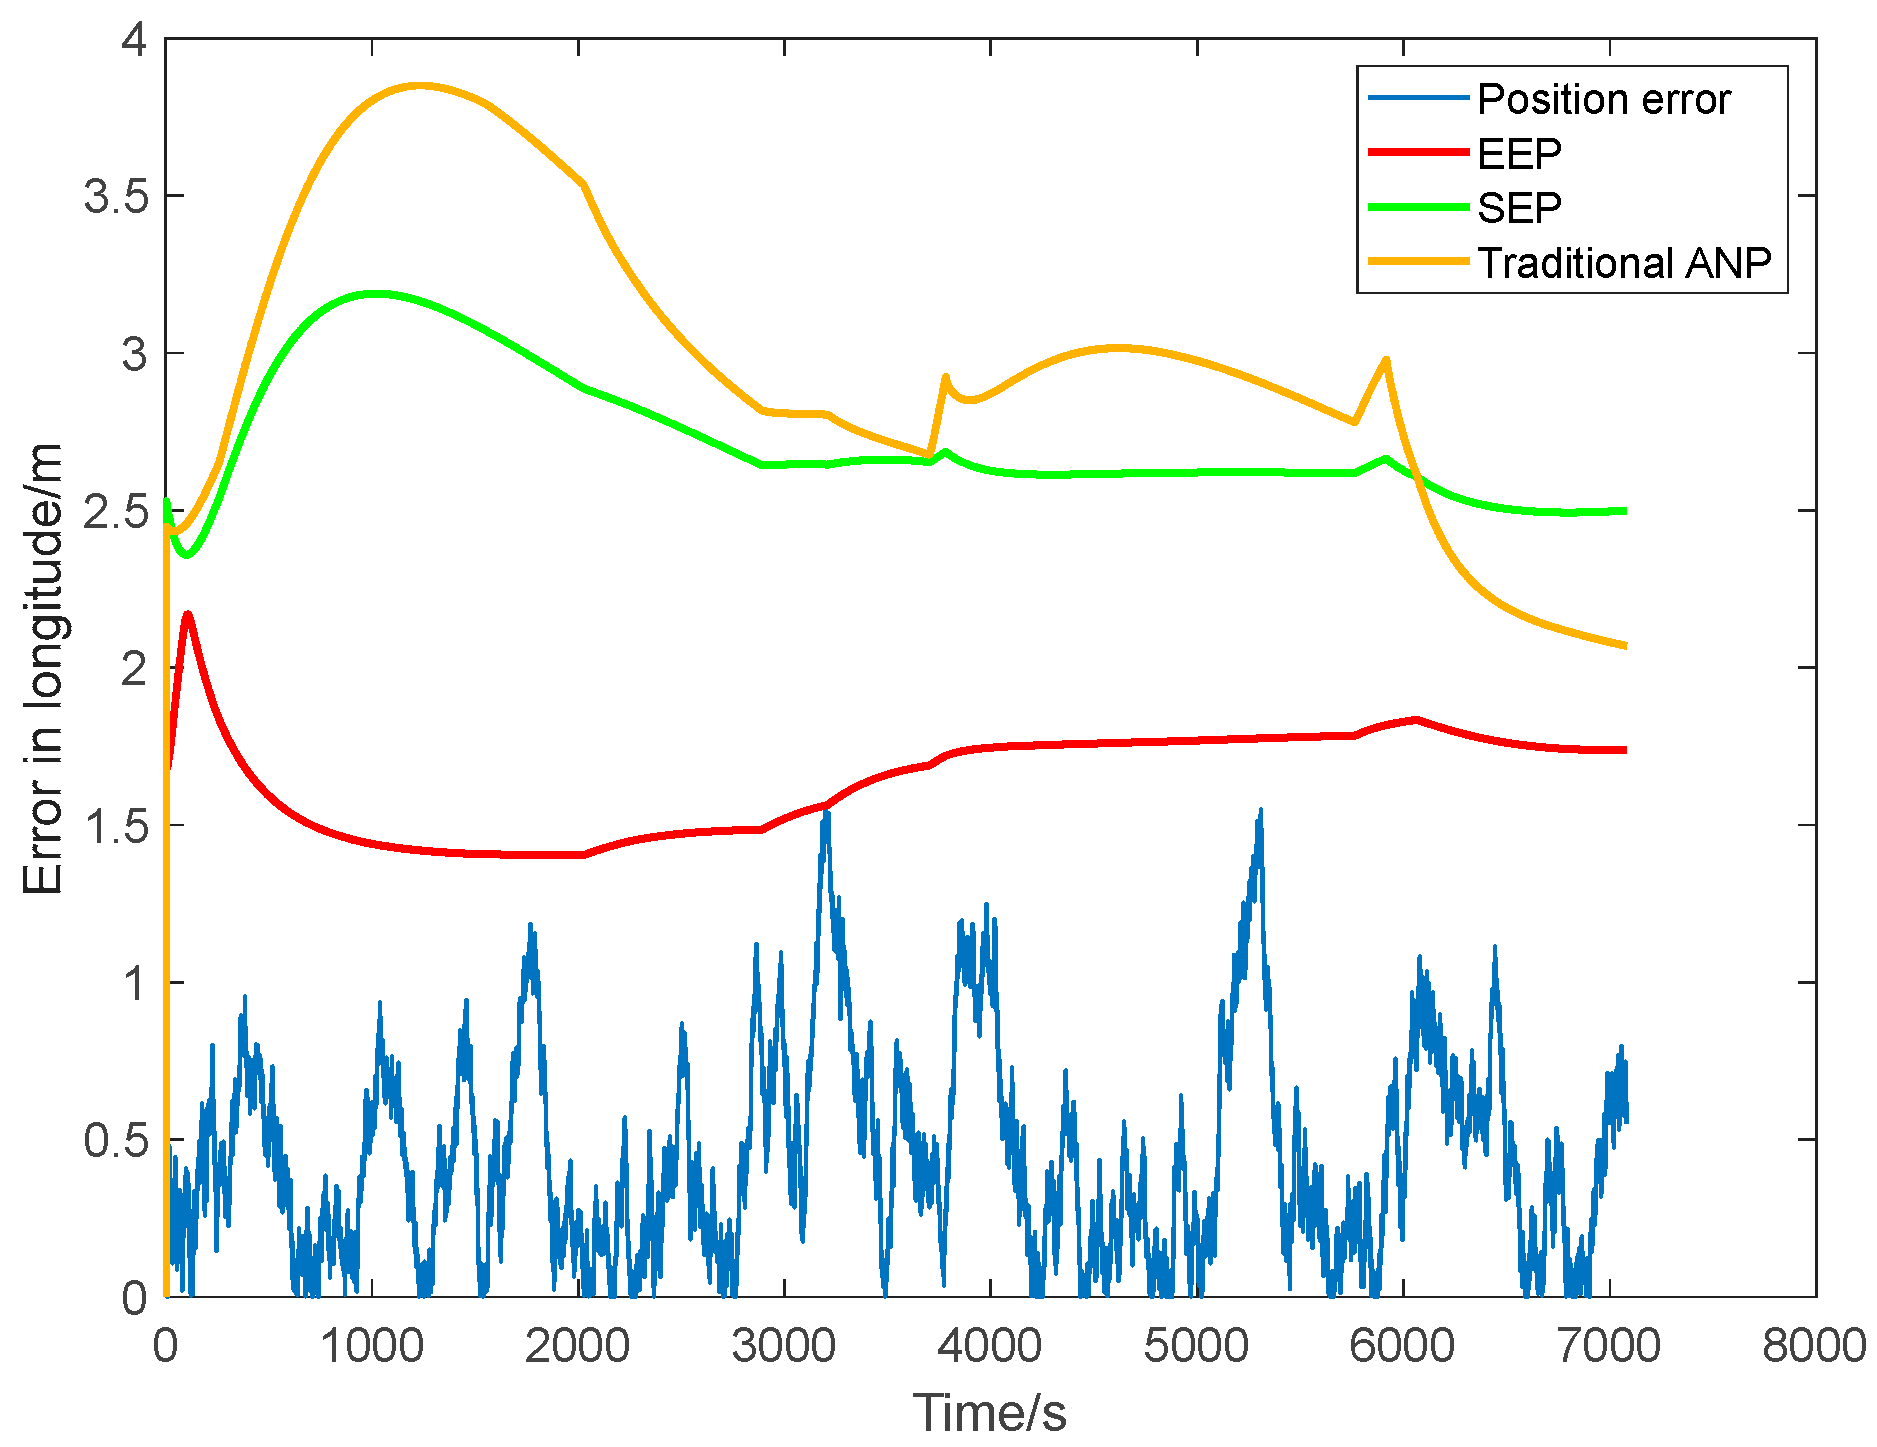
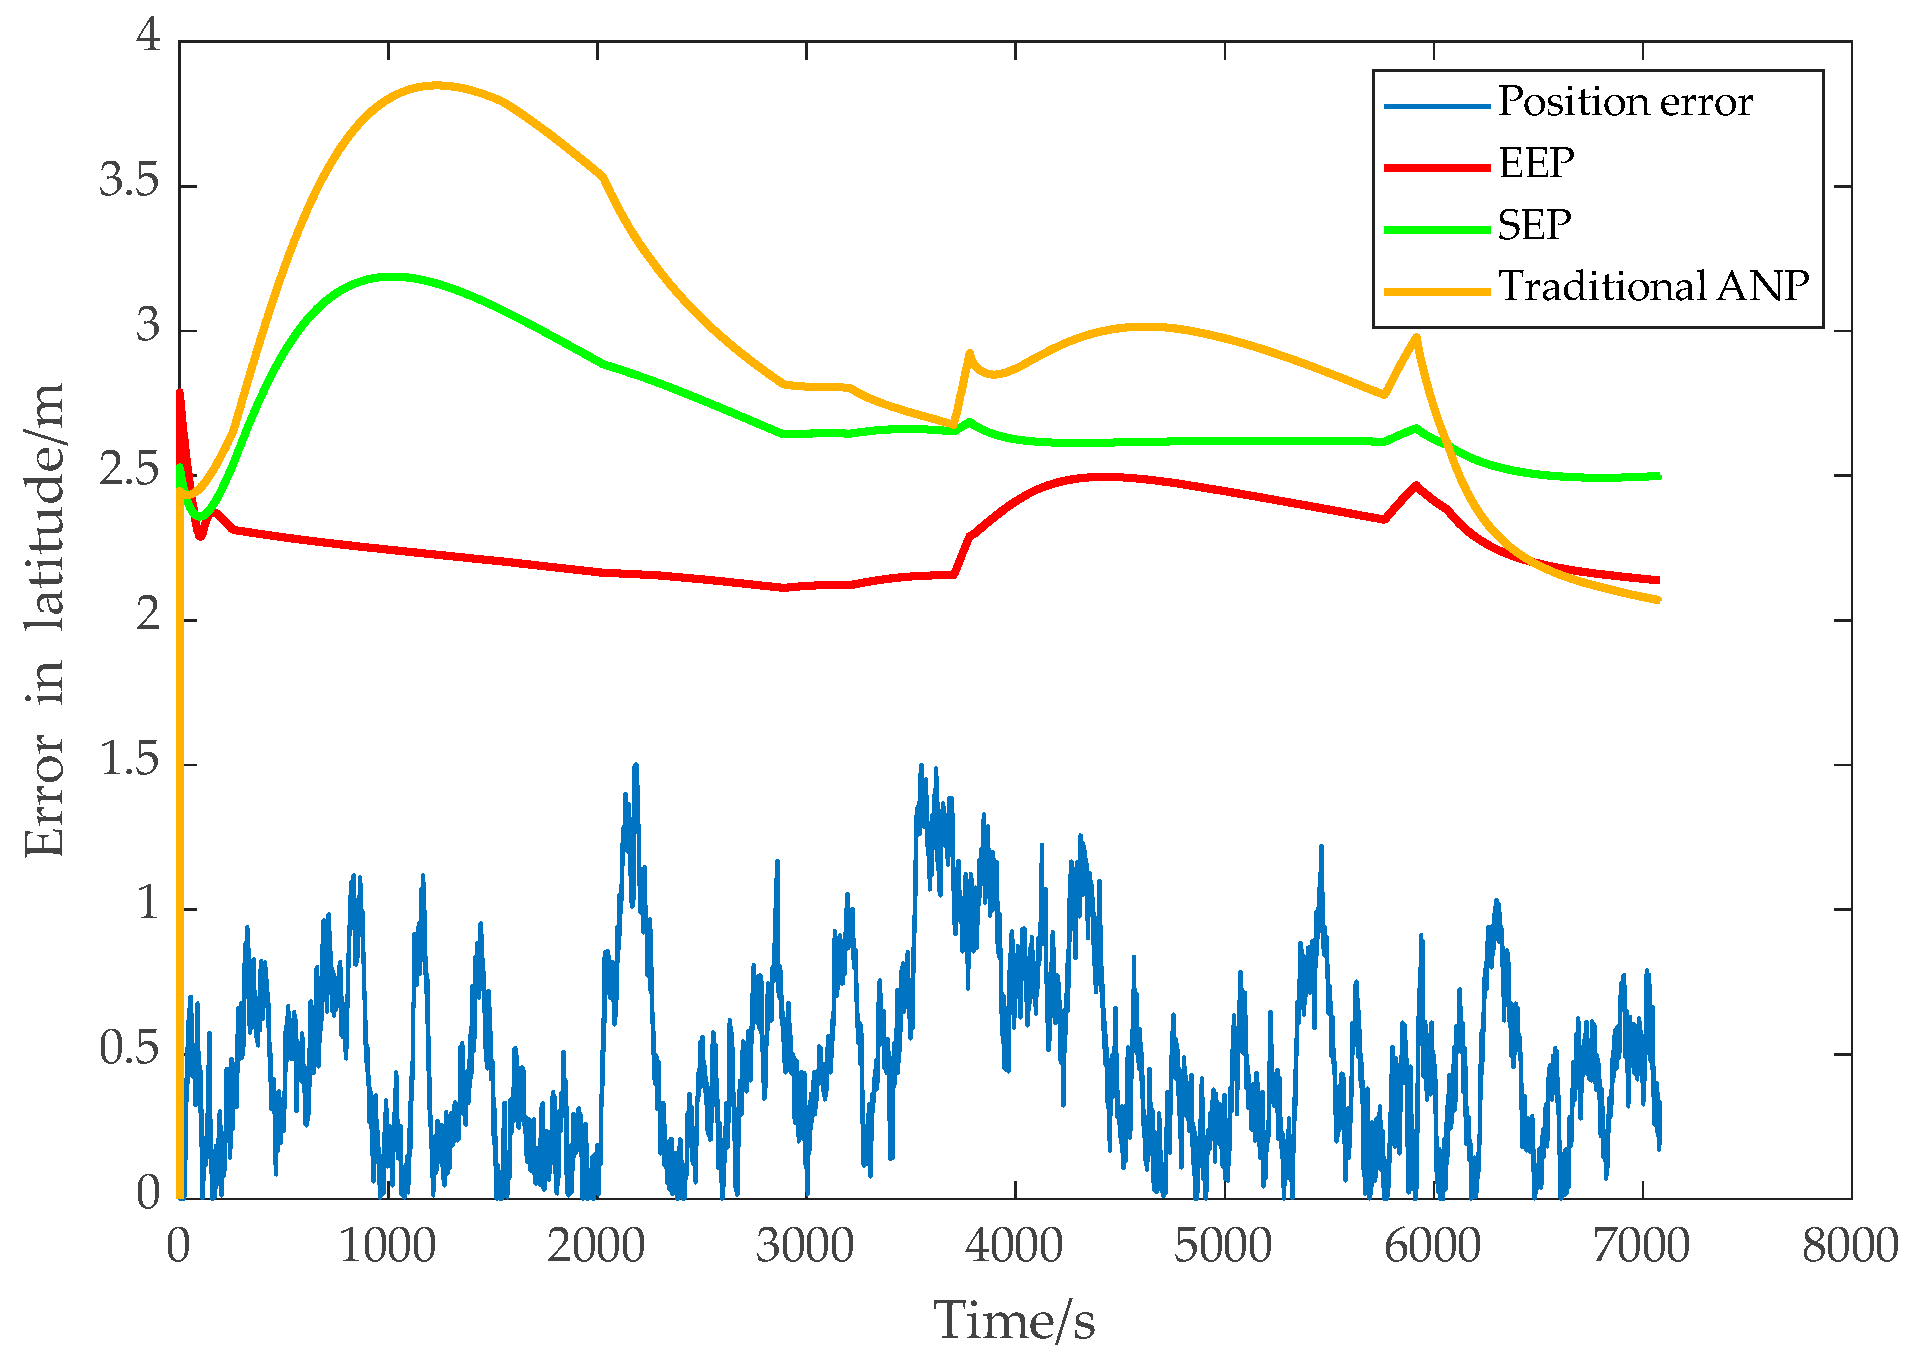
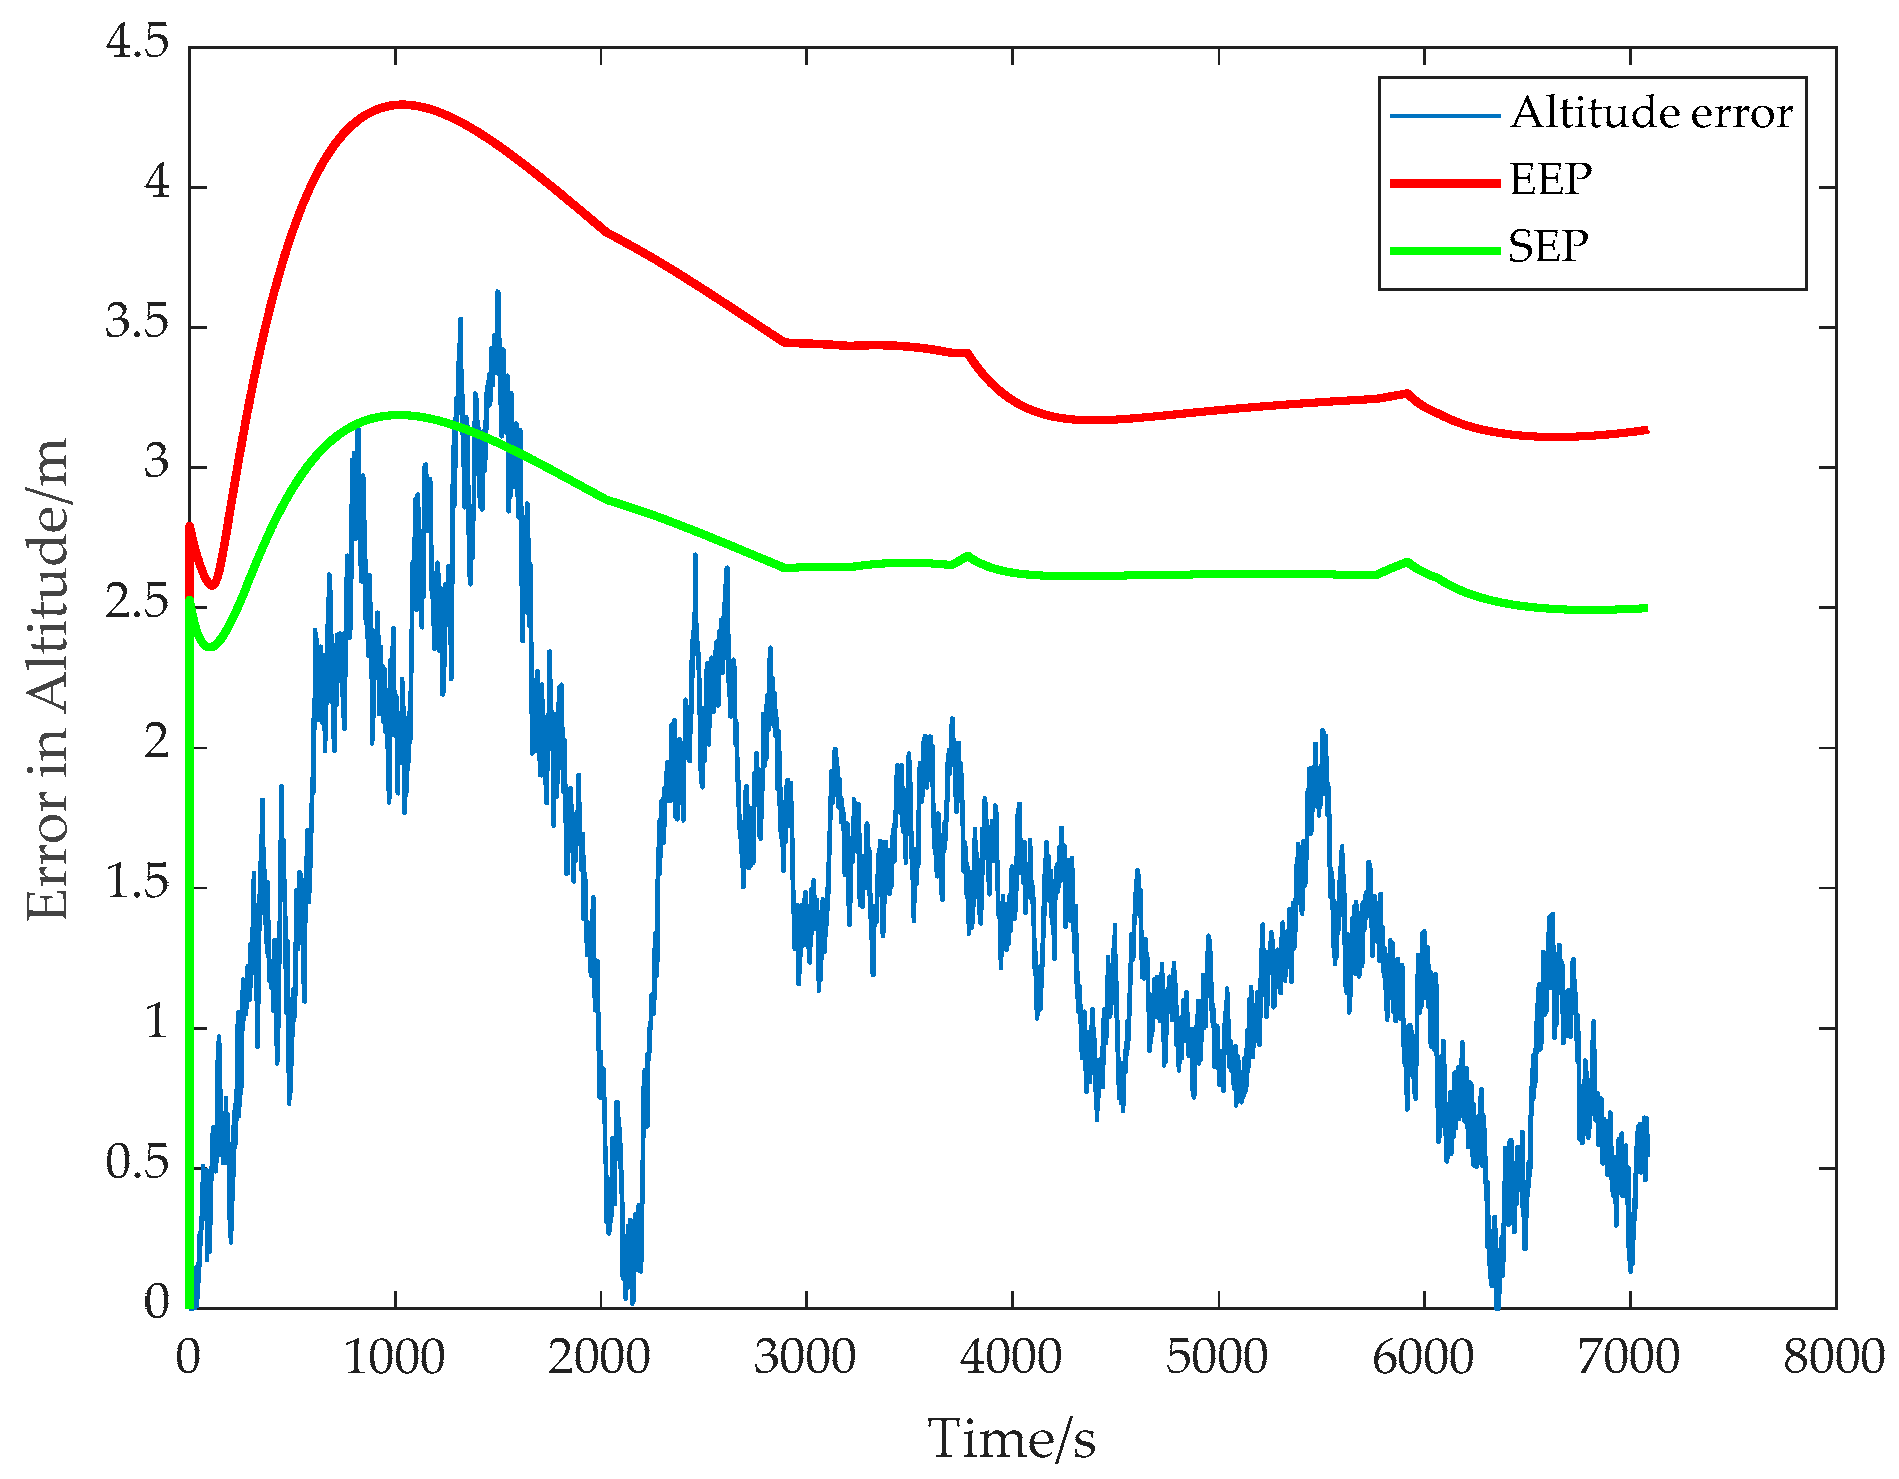
Figure 13, Figure 14 and Figure 15 show the comparison results of the position-estimated error of the FMS in the longitude, latitude, and vertical direction with the ANP evaluation values.
The comparison of actual navigation performance evaluation algorithm results are shown in Table 3.
In order to compare the evaluation accuracy and precision of the traditional ANP model, SEP model, and EEP model proposed in this paper, the recall and mean absolute percentage error (MAPE) statistics are shown in Table 4 and Table 5.
Statistical analysis shows that the EEP model proposed in this paper has no false evaluation compared with the SEP model, and the evaluation accuracy in longitude direction and latitude direction is effectively improved compared with the traditional ANP evaluation method and SEP evaluation method.
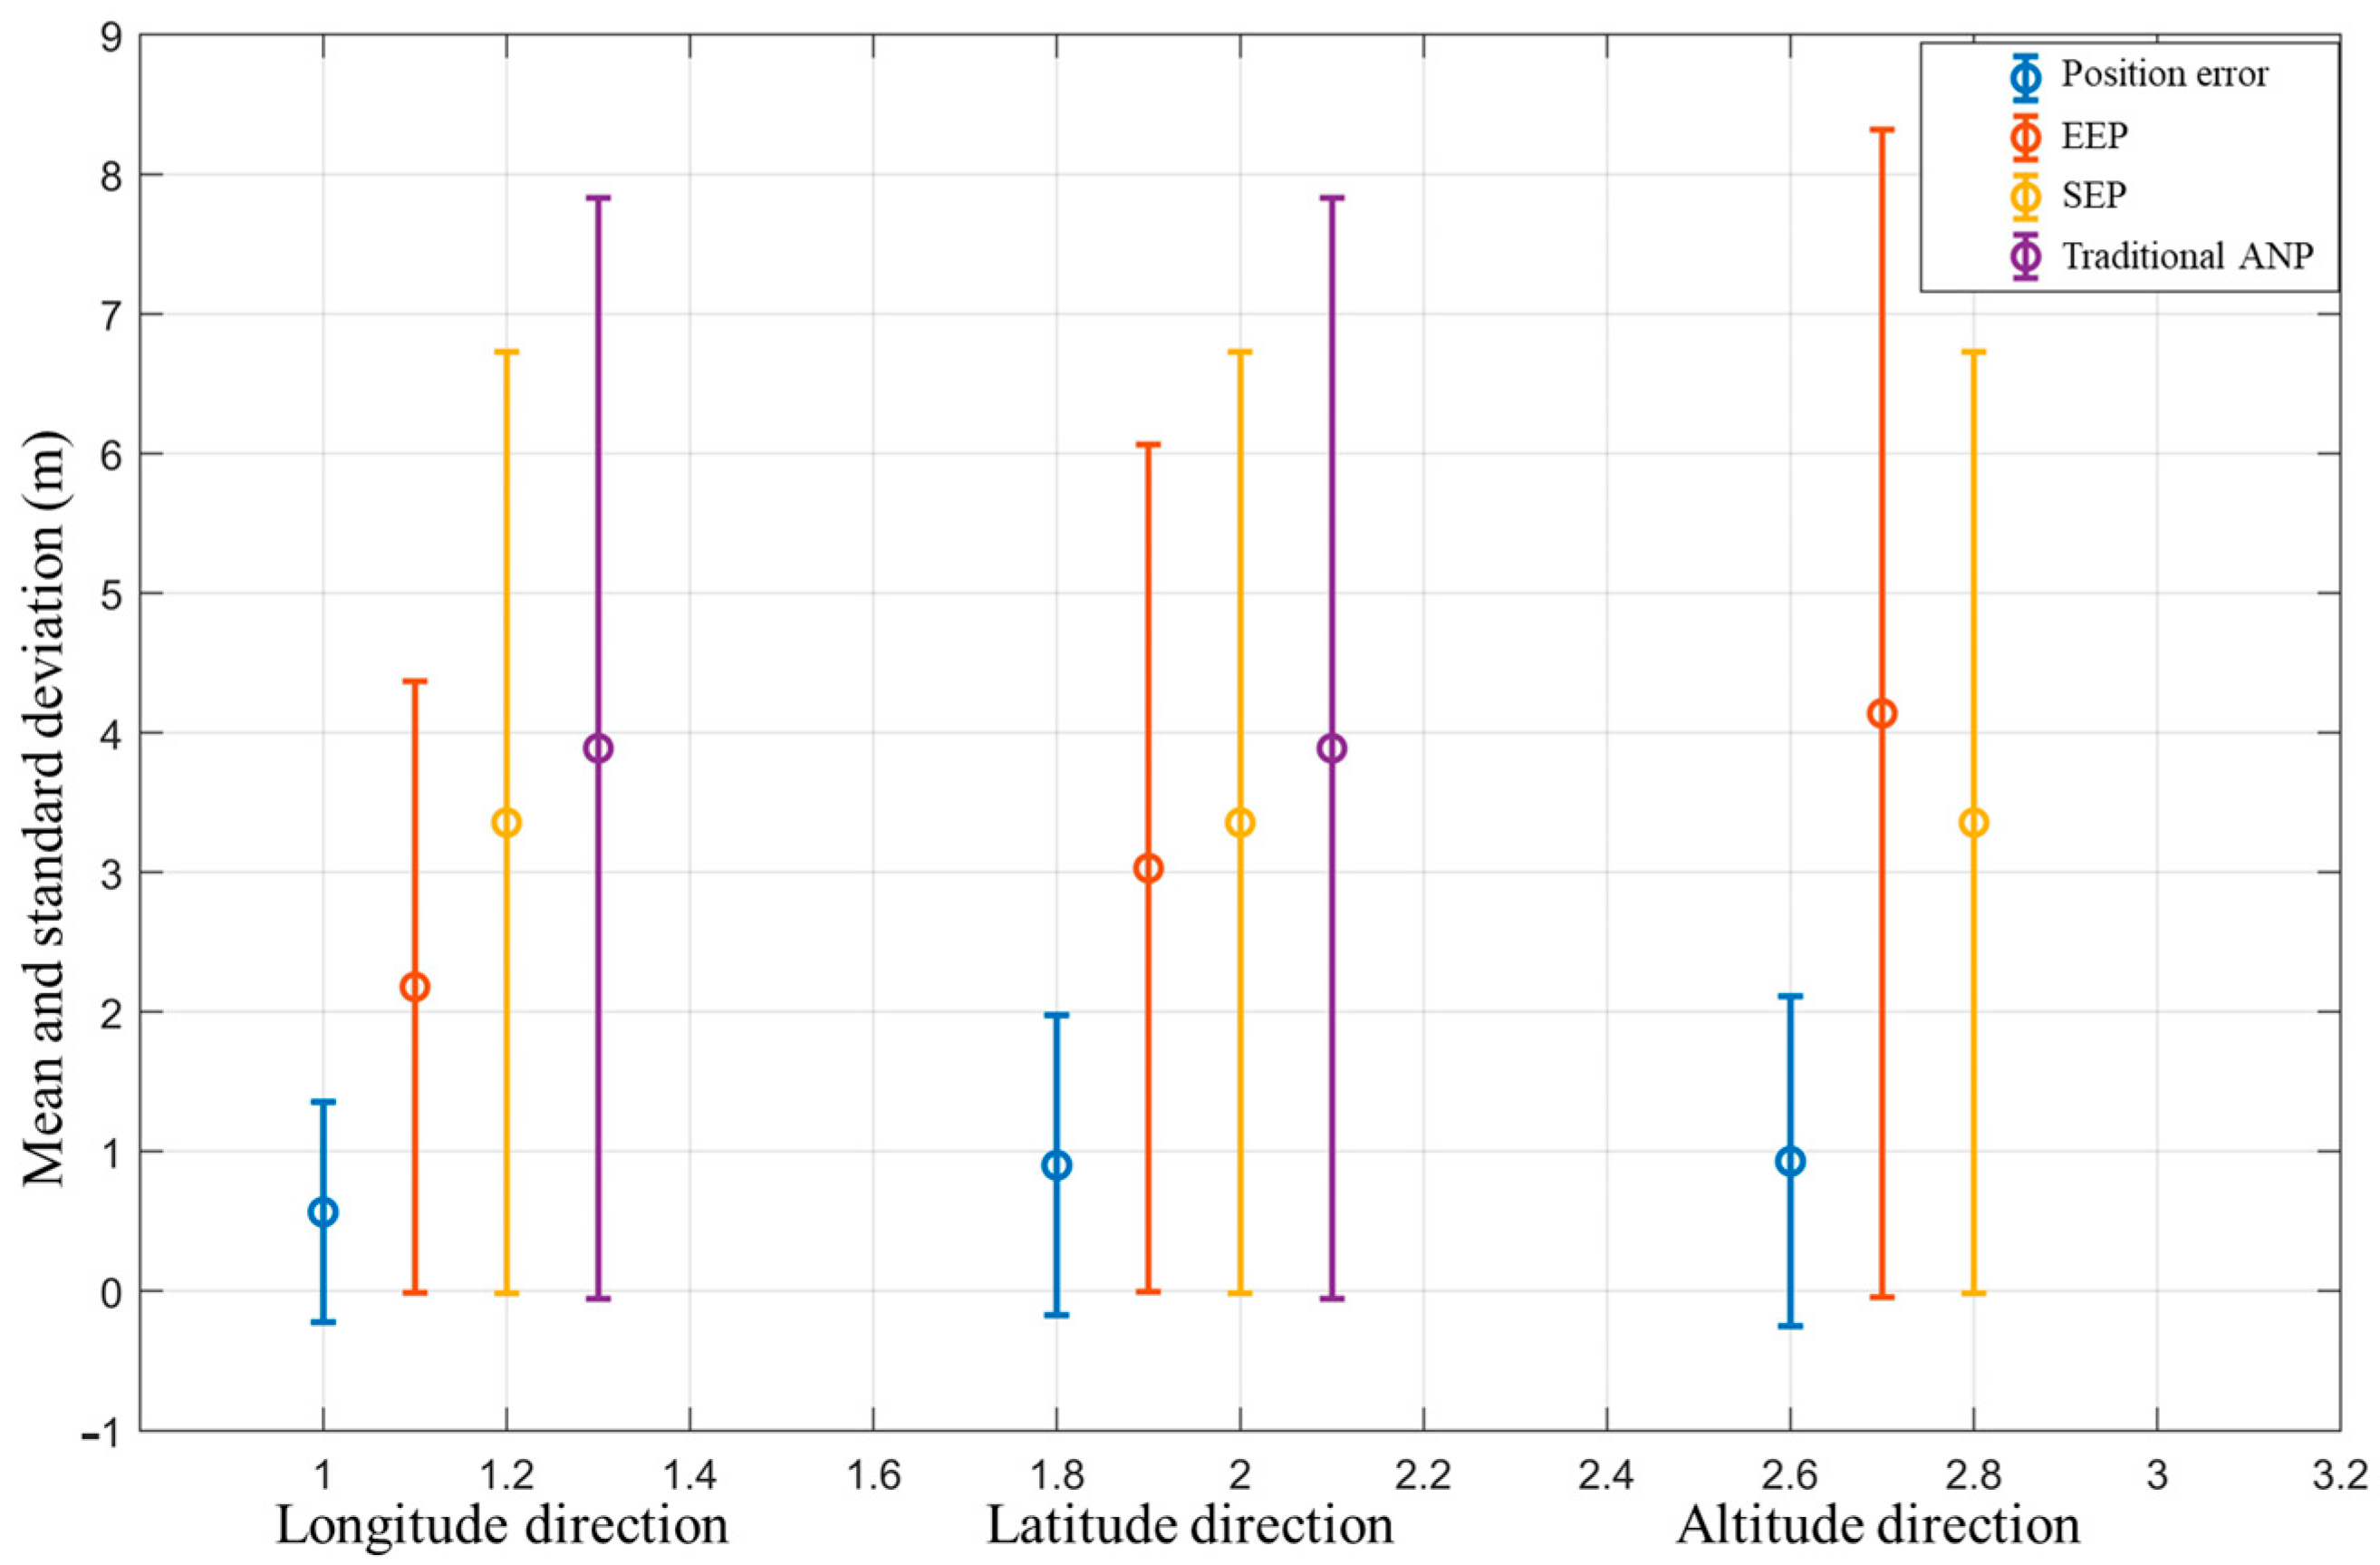
In order to verify the effectiveness of the proposed algorithm, 50 groups of Monte Carlo simulations were carried out under the same simulation conditions. The simulation results are shown in Figure 16.
For the 50 groups of Monte Carlo simulation results, the evaluation accuracy and precision of the traditional ANP model, SEP model, and EEP model proposed in this paper are statistically analyzed in Table 6 and Table 7.
Statistical analysis shows that the EEP model proposed in this paper has no false evaluation, and the evaluation accuracy in the longitude direction is 43.62% higher than that of the traditional ANP evaluation method and 34.91% higher than that of the SEP evaluation method. In the latitude direction, it is 34.55% higher than that of the traditional ANP evaluation method and 13.28% higher than that of the SEP evaluation method.
6. Conclusions
During RNP operation, it is important to monitor the actual navigation performance of FMS accurately. Traditional ANP calculation mainly focuses on the navigation and positioning performance of the aircraft along the track direction and considers the position uncertainty caused by a single sensor. The lack of comprehensive consideration of spatial position uncertainty will lead to the loss of dimension perception of aircraft navigation performance and inaccurate evaluation of ANP.
In this paper, to meet the needs of future development of civil aircraft RNP to 3D/4D, aiming at the lack of evaluation dimension of the traditional two-dimensional actual navigation performance evaluation method and the inaccuracy of the SEP model, a three-dimensional EEP model is proposed based on the uncertainty of the three-dimensional position of civil aircraft with unequal variances and relevance, and the corresponding three-dimensional ANP calculation method is given.
- (1)
- Compared with the traditional two-dimensional ANP model and SEP model, it fully considers the spatial uncertainty of civil aircraft, has smaller model inclusion volume, and improves the accuracy of the evaluation model.
- (2)
- The simulation results show that the EEP model proposed in this paper can effectively improve the evaluation accuracy on the basis of ensuring the accuracy of the evaluation of the actual navigation performance of the FMS in three-dimensional directions and more accurately represent the uncertainty of the position of the FMS in the flight space–time of the civil aircraft RNP to ensure flight safety.
Author Contributions
Conceptualization, Y.D. and J.L.; methodology, Y.D. and J.L.; validation, Y.D., Z.L. and J.L.; formal analysis, Y.D. and X.S.; investigation, Y.D., B.Z. and J.L.; data curation, Y.D., P.L. and J.L.; writing—original draft preparation, Y.D.; writing—review and editing, Y.D., Z.L. and J.L.; visualization, J.L.; supervision, J.L. All authors have read and agreed to the published version of the manuscript.
Funding
This research was funded by the Fundamental Research Funds for the Central Universities (NS2022039, NF2022001), and National Natural Science Foundation of China (61973160).
Institutional Review Board Statement
Not applicable.
Informed Consent Statement
Informed consent was obtained from all subjects involved in the study.
Data Availability Statement
Not applicable.
Conflicts of Interest
The authors declare no conflict of interest.
Abbreviations
| PBN | Performance Based Navigation |
| RNP | Required Navigation Performance |
| RNAV | Area Navigation |
| ANP | Actual Navigation Performance |
| EEP | Ellipsoid Error Probability |
| SEP | Spherical Error Probability |
| EPU | Estimated Position Uncertainty |
| FMS | Flight Management System |
| DME | Distance Measuring Equipment |
| VOR VHF | Omnidirectional Radio |
| MAPE | Mean Absolute Percentage Error |
References
- Joint Planning and Development Office (JPDO). Concept of Operations for the Next Generation Air Transportation System; JPDO: Washington, DC, USA, 2013. [Google Scholar]
- SESAR Consortium. The ATM Target of Operations; SESAR Consortium: Brussels, Belgium, 2007. [Google Scholar]
- Civil Aviation Administration of China. Statistical Bulletin on the Development of Civil Aviation Industry of 2019; Development Planning Division: Beijing, China, 2020.
- International Civil Aviation Organization (ICAO). Doc 9613: Performance Based Navigation (PBN) Manual; ICAO: Montréal, QC, Canada, 2013. [Google Scholar]
- Radio Technical Commission for Aeronautics (RTCA). RTCA DO-283A, Minimum Operational Performance Standards for Required Navigation Performance for Area Navigation; RTCA Inc.: Washington, DC, USA, 2013. [Google Scholar]
- FAA Aeronautical Center. Assessing the Validity of Using Actual Navigation Performance (ANP) Information for Supporting Designated Flight Inspection Operations; FAA Aeronautical Center: Oklahoma City, OK, USA, 2008.
- Yoon, M.G.; Kim, J.K. Evaluation methodology for safety maturity in air navigation safety. J. Air Transp. Manag. 2022, 98, 102159. [Google Scholar] [CrossRef]
- Fu, L.; Zhang, J.; Li, R. Real-time total system error estimation: Modeling and application in required navigation performance. Chin. J. Aeronaut. 2014, 27, 1544–1553. [Google Scholar] [CrossRef] [Green Version]
- Zhao, H.; Xu, X.; Zhang, J.; Zhu, Y.; Yang, C.; Hong, S. Lateral Flight Technical Error Estimation Model for Performance Based Navigation. Chin. J. Aeronaut. 2011, 24, 329–336. [Google Scholar] [CrossRef] [Green Version]
- Chamlou, R. TIS-B: Calculation of navigation accuracy category for position and velocity parameters. In Proceedings of the 23rd Digital Avionics Systems Conference, Salt Lake City, UT, USA, 28 October 2004; IEEE: Piscataway, NJ, USA Computer Science. ; pp. D.3-1–D.3-13. [Google Scholar]
- Carl, E.J. Analysis of Fatigue-Crack Propagation and Fracture Data: AIAA-2009-1363; AIAA: Reston, VA, USA, 1973. [Google Scholar]
- Zhang, Q.; Zhang, J.; Zhu, Y.; Liu, W. Navigation Accuracy Category-Position Models and Estimate Position Uncertainty Calculations for TIS-B System. Chin. J. Aeronaut. 2009, 22, 419–425. [Google Scholar] [CrossRef] [Green Version]
- Lu, D.; Schnieder, E. Performance Evaluation of GNSS for Train Localization. IEEE Trans. Intell. Transp. Syst. 2015, 16, 1054–1059. [Google Scholar] [CrossRef]
- Liu, M.; Lai, J.; Li, Z.; Liu, J. An adaptive cubature Kalman filter algorithm for inertial and land-based navigation system. Aerosp. Sci. Technol. 2016, 51, 52–60. [Google Scholar] [CrossRef]
- Przemieniecki, J.S. Mathematical Methods in Defense Analyses; American Institute of Aeronautics and Astronautics Inc.: Washington, DC, USA, 2000. [Google Scholar]
- Gura, A.; Gersten, R.H. On Analysis of n-Dimensional Normal Probabilities; Space and missile system organization of air force system command Los Angeles air force station: Los Angeles, CA, USA, 1970. [Google Scholar]
- Pamplona, D.A.; de Barros, A.G.; Alves, C.J. Performance-Based Navigation Flight Path Analysis Using Fast-Time Simulation. Energies 2021, 14, 7800. [Google Scholar] [CrossRef]
- Radio Technical Commission for Aeronautics (RTCA). RTCA DO-236C, Minimum Aviation System Performance Standards: Re-quired Navigation Performance for Area Navigation; Radio Technical Commission for Aeronautics (RTCA): Washington, DC, USA, 2014. [Google Scholar]
- Radio Technical Commission for Aeronautics (RTCA). RTCA DO-229C, Minimum Operational Performance Standards for Global Positioning System/Wide Area Augmentation System Airborne Equipment; Radio Technical Commission for Aeronautics (RTCA): Washington, DC, USA, 2001. [Google Scholar]
- Aeronautical Radio Inc. (ARINC). ARINC 712-7, Airborne ADF System; ARINC: Annapolis, MD, USA, 1997. [Google Scholar]
Figure 1.
RNP for each leg.

Figure 2.
Two-dimensional ANP model.

Figure 3.
Spherical Error Probable.

Figure 4.
Three-dimensional position error ellipsoid.

Figure 5.
Numerical integration results of P and .

Figure 6.
Comparison between SEP volume and EEP model volume.

Figure 7.
Comparison between EEP model and SEP model in XOY plane.

Figure 8.
Comparison between EEP model and SEP model in XOZ plane.

Figure 9.
Comparison between EEP model and SEP model in YOZ plane.

Figure 10.
Three-dimensional ANP calculation process.

Figure 11.
RNP flight simulation and verification platform.

Figure 12.
Flight simulation trajectory.

Figure 13.
Comparison between longitude position error and ANP.

Figure 14.
Comparison between latitude position error and ANP.

Figure 15.
Comparison between altitude position error and ANP.

Figure 16.
Statistical comparison chart of Monte Carlo simulation.


Table 1.
Simulation track waypoint table.
| Way Point | Longitude/° | Latitude/° |
|---|---|---|
| ZBAA | 116.598333 | 40.073333 |
| ELKUR | 116.665000 | 38.639722 |
| DOXAB | 116.625000 | 38.291111 |
| OVNUG | 116.692222 | 38.110278 |
| PANKI | 116.999722 | 37.295833 |
| GUSIR | 117.041667 | 37.206667 |
| YQG | 117.215000 | 36.833333 |
| DALIM | 117.213056 | 36.417778 |
| ABTUB | 117.367778 | 36.000556 |
| UDINO | 117.803333 | 34.822500 |
| DPX | 117.998333 | 34.278333 |
| OMUDI | 118.266667 | 33.970556 |
| LAGAL | 118.705556 | 33.467222 |
| ATVAD | 118.854167 | 33.295833 |
| SUBKU | 118.940278 | 33.197222 |
| NIXEM | 119.160556 | 32.941944 |
| XUTGU | 119.575556 | 32.463889 |
| PIMOL | 119.761667 | 32.245833 |
| VMB | 120.191667 | 31.743333 |
| SASAN | 120.319444 | 31.589444 |
| ZSSS | 121.335000 | 31.196667 |
Table 2.
Location information of ground stations.
| Station Number | Longitude/° | Latitude/° | Altitude/m |
|---|---|---|---|
| 1 | 116.1 | 39.6 | 37 |
| 2 | 117.2 | 39.132811 | 7 |
| 3 | 118.285661 | 35.222025 | 49 |
| 4 | 118.882050 | 31.7362194 | 5 |
| 5 | 121.325931 | 31.1436056 | 5 |
Table 3.
Comparison of actual navigation performance evaluation algorithm results.
| Statistical Items (RMSE) | Longitude/m | Latitude/m | Altitude/m |
|---|---|---|---|
| Position error | 0.557 | 0.5943 | 1.6269 |
| Traditional ANP | 3.0112 | 3.0112 | - |
| SEP | 2.4991 | 2.4991 | 2.4991 |
| EEP | 1.6527 | 2.2799 | 3.4975 |
Table 4.
Comparison of actual navigation performance evaluation algorithm results.
| Recall | Longitude | Latitude | Altitude |
|---|---|---|---|
| Traditional ANP | 100% | 100% | - |
| SEP | 100% | 100% | 97.14% |
| EEP | 100% | 100% | 100% |
Table 5.
Comparison of actual navigation performance evaluation algorithm results.
| MAPE | Longitude | Latitude | Altitude |
|---|---|---|---|
| Traditional ANP | 50.7283 | 37.9040 | - |
| SEP | 46.4230 | 34.0138 | 45.4766 |
| EEP | 31.6131 | 30.3037 | 55.5729 |
Table 6.
Precision comparison of actual navigation performance evaluation algorithm results in Monte Carlo simulation.
Table 6.
Precision comparison of actual navigation performance evaluation algorithm results in Monte Carlo simulation.
| Recall | Longitude | Latitude | Altitude |
|---|---|---|---|
| Traditional ANP | 100% | 100% | - |
| SEP | 100% | 100% | 97.14% |
| EEP | 100% | 100% | 100% |
Table 7.
Accuracy comparison of actual navigation performance evaluation algorithm results in Monte Carlo simulation.
Table 7.
Accuracy comparison of actual navigation performance evaluation algorithm results in Monte Carlo simulation.
| MAPE | Longitude | Latitude | Altitude |
|---|---|---|---|
| Traditional ANP | 50.7283 | 37.9040 | - |
| SEP | 46.4230 | 34.0138 | 45.4766 |
| EEP | 31.6131 | 30.3037 | 55.5729 |
Publisher’s Note: MDPI stays neutral with regard to jurisdictional claims in published maps and institutional affiliations. |
© 2022 by the authors. Licensee MDPI, Basel, Switzerland. This article is an open access article distributed under the terms and conditions of the Creative Commons Attribution (CC BY) license (https://creativecommons.org/licenses/by/4.0/).
Share and Cite
MDPI and ACS Style
Dai, Y.; Lai, J.; Zhu, B.; Li, Z.; Sun, X.; Lv, P. Three-Dimensional ANP Evaluation Method Based on Spatial Position Uncertainty under RNP Operation. Aerospace 2022, 9, 703. https://doi.org/10.3390/aerospace9110703
AMA Style
Dai Y, Lai J, Zhu B, Li Z, Sun X, Lv P. Three-Dimensional ANP Evaluation Method Based on Spatial Position Uncertainty under RNP Operation. Aerospace. 2022; 9(11):703. https://doi.org/10.3390/aerospace9110703
Chicago/Turabian StyleDai, Yuting, Jizhou Lai, Bin Zhu, Zhimin Li, Xiao Sun, and Pin Lv. 2022. "Three-Dimensional ANP Evaluation Method Based on Spatial Position Uncertainty under RNP Operation" Aerospace 9, no. 11: 703. https://doi.org/10.3390/aerospace9110703
Note that from the first issue of 2016, this journal uses article numbers instead of page numbers. See further details here.