Article

Visual Navigation Algorithm for Night Landing of Fixed-Wing Unmanned Aerial Vehicle

1
College of Astronautics, Nanjing University of Aeronautics and Astronautics, 29 Jiangjun Street, Nanjing 211106, China
2
Department of Mechanical Engineering, University of Canterbury, 4800 Private Bag, Christchurch 8140, New Zealand
*
Author to whom correspondence should be addressed.
Aerospace 2022, 9(10), 615; https://doi.org/10.3390/aerospace9100615
Submission received: 8 September 2022 / Revised: 8 October 2022 / Accepted: 13 October 2022 / Published: 17 October 2022
(This article belongs to the Special Issue Vision-Based UAV Navigation)

Abstract

:
In the recent years, visual navigation has been considered an effective mechanism for achieving an autonomous landing of Unmanned Aerial Vehicles (UAVs). Nevertheless, with the limitations of visual cameras, the effectiveness of visual algorithms is significantly limited by lighting conditions. Therefore, a novel vision-based autonomous landing navigation scheme is proposed for night-time autonomous landing of fixed-wing UAV. Firstly, due to the difficulty of detecting the runway caused by the low-light image, a strategy of visible and infrared image fusion is adopted. The objective functions of the fused and visible image, and the fused and infrared image, are established. Then, the fusion problem is transformed into the optimal situation of the objective function, and the optimal solution is realized by gradient descent schemes to obtain the fused image. Secondly, to improve the performance of detecting the runway from the enhanced image, a runway detection algorithm based on an improved Faster region-based convolutional neural network (Faster R-CNN) is proposed. The runway ground-truth box of the dataset is statistically analyzed, and the size and number of anchors in line with the runway detection background are redesigned based on the analysis results. Finally, a relative attitude and position estimation method for the UAV with respect to the landing runway is proposed. New coordinate reference systems are established, six landing parameters, such as three attitude and three positions, are further calculated by Orthogonal Iteration (OI). Simulation results reveal that the proposed algorithm can achieve 1.85% improvement of AP on runway detection, and the reprojection error of rotation and translation for pose estimation are 0 . 675 and 0.581%, respectively.

1. Introduction

The broader applications of unmanned aerial vehicles (UAVs) in various industries have increased the requirements for intelligence and autonomy on unmanned aircraft. Autonomous UAV flights are often classified into three stages: autonomous takeoff, cruise, and landing. Among them, landing is considered to be one of the most critical and dangerous stages during the whole operation [1]. Therefore, studying the autonomous landing of UAVs is particularly important to improve their level of autonomy.
Existing navigation systems for aircraft landing include the Global Positioning System (GPS), Instrument Landing System (ILS), and Radio Navigation System (RNS) [2]. However, these systems have several disadvantages. (1) GPS signals are easily disrupted and frequently lost. If a UAV loses the GPS signal during flight, it will be unable to complete the established landing mission. (2) The ILS can only guide the UAV to the decision height. It cannot guide the UAV to land on the runway; hence, the final landing process is manually completed by the pilot. (3) The RNS needs to deal with information interaction between airborne and ground equipment—a process that is easily interfered by other electromagnetic signals. In short, these navigation technologies are unsuitable for autonomous UAV landing.
Because vision provides rich information, machine vision has become a promising technology to guide UAV landings. Visual navigation has the following advantages, such as visual sensors are lighter in weight, low energy consumption, and easier to deploy on UAVs. On the other hand, GPS, ILS, RNS, and other systems require information interaction with other equipment, the working process of visual sensor is completely passive; hence, it avoids signal interference, is less conspicuous, and enhances information security. Visual navigation can directly obtain the attitude and position of the UAV with respect to the runway, which is the essential information for landing control. With the development of hardware, it is becoming faster to process image information with an onboard processor, such as the Parallel processors arrays (PPAS) [3], a new class of vision sensor devices, can enable the UAV to track target, detect and avoid an obstacle. In addition, Benini et al. [4] developed a real-time GPU-based UAV pose estimation system which can process the monocular video stream at least 30 fps. The progress of onboard processors makes it possible for fixed-wing UAVs to utilize visual sensors for navigation. A large number of studies have shown that the accuracy of visual navigation can reach the centimeter level [5]. Moreover, machine vision is a key area of focus to achieve UAS autonomy [6]. Because of these advantages, visual navigation has been studied for several years and successfully applied to rotary and fixed-wing UAVs, such as autonomous landing on mobile platforms [7] and landing fixed-wing UAVs using a vision system [8].
The difference in flight characteristics between the rotary and fixed-wing UAVs has made the landing process of the latter more challenging for the following reasons. (1) Fixed-wing UAVs have higher requirements for robustness and real-time visual navigation algorithms because, unlike rotary UAVs, they cannot hover during the landing process. (2) Because rotary UAVs are equipped with a down-looking visual sensor and signs with obvious characters that are set on the landing platform (e.g., ARTag [9], AprilTag [10], ARUco [11]), these are easier to detect from visual images. In contrast, the runway characteristics of fixed-wing UAVs are not obvious, which makes them difficult to detect. Furthermore, the malfunction runway light, such as one pixel color change, could lead to an erroneous runway detection. The authors of [12] studied the robustness of Bayesian neural networks, proving that Bayesian methods are effective in improving the robustness of image-based deep learning systems, providing a feasible idea for runway recognition in interference scenarios. (3) Most studies on visual landing were conducted under good lighting conditions. However, there are many tasks that have to be performed at night. A low-light image can reduce the performance of high-level vision algorithms; sometimes, the object detection algorithm cannot detect any object at all, as shown in Figure 1. Our observation of visual navigation for fixed-wing UAVs leads us to conclude that (1) although the topic of visual navigation for fixed-wing UAVs has been widely researched, it still cannot cover overall fixed-wing UAVs autonomous landing scenarios, such as landing at night; (2) the properties of fixed-wing UAVs landing runway are difficult to be detected by normal vision detection algorithm. These conclusions motivated us to develop a novel visual navigation approach to achieve fixed-wing UAVs autonomous landing at night.
To solve the three problems described above, the vision-based navigation algorithm of a fixed-wing UAV is divided into three parts. First, the image fusion algorithm based on the objective function is used to fuse the visible and infrared images. Second, a runway detection algorithm based on an improved Faster region-based convolutional neural network (Faster R-CNN) is proposed. Finally, the relationships between the world coordinate system, camera coordinate system, and image coordinate system are established, and the attitude and position of the UAV relative to the landing runway are calculated by an Orthogonal Iteration (OI) algorithm. The general scheme of the vision-based navigation algorithm for fixed-wing UAVs for night landing is shown in Figure 2. The main novelty of this work includes three aspects.
(1)
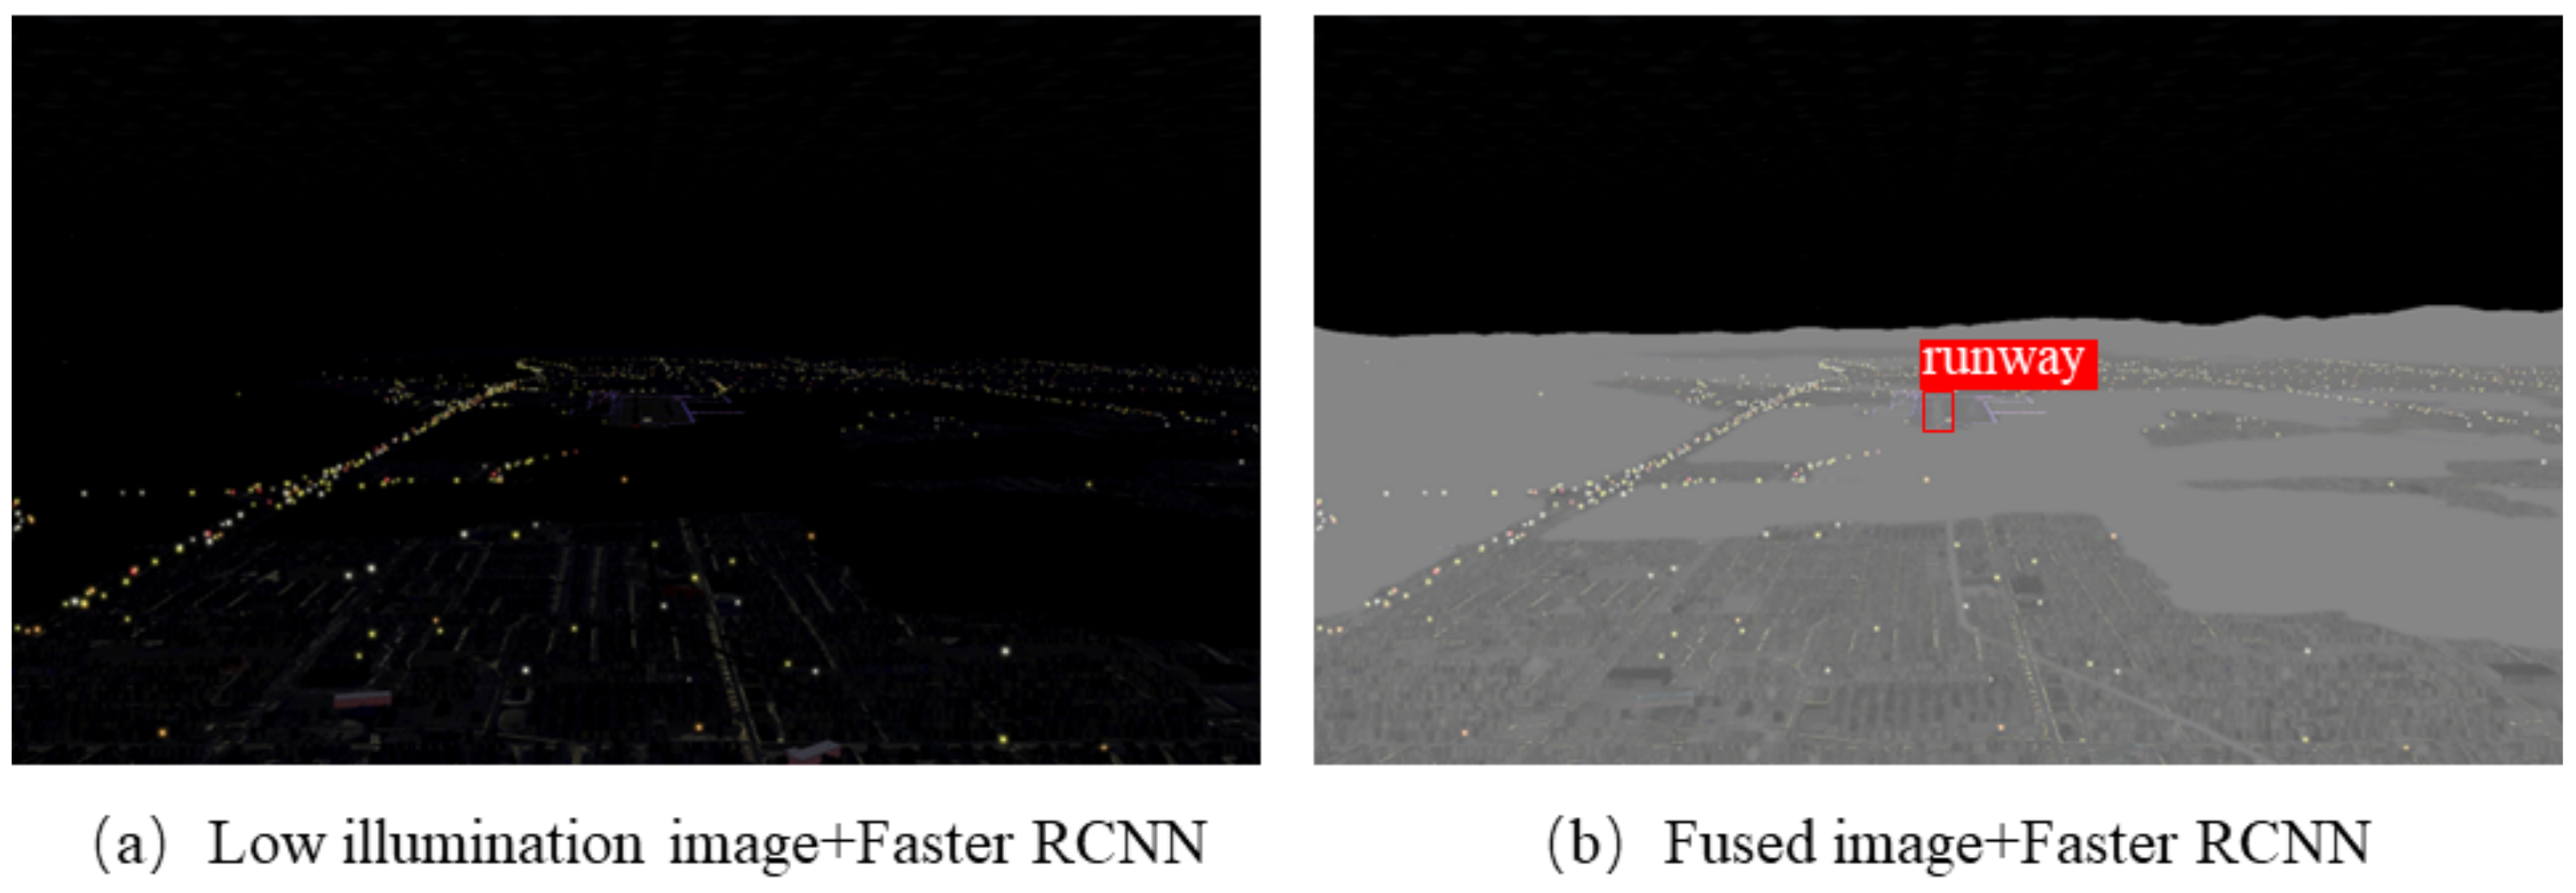
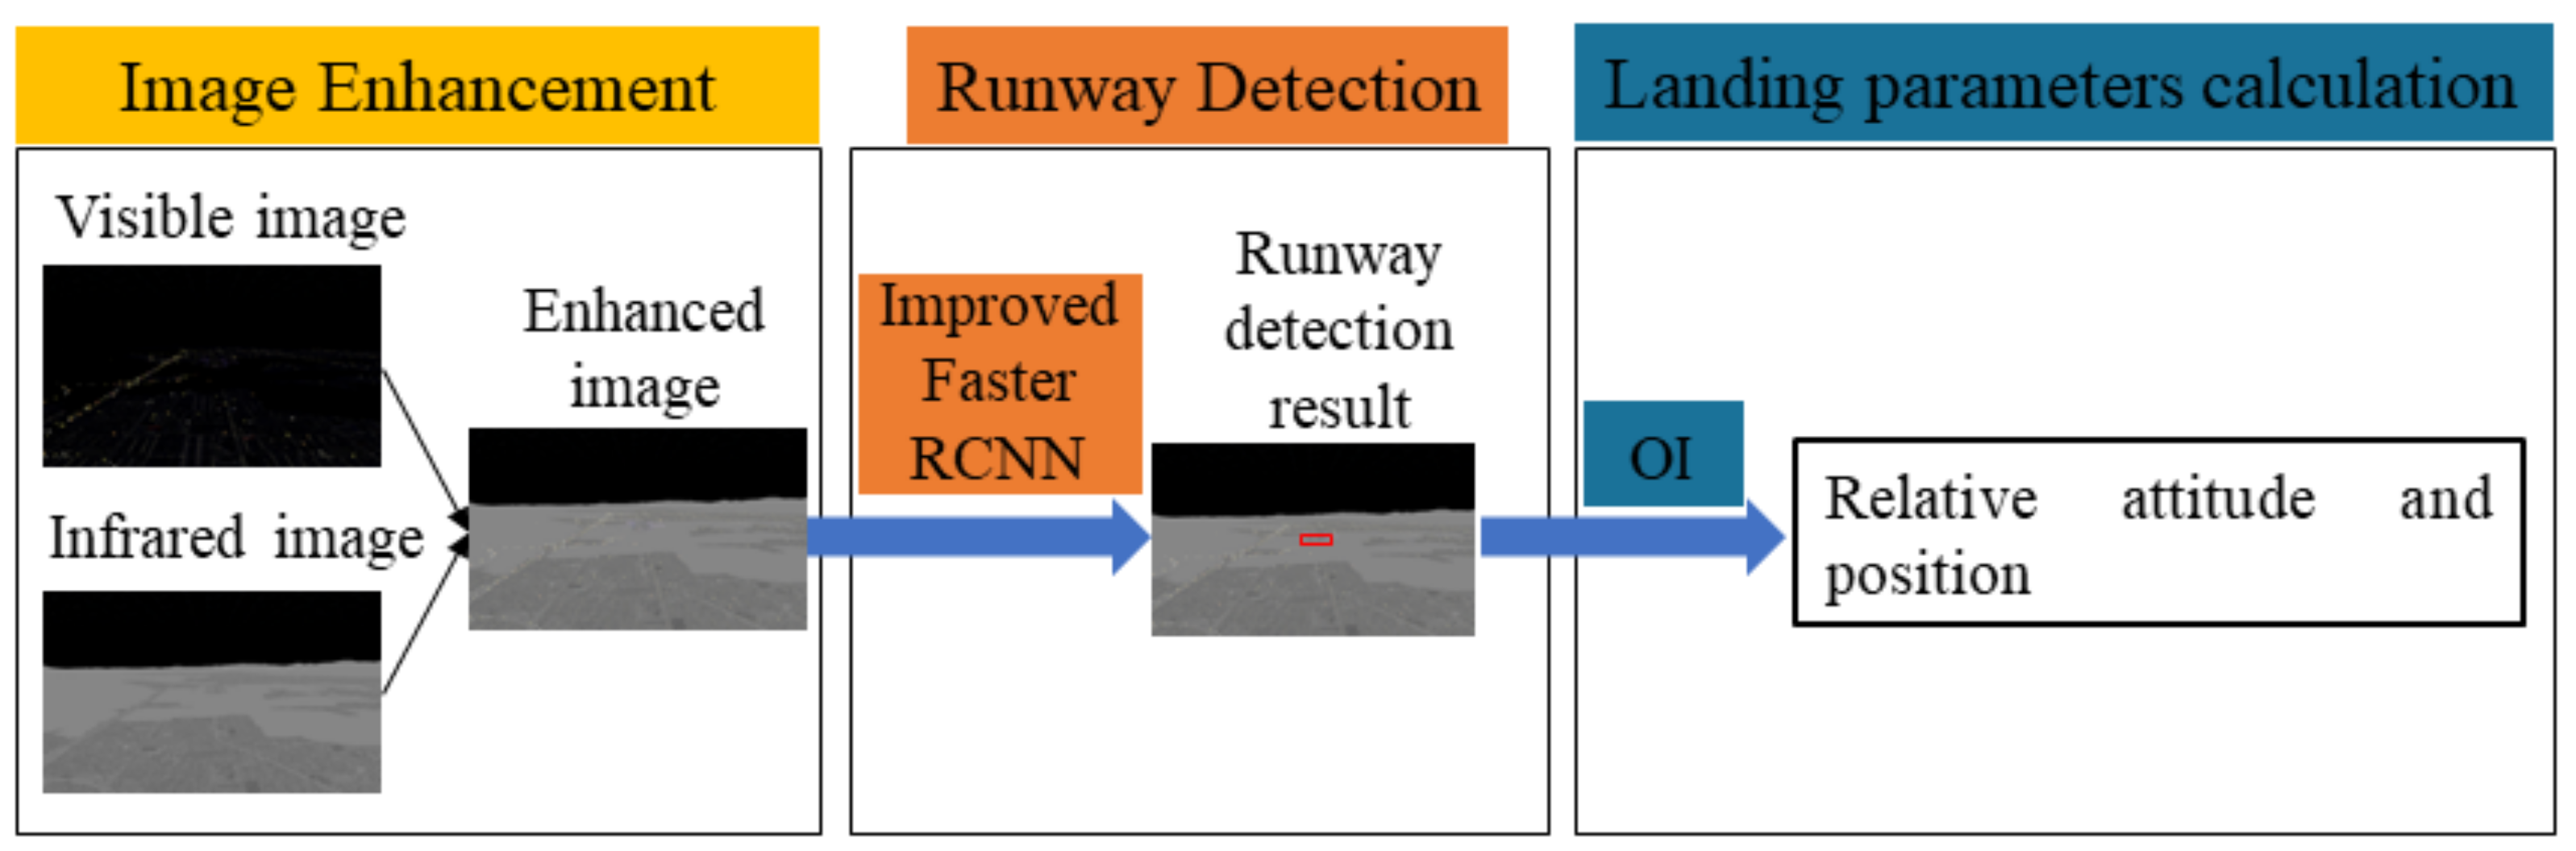
For fixed-wing UAV autonomous landing at night, an image brightness enhancement method based on visible and infrared images fusion is proposed. While effectively enhancing brightness, more texture information is preserved.
(2)
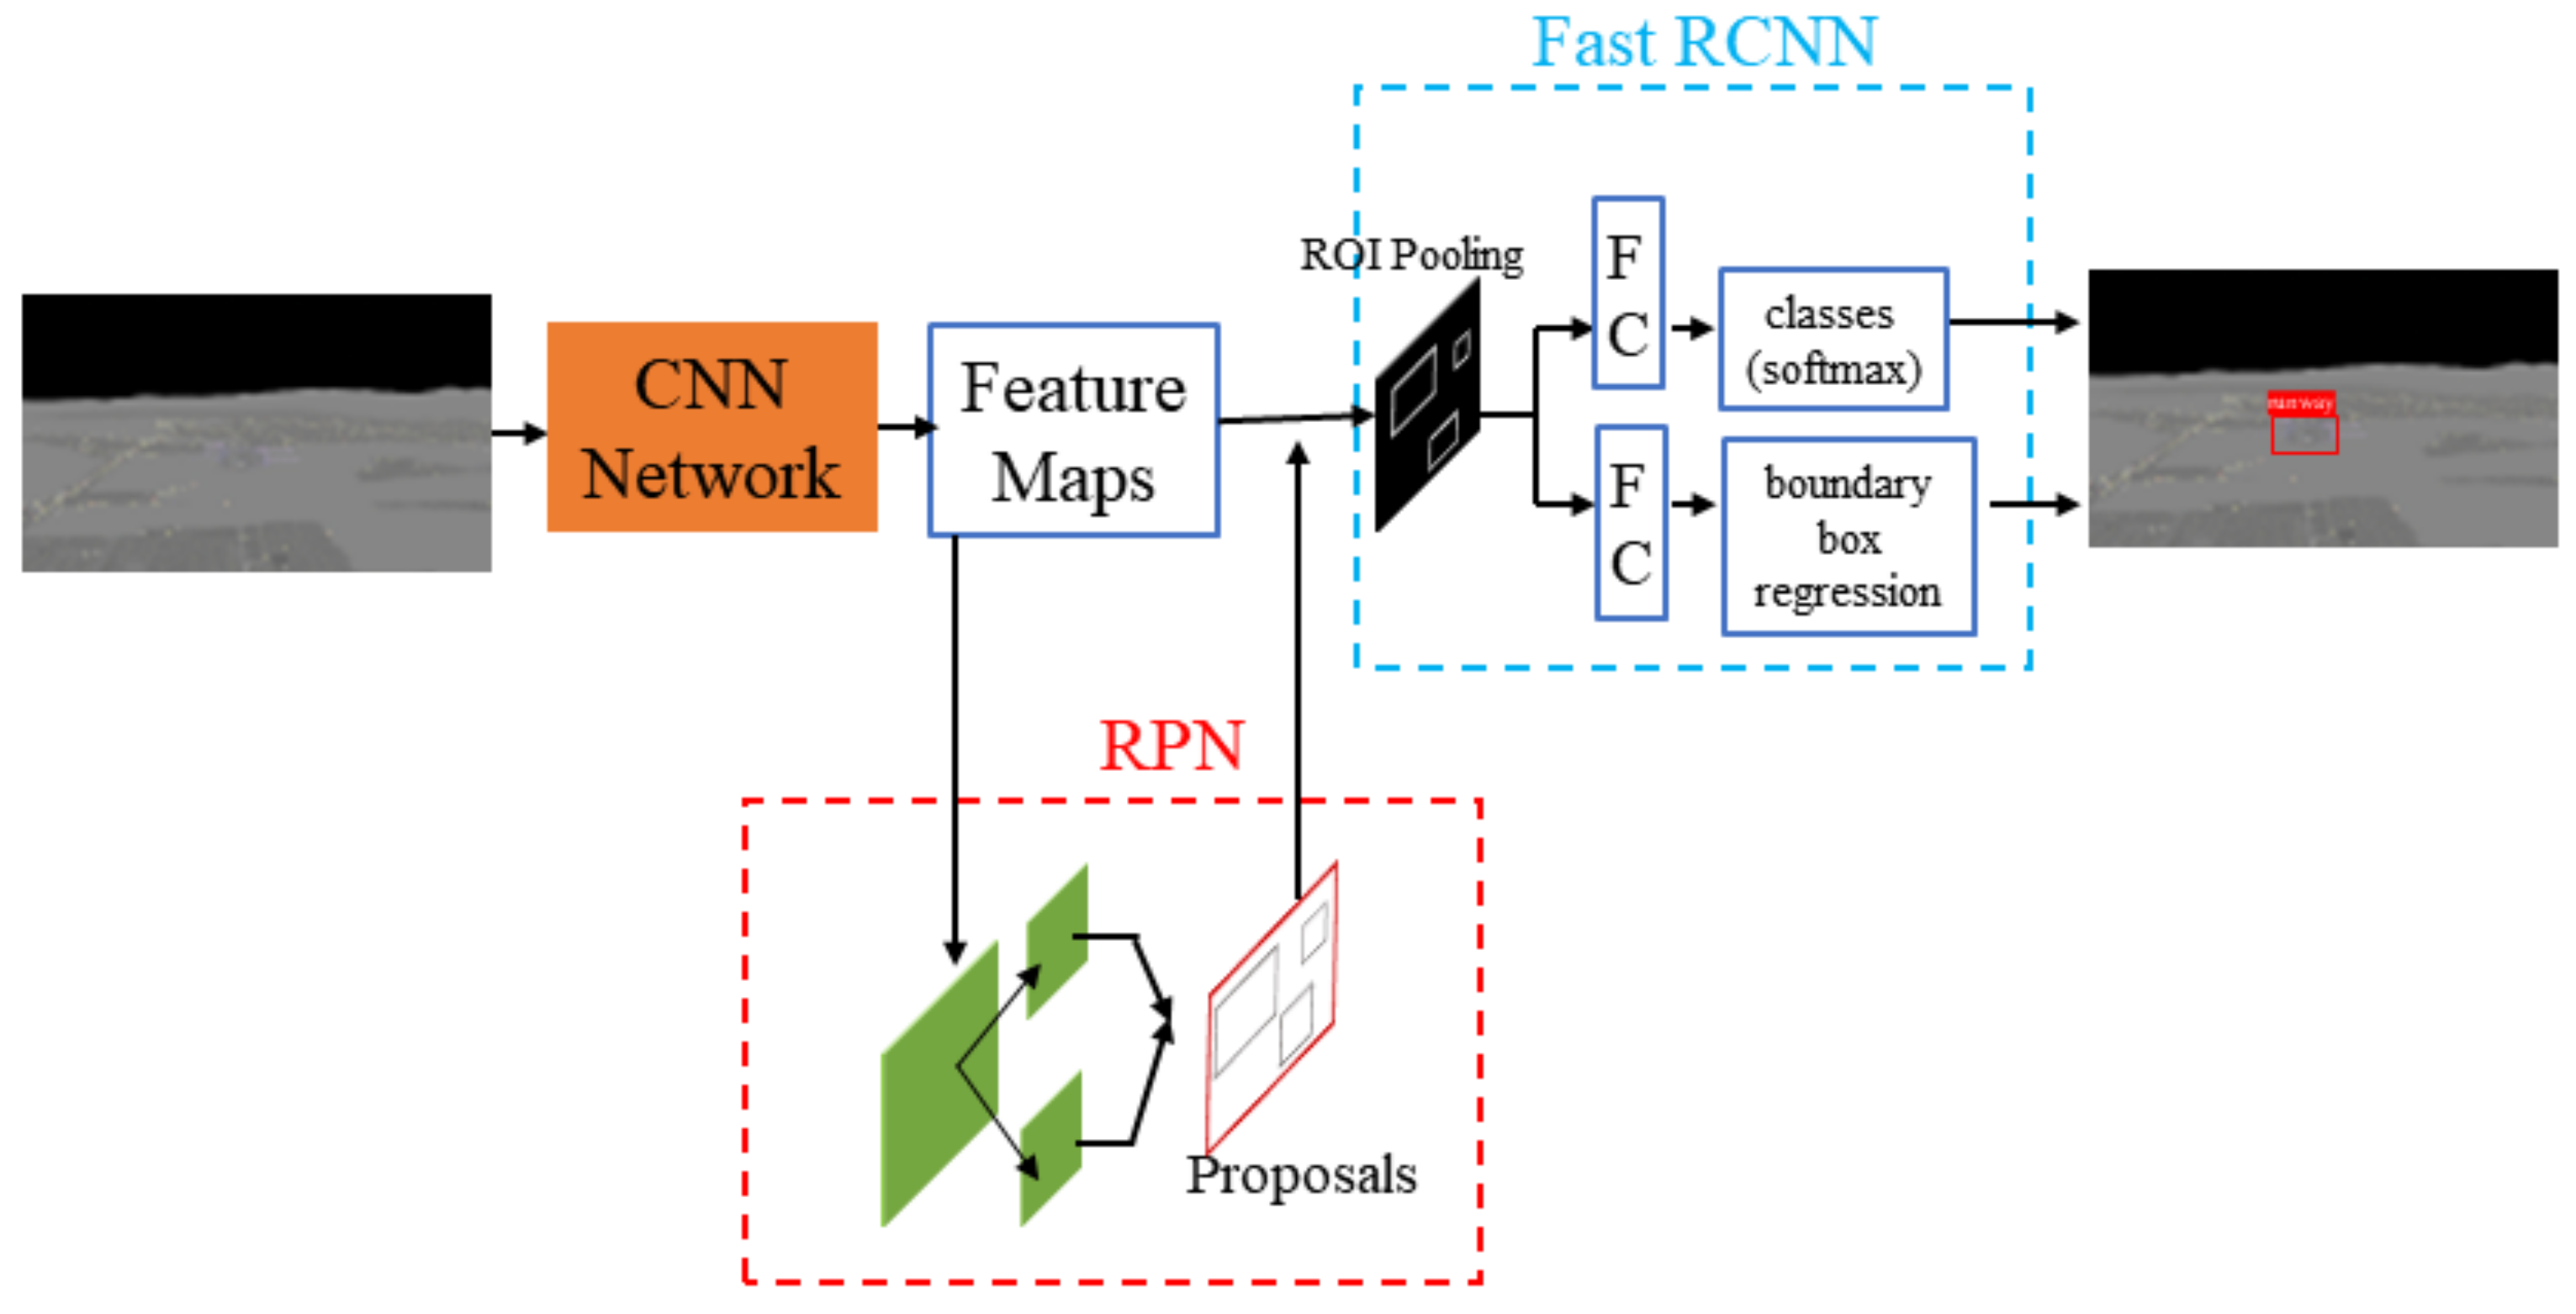
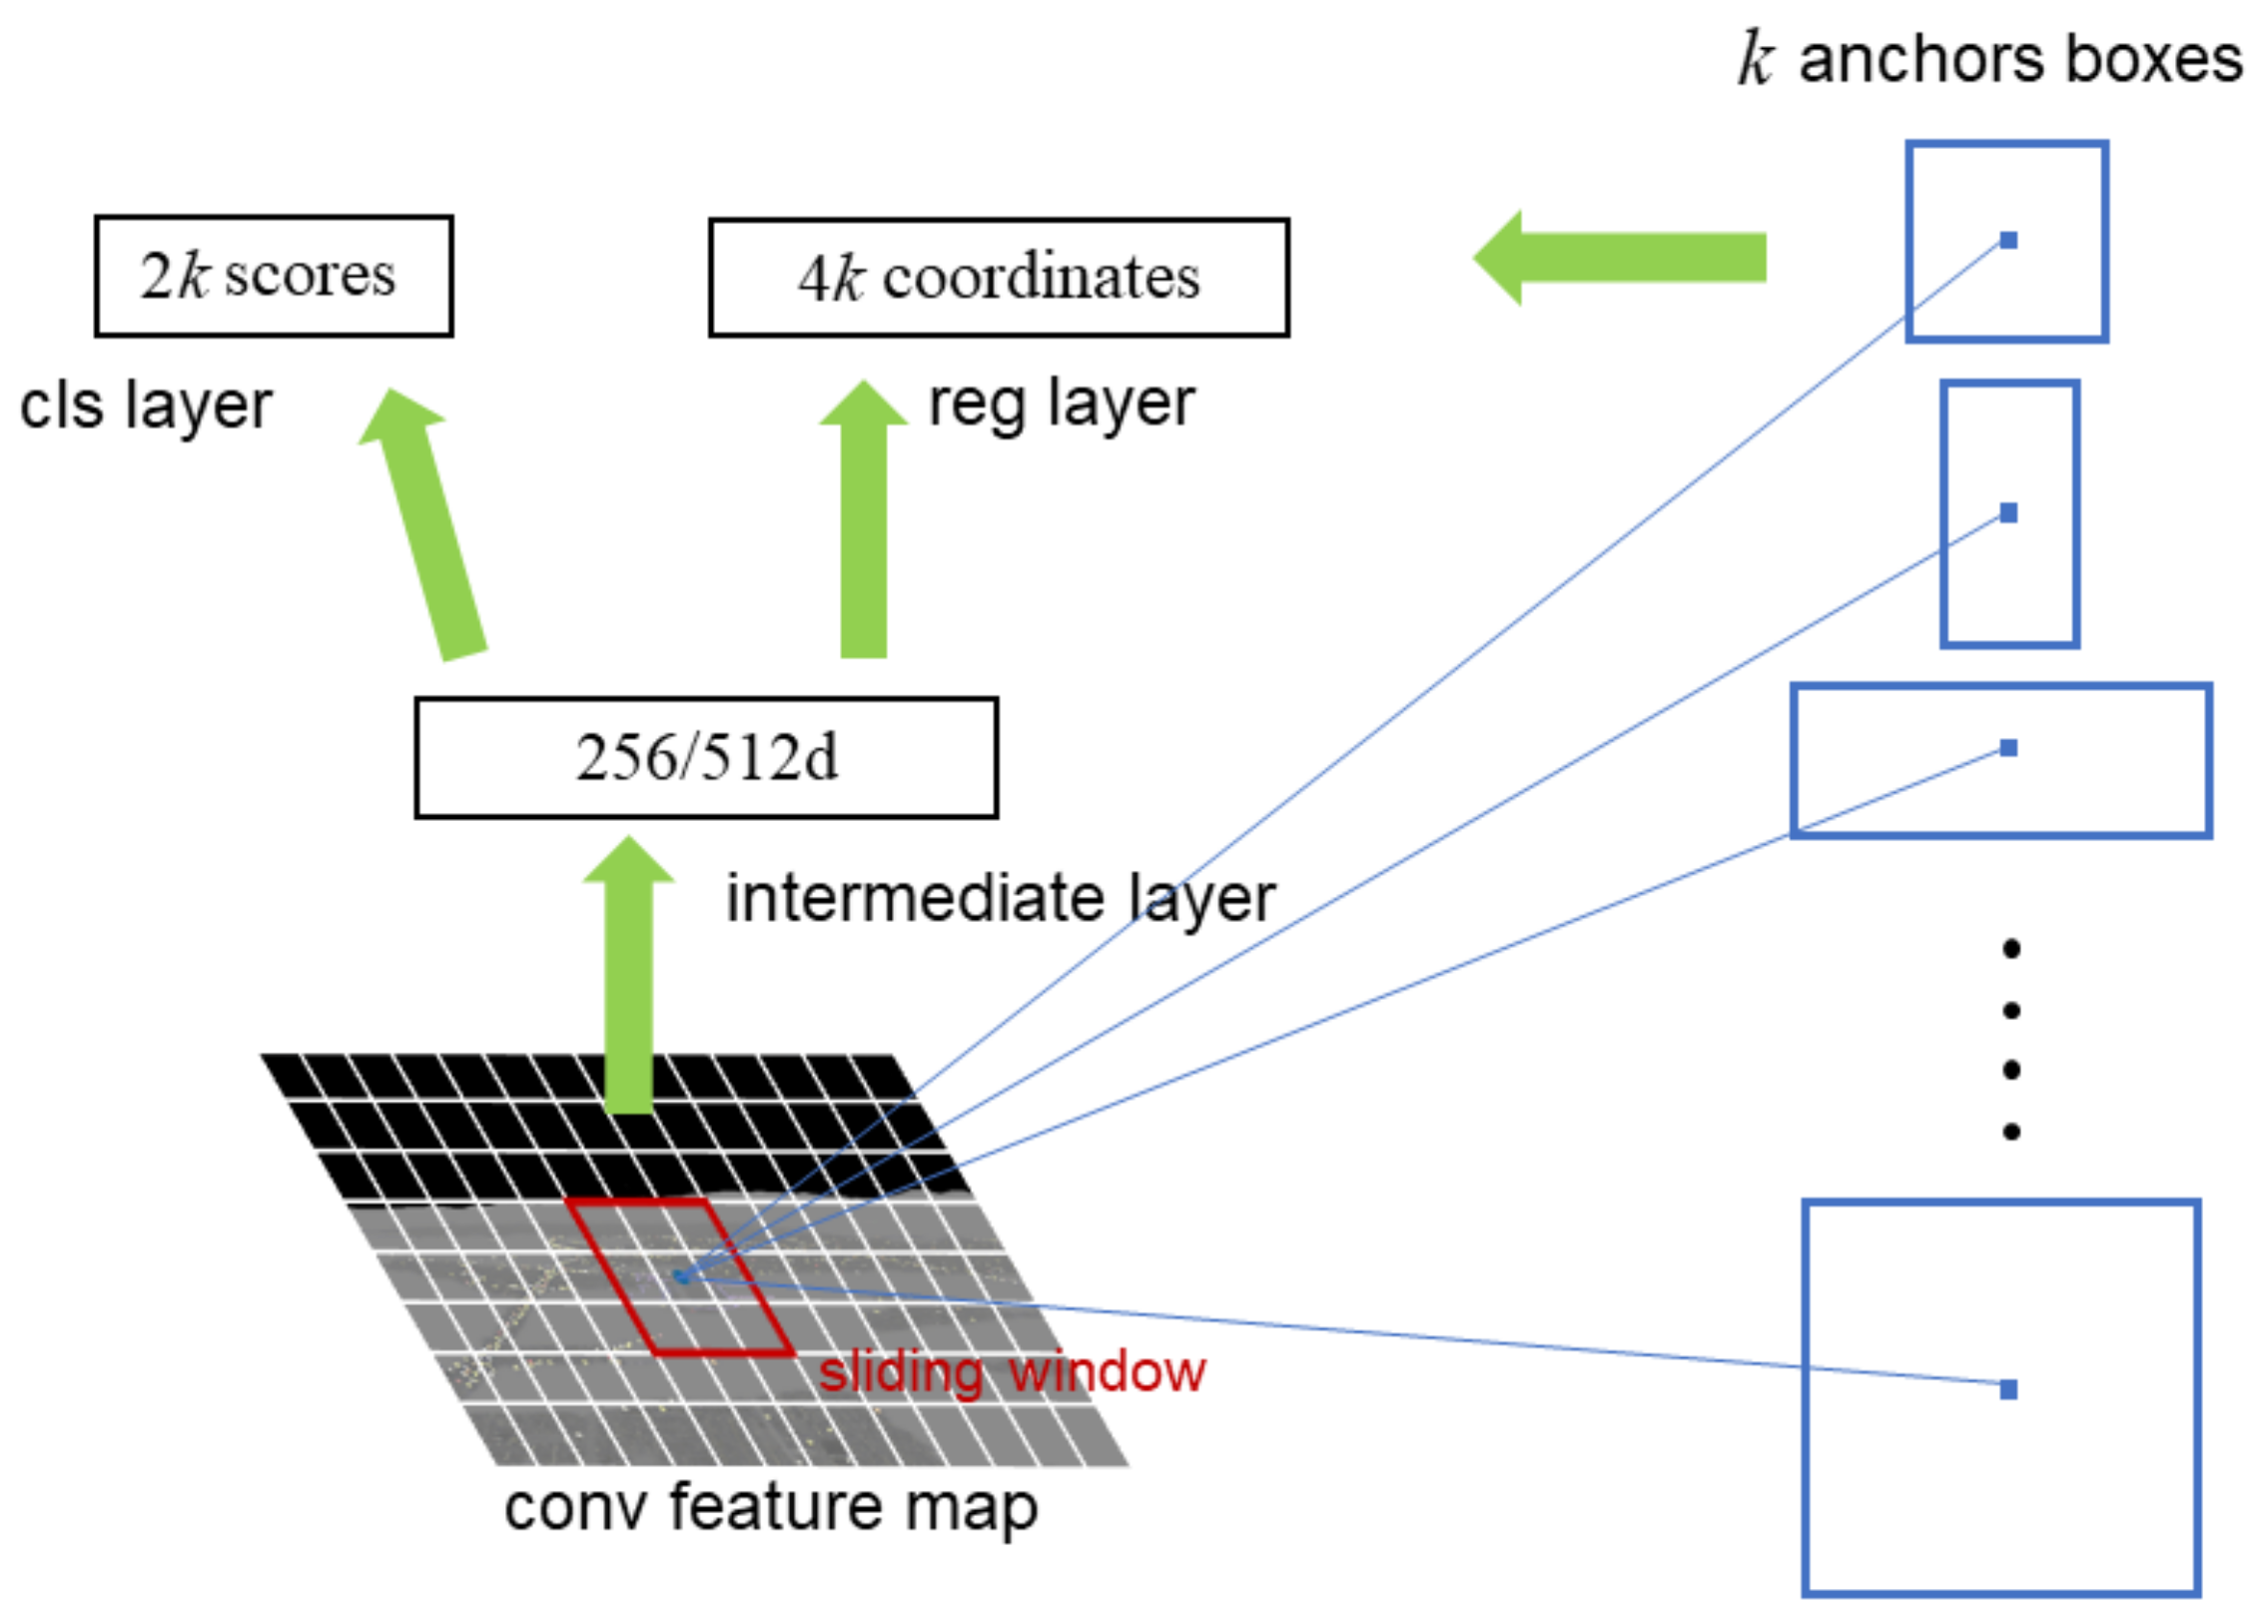
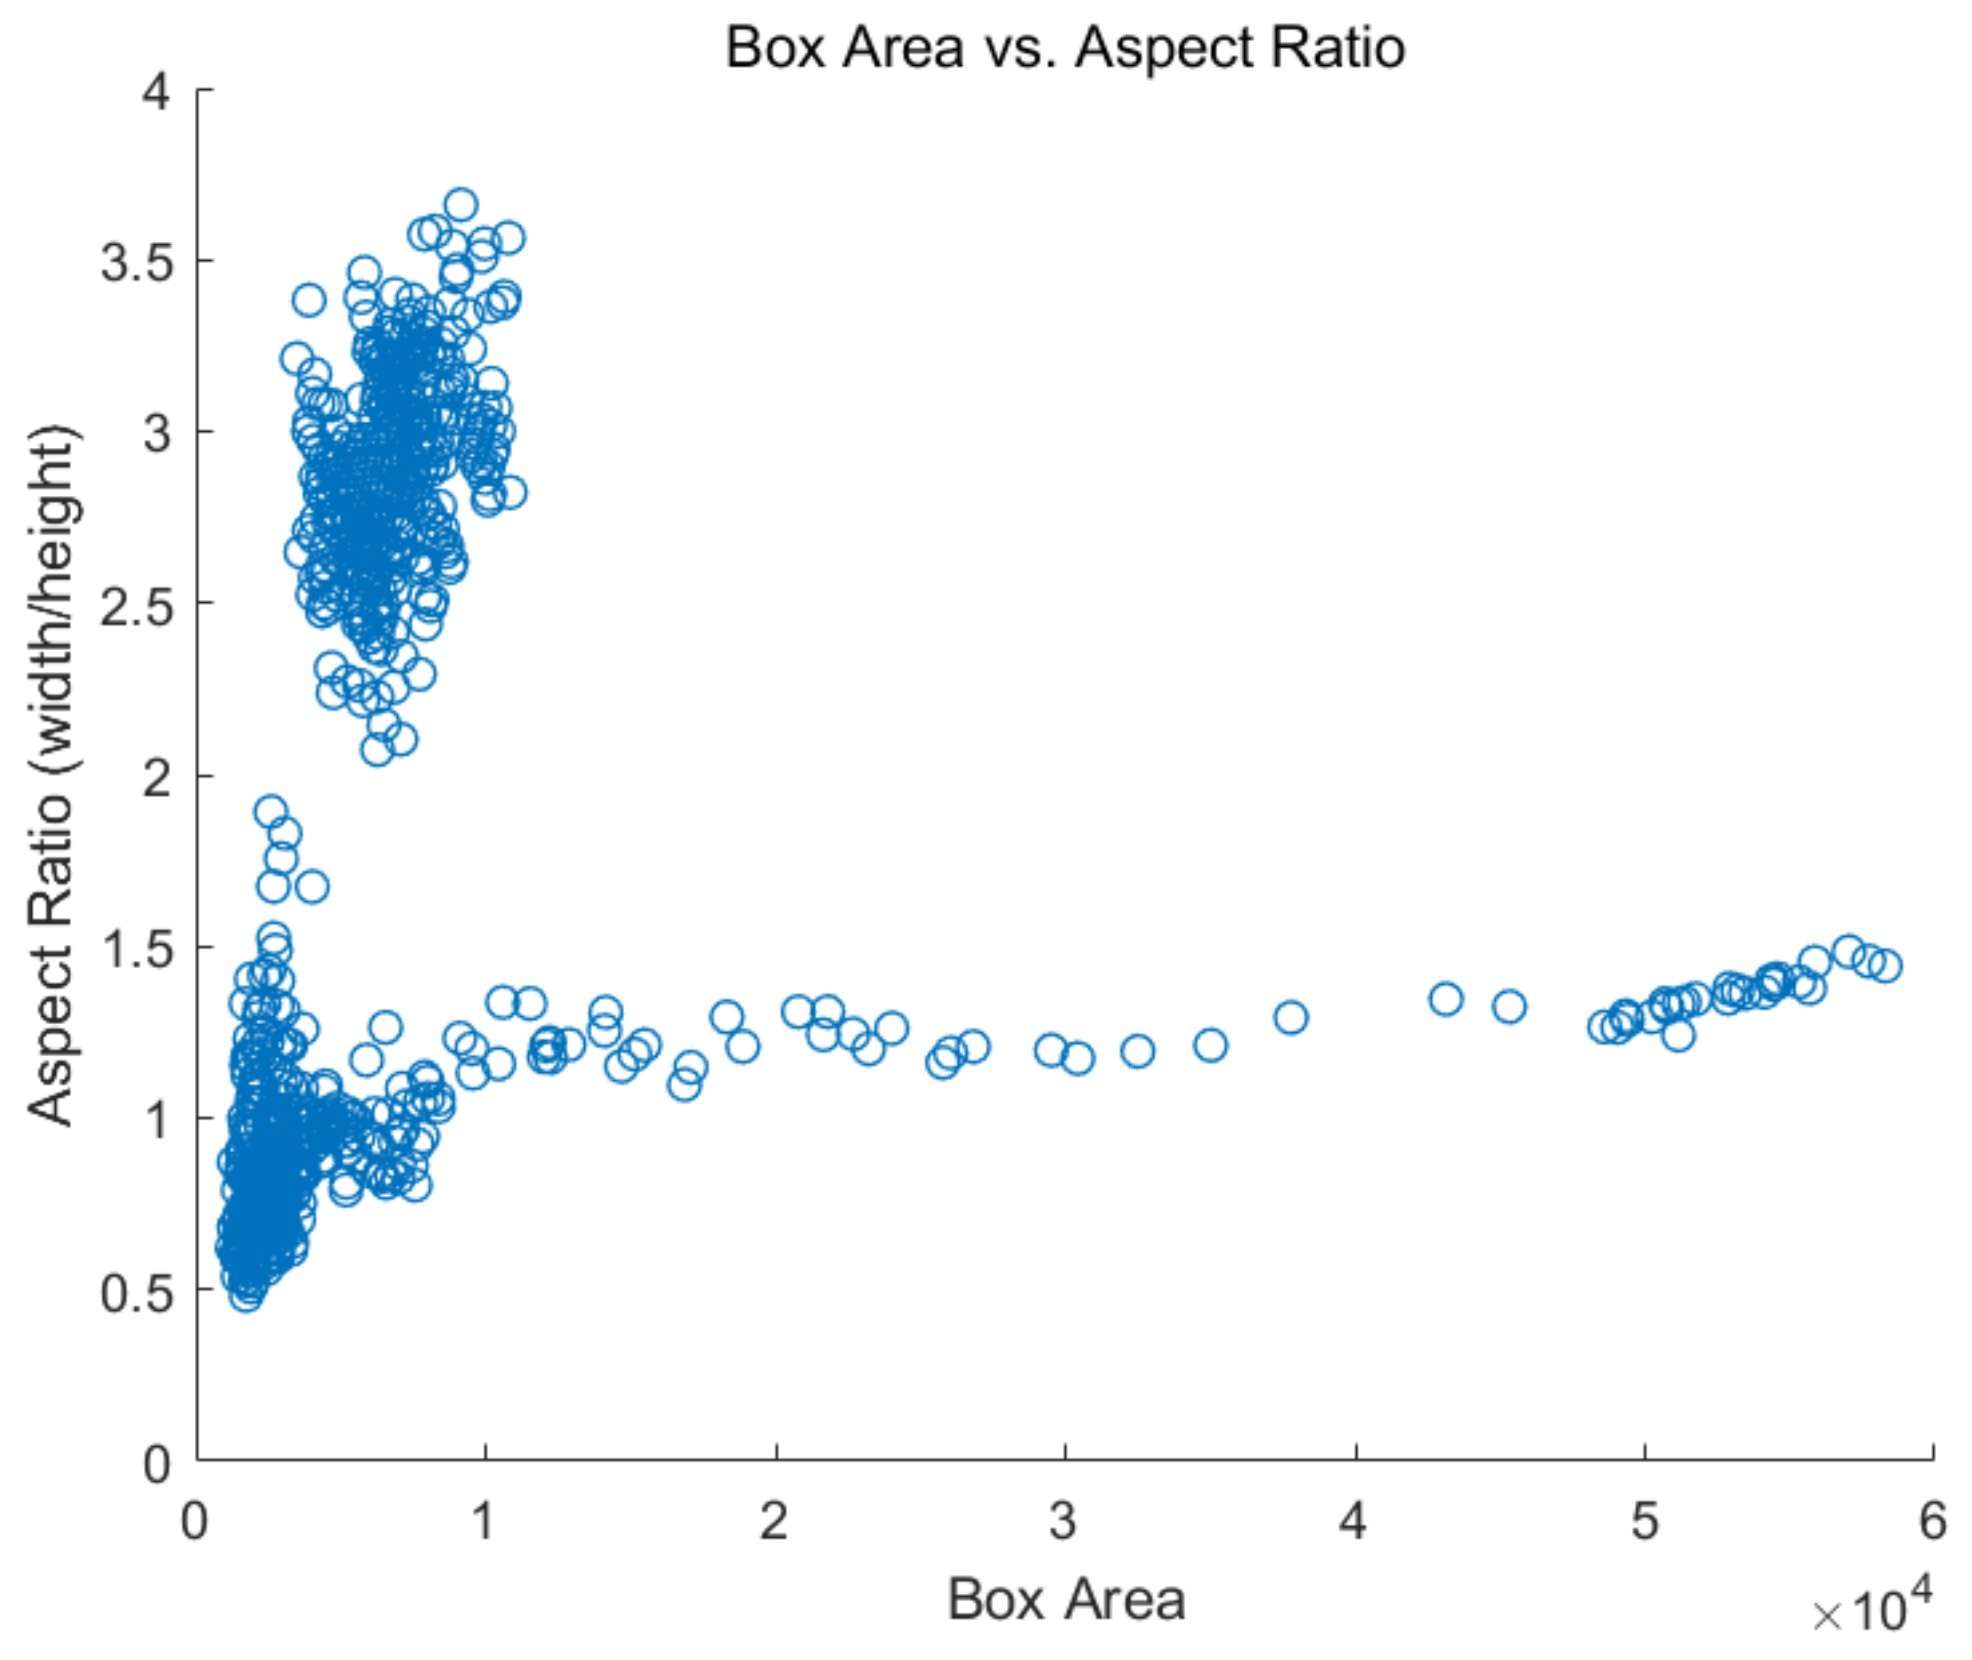
Since it is difficult for ordinary visual detection algorithms to detect runway targets from the enhanced image, a runway detection algorithm based on an improved Faster R-CNN is proposed. The ResNet101 model that is most suitable for the runway detection scene is selected, and the size of the anchor is tailored specifically according to the statistical analysis results of the runway ground-truth box label.
(3)
As an indirect result, this manuscript presents a complete system for fixed-wing UAVs landing at night by means of visual navigation.
The remainder of this paper is organized as follows. Section 2 describes the visible and infrared image fusion algorithm based on the objective function. Section 3 introduces the runway detection algorithm based on the improved Faster R-CNN. In Section 4, the relative attitude and position between the UAV and landing runway are calculated. Section 5 presents and analyzes the experimental results. Finally, the results of this study are summarized in Section 6.

2. Illuminance Enhancement Based on Visible and Infrared Image Fusion

The first step in vision-based fixed-wing UAV landing at night is image preprocessing, which aims to enhance the illuminance of the airborne image when the UAV lands at night to enable the subsequent runway detection algorithm to detect the runway. This section adopts the strategy of visible and infrared image fusion to realize low-illumination airborne image enhancement.

2.1. Establishment of Objective Function

Airborne image fusion has been utilized to generate an image with enhanced illumination and rich texture information. Therefore, the fused image should retain as much brightness and detailed appearance texture information as possible from the two images. The infrared, visible, and fused images are denoted as I, V, and F R m × n × 1 , respectively, m × n represents the size of image.
The texture information in the visible image is mainly characterized by the gradients. The area with a larger gradient value indicates that it contains richer detailed texture information. The thermal radiation information in an infrared image has pixel intensity characteristics. Runway objects usually have a high pixel intensity, which means that these have a high brightness in the infrared image. To improve the recognition ability of the runway detection algorithm, it is necessary to retain more feature information in the fused image. Therefore, as described in Equation (1), an empirical error formula for p norm measurement is established to constrain the fused image such that the fused image has a pixel gradient similar to the visible image, where ∇ is the gradient.
ε 1 ( F ) = 1 p F V p p
To ensure that the runway object in the fused image has a large brightness value, it is necessary to retain more radiation information (pixel intensity) from the infrared image so that the fused image has a brightness distribution similar to that of the infrared image. Therefore, the fused image is constrained by the following equation:
ε 2 ( F ) = 1 q F I q q
Combining Equations (1) and (2), the fusion problem can be transformed into minimizing the following objective function:
ε ( F ) = η ε 1 ( F ) + ε 2 ( F ) = η 1 p F V p p + 1 q F I q q
The first term in Equation (3) ensures that the fused image F retains as much gradient information of the visible image F as possible to retain more texture details. The second item ensures that the fused image F has a pixel intensity similar to that of the infrared image I. η is a positive parameter that controls the trade-off between the two items.
The gradient/texture in the visible image can be fused with the corresponding position in the infrared image through the objective Function (3). This ensures that the fused image retains the brightness of the infrared image visually as well as more runway appearance details. Therefore, we can obtain a brightness-enhanced fused image with a more complex scene performance and richer detailed features.

2.2. Solving Objective Function

This section solves the objective function (3). To enhance the brightness of the image, the fused image must retain the brightness information of I, i.e., most entries of F I should be zero. Simultaneously, to preserve the texture information (gradient) of the visible image V, a small number of entries may be significant. Therefore, the difference between F and I should be Laplace or pulsed, where the parameter q is set to 1. To maintain the sparsity of the gradient of the visible image, p = 0 is selected. Since, p = 0 is NP-hard, we set p = 1. Let Z = F V , then the fusion problem is transformed into the solution in Equation (4).
Z = arg min Z { i = 1 m n | Z i ( I i V i ) | + η J ( Z ) } J ( Z ) = i = 1 m n | i Z | = i = 1 m n ( i h Z ) 2 + ( i v Z ) 2
where i = ( i h , i v ) represents the image gradients ∇ at pixel i, i h F = F i F r ( i ) , and i v F = F i F b ( i ) ; and r ( i ) and b ( i ) represent adjacent points below and to the right of pixel i. The objective function (4) is convex; hence, it has the optimal solution. The gradient descent method in [13] is used to solve Z , and the optimal fused image is obtained from F = Z + V . In this way, the enhanced image can retain more feature information while increasing the illuminance, thus improving the accuracy of runway recognition at night.
The process of the proposed visible and infrared image fusion algorithm is described below in Algorithm 1.
Algorithm 1 Visible and infrared image fusion algorithm.
Input: visible image I, infrared image V, parameter η
Output: fused image F
1:
Calculating the error between F and V and I respectively: ε 1 ( F ) = 1 p F V p p and ε 2 ( F ) = 1 q F I q q .
2:
Combining the two errors by ε ( F ) = η 1 p F V p p + 1 q F I q q .
3:
Transferring the fusion problem to solve Z = arg min Z { i = 1 m n | Z i ( I i V i ) | + η J ( Z ) } .
4:
Computing Z using the gradient descent method [13].

3. Runway Detection Based on Improved Faster R-CNN

Traditional target-detection technologies have three steps: region selection, feature extraction, and feature classification [14]. The most commonly used region selection algorithm is the sliding window algorithm. However, its high computational complexity makes it difficult to detect the runway in real time. Therefore, this method is unsuitable for the vision-based autonomous landing of fixed-wing UAVs. In the feature extraction stage, commonly used algorithms include scale-invariant feature transform (SIFT) and histogram of oriented gradients (HOG). These types of extractors have fewer parameters, low robustness of manual design, and low quality of feature extraction. Therefore, these are also unsuitable for detecting runways whose point-line characteristics are not very obvious. The learning-based object detection algorithm uses a neural network for feature extraction. It can extract features with improved robustness and semantics, whereas the classifier has better performance and detection results. Due to such advantages, a learning-based object detection algorithm is used for runway detection in this study.
There are two types of learning-based object detection: single-step detection, such as Yolo [15] and SSD [16]; and two-step detection, such as Fast R-CNN [17], Faster R-CNN [18], and R-FCN [19]. Compared with the single-step detection algorithm, the two-step detection algorithm has a high detection accuracy and favorable outcomes. Since the Faster R-CNN directly uses a region proposal network (RPN) to generate detection boxes, the algorithm speed is significantly improved. Therefore, the runway detection algorithm proposed in this study is designed based on the Faster R-CNN architecture.
The Faster R-CNN has achieved excellent performance in multi-class object detection in many fields, such as multi-class fruit detection [20], multi-object recognition in the complex traffic environment [21], aerial target detection [22], and aircraft dents detection [23]. However, it has not been applied to runway detection in airborne images. This paper proposes an improved Faster R-CNN to detect runways, as shown in Figure 3. The framework consists of two modules: an RPN and a Fast R-CNN detector. Firstly, the RPN processes feature maps to generate multiple region proposals that may contain airports. Secondly, the Fast R-CNN module takes the feature maps and region proposals as inputs, which are then processed by a full connection layer, loss function, and boundary box regression function. Finally, the accurate object category and object box are generated.

3.1. Region Proposal Network

When an image is input into the Faster R-CNN, it first utilizes a set of basic CNNs to extract features from the input image. Then, the CNN generates a feature map for the RPN module and region of interest (ROI) pooling layer, as shown in Figure 3. CNNs frequently used in Faster R-CNN include VGGNet [24], GoogLeNet [25], and ResNet [26]. In the experimental section, VGG19, Inception V4, and ResNet101 were selected as CNN models for feature extraction; their runway detection performance was compared and analyzed.
The RPN is a full CNN that takes the feature map output by the CNN as the input, generates multiple candidate regions with different scales and aspect ratios, and transmits them to the Fast R-CNN module. The RPN structure, shown in Figure 4, adopts the sliding window strategy. A 3 × 3 window is used to slide on the feature map generated by the last layer, and a short feature vector is generated and input into two full connection layers: the classification layer and boundary box regression layer. The number of candidate boxes generated at each location is k. Each candidate box is encoded with four coordinates; hence, the boundary box regression layer has 4k outputs. The classification layer outputs 2k scores to estimate the probability that the candidate region is or is not the object. These k parameterized candidate boxes are known as anchors.
The default parameter of the anchor in the Faster R-CNN is [ 128 2 , 256 2 , 512 2 ] , and the number of anchors is 9. The efficiency and accuracy of the detector are closely related to the shape, aspect, and number of anchors [27]. Through the statistical analysis of the runway ground-truth box in the airborne image dataset with a resolution of 1224 × 520 , the relationship between the number of anchors and mean Intersection over Union (IoU) is shown in Figure 5. It can be seen that when the number of anchors is 1–4, the mean IoU significantly increased with the increase in the number of anchors. When the number of anchors is 4–15, the rate of increase of the mean IoU slowed down, and decreased when the number of anchors is 8 and 12, respectively. Considering the speed and accuracy of detection, the number of anchors was set as 9 in this study.
Figure 6 shows the statistical analysis results for the width–height ratio and size of the runway ground-truth box in the dataset. It can be seen that the aspect ratios of the ground-truth box in the dataset ranged from 0.5 to 1.5, and 2.3 to 3.5, while the size ranged from 0 to 10,000. To improve the generalization performance and robustness of the Faster R-CNN for runway detection, nine anchors were designed that met the requirements of a runway detection application scenario. Those anchors were designed by using a K-means cluster analysis algorithm which uses the intersection-over-union (IoU) distance metric to cluster together boxes of similar aspect ratios and sizes, which ensure that the estimated anchors fit the ground-truth size of the runway. When the number of anchors has been determined, the algorithm outputs the specified number of anchor sizes. The anchor sizes are [60, 50], [195, 263], [49, 144], [100, 122], [79, 76], [44, 118], [54, 167], [49, 41], and [140, 169].

3.2. Fast R-CNN Detector

As shown in Figure 3, multiple ROIs were input into the Fast R-CNN detector. For each ROI, the ROI pooling layer extracts a fixed-length feature vector from the convolutional layer. Each feature is input into the fully connected layer. The final outputs of the Fast R-CNN detector through the softmax layer and bounding box regression layer are the object category and the bounding box. The object category calculates the probability score of proposal A that belongs to the A category; the bounding box uses bounding box regression to correct the position of each proposal detection box to obtain a more accurate bounding box position. In this study, the object class contains only one object, ‘runway’, A = 1.
The position regression loss and classification loss functions of an object [18] are expressed as
L ( { p j , t j } ) = 1 N c l s j L c l s ( p j , p j ) + λ 1 N r e g j p j L r e g ( t j , t j )
where j is the index of an anchor in a mini batch. N c l s and N r e g are the normalized parameters and balanced weighted by λ . The values of N c l s , N r e g , and λ are 256, 2400, and 10, respectively, which indicate that the weights of cls and reg are approximately equal.
L c l s ( p j , p j ) = log [ p j p j + ( 1 p j ) ( 1 p j ) ]
p j is the prediction probability of anchor j as the object. If the anchor is positive, then the ground-truth label p j = 1; otherwise, it is 0.
L c l s ( t j , t j ) = j { x , y , w , h } s m o o t h L 1 ( t j t j ) s m o o t h L 1 ( x ) = 0.5 x 2 , if x < 1 x 0.5 , otherwise
t x = x x a w a , t x = y y a h a t w = log ( w w a ) , t h = log ( h h a ) t x = x x a w a , t y = y y a h a t w = log ( w w a ) , t h = log ( h h a )
where x and y are the central coordinates of the bounding box; w and h are the width and height of the bounding box; and x, x a , and x are the prediction box, anchor box, and ground-truth box, respectively. The definitions of y, w, and h are similar.

4. Landing Parameter Calculation

As mentioned in Section 1, a vision-based night-landing system should solve three problems: (1) low-light airborne image enhancement, (2) landing runway detection, and (3) estimation of the relative attitude and position between the UAV and runway. Since the problems associated with the low-light airborne image enhancement and landing runway detection have been addressed in Section 2 and Section 3, the current section focuses on estimating the relative attitude and position between the UAV and runway.

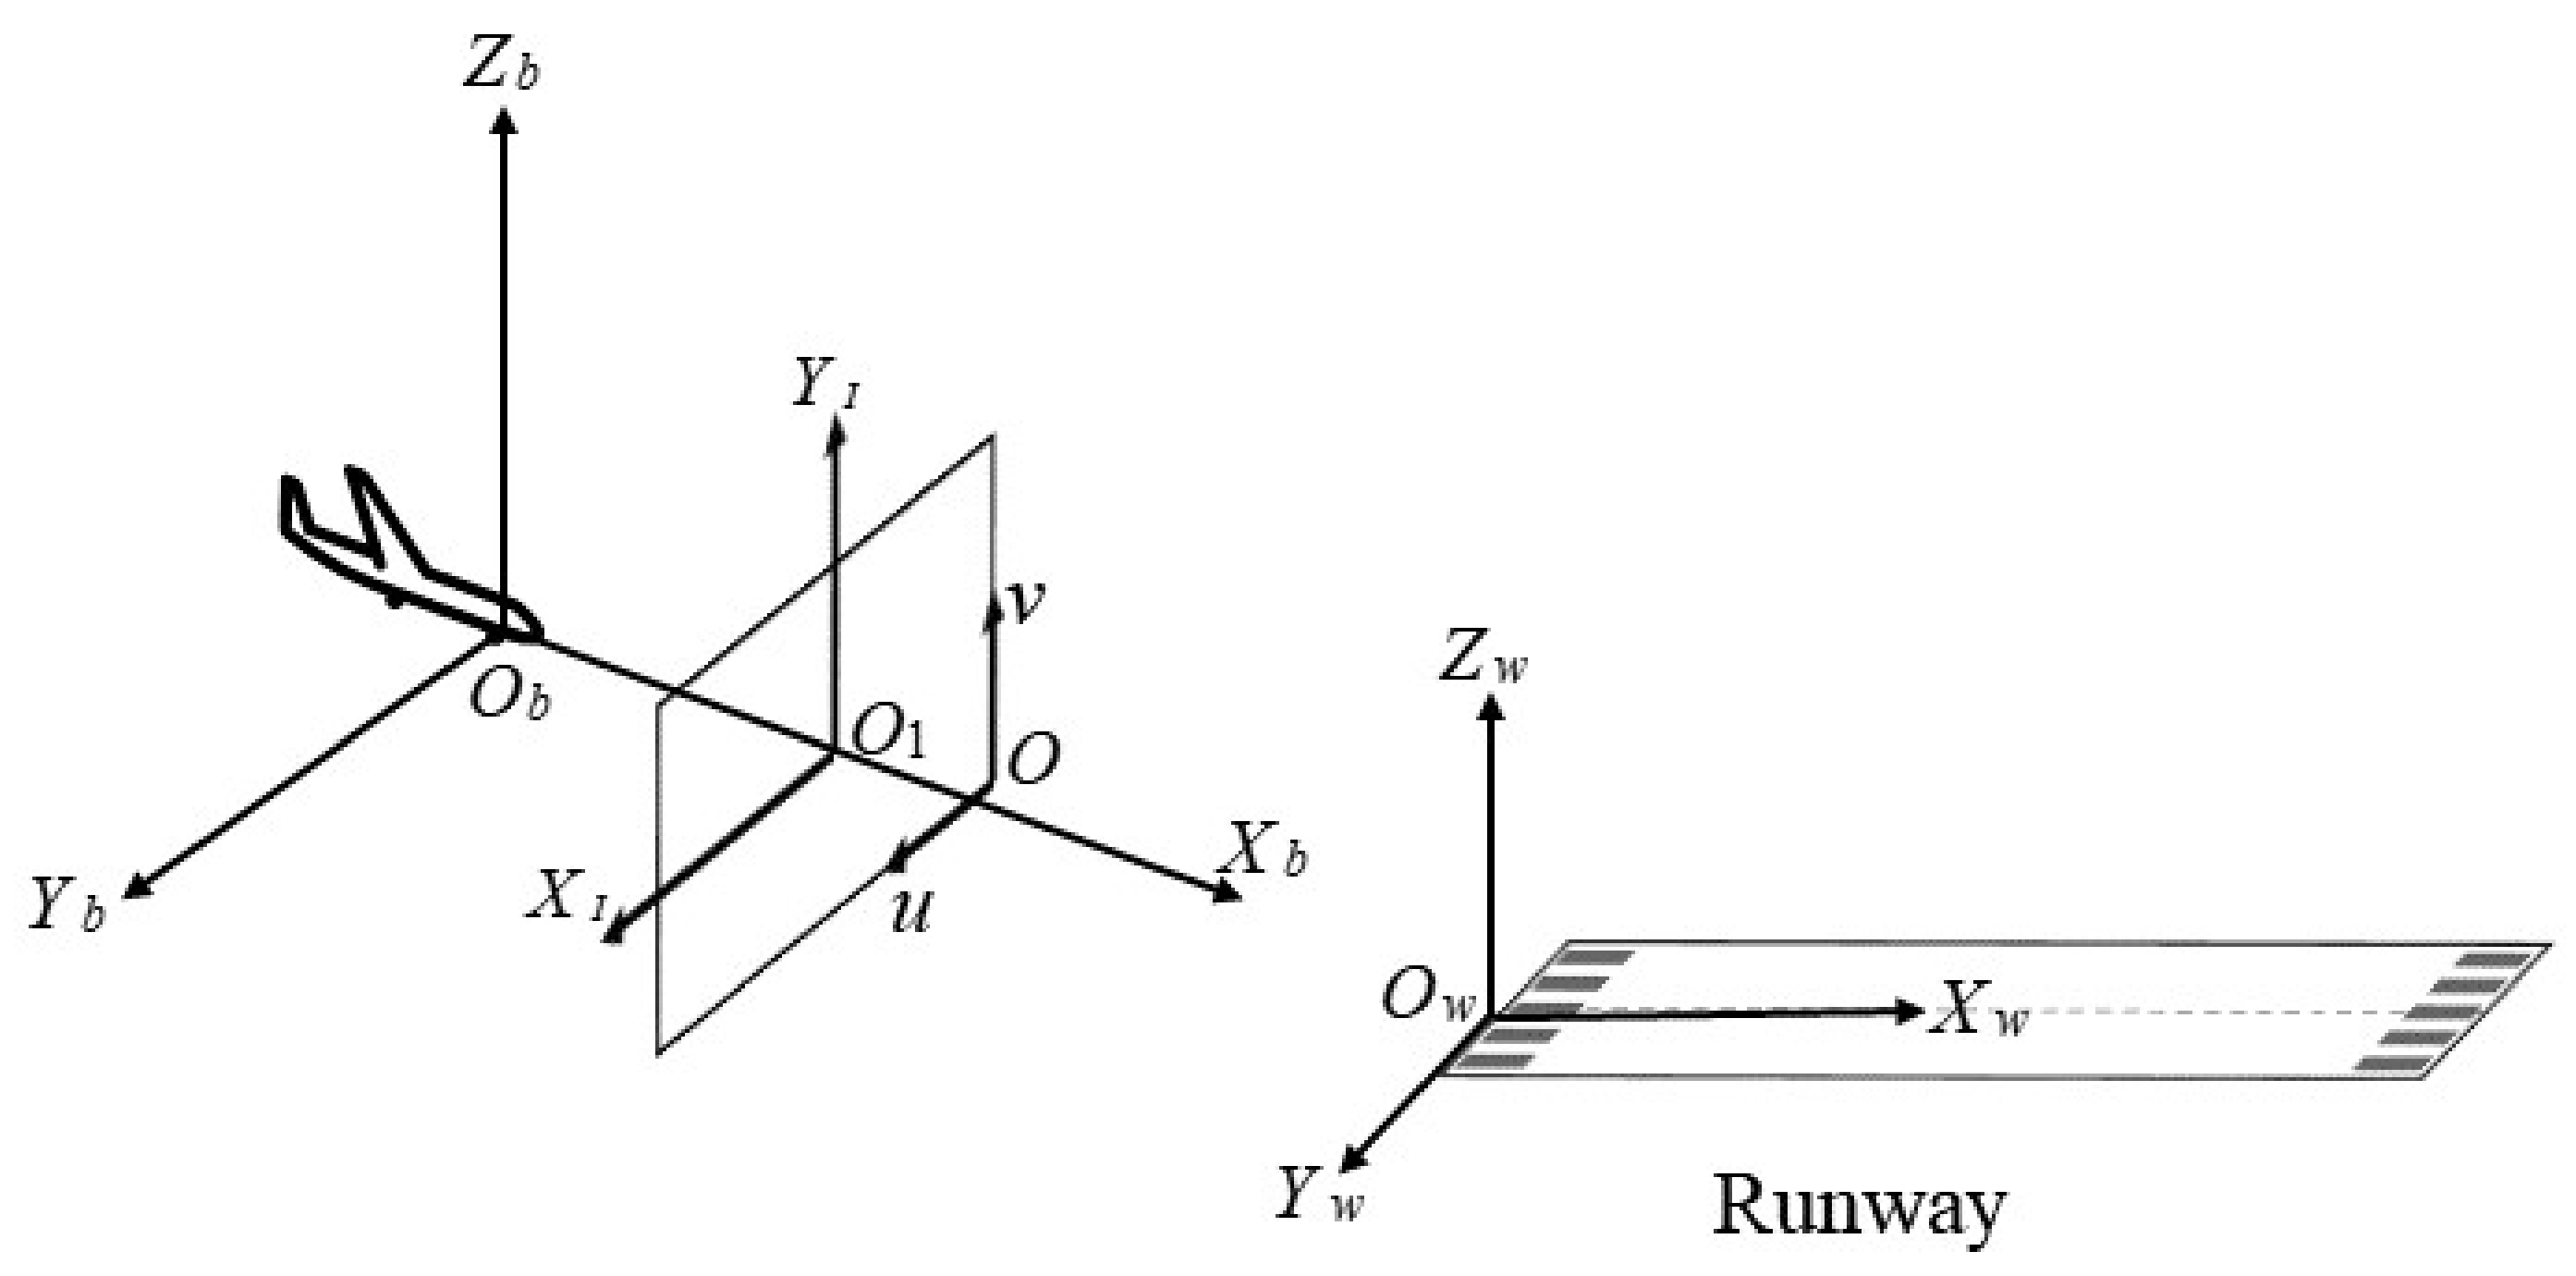
4.1. Construction of Reference Coordinate System

The first step in the estimation of vision-based navigation parameters is to establish the mapping relationship between the position of a point in space and its position in the image. Figure 7 shows the four coordinate systems, elaborated below, that were constructed.
(1)
Earth-fixed coordinate system ( O w X w Y w Z w ) : the origin of Earth-fixed coordinate system can be fixed anywhere. Since the study only focuses on the attitude and position of the UAV relative to the runway, the Earth-fixed coordinate system was set at the runway plane.
(2)
Camera reference coordinate system ( O b X b Y b Z b ) : the camera was fixed at the center of the UAV body. Thus, the body coordinate system and camera reference coordinate system are the same.
(3)
Image coordinate system ( O I X I Y I ) : the origin O I of Image coordinate system is the intersection of the camera optical axis O b X b and the image plane, usually the image center point.
(4)
Pixel coordinate system ( O u v ) : the Pixel coordinate system is established on the pixel plane, and the unit is pixel. The digital image is stored in the form of M × N , so the pixel coordinate ( u , v ) represents the position of the pixel in the array M × N .
According to the pinhole imaging model, the homogeneous relationship between position ( X b , Y b , Z b ) of a space point P in the camera reference coordinate system and the corresponding point p ( X I , Y I ) in the image coordinate system is
α X I Y I 1 = f 0 0 0 0 f 0 0 0 0 1 0 X b Y b Z b 1
where α is the scale factor and f is the focal length of the camera.
The homogeneous relationship between the point p ( u , v ) in the pixel coordinate system and the point p ( X I , Y I ) in the image coordinate system is
u v 1 = 1 d x 0 u 0 0 1 d y v 0 0 0 1 X I Y I 1
The conversion relationship between the pixel coordinate system and camera reference coordinate system can be obtained from Equations (9) and (10) as
α u v 1 = f d x 0 u 0 0 f d y v 0 0 0 1 f 0 0 0 0 f 0 0 0 0 1 0 X b Y b Z b 1 = K I 0 X b Y b Z b 1
where K is the calibration matrix of the camera, describing the intrinsic parameters of the camera, which is a necessary parameter for relative attitude and position estimation.
The coordinate correspondence of point P in the camera reference coordinate system ( X b , Y b , Z b ) and the Earth-fixed coordinate system ( X w , Y w , Z w ) can be expressed by the rotation matrix R and translation vector T.
X b Y b Z b 1 = R T 0 T 1 X w Y w Z w 1
Substituting Equation (12) into Equation (11) yields a homogeneous mapping relationship between the point p in the pixel coordinate system and the point P in the Earth-fixed coordinate system.
α u v 1 = K I 0 R T 0 T 1 X w Y w Z w 1 = K R T X w Y w Z w 1
From Equation (13), the relationship between the pixel coordinate system and the Earth-fixed coordinate system can be determined by K, R, and T. Therefore, the core problem of determining the relative attitude and position between the UAV and landing runway is solved by calculating the R and T.

4.2. Calculation of Relative Attitude and Position

The main problem discussed in this section is the calculation of the R and T. In general, calculation methods for the R and T can be classified into two types: linear and nonlinear. The linear method has poor robustness and accuracy, making it is unsuitable for the autonomous landing of fixed-wing UAVs. Nonlinear methods, such as the Gauss–Newton and Levenberg–Marquardt methods, can overcome such problem. However, the hundreds of iterations required by these methods result in low efficiency and poor real-time performance. To optimize the number of iterations and improve the convergence speed, Lu et al. [28] proposed an OI algorithm that transformed the attitude estimation problem into an object-space collinear error minimization problem that could globally converge in five to ten iterations. This paper proposes a relative attitude and position calculation method based on OI.
We designed three feature-point layout schemes on the runway, as shown in Figure 8a–c. These feature points can be detected by image segmentation technology.
In the above three schemes, the coordinates of the feature points in the Earth-fixed coordinate system and camera reference coordinate system are P r w = X r w Y r w Z r w and Q r b = X r b Y r b Z r b , respectively, where r = 1 , 2 , , , s ; s 5 . According to the relationship between these two coordinate systems, the relationship between P r w and Q r b is
Q r b = R P r w + T
The estimation of the rotation matrix R and translation vector T can be converted into a least-squares problem.
min R , T r = 1 n R P r w + T Q r b 2 s . t . R R T = I , det ( R ) = I
Through the OI algorithm, the solution of Equation (15) is transformed into an iterative process to calculate R and T. Then, the relative attitude and position between the UAV and runway can be obtained.

5. Simulation Results and Discussion

This section discusses the capabilities of the proposed algorithm, including visible and infrared image fusion, landing runway detection, and UAV landing parameter calculation.

5.1. Simulation Dataset Setup
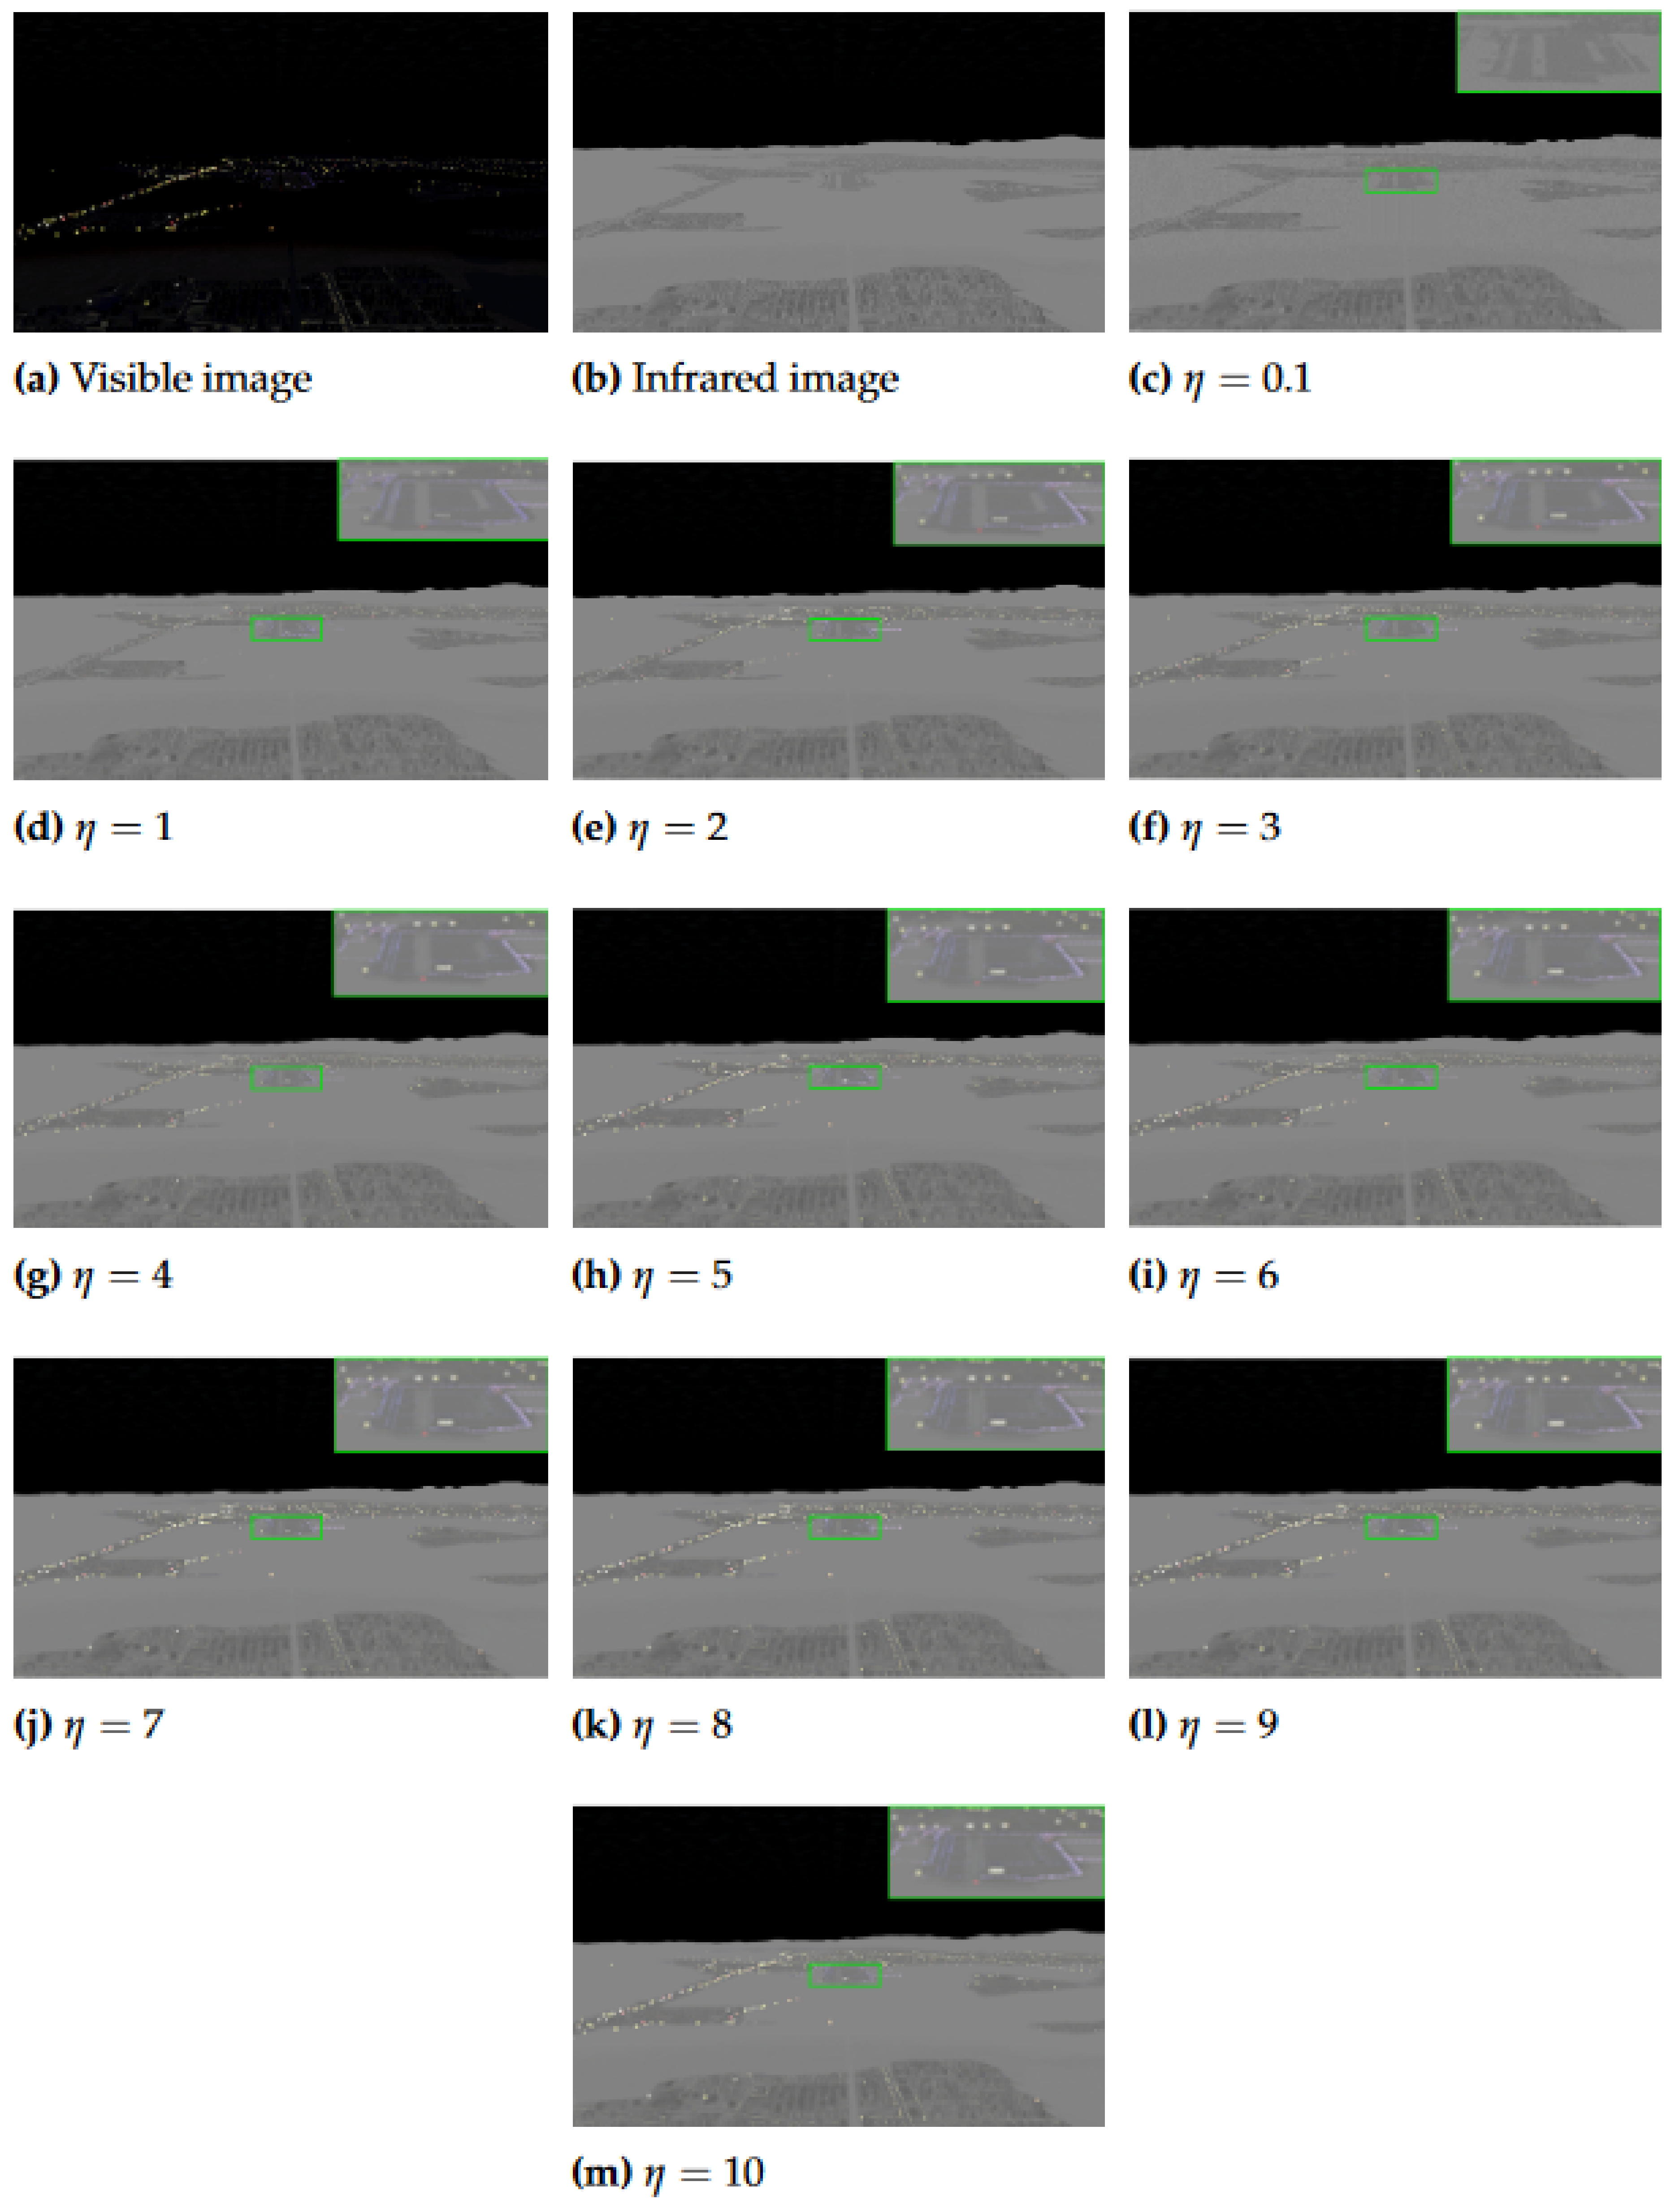
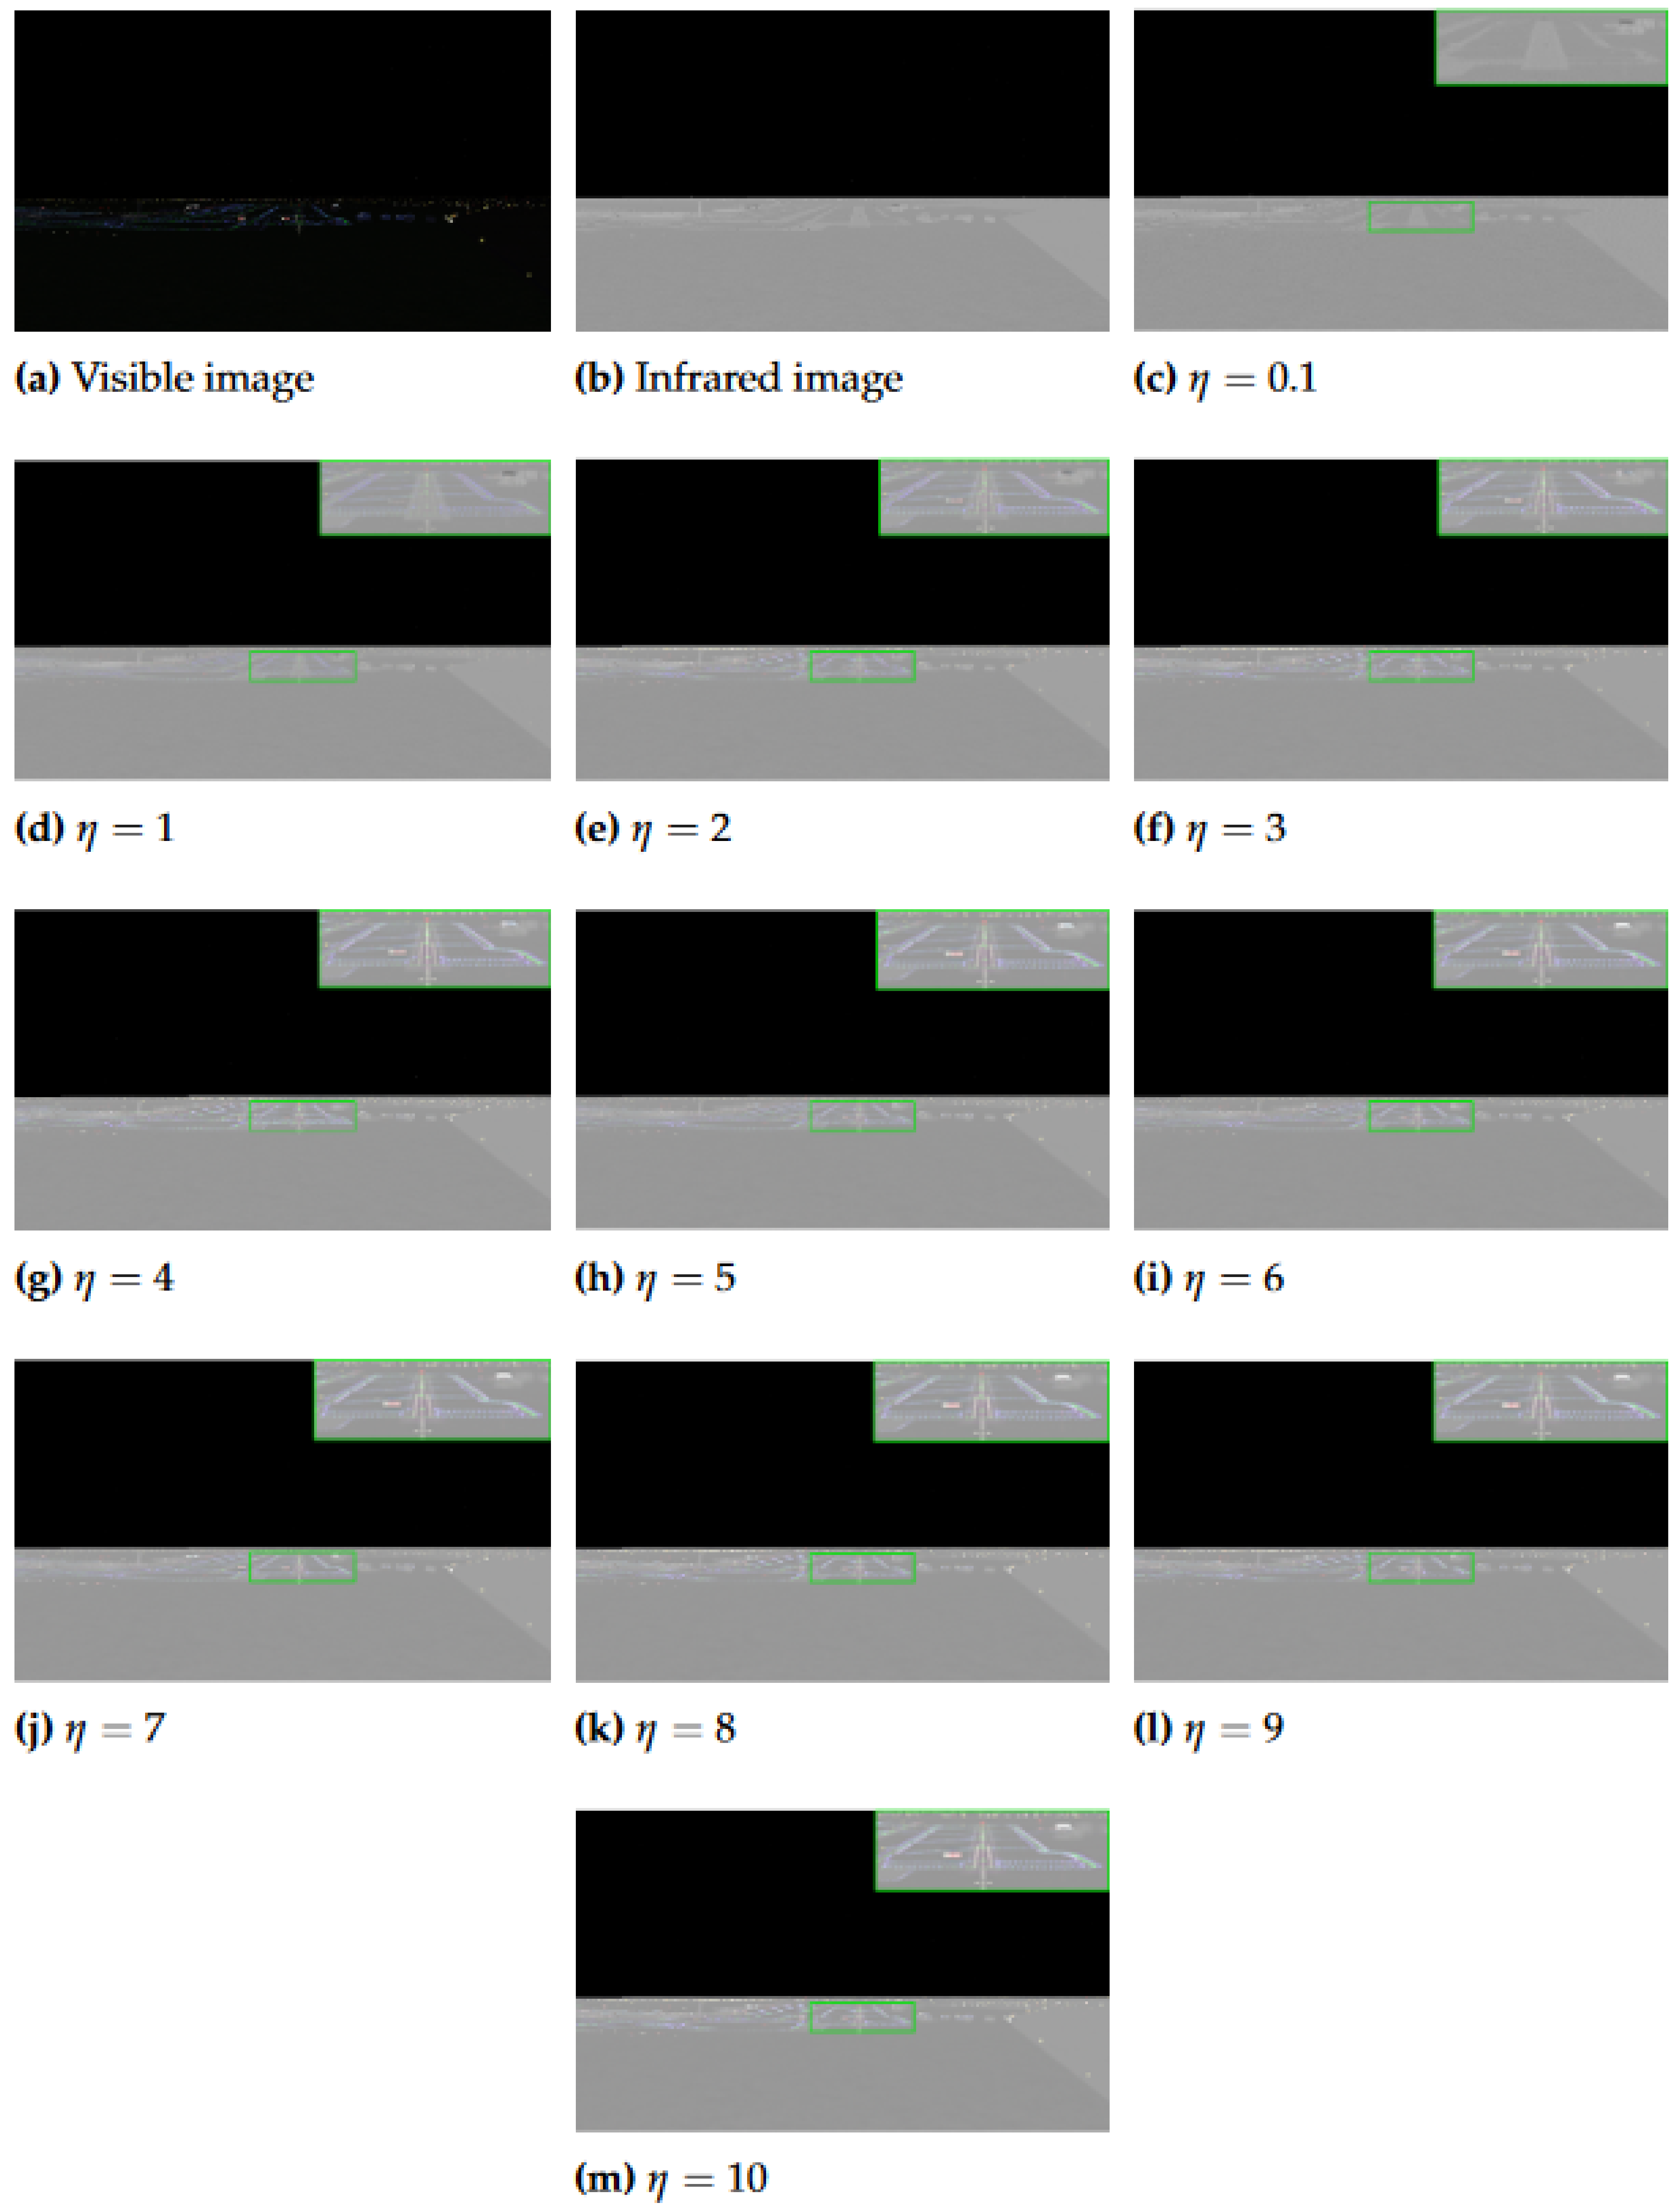
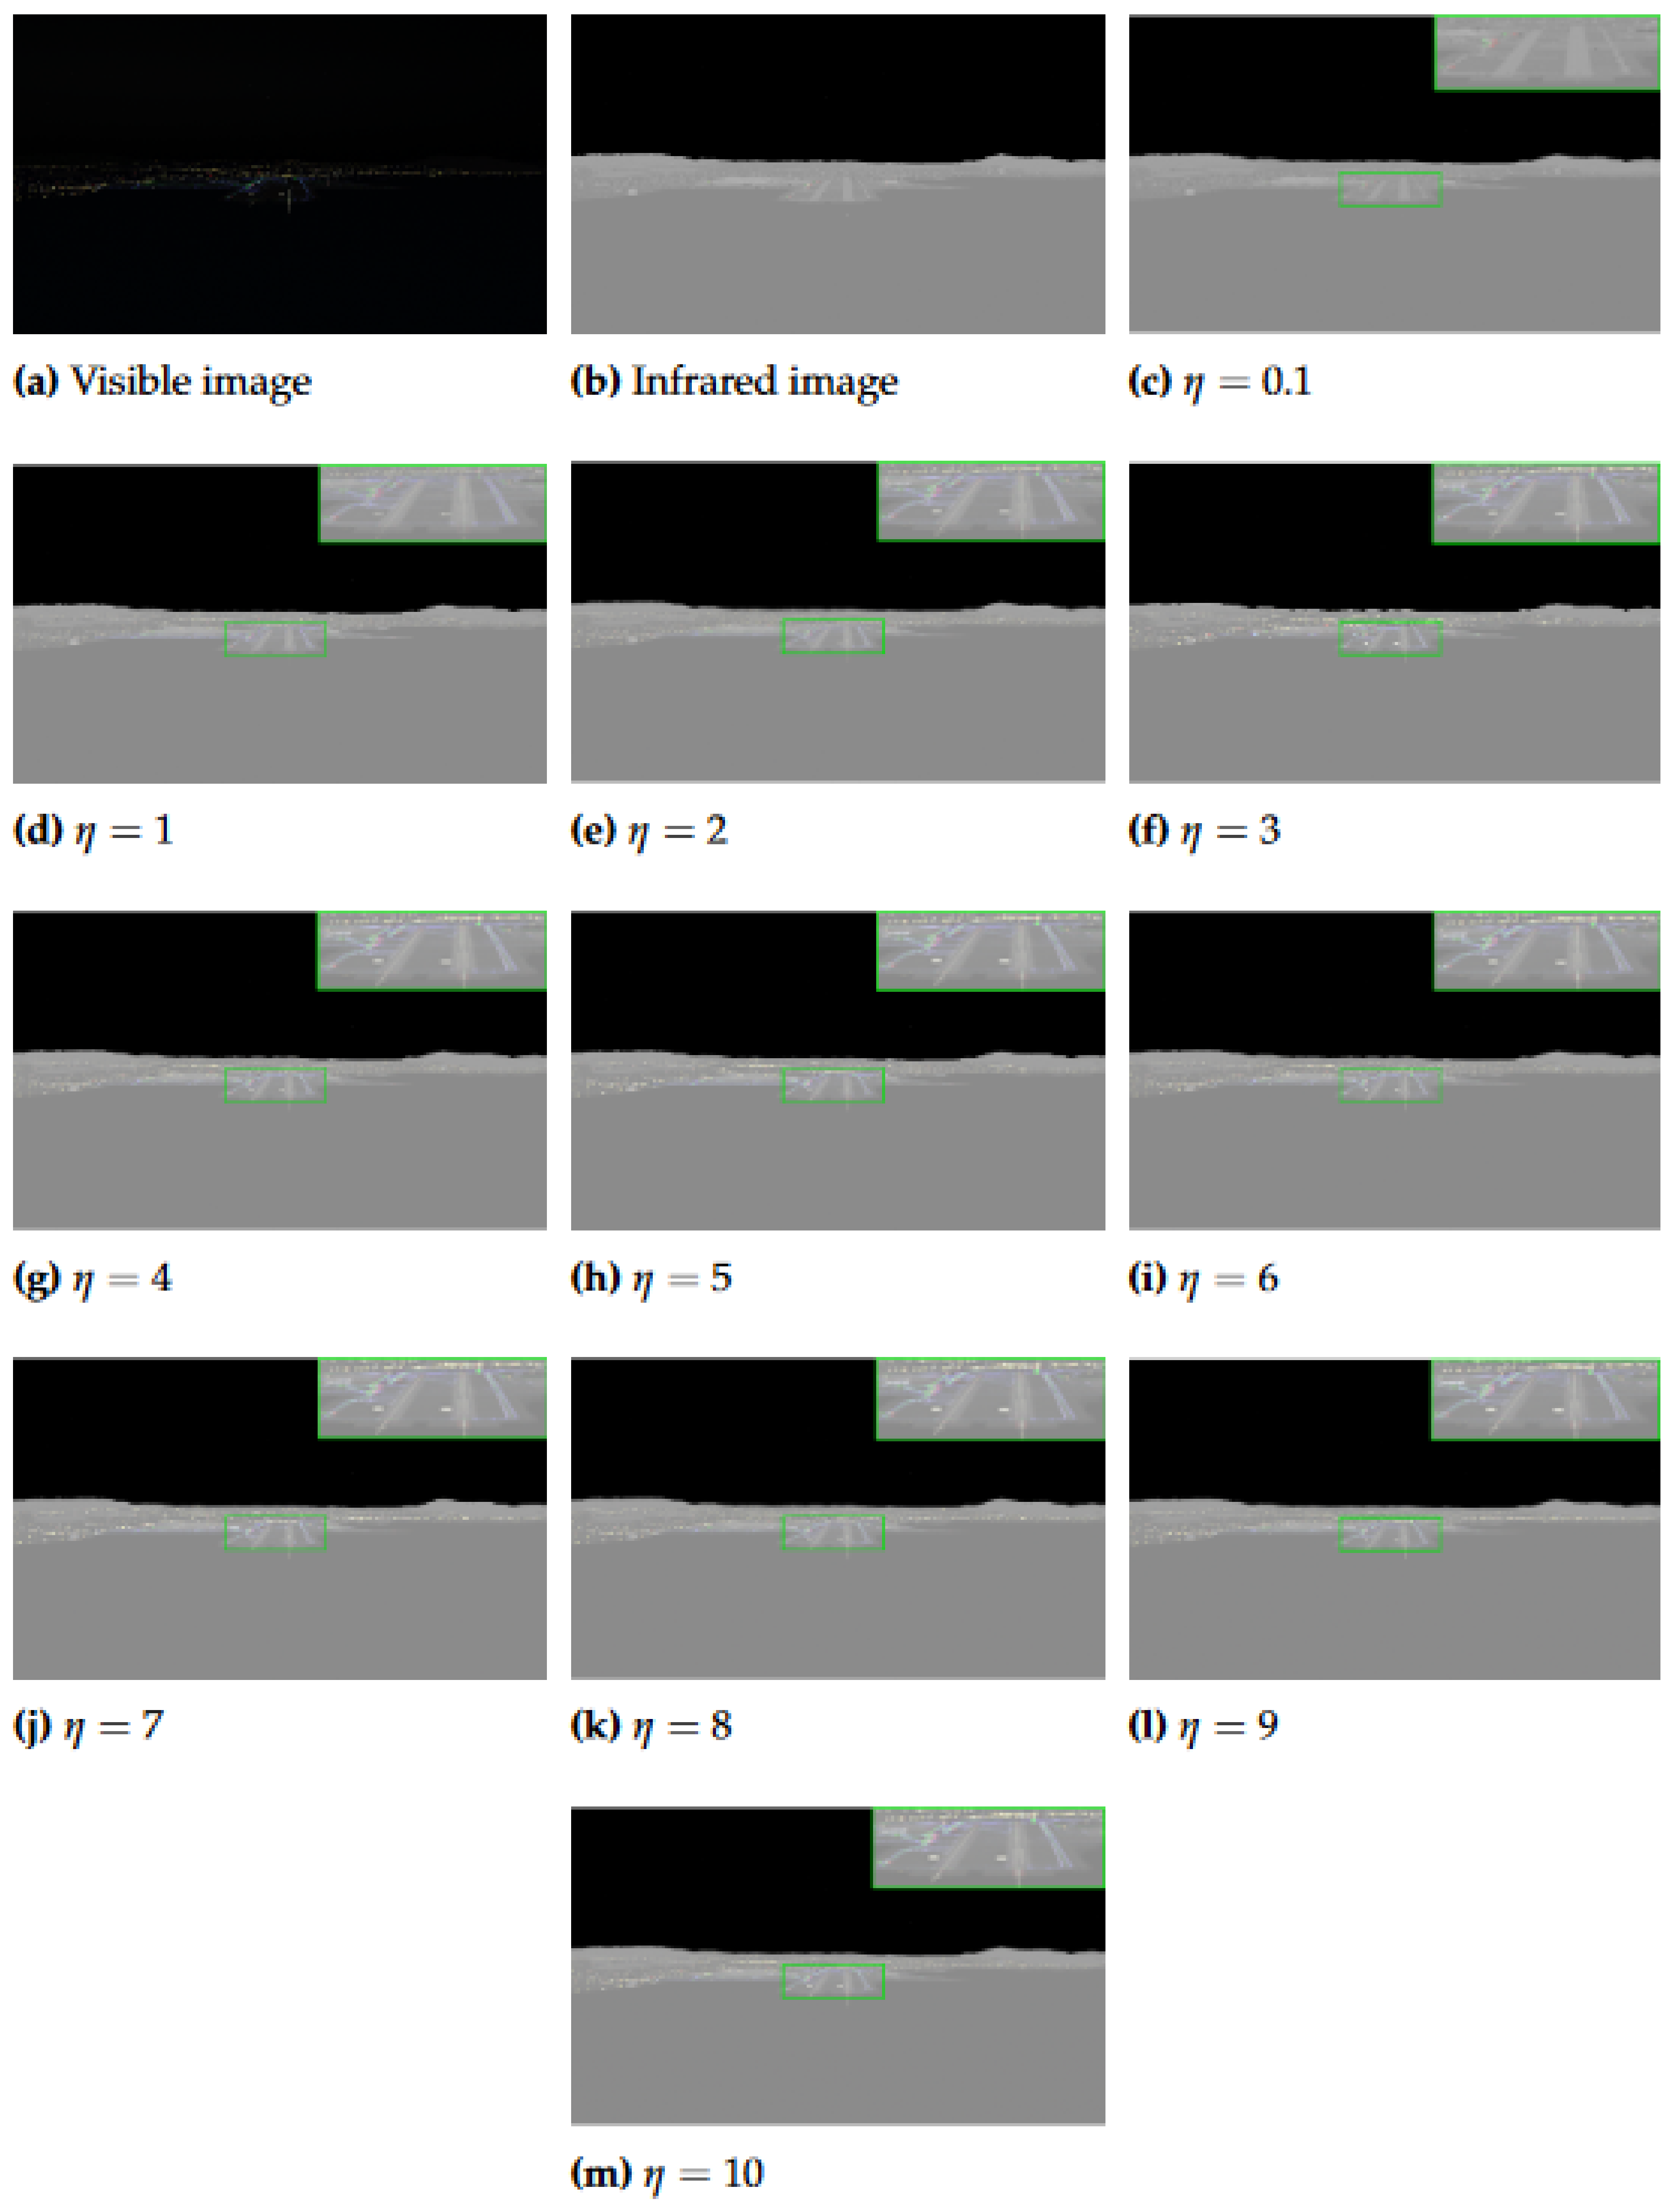
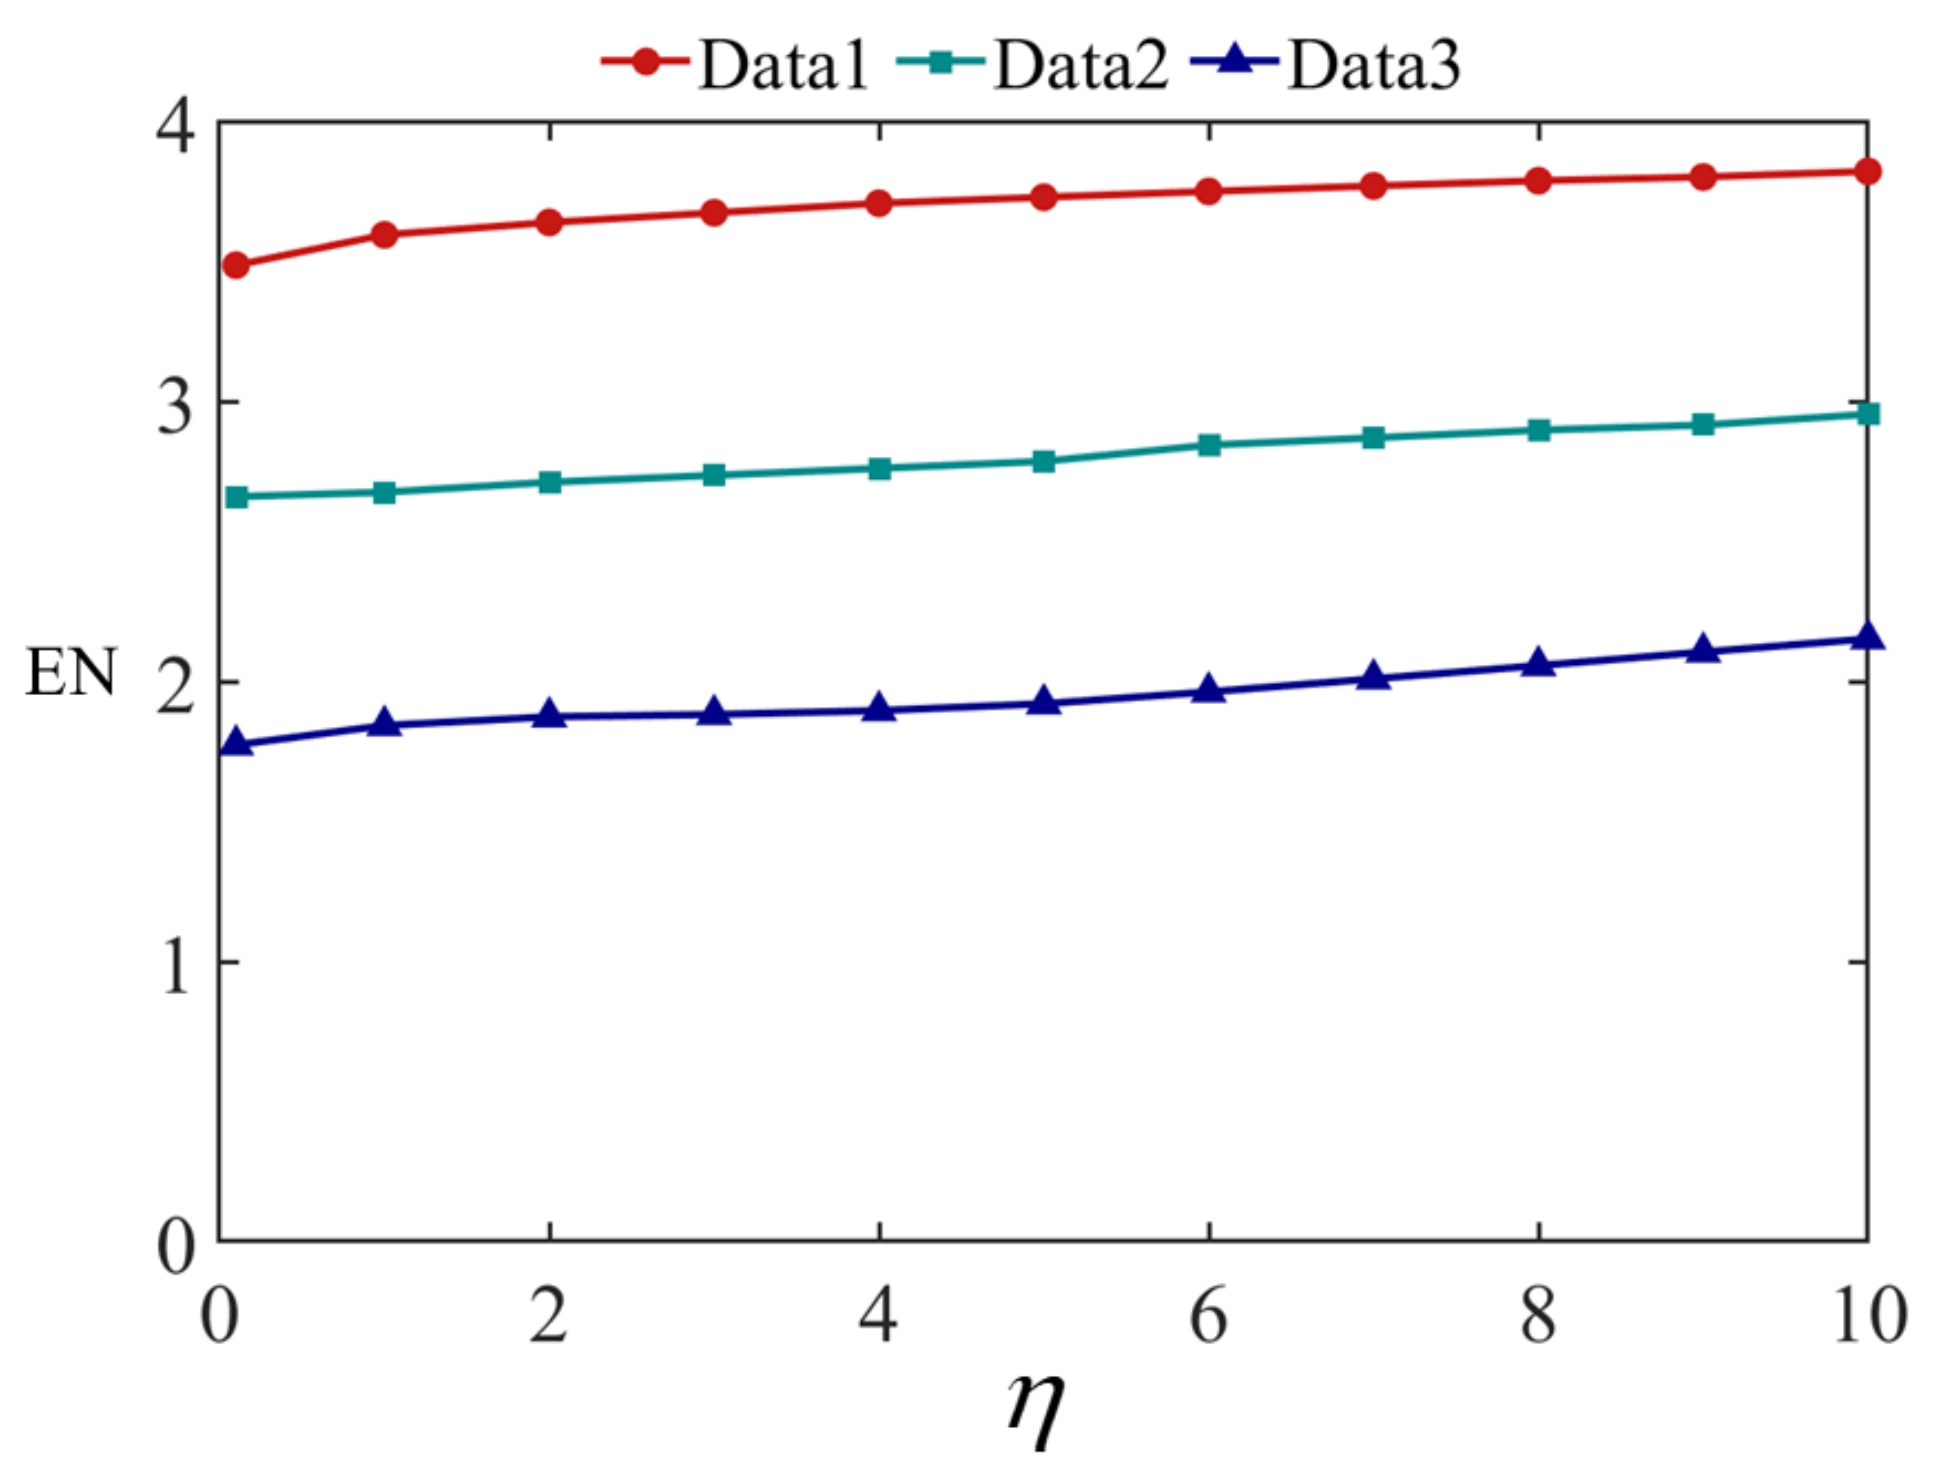
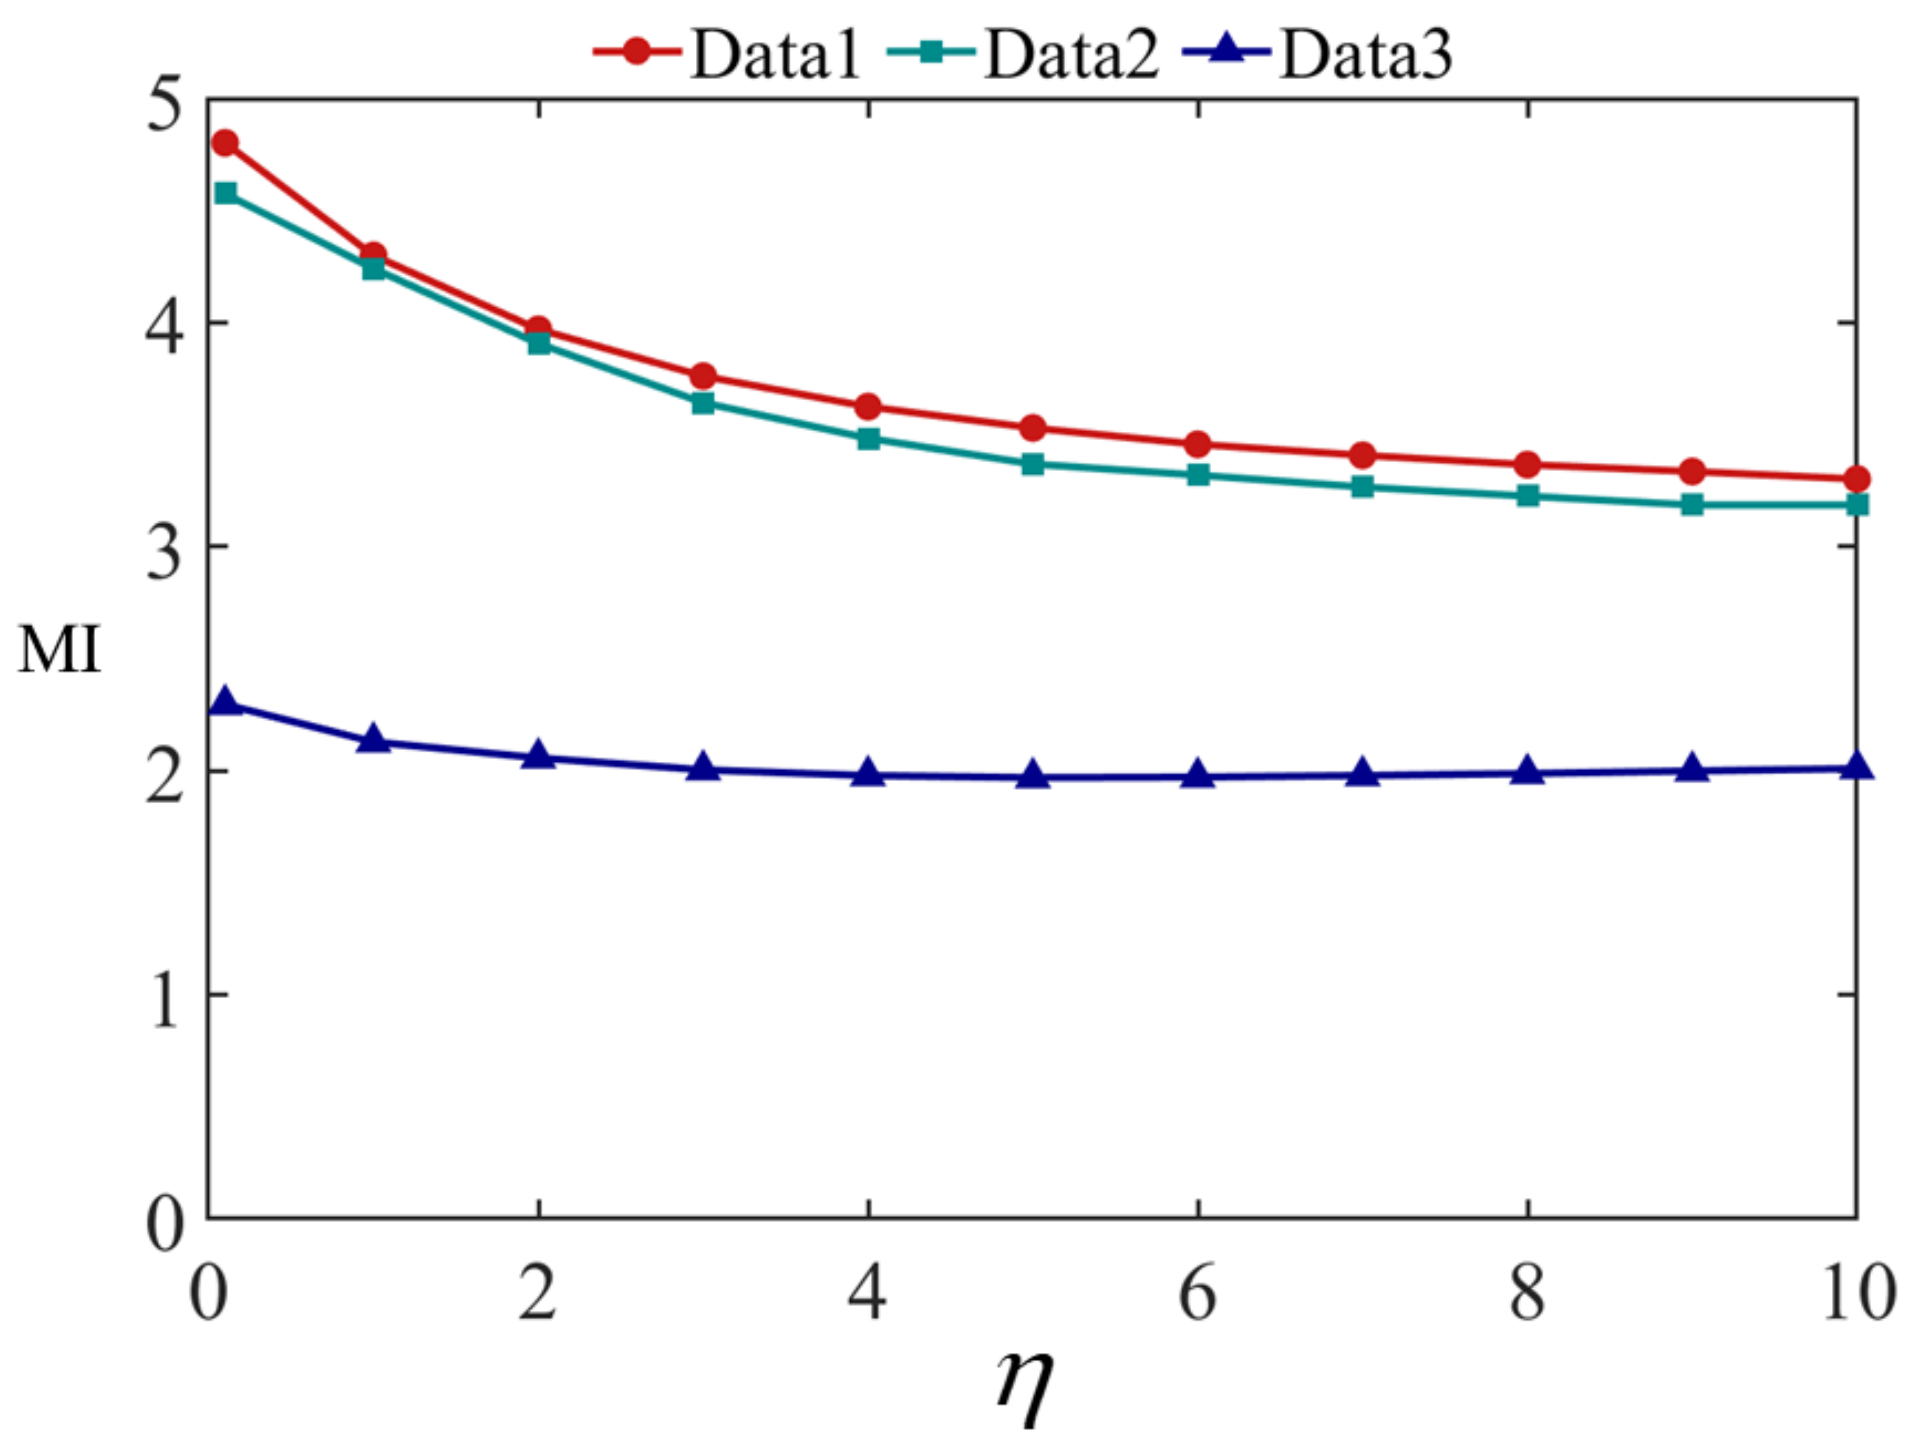
In this study, three real-world airports in different environments were set in the flight simulation software FlightGear 2020.3 [29]: Data 1—Livermore Municipal Airport (Livermore, California, USA) located in an urban environment; Data 2—George Bush Intercontinental Airport (Houston, Texas, USA) located in an open environment; and Data 3—San Francisco International Airport (San Francisco, CA, USA) located along the coast. A fixed-wing UAV, i.e., MQ-9, which contains a visible/infrared dual light pod module was selected to land at the three airports. The visible and infrared images are collected during MQ-9 autonomous landing process at night. Figure 9 shows the MQ-9. The MQ-9 properties are presented in Table 1. A total of 1500 visible images and 1500 infrared images were collected. Images of the three airports are shown in Figure 10. The characteristics of the three airports are listed in Table 2.
The simulation was implemented using the Flightgear and MATLAB 2020b on a computer equipped with an Intel Core i7–9700KF CPU and NVIDIA GeForce RTX2070Super GPU.

5.2. Fusion Experiment when η Changes

In the proposed fusion algorithm, the weight parameter η controls the information preservation trade-off between the visible and infrared images. By setting different η values, the brightness and texture information of the fused image can be adjusted. Therefore, the weight parameter η affects the fusion results. This section examines the influence of different η values on the fused image. To quantitatively measure the quality of the fused image, three commonly used image fusion metrics were utilized for the quantitative evaluation: entropy (EN) [30], mutual information (MI) [31], and gradient-based fusion measurement ( Q G ) [32]. These three indicators are defined as follows:
  • EN evaluates the amount of image information after fusion.
  • MI evaluates the image fusion performance by measuring the amount of information a given variable contains about another variable. In other words, it measures the dependence between the infrared and visible images.
  • Q G evaluates the amount of detail texture information in the fused image that was transferred from the infrared and visible images.
The larger the values of these three parameters, the higher the quality of the fused image.
Figure 11 shows the fusion results of Data 1 at different η values, where (a) is the visible image and (b) is the infrared image. (c–m) are the results when η = 0.1 , 1 , 2 , 3 , 4 , 5 , 6 , 7 , 8 , 9 , 10 , respectively. Figure 12 and Figure 13 show the fusion results of Data 2 and 3 at different η values. The quantitative evaluation results of the fused images at different η values of Data 1, Data 2, and Data 3 using EN, MI, and Q G are shown in Figure 14, Figure 15 and Figure 16, respectively.
It can be seen from Figure 11, Figure 12 and Figure 13 that the smaller the value of η , the greater the amount of brightness information from the infrared image saved in the fused image. The larger the value of η , the greater the amount of runway texture information is saved in the fused image. When η gradually increased from 0.1, the fused image has a high brightness, the texture information of the runway in the image gradually increased, and the visual effect of the fused image continuously improved. When η increased to 4, the improvement of airport texture details in the fused image gradually slowed down, and the improvement of visual effect of the fused image was not very significant. In terms of quantitative evaluation metrics, it can be seen from Figure 14, Figure 15 and Figure 16, increasing η gradually raises the EN and Q G , while the MI indicator decreases. Considering these three objective evaluation metrics comprehensively, to obtain high EN and Q G values and good MI results, the η was kept constant at 5 in this study to achieve good visual effects in most cases.

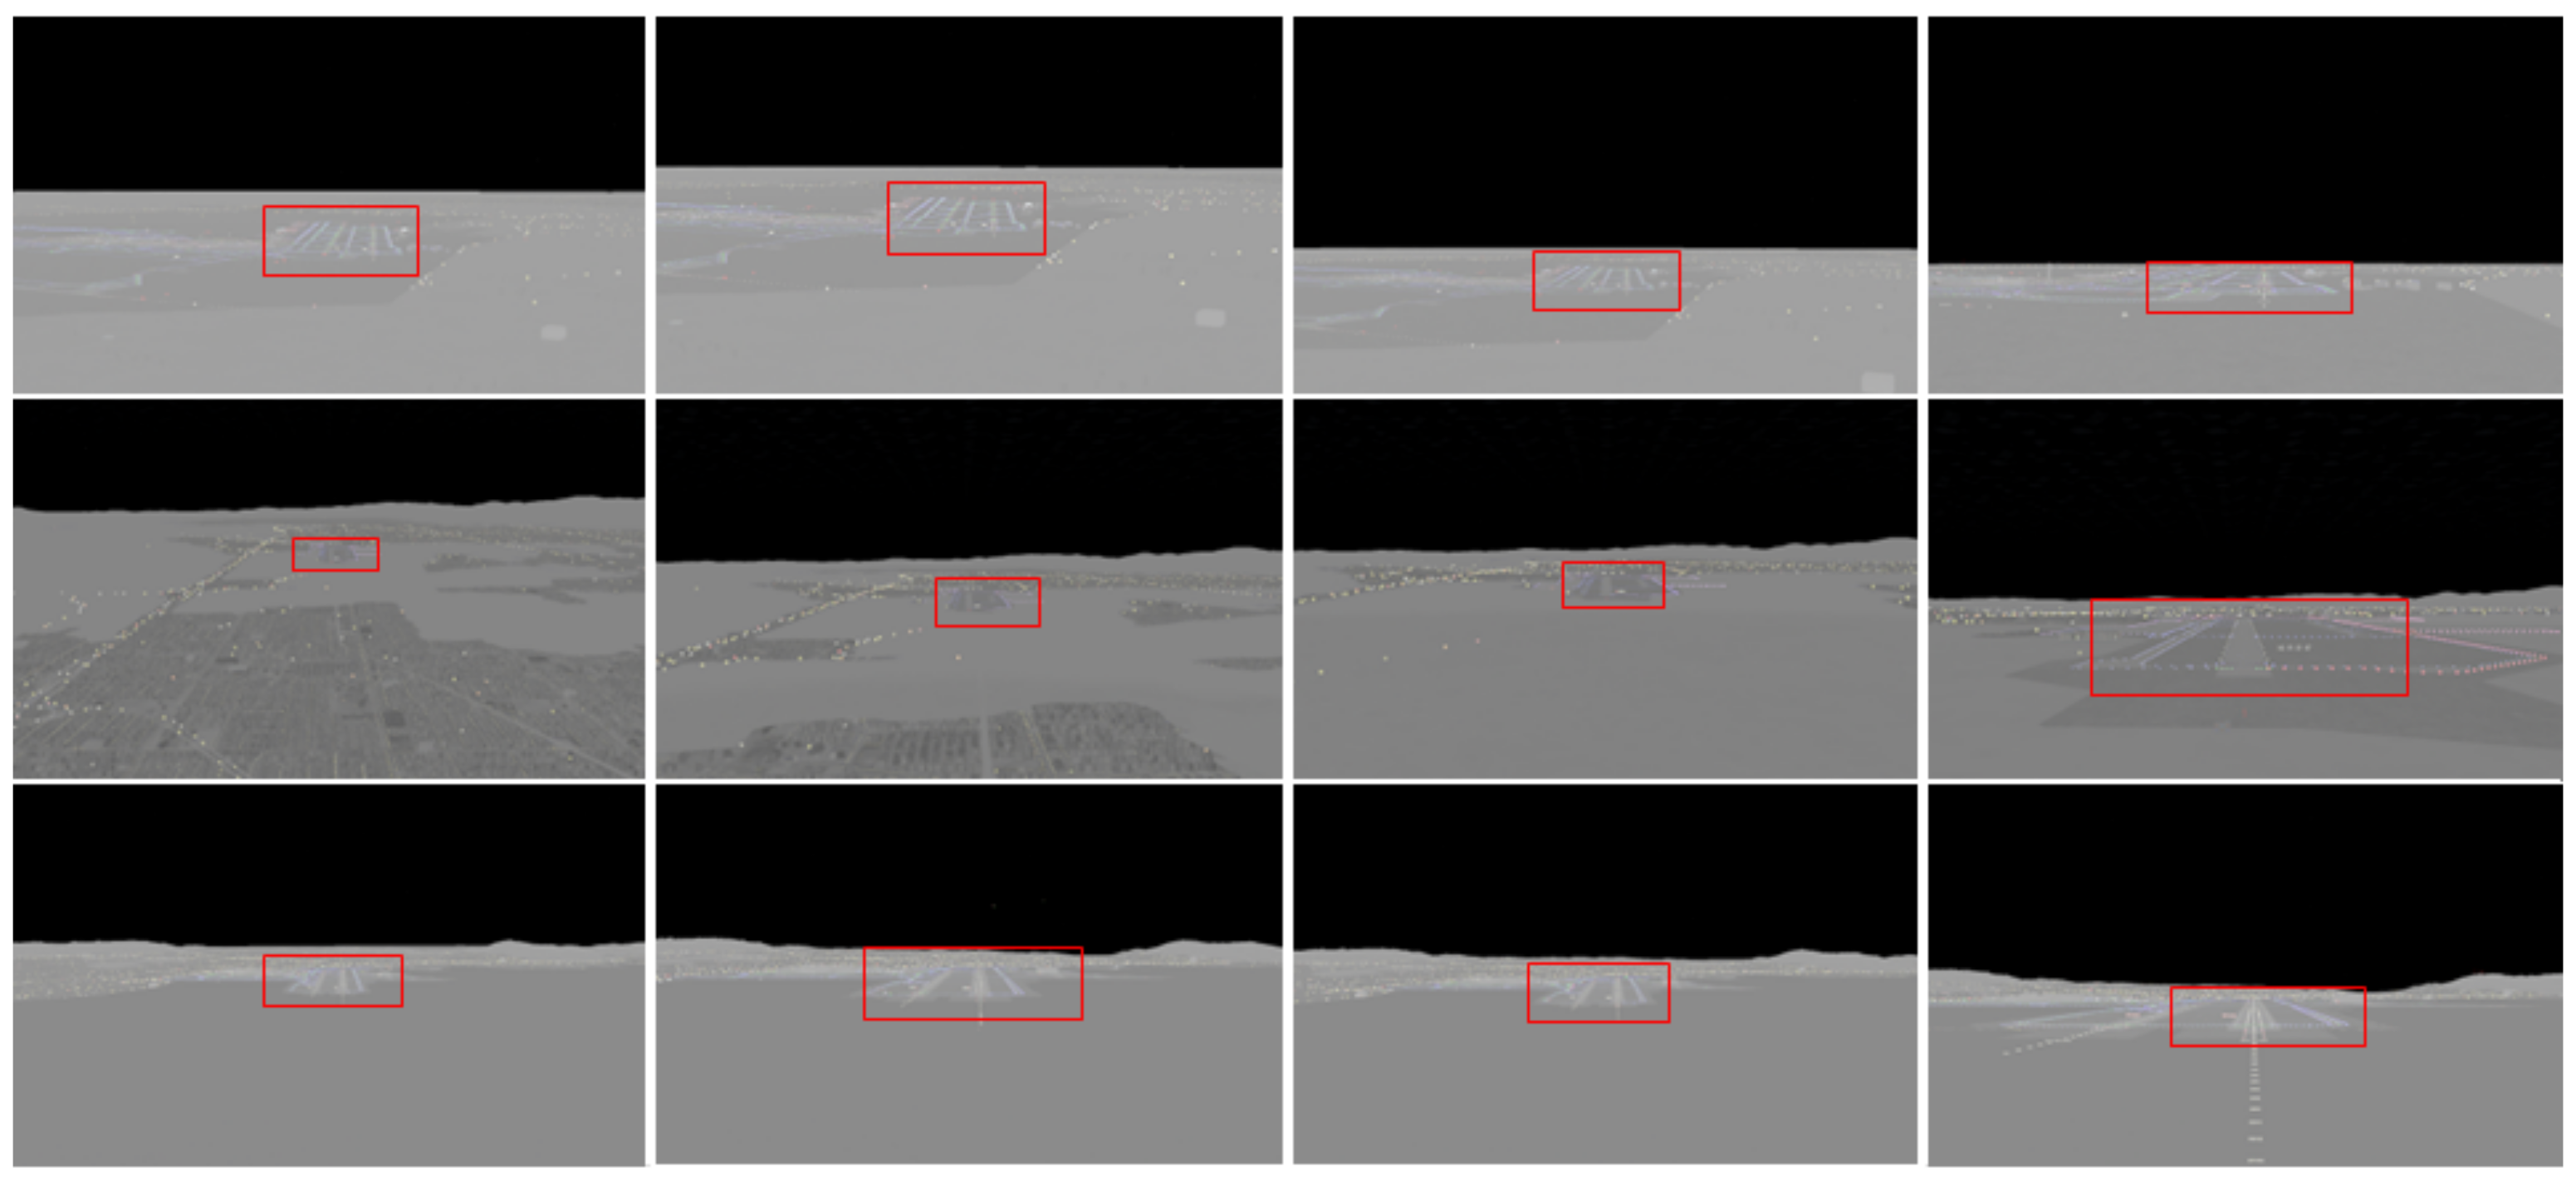
5.3. Runway Detection

The runway detection dataset in this section was obtained from the fused image in the previous section.

5.3.1. Influence of Different Feature Extraction Networks on Runway Detection

In the Faster R-CNN, different feature extraction networks have different effects on the target detection performance [33]. VGGNet, ResNet, and GoogLeNet have achieved good results in remote sensing image classification and airport detection [34,35,36,37,38,39,40,41]. Therefore, in this section, VGG19, ResNet101, and Inception V4 models are used as the airport feature extraction networks. The default anchor size is used, and AP (Average Precision is a metric which indicates the performance of the detector on two aspects of Precision and Recall) is used as the evaluation metric to analyze the impact of different feature extraction networks on the runway detection. The comparison results of the three models are summarized in Table 3, where ResNet101 has the highest AP value, meaning that it has the best runway detection performance.

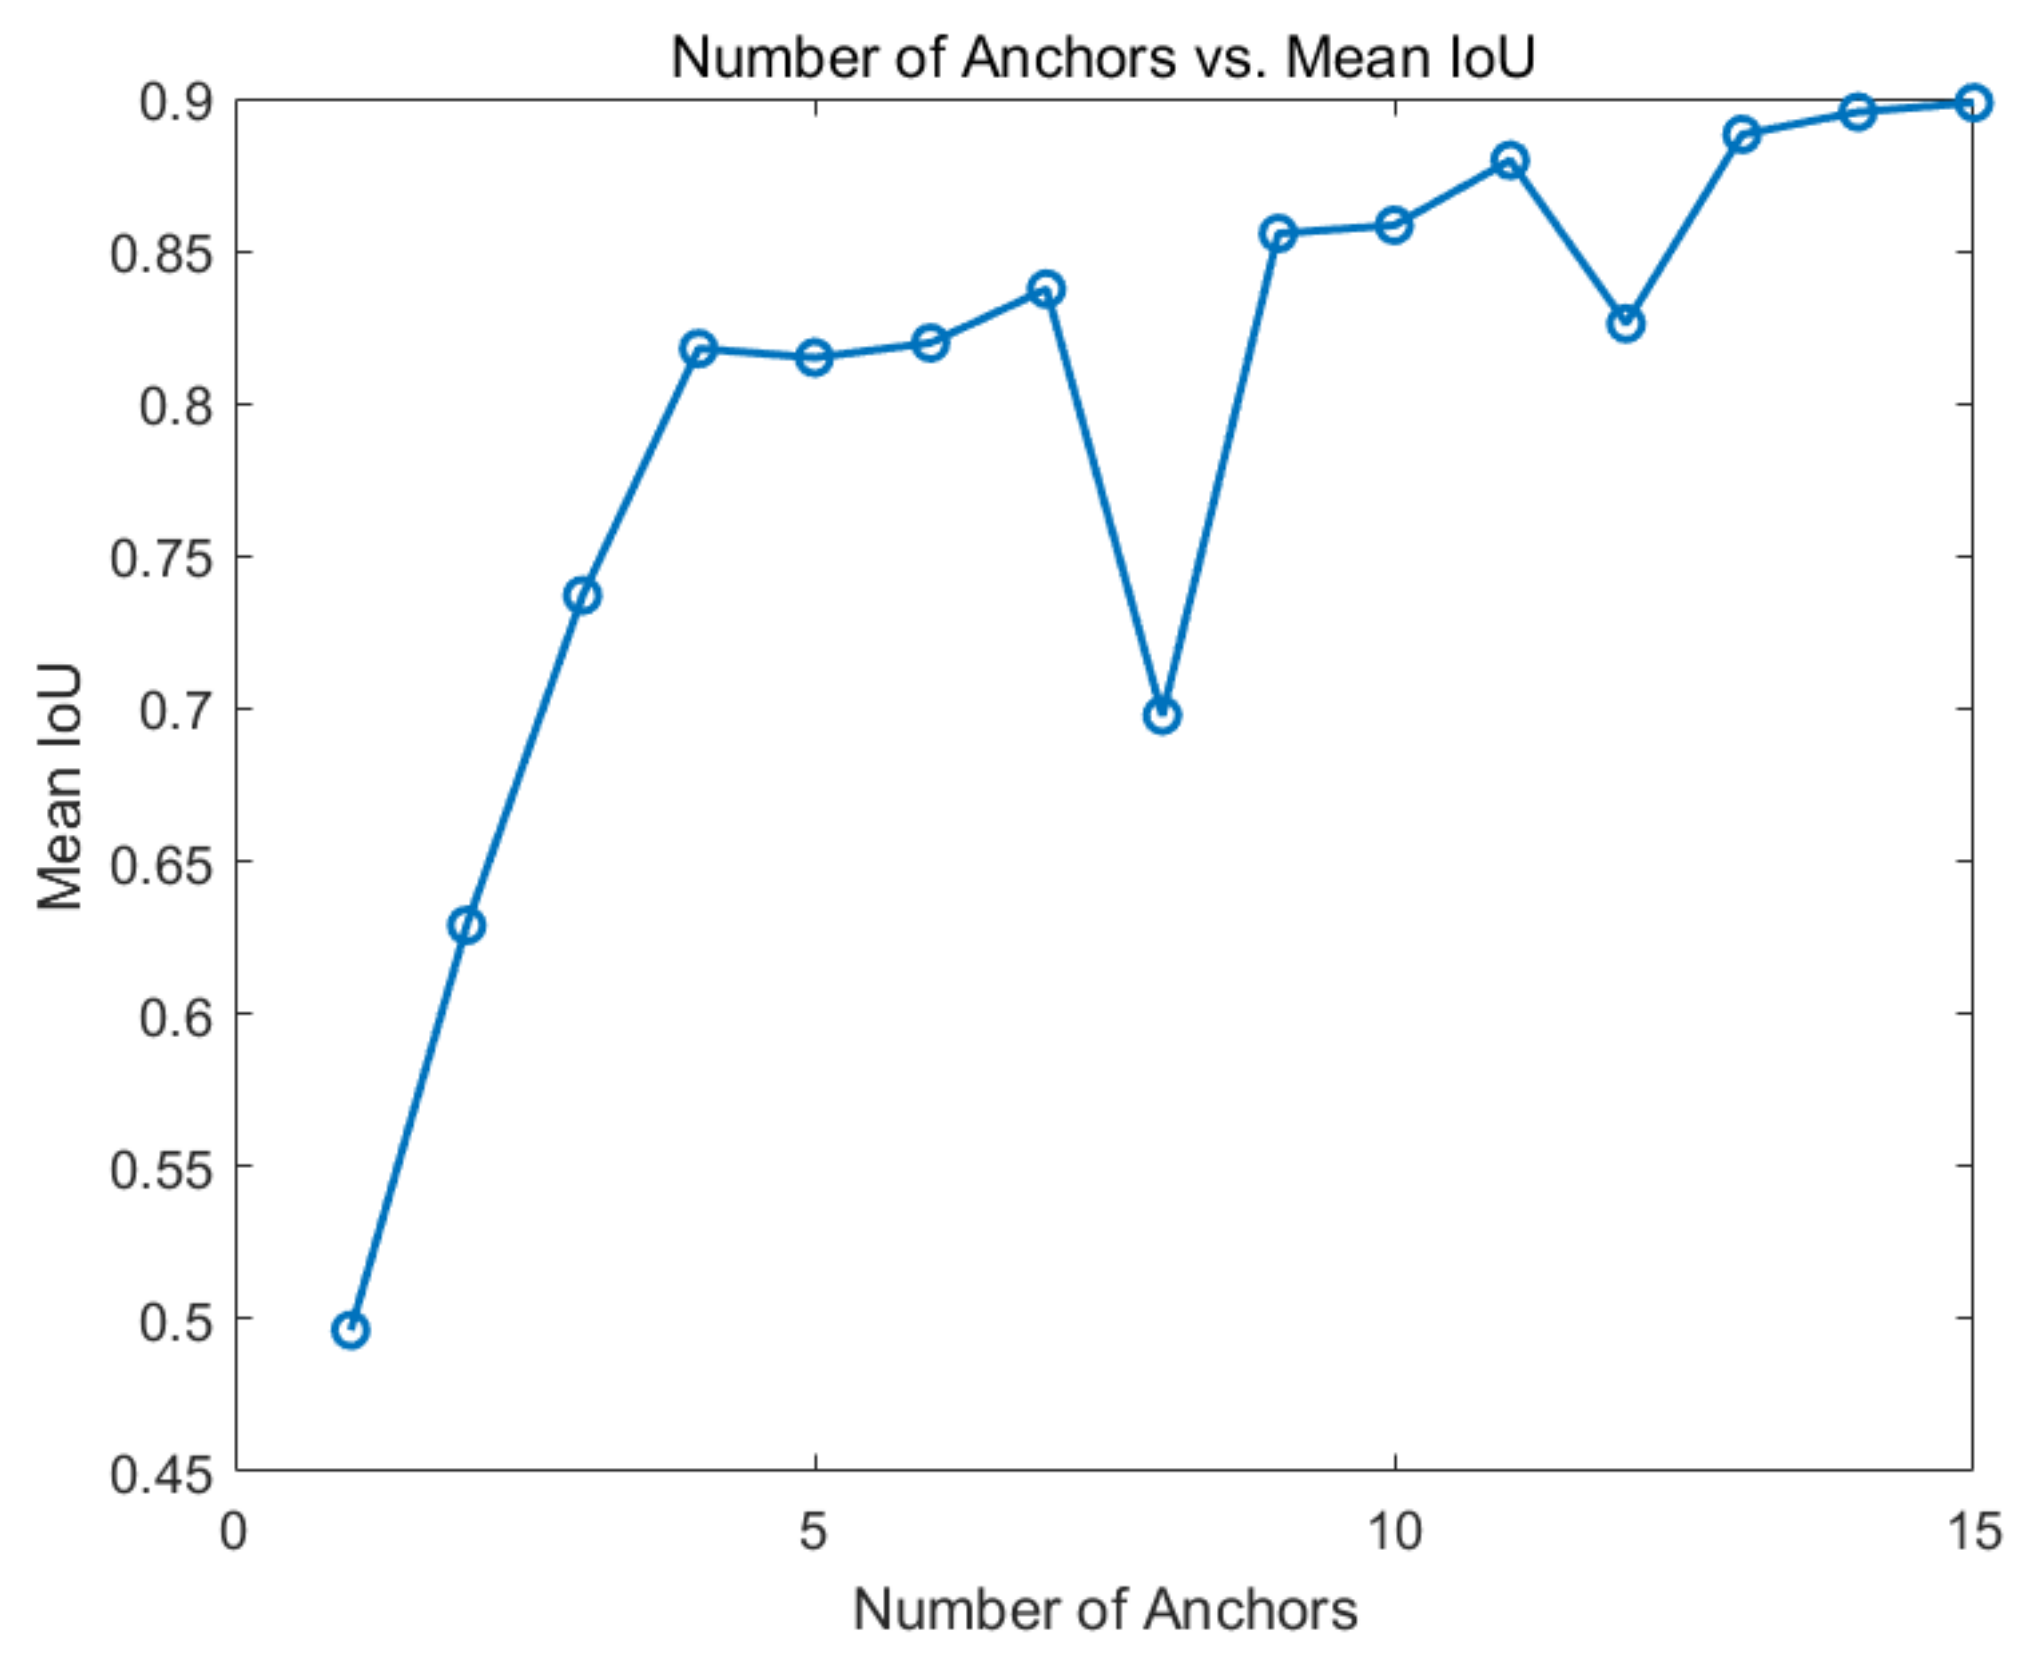
5.3.2. Influence of Different Anchor Size on Runway Detection

The results from the previous section showed that the ResNet101 network has the best runway detection performance. To compare and analyze the effects of the anchor size before and after modification on the detection performance of the Faster R-CNN, this study used the ResNet101 to detect the runway in the fused image with a resolution of 1224 × 520 . Figure 17 and Figure 18 show the detection results before and after the anchor size modification. It can be seen that the Faster R-CNN with the modified anchor size can locate the runway more accurately than the Faster R-CNN with the default anchor size. Table 4 presents the quantitative comparison results of the AP values before and after the anchor size modification. It can be seen that the AP value of the Faster R-CNN improved after the anchor size was modified.

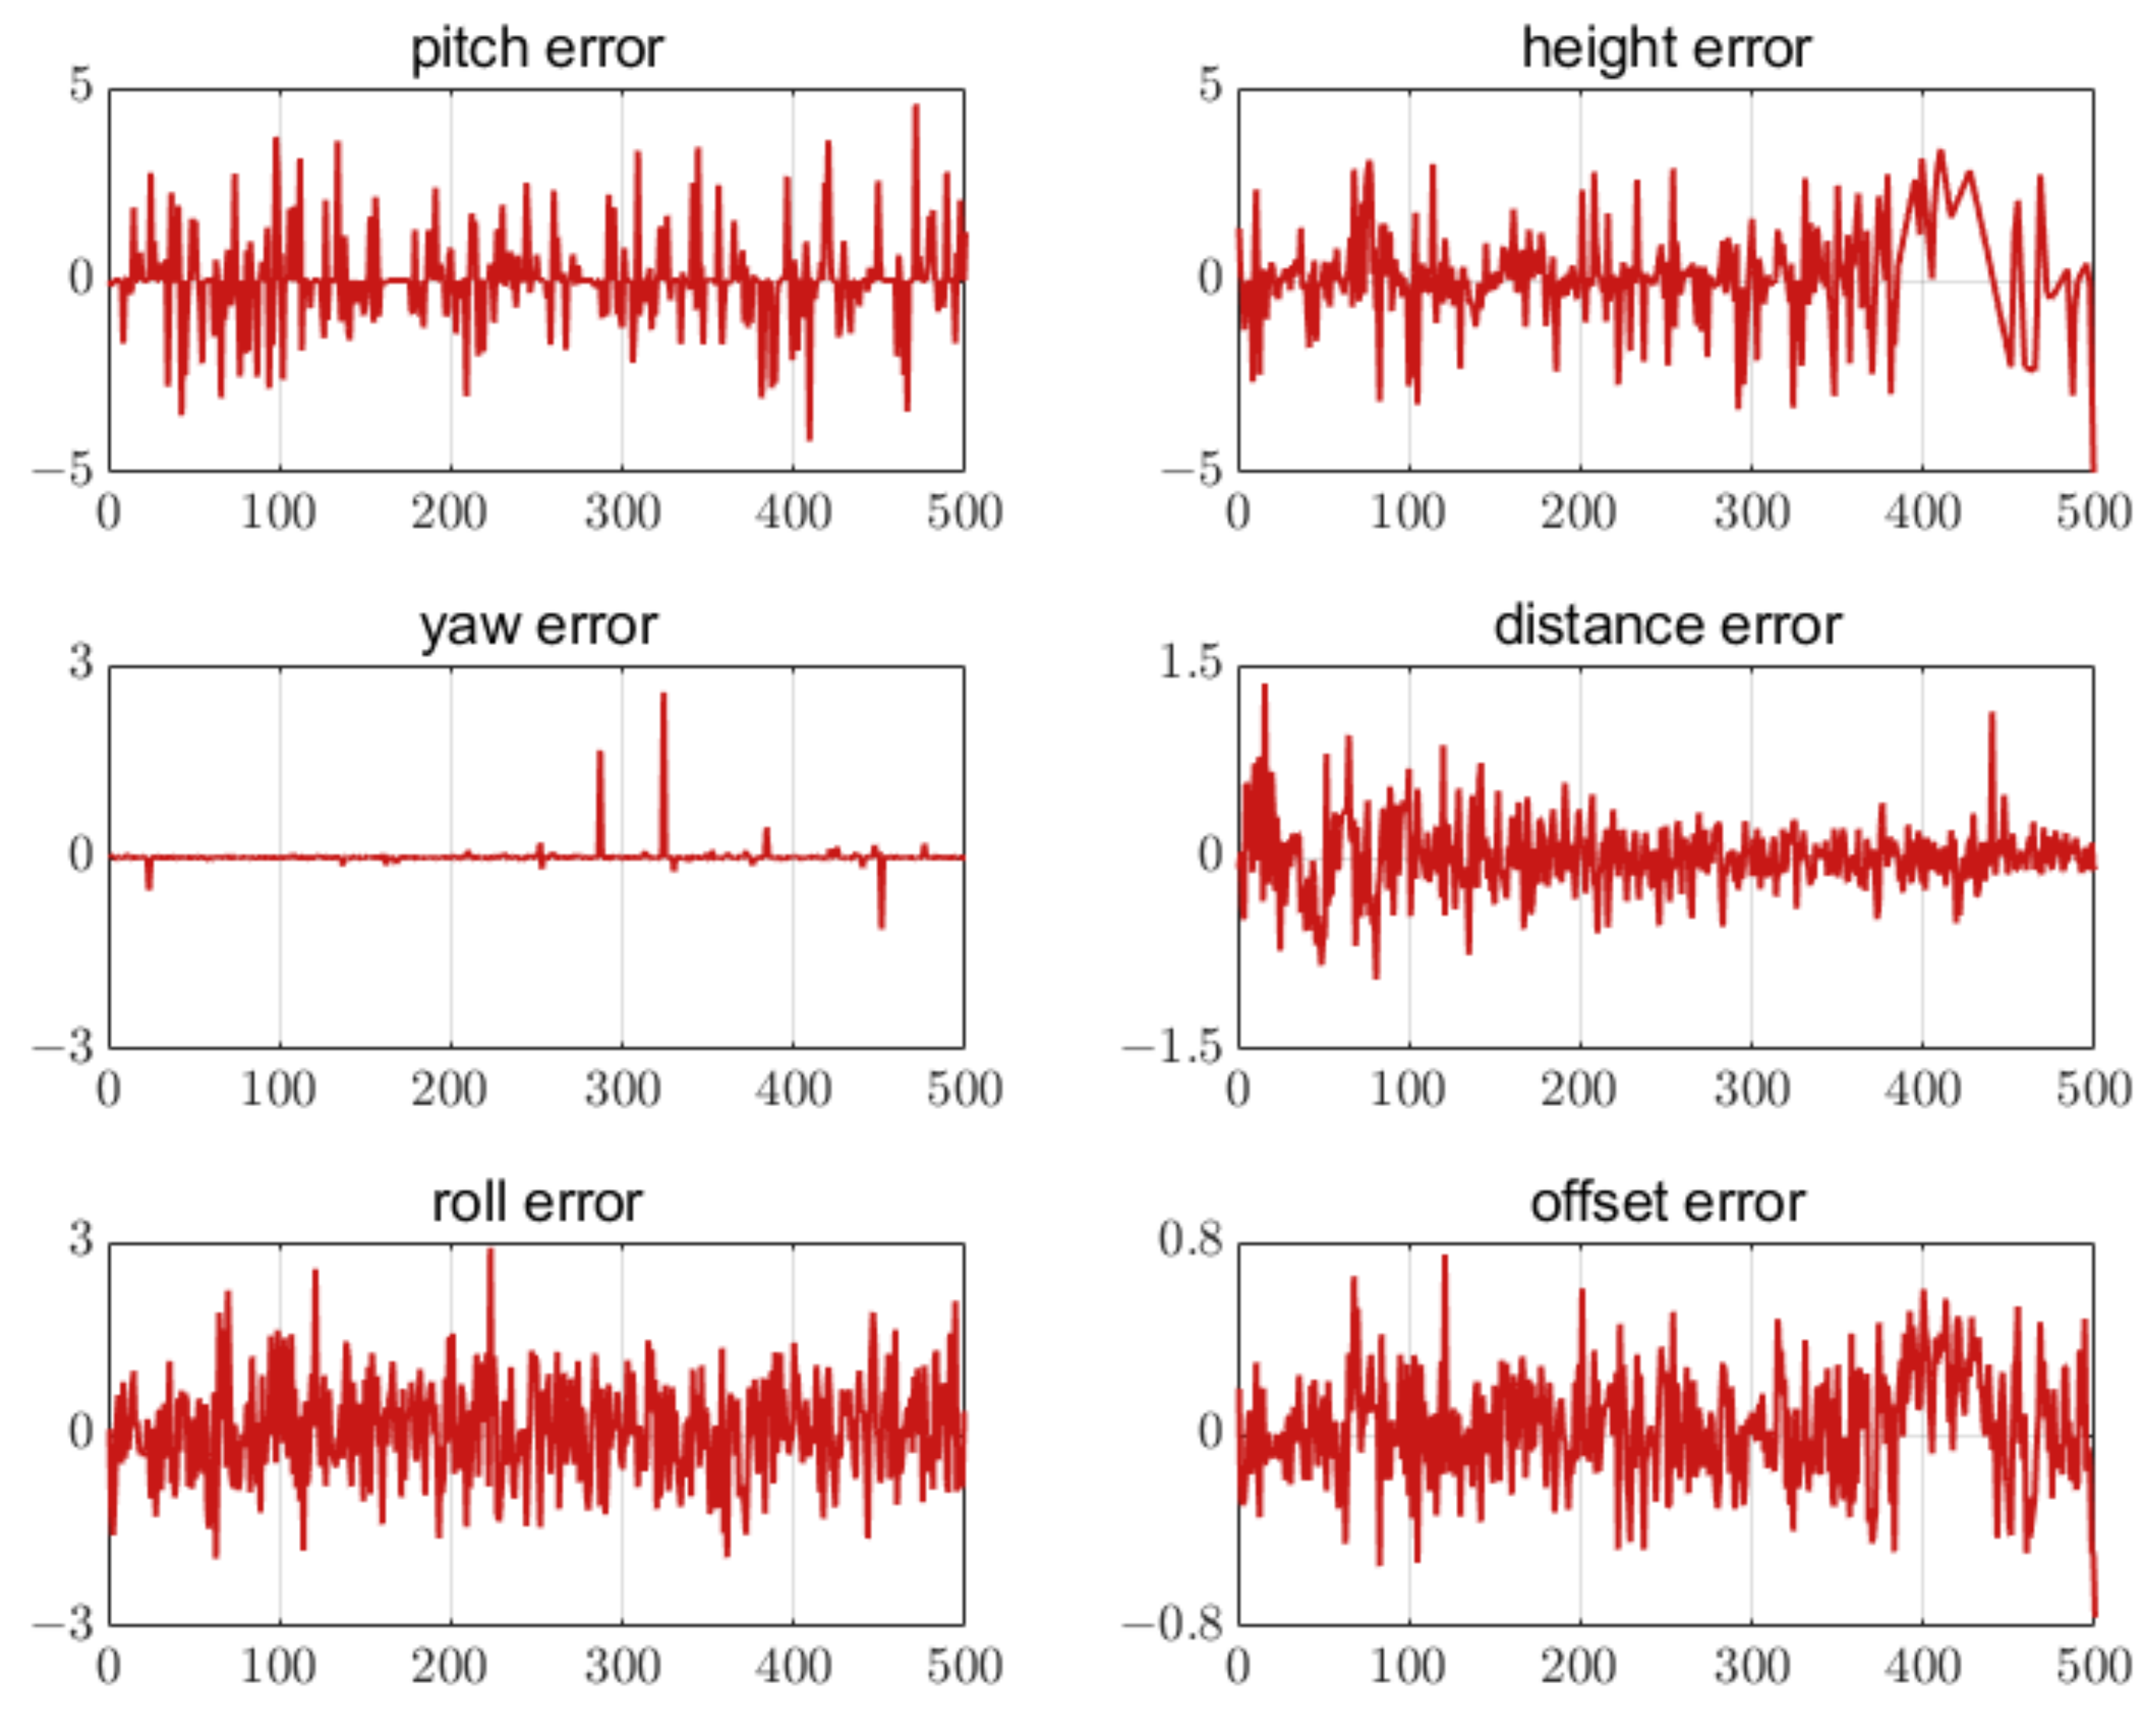
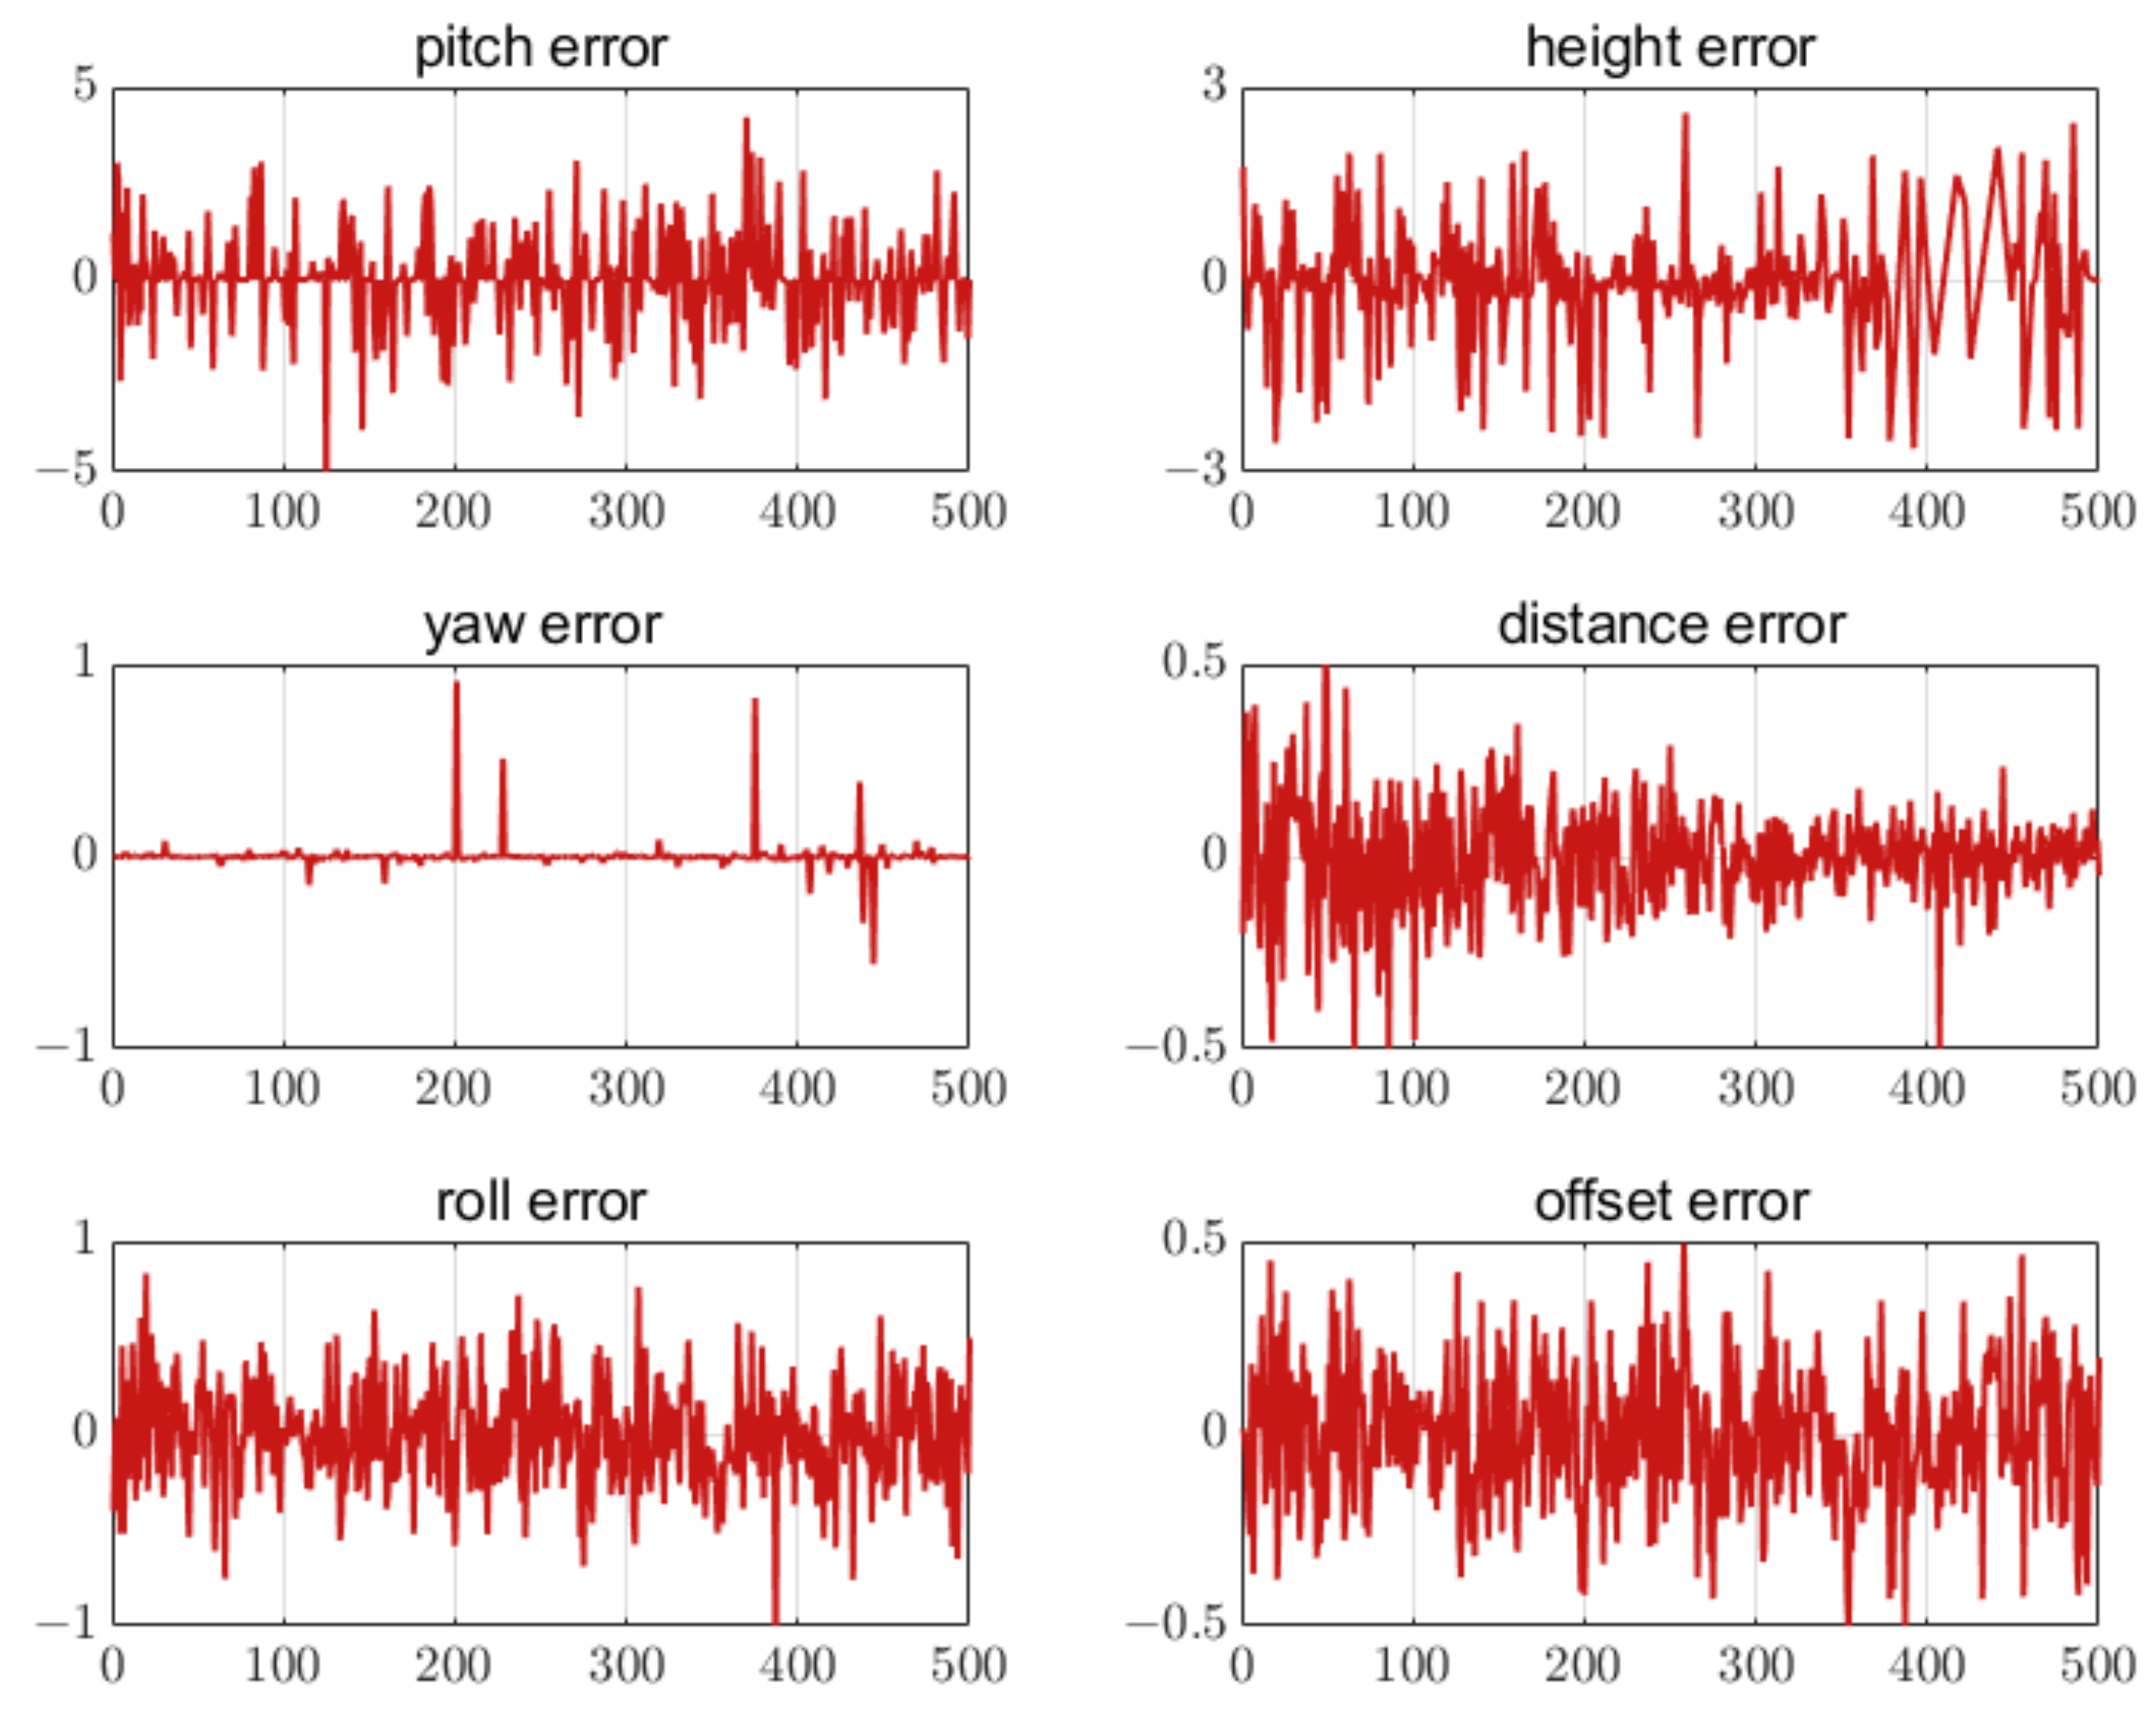
5.4. Relative Attitude and Position Calculation

This section conducts the calculation experiment on the UAV landing attitude and position parameters. The influence of the number of feature points and feature point extraction error on the accuracy of the calculated attitude and position is analyzed. Three layout schemes with different numbers of feature points are shown in Figure 8. By using the camera calibration toolbox in MATLAB, we can obtain the camera intrinsic matrix
K = 571 0 254 0 571 206 0 0 1

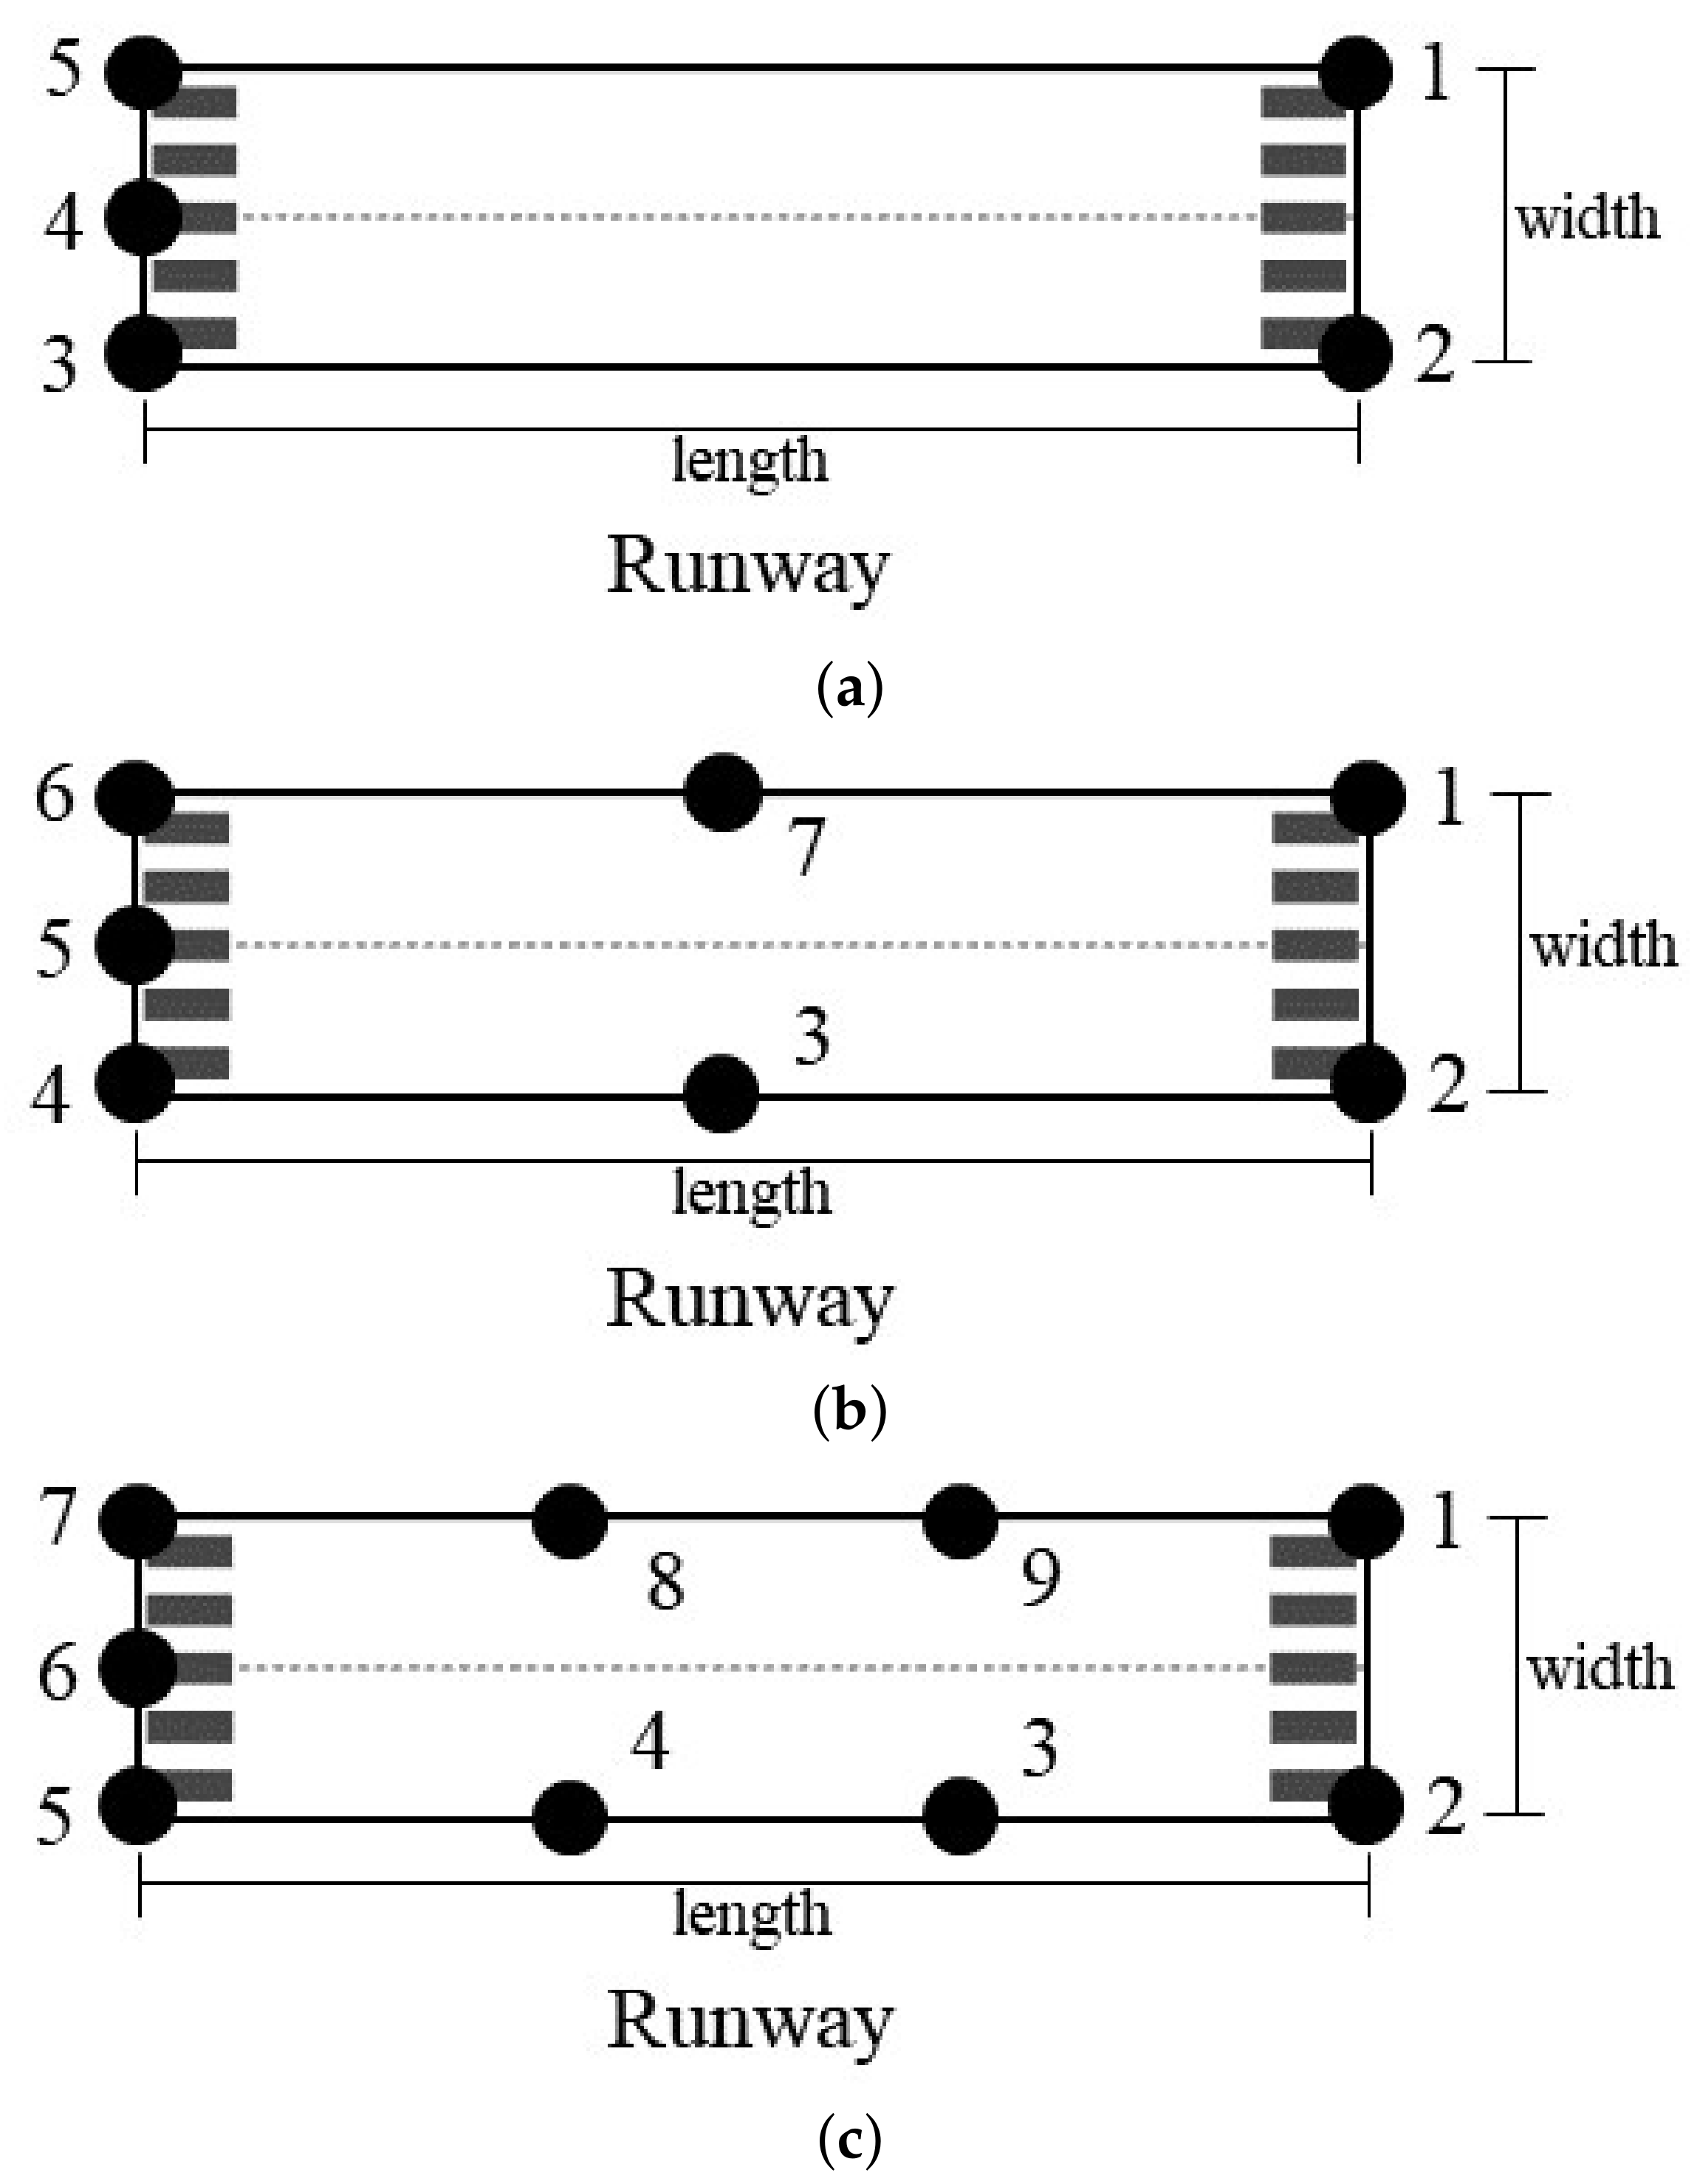
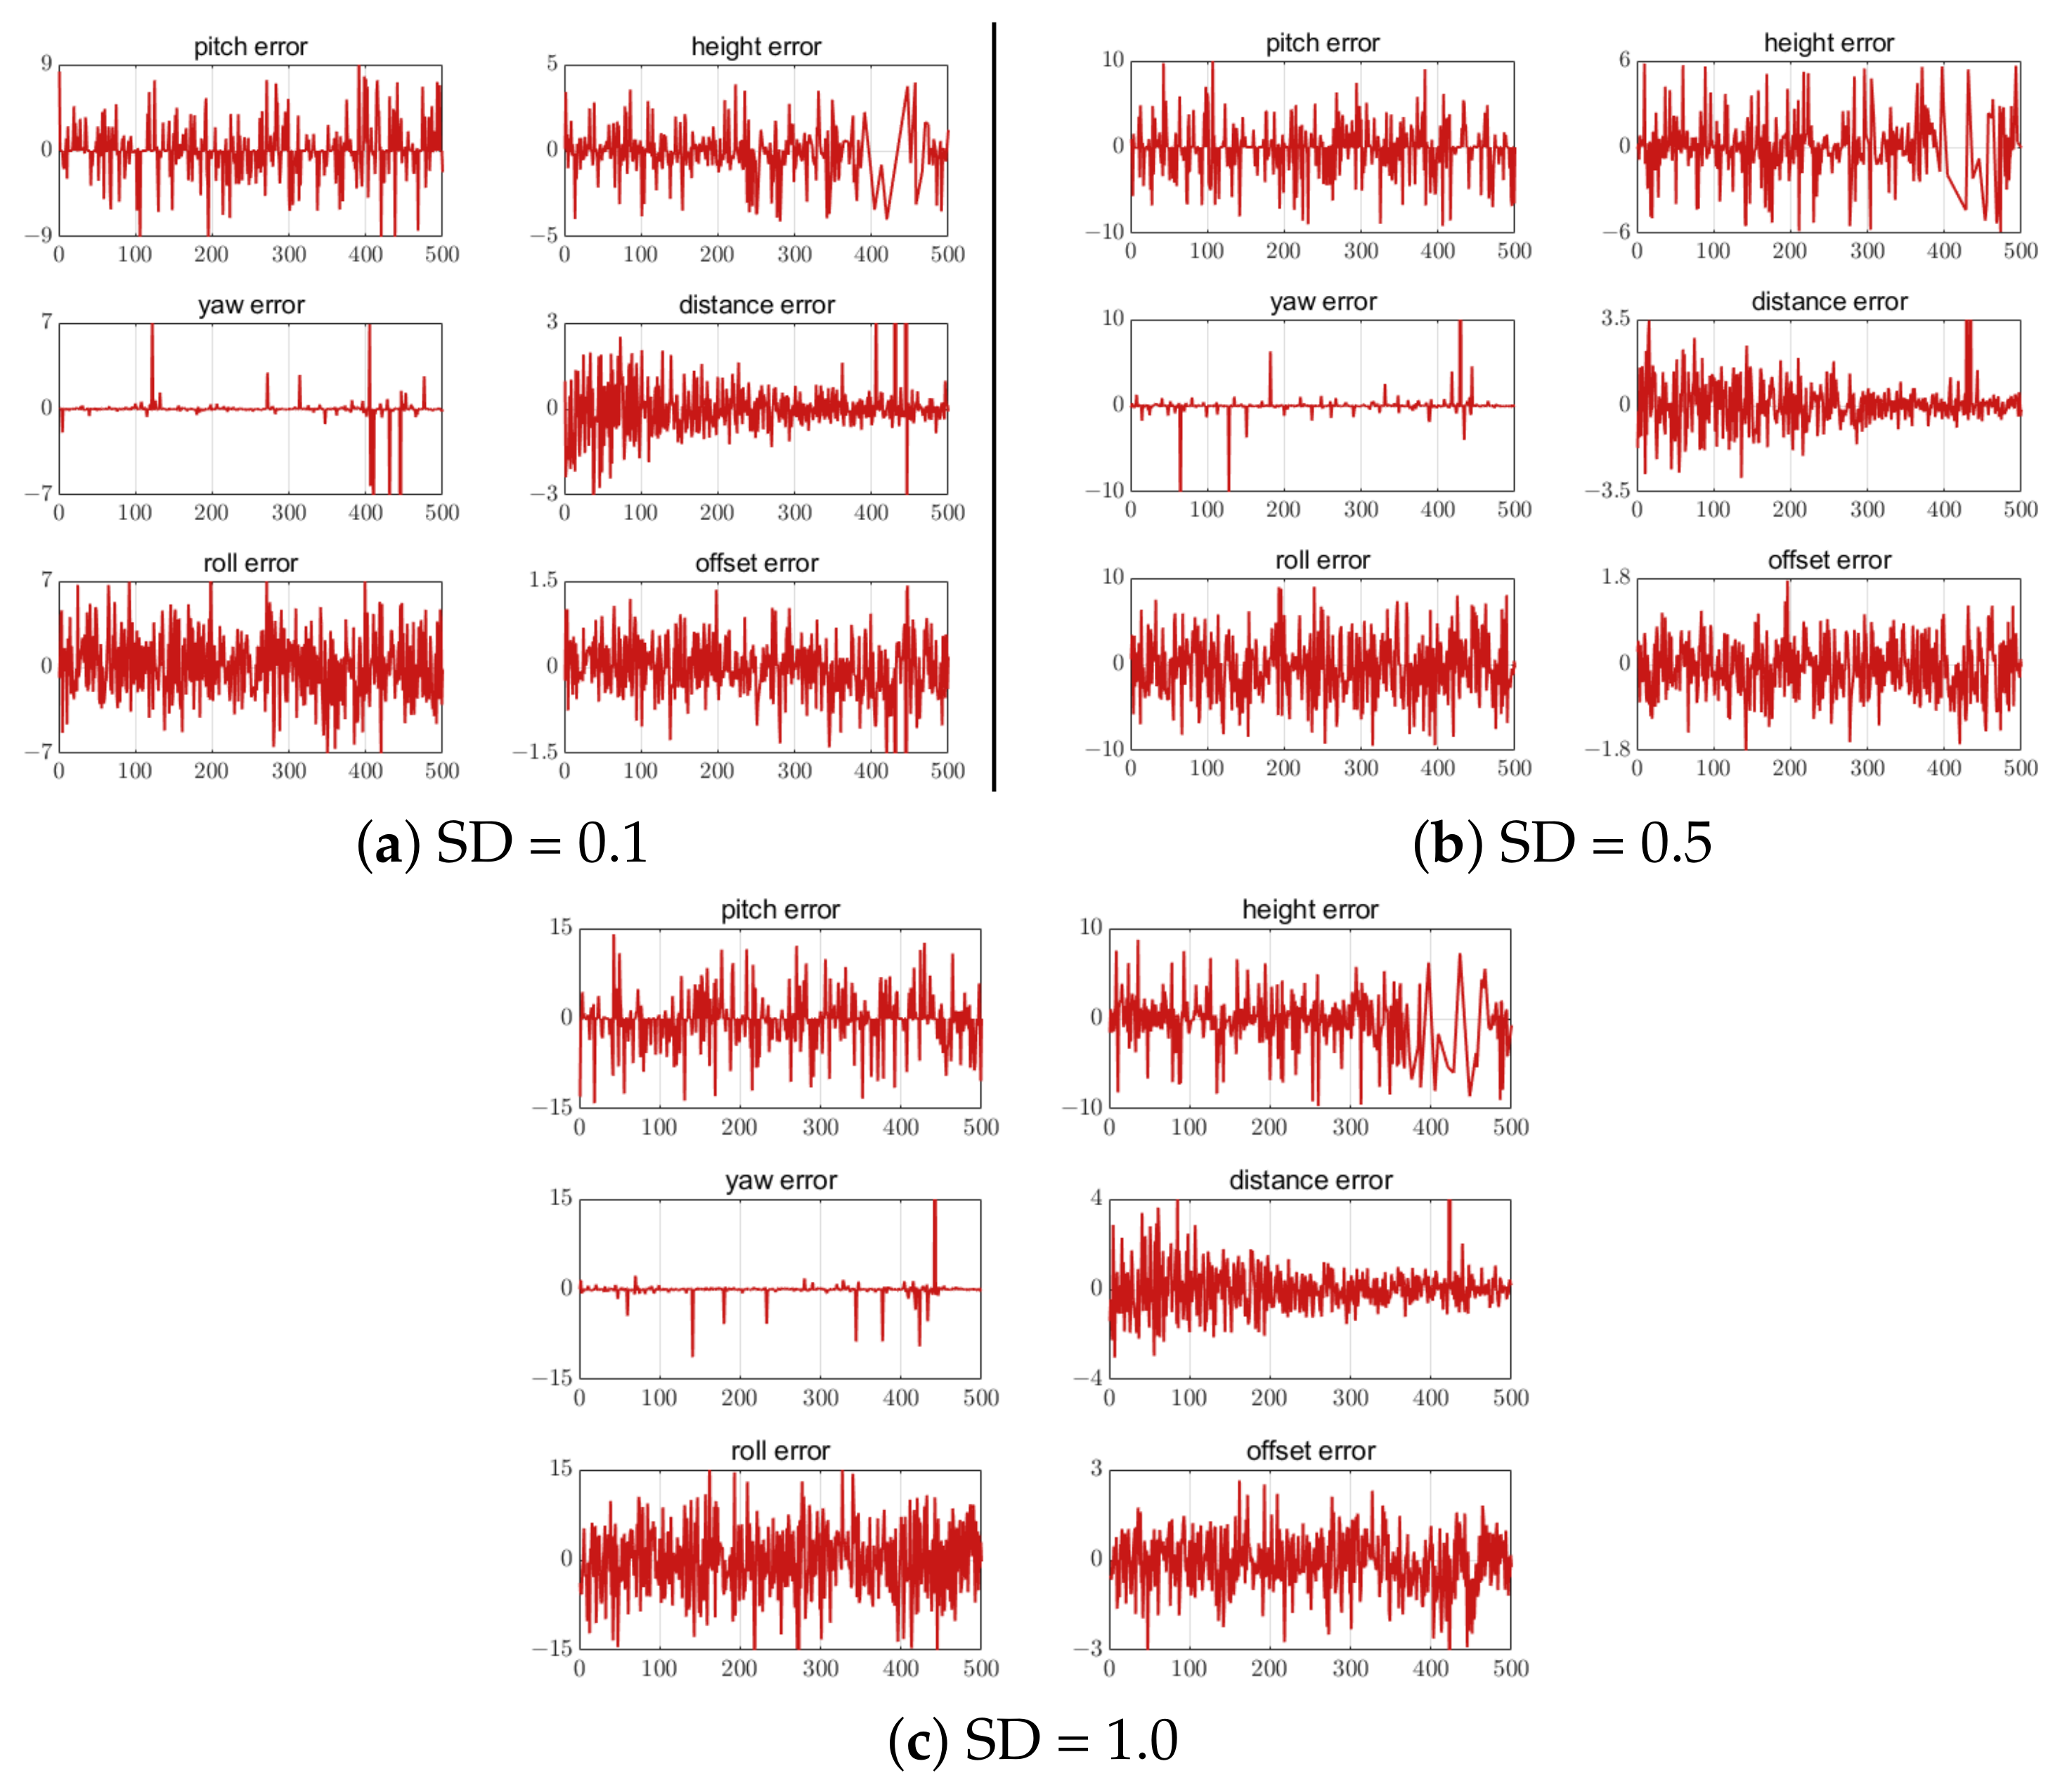
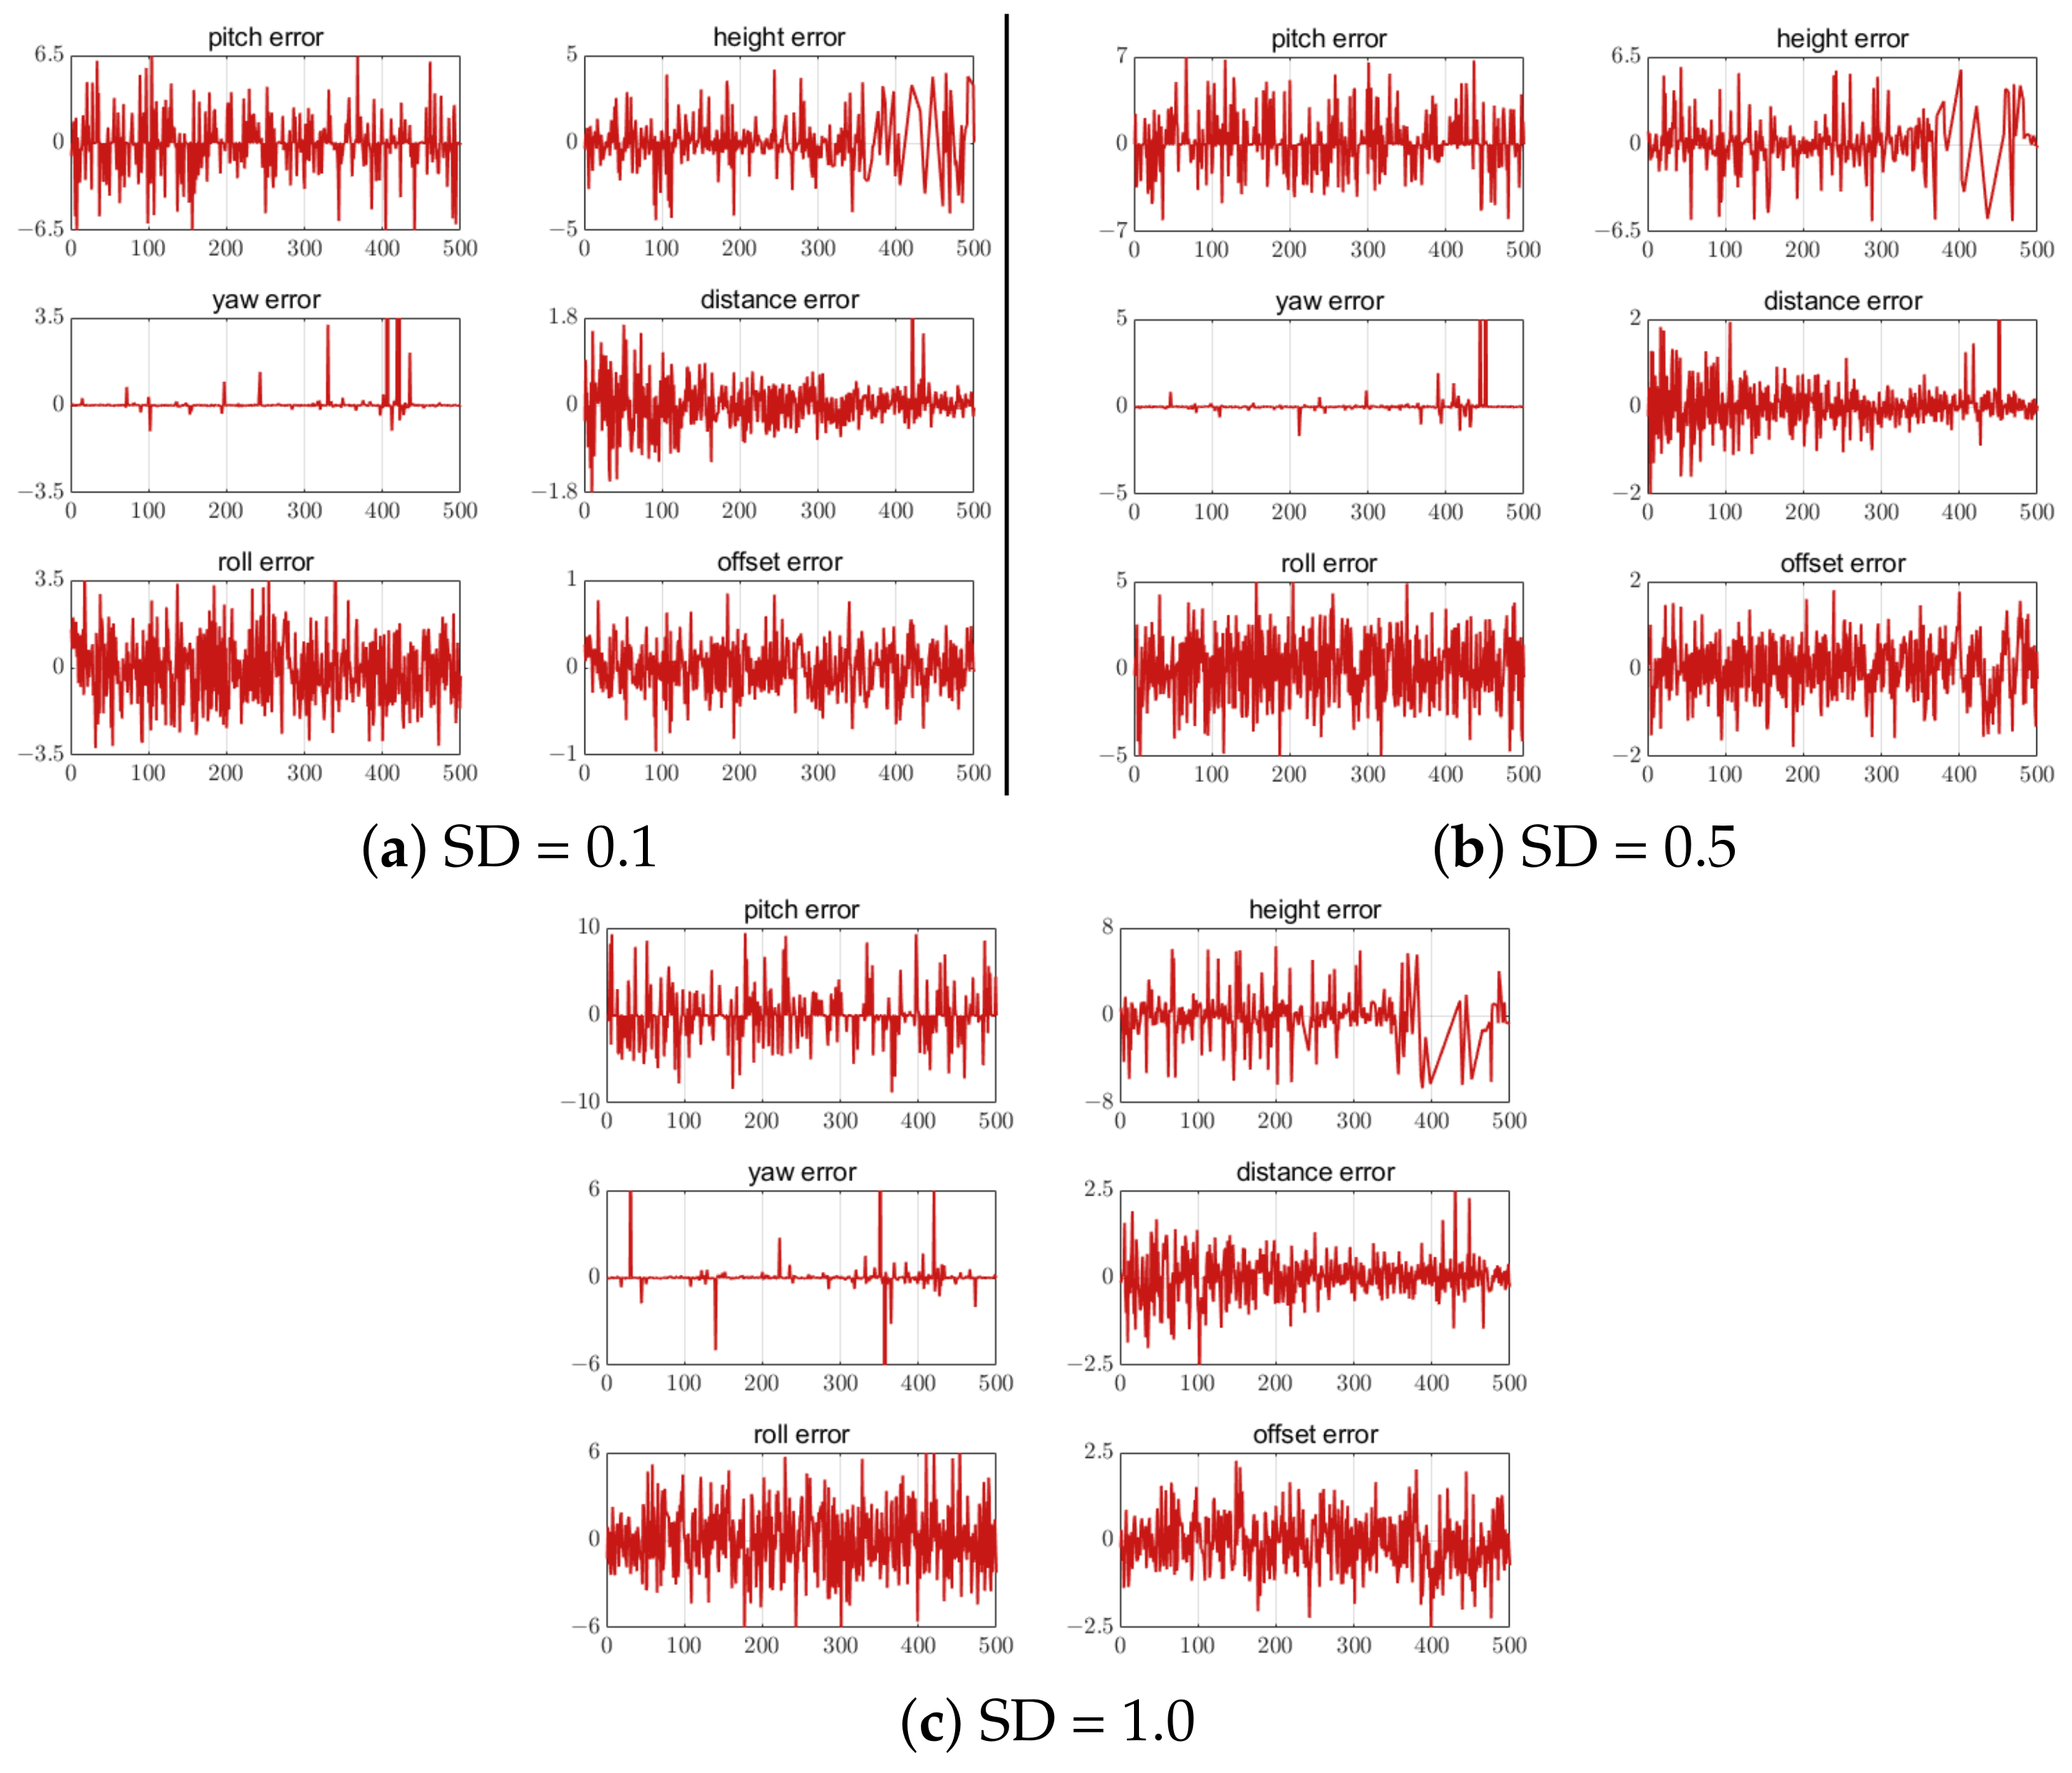
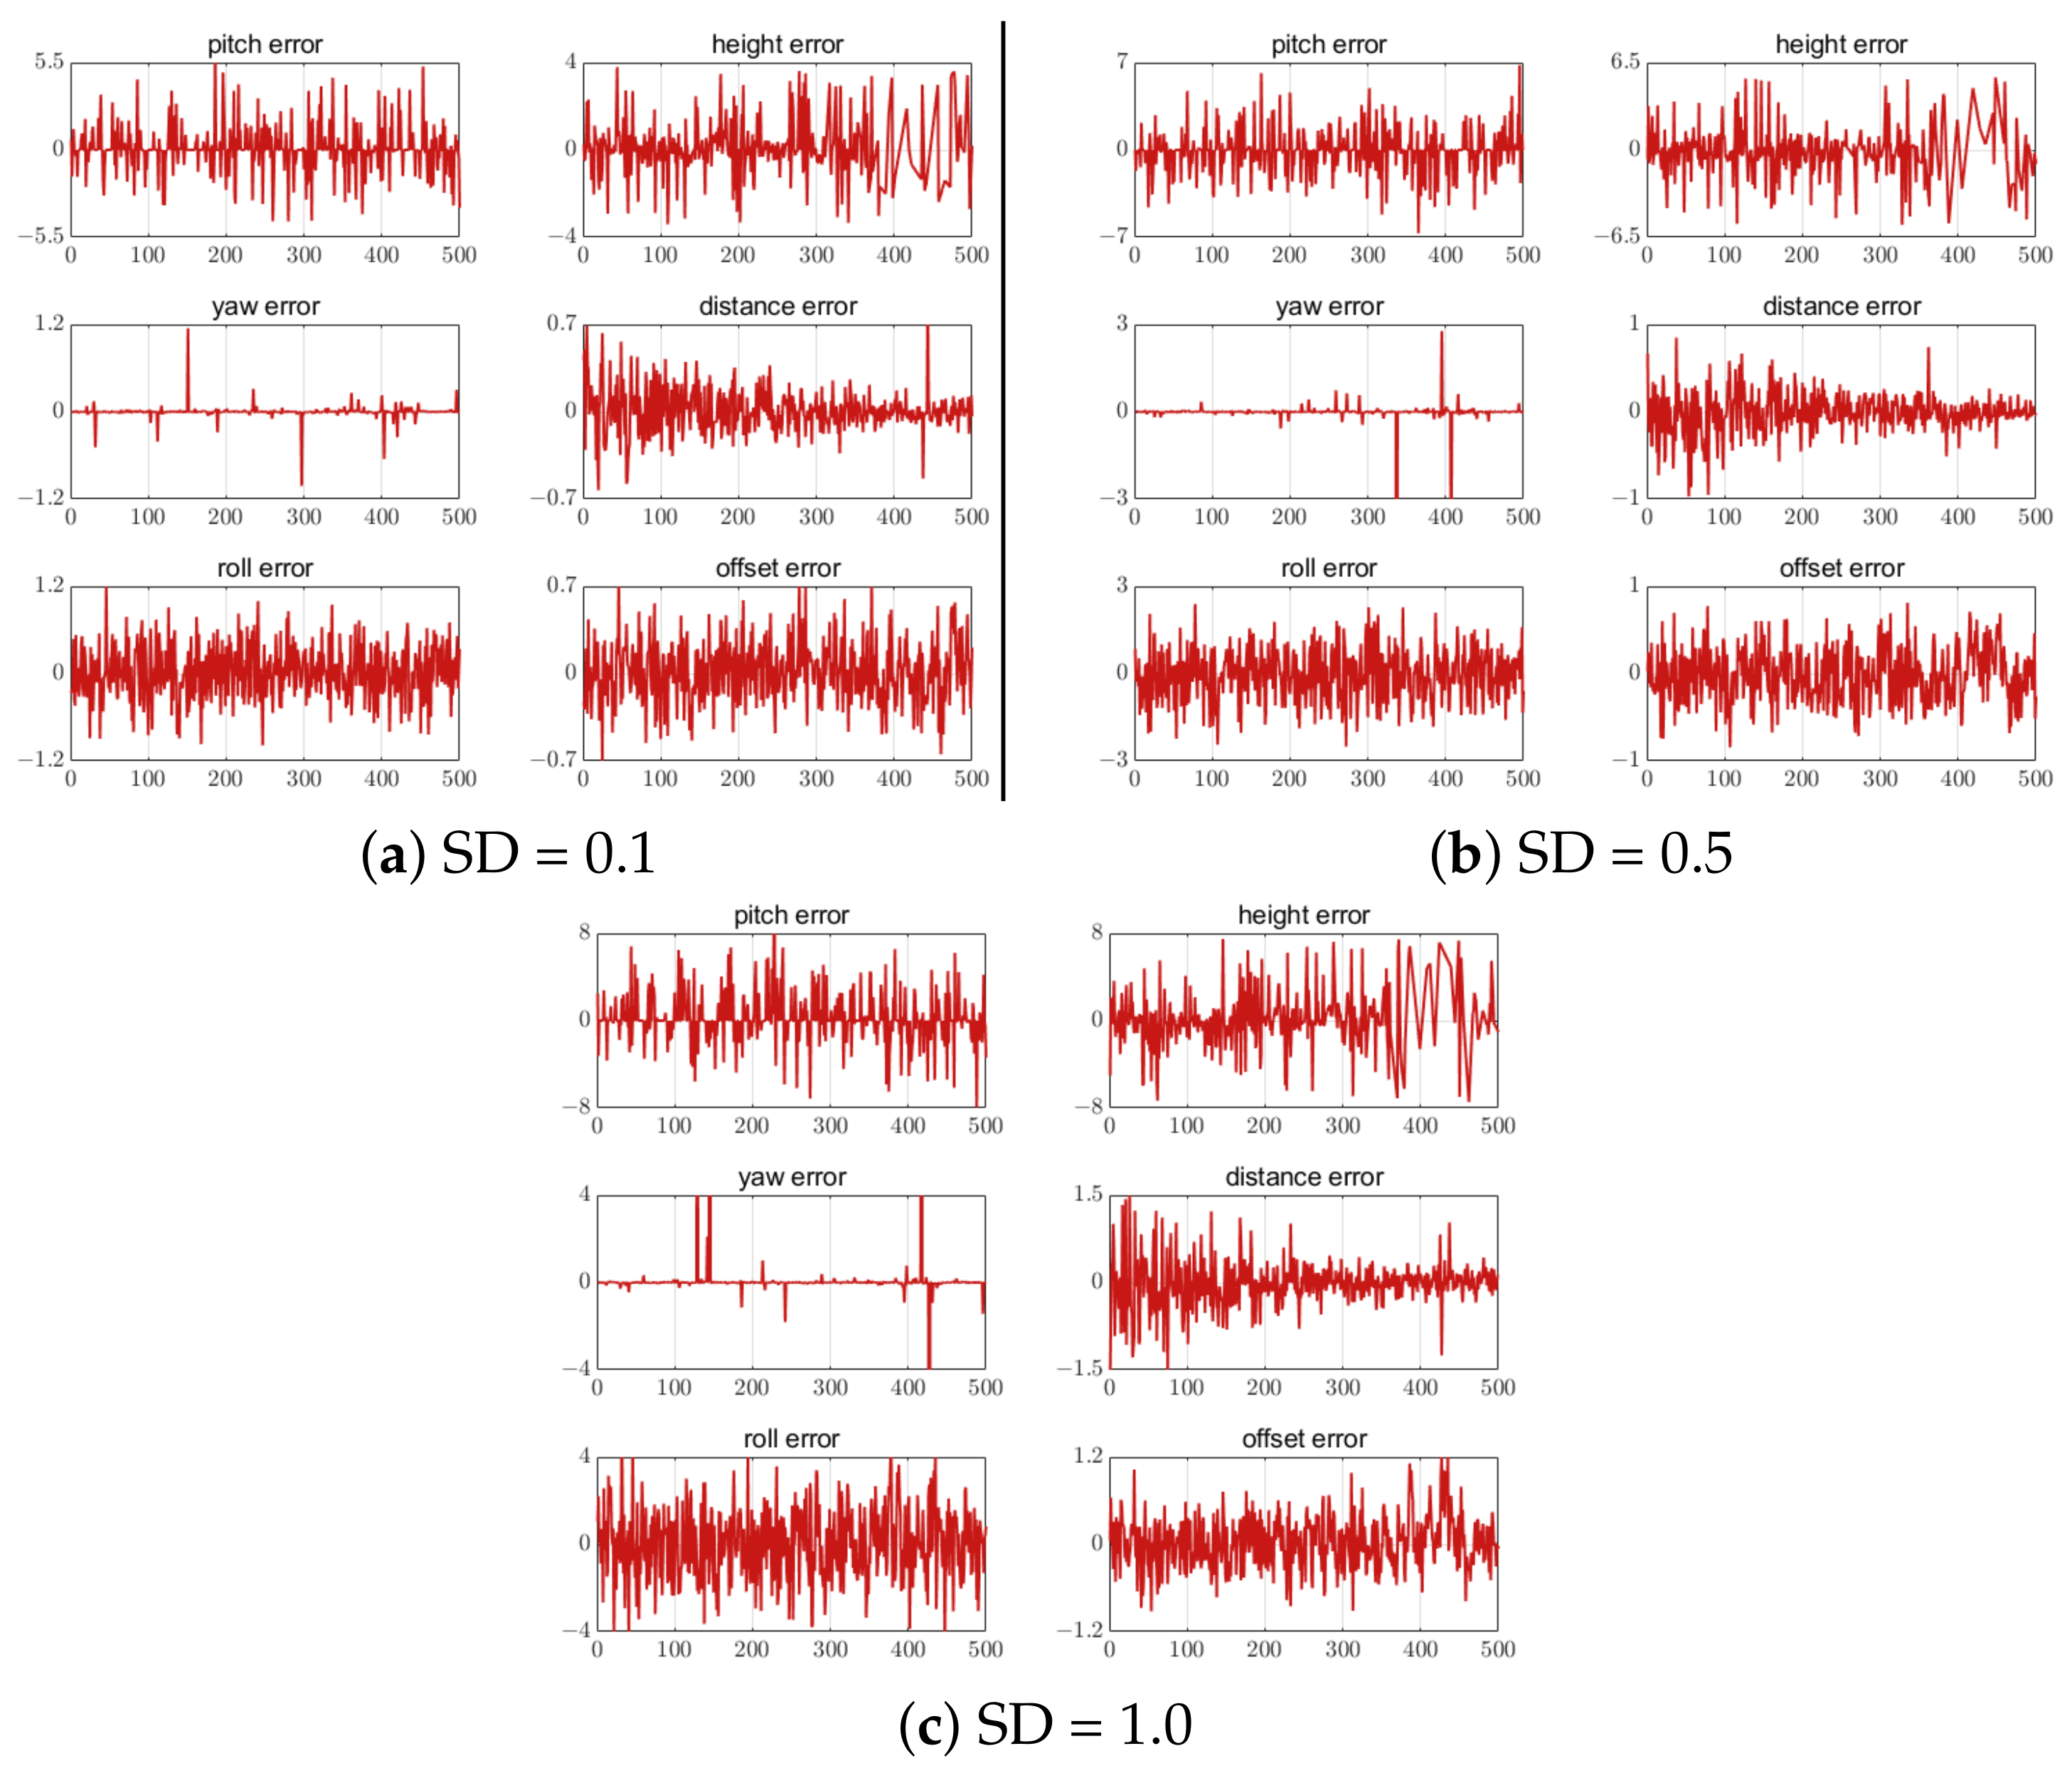
5.4.1. Error of Different Numbers of Feature Points

The error results of the UAV landing parameter estimation are shown in Figure 19, Figure 20 and Figure 21 when five, seven, and nine feature points were set on the airport, respectively. The results have shown that the attitude and position errors decreased with the increase of the number of feature points. For all three schemes, the attitude estimation error is larger than the position estimation error.

5.4.2. Feature Point Extraction Error

Different standard deviations (SD) of white noise were added to the three feature-point-setting schemes to analyze the influence of the feature point position extraction error on the UAV attitude and position calculation. Noise values of 0.1, 0.5 and 1.0 were added to the five, seven, and nine feature-point-setting schemes, respectively. The error results are shown in Figure 22, Figure 23 and Figure 24. The correlation results show that the estimation error increased with the increase in the feature point extraction error. In the five-feature-point scheme, the calculated landing parameters had the largest error when SD = 1, making it unsafe for UAV landing.
Therefore, in subsequent engineering applications, we can consider increasing the number of feature points and improving the accuracy of feature point position extraction to improve the calculation accuracy of the attitude and position.

5.4.3. Computational Cost as Feature Points Increase

To evaluate the relationship between the number of feature points and computational complexity and the pose estimation accuracy, we calculate the pose estimation accuracy and the computation time as the number of feature points increases. The related results are shown in Table 5.
The results shown in Table 5 illustrate two things. (1) When the number of feature points increases initially, the computational accuracy improves rapidly, but then tends to be flat; (2) the computational complexity always increases steadily with the increase of the number of feature points. Considering the balance of computational complexity and accuracy, the number of 9 feature points was selected.

5.5. Comparison with Other Methods

To demonstrate the superiority of the proposed algorithm, several state-of-the-art algorithms for image fusion, runway detection, and pose estimation are compared in this section.

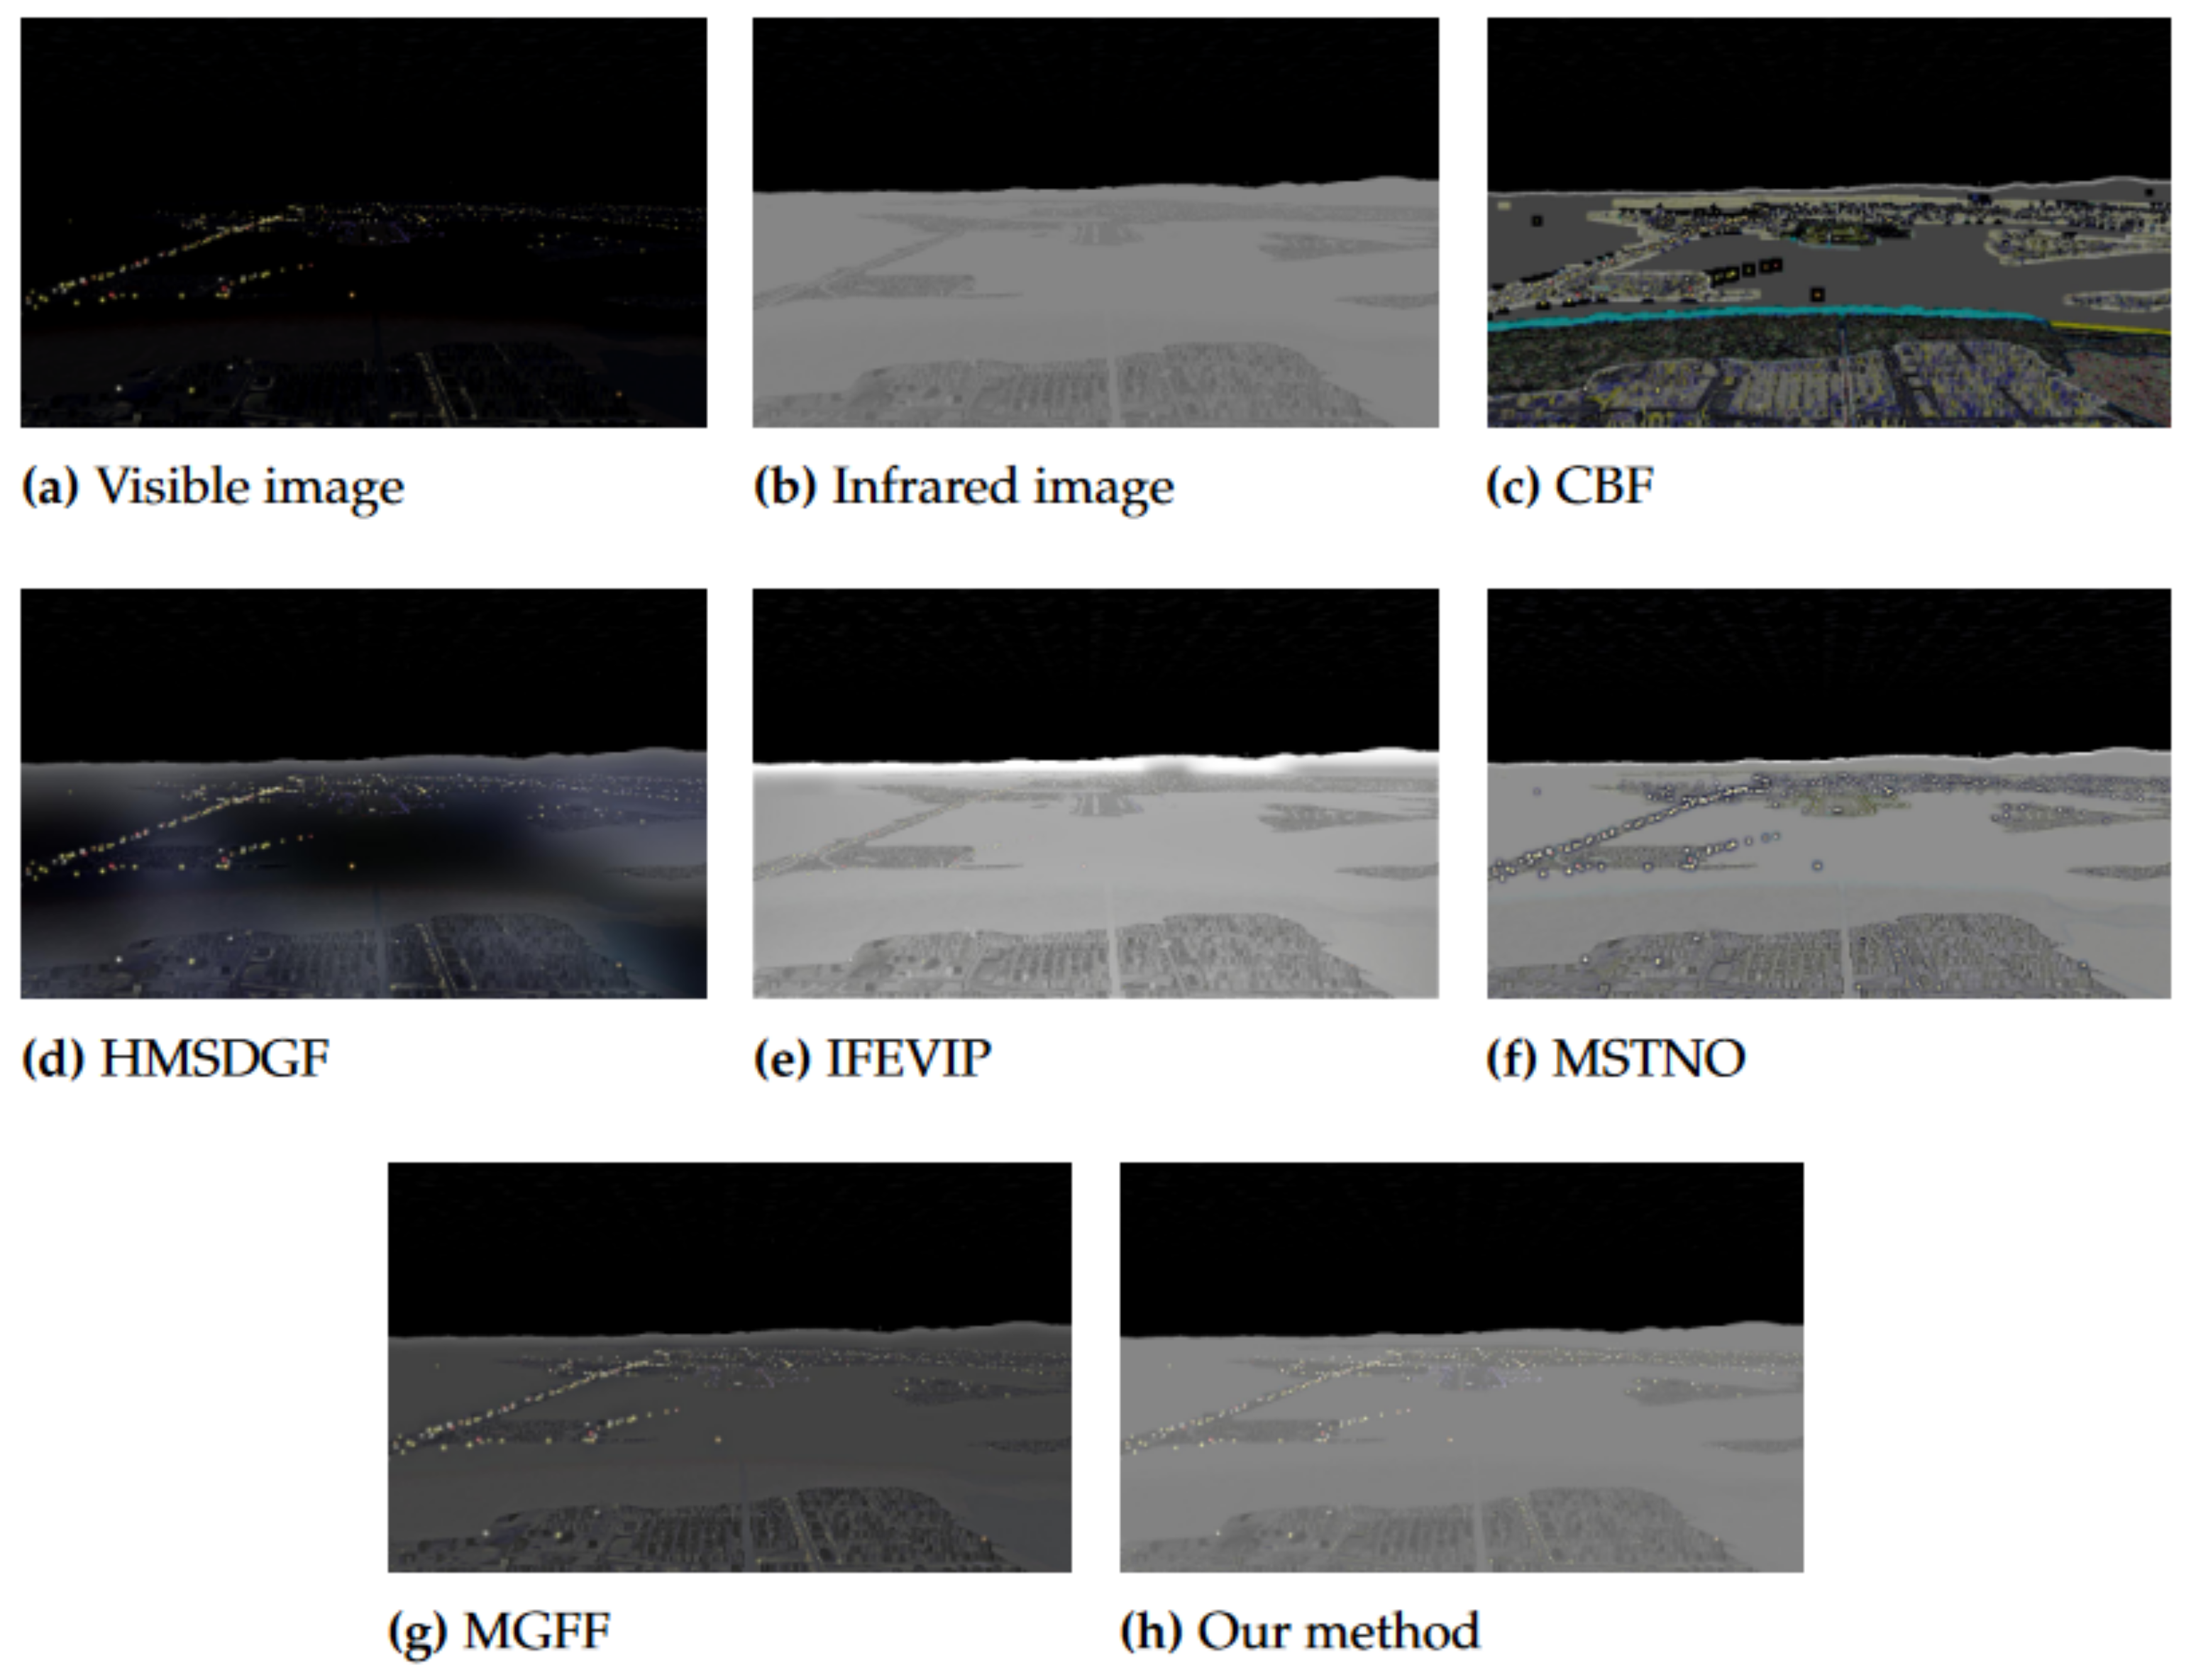
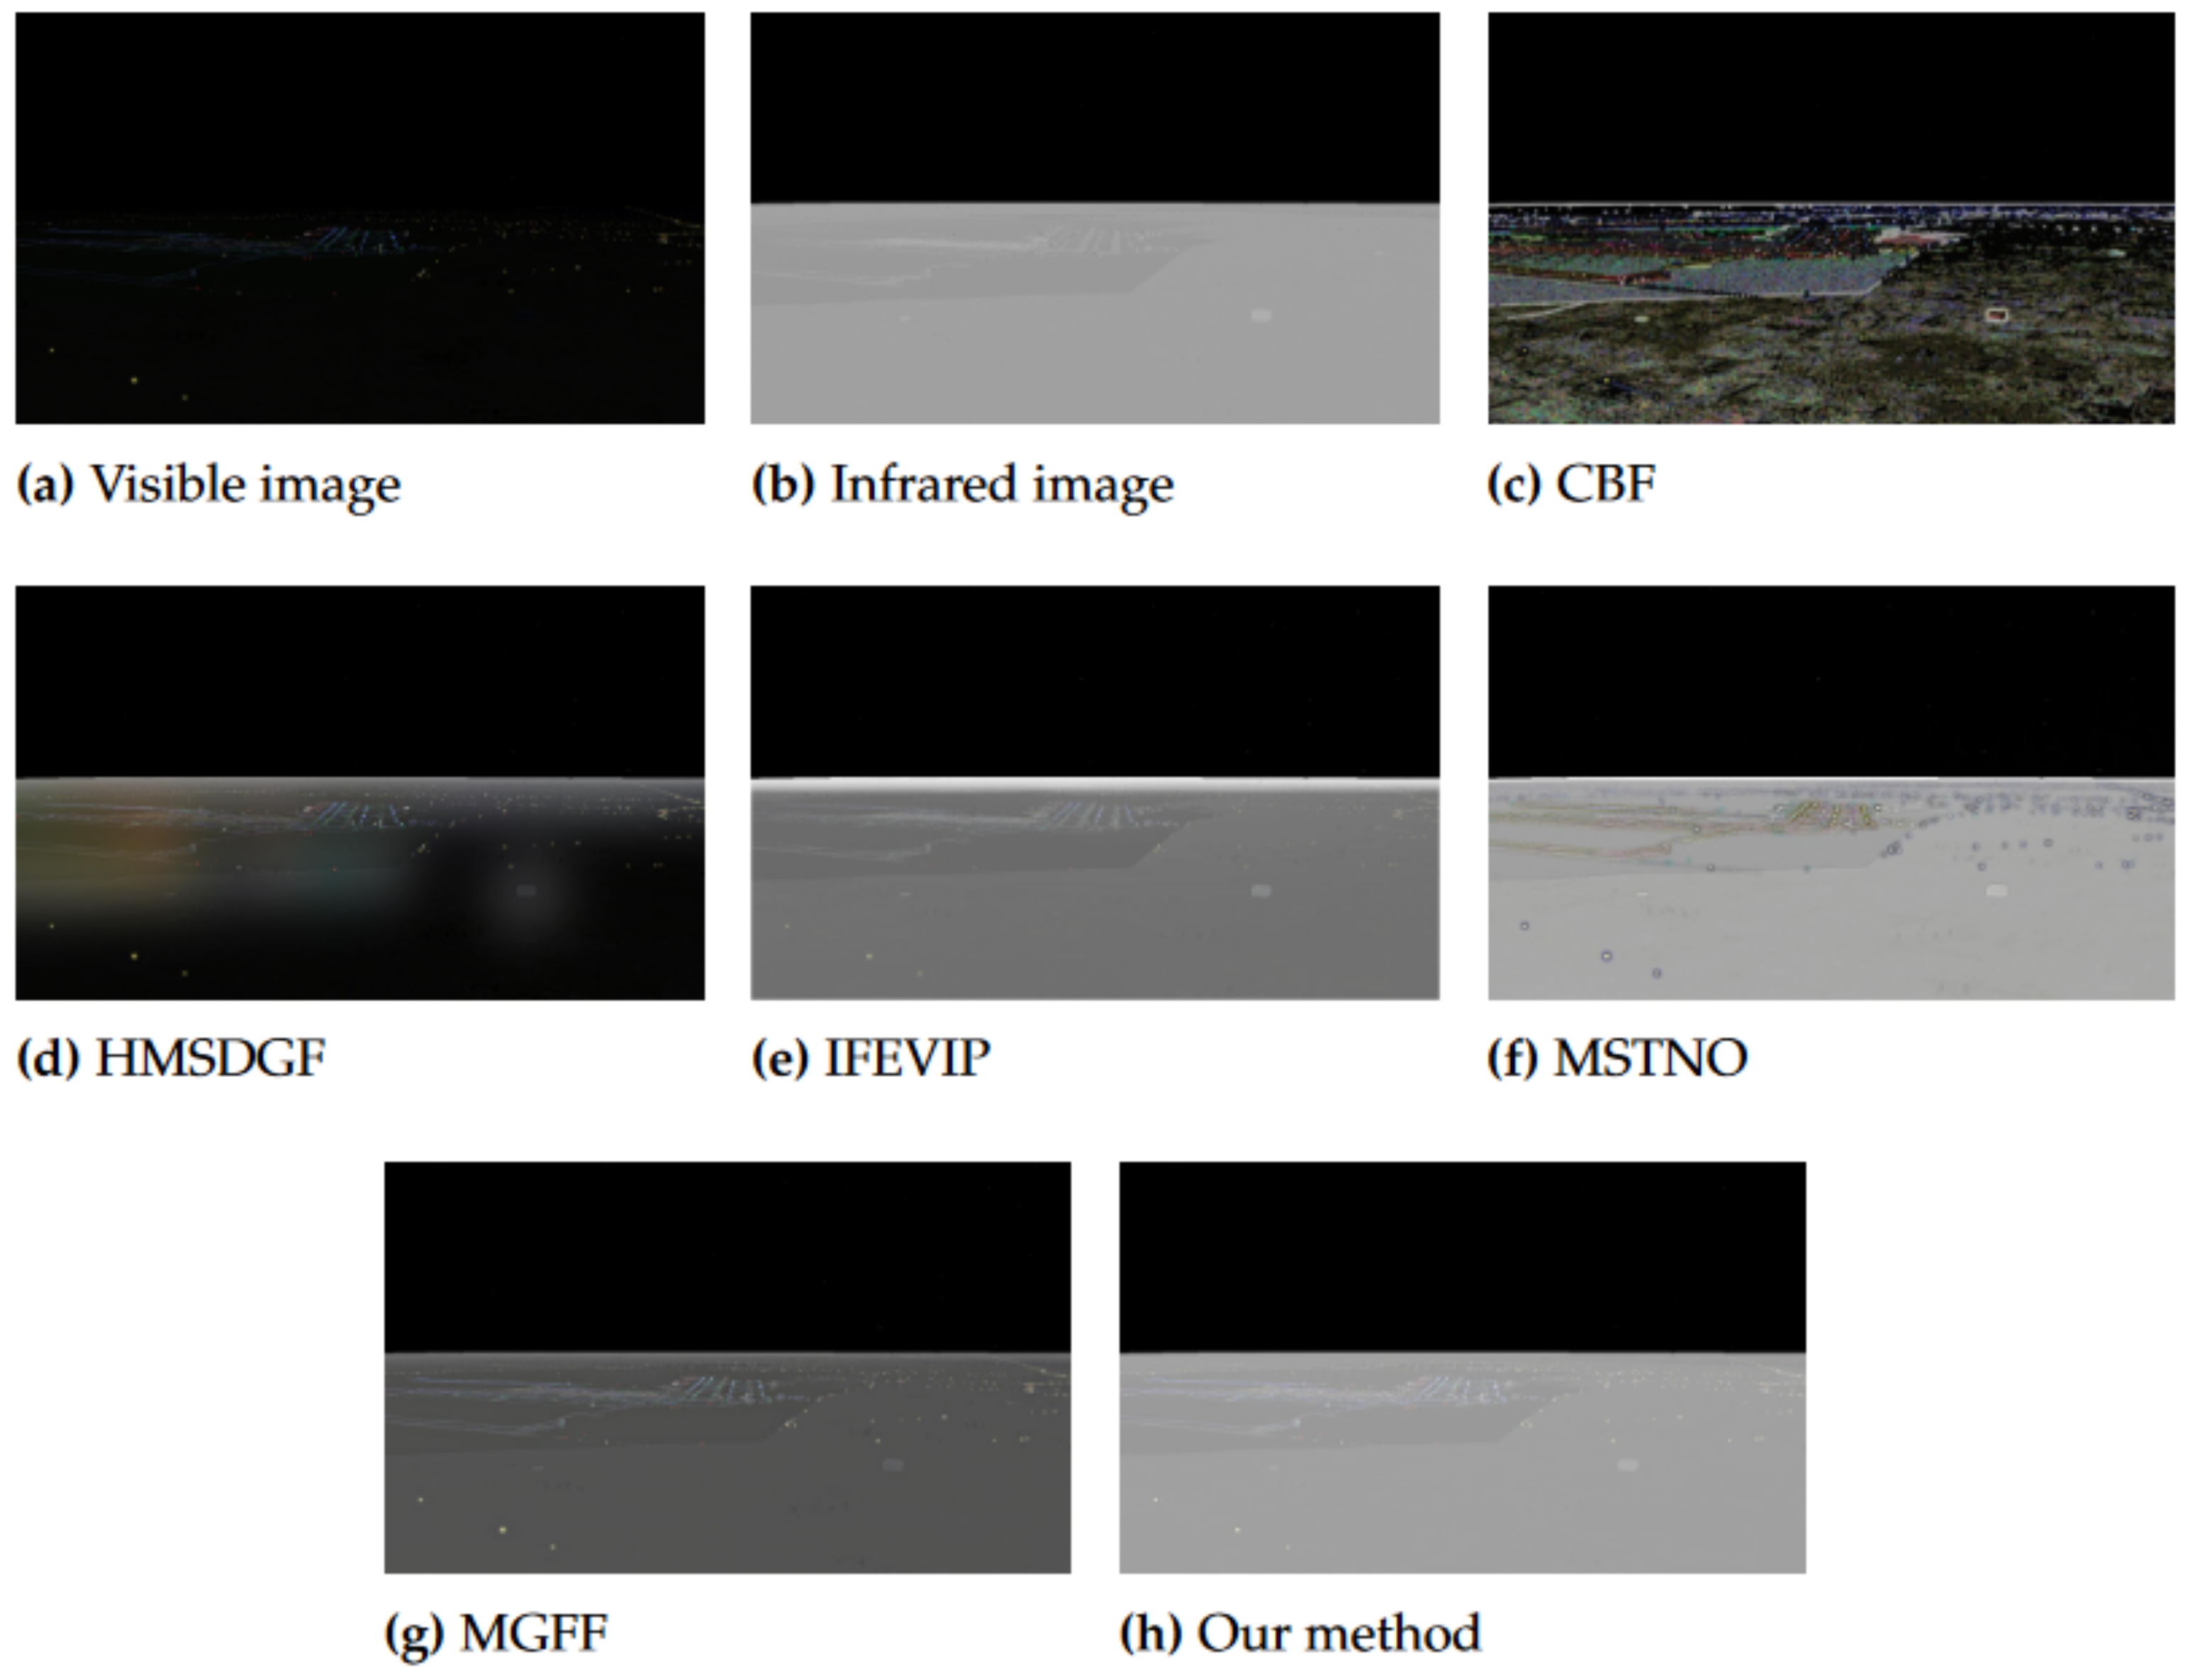
5.5.1. Fusion Comparison

The proposed image enhancement method was compared with existing image fusion methods, including CBF [36], HMSDGF [37], IFEVIP [38], MSTNO [39], and MGFF [40]. The EN, MI, and Q G were used to quantitatively compare the fusion results. For the purpose of fairness, open source code, i.e., publicly available, was utilized and we did not make any amendment to the parameters. Two pairs of visible and infrared images, Image1 and Image2, were randomly selected in the image dataset, as shown in Figure 25a,b and Figure 26a,b. Figure 25 and Figure 26 show the intuitive results of the compared methods, and the quantitative comparison of these results is summarized in Table 6.
The image enhancement method proposed in this study achieved higher EN, MI, and Q G compared with the other similar techniques, indicating that the method can achieve better fused image quality. As shown in Figure 25 and Figure 26, the CBF images have an unrealistic visual effect. The HMSDGF images have large blocks of unexpected color errors. The IFEVIP and MSTNO images have a white area at the boundary between the sky and earth. The MGFF images are not sufficiently bright. In conclusion, the results of the proposed model have better contrast, clearer details, and improved noise suppression.

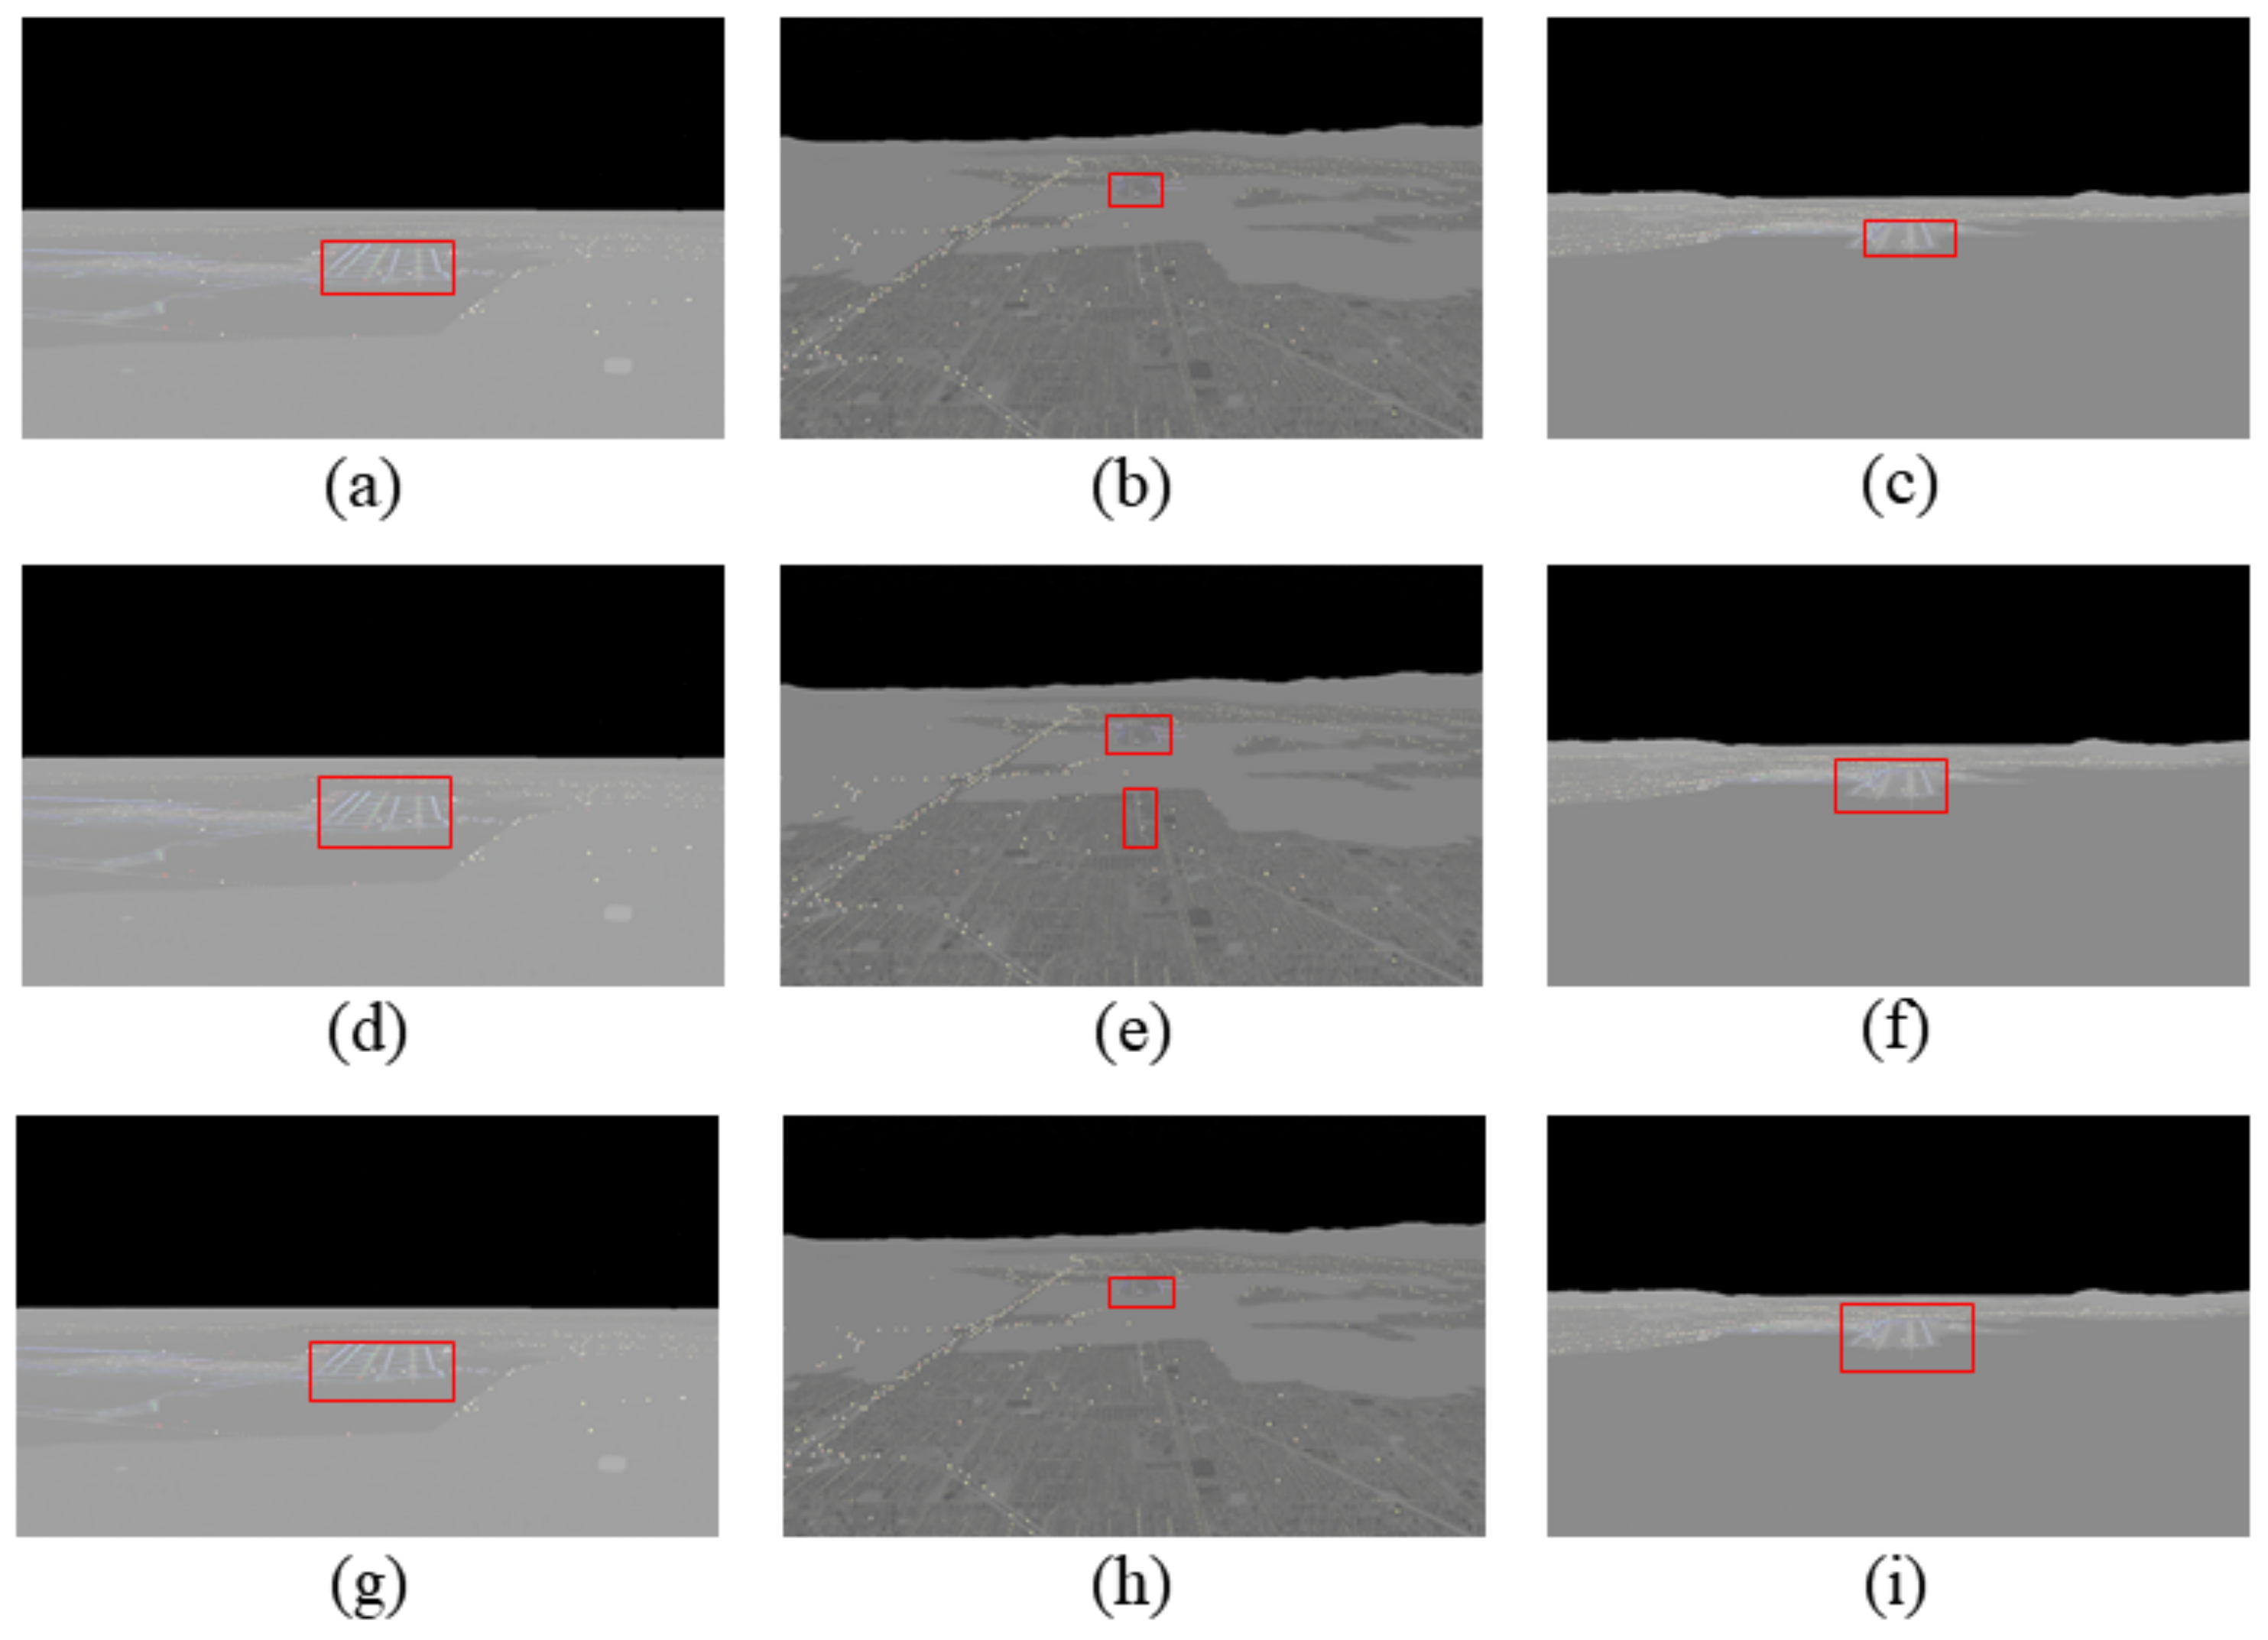
5.5.2. Runway Detection Comparison

In this section, two algorithms (MSF [41] and DCNN [42]) that performed well in airport detection in remote sensing images are compared with the algorithm proposed in this study. Figure 27 presents a visual comparison of the detection results of the three algorithms: (a–c) improved Faster R-CNN, (d–f) DCNN, and (g–i) MSF. It can be seen from Figure 27e that the DCNN algorithm could mistakenly identify roads as runways in some scenarios, which may be attributed to the generation of candidate regions based on prior knowledge of the airport segment distribution. Table 7 presents a quantitative comparison of the three algorithms. It can be seen that the proposed algorithm has the highest AP value. Figure 27 shows that the proposed algorithm accurately detected the runway because the anchor size was modified according to the runway detection scenario. In short, the proposed algorithm is one of the best-performing algorithms till date.

5.5.3. Pose Calculation Comparison

To verify the superiority of the proposed landing parameter estimation algorithm, several state-of-the-art algorithms for R and T calculation were selected for comparison, including DLT [43], DLS [44], UPnP [45] and OPnP [46], with the reprojection error as the index. The rotational and translational reprojection errors were calculated, and the results are listed in Table 8. It can be seen that the proposed algorithm has the lowest R and T reprojection errors, which means that it has the highest solution accuracy.

6. Conclusions

This paper proposed a visual navigation scheme for fixed-wing UAV autonomous landing at night. It has considered three key problems: enhancing the illumination of UAV night-airborne images, detecting the landing runway from an enhanced image, and calculating the relative attitude and position between the UAV and runway. To solve the first problem, the objective functions of the fused and visible image, and fused and infrared image were established. Then, the fusion problem was transformed into an optimal problem. To solve the second problem, we compared and analyzed the performance of three different CNNs. After that, in the candidate region extraction network part, we statistically analyzed the size of the runway ground-truth box label and improved the number and size of the anchors. To solve the third problem, we designed three feature-point layout schemes on the runway surface and adopted the OI algorithm to calculate the relative attitude and position parameters between the UAV and landing runway. The main contributions of this study are as follows:
  • For the problem of the low brightness of airborne images taken at night, which make it difficult to extract runway information and identify runway objects, an image fusion method based on gradient descent to obtain the enhanced images was proposed. This method ensures the retention of more texture details and other feature information while enhancing the brightness.
  • For the problem in which the original Faster R-CNN could not be effectively applied to the runway detection scene, the anchors were redesigned and improved. Additionally, the ResNet101 network was selected, which is the most suitable for runway feature extraction. The simulation results show that, for runway detection, we can achieve 1.85% improvement of AP by the improved Faster R-CNN.
  • For the low efficiency and poor real-time performance of nonlinear algorithms in calculating the R and T, a relative attitude and position estimation method based on the OI algorithm was proposed. The simulation results show that the reprojection error of rotation and translation for pose estimation can be as little as 0 . 675 and 0.581%, respectively.
The experimental results demonstrated the effectiveness and superiority of the newly developed algorithm.

Author Contributions

Z.W.: proposed algorithm and testing, data processing, and manuscript writing. D.Z.: research conceptualization, figure design, and manuscript review and editing. Y.C.: directing, project administration, and manuscript review. All authors have read and agreed to the published version of the manuscript.

Funding

This research was funded by the Interdisciplinary Innovation Fund For Doctoral Students of Nanjing University of Aeronautics and Astronautics (No. KXKCXJJ202203) and Postgraduate Research & Practice Innovation Program of Jiangsu Province (No. KYCX20_0210).

Institutional Review Board Statement

Not applicable.

Informed Consent Statement

Not applicable.

Data Availability Statement

The original data have not been made publicly available, but they can be used for scientific research. Other researchers can send emails to the first author if needed.

Conflicts of Interest

The authors declare no conflict of interest.

References

  1. Chen, X.; Phang, S.K.; Chen, B.M. System integration of a vision-guided UAV for autonomous tracking on moving platform in low illumination condition. In Proceedings of the ION 2017 Pacific PNT Meeting, Honolulu, HI, USA, 1–4 May 2017. [Google Scholar]
  2. Hai, J.; Hao, Y.; Zou, F.; Lin, F.; Han, S. A Visual Navigation System for UAV under Diverse Illumination Conditions. Appl. Artif. Intell. 2021, 35, 1529–1549. [Google Scholar] [CrossRef]
  3. Dudek, P.; Richardson, T.; Bose, L.; Carey, S.; Chen, J.; Greatwood, C.; Liu, Y.; Mayol-Cuevas, W. Sensor-level computer vision with pixel processor arrays for agile robots. Sci. Robot. 2022, 7, eabl7755. [Google Scholar] [CrossRef] [PubMed]
  4. Benini, A.; Rutherford, M.J.; Valavanis, K.P. Real-time, GPU-based pose estimation of a UAV for autonomous takeoff and landing. In Proceedings of the 2016 IEEE International Conference on Robotics and Automation (ICRA), Stockholm, Sweden, 16–21 May 2016. [Google Scholar]
  5. Kumar V, S.; Kashyap, S.K.; Kumar, N.S. Detection of Runway and Obstacles using Electro-optical and Infrared Sensors before Landing. Def. Sci. J. 2014, 64, 67–76. [Google Scholar]
  6. Jagannath, J.; Jagannath, A.; Furman, S.; Gwin, T. Deep learning and reinforcement learning for autonomous unmanned aerial systems: Roadmap for theory to deployment. In Deep Learning for Unmanned Systems; Springer: Berlin/Heidelberg, Germany, 2021; pp. 25–82. [Google Scholar]
  7. Araar, O.; Aouf, N.; Vitanov, I. Vision based autonomous landing of multirotor UAV on moving platform. J. Intell. Robot. Syst. 2017, 85, 369–384. [Google Scholar] [CrossRef]
  8. Brukarczyk, B.; Nowak, D.; Kot, P.; Rogalski, T.; Rzucidło, P. Fixed Wing Aircraft Automatic Landing with the Use of a Dedicated Ground Sign System. Aerospace 2021, 8, 167. [Google Scholar] [CrossRef]
  9. Wang, Z.; Liu, S.; Chen, G.; Dong, W. Robust Visual Positioning of the UAV for the Under Bridge Inspection With a Ground Guided Vehicle. IEEE Trans. Instrum. Meas. 2021, 71, 1–10. [Google Scholar] [CrossRef]
  10. Liang, X.; Chen, G.; Zhao, S.; Xiu, Y. Moving target tracking method for unmanned aerial vehicle/unmanned ground vehicle heterogeneous system based on AprilTags. Meas. Control 2020, 53, 427–440. [Google Scholar] [CrossRef] [Green Version]
  11. Khazetdinov, A.; Zakiev, A.; Tsoy, T.; Svinin, M.; Magid, E. Embedded ArUco: A novel approach for high precision UAV landing. In Proceedings of the 2021 International Siberian Conference on Control and Communications (SIBCON), Kazan, Russia, 13–15 May 2021. [Google Scholar]
  12. Pang, Y.; Cheng, S.; Hu, J.; Liu, Y. Evaluating the robustness of bayesian neural networks against different types of attacks. arXiv 2021, arXiv:2106.09223. [Google Scholar]
  13. Chan, T.F.; Esedoglu, S. Aspects of total variation regularized L 1 function approximation. SIAM J. Appl. Math. 2005, 65, 1817–1837. [Google Scholar] [CrossRef] [Green Version]
  14. Zhao, Z.Q.; Zheng, P.; Xu, S.t.; Wu, X. Object detection with deep learning: A review. IEEE Trans. Neural Netw. Learn. Syst. 2019, 30, 3212–3232. [Google Scholar] [CrossRef] [Green Version]
  15. Redmon, J.; Divvala, S.; Girshick, R.; Farhadi, A. You only look once: Unified, real-time object detection. In Proceedings of the 2016 IEEE Conference on Computer Vision and Pattern Recognition, Las Vegas, CA, USA, 27–30 June 2016. [Google Scholar]
  16. Liu, W.; Anguelov, D.; Erhan, D.; Szegedy, C.; Reed, S.; Fu, C.Y.; Berg, A.C. Ssd: Single shot multibox detector. In Proceedings of the 2016 European Conference on Computer Vision, Amsterdam, The Netherlands, 11–14 October 2016. [Google Scholar]
  17. Girshick, R. Fast r-cnn. In Proceedings of the 2015 IEEE International Conference on Computer Vision, Santiago, Chile, 7–13 December 2015. [Google Scholar]
  18. Ren, S.; He, K.; Girshick, R.; Sun, J. Faster r-cnn: Towards real-time object detection with region proposal networks. IEEE Trans. Pattern Anal. Mach. Intell. 2017, 39, 1137–1149. [Google Scholar] [CrossRef] [PubMed] [Green Version]
  19. Dai, J.; Li, Y.; He, K.; Sun, J. R-FCN: Object detection via region-based fully convolutional networks. Adv. Neural Inf. Process. Syst. 2016, 29, 4–9. [Google Scholar]
  20. Wan, S.; Goudos, S. Faster R-CNN for multi-class fruit detection using a robotic vision system. Comput. Netw. 2020, 168, 10703–107042. [Google Scholar] [CrossRef]
  21. Li, C.j.; Qu, Z.; Wang, S.y.; Liu, L. A method of cross-layer fusion multi-object detection and recognition based on improved faster R-CNN model in complex traffic environment. Pattern Recognit. Lett. 2021, 145, 127–134. [Google Scholar] [CrossRef]
  22. Yang, Y.; Gong, H.; Wang, X.; Sun, P. Aerial target tracking algorithm based on faster R-CNN combined with frame differencing. Aerospace 2017, 4, 32. [Google Scholar] [CrossRef] [Green Version]
  23. Doğru, A.; Bouarfa, S.; Arizar, R.; Aydoğan, R. Using convolutional neural networks to automate aircraft maintenance visual inspection. Aerospace 2020, 7, 171. [Google Scholar] [CrossRef]
  24. Simonyan, K.; Zisserman, A. Very deep convolutional networks for large-scale image recognition. arXiv 2014, arXiv:1409.1556. [Google Scholar]
  25. Szegedy, C.; Liu, W.; Jia, Y.; Sermanet, P.; Reed, S.; Anguelov, D.; Erhan, D.; Vanhoucke, V.; Rabinovich, A. Going deeper with convolutions. In Proceedings of the IEEE Conference on Computer Vision and Pattern Recognition, Boston, MA, USA, 7–12 June 2015. [Google Scholar]
  26. He, K.; Zhang, X.; Ren, S.; Sun, J. Deep residual learning for image recognition. In Proceedings of the 2016 IEEE Conference on Computer Vision and Pattern Recognition, Las Vegas, CA, USA, 27–30 June 2016. [Google Scholar]
  27. Redmon, J.; Farhadi, A. YOLO9000: Better, faster, stronger. In Proceedings of the 2017 IEEE Conference on Computer Vision and Pattern Recognition, Honolulu, HI, USA, 21–26 July 2017. [Google Scholar]
  28. Lu, C.P.; Hager, G.D.; Mjolsness, E. Fast and globally convergent pose estimation from video images. IEEE Trans. Pattern Anal. Mach. Intell. 2000, 22, 610–622. [Google Scholar] [CrossRef] [Green Version]
  29. Download Link if FightGear 2020.3. Available online: https://www.flightgear.org/ (accessed on 1 December 2021).
  30. Liu, Y.; Liu, S.; Wang, Z. A general framework for image fusion based on multi-scale transform and sparse representation. Inf. Fusion 2015, 24, 147–164. [Google Scholar] [CrossRef]
  31. Qu, G.; Zhang, D.; Yan, P. Information measure for performance of image fusion. Electron. Lett. 2002, 38, 313–315. [Google Scholar] [CrossRef] [Green Version]
  32. Xydeas, C.; Petrovic, V. Objective image fusion performance measure. Electron. Lett. 2000, 36, 308–309. [Google Scholar] [CrossRef] [Green Version]
  33. Han, L.; Yu, C.; Xiao, K.; Zhao, X. A new method of mixed gas identification based on a convolutional neural network for time series classification. Sensors 2019, 19, 1960. [Google Scholar] [CrossRef] [PubMed] [Green Version]
  34. Bazi, Y.; Al Rahhal, M.M.; Alhichri, H.; Alajlan, N. Simple yet effective fine-tuning of deep CNNs using an auxiliary classification loss for remote sensing scene classification. Remote Sens. 2019, 11, 2908. [Google Scholar] [CrossRef] [Green Version]
  35. Ji, C.; Cheng, L.; Li, N.; Zeng, F.; Li, M. Validation of global airport spatial locations from open databases using deep learning for runway detection. IEEE J. Sel. Top. Appl. Earth Obs. Remote Sens. 2020, 14, 1120–1131. [Google Scholar] [CrossRef]
  36. Shreyamsha Kumar, B. Image fusion based on pixel significance using cross bilateral filter. Signal Image Video Process. 2015, 9, 1193–1204. [Google Scholar] [CrossRef]
  37. Zhou, Z.; Dong, M.; Xie, X.; Gao, Z. Fusion of infrared and visible images for night-vision context enhancement. Appl. Opt. 2016, 55, 6480–6490. [Google Scholar] [CrossRef]
  38. Zhang, Y.; Zhang, L.; Bai, X.; Zhang, L. Infrared and visual image fusion through infrared feature extraction and visual information preservation. Infrared Phys. Technol. 2017, 83, 227–237. [Google Scholar] [CrossRef]
  39. Li, G.; Lin, Y.; Qu, X. An infrared and visible image fusion method based on multi-scale transformation and norm optimization. Inf. Fusion 2021, 71, 109–129. [Google Scholar] [CrossRef]
  40. Bavirisetti, D.P.; Xiao, G.; Zhao, J.; Dhuli, R.; Liu, G. Multi-scale guided image and video fusion: A fast and efficient approach. Circ. Syst. Signal Process. 2019, 38, 5576–5605. [Google Scholar] [CrossRef]
  41. Xiao, Z.; Gong, Y.; Long, Y.; Li, D.; Wang, X.; Liu, H. Airport detection based on a multiscale fusion feature for optical remote sensing images. IEEE Geosci. Remote Sens. Lett. 2017, 14, 1469–1473. [Google Scholar] [CrossRef]
  42. Zhang, P.; Niu, X.; Dou, Y.; Xia, F. Airport detection on optical satellite images using deep convolutional neural networks. IEEE Geosci. Remote Sens. Lett. 2017, 14, 1183–1187. [Google Scholar] [CrossRef]
  43. Abdel-Aziz, Y.I.; Karara, H.M.; Hauck, M. Direct linear transformation from comparator coordinates into object space coordinates in close-range photogrammetry. Photogramm. Eng. Remote Sens. 2015, 81, 103–107. [Google Scholar] [CrossRef]
  44. Hesch, J.A.; Roumeliotis, S.I. A direct least-squares (DLS) method for PnP. In Proceedings of the 2011 International Conference on Computer Vision, Barcelona, Spain, 6–13 November 2011. [Google Scholar]
  45. Kneip, L.; Li, H.; Seo, Y. Upnp: An optimal o (n) solution to the absolute pose problem with universal applicability. In Proceedings of the 2014 European Conference on Computer Vision, Zurich, Switzerland, 6–12 September 2014. [Google Scholar]
  46. Zheng, Y.; Kuang, Y.; Sugimoto, S.; Astrom, K.; Okutomi, M. Revisiting the pnp problem: A fast, general and optimal solution. In Proceedings of the 2013 IEEE International Conference on Computer Vision, Sydney, Australia, 1–8 December 2013. [Google Scholar]
Figure 1. Detection comparison between the (a) low-light image and (b) enhanced image.
Aerospace 09 00615 g001
Figure 2. Structure of the proposed navigation algorithm.
Aerospace 09 00615 g002
Figure 3. Faster R-CNN structure.
Aerospace 09 00615 g003
Figure 4. Illustration of RPN structure.
Aerospace 09 00615 g004
Figure 5. Effect of the number of anchors on the mean IoU.
Aerospace 09 00615 g005
Figure 6. Aspect ratio and size of the ground-truth box of the dataset. The unit of the Box Area is pixel.
Aerospace 09 00615 g006
Figure 7. Illustration of reference coordinate systems.
Aerospace 09 00615 g007
Figure 8. Schematic of runway feature point layout. (a) Five feature points. (b) Seven feature points. (c) Nine feature points.
Aerospace 09 00615 g008
Figure 9. The fixed-wing UAV MQ-9.
Aerospace 09 00615 g009
Figure 10. The first row is Data 1; the second row is Data 2; and the third row is Data 3. The first, second, and third columns show normal light, night visible, and infrared images, respectively.
Aerospace 09 00615 g010
Figure 11. Fused results of Data 1 as η changes.
Aerospace 09 00615 g011
Figure 12. Fused results of Data 2 as η changes.
Aerospace 09 00615 g012
Figure 13. Fused results of Data 3 as η changes.
Aerospace 09 00615 g013
Figure 14. EN evaluation results at different η values.
Aerospace 09 00615 g014
Figure 15. MI evaluation results at different η values.
Aerospace 09 00615 g015
Figure 16. Q G evaluation results at different η values.
Aerospace 09 00615 g016
Figure 17. Runway detection results with default anchor size.
Aerospace 09 00615 g017
Figure 18. Runway detection results with improved anchor size.
Aerospace 09 00615 g018
Figure 19. Error of five feature points. The unit of the attitude error is degree. The unit of the position error is meter. The horizontal axis in all figures is the number of measurement points.
Aerospace 09 00615 g019
Figure 20. Error of seven feature points.The unit of the attitude error is degree. The unit of the position error is meter. The horizontal axis in all figures is the number of measurement points.
Aerospace 09 00615 g020
Figure 21. Error of nine feature points. The unit of the attitude error is degree. The unit of the position error is meter. The horizontal axis in all figures is the number of measurement points.
Aerospace 09 00615 g021
Figure 22. Error of 5 feature points with different SD. The unit of the attitude error is degree. The unit of the position error is meter. The horizontal axis in all figures is the number of measurement points.
Aerospace 09 00615 g022
Figure 23. Error of 7 feature points with different SD. The unit of the attitude error is degree. The unit of the position error is meter. The horizontal axis in all figures is the number of measurement points.
Aerospace 09 00615 g023
Figure 24. Error of 9 feature points with different SD. The unit of the attitude error is degree. The unit of the position error is meter. The horizontal axis in all figures is the number of measurement points.
Aerospace 09 00615 g024
Figure 25. Visual comparison between different fusion methods of Image1.
Aerospace 09 00615 g025
Figure 26. Visual comparison between different fusion methods of Image2.
Aerospace 09 00615 g026
Figure 27. Detection results of three algorithms.
Aerospace 09 00615 g027
Table 1. The MQ-9 properties.
UAVLengthWingspanHeightMax
Takeoff
Weight
Cruising
Speed
RangeEndurance
MQ-911 m20 m3.81 m4760 kg313
km/h
1852 km14 h
Table 2. Characteristics of three different airports.
AirportICAOLatitudeLongitudeElevationRunway Length
Livermore Municipal AirportKLVK37.693−121.821400 ft5248 ft
George Bush Intercontinental AirportIAH29.983−95.34297 ft11,995 ft
San Francisco International AirportKSFO37.619−122.37513 ft11,867 ft
Table 3. Comparison of different feature extraction models.
Test DataFeature Extraction ModelAP Value
AirportVGG1979.23%
AirportResNet10182.52%
AirportInception V480.95%
Table 4. Quantitative comparison of different anchor sizes.
AnchorFeature Extraction ModelAP Value
DefaultResNet10182.52%
ImprovedResNet10184.37%
Table 5. The influence on pose estimation accuracy and computation time when feature-point number increases.
Feature-Point Number567891011
Mean rotational reprojection error/ 15.7316.8795.1063.3540.6750.7020.693
Mean translational reprojection error/%13.90511.1274.9142.6320.5810.5870.546
Mean computational time m s 1.5973.9644.1566.0979.57210.48415.803
Table 6. Quantitative comparison between different fusion methods.
MethodENMI Q G
CBF4.5192.1660.415
HMSDGF4.2291.8570.437
IFEVIP3.9082.5760.280
MSTNO4.7212.8890.355
MGFF4.2132.6280.408
Our method4.8233.0330.467
Table 7. Quantitative comparison between different algorithms.
MethodAP Value
Improved Faster R-CNN84.37%
DCNN80.81%
DSF82.19%
Table 8. Pose calculation comparison.
MethodRotational Reprojection
Error/
Translational Reprojection
Error/%
DLT2.5942.386
DLS1.1640.953
UPnP0.7760.627
OPnP0.6930.603
Our method0.6750.581
Publisher’s Note: MDPI stays neutral with regard to jurisdictional claims in published maps and institutional affiliations.

