
Cooling Characteristic of a Wall Jet for Suppressing Crossflow Effect under Conjugate Heat Transfer Condition


Abstract
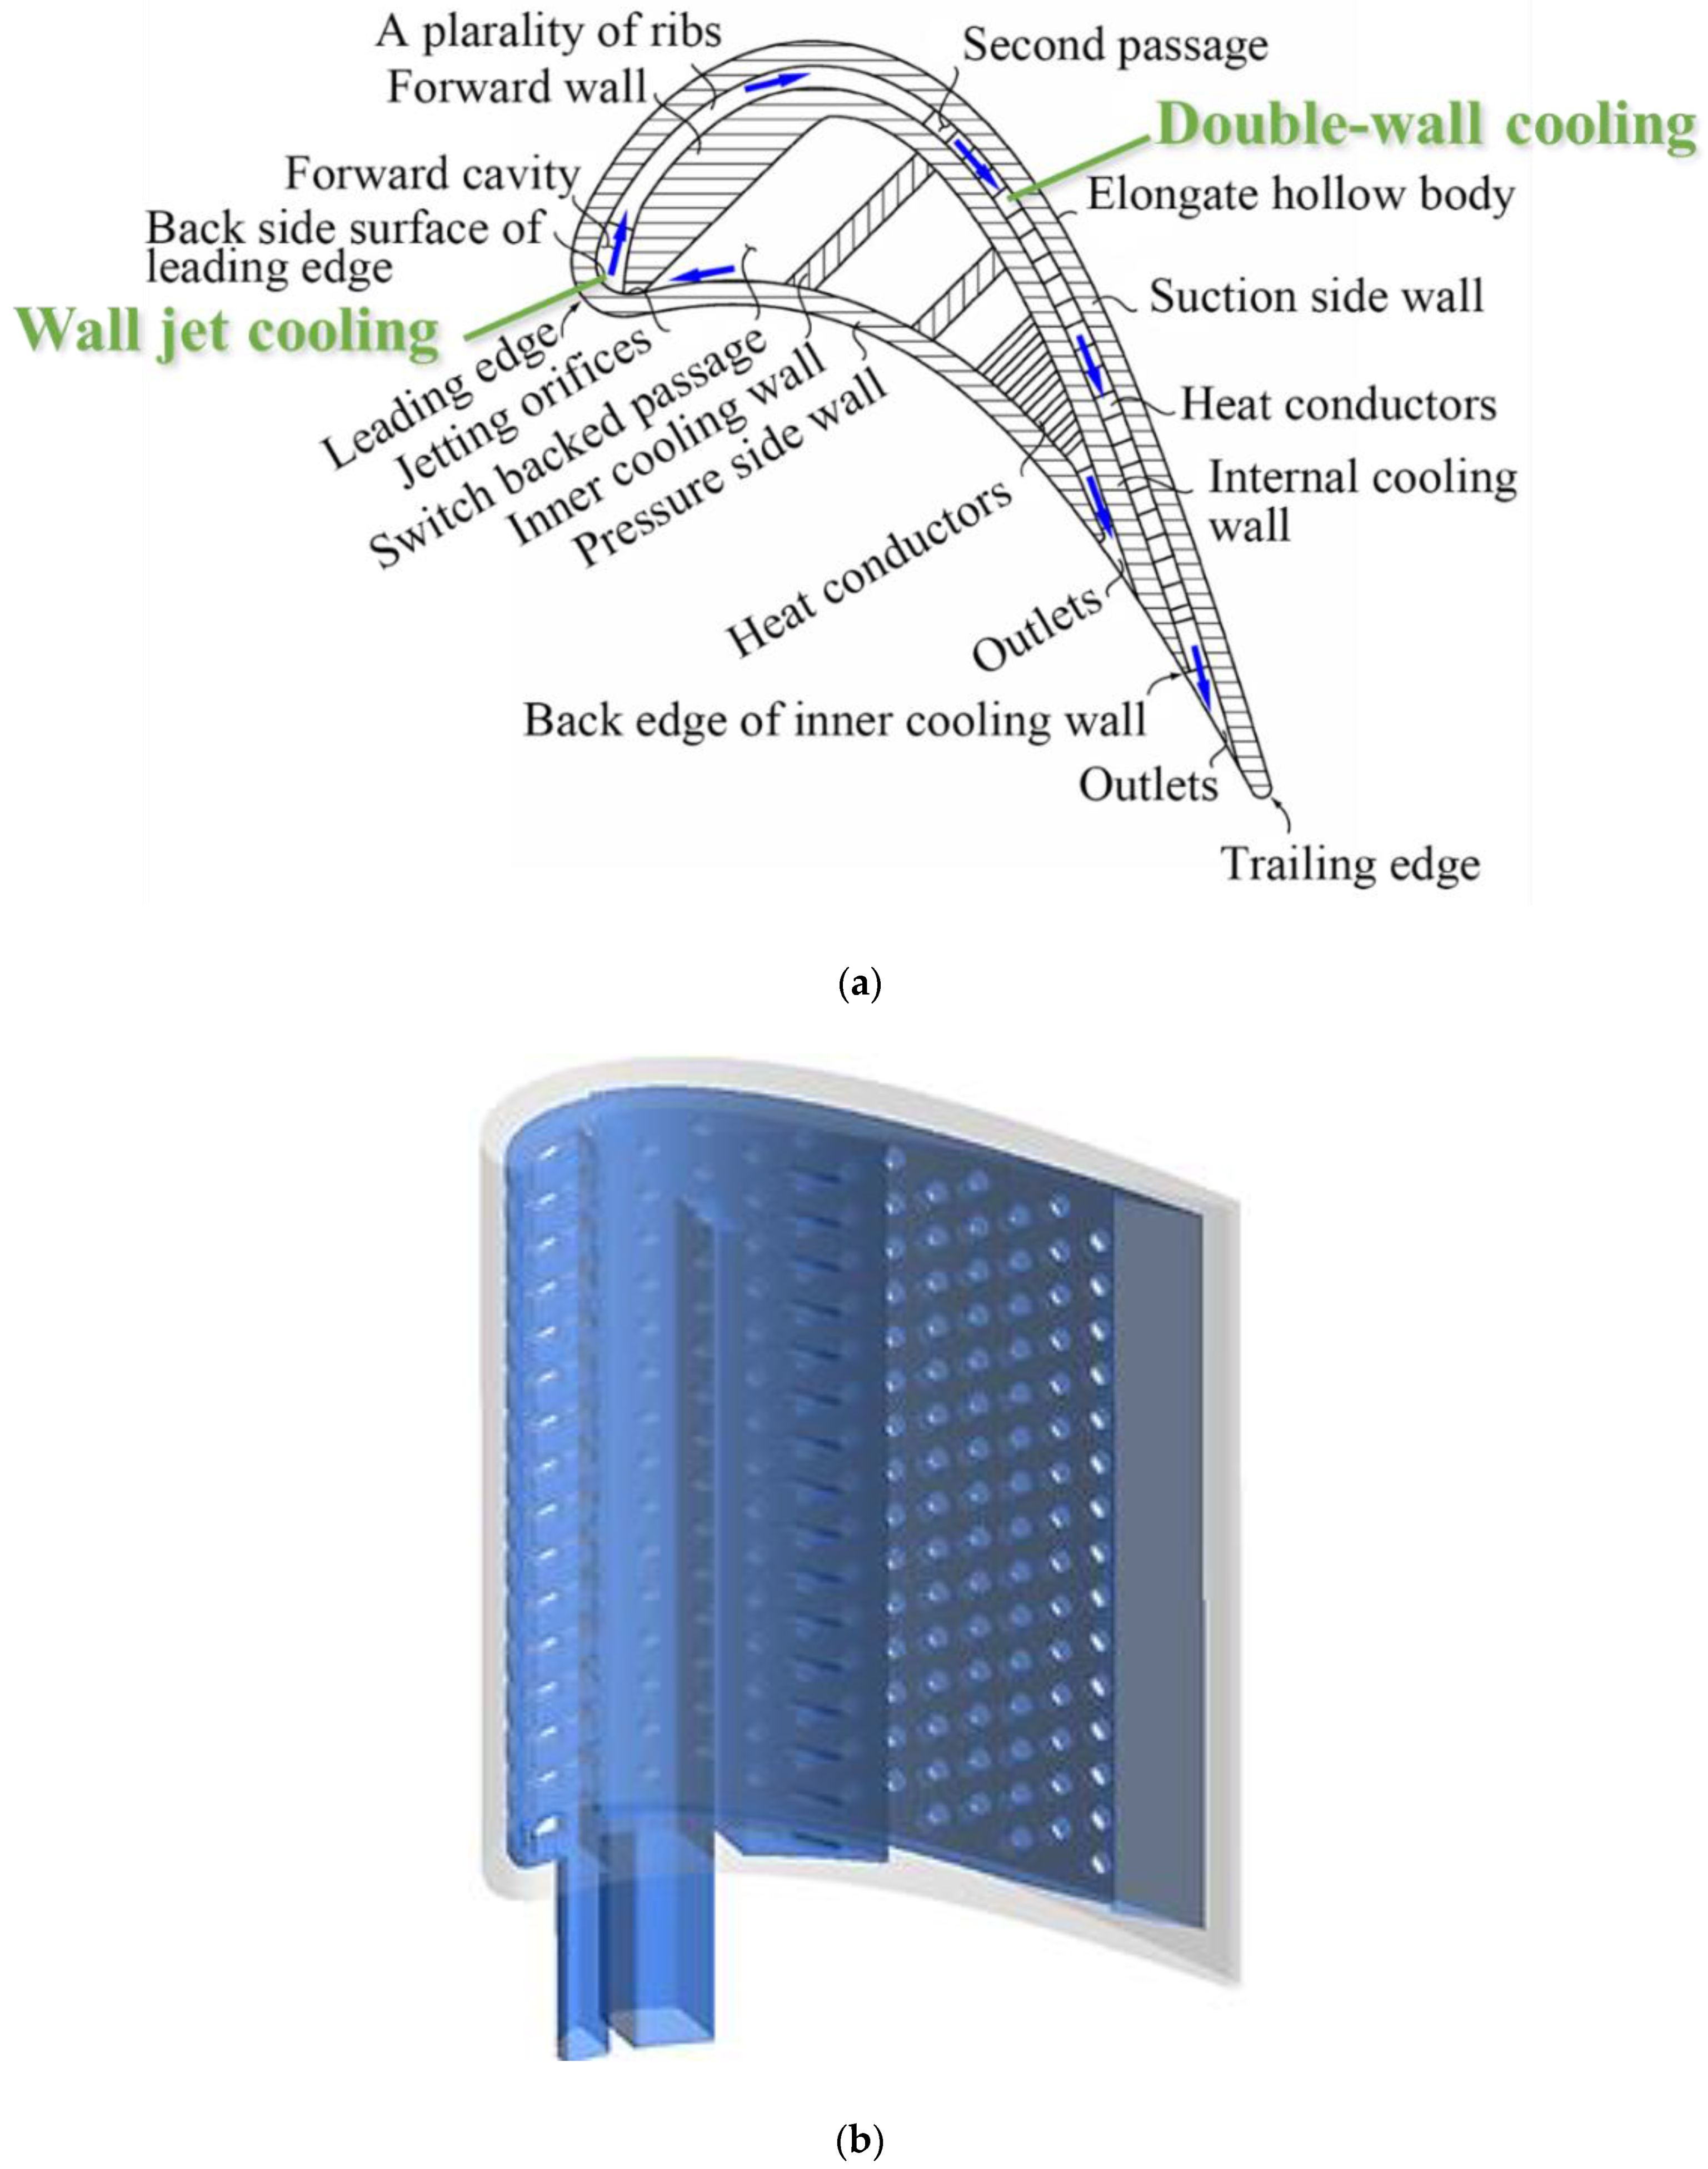
:1. Introduction
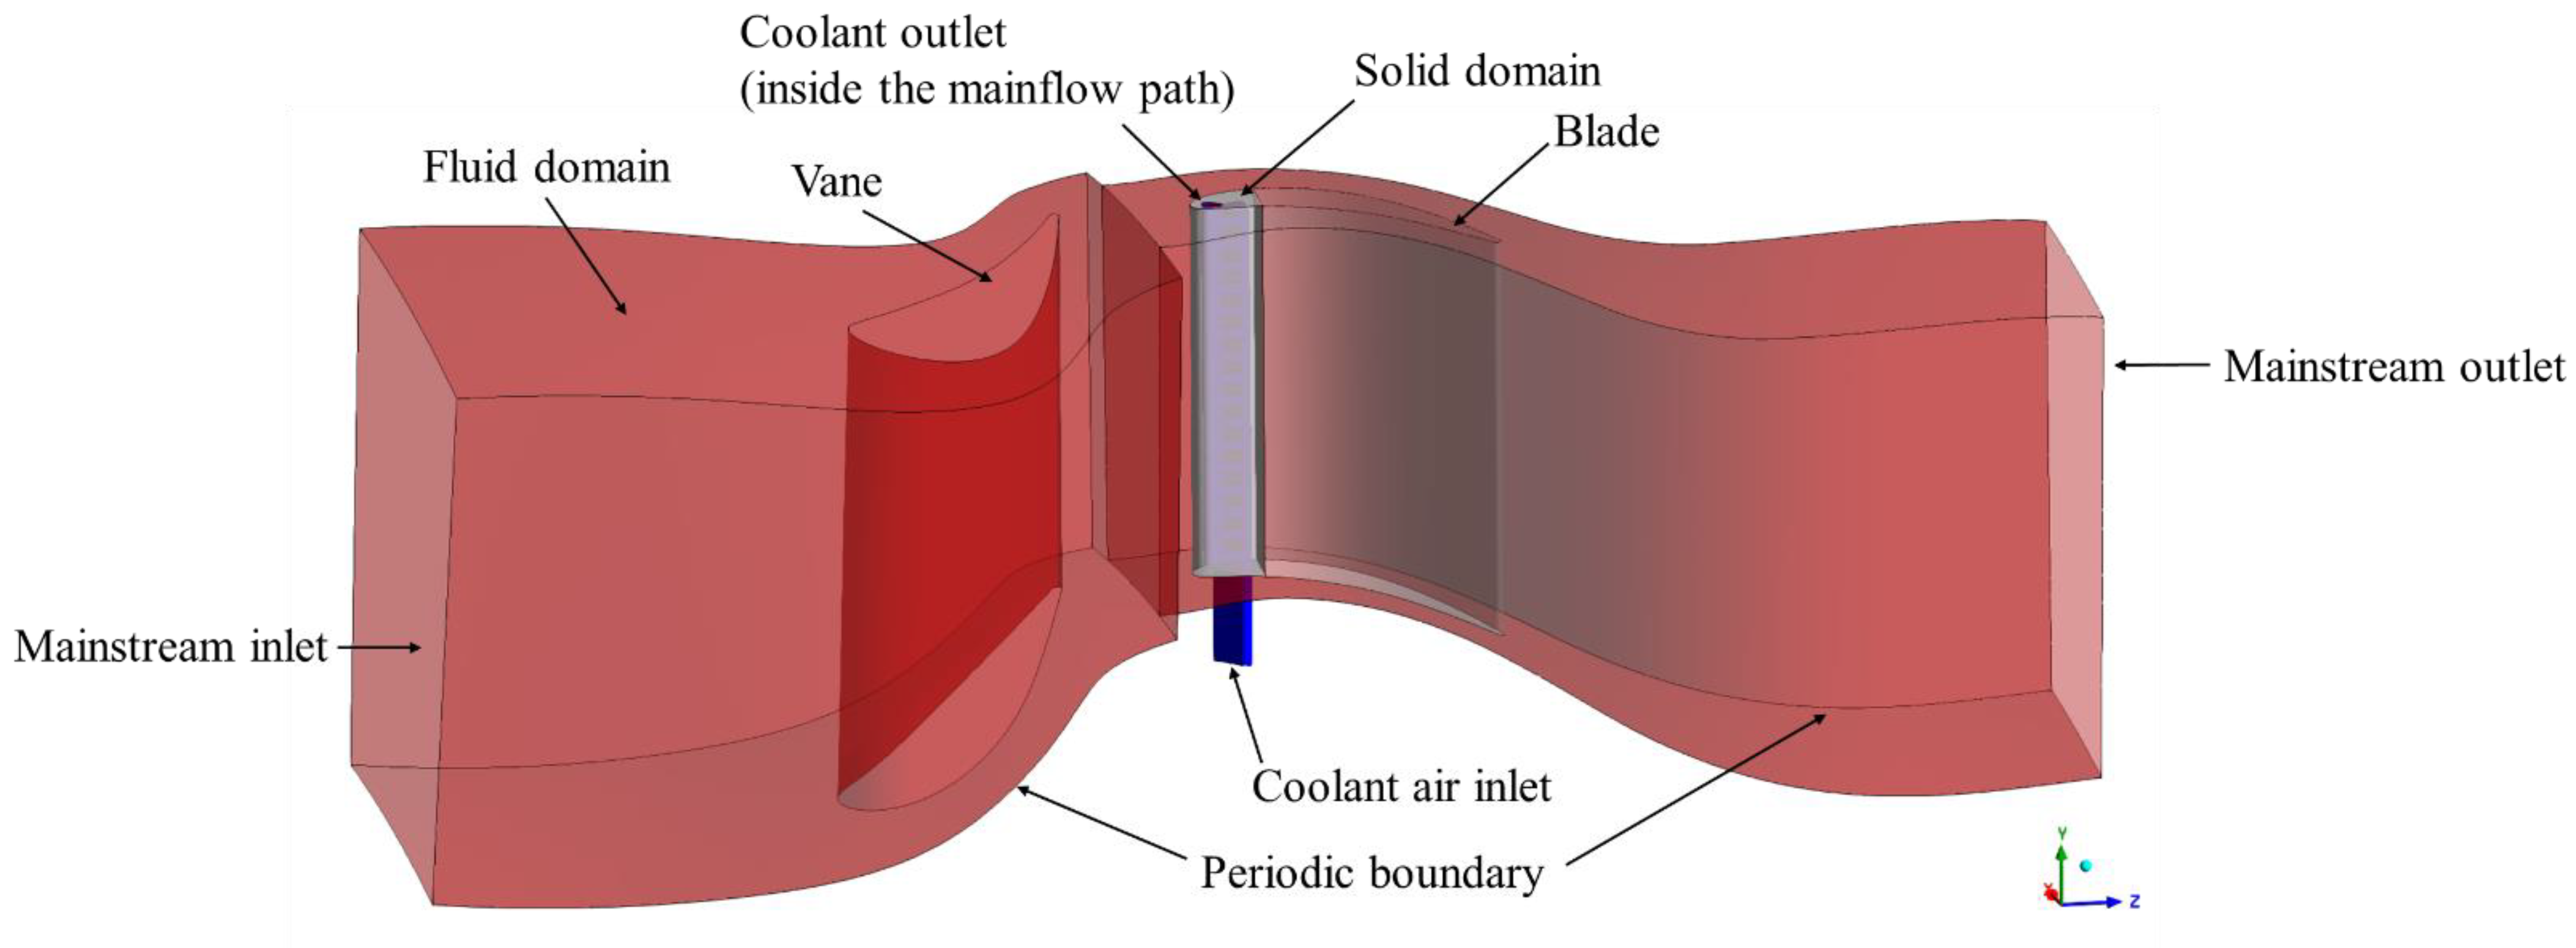
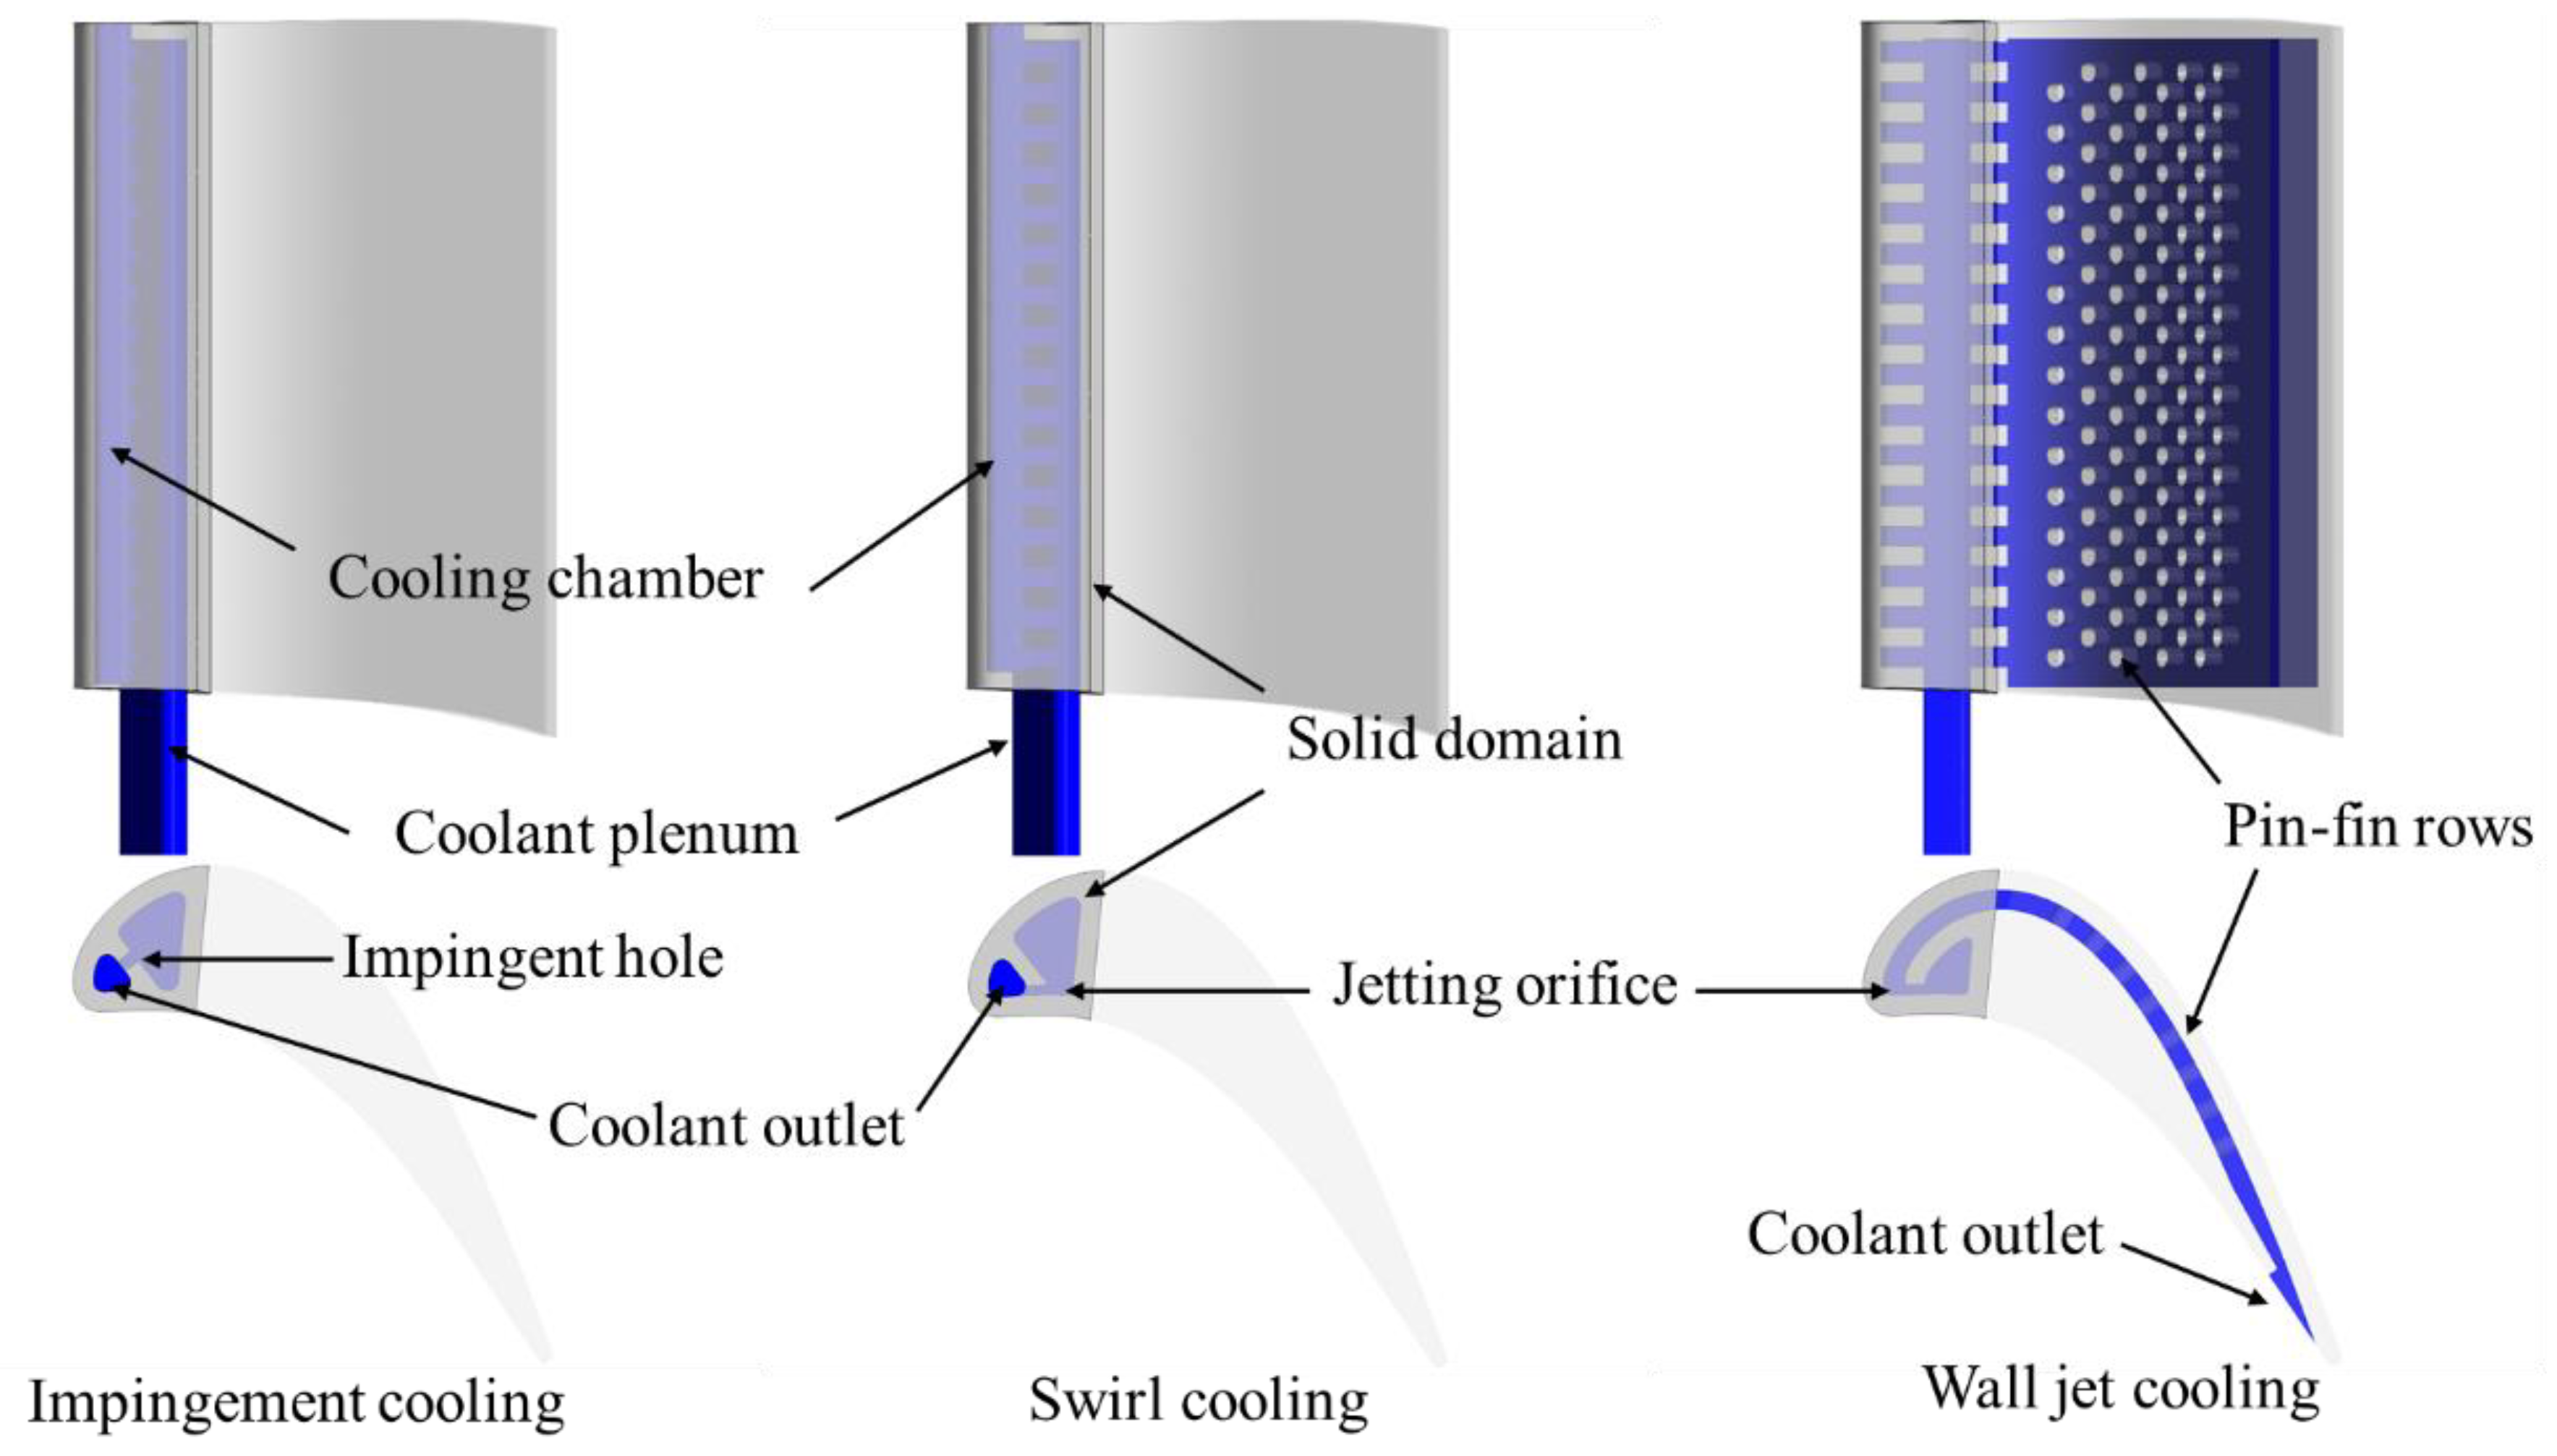
2. Computational Model & Numerical Method
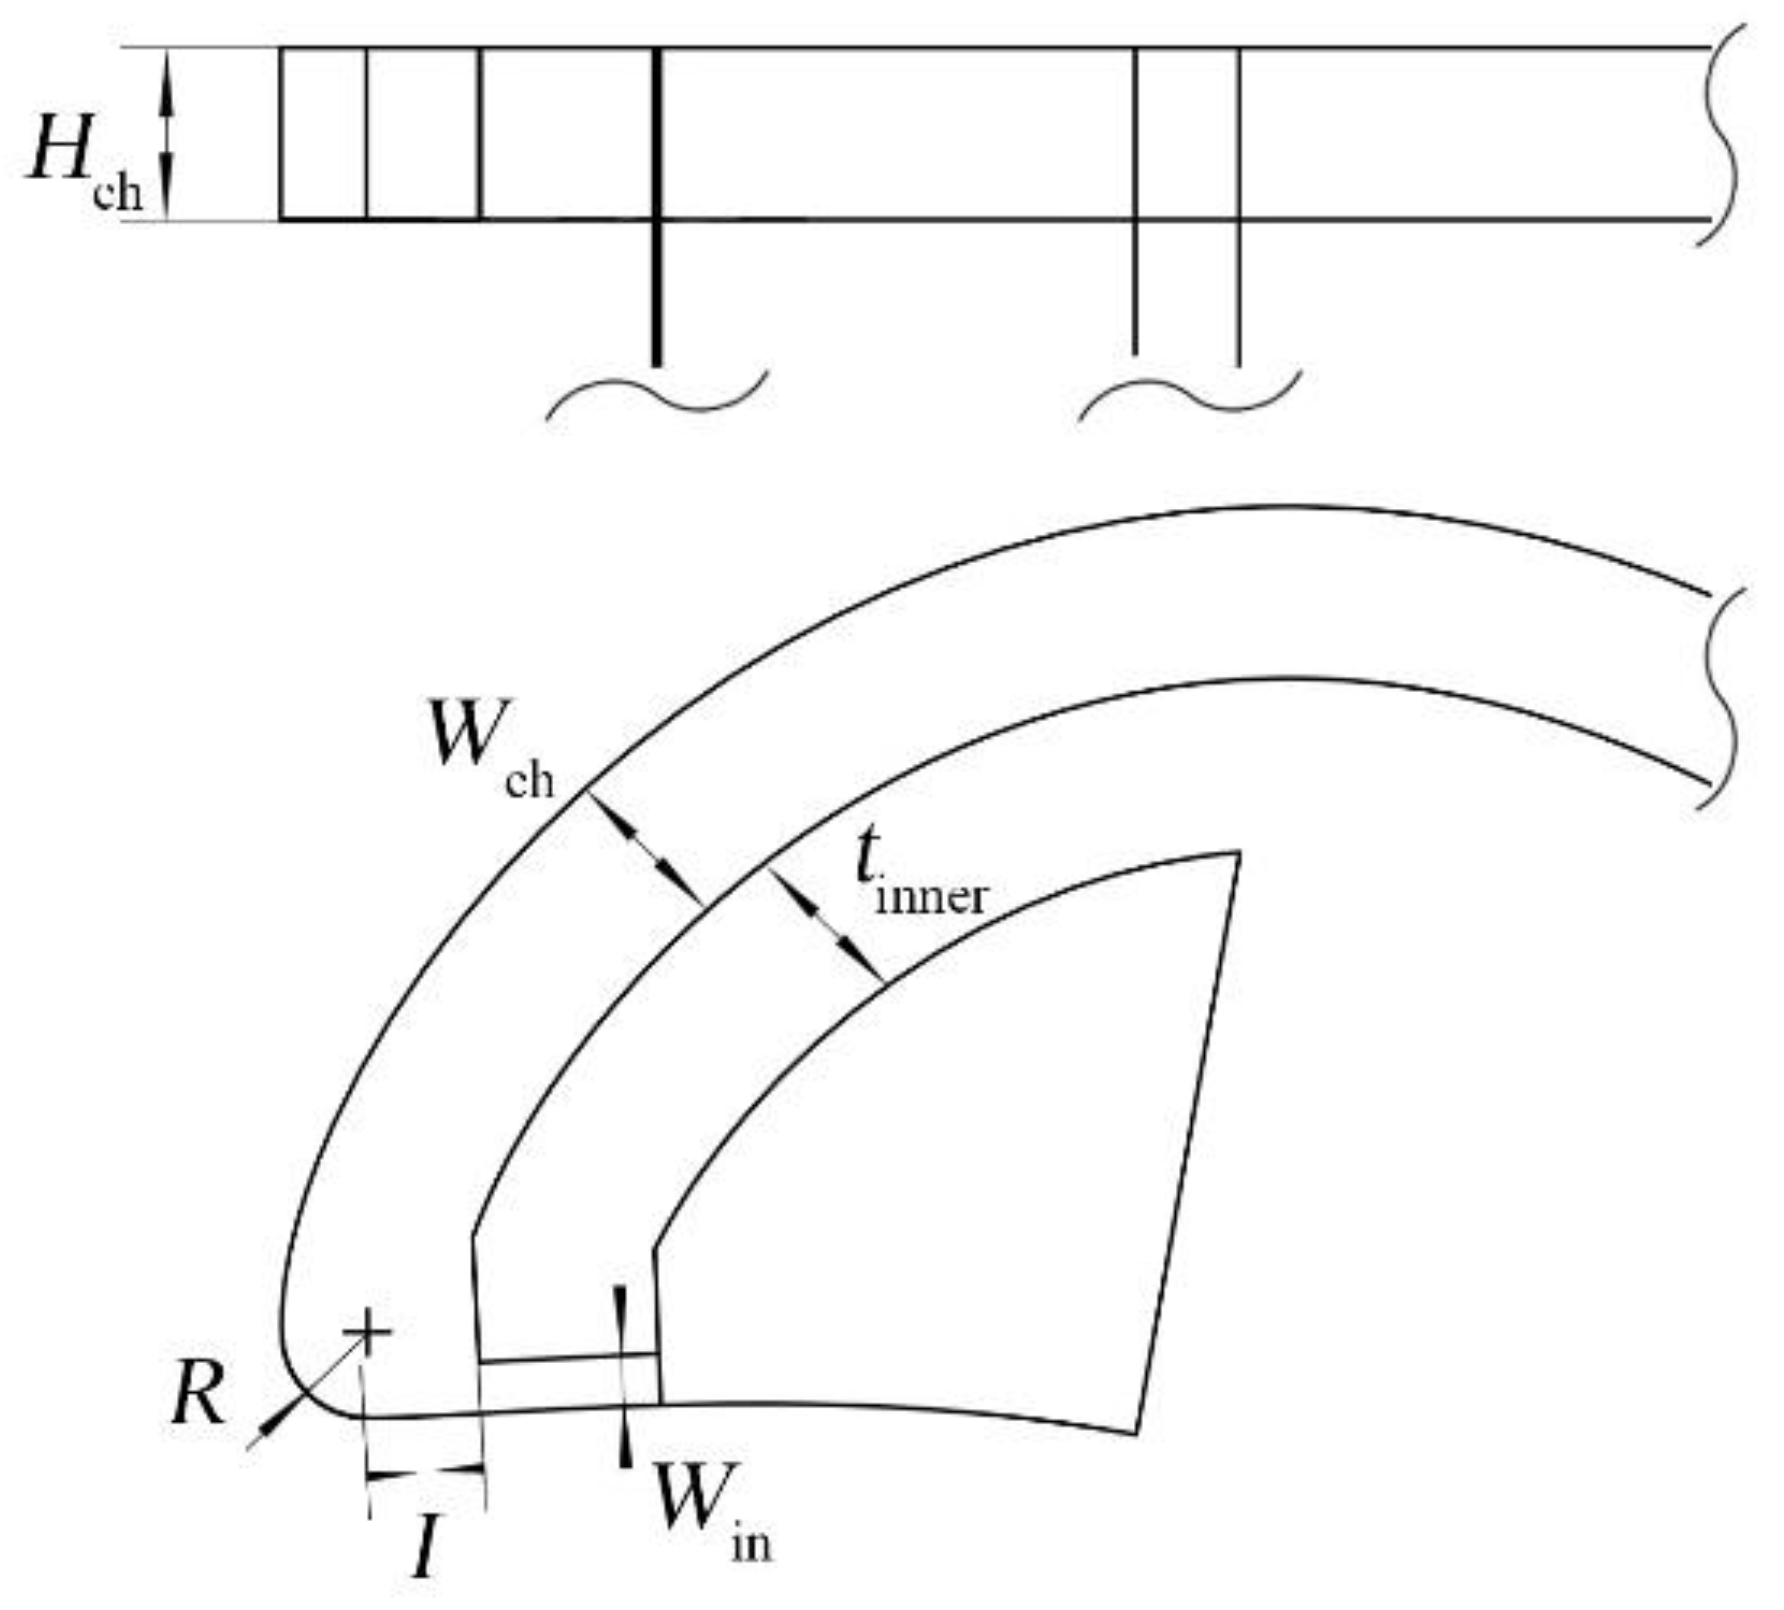
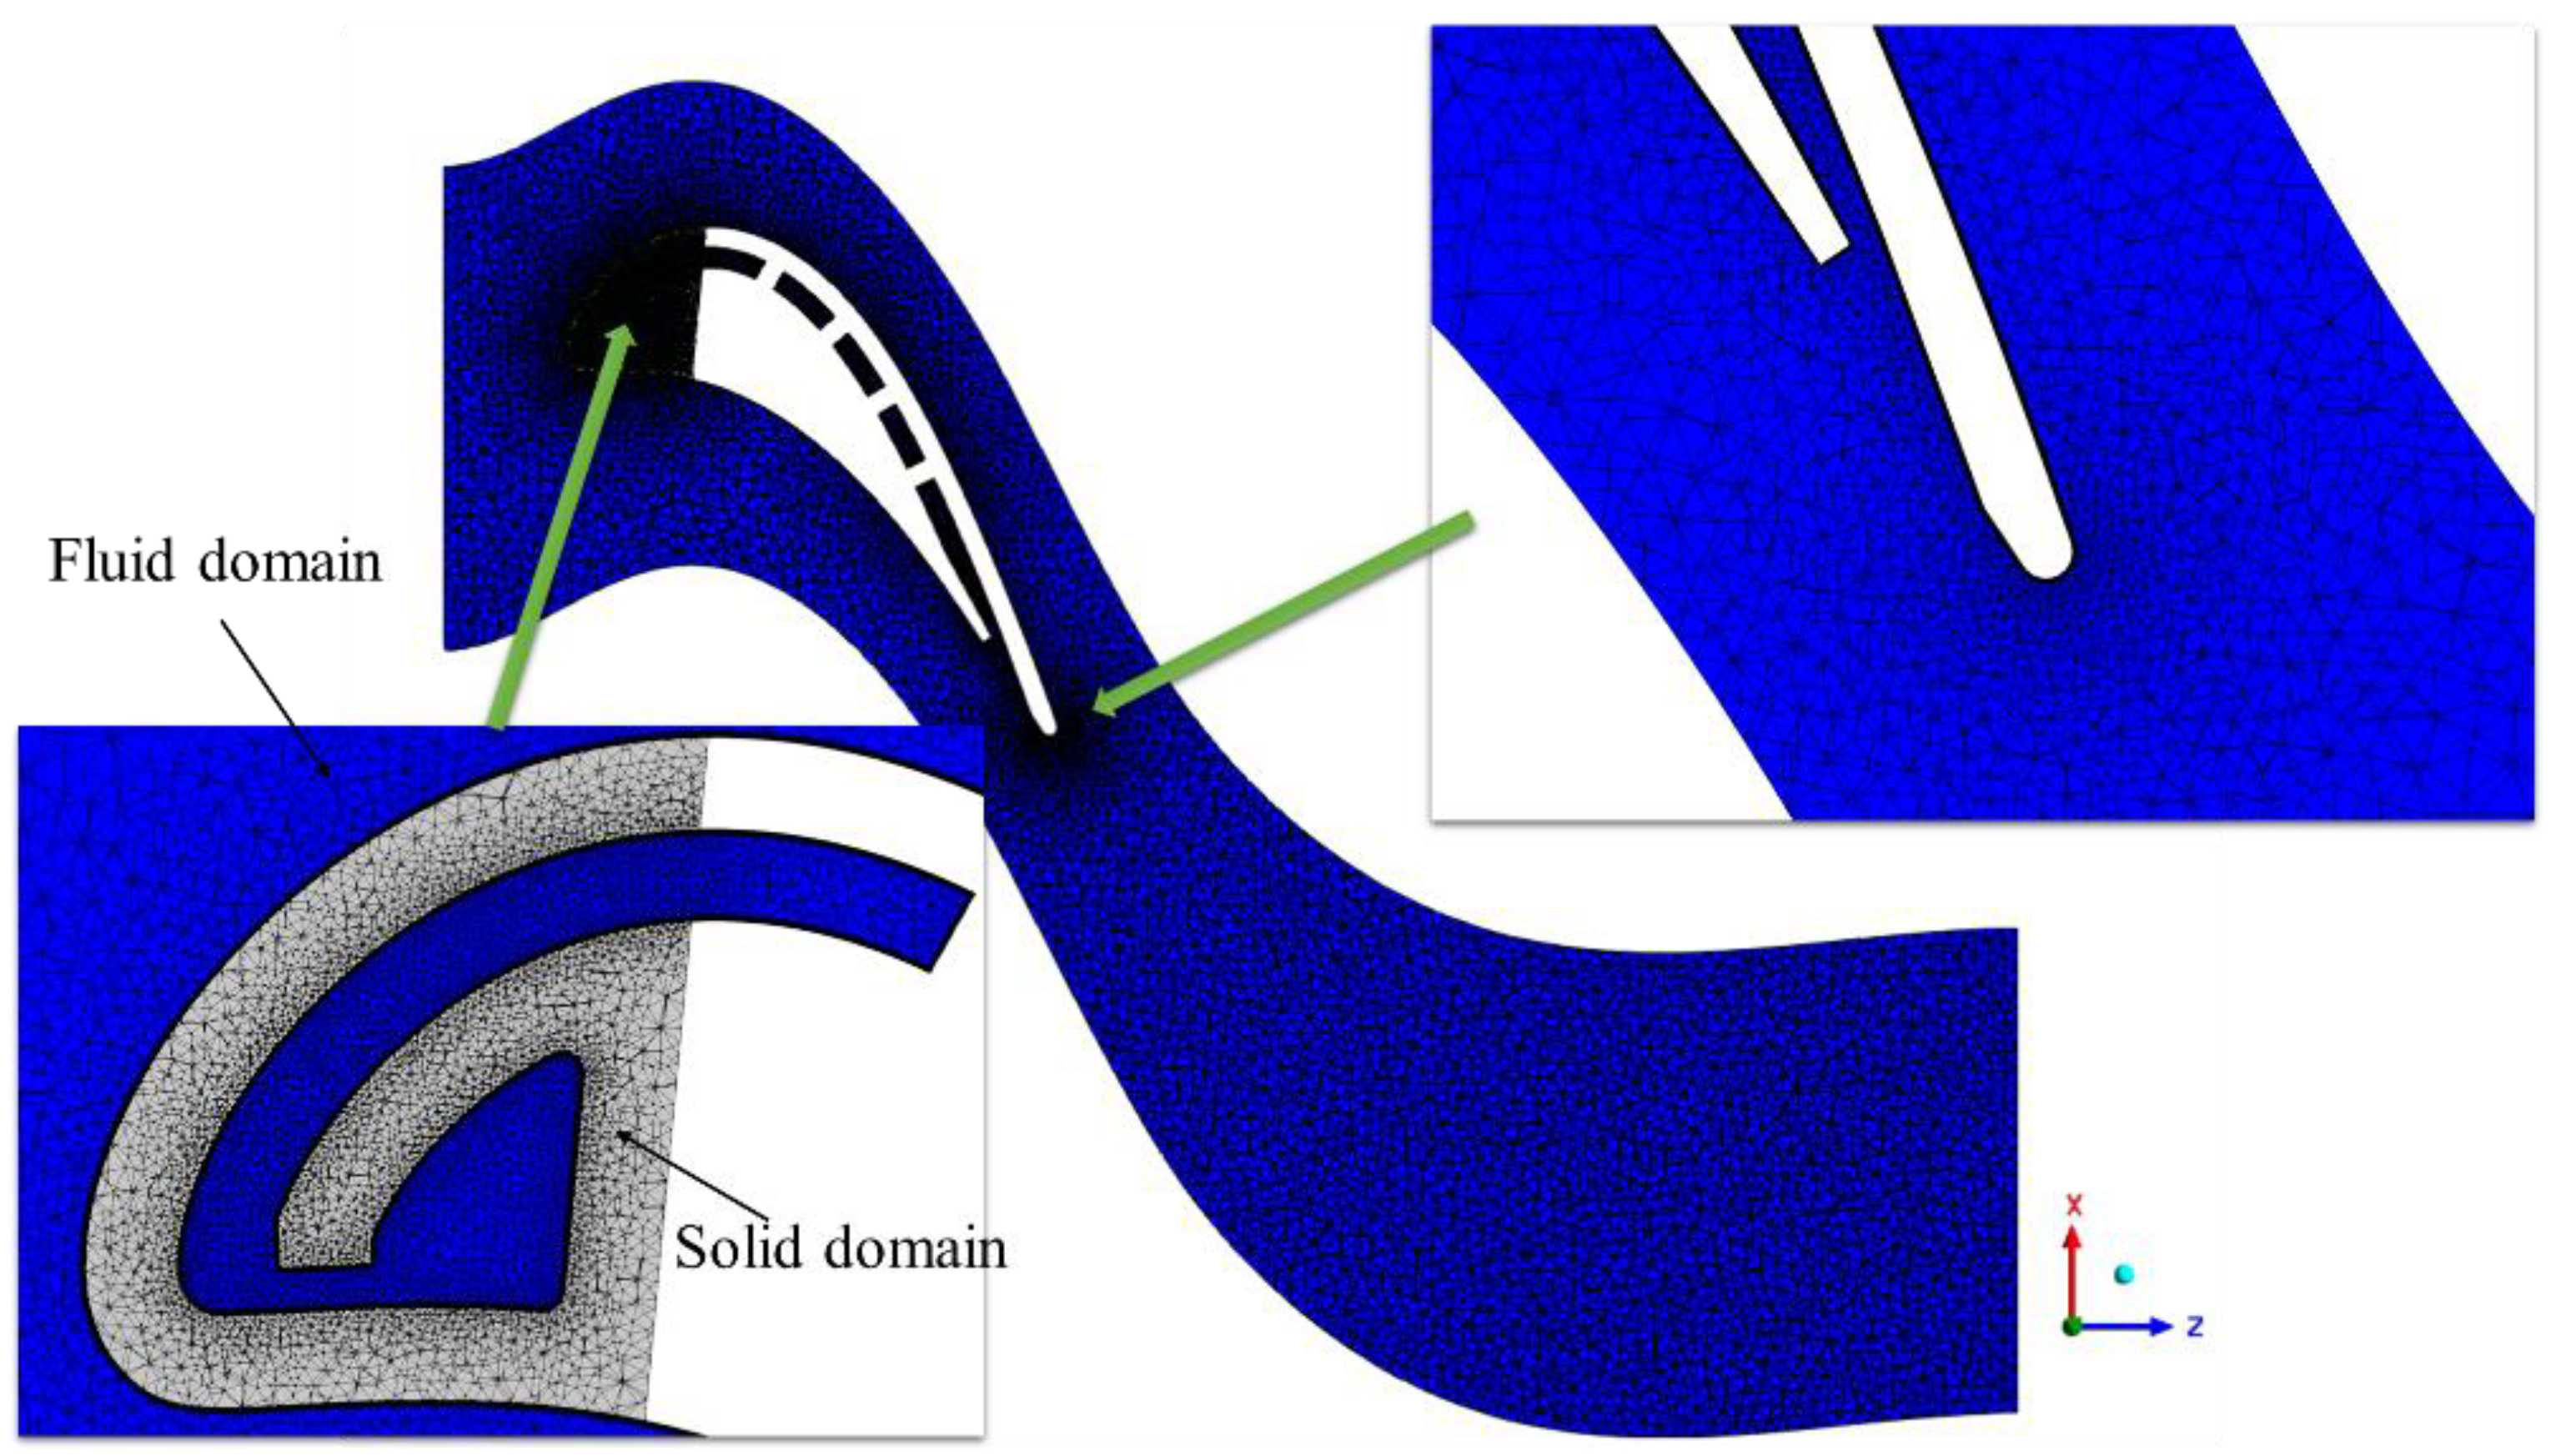
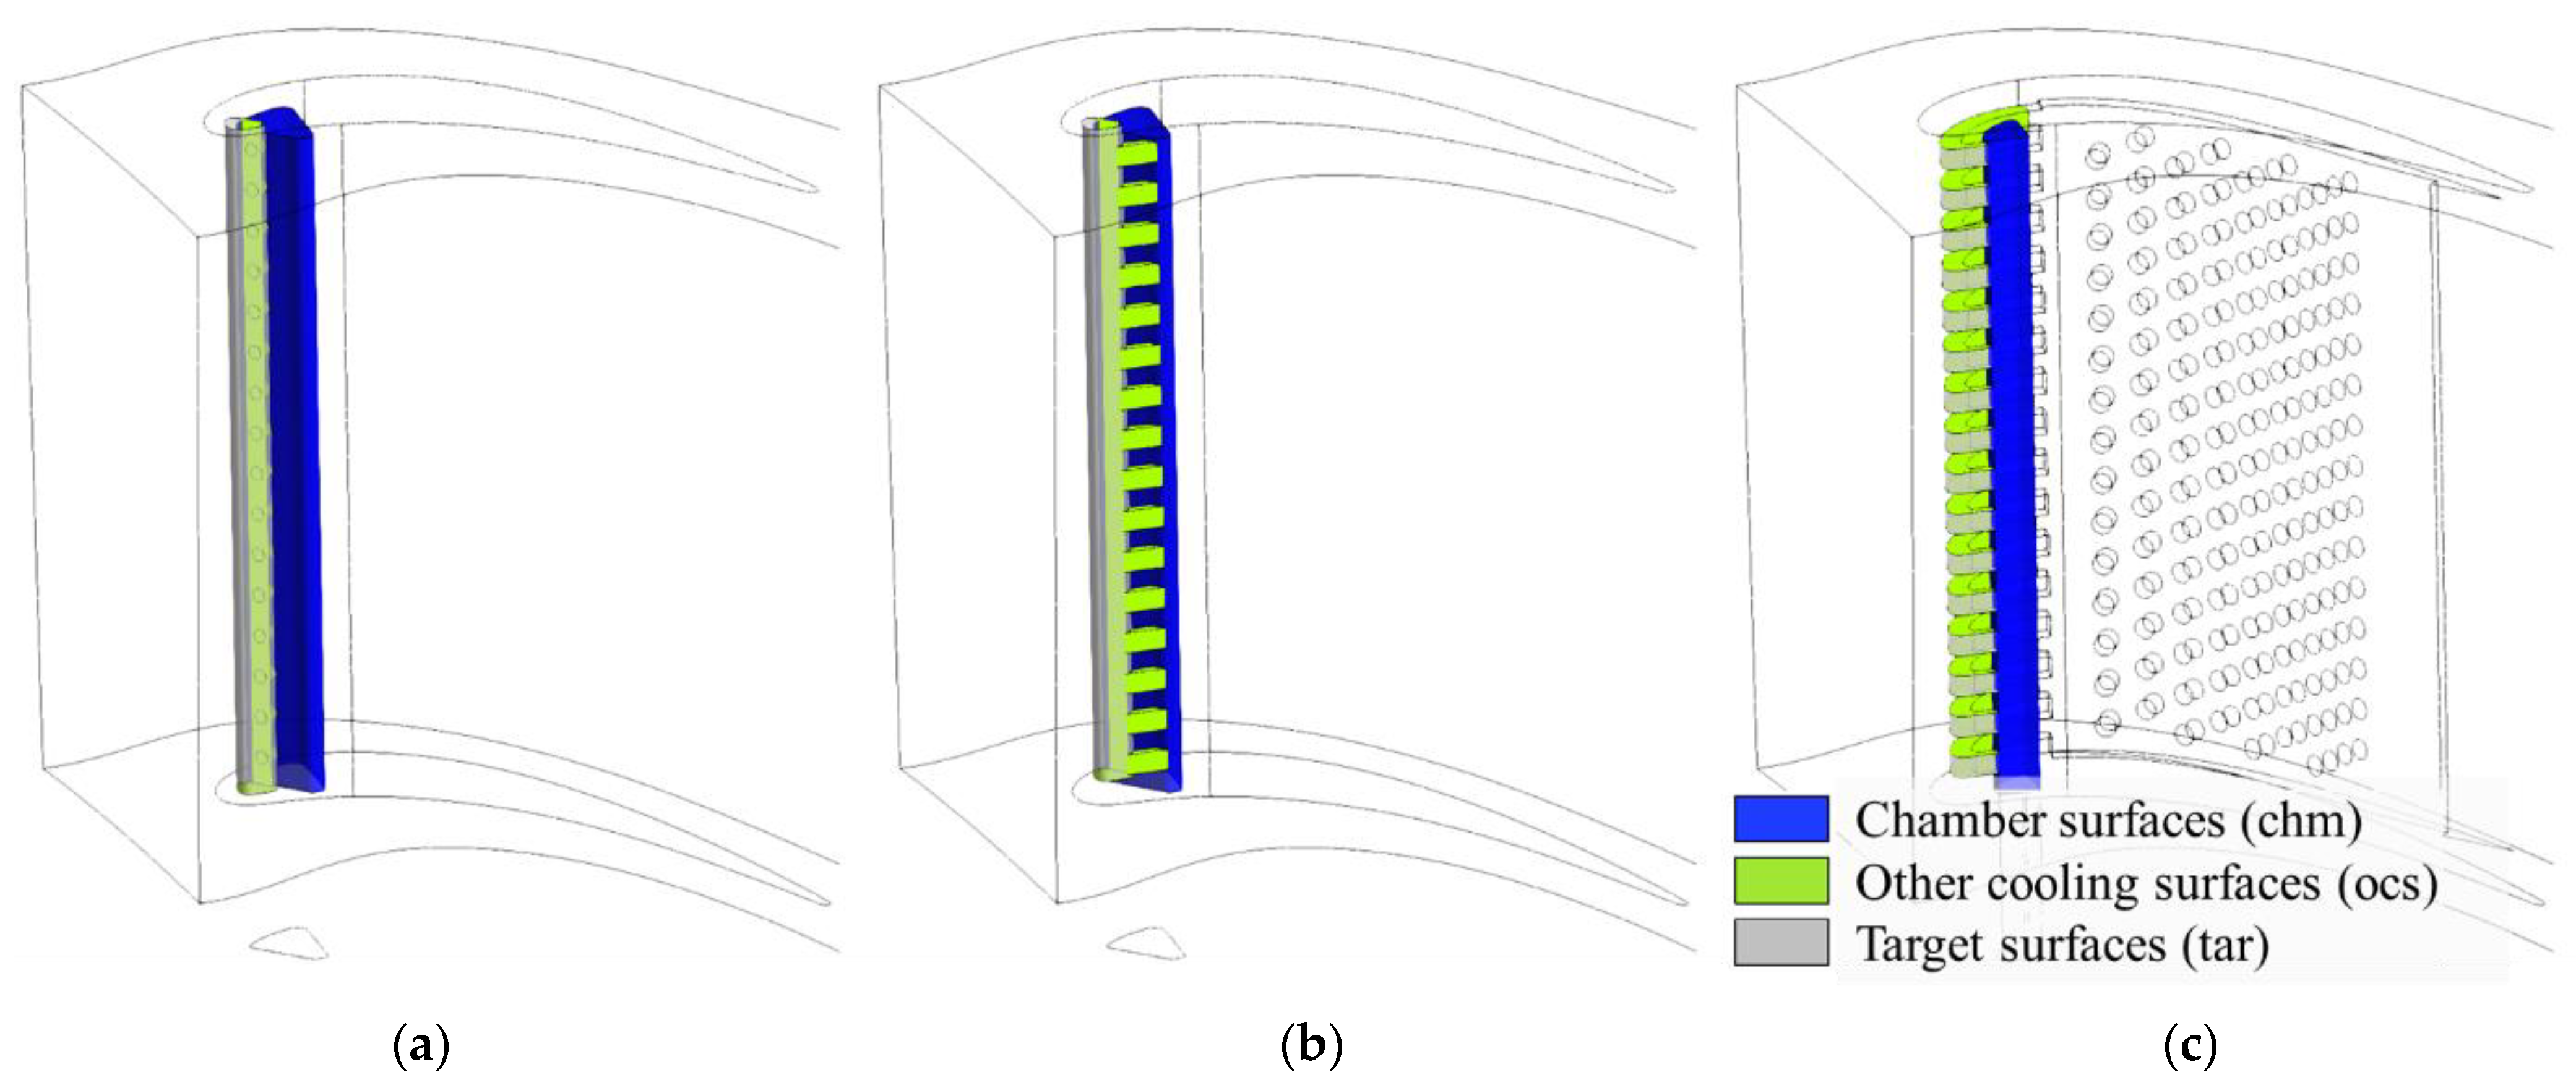
2.1. Computational Model
2.2. Boundary Conditions
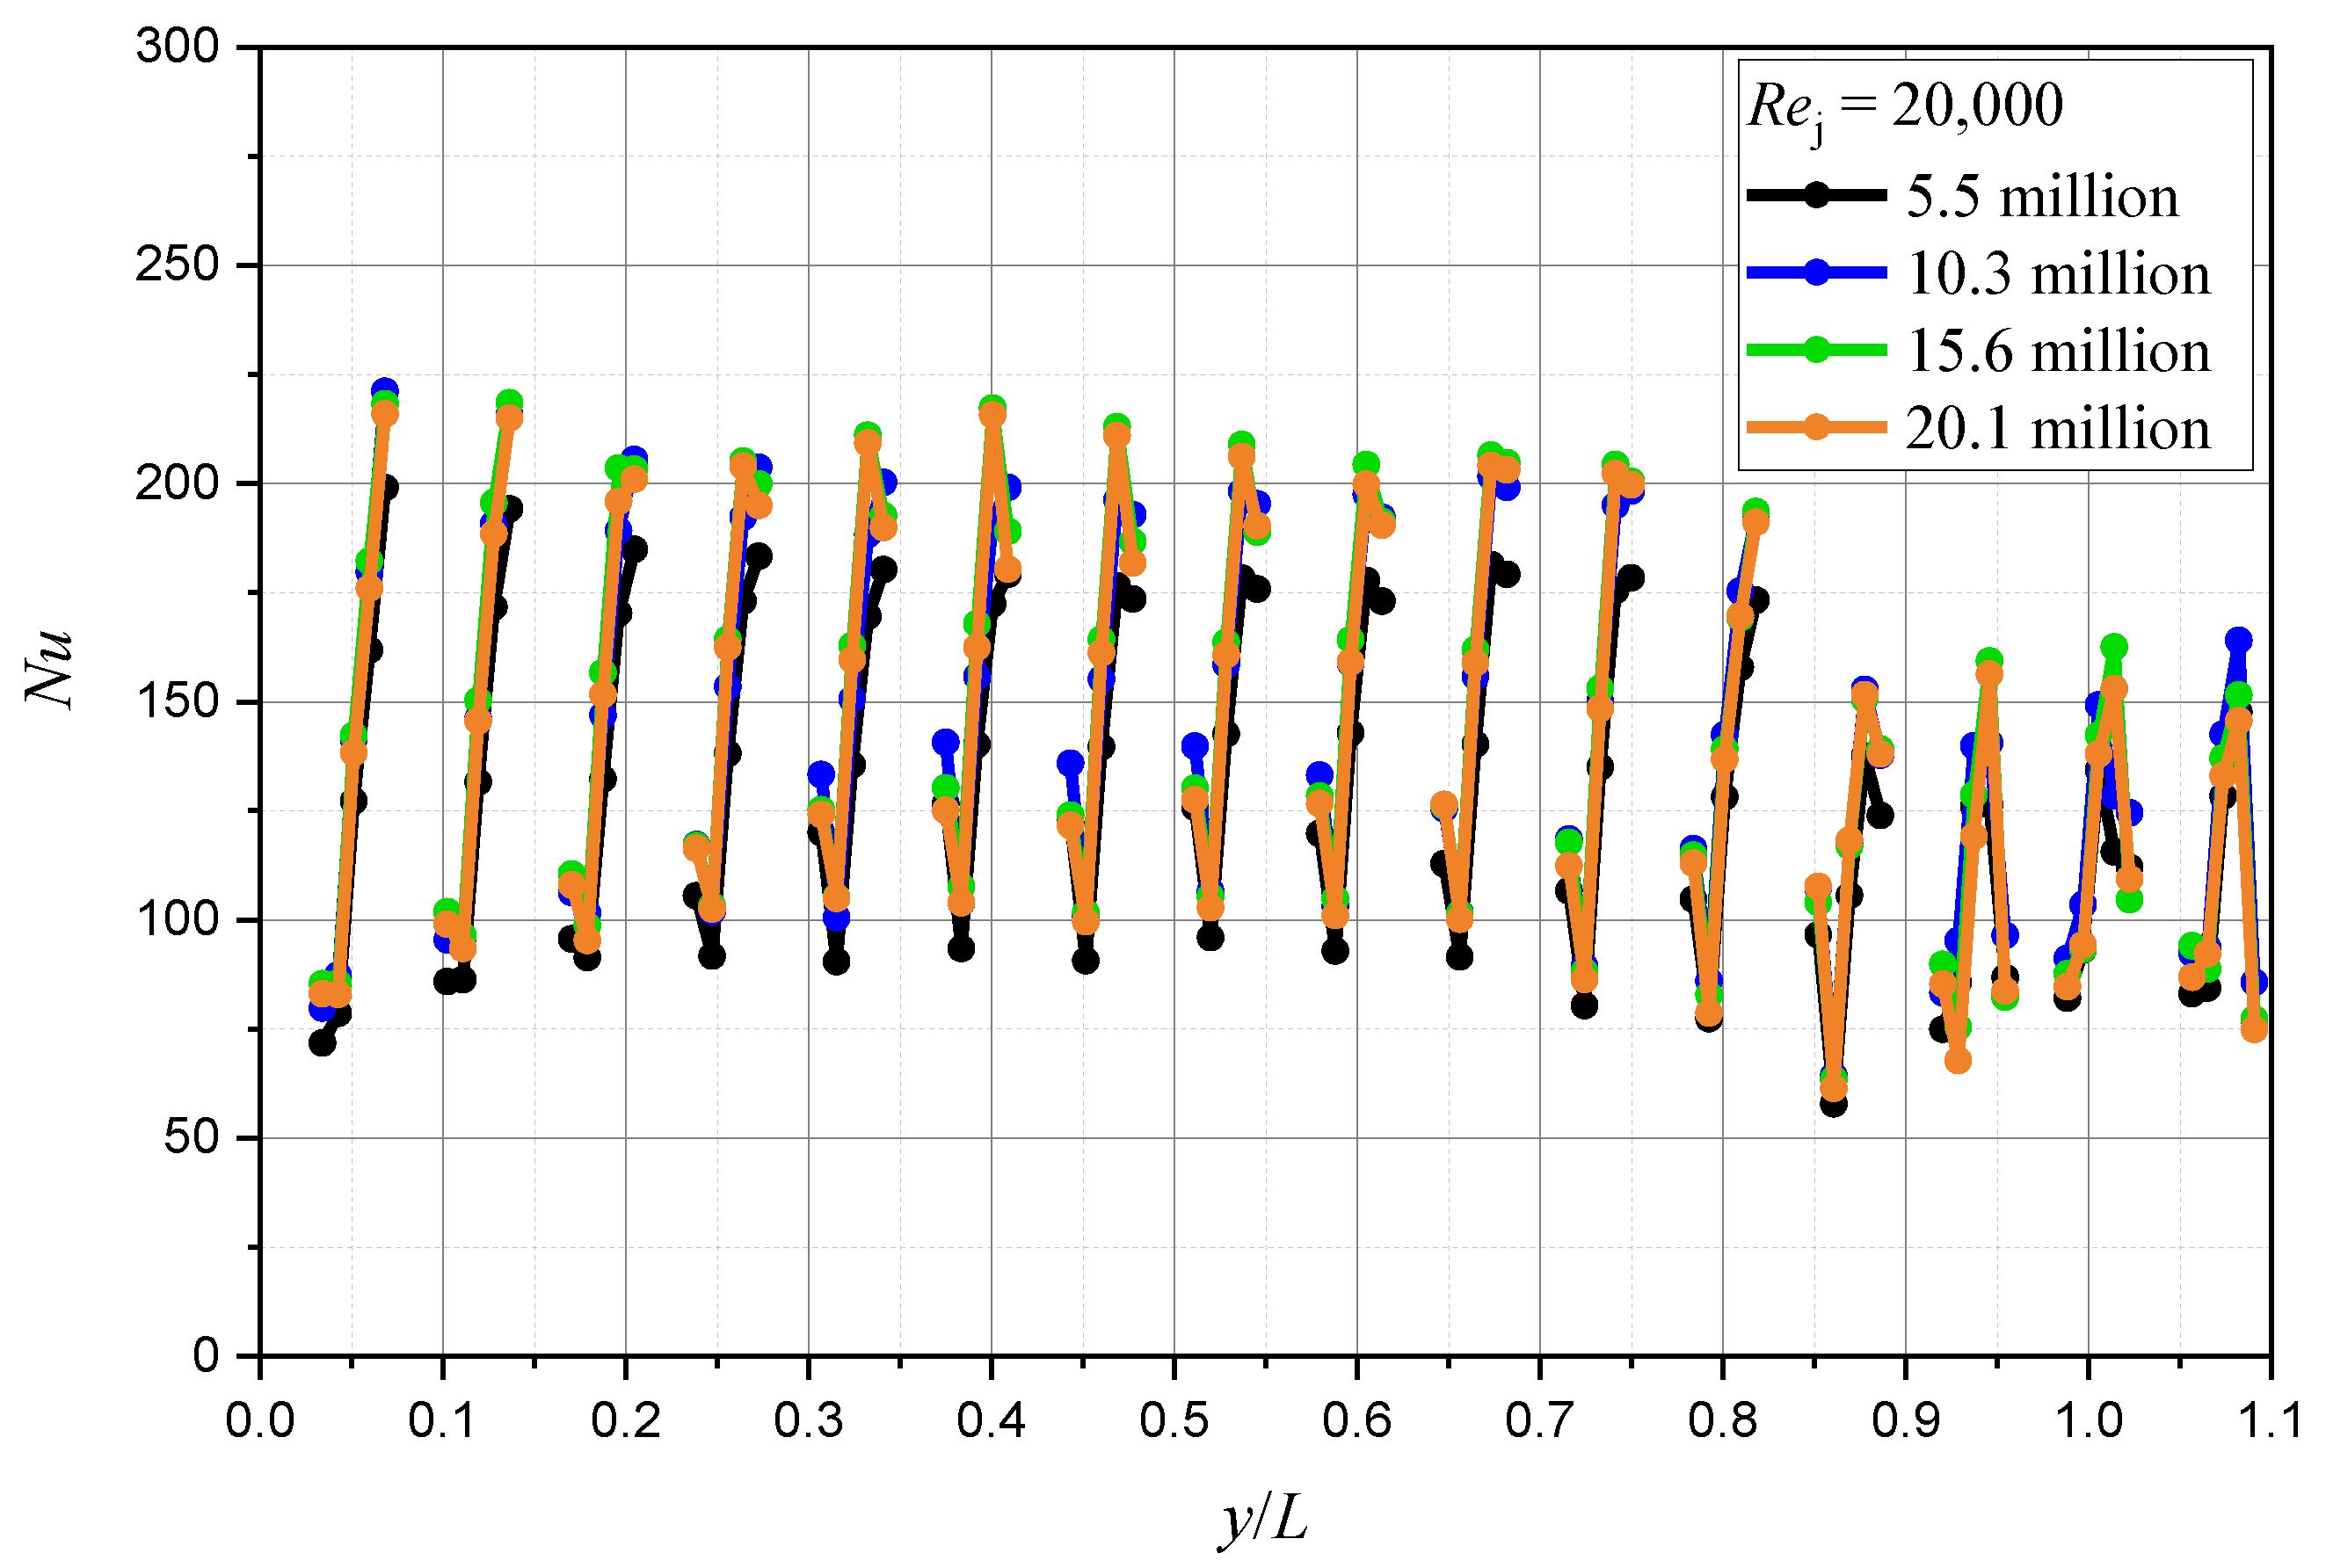
2.3. Grid Independence
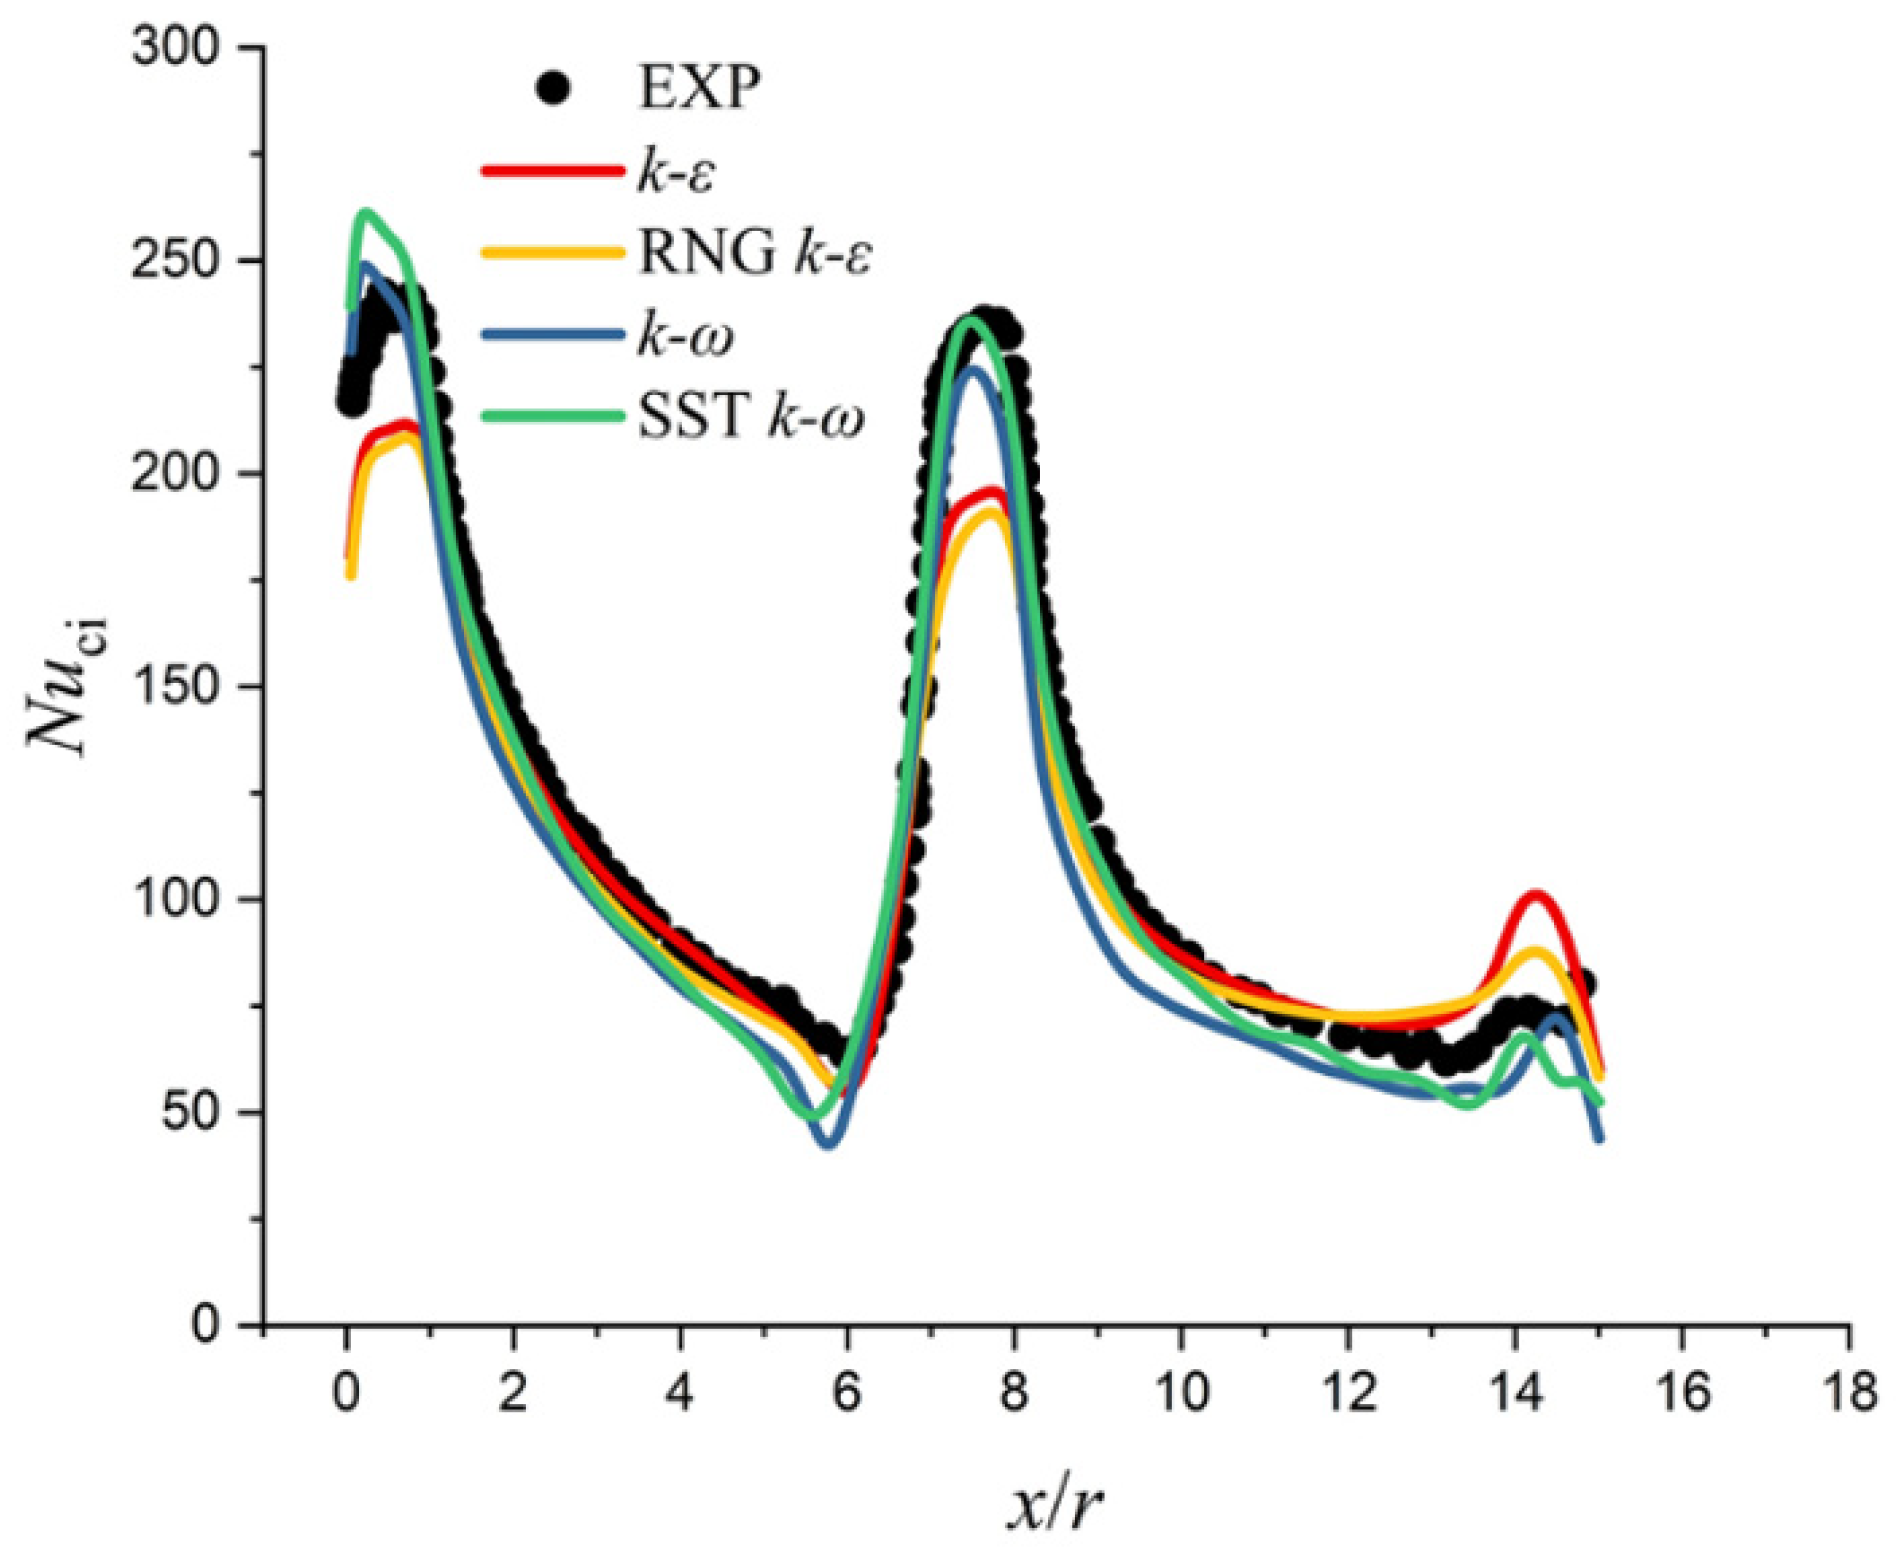
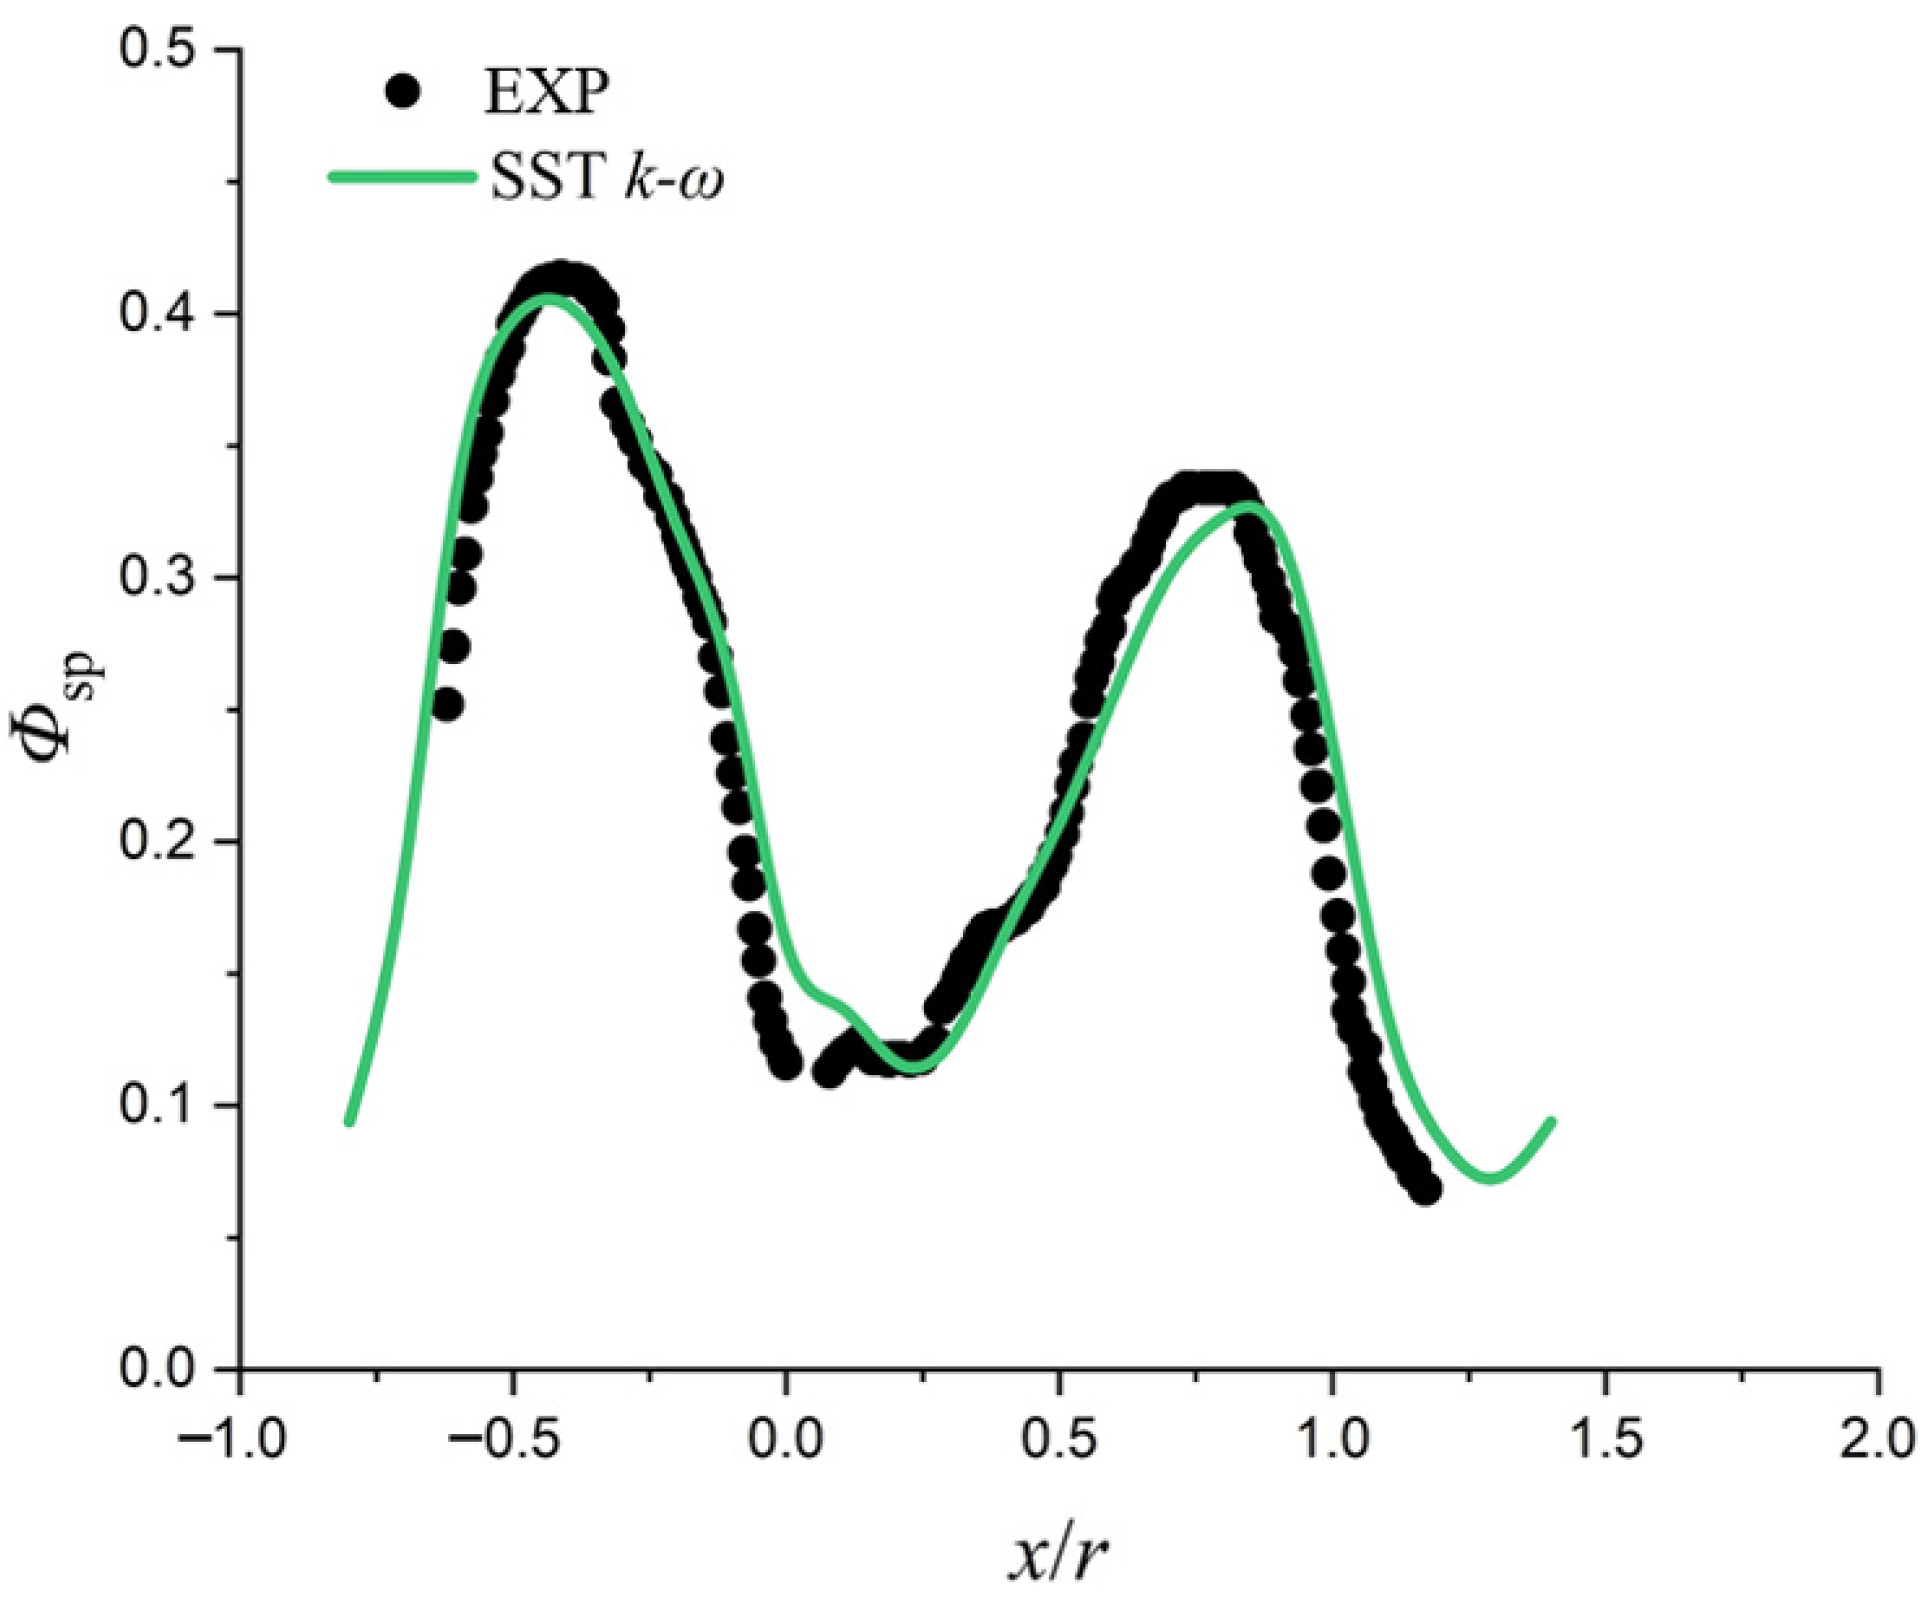
2.4. Turbulence Model Validation
3. Results and Discussion
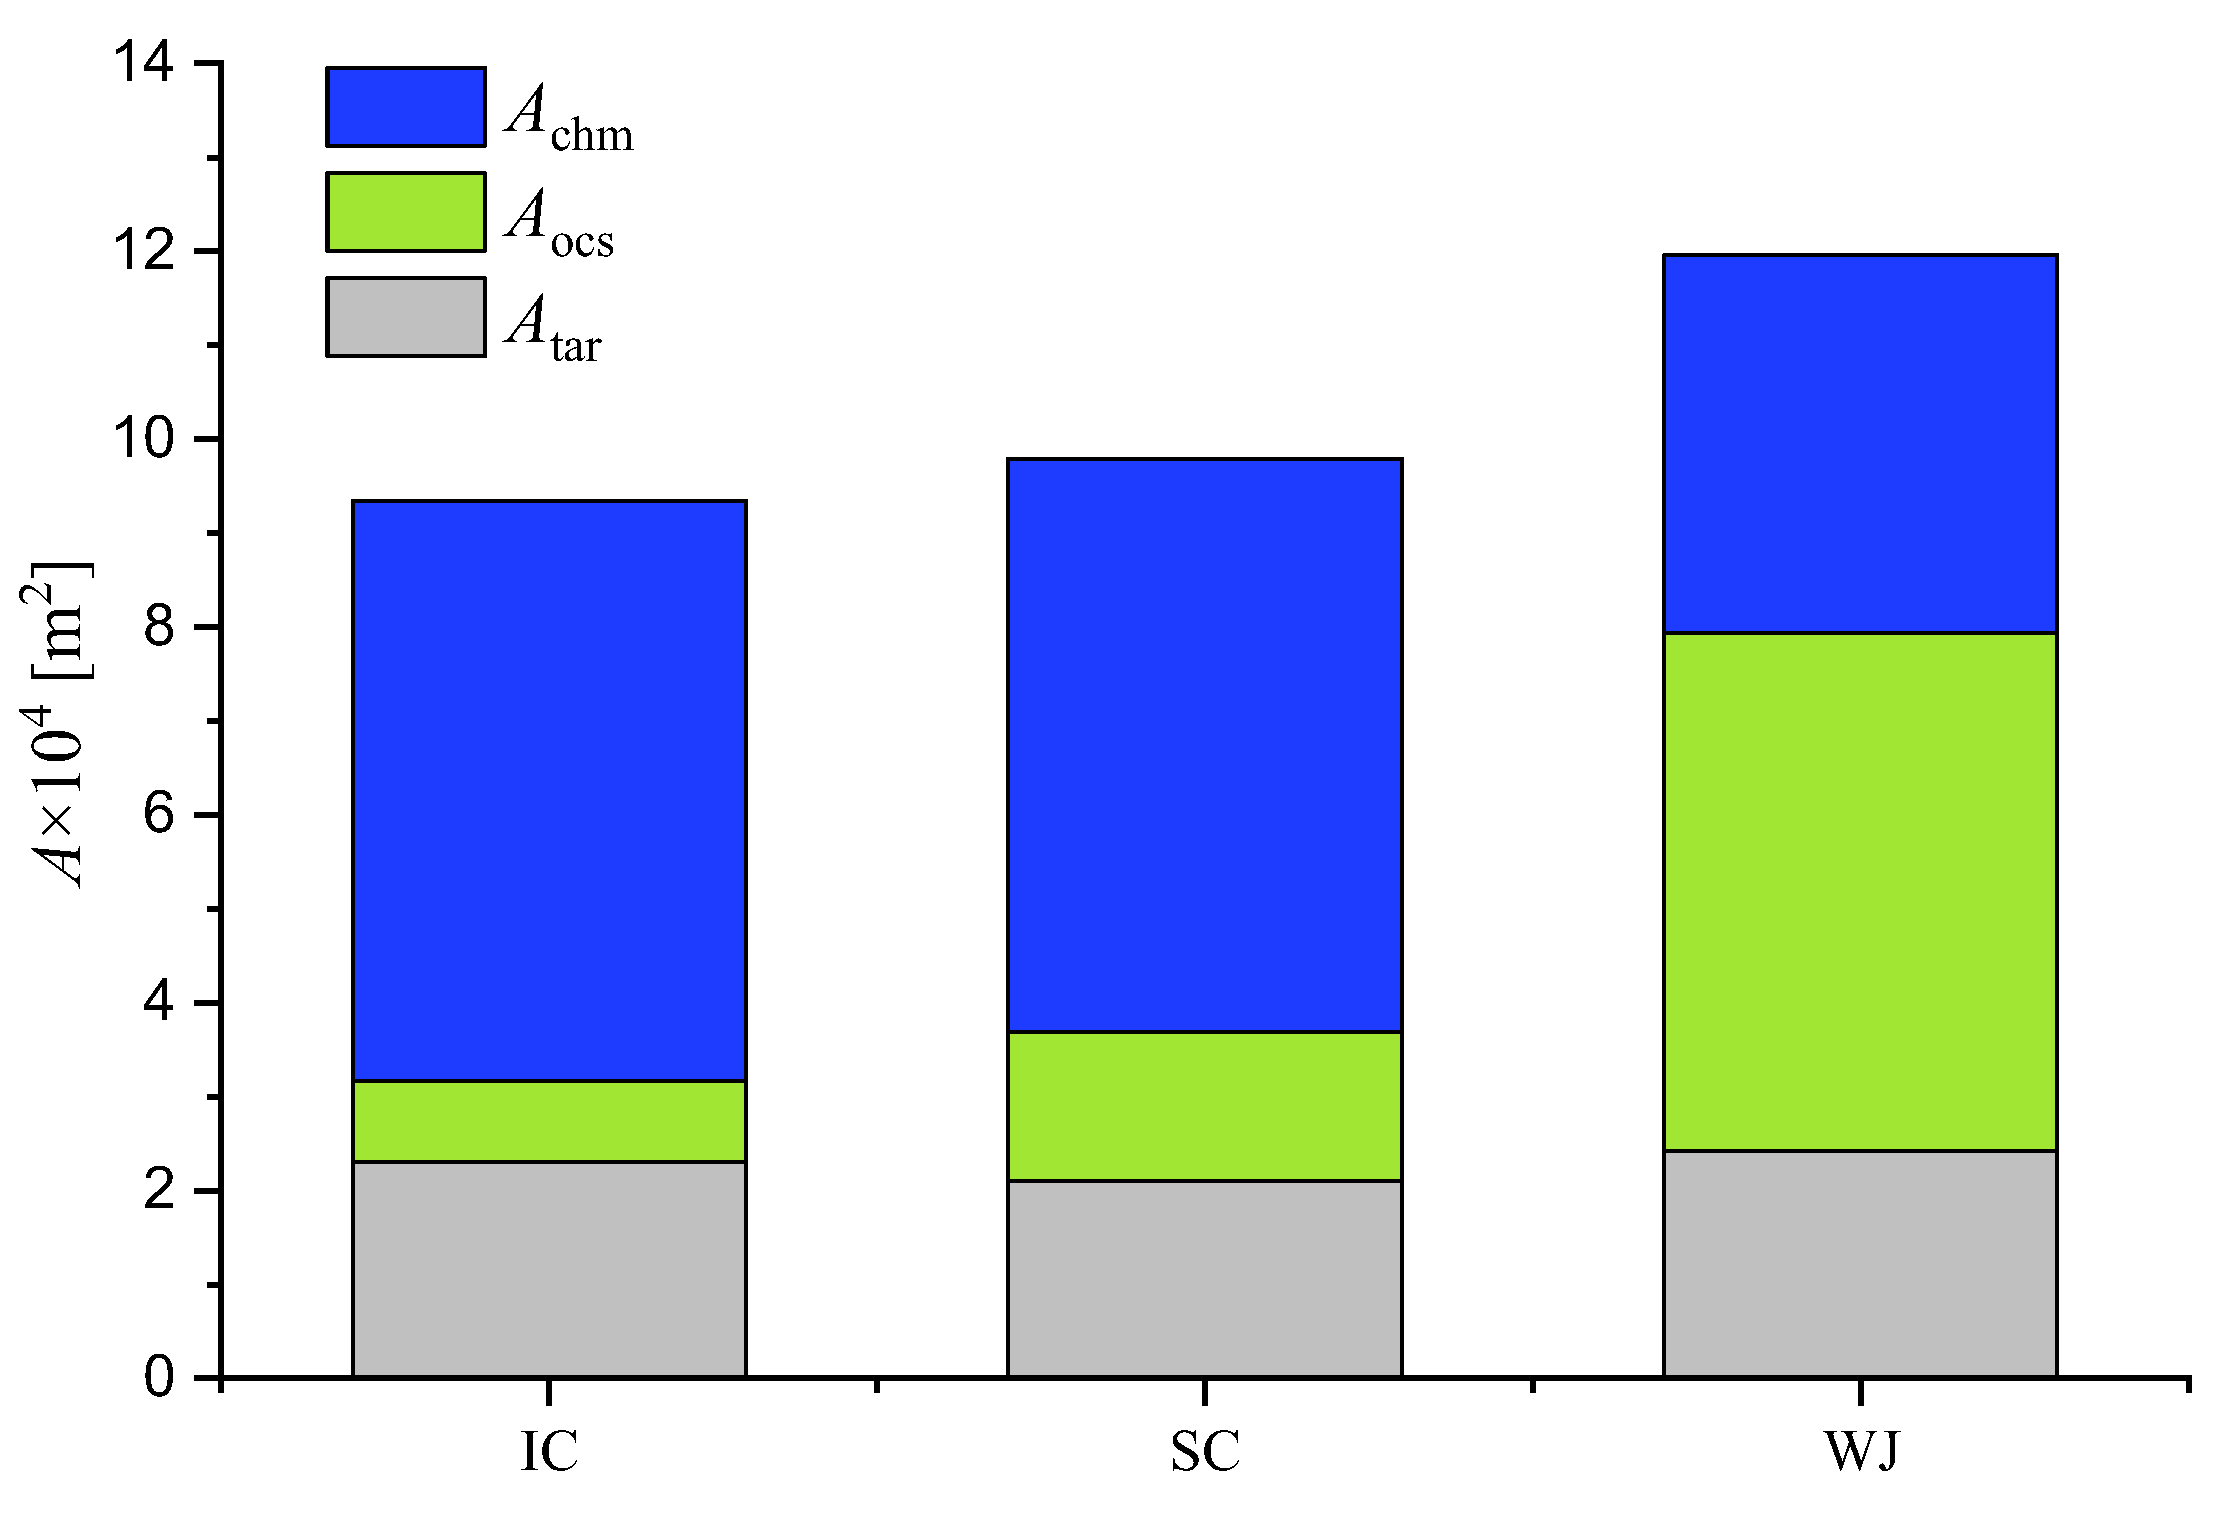
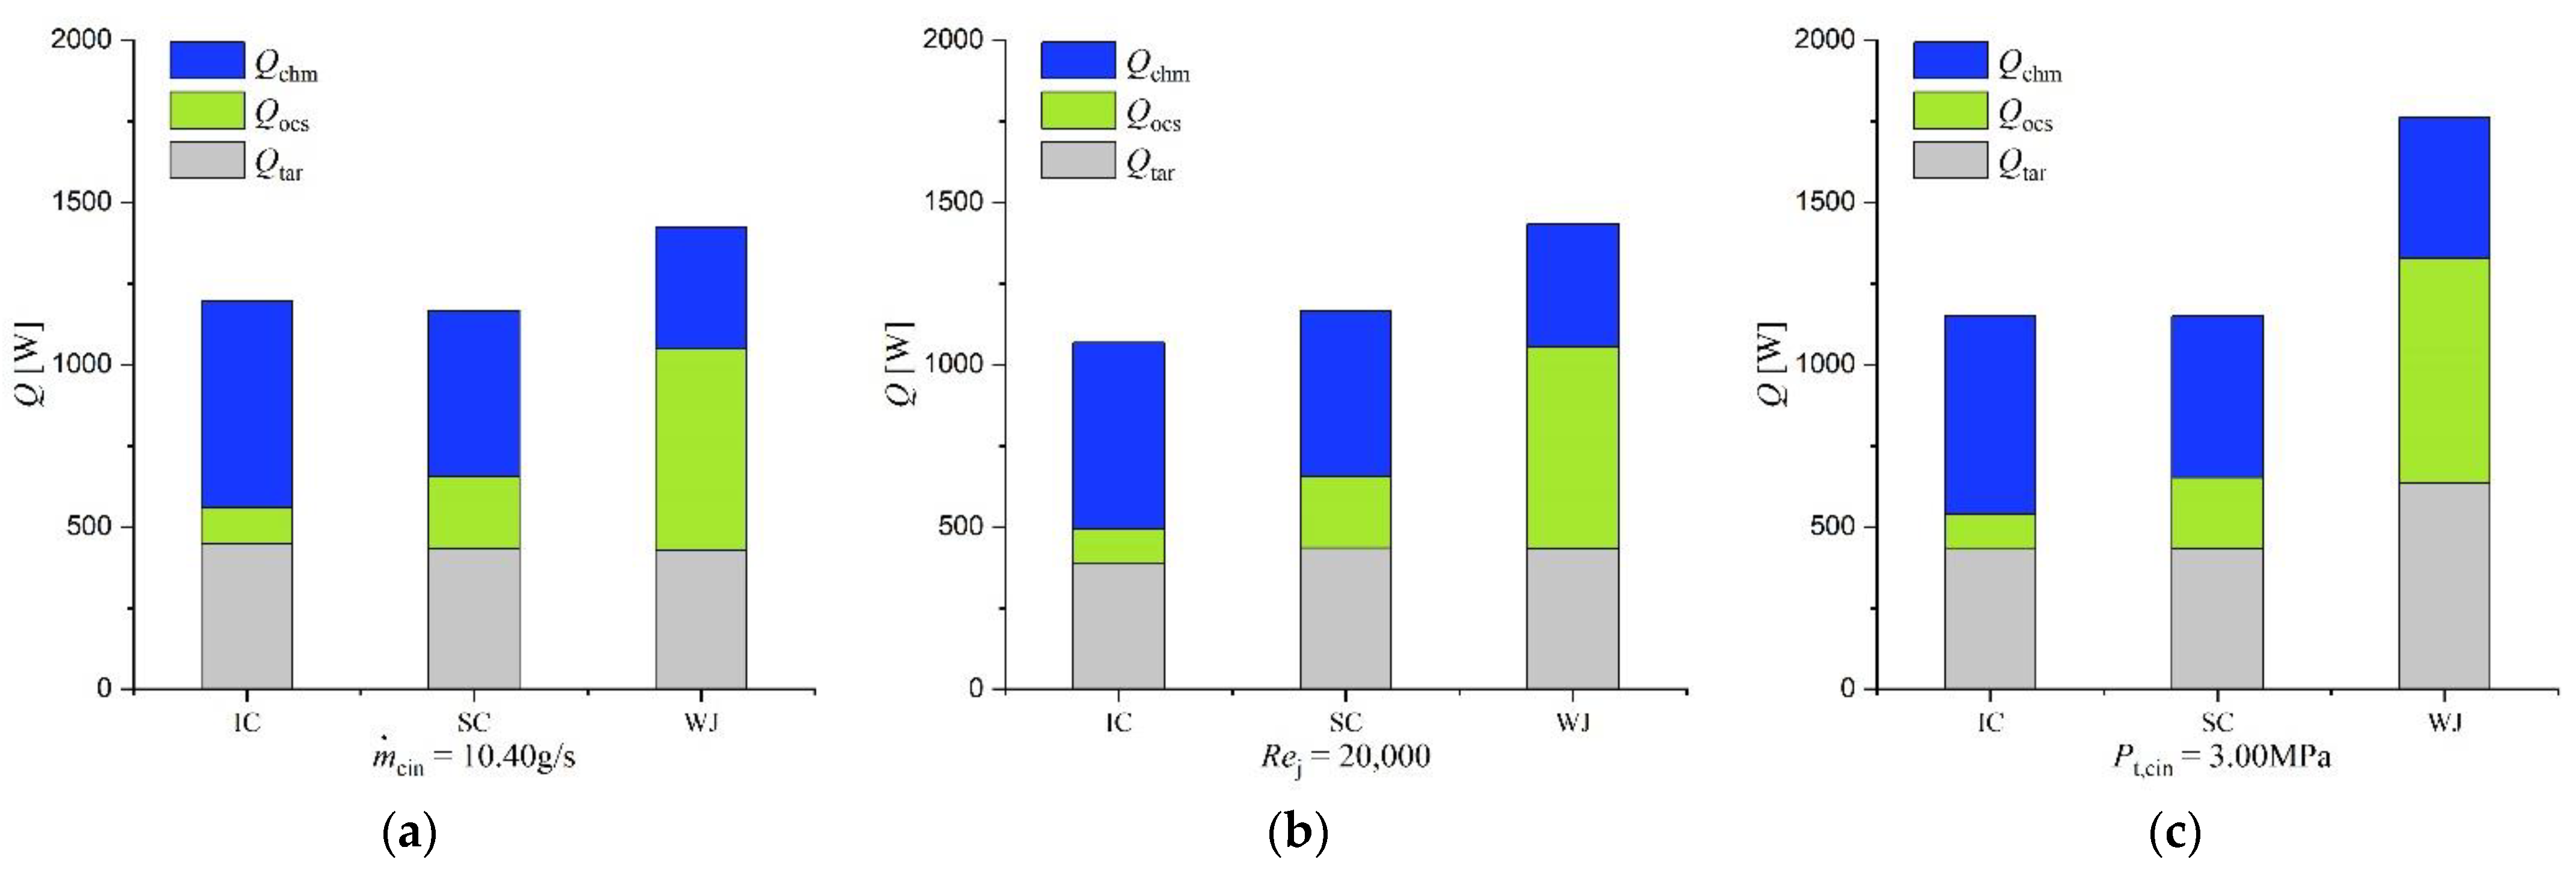
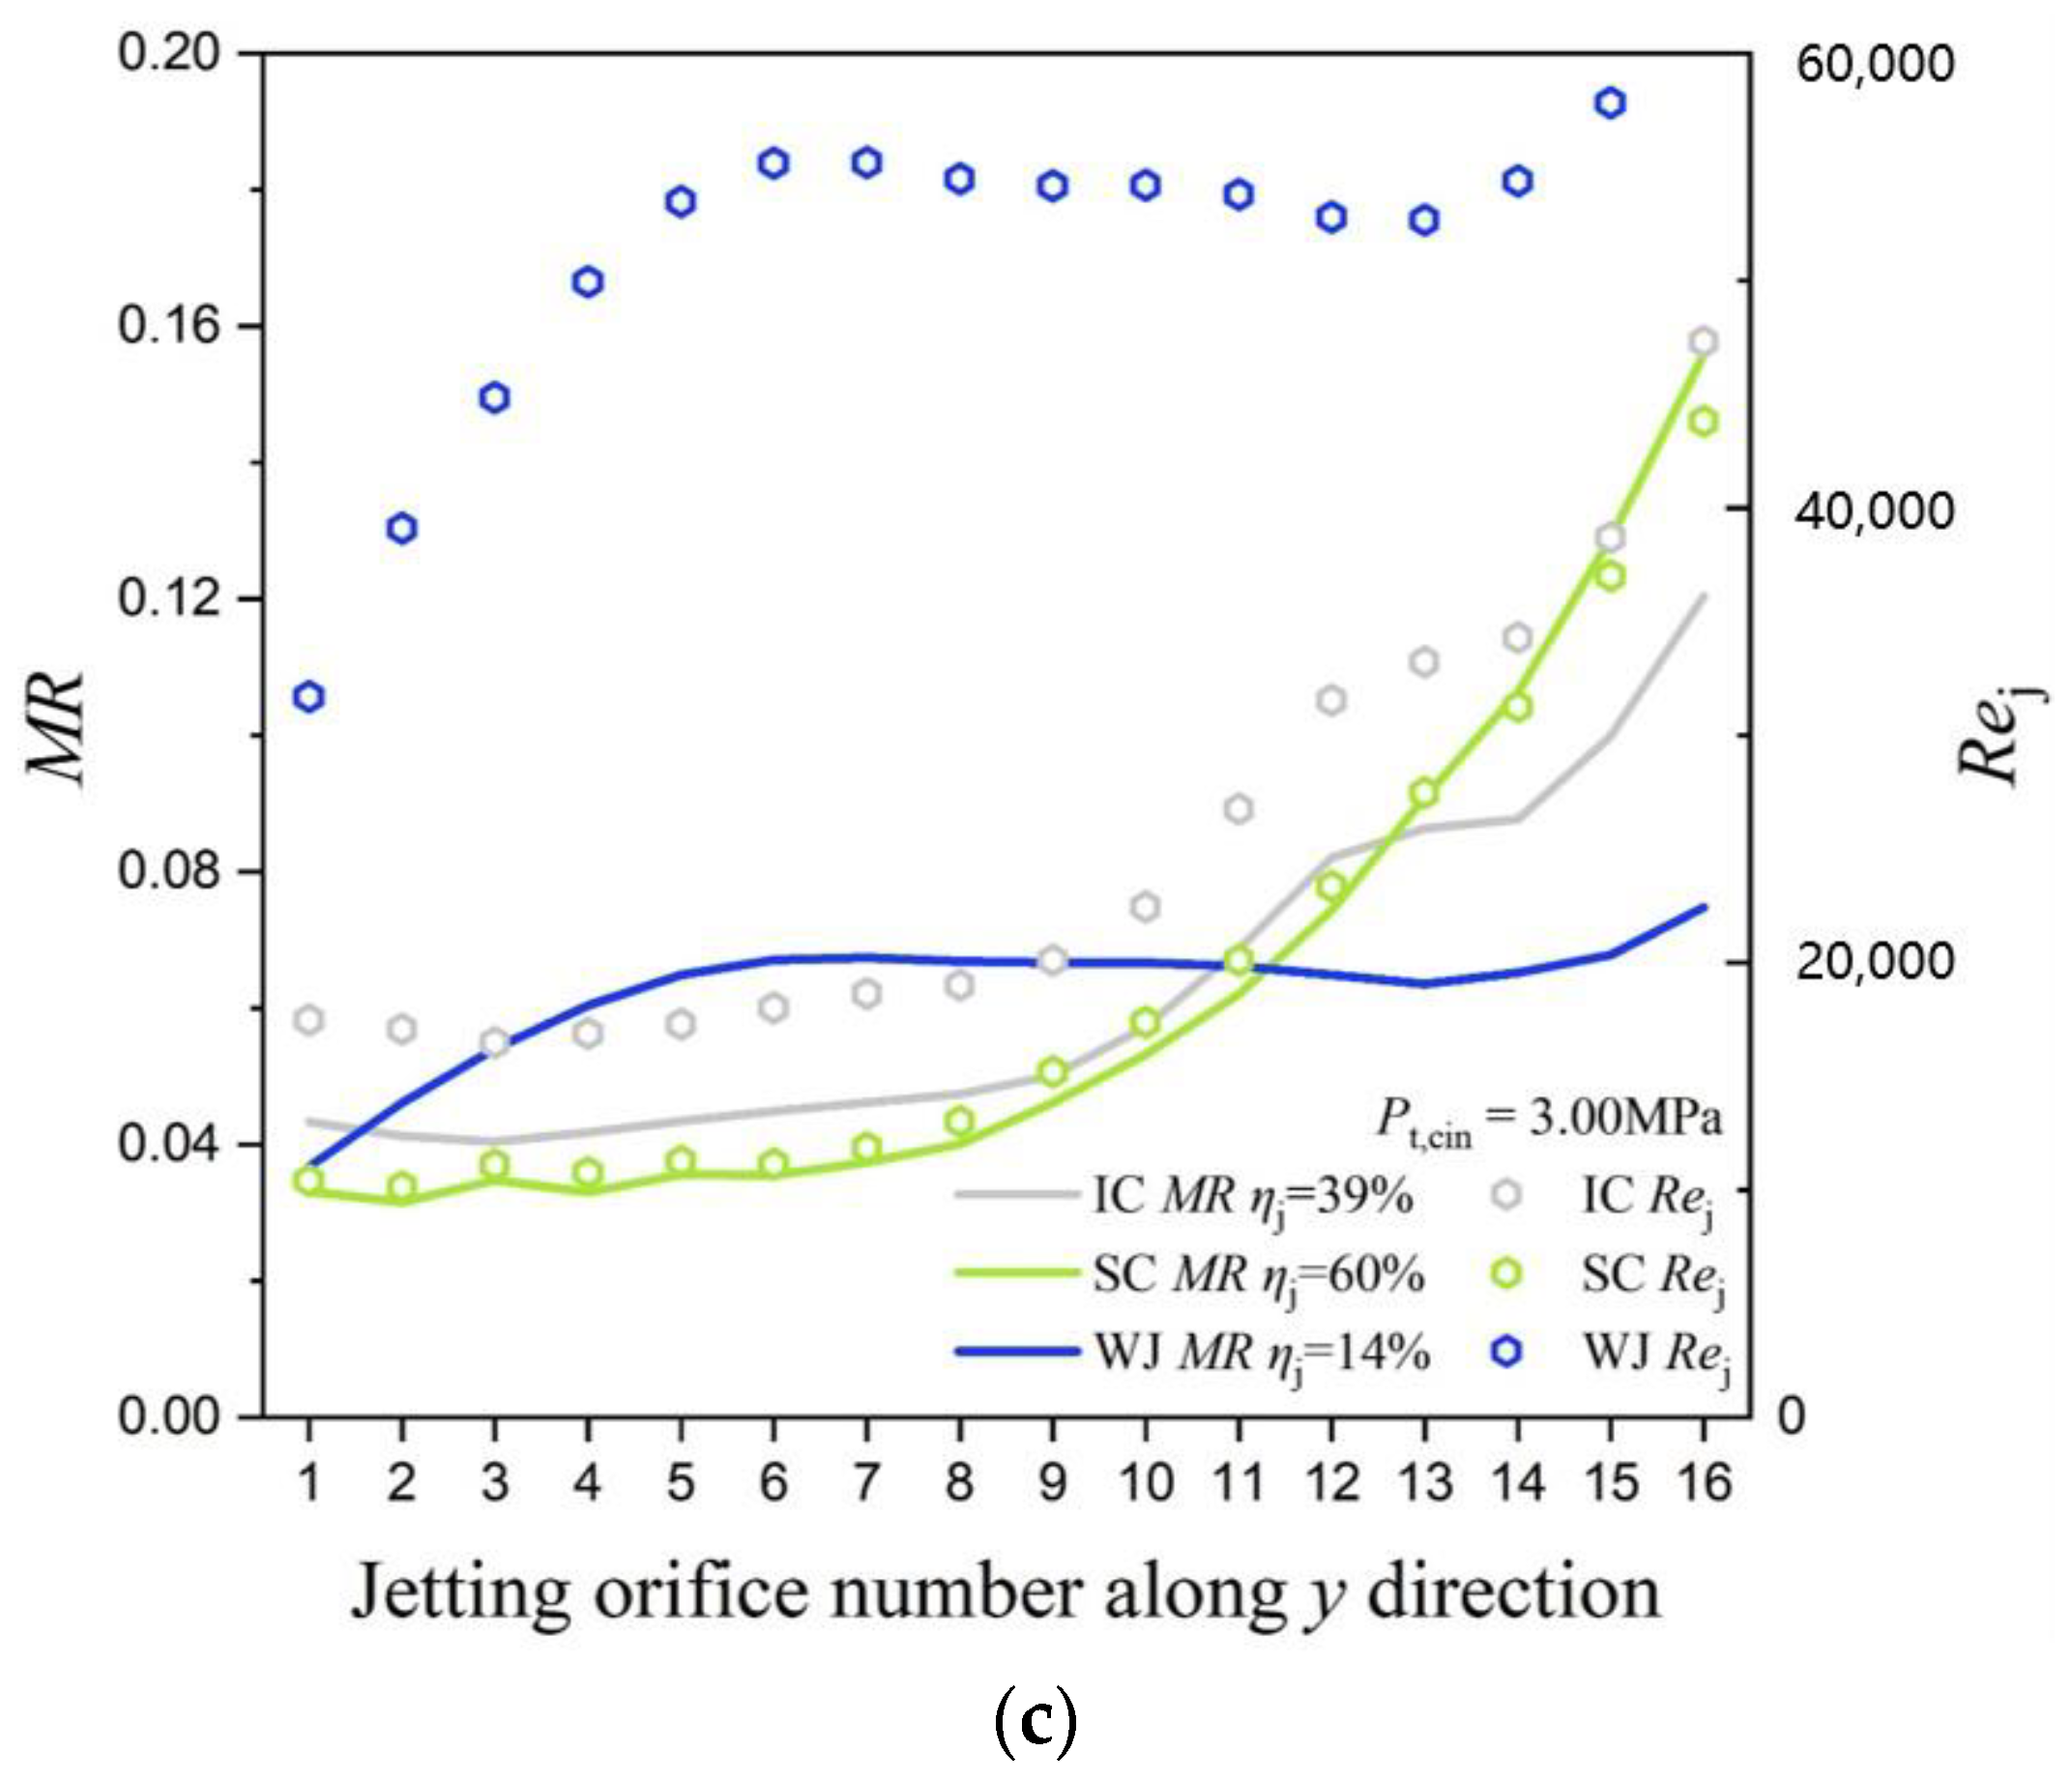
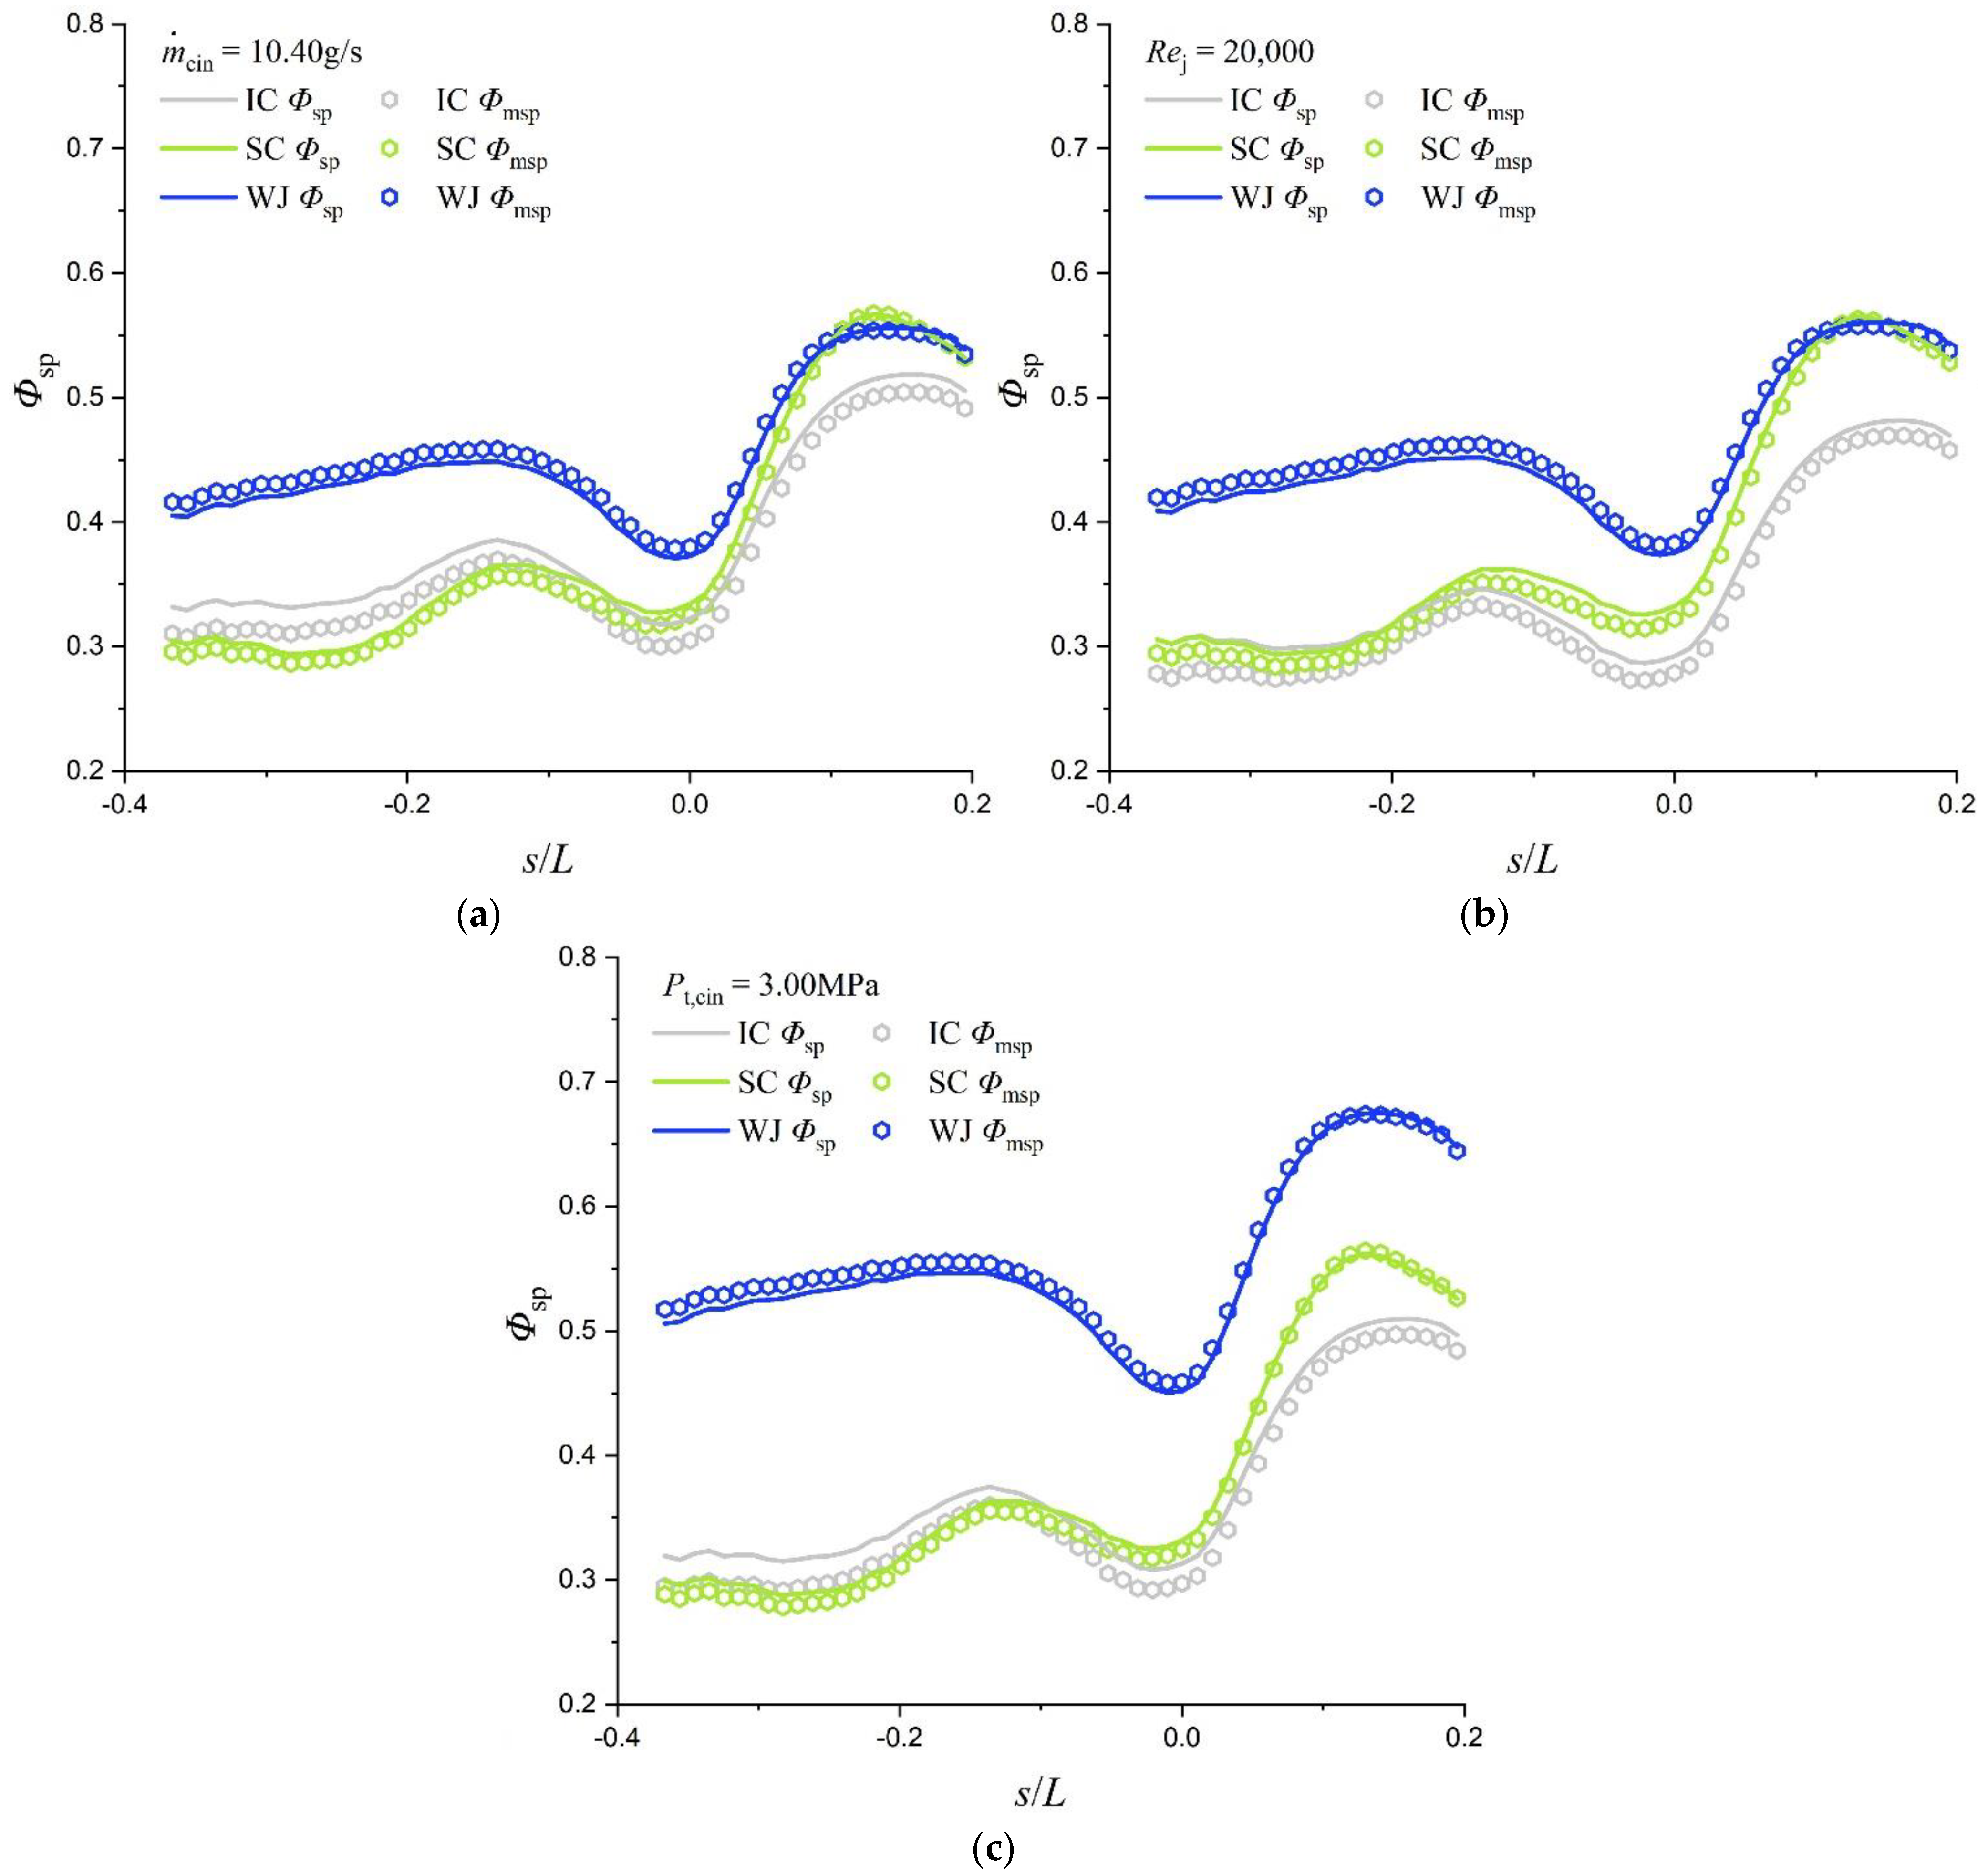
3.1. Overall Performance Evaluations
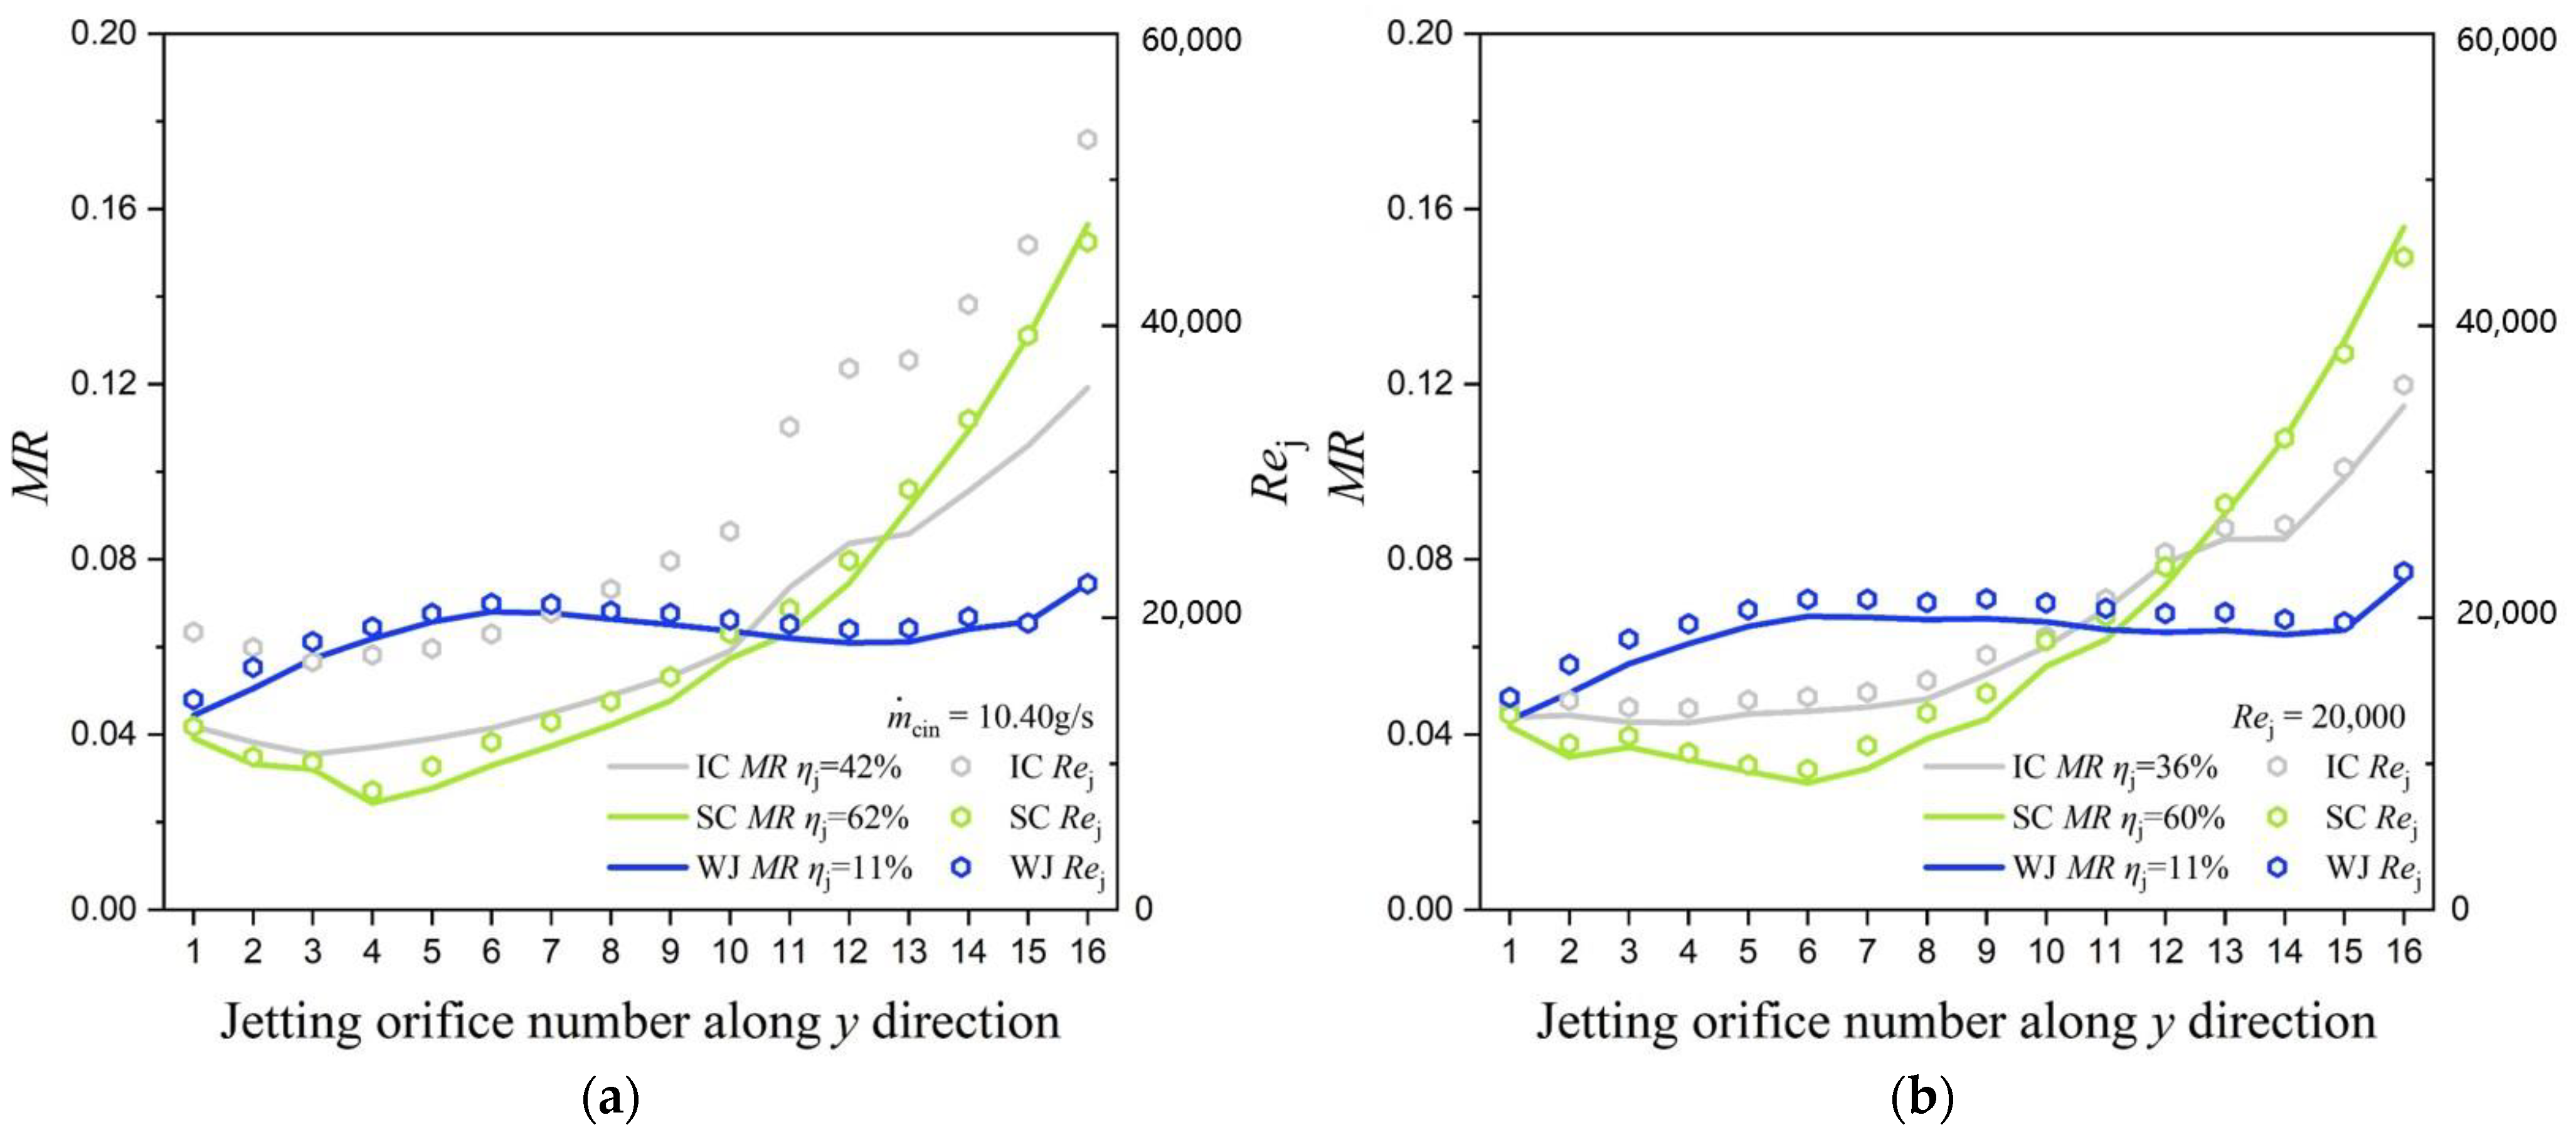
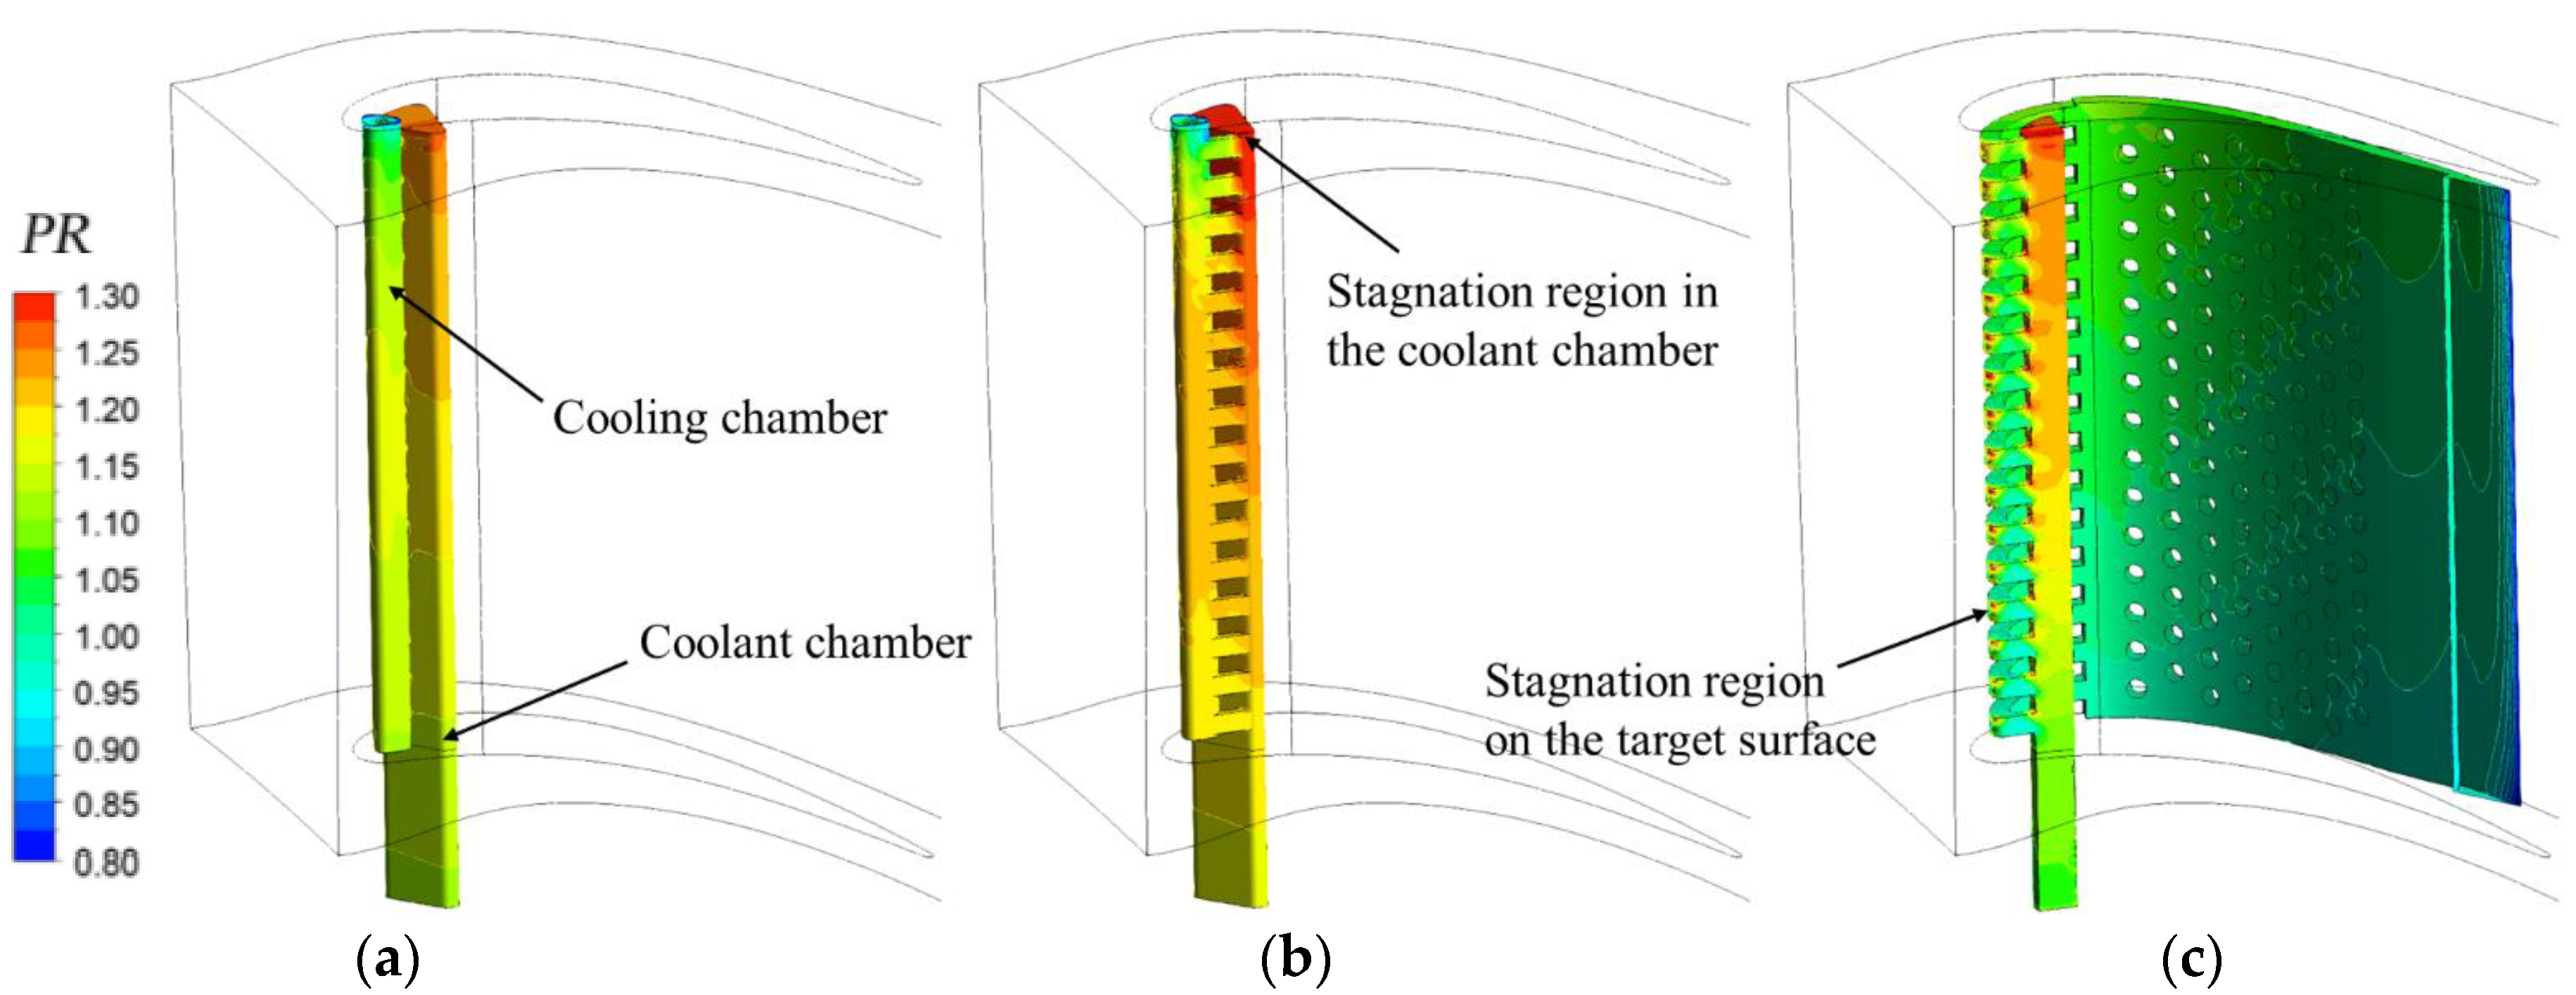
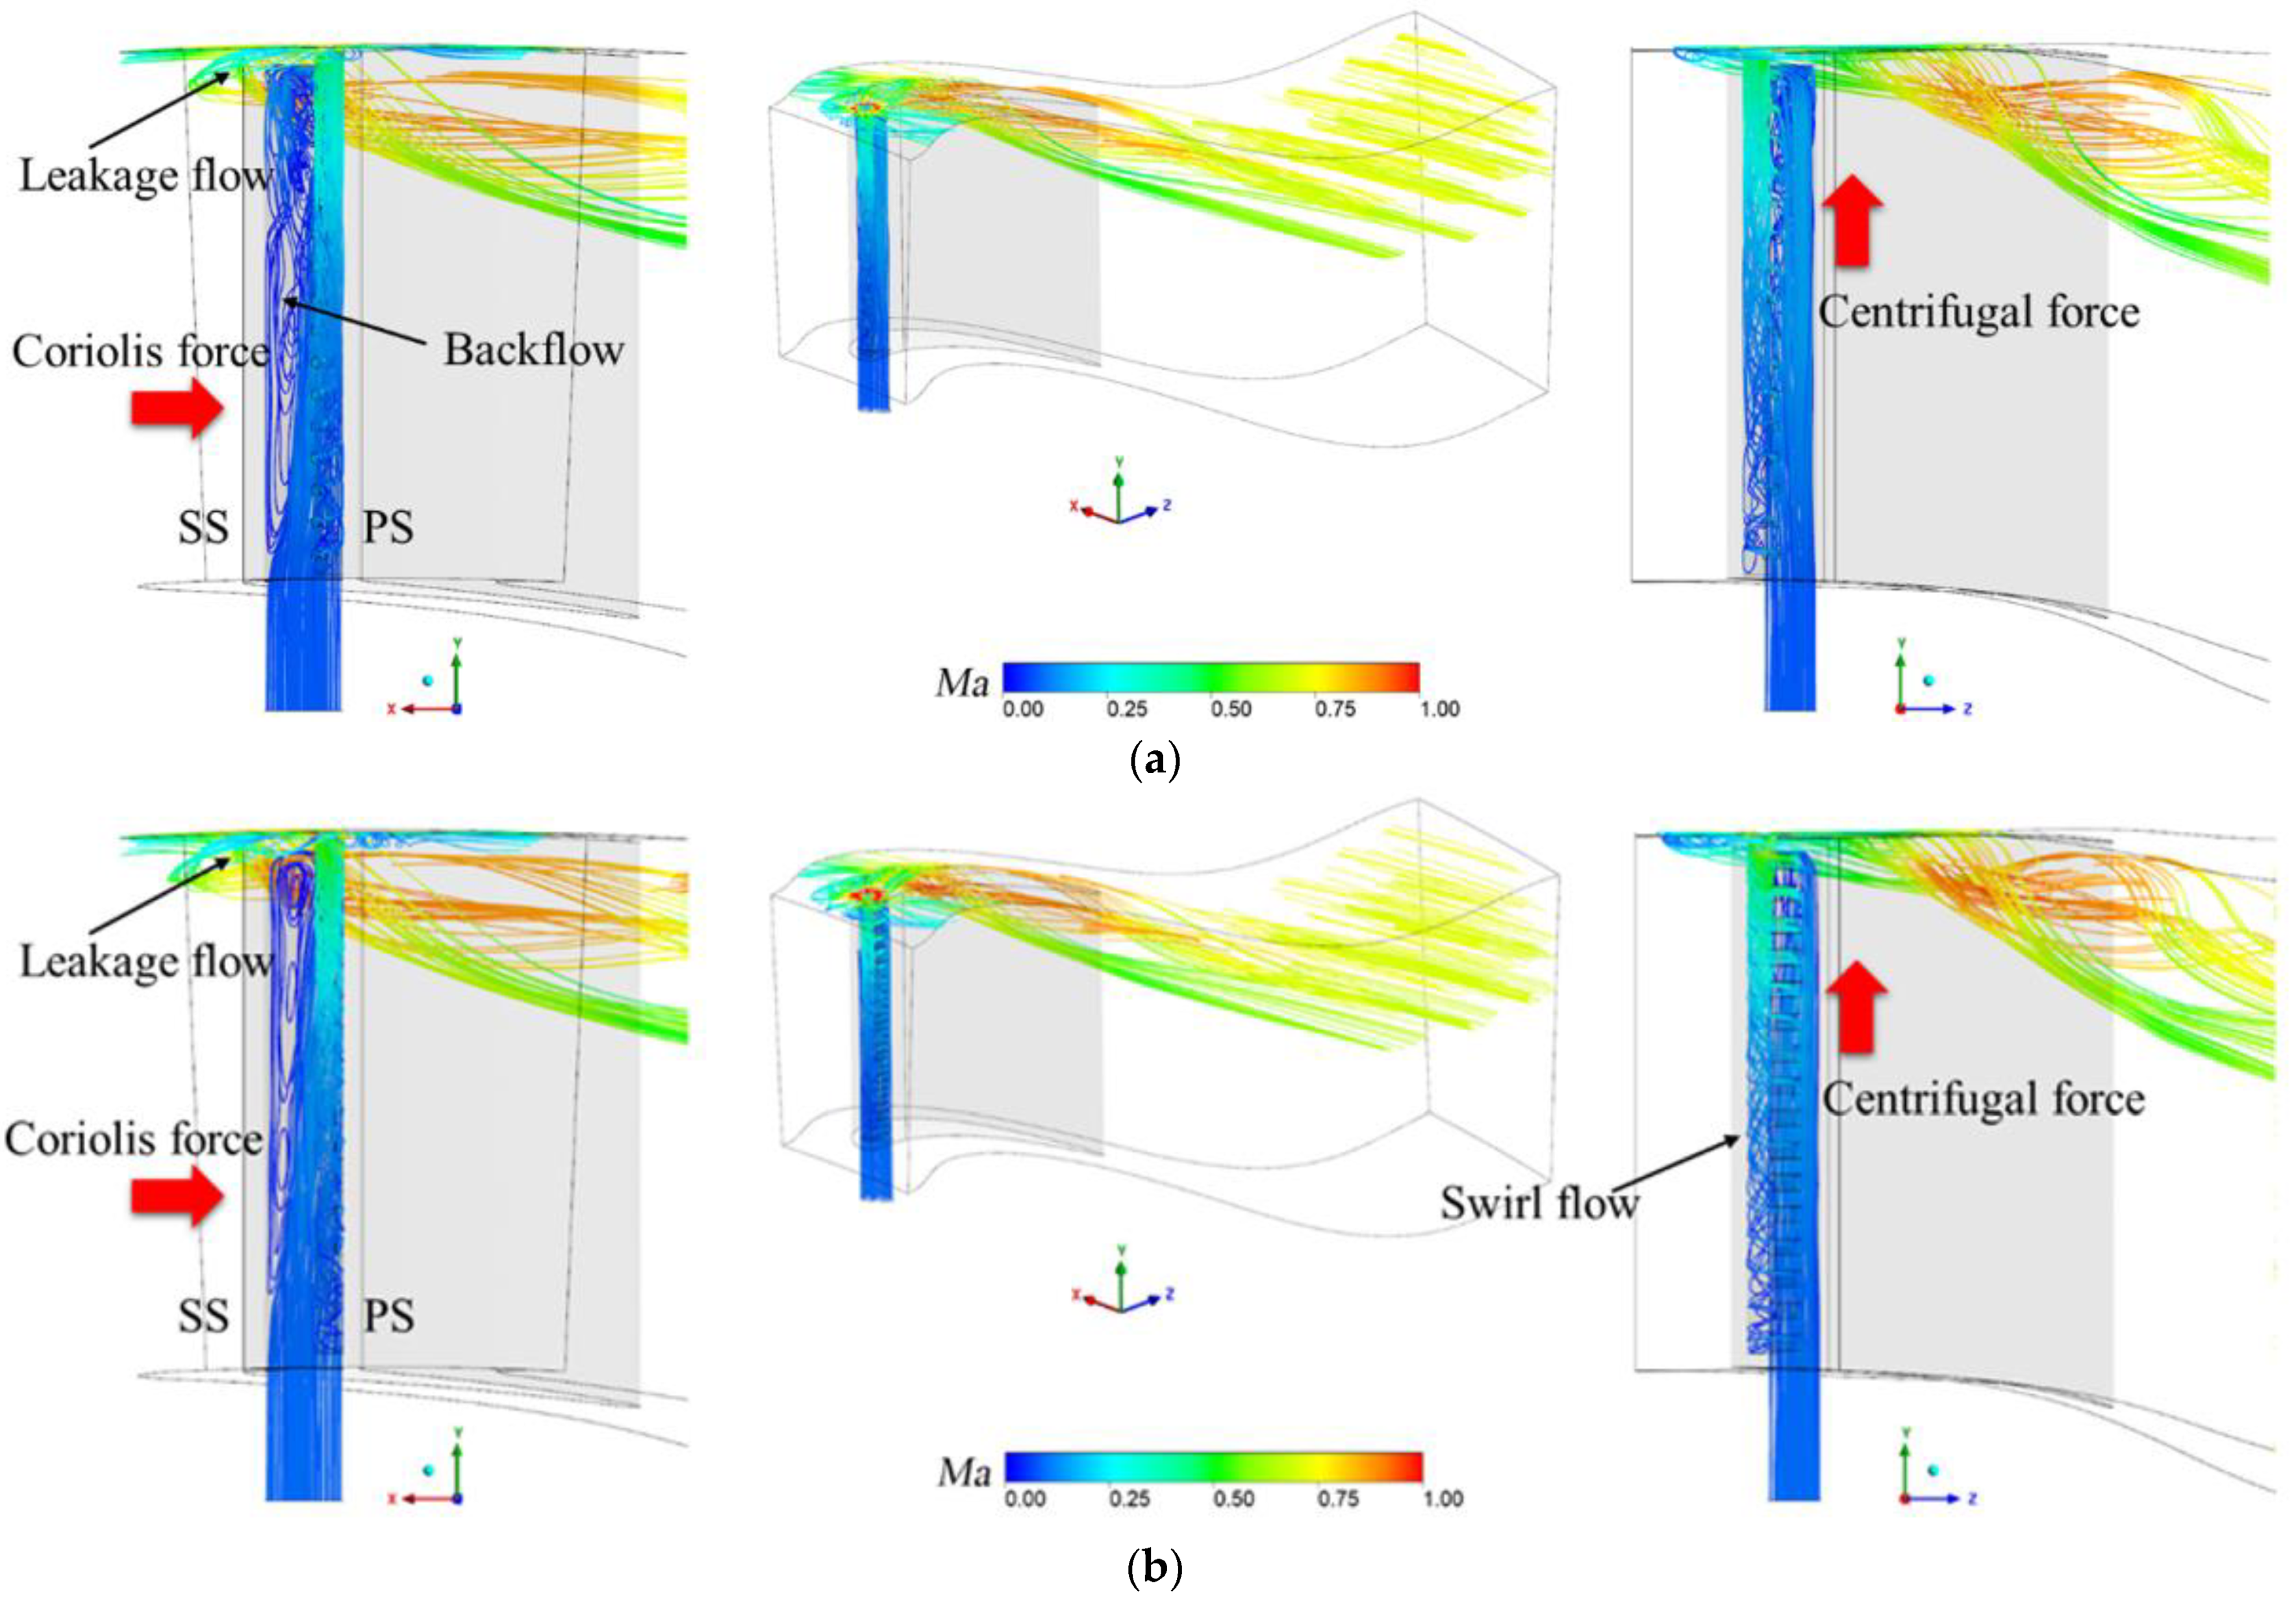
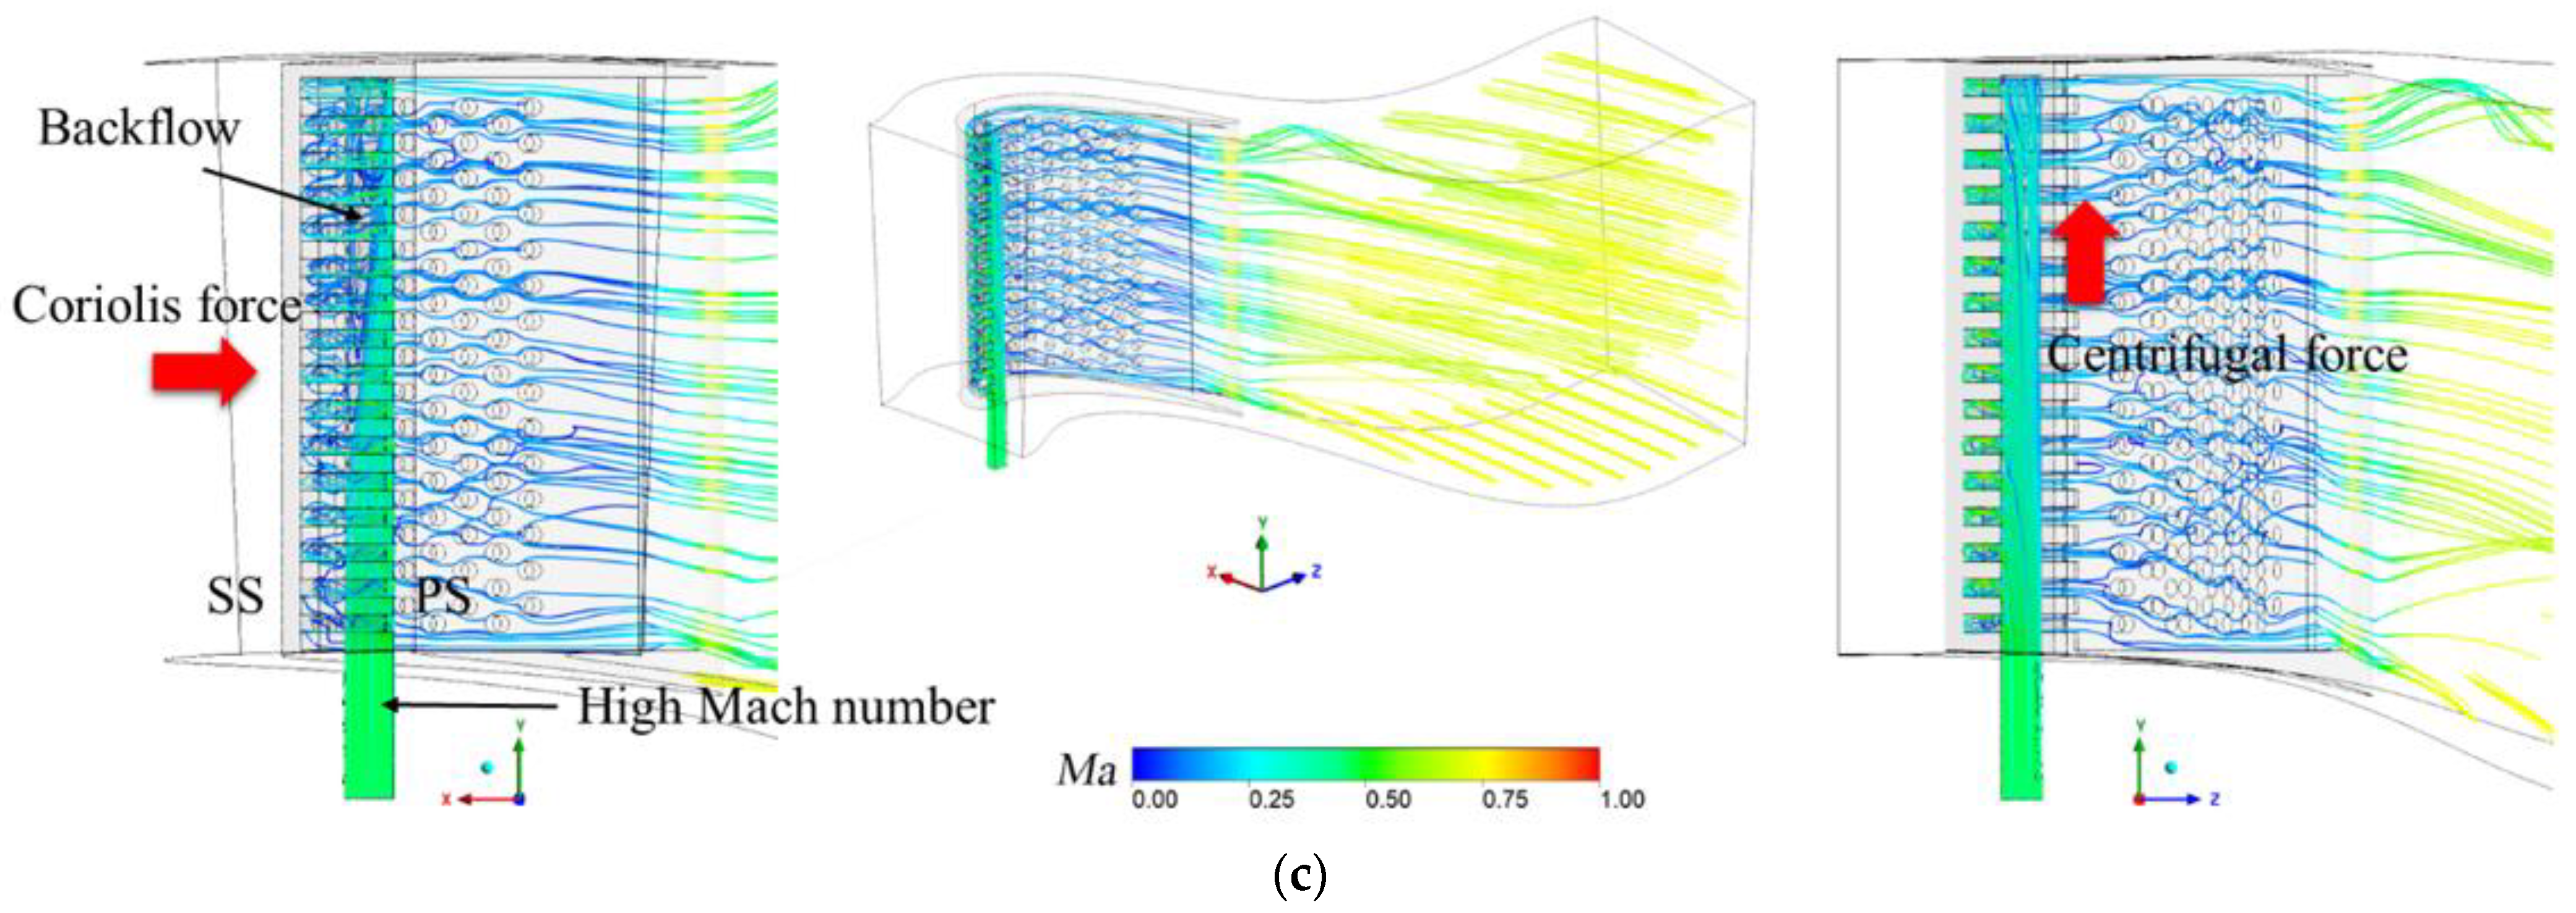
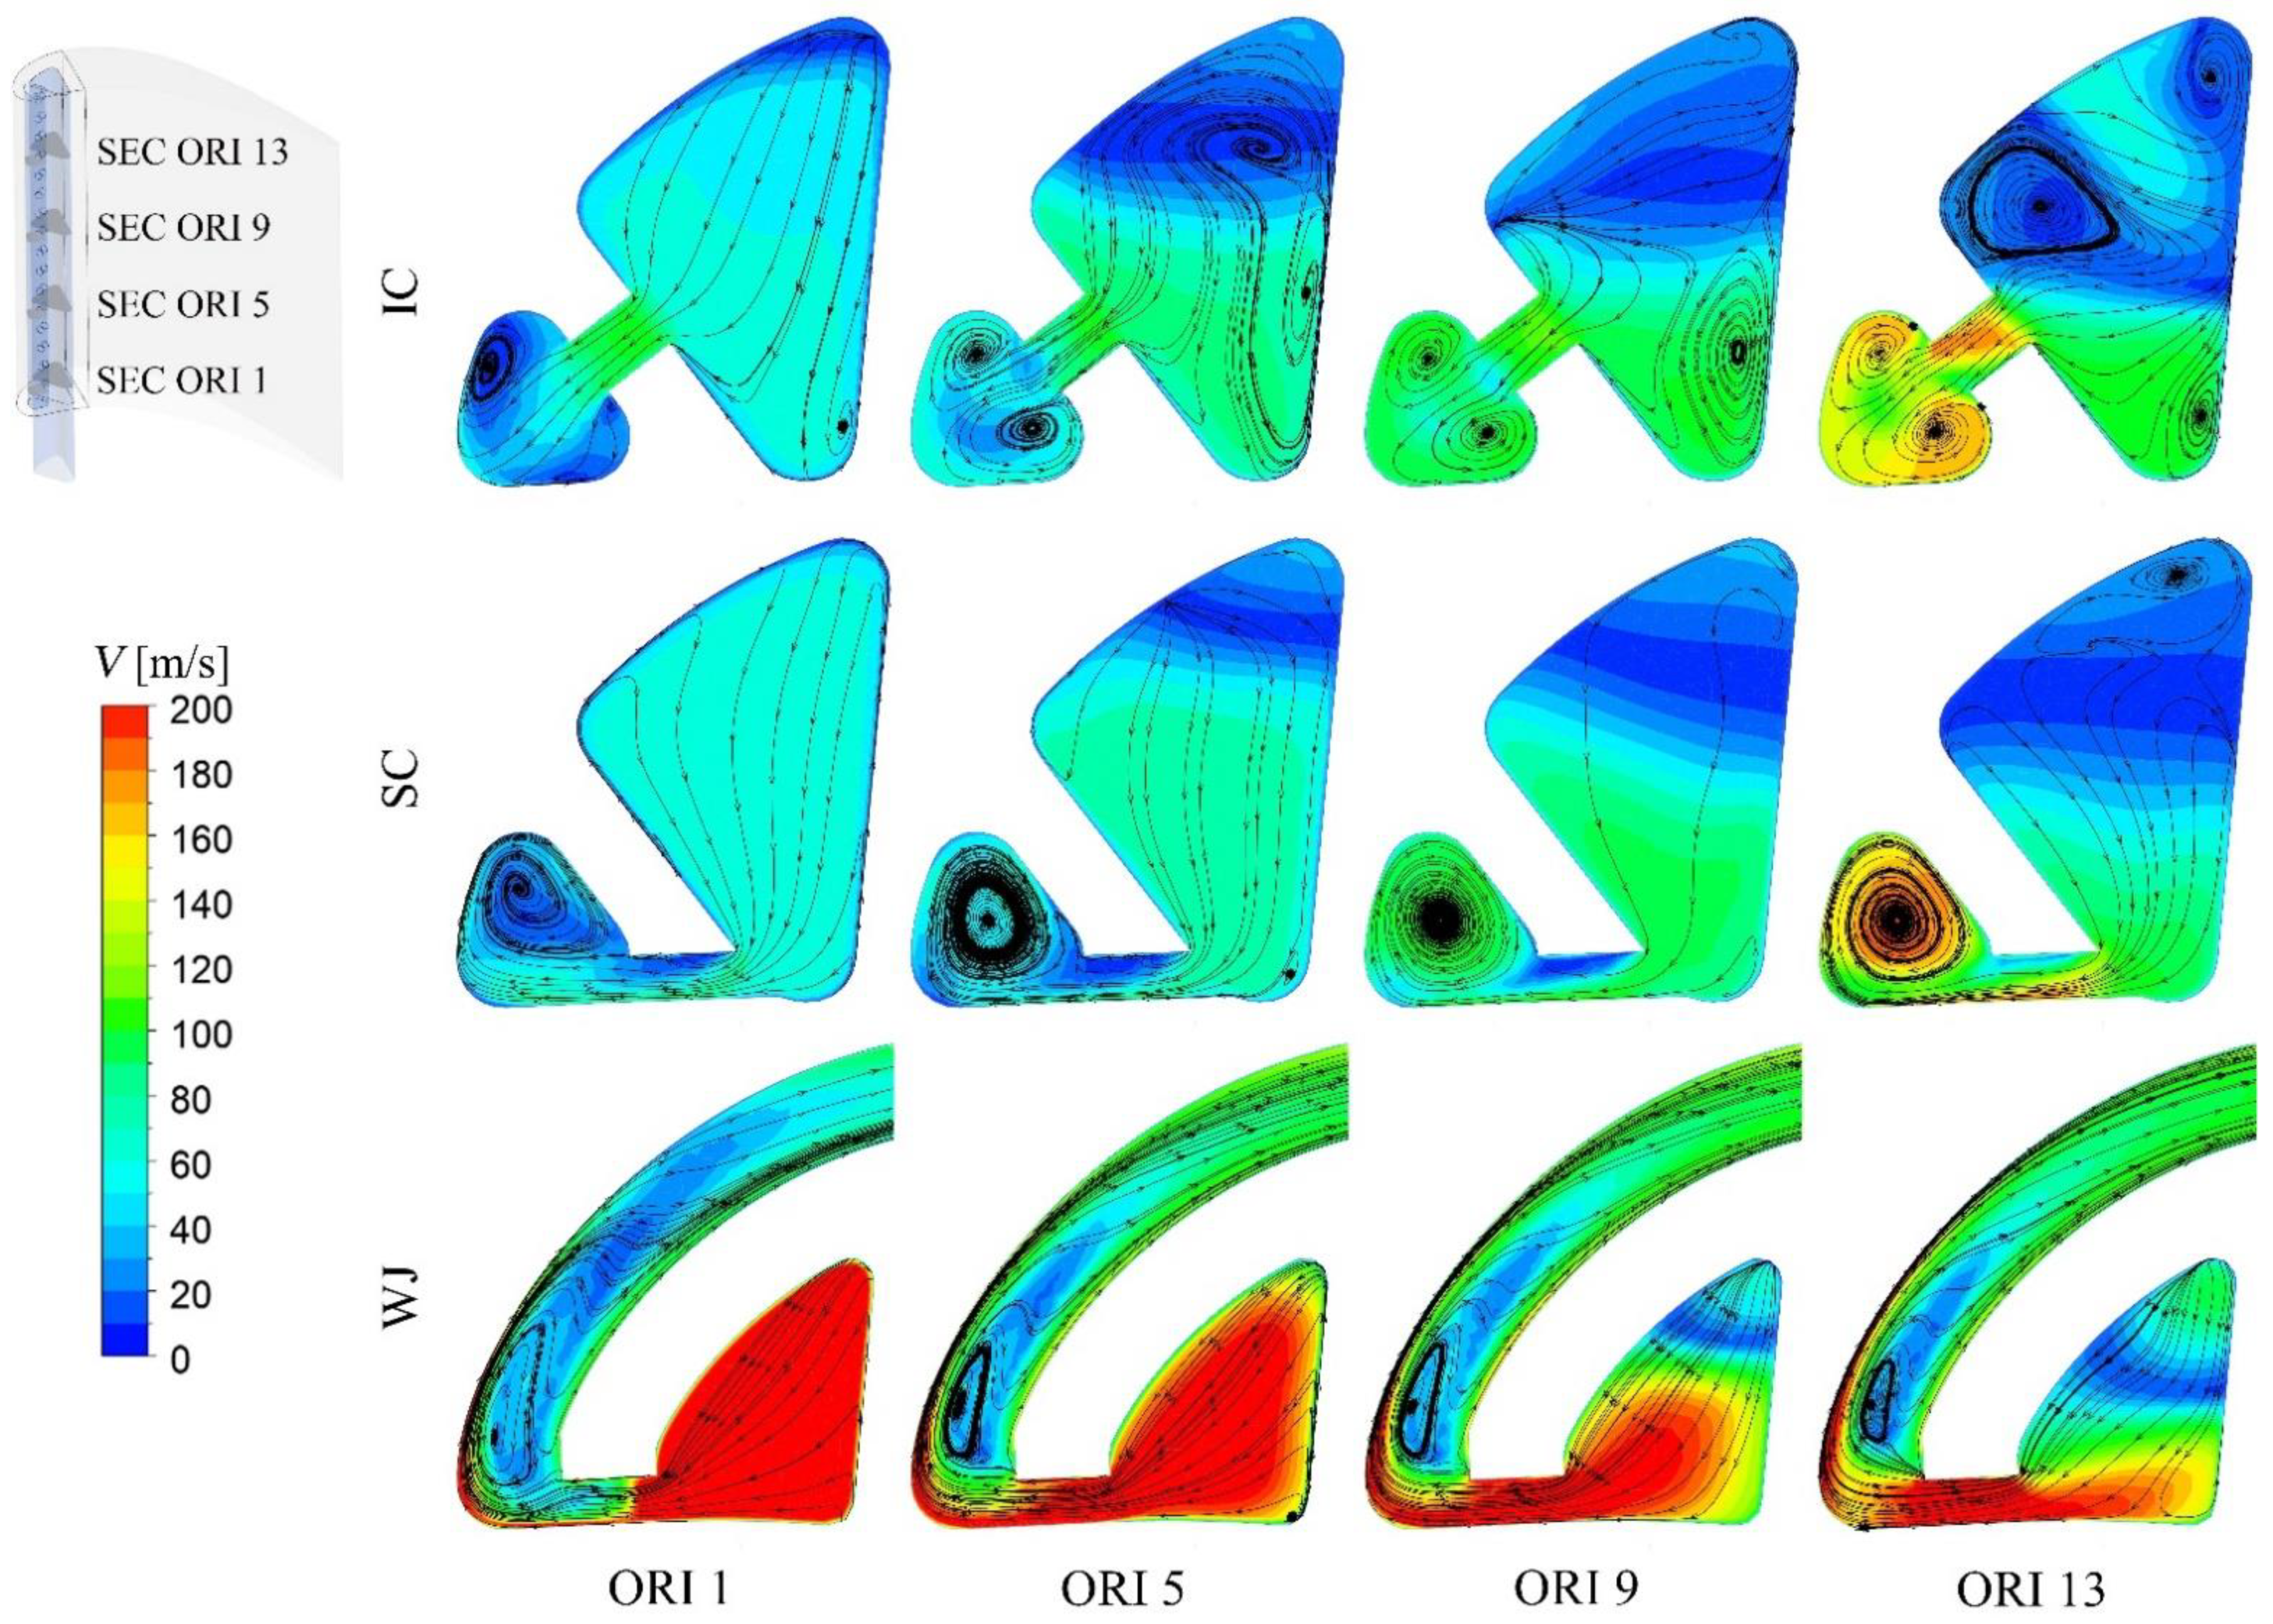
3.2. Flow Characteristics
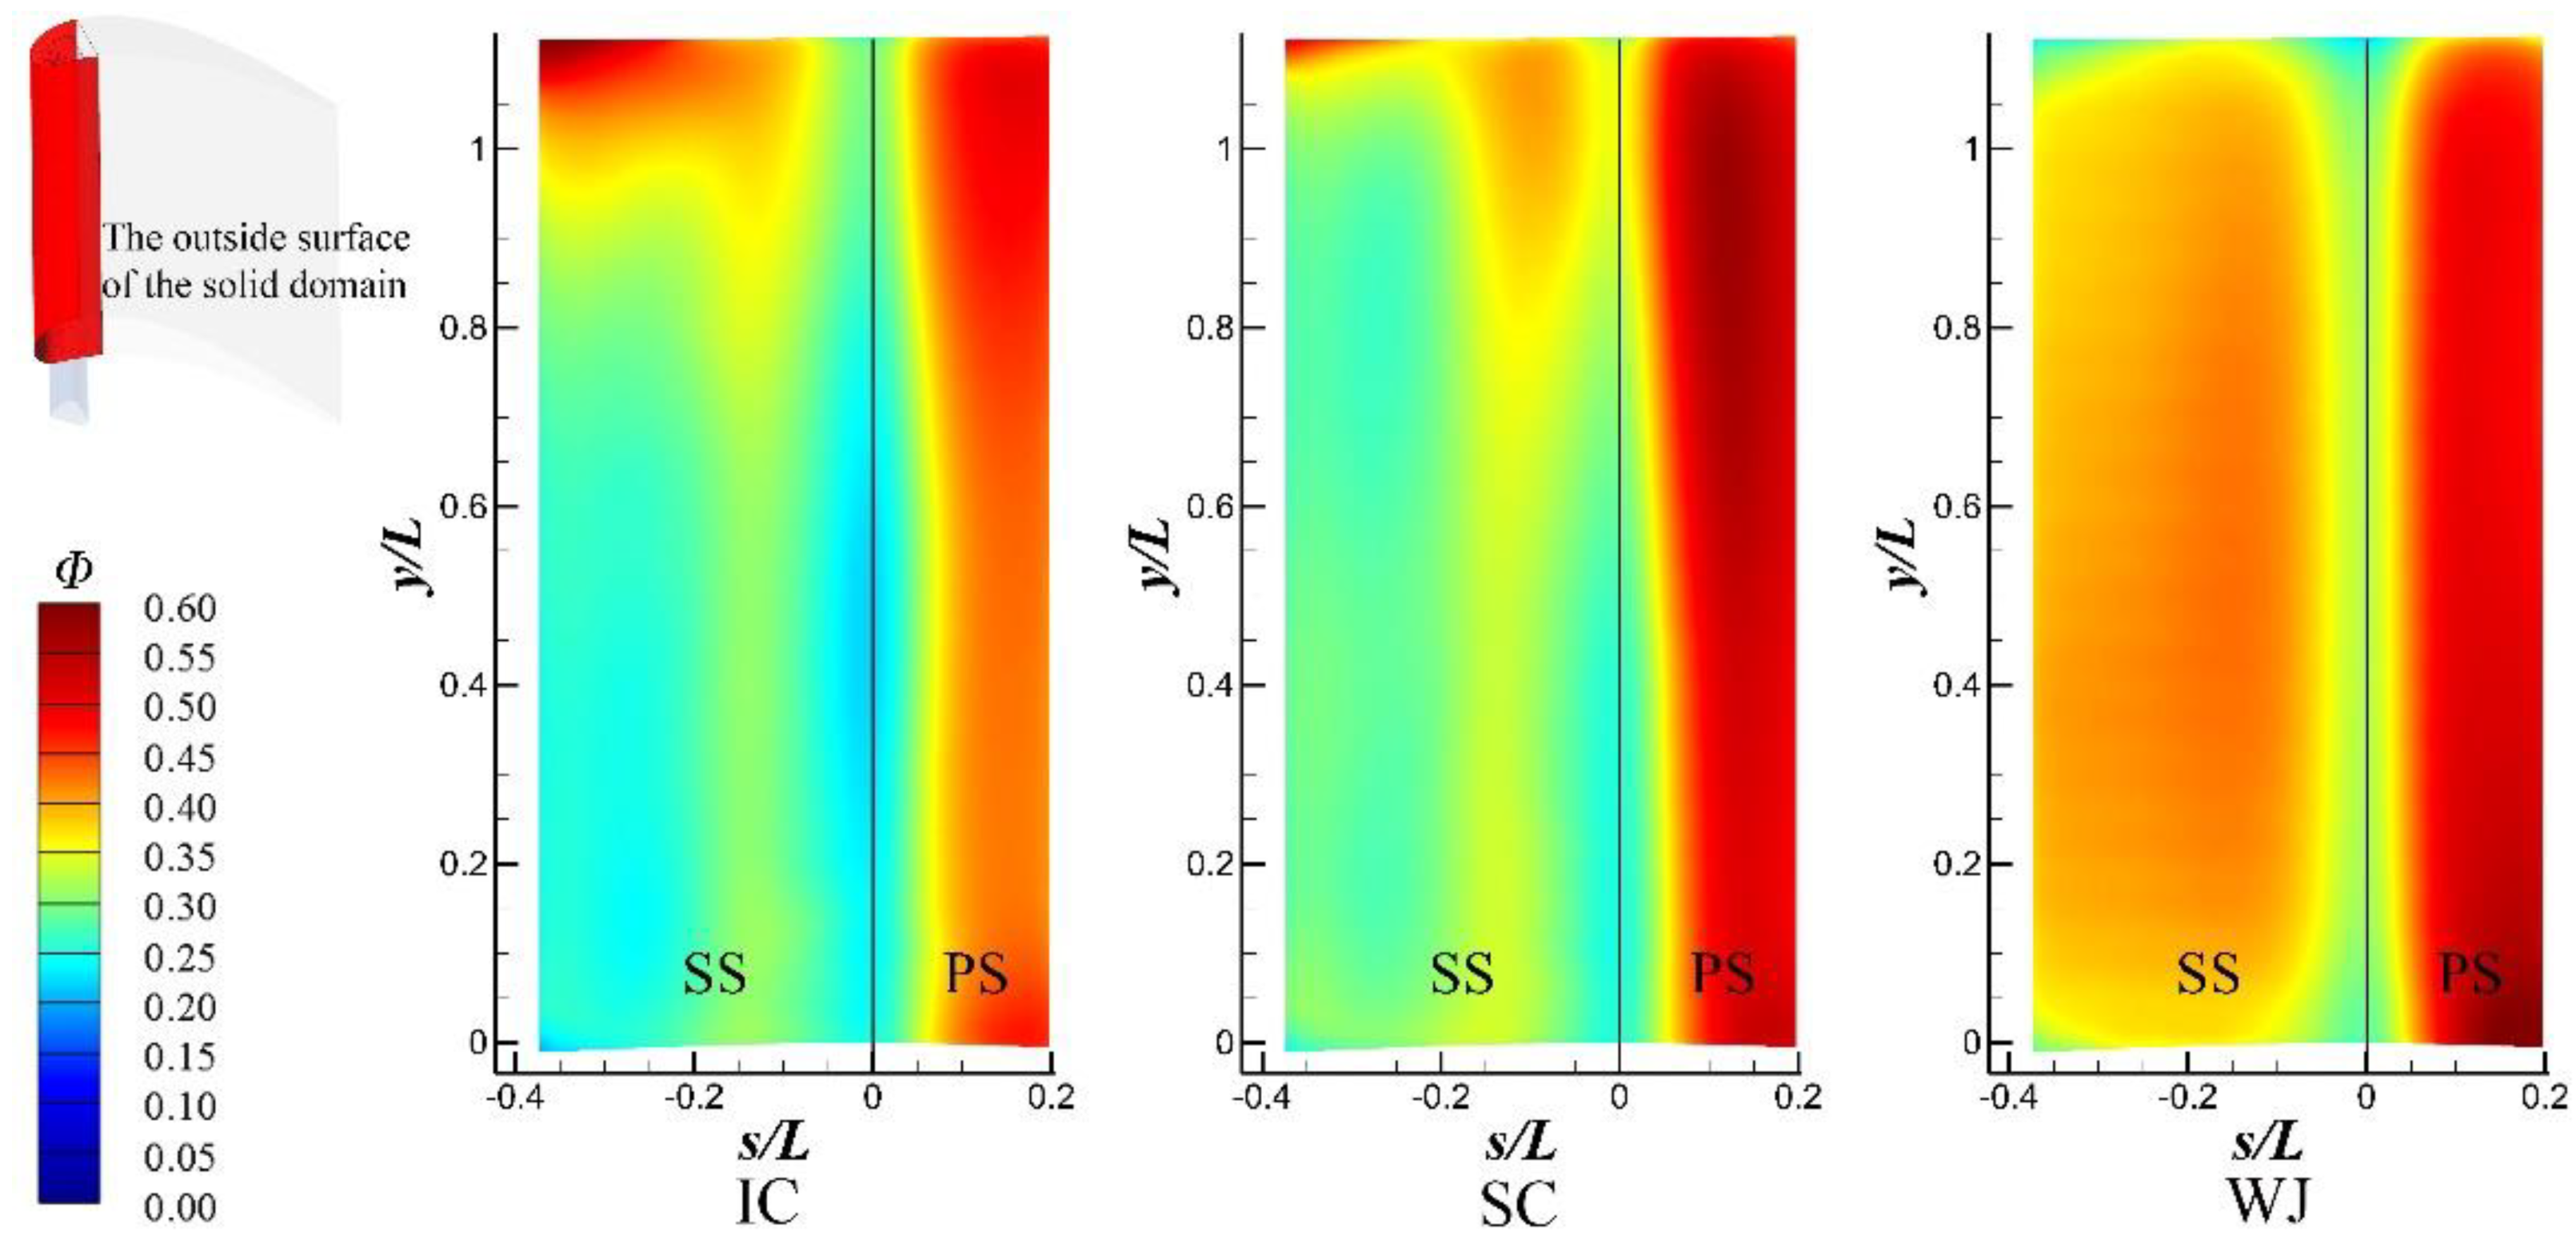
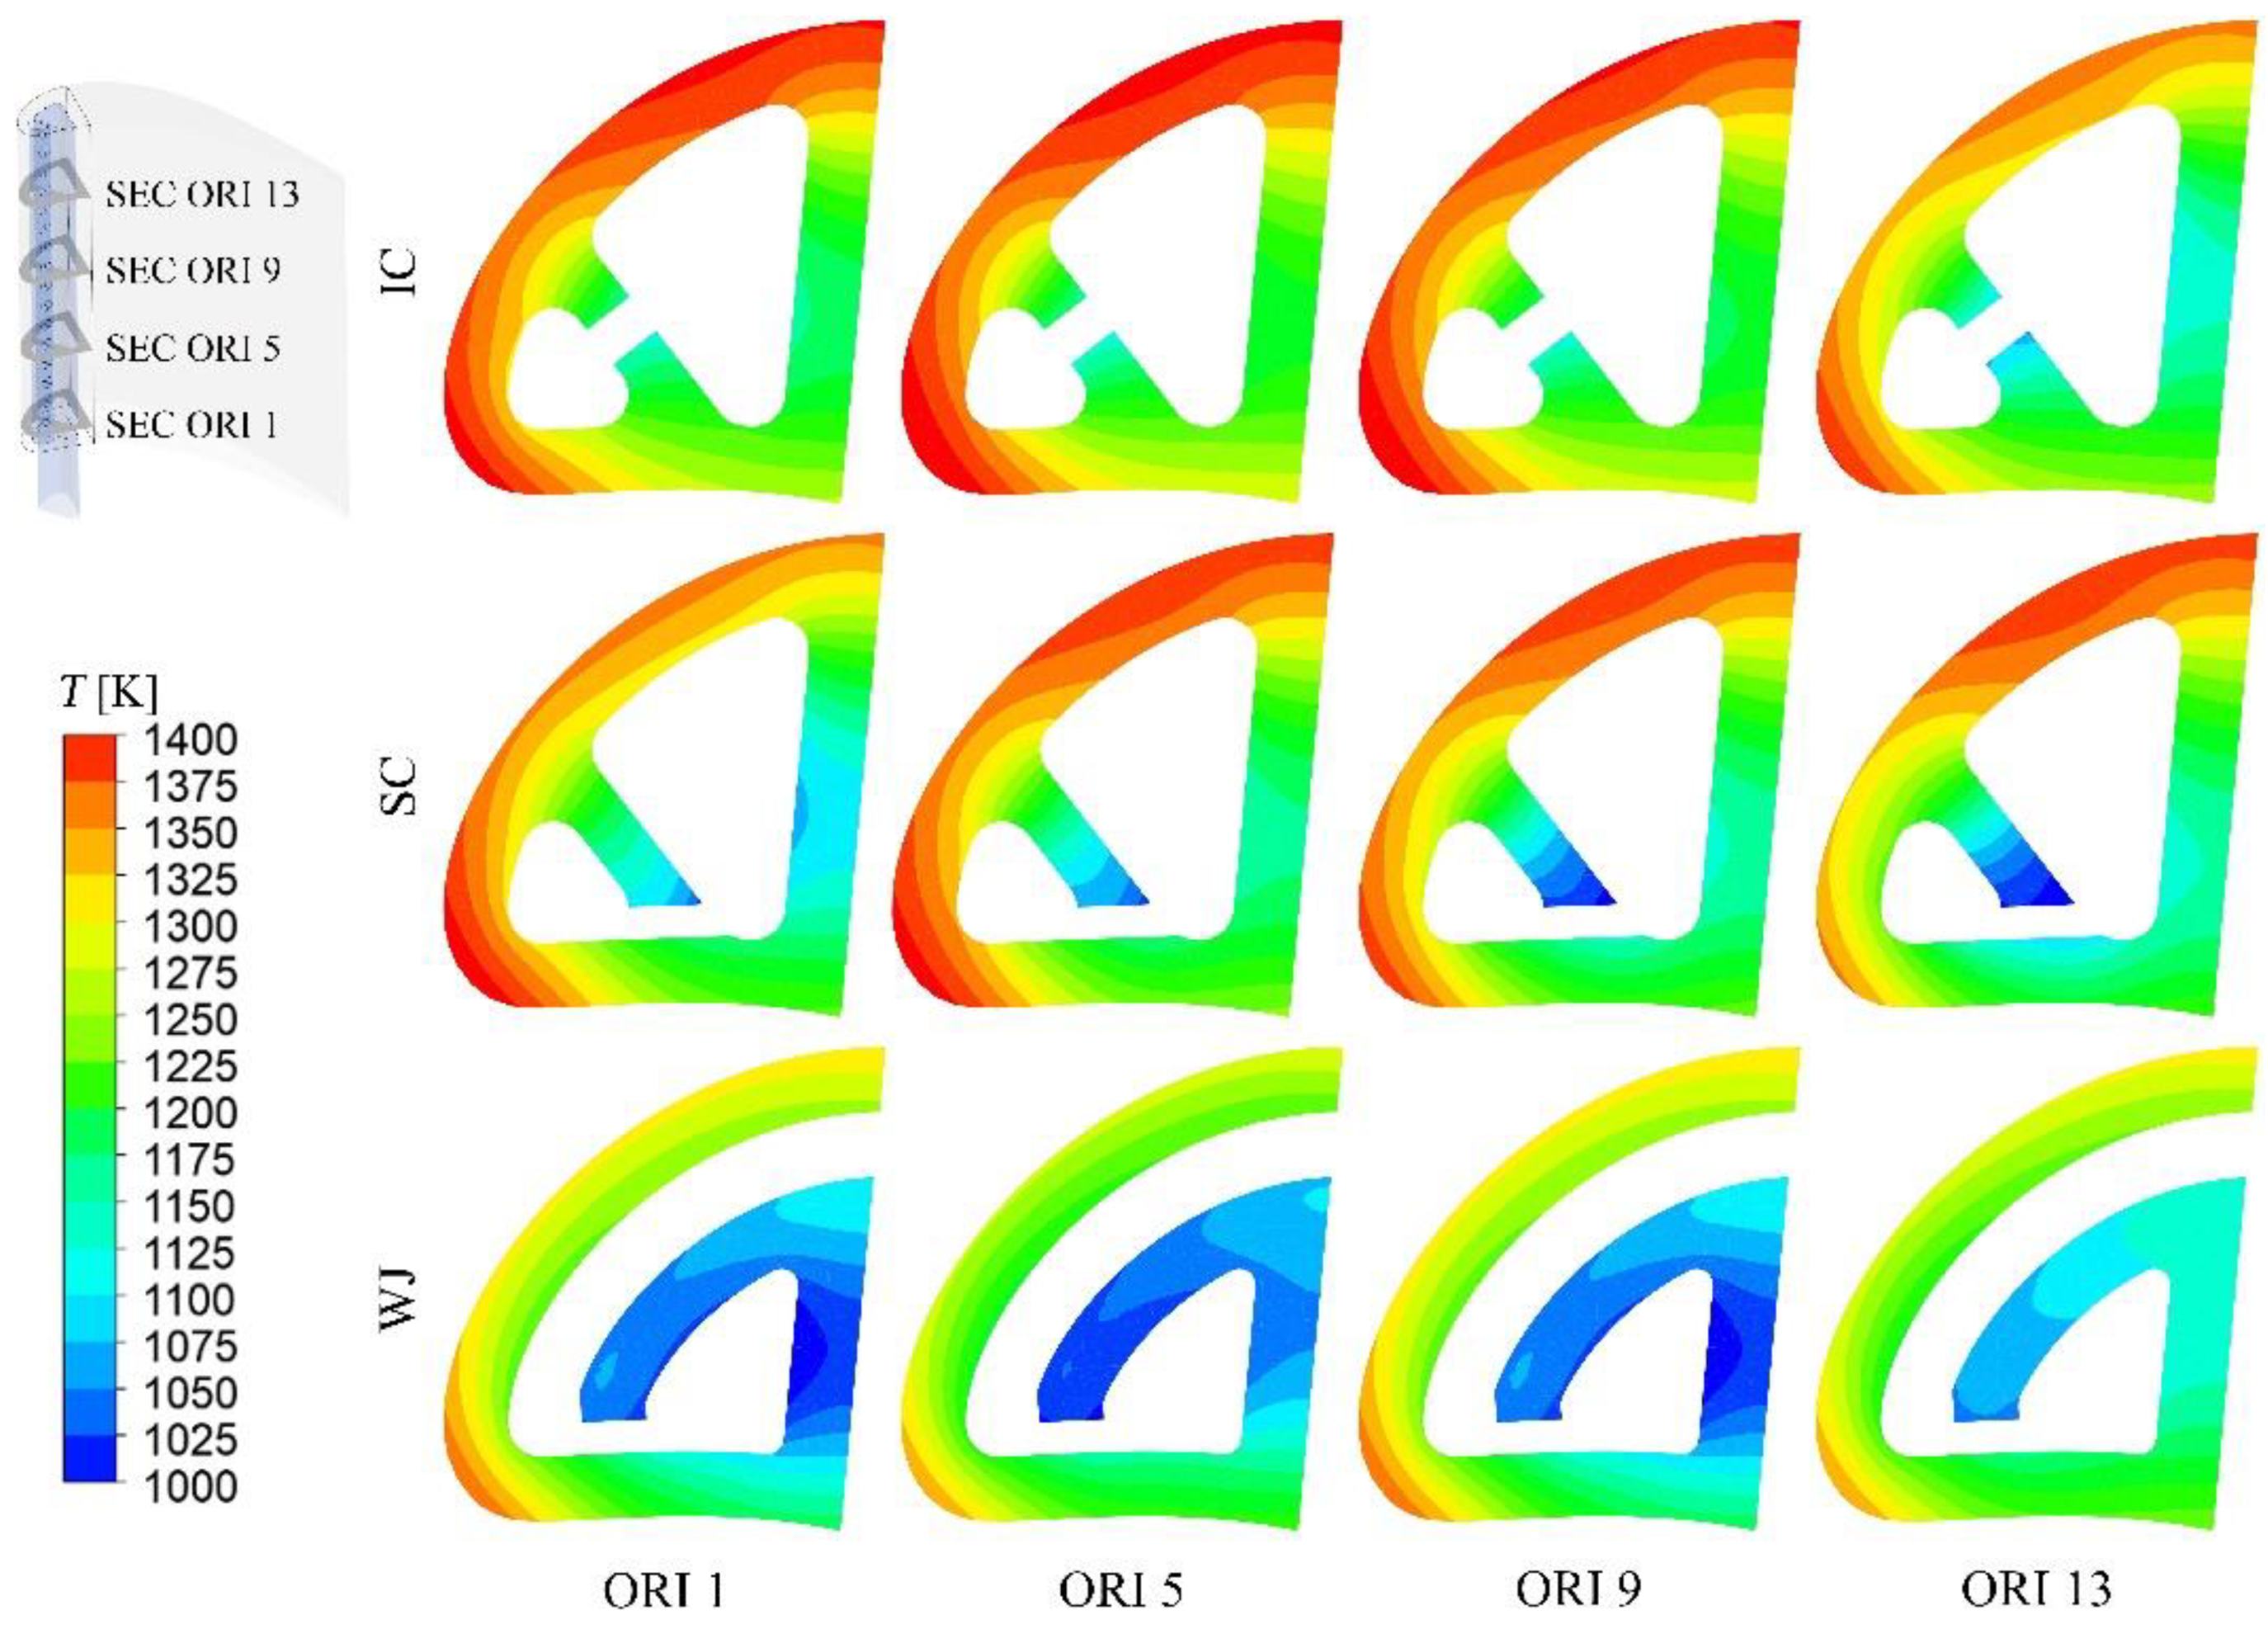
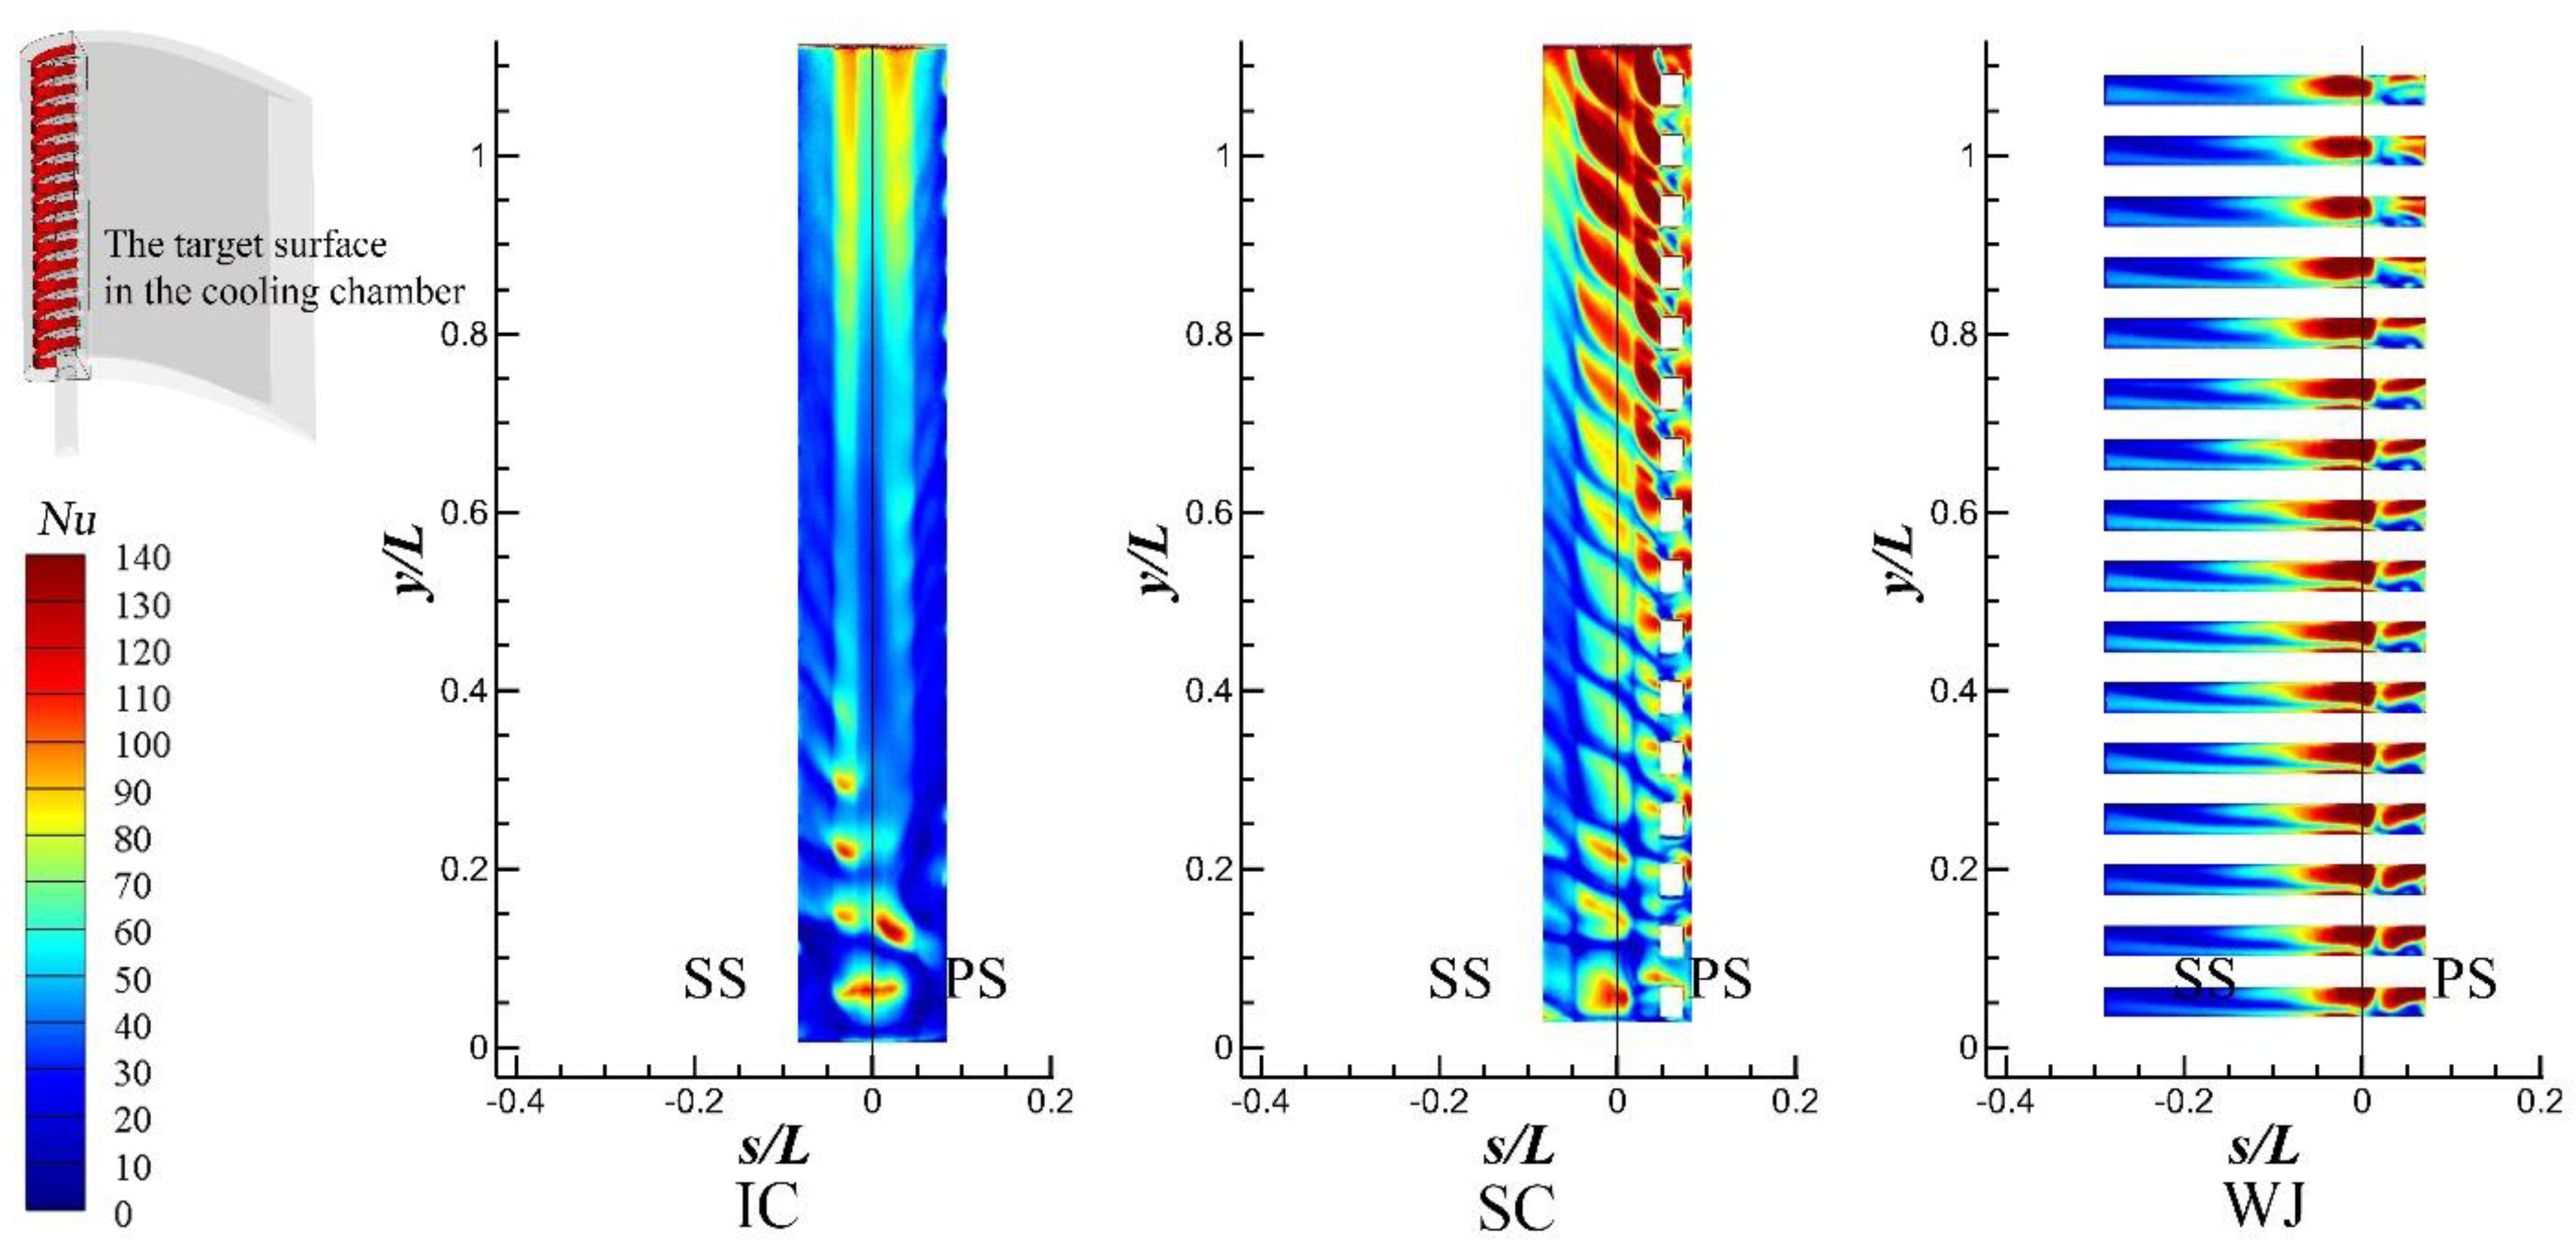
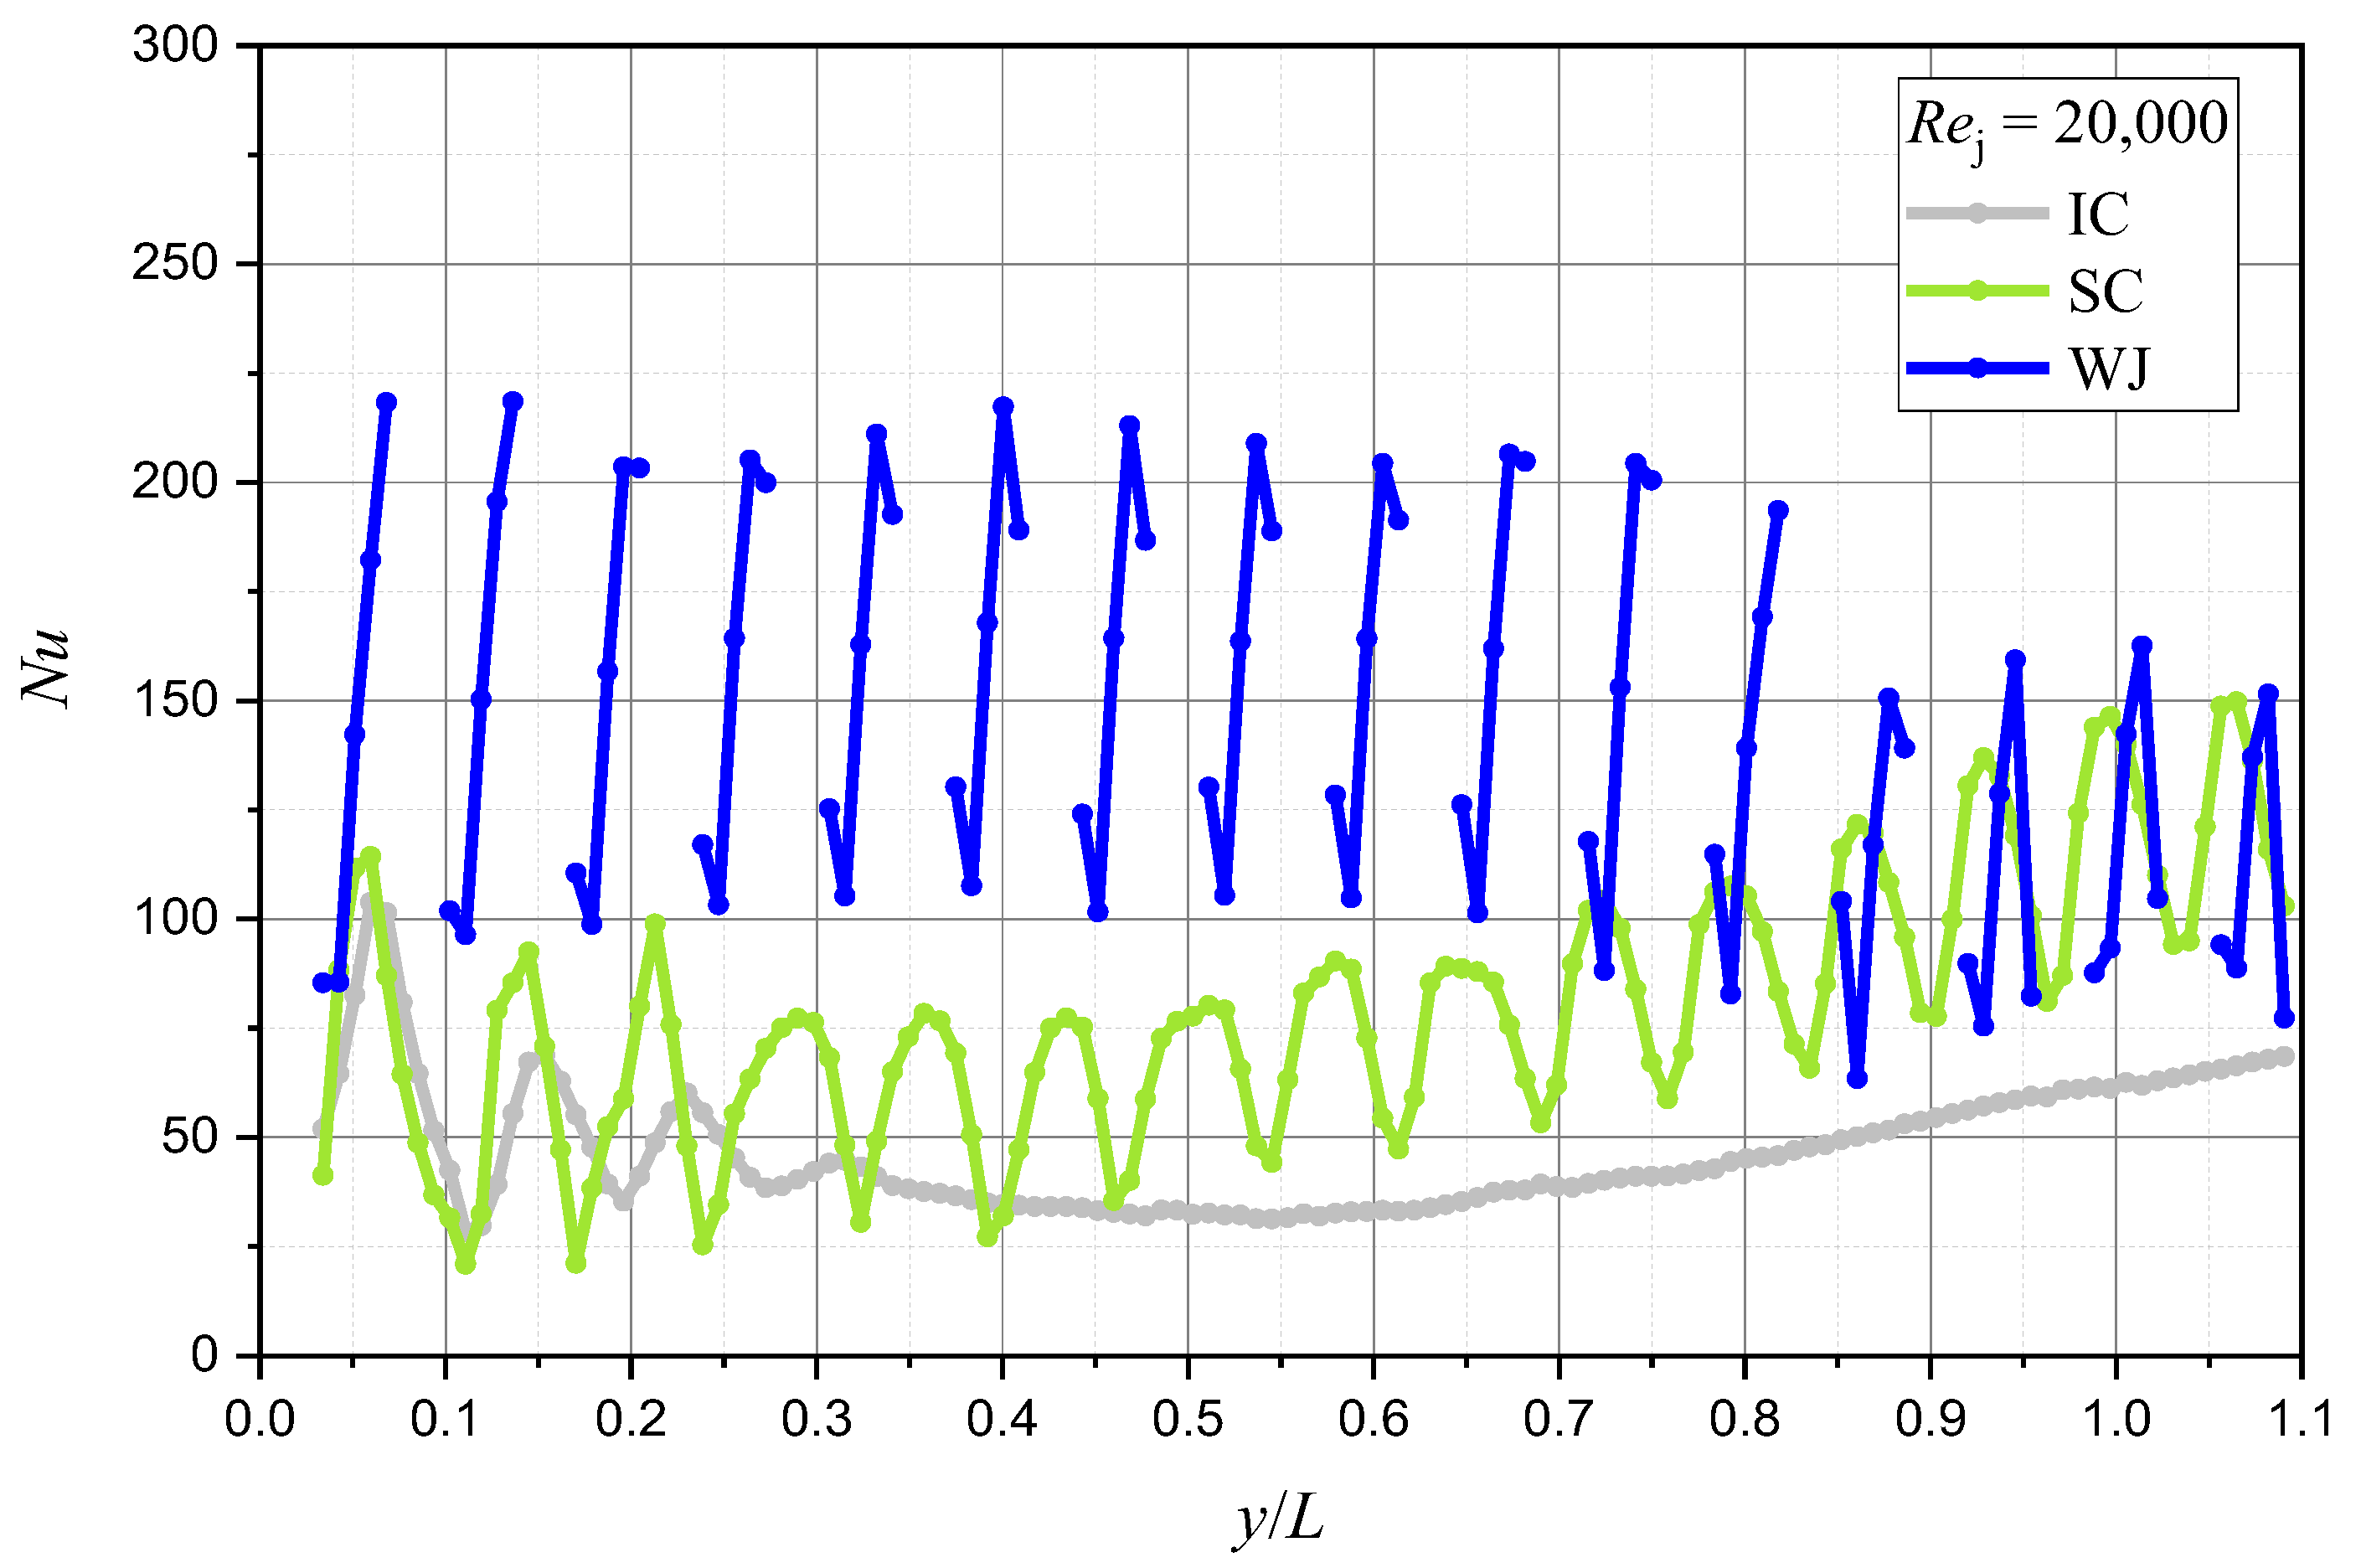
3.3. Heat Transfer Characteristics
4. Conclusions
Author Contributions
Funding
Conflicts of Interest
Nomenclature
| Symbols | |
| Achm | area of the coolant chamber surface, m2 |
| Aocs | area of the other cooling surface, m2 |
| Atar | area of the target surface, m2 |
| BR | blowing ratio |
| Dhy | hydraulic diameter, mm |
| Dim | diameter of impingement cooling hole, mm |
| Hch | height of bended channel, mm |
| h | heat transfer coefficient, W/(m2·K) |
| I | impingement distance, mm |
| Mais | isentropic Mach number |
| MR | ratio of jet mass to total coolant mass |
| mainstream mass flow rate, kg/s | |
| mideal | calculational mass flow rate in film hole with incompressible assumption, kg/s |
| mm | coolant air mass flow rate, kg/s |
| Nu | Nusselt number |
| Nua | area-averaged Nusselt number |
| Nuc | area-averaged Nusselt number on the whole internal cooling surfaces |
| Nuci | circumferentially-averaged Nusselt number |
| Nusp | span-wise averaged Nusselt number |
| Nutar | area-averaged Nusselt number on the target surface |
| qw | wall heat flux, W/m2 |
| P | static pressure, Pa |
| p | jetting orifice/hole pitch, mm |
| Pt,cin | total pressure at the coolant inlet, MPa |
| Pcou | total pressure at the coolant outlet, MPa |
| PR | pressure ratio |
| R | turning internal radius of the cooling channel, mm |
| Re | Reynolds number |
| Rej | Reynolds number based on the hydraulic diameter of the jetting orifice/hole |
| r | radius of swirl pipe, mm |
| s | stream-wise surface coordinate, mm |
| s’ | stream-wise surface coordinate on the target surface, mm |
| t | outer wall thickness of the blade, mm |
| tinner | inner cooling wall thickness of the blade, mm |
| Tew | external wall temperature, K |
| Tc | total temperature at coolant plenum inlet, K |
| Trec | uncooled blade wall temperature, K |
| Tw | target wall temperature, K |
| U | mean velocity, m/s |
| Wch | width of cooling channel, mm |
| Win | jetting orifice width, mm |
| x | stream-wise distance, mm |
| y | height direction coordinate, mm |
| Greek Symbols | |
| μ | fluid dynamic viscosity, kg/(m·s) |
| ρ | fluid density, kg/m3 |
| λ | fluid thermal conductivity, W/(m·K) |
| ηj | mass flow nonuniformity coefficient |
| Φ | overall cooling effectiveness |
| Φmsp | main region span-wise averaged overall cooling effectiveness |
| Φsp | span-wise averaged overall cooling effectiveness |
| Abbreviation | |
| CHT | Conjugate Heat Transfer |
| IC | Impingement Cooling |
| RANS | Reynolds-Averaged Navier-Stokes |
| SC | Swirl Cooling |
| WJ | Wall Jet cooling |
References
- Elnady, T.; Hassan, I.; Kadem, L.; Lucas, T. Cooling Effectiveness of Shaped Film Holes for Leading Edge. Exp. Therm. Fluid Sci. 2013, 44, 649–661. [Google Scholar] [CrossRef]
- Chowdhury, N.H.K.; Qureshi, S.A.; Zhang, M.J.; Han, J.C. Influence of Turbine Blade Leading Edge Shape on Film Cooling with Cylindrical Holes. Int. J. Heat Mass Transf. 2017, 115, 895–908. [Google Scholar] [CrossRef]
- Bu, S.; Yang, Z.; Zhang, W.; Liu, H.; Sun, H. Research on the Thermal Performance of Matrix Cooling Channel with Response Surface Methodology. Appl. Therm. Eng. 2016, 109, 75–86. [Google Scholar] [CrossRef]
- Sun, H.O.; Sun, T.; Yang, L.F.; Bu, S.; Luan, Y.G. Effect of Bleed Hole on Internal Flow and Heat Transfer in Matrix Cooling Channel. Appl. Therm. Eng. 2018, 136, 419–430. [Google Scholar] [CrossRef]
- Siw, S.C.; Chyu, M.K.; Karaivanov, V.G.; Slaughter, W.S.; Alvin, M.A. Influence of Internal Cooling Configuration on Metal Temperature Distributions of Future Coal-Fuel Based Turbine Airfoils; ASME Paper No. GT2009-59829; ASME: New York, NY, USA, 2009. [Google Scholar]
- Liu, L.L.; Zhu, X.C.; Liu, H.; Du, Z.H. Effect of Tangential Jet Impingement on Blade Leading Edge Impingement Heat Transfer. Appl. Therm. Eng. 2018, 130, 1380–1390. [Google Scholar] [CrossRef]
- Martin, H. Heat and Mass Transfer between Impinging Gas Jets and Solid Surfaces. Adv. Heat Transf. 1977, 13, 1–60. [Google Scholar]
- Zuckerman, N.; Lior, N. Jet Impingement Heat Transfer: Physics, Correlations, and Numerical Modeling. Adv. Heat Transf. 2006, 39, 565–631. [Google Scholar]
- Weigand, B.; Spring, S. Multiple Jet Impingement—A Review. Heat Transf. Res. 2011, 42, 101–142. [Google Scholar] [CrossRef]
- Chupp, R.E.; Helms, H.E.; Mcfadden, P.W. Evaluation of Internal Heat Transfer Coefficients for Impingement Cooled Turbine Airfoils. J. Aircr. 1969, 6, 203–208. [Google Scholar] [CrossRef]
- Taslim, M.E.; Setayeshgar, L.; Spring, S.D. An Experimental Evaluation of Advanced Leading Edge Impingement Cooling Concepts. J. Turbomach. 2000, 123, 147–153. [Google Scholar] [CrossRef]
- Ramakumar, B.V.N.; Joshi, D.S.; Sridhar, M.; Jong, S.; Liu, J.S.; Crites, D.C. Computational Investigation of Flow and Heat Transfer Characteristics of Impingement Cooling Channel. In Turbo Expo: Power for Land, Sea, and Air, Proceedings of the ASME Turbo Expo 2013: Turbine Technical Conference and Exposition, San Antonio, TX, USA, 3–7 June 2013; ASME Paper No. GT2013-94553; ASME: New York, NY, USA, 2013. [Google Scholar]
- Parneix, S.; Behnia, M.; Durbin, P.A. Prediction of Turbulent Heat Transfer in an Axisymmetric Jet Impinging on a Heated Pedestal. J. Heat Transf. 1999, 121, 43–49. [Google Scholar] [CrossRef]
- Kondo, Y.; Matsushima, H.; Komatsu, T. Optimization of Pin-Fin Heat Sink for Impingement Cooling in Electronic Packaging. J. Electron. 2000, 122, 240–246. [Google Scholar]
- El-Gabry, L.A.; Kaminski, D.A. Experimental investigation of local heat transfer distribution on smooth and roughened surfaces under an array of angled impinging jets. J. Turbomach. 2005, 127, 532–544. [Google Scholar] [CrossRef]
- Kanokjaruvijit, K.; Martinezbotas, R.F. Heat Transfer Correlations of Perpendicularly Impinging Jets on a Hemispherical-Dimpled Surface. Int. J. Heat Mass Transf. 2010, 53, 3045–3056. [Google Scholar] [CrossRef]
- Xing, Y.; Weigand, B. Experimental Investigation of Impingement Heat Transfer on a Flat and Dimpled Plate with Different Crossflow Schemes. Int. J. Heat Mass Transf. 2010, 53, 3874–3886. [Google Scholar] [CrossRef]
- Hrycak, P. Heat Transfer from Impinging Jets to a Flat Plate with Conical and Ring Protuberances. Int. J. Heat Mass Transf. 1984, 27, 2145–2154. [Google Scholar] [CrossRef]
- Kreith, F.; Margolis, D. Heat Transfer and Friction in Turbulent Vortex Flow. Appl. Sci. Res. 1959, 8, 457–473. [Google Scholar] [CrossRef]
- Qian, C.; Flannery, K.; Saito, K.; Downs, J.; Soechting, F. Innovative Vortex Cooling Concept and Its Application to Turbine Airfoil Trailing Edge Cooling Design. In Proceedings of the Joint Propulsion Conference & Exhibit, Seattle, WA, USA, 6–9 July 1997; pp. 1997–3013. [Google Scholar]
- Du, C.H.; Li, L.; Wu, X.; Feng, Z.P. Effect of Jet Nozzle Geometry on Flow and Heat Transfer Performance of Vortex Cooling for Gas Turbine Blade Leading Edge. Appl. Therm. Eng. 2016, 93, 1020–1032. [Google Scholar] [CrossRef]
- Liu, Z.; Feng, Z.P. Numerical Simulation on the Effect of Jet Nozzle Position on the Impingement Cooling of Gas Turbine Blade Leading Edge. Int. J. Heat Mass Transf. 2011, 54, 4949–4959. [Google Scholar] [CrossRef]
- Kusterer, K.; Lin, G.; Bohn, D.; Sugimoto, T.; Tanaka, R.; Kazari, M. Heat Transfer Enhancement for Gas Turbine Internal Cooling by Application of Double Swirl Cooling Chambers. In Turbo Expo: Power for Land, Sea, and Air, Proceedings of the ASME Turbo Expo 2013: Turbine Technical Conference and Exposition, San Antonio, TX, USA, 3–7 June 2013; ASME Paper No. GT2013-94774; ASME: New York, NY, USA, 2013. [Google Scholar]
- Lin, G.; Kusterer, K.; Bohn, D.; Sugimoto, T.; Tanaka, R.; Kazari, M. Investigation on Heat Transfer Enhancement and Pressure Loss of Double Swirl Chambers Cooling. Propuls. Power Res. 2013, 2, 177–187. [Google Scholar] [CrossRef] [Green Version]
- Kusterer, K.; Lin, G.; Bohn, D.; Sugimoto, T.; Tanaka, R.; Kazari, M. Leading Edge Cooling of a Gas Turbine Blade with Double Swirl Chambers. In Turbo Expo: Power for Land, Sea, and Air, Proceedings of the ASME Turbo Expo 2014: Turbine Technical Conference and Exposition, Düsseldorf, Germany, 16–20 June 2014; ASME Paper No. GT2014-25851; ASME: New York, NY, USA, 2014. [Google Scholar]
- Han, J.C.; Dutta, S.; Ekkad, S. Gas Turbine Heat Transfer and Cooling Technology; Taylor & Francis: New York, NY, USA, 2000. [Google Scholar]
- Rekingen, J.H.; Othmarsingen, A.K.; Mandach, T.S.; Seon, R.T. Apparatus for Impingement Cooling. U.S. Patent No. 5467815, 8 June 1995. [Google Scholar]
- Hebert, R.; Ekkad, S.V.; Khanna, V.; Abreu, M.; Moon, H.K. Heat Transfer Study of a Novel Low-Crossflow Design for Jet Impingement. In Proceedings of the ASME International Mechanical Engineering Congress and Exposition, Paper No. IMECE2004-60468. Anaheim, CA, USA, 13–19 November 2004; pp. 583–588. [Google Scholar]
- Liu, K. A Combustor Assembly with Impingement Plates for Redirecting Cooling Air Flow in Gas Turbine Engines. WO Patent No. 2017190967A1, 9 November 2017. [Google Scholar]
- Zhang, L.Z.; Yin, J.; Moon, H.K. Airfoil for Turbomachine and Airfoil Cooling Method. US Patent No. US 2017/0248022 A1, 19 February 2019. [Google Scholar]
- He, W.; Deng, Q.H.; He, J.; Gao, T.Y.; Feng, Z.P. Effects of Jetting Orifice Geometry Parameters and Channel Reynolds Number on Bended Channel Cooling for a Novel Internal Cooling Structure. In Turbo Expo: Power for Land, Sea, and Air, Proceedings of the ASME Turbo Expo 2019: Turbine Technical Conference and Exposition, Phoenix, AZ, USA, 17–21 June 2019; ASME Paper No. GT2019-90421; ASME: New York, NY, USA, 2019. [Google Scholar]
- He, W.; Deng, Q.H.; Yang, G.Y.; Feng, Z.P. Effects of Turning Angle and Turning Internal Radius on Channel Impingement Cooling for a Novel Internal Cooling Structure. In Turbo Expo: Power for Land, Sea, and Air, Proceedings of the ASME Turbo Expo 2020: Turbine Technical Conference and Exposition, Online, 21–25 September 2020; ASME Paper No. GT2020-16115; ASME: New York, NY, USA, 2020. [Google Scholar]
- Timko, L.P. Energy Efficient Engine High Pressure Turbine Component Test Performance Report; NASA Contractor Report 168289; NASA: Washington, DC, USA, 1984.
- Takeshi, H.; Tomoki, T.; Ryozo, T.; Masanori, R.; Masahide, K. Application of Conjugate Heat Transfer Analysis to Improvement of Cooled Turbine Vane and Blade for Industrial Gas Turbine. In Turbo Expo: Power for Land, Sea, and Air, Proceedings of the ASME Turbo Expo 2018: Turbine Technical Conference and Exposition, Oslo Norway, 11–15 June 2018; ASME Paper No. GT2018-75669; ASME: New York, NY, USA, 2018. [Google Scholar]
- He, L.; Oldfield, M.L.G. Unsteady Conjugate Heat Transfer Modeling. J. Turbomach. 2011, 133, 031022. [Google Scholar] [CrossRef]
- Xing, Y.F.; Spring, S.; Weigand, B. Experimental and Numerical Investigation of Heat Transfer Characteristics of Inline and Staggered Arrays of Impinging Jets. J. Heat Transf. 2010, 132, 53–58. [Google Scholar] [CrossRef]
- Ligrani, P.M.; Hedlund, C.R.; Babinchak, B.T.; Thambu, R.; Moon, H.K.; Glezer, B. Flow Phenomena in Swirl Chambers. Exp. Fluids 1998, 24, 254–264. [Google Scholar] [CrossRef]
- Ling, J.P.C.W.; Ireland, P.T.; Harvey, N.W. Measurement of Heat Transfer Coefficient Distributions and Flow Field in a Model of a Turbine Blade Cooling Passage with Tangential Injection. In Turbo Expo: Power for Land, Sea, and Air, Proceedings of the ASME Turbo Expo 2006: Turbine Technical Conference and Exposition, Barcelona, Spain, 8–11 May 2006; ASME Paper No. GT2006-90352; ASME: New York, NY, USA, 2006. [Google Scholar]
- Dees, J.E.; Bogard, D.G.; Ledezma, G.A.; Laskowski, G.M.; Tolpadi, A.K. Experimental Measurements and Computational Predictions for an Internally Cooled Simulated Turbine Vane with 90 Degree Rib Turbulators. In Turbo Expo: Power for Land, Sea, and Air, Proceedings of the ASME Turbo Expo 2010: Turbine Technical Conference and Exposition, Glasgow, UK, 14–18 June 2010; ASME Paper No. GT2010-23004; ASME: New York, NY, USA, 2010. [Google Scholar]


| Geometry | T [mm] | Dj [mm] | Win/t [-] | P/t [-] | tinner/t [-] | Wch/t [-] | Hch/t [-] | R/t [-] | I/t [-] |
|---|---|---|---|---|---|---|---|---|---|
| IC | 1.2 | 0.8 | - | 2 | - | - | - | - | 1.68 |
| SC | 1.2 | - | 0.5 | 2 | - | - | - | - | - |
| WJ | 1.2 | - | 0.5 | 2 | 1 | 1 | 1 | 0.5 | 0.63 |
| Boundary Conditions | Value |
|---|---|
| Fluid (mainstream and coolant) | Ideal air |
| Solid | DD6 alloy |
| Mainstream inlet total pressure [MPa] | 2.526 |
| Mainstream inlet total temperature [K] | 1780 |
| Mainstream inlet turbulence intensity [%] | 10 |
| Mainstream inlet turbulence length scale [mm] | 7.5 |
| Mainstream outlet static pressure [MPa] | 1.123 |
| Coolant inlet total temperature [K] | 883 |
| Coolant inlet turbulence intensity [%] | 5 |
| Coolant inlet turbulence length scale [mm] | 0.1 |
| Coolant inlet massflow rate (under constant mass condition) [g/s] | 10.4 |
| Coolant inlet total pressure in the relative coordinate system (under constant total pressure condition) [MPa] | 3.0 |
| Jetting Reynolds number (under constant Rej condition) | 20,000 |
| Geometry | [g/s] | Rej | Pt,cin [MPa] | Pcou [MPa] | Φps | Φss | Φle | Nutar | Nuc |
|---|---|---|---|---|---|---|---|---|---|
| IC | 10.40 | 28,000 | 3.32 | 2.88 | 0.43 | 0.33 | 0.37 | 61.12 | 52.92 |
| SC | 10.40 | 20,100 | 3.07 | 2.63 | 0.46 | 0.31 | 0.36 | 70.88 | 50.37 |
| WJ | 10.40 | 19,400 | 1.59 | 1.31 | 0.48 | 0.41 | 0.43 | 63.24 | 62.31 |
| Geometry | [g/s] | Rej | Pt,cin [MPa] | Pcou [MPa] | Φps | Φss | Φle | Nutar | Nuc |
|---|---|---|---|---|---|---|---|---|---|
| IC | 7.51 | 20,000 | 2.54 | 2.26 | 0.39 | 0.3 | 0.33 | 44.67 | 39.12 |
| SC | 10.32 | 20,000 | 3.05 | 2.61 | 0.46 | 0.31 | 0.36 | 70.17 | 50.34 |
| WJ | 10.70 | 20,000 | 1.61 | 1.31 | 0.48 | 0.41 | 0.44 | 64.92 | 64.24 |
| Geometry | [g/s] | Rej | Pt,cin [MPa] | Pcou [MPa] | Φps | Φss | Φle | Nutar | Nuc |
|---|---|---|---|---|---|---|---|---|---|
| IC | 9.26 | 25,000 | 3.00 | 2.62 | 0.42 | 0.32 | 0.35 | 55.68 | 48.11 |
| SC | 10.16 | 19,700 | 3.00 | 2.59 | 0.46 | 0.31 | 0.36 | 69.97 | 48.87 |
| WJ | 27.13 | 51,500 | 3.00 | 1.42 | 0.59 | 0.51 | 0.54 | 175.34 | 145.07 |
Publisher’s Note: MDPI stays neutral with regard to jurisdictional claims in published maps and institutional affiliations. |
© 2022 by the authors. Licensee MDPI, Basel, Switzerland. This article is an open access article distributed under the terms and conditions of the Creative Commons Attribution (CC BY) license (https://creativecommons.org/licenses/by/4.0/).
Share and Cite
Deng, Q.; Wang, H.; He, W.; Feng, Z. Cooling Characteristic of a Wall Jet for Suppressing Crossflow Effect under Conjugate Heat Transfer Condition. Aerospace 2022, 9, 29. https://doi.org/10.3390/aerospace9010029
Deng Q, Wang H, He W, Feng Z. Cooling Characteristic of a Wall Jet for Suppressing Crossflow Effect under Conjugate Heat Transfer Condition. Aerospace. 2022; 9(1):29. https://doi.org/10.3390/aerospace9010029
Chicago/Turabian StyleDeng, Qinghua, Huihui Wang, Wei He, and Zhenping Feng. 2022. "Cooling Characteristic of a Wall Jet for Suppressing Crossflow Effect under Conjugate Heat Transfer Condition" Aerospace 9, no. 1: 29. https://doi.org/10.3390/aerospace9010029