
Numerical Study on Low-Temperature Region as Heat Sink and Its Heat Dissipation Capacity for Hypersonic Vehicle

School of Aeronautic Science and Engineering, Beihang University, Beijing 100191, China
*
Author to whom correspondence should be addressed.
Aerospace 2021, 8(9), 238; https://doi.org/10.3390/aerospace8090238
Submission received: 8 July 2021
/
Revised: 24 August 2021
/
Accepted: 25 August 2021
/
Published: 30 August 2021
(This article belongs to the Special Issue Hypersonics: Emerging Research)
Abstract
:Researches have focused on the thermal protection system (TPS) of hypersonic vehicles under severe aerodynamic heat. According to the second law of thermodynamics, heat transfer needs to consume a heat sink, but the cold energy provided by the airborne heat sink is limited. Therefore, it is necessary to explore new available heat sinks during hypersonic cruise. This paper numerically calculated the wall temperature distribution of hypersonic vehicle X-51A with different Mach numbers, altitudes and angles of attack using ANSYS Fluent 19.0. A dimensionless parameter, relative temperature coefficient rt, was proposed to characterize the relative value of local wall temperature in the whole wall temperature range. The distribution regularity and influencing factors of wall temperature were summarized. The low-temperature region which is less affected by flight conditions was divided as the heat sink and its heat dissipation capacity (Q) and characteristics were studied. The angle of attack has great influence on the temperature distribution. In XY view the rear side of leeward surface is least affected by flight conditions and its rt is less than 0.2, which can be used as a low-temperature region. Taking this region as a heat sink to dissipate heat, it is found that the Q of the new heat sink is 30 kW/m2 at Ma 3, 90 kW/m2 at Ma 4 and 200 kW/m2 at Ma 5. The Q increases greatly with the increase in Mach number, and the convective heat transfer coefficient (h) also increases. At the same Q, the h decreases with the increase in Mach number. The exploration of low-temperature region as heat sink has an important reference for reducing the dependence on consumable heat sink and alleviating the energy shortage of the hypersonic vehicle.
1. Introduction
Hypersonic vehicles are an important development direction in the field of aerospace in the world, which has the obvious advantages of wider battlefield combat space, stronger combat penetration capability and higher precision strike efficiency [1]. When the aircraft cruises in the atmosphere at hypersonic speed, its aerodynamic environment is very complicated. Shock wave, vortex, interaction and interference between viscous layer and shear layer exist in the flow field, which would produce strong aerodynamic heating [2]. Therefore, the thermal protection system is one of the key components of a hypersonic vehicle, which can be divided into three categories [3]: passive thermal protection system, active thermal protection system and semi-passive thermal protection system.
Passive thermal protection refers to the use of heat-resistant materials and thermal insulation materials to achieve structural cooling and insulation, which is suitable for relatively short heating time and moderate heat flux. The main structure of X-51A and X-43A aircrafts adopts the passive thermal protection structure of ceramic tile [4]. The X-43A hypersonic aircraft adopts a thermal protection structure of silicon carbide ceramic composite cover plate and light flexible thermal insulation layer in the high-temperature area of windward area [5,6]. NASA Space Shuttle engineering discussed the application of advanced metallic panel, ceramic blanket, and ceramic tile thermal protection systems under the heat loads of the Access to Space (ATS) vehicle and a proposed Reusable Launch Vehicle (RLV). The research shows that an advanced metal system with high-temperature alloy and high-efficiency multilayer insulation material is expected to be much lighter than the ceramic insulation system [7].
Semi-passive heat protection is suitable for long time periods and high heat flux. For example, heat-pipe-cooled TPS can absorb aerodynamic heat in a high-temperature area and transfer it to a low-temperature area in a short time, which is often used in key positions such as leading edge of aircraft. Kasen et al. [8] experimentally investigated the feasibility of metallic leading-edge heat pipe concepts for thermal management in an efficient load supporting structure. The study indicates that the surface temperature reductions in heat pipe-based leading edges may be enough to permit the use of non-ablative, refractory metal leading edges with oxidation protection in hypersonic environments. Steeves et al. [9] proposed integrating a planar heat pipe into the structure of the leading edge; the heat can be conducted to large flat surfaces from which it can be radiated out to the environment, significantly reducing the temperatures at the leading edge and making metals feasible materials. The results indicate that the niobium alloy Cb-752, with lithium as the working fluid, is a feasible combination for Mach 6–8 flight with a 3 mm leading edge radius. Gene et al. [10] used a verified heat pipe cooling model to analyze the thermal protection scheme combining evaporation and film cooling. The study indicates that these cooling techniques limited the maximum leading-edge surface temperatures, moderated the structural temperature gradients, and led to the conclusion that cooling leading-edge structures exposed to severe hypersonic flight environments using a combination of liquid metal heat pipe, surface transpiration, and film cooling methods appeared feasible.
Active cooling is suitable for structures subjected to aerodynamic heating with long time periods and higher heat flux, and convection heat transfer is usually used for cooling. Liu et al. [11] designed a transpiration active cooling metallic TPS and tested the cooling capacity and efficiency of the system. The results show that the recommended transpiration active cooling metallic thermal protection method really played a role in reducing the structure temperature. For the principle sample, transpiration active cooling reduced the internal structure temperature by 50 °C, and the overall structure improved the heat load dissipation capacity by more than 70%. Maruyama et al. [12] investigated an active thermal insulation system for protecting a structure from intense incident radiation flux and study transient heat transfer by combined conduction, convection, and radiation in a layer of a semitransparent porous medium. Rakow et al. [13,14] studied and improved the sandwich panels with metal foam cores used in actively cooled thermal protection systems, which takes metal foam as core and metal foam pores as cooling channels. The response of the structure under the boundary condition of thermal-mechanical coupling was studied experimentally.
The thermal protection system utilizes the working medium to absorb heat, convert heat and power, and dissipate the aerodynamic heat. According to the second law of thermodynamics, it is impossible for heat to transfer spontaneously and without paying any price [15]. It needs to consume low-temperature heat sinks and produce irreversible losses in the process of heat exchange.
There are two traditional heat sinks: ram air and airborne fuel. With the increase in Mach number, the inlet temperature of ram air increases greatly, so ram air can no longer be used as a heat sink, and its pre-cooling problem is also a key issue in the development of supersonic/hypersonic vehicles. However, due to the limitation of quality and safe temperature, the cooling capacity provided by airborne fuel is also very limited [16,17,18], which is difficult to meet the heat dissipation requirements of high-speed aircraft.
When the aircraft is flying at high speed, a shock wave is generated at the nose cone, and a large area of the fuselage is in the expansion range of the head shock wave. Usually, the wall temperature of windward areas such as aircraft head and wing front is relatively high, and there is a certain temperature difference between it and fuselage [19,20,21].Therefore, by exploring cold source on a large-area low-temperature region, the dependence on consumable airborne heat sinks during flight can be reduced, and the problem of energy shortage of high-speed aircraft can be alleviated.
In this study, the hypersonic vehicle X-51A is taken as the research model, and Ansys Fluent 19.0 is used to calculate the temperature distribution of aircraft with different Mach numbers, altitudes and angles of attack. According to the temperature distribution under different working conditions, the low-temperature region and high-temperature region are divided. A dimensionless parameter, surface relative temperature coefficient rt, is proposed to characterize the local temperature difference. The distribution regularity and influencing factors of wall temperature are summarized. The heat dissipation capacity and characteristics of a low-temperature region as the heat sink which is less affected by flight conditions are studied and analyzed.
2. Physical Model and Numerical Method
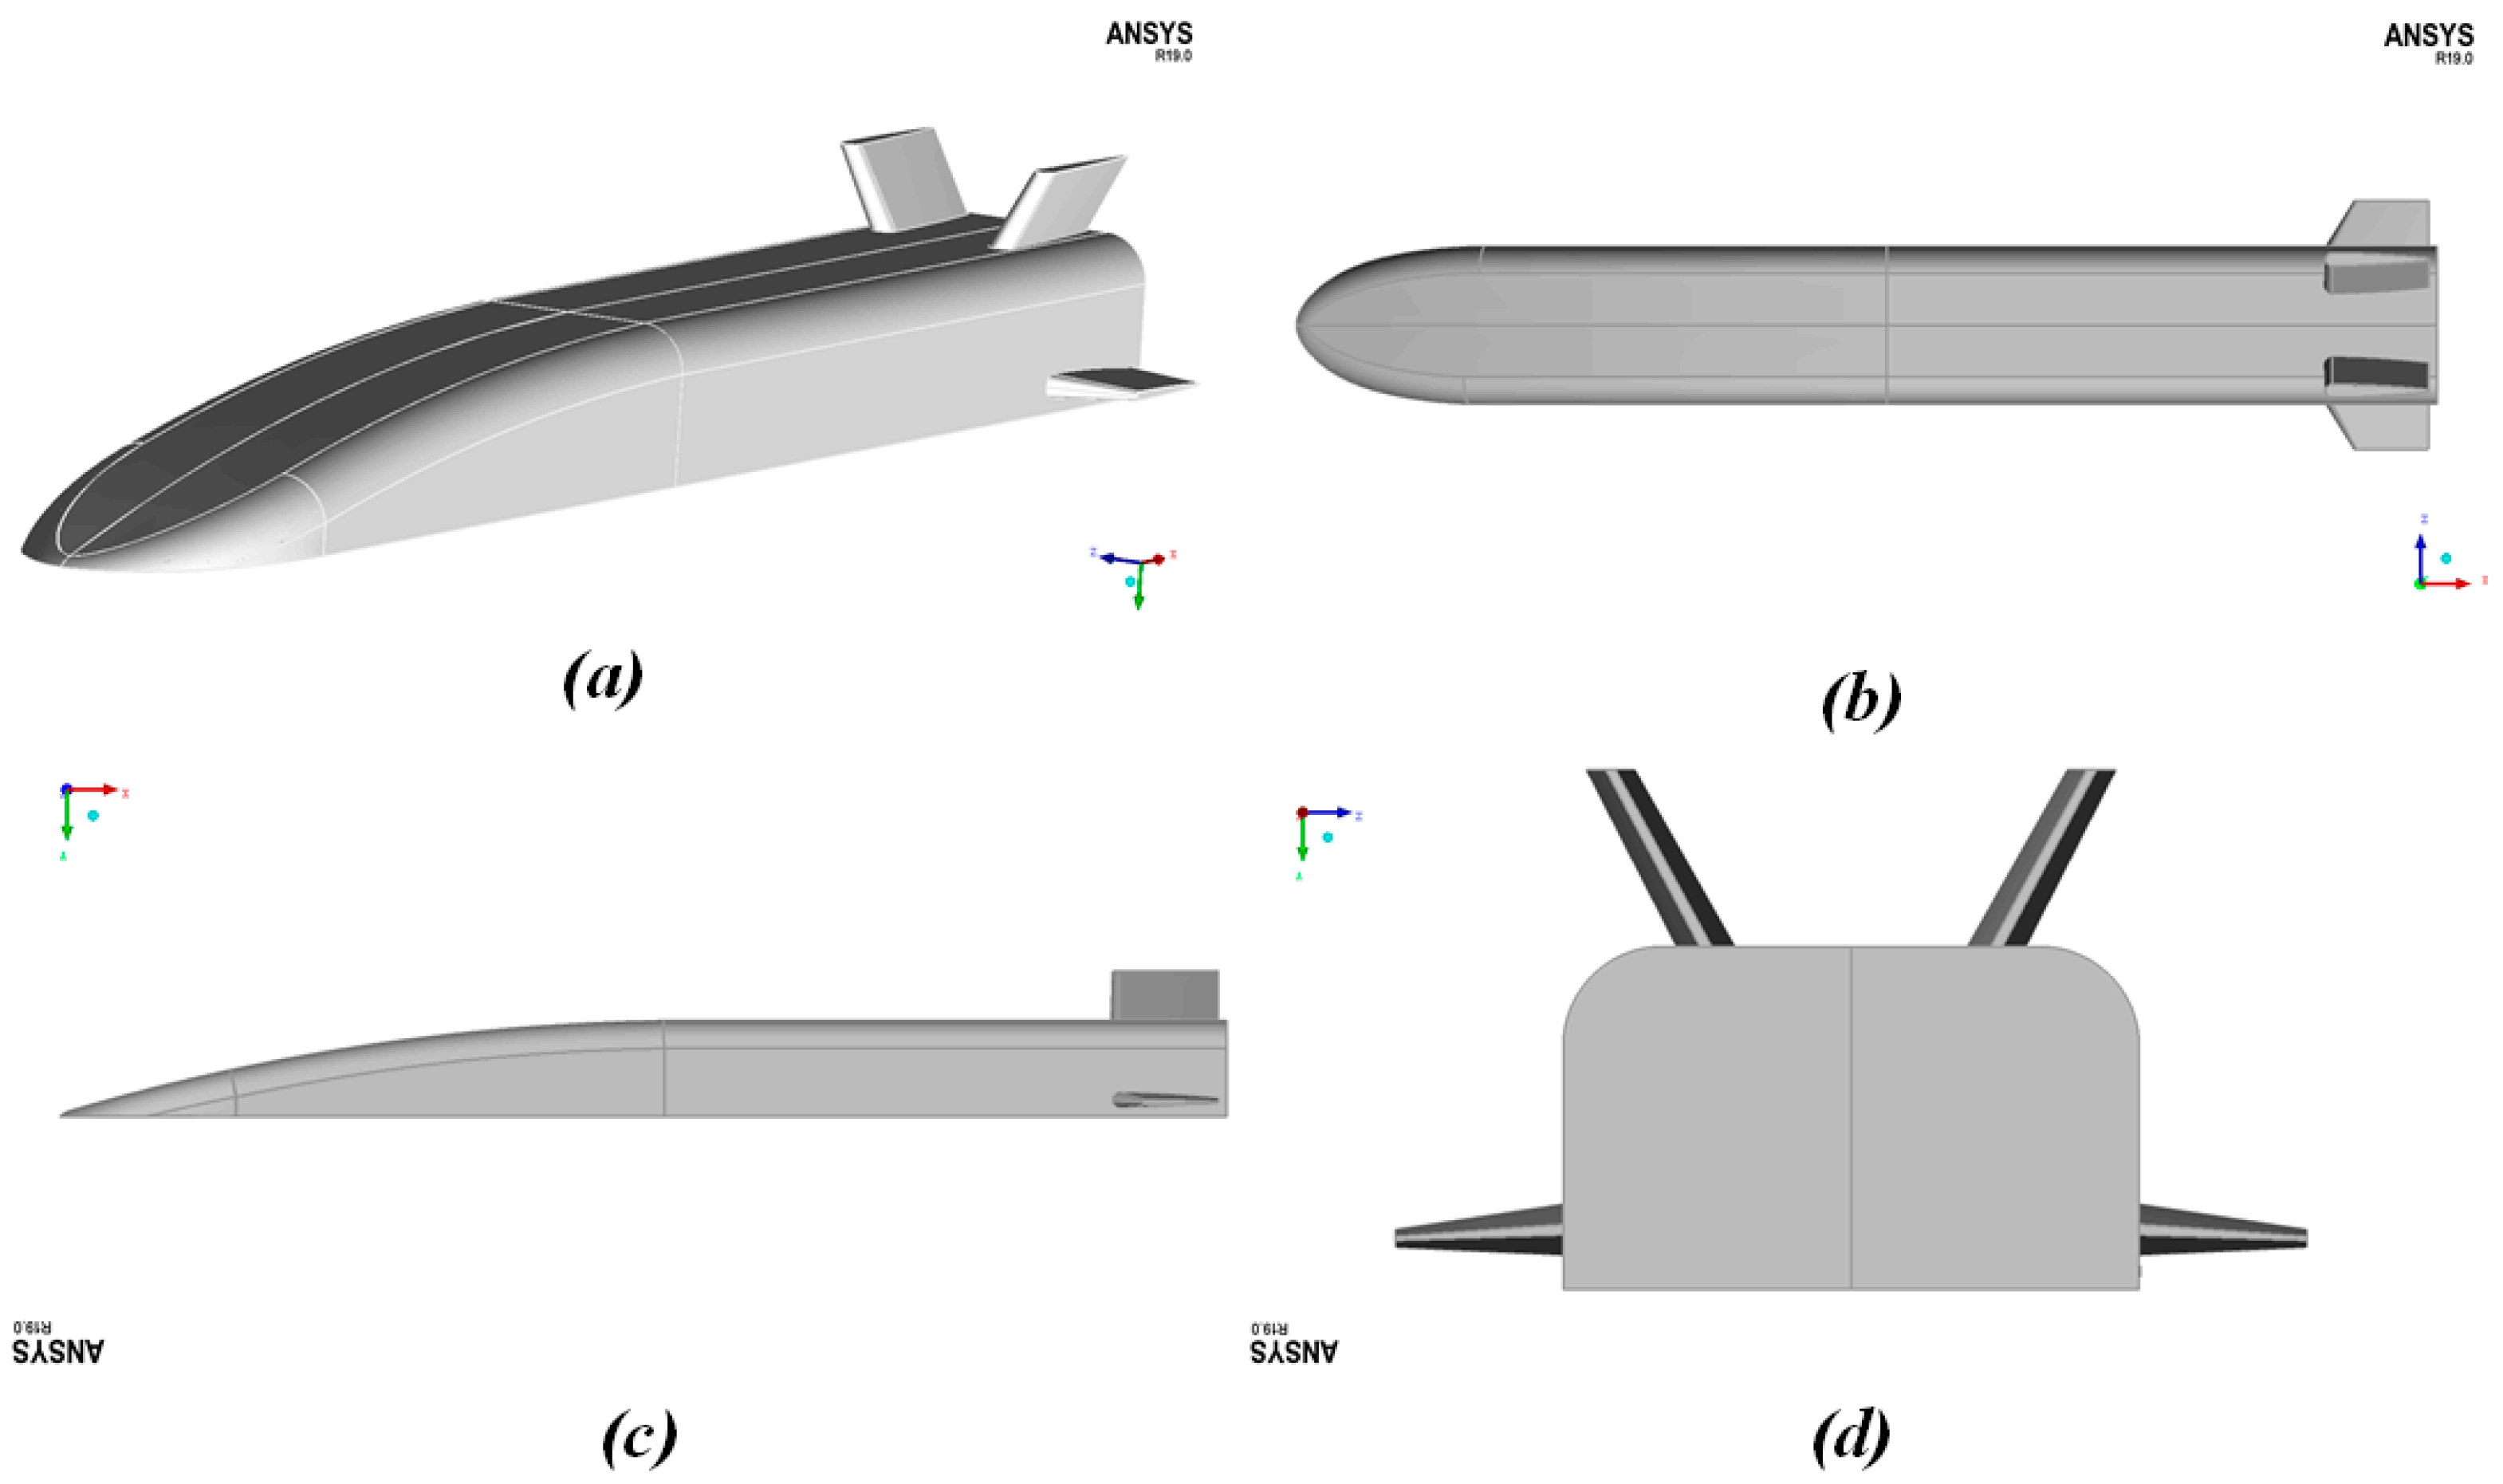
The hypersonic vehicle selected in this study is the X-51A cruise body, which adopts a wedge-shaped head, lifting body fuselage and rear control surface design [22]. The model is shown in Figure 1. In order to simplify the model calculation, the following assumptions were made: (1) the solid structure of the aircraft is the same homogeneous medium; (2) The shape of the aircraft does not change in flight. The flight conditions in this paper are shown in Table 1.
The aircraft and its flow field are taken as the computational domain, and the boundary conditions include pressure-far field, pressure-outlet, wall and symmetry. The computational domain is divided into unstructured grids by ICEM CFD 19.1. Numerical calculation of hypersonic aerodynamic heating requires a high quality of grid near the wall. The first layer grid height of the near wall in the normal direction (Δnw) is an important factor affecting the numerical calculation of hypersonic aerodynamics. In this study, the wall cell Reynolds number method based on the free flow conditions is used to calculate the Δnw [23,24]. In addition, the growth rate of the boundary layer grid near the wall is controlled to be 1.05 to 1.1, which makes the boundary layer grid grow evenly to meet the calculation requirements of turbulence model for near-wall grid.
When the boundary condition is pressure-far field, the ideal gas model should be used to calculate the incoming air. The numerical calculation method adopted in this paper is based on the finite volume method, the solver is the coupled density-based algorithm, the turbulence model is the Spalart–Allmaras model, the discrete scheme is the second-order upwind Roe-FDS scheme, and the gradient interpolation method is the Green-Gaussian node-based method. The implicit time advance method is adopted. The stability and convergence of the numerical calculation can be ensured by adjusting the Courant number. The numerical method is very suitable for the calculation of supersonic viscous flow with high grid density near the wall and shock wave [25]. In order to ensure the calculation accuracy, the residual convergence standard of conservation equation is .
3. Verification of Numerical Method and Grid Independence
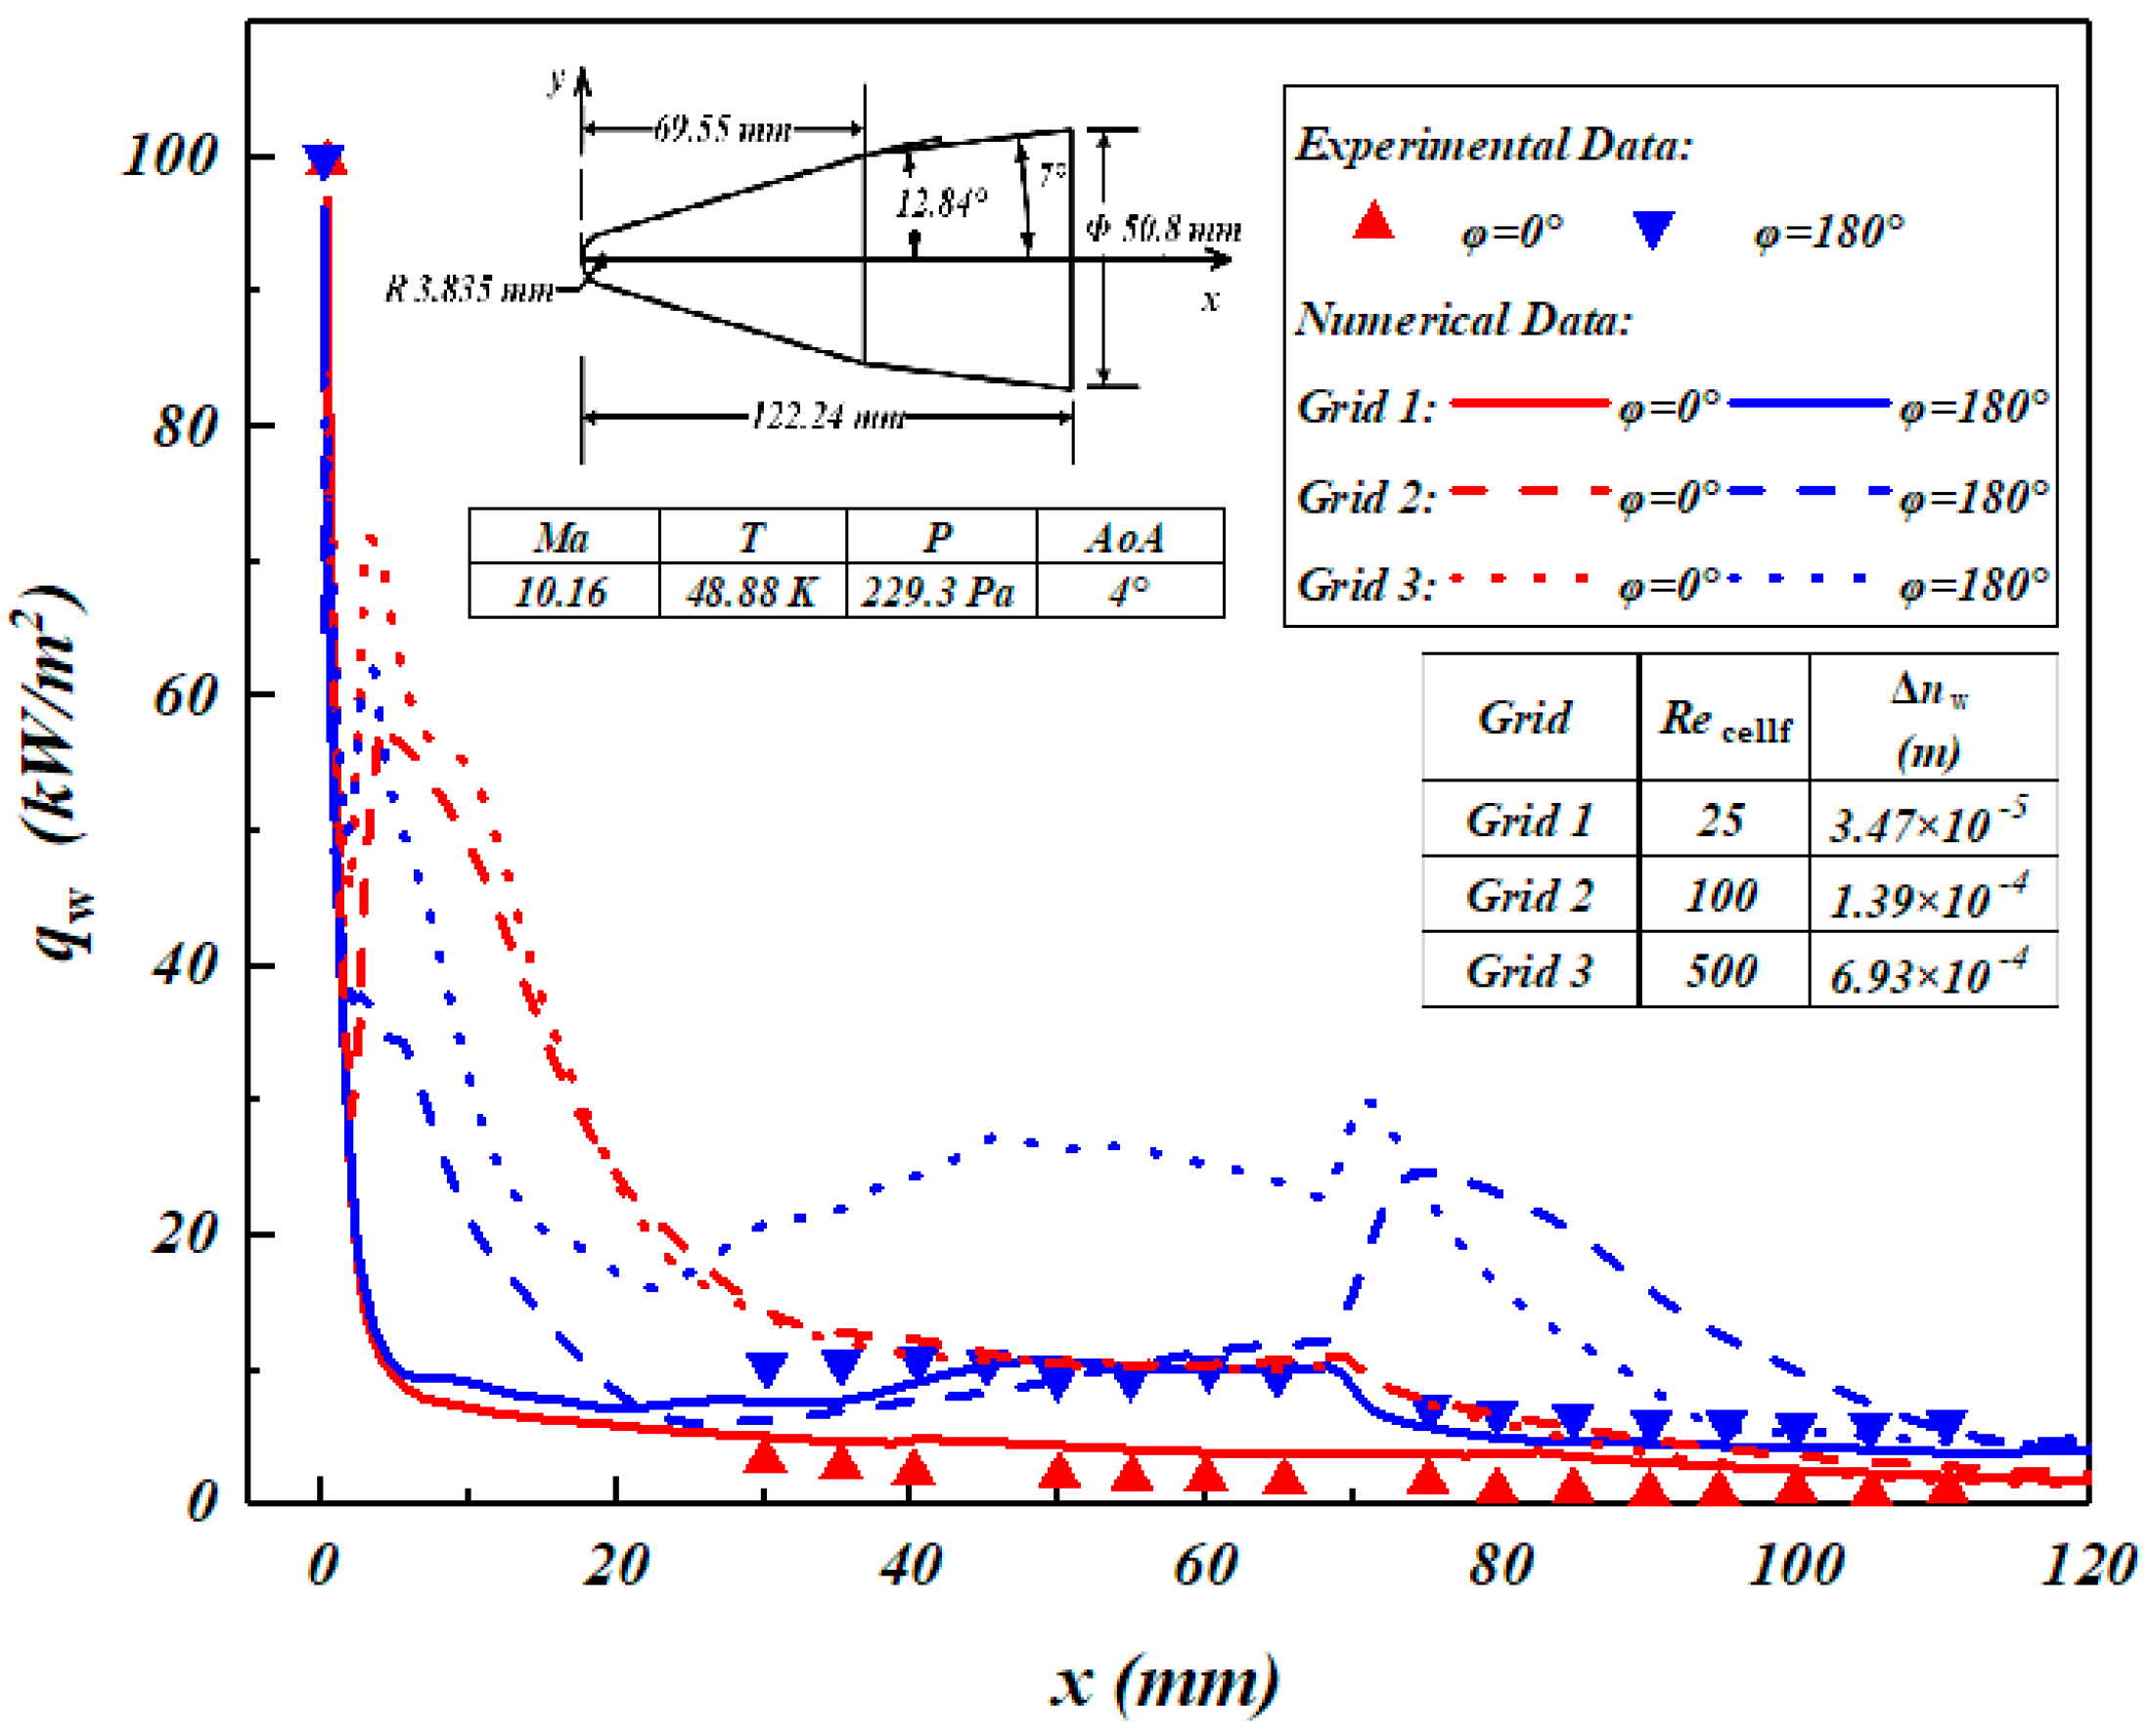
This paper uses the typical blunt-headed double cone in the NASA-2334 Report [26] as the verification model, and the shape parameters are shown in Figure 2. The incoming flow conditions of the verification example are shown in Figure 2. The pressure is 229.3 Pa, the temperature is 48.88 K, the speed is 1429 m/s, the Mach number is 10.16, the aircraft wall temperature is 300 K, and the angle of attack is 4°. The heat flux distribution along the flow direction at the central axis of the windward surface (φ = 180°) and the leeward surface (φ = 0°) is obtained. The numerical data are compared with the experimental data in Ref. [26]. When the cell Reynolds number is smaller, that is, the first layer grid height of the near wall in the normal direction is smaller, the numerical data are in good agreement with the experimental data (as shown in Figure 2).
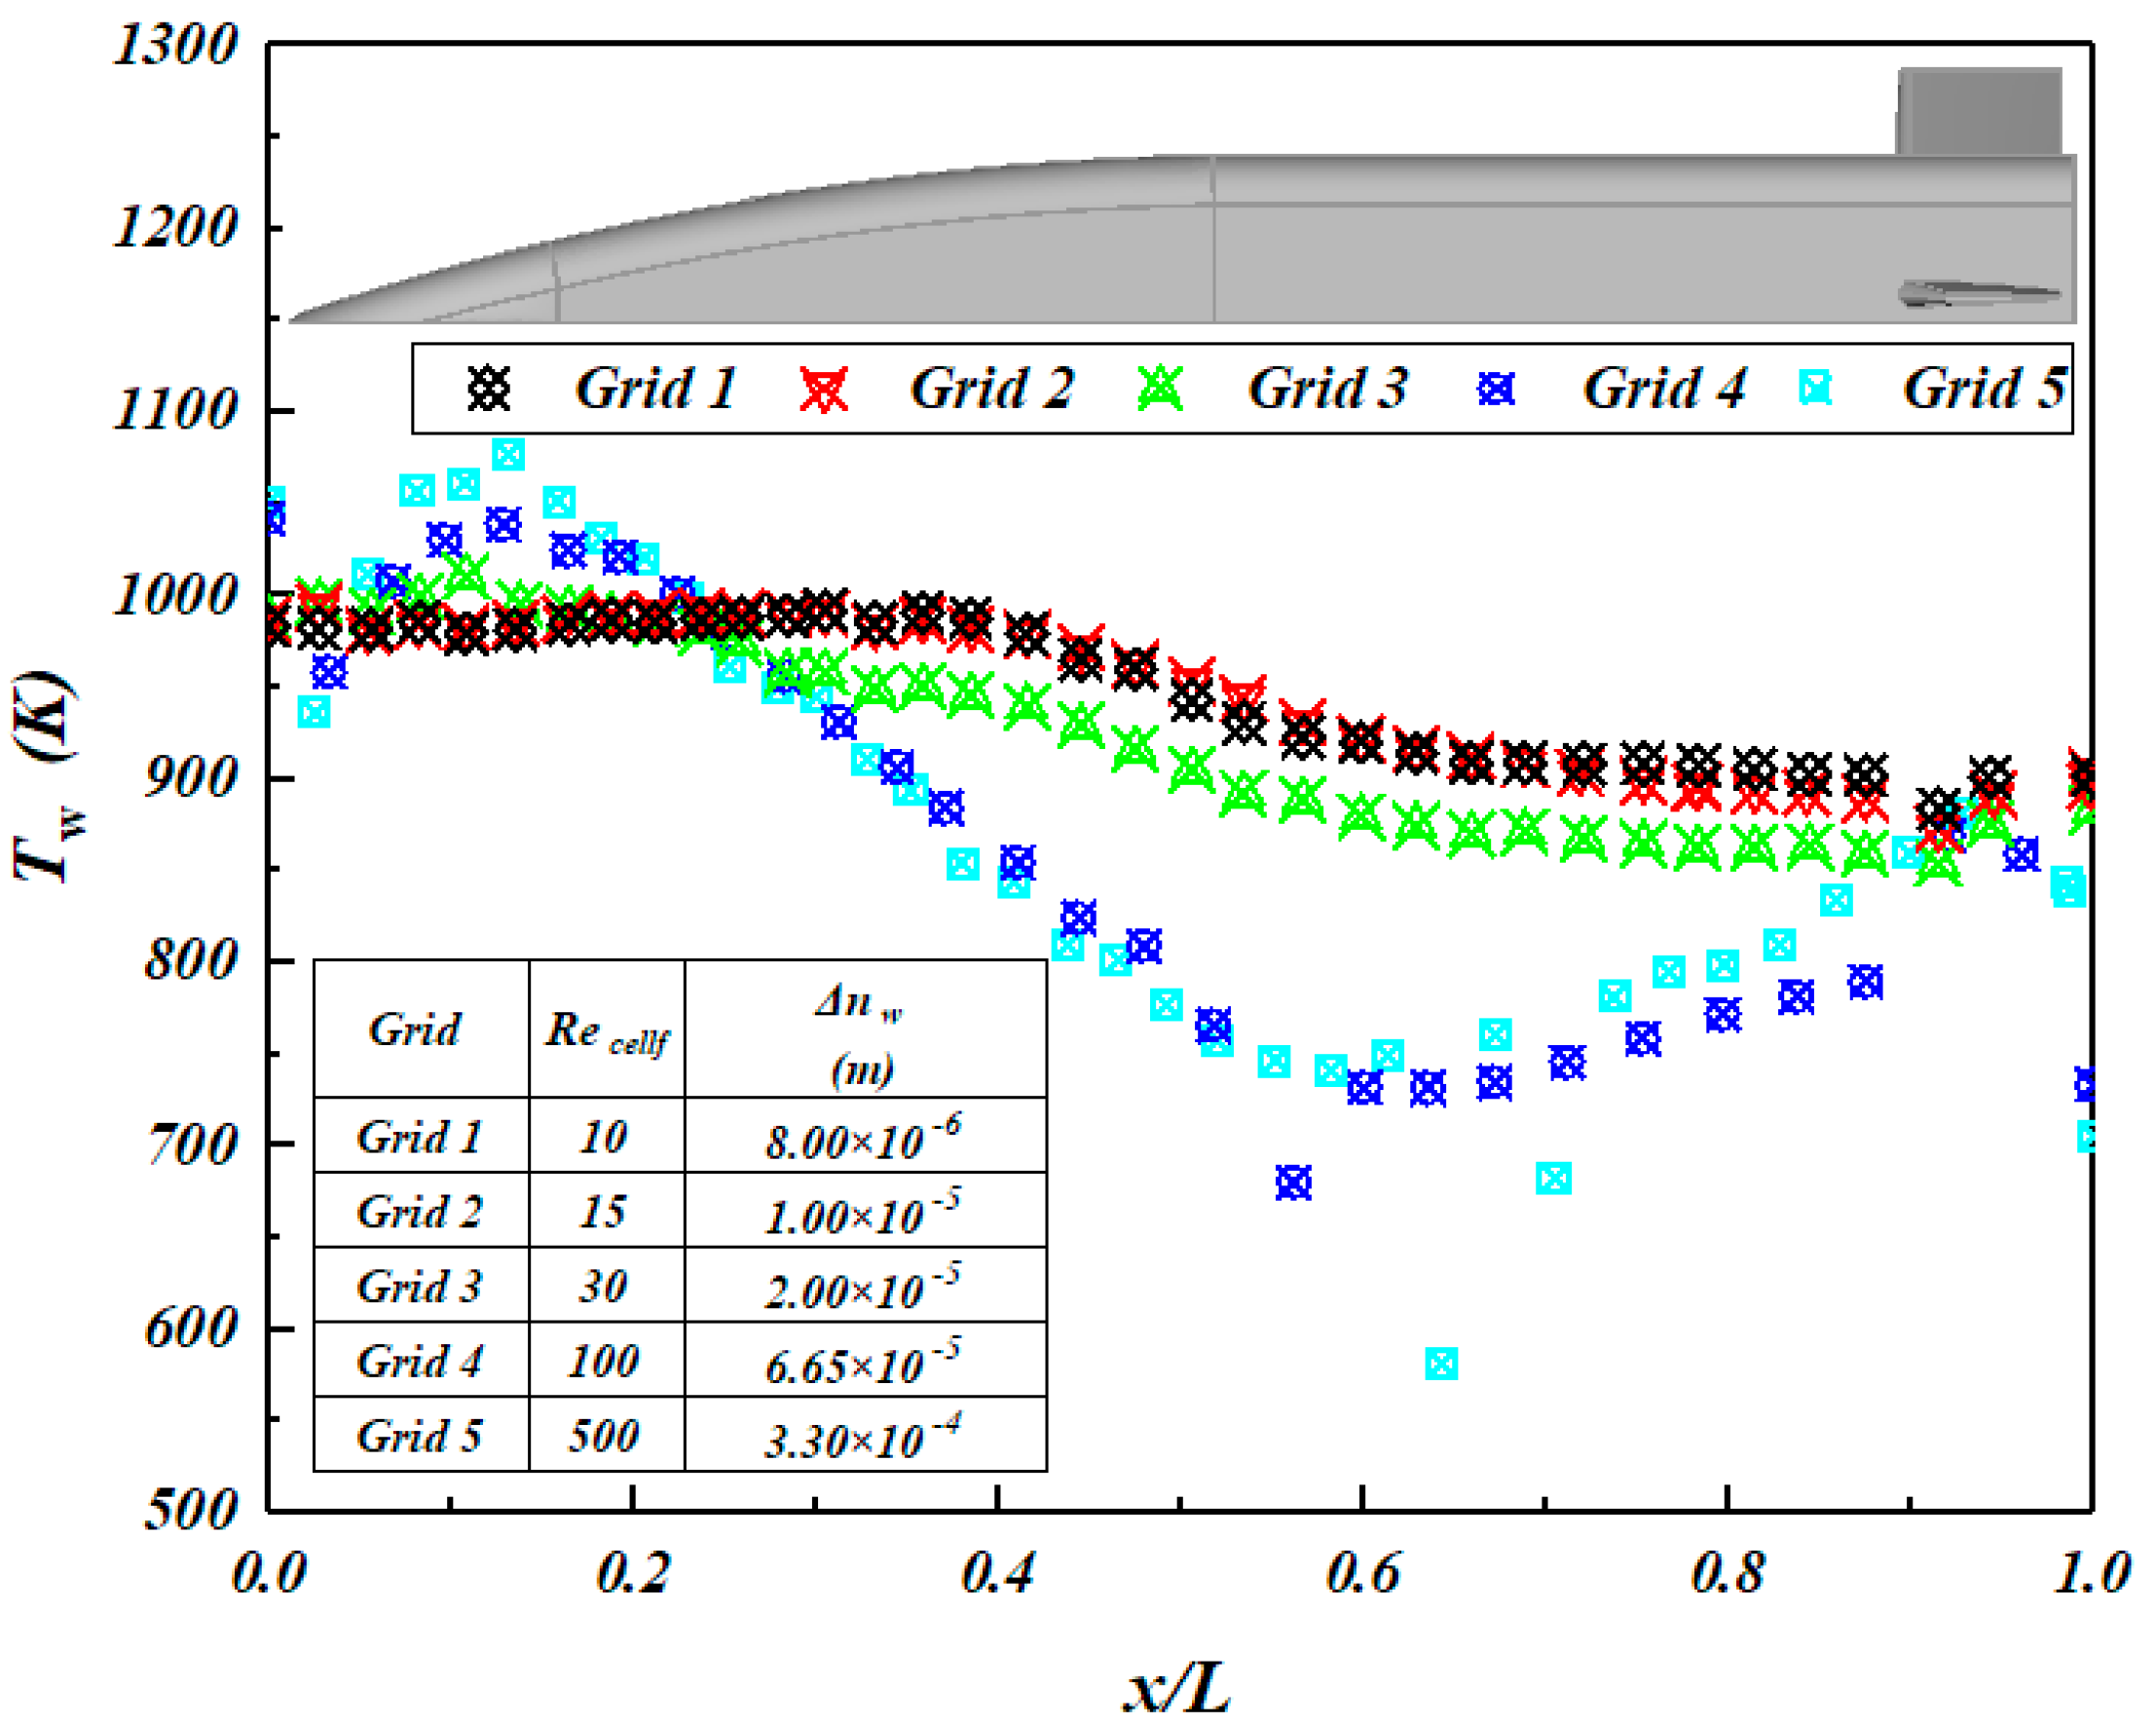
The grid of the X-51A model is divided by the above method. By comparing the numerical results of different height of the first layer in the normal direction (as shown in Figure 3), the greater the cell Reynolds number, the worse the convergence of the calculation. When the cell Reynolds number is less than 30, the convergence of calculation can be guaranteed.
4. Results and Analyses
4.1. Distribution of Wall Temperature
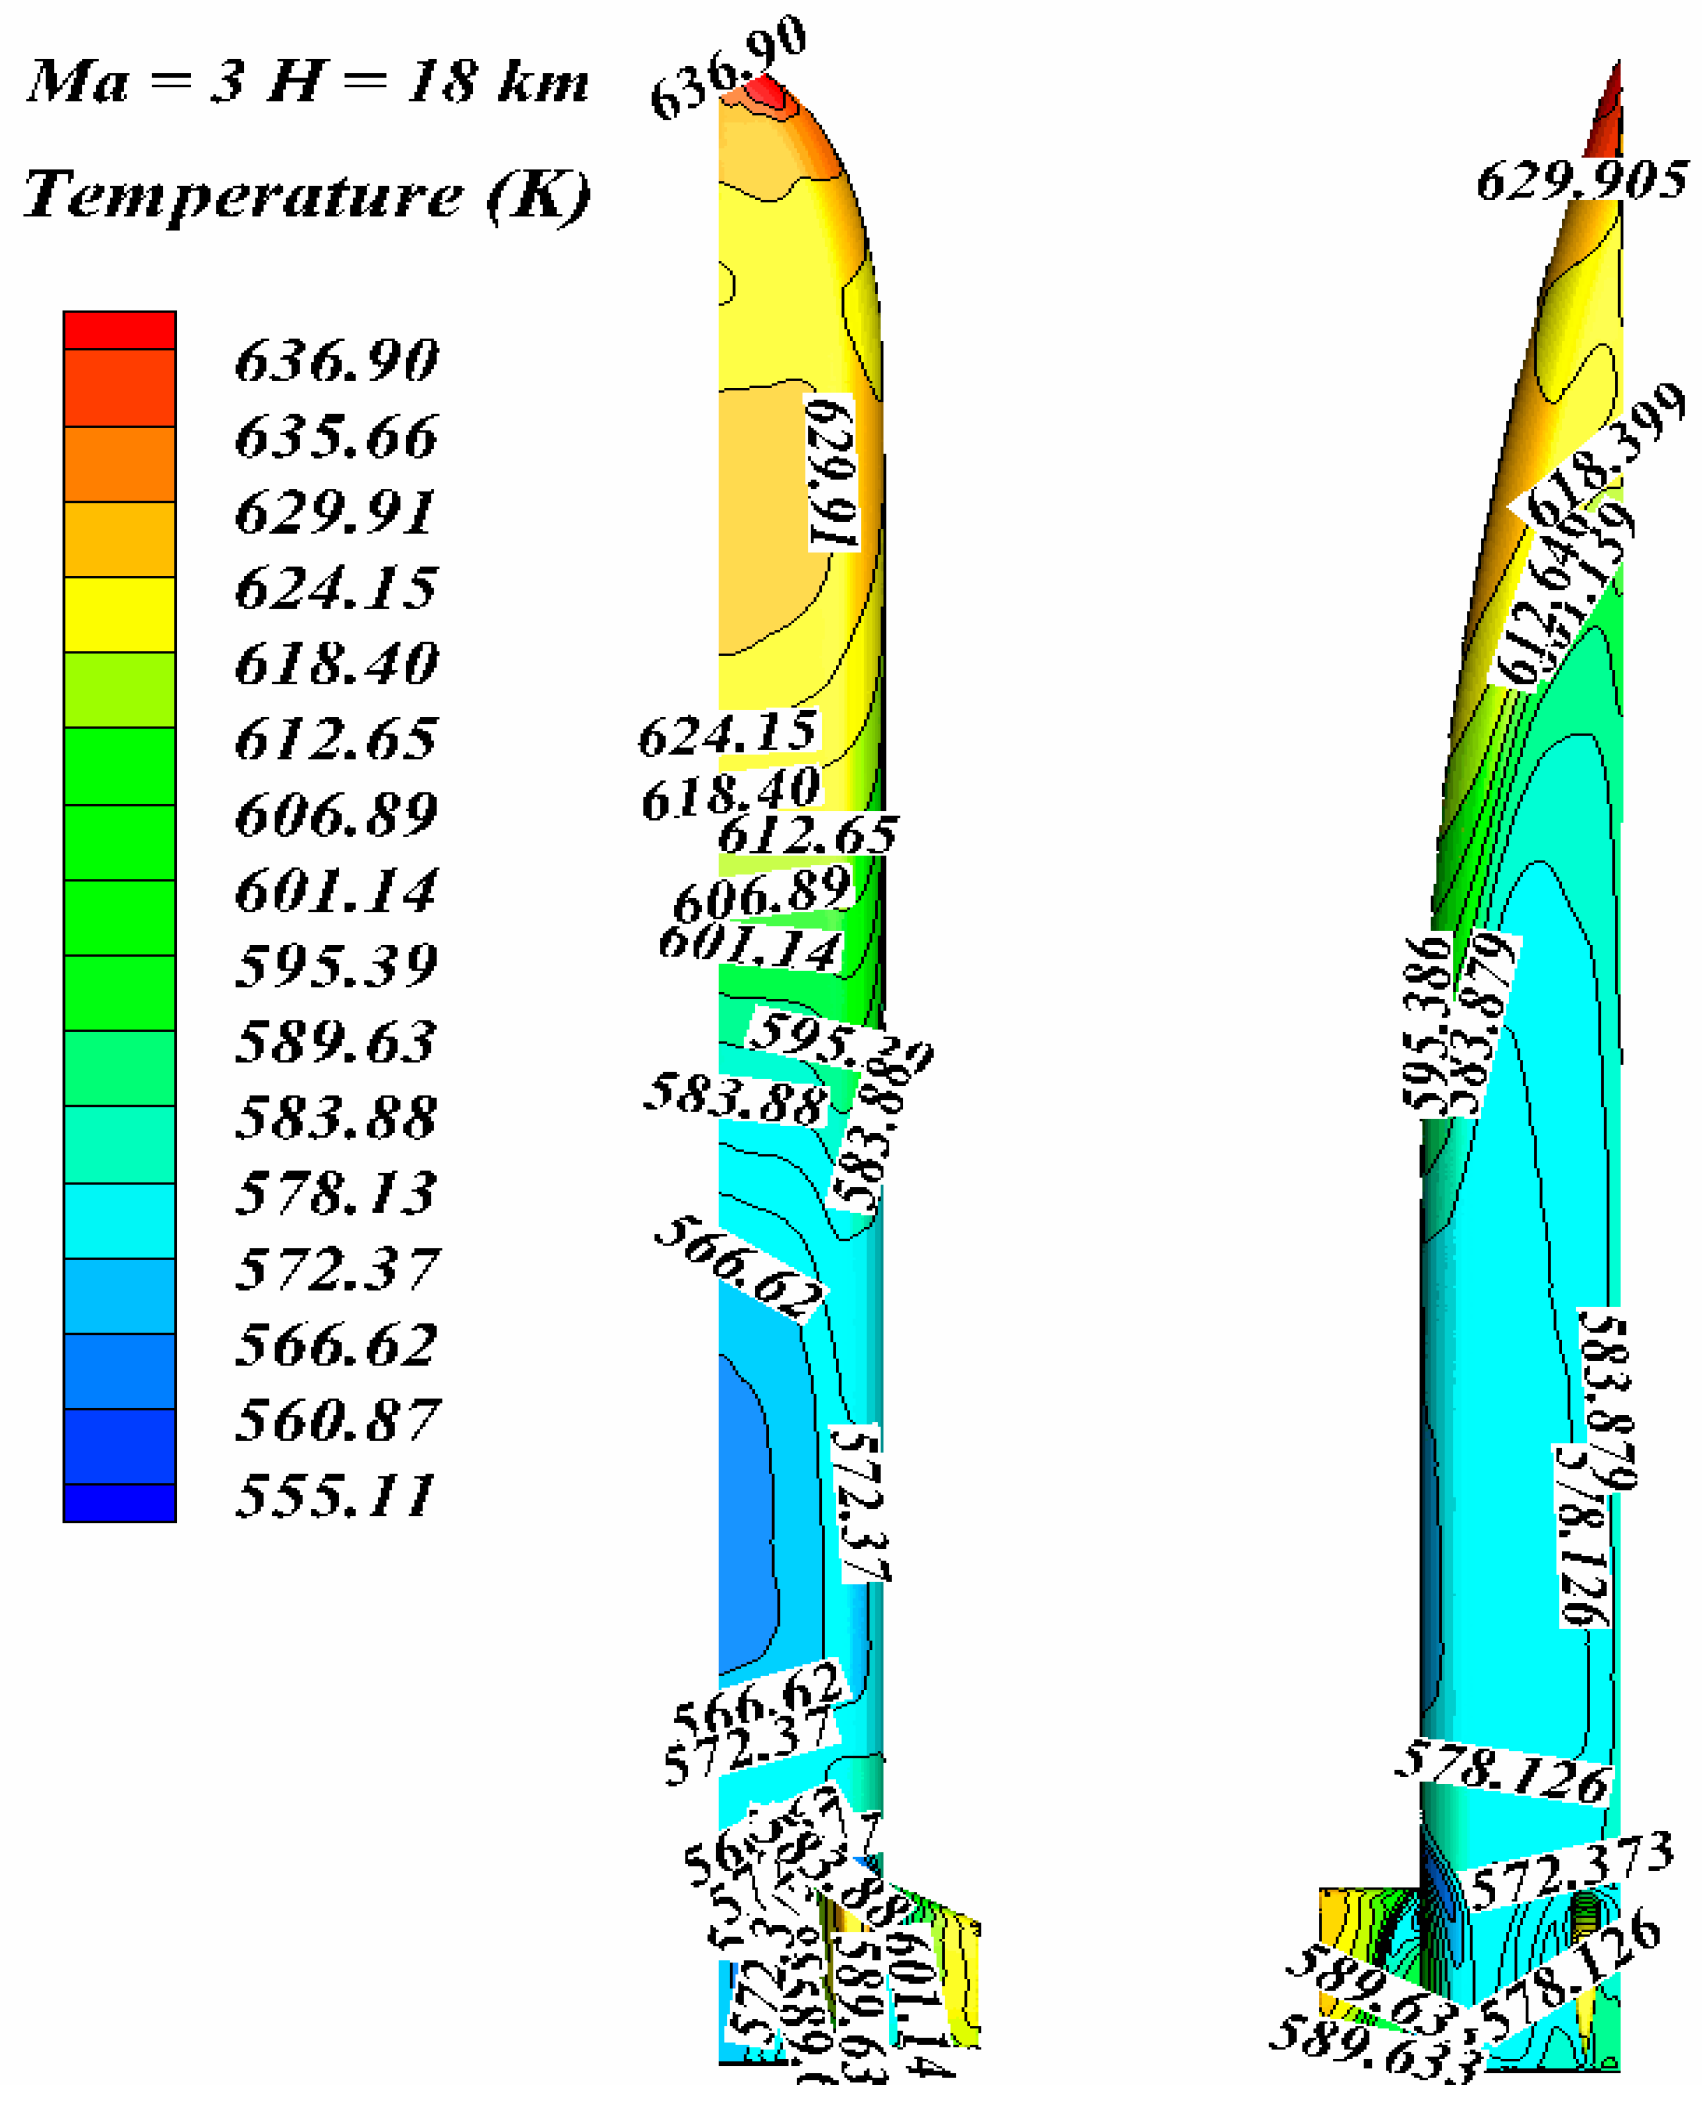
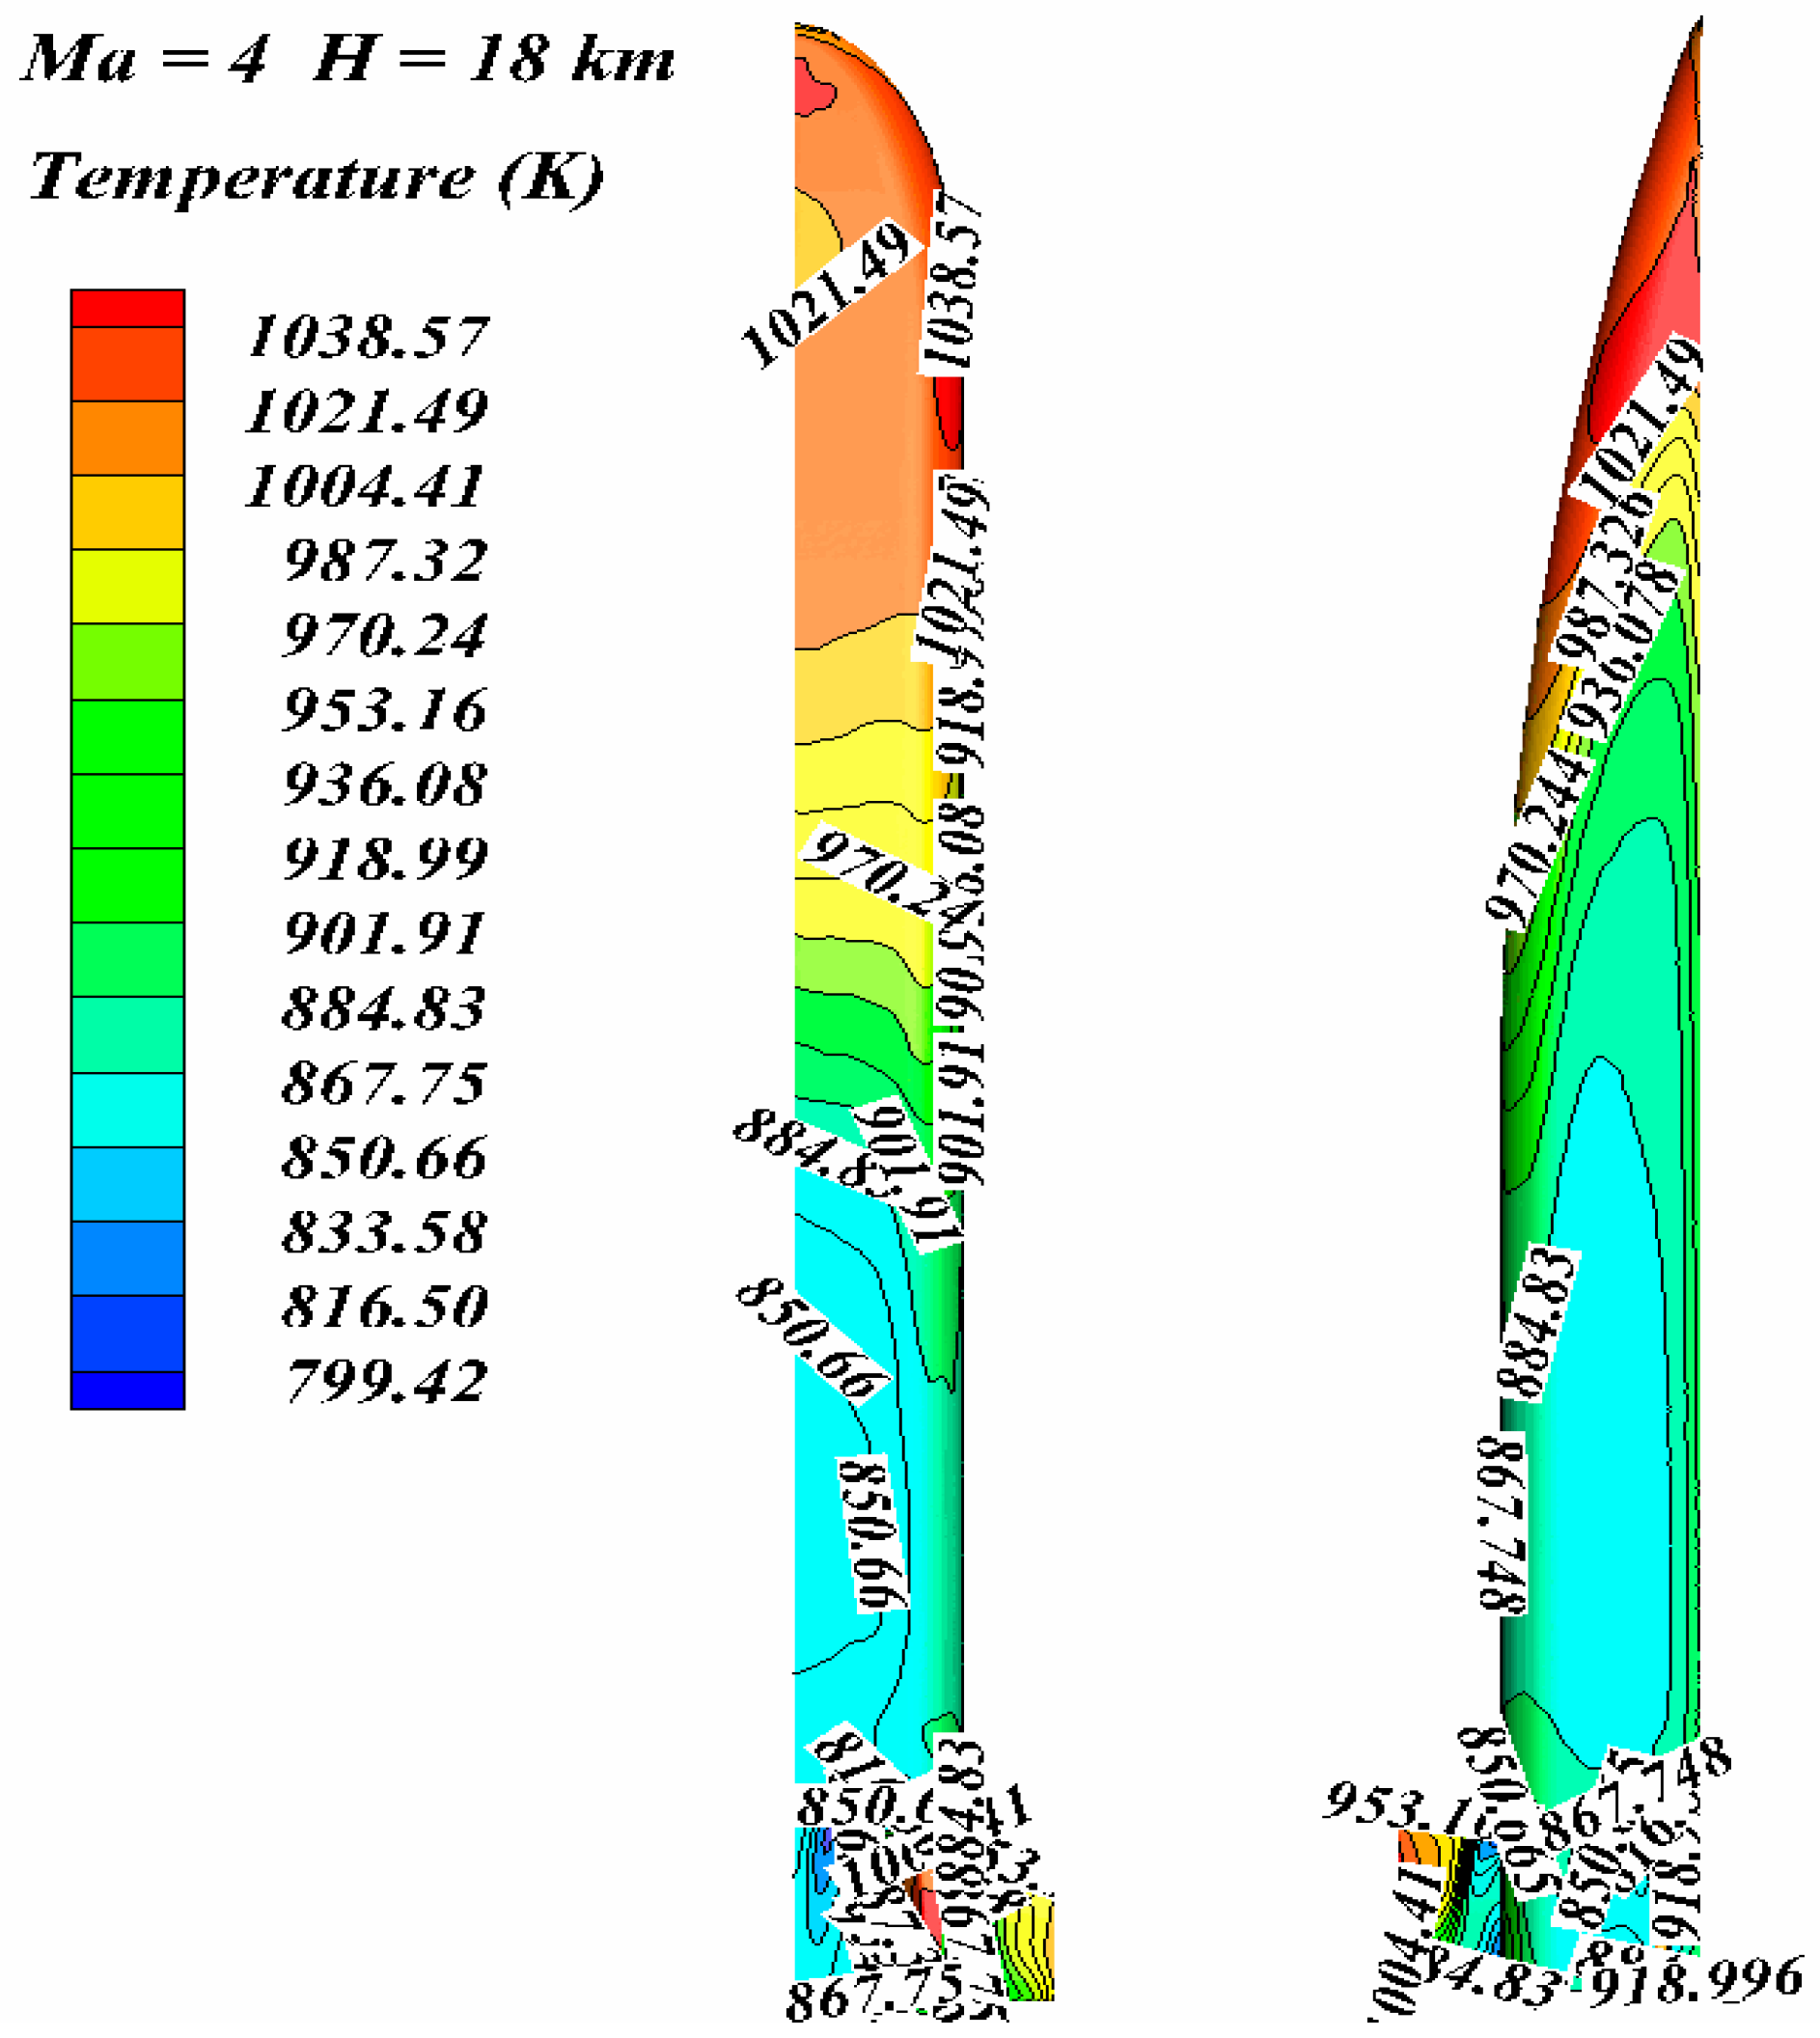
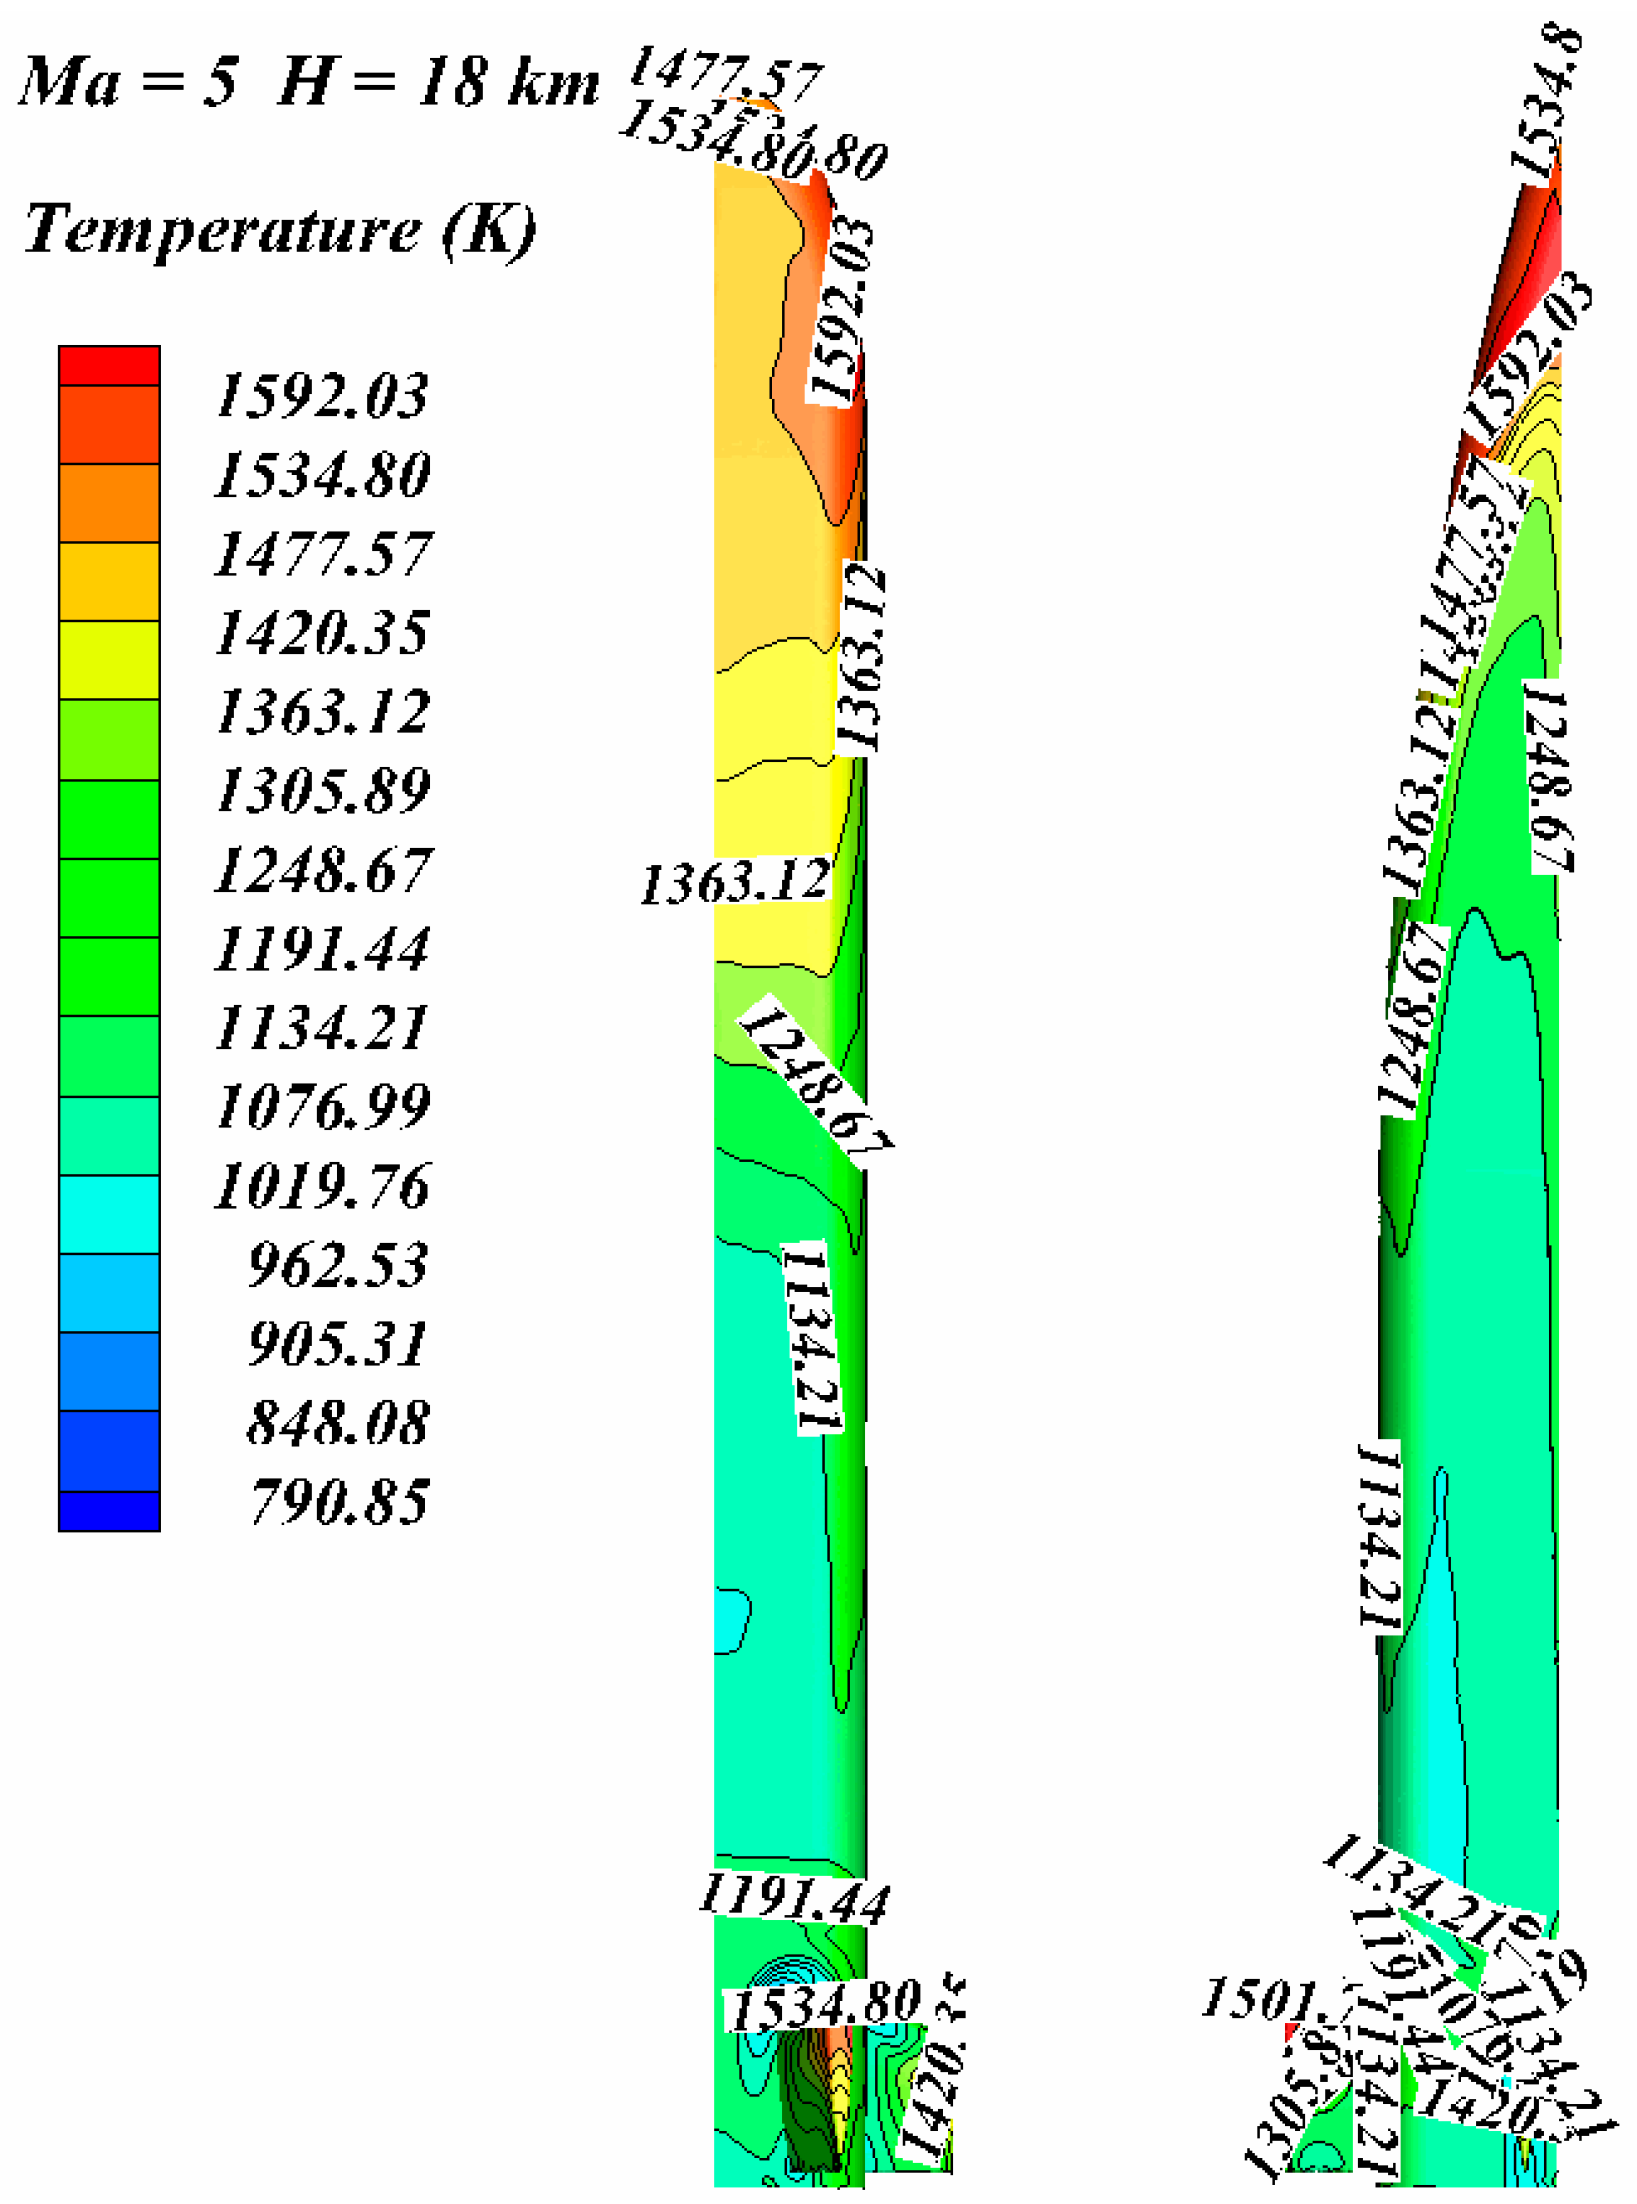
Figure 4, Figure 5 and Figure 6, respectively, show the isotherm distribution on the leeward side of aircraft at Mach 3–5. The aircraft is a wedge-shaped structure, and a shock wave is formed at the nose cone. The head of the aircraft is heated most seriously by aerodynamic heating, and its temperature is the highest temperature of the whole aircraft, while the fuselage temperature is decreasing along the air flow direction.
At Mach 3, the temperature of nose cone is 630 K, and the temperature of fuselage is about 570 K; at Mach 4, the temperature of the nose cone is 1038 K, and the temperature of the fuselage is about 850 K; at Mach 5, the temperature of the nose cone is 1590 K, and the temperature of the fuselage is about 1000 K. When the aircraft is cruising at high speed, its wedge structure makes the nose cone form a shock wave, which is most seriously heated by aerodynamics and the temperature is also the highest temperature of the whole aircraft. While the fuselage is in the shock-wave expansion zone, the fuselage temperature is lower than the head temperature and gradually decreases along the air flow direction. It can be seen from the figures that the red high-temperature region occupies a small area of the fuselage, mainly concentrated in the nose cone, while the blue relative lower temperature region occupies a large area of the fuselage.
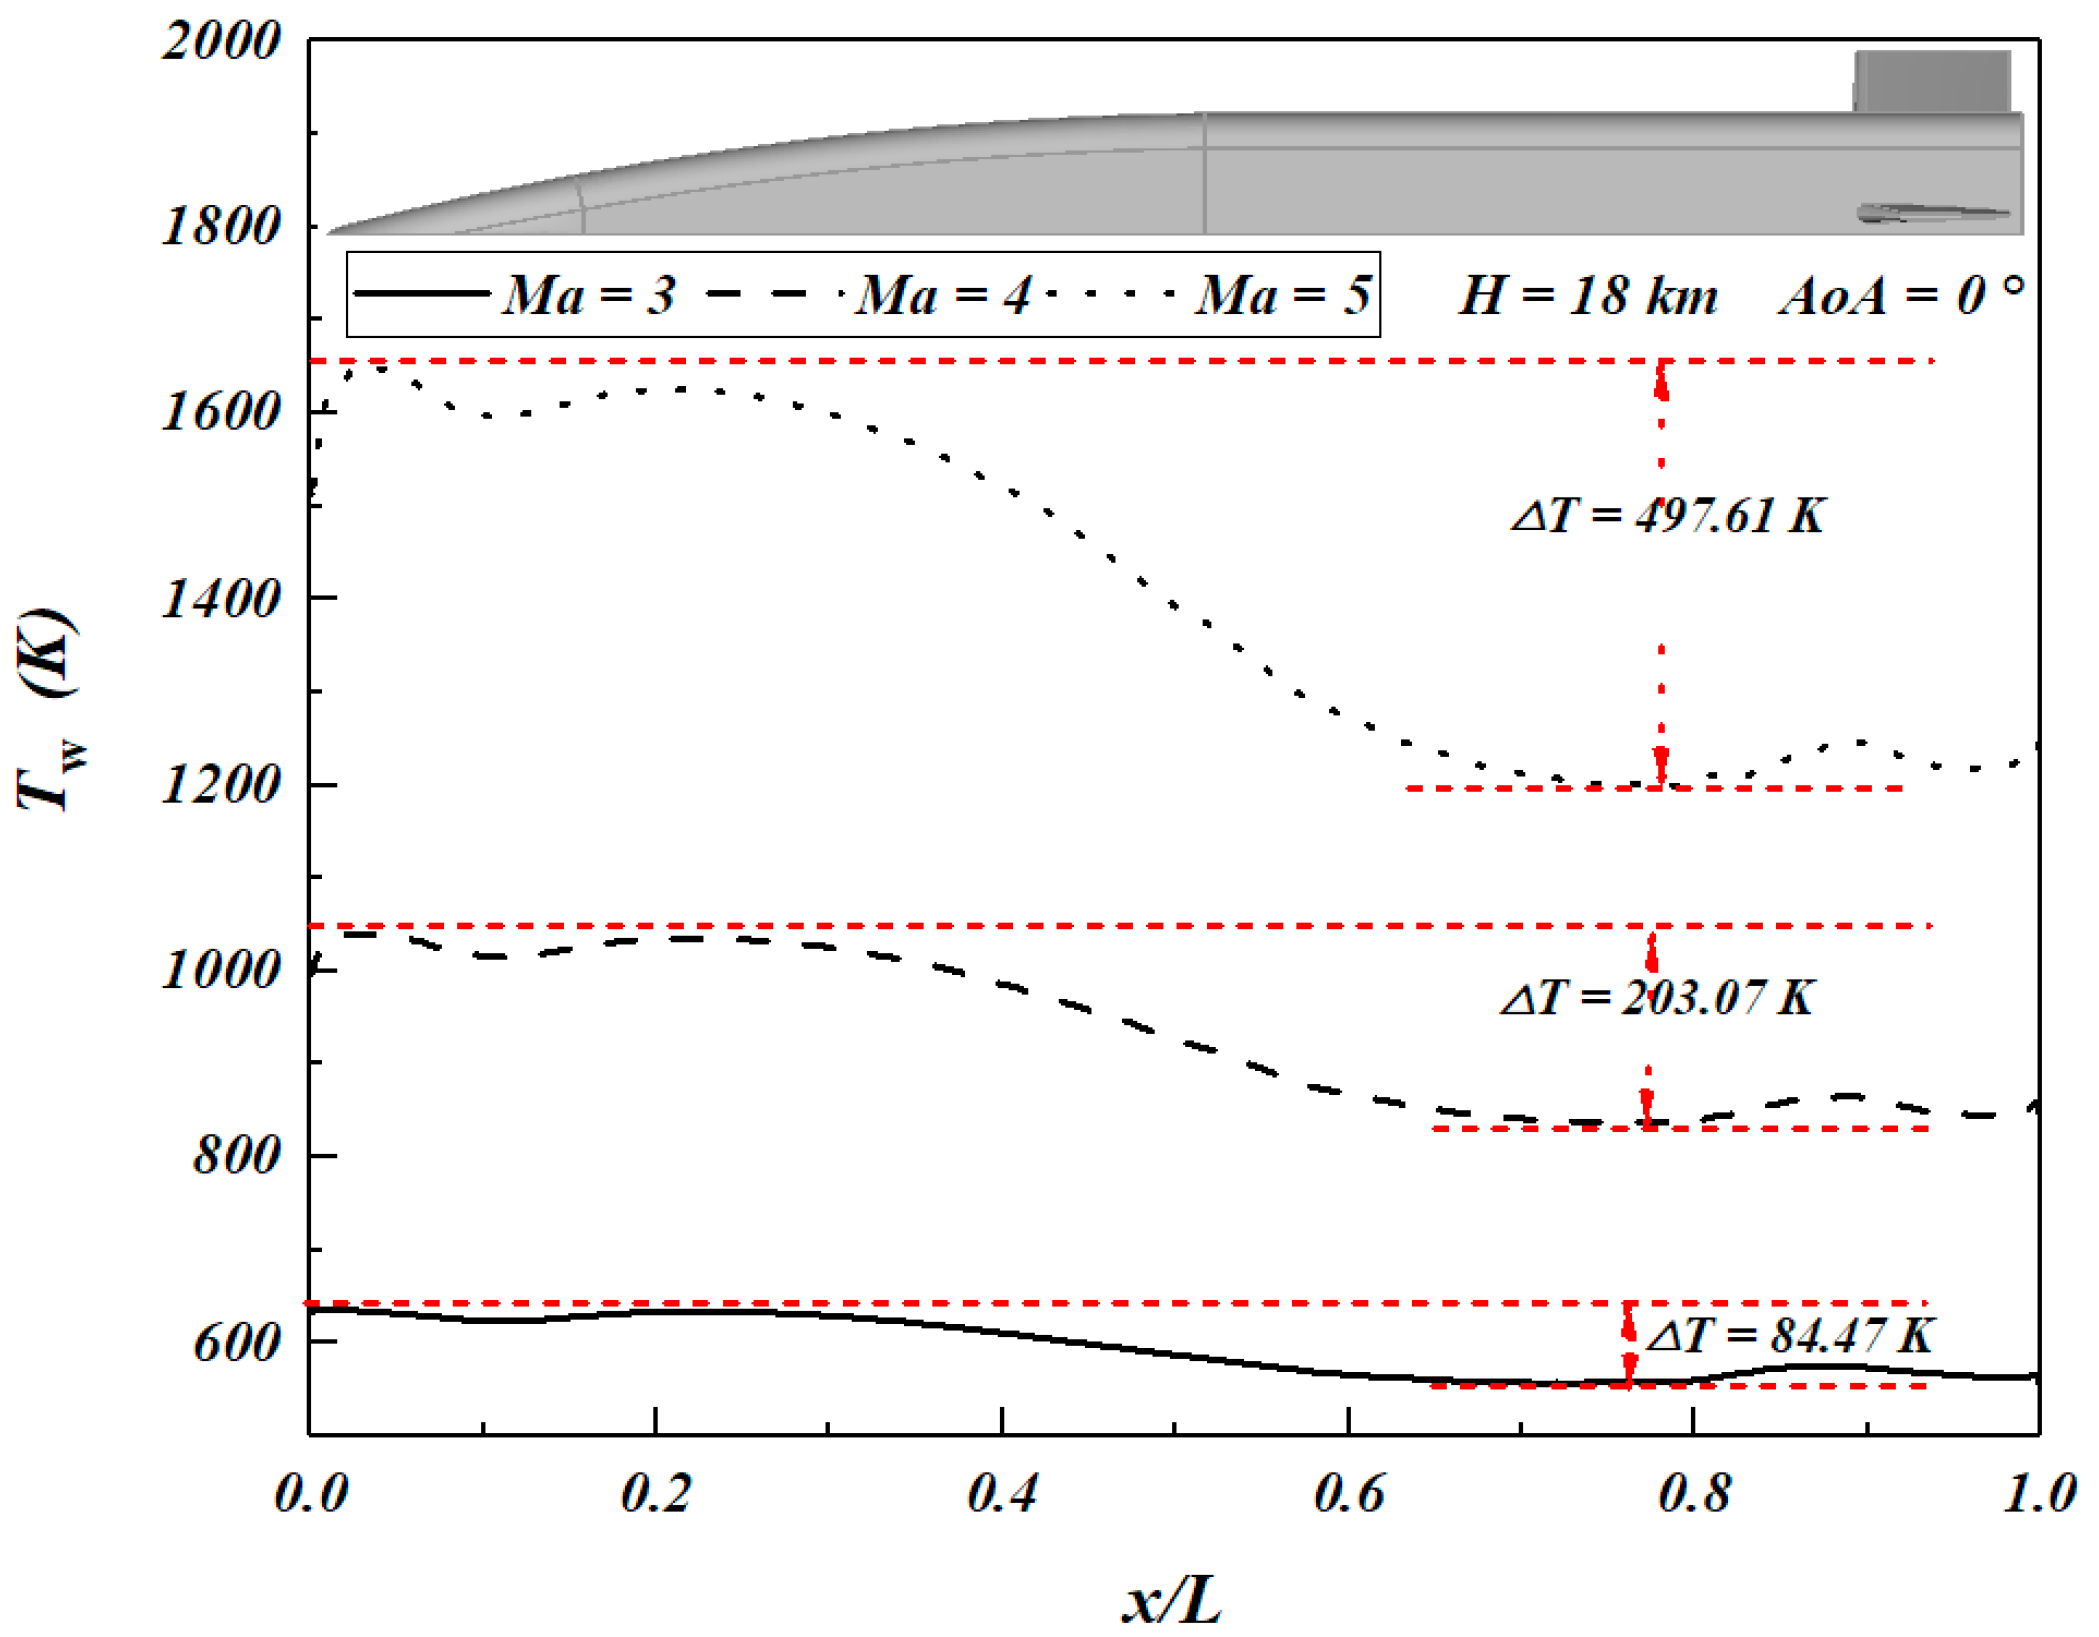
Figure 7 shows the variation trend of wall temperature along the flow direction at the axis of the aircraft and its maximum temperature difference at different Mach numbers, with the same flight altitude and angles of attack. The maximum temperature difference (ΔT) between the highest and lowest wall temperatures is 84.47 K at Mach 3, 203.07 K at Mach 4 and 497.61 K at Mach 5. With the increase in the Mach number, ΔT gradually increases. The low-temperature region is concentrated in the x/L range of 0.5 to 0.8, that is, the region before the rear side of the aircraft fuselage and the front side of the wing.
4.2. Relative Temperature Coefficient rt
Flight conditions, such as Mach number, altitude, angle of attack, affect the flow field parameters, such as shock angle and environmental pressure, which makes the aerodynamic heating of fuselage change, resulting in the difference in wall temperature distribution. Therefore, it is difficult to divide the high-/low-temperature region which are less affected by the flight conditions only by the wall temperature.
In this study, a dimensionless coefficient, namely the relative temperature coefficient rt, is proposed to characterize the relative value of local temperature in the whole temperature range, that is, the ratio of local temperature difference (Tw, local − Tw, min) to maximum temperature difference (Tw, max − Tw, min).
where Tw, local is the local wall temperature of the leeward side; Tw, max is the minimum wall temperature of the leeward side; Tw, min is the maximum wall temperature of the leeward side.
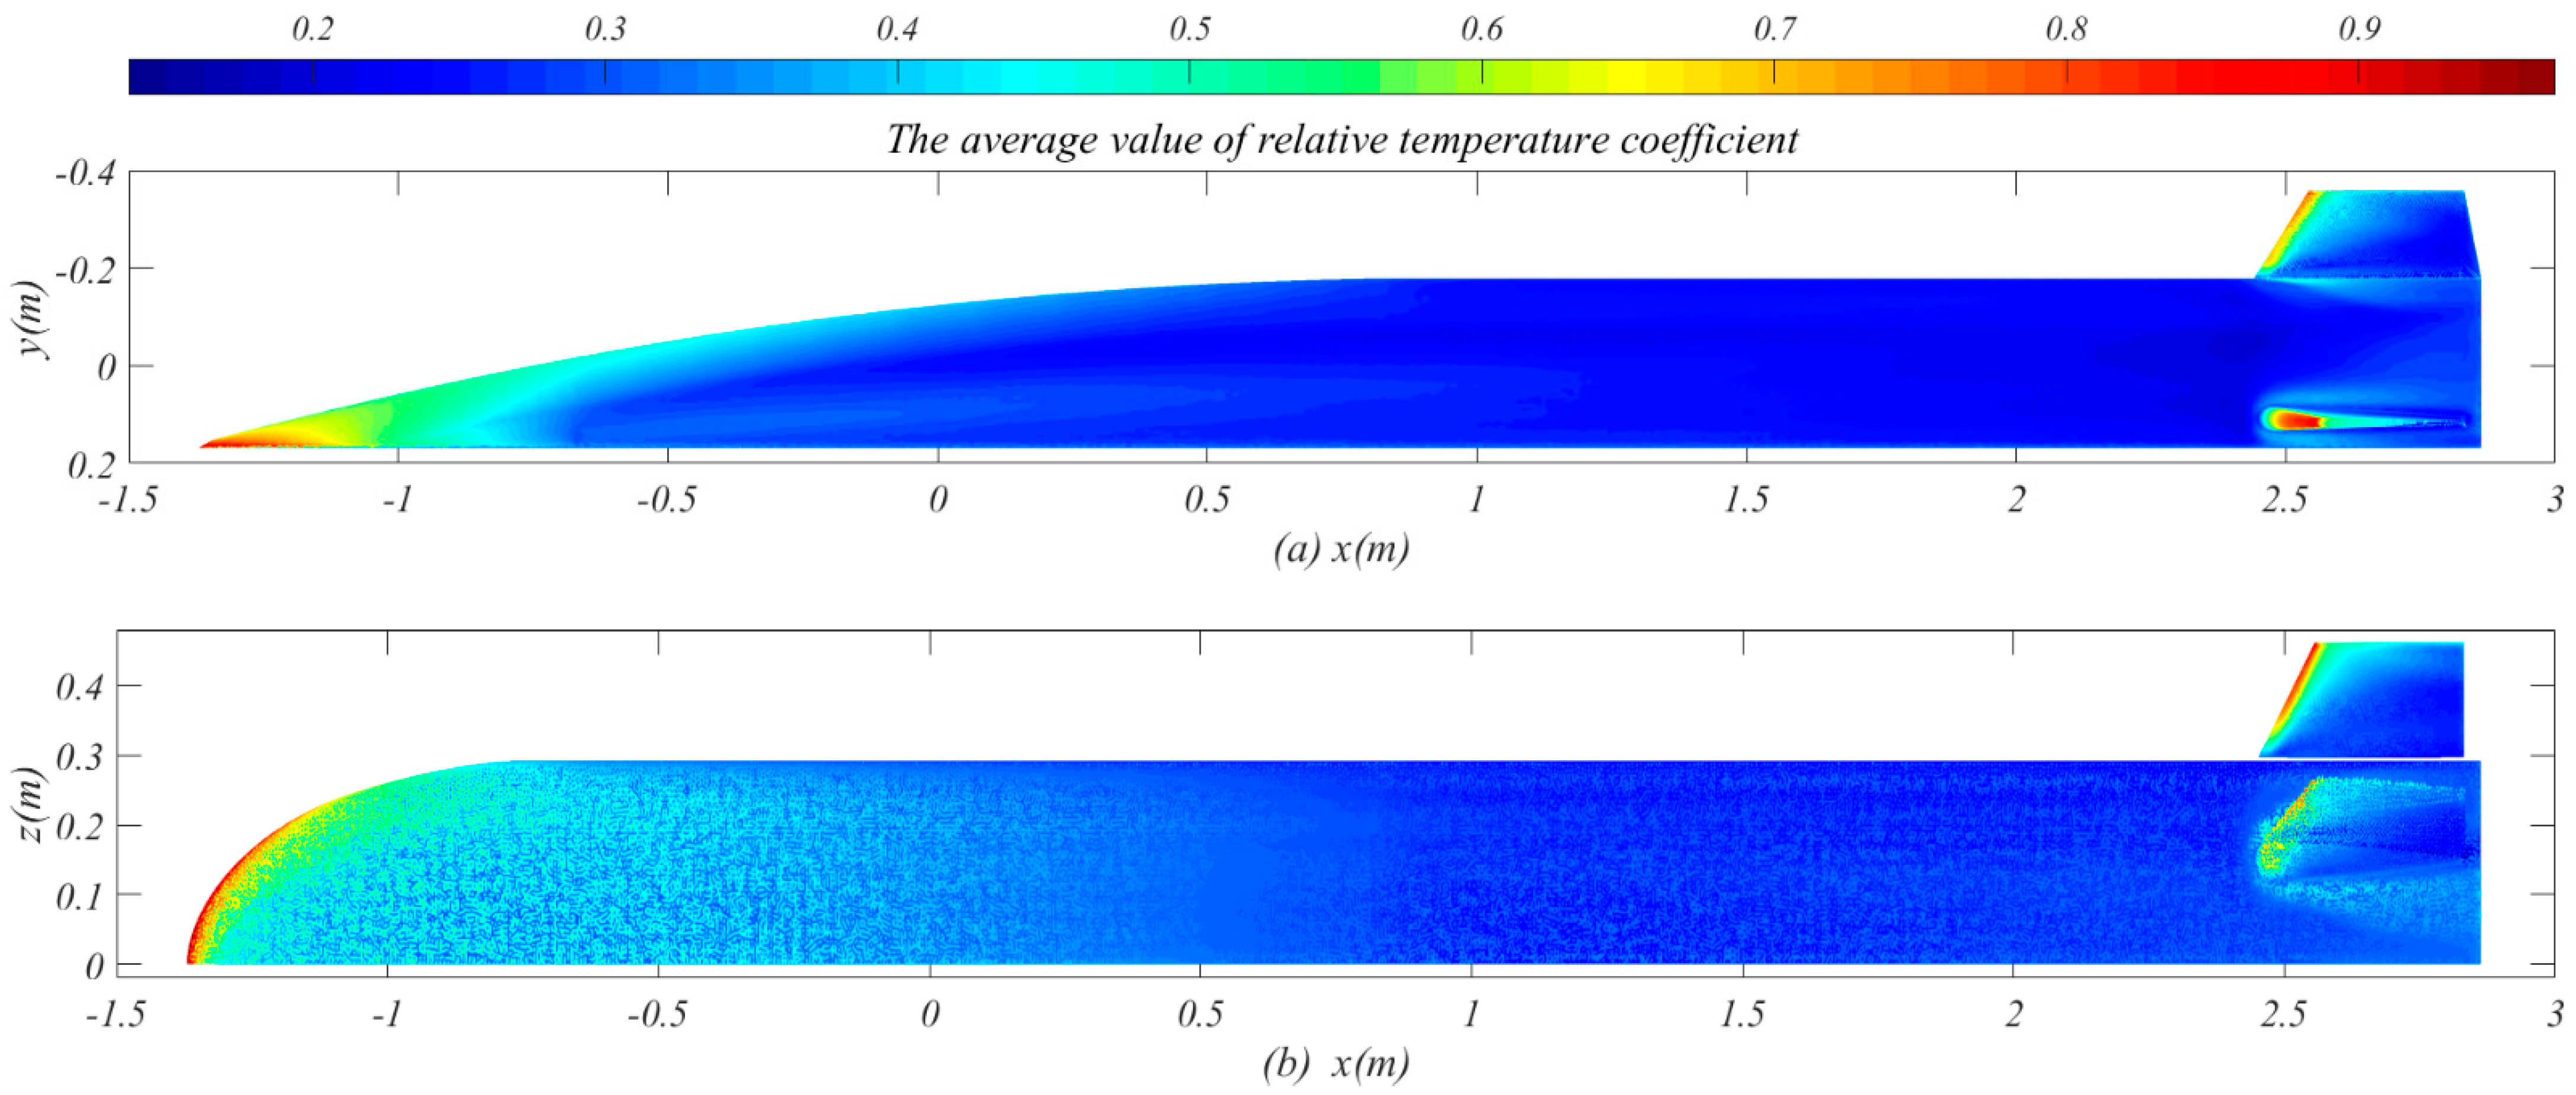
The distribution of relative temperature coefficient is obtained by post-processing wall temperature, and the average value of relative temperature coefficient under different flight conditions is calculated. The visualization results are shown in Figure 8. In the nose cone region, where x is less than −1 m, the rt is greater than 0.6. The rt on the leading edge of nose cone and windward side of tail is close to 1, which is closest to the highest wall temperature. In Figure 8a, the rt of the leeward side where x is located from 1 m to 2.5 m is less than 0.3, which is the region closest to the lowest temperature. In Figure 8b, the distribution of rt on the leeward side is uneven, but the maximum value does not exceed 0.35, which is close to the region with the lowest wall temperature. The area near the lowest wall temperature in the leeward side is very considerable.
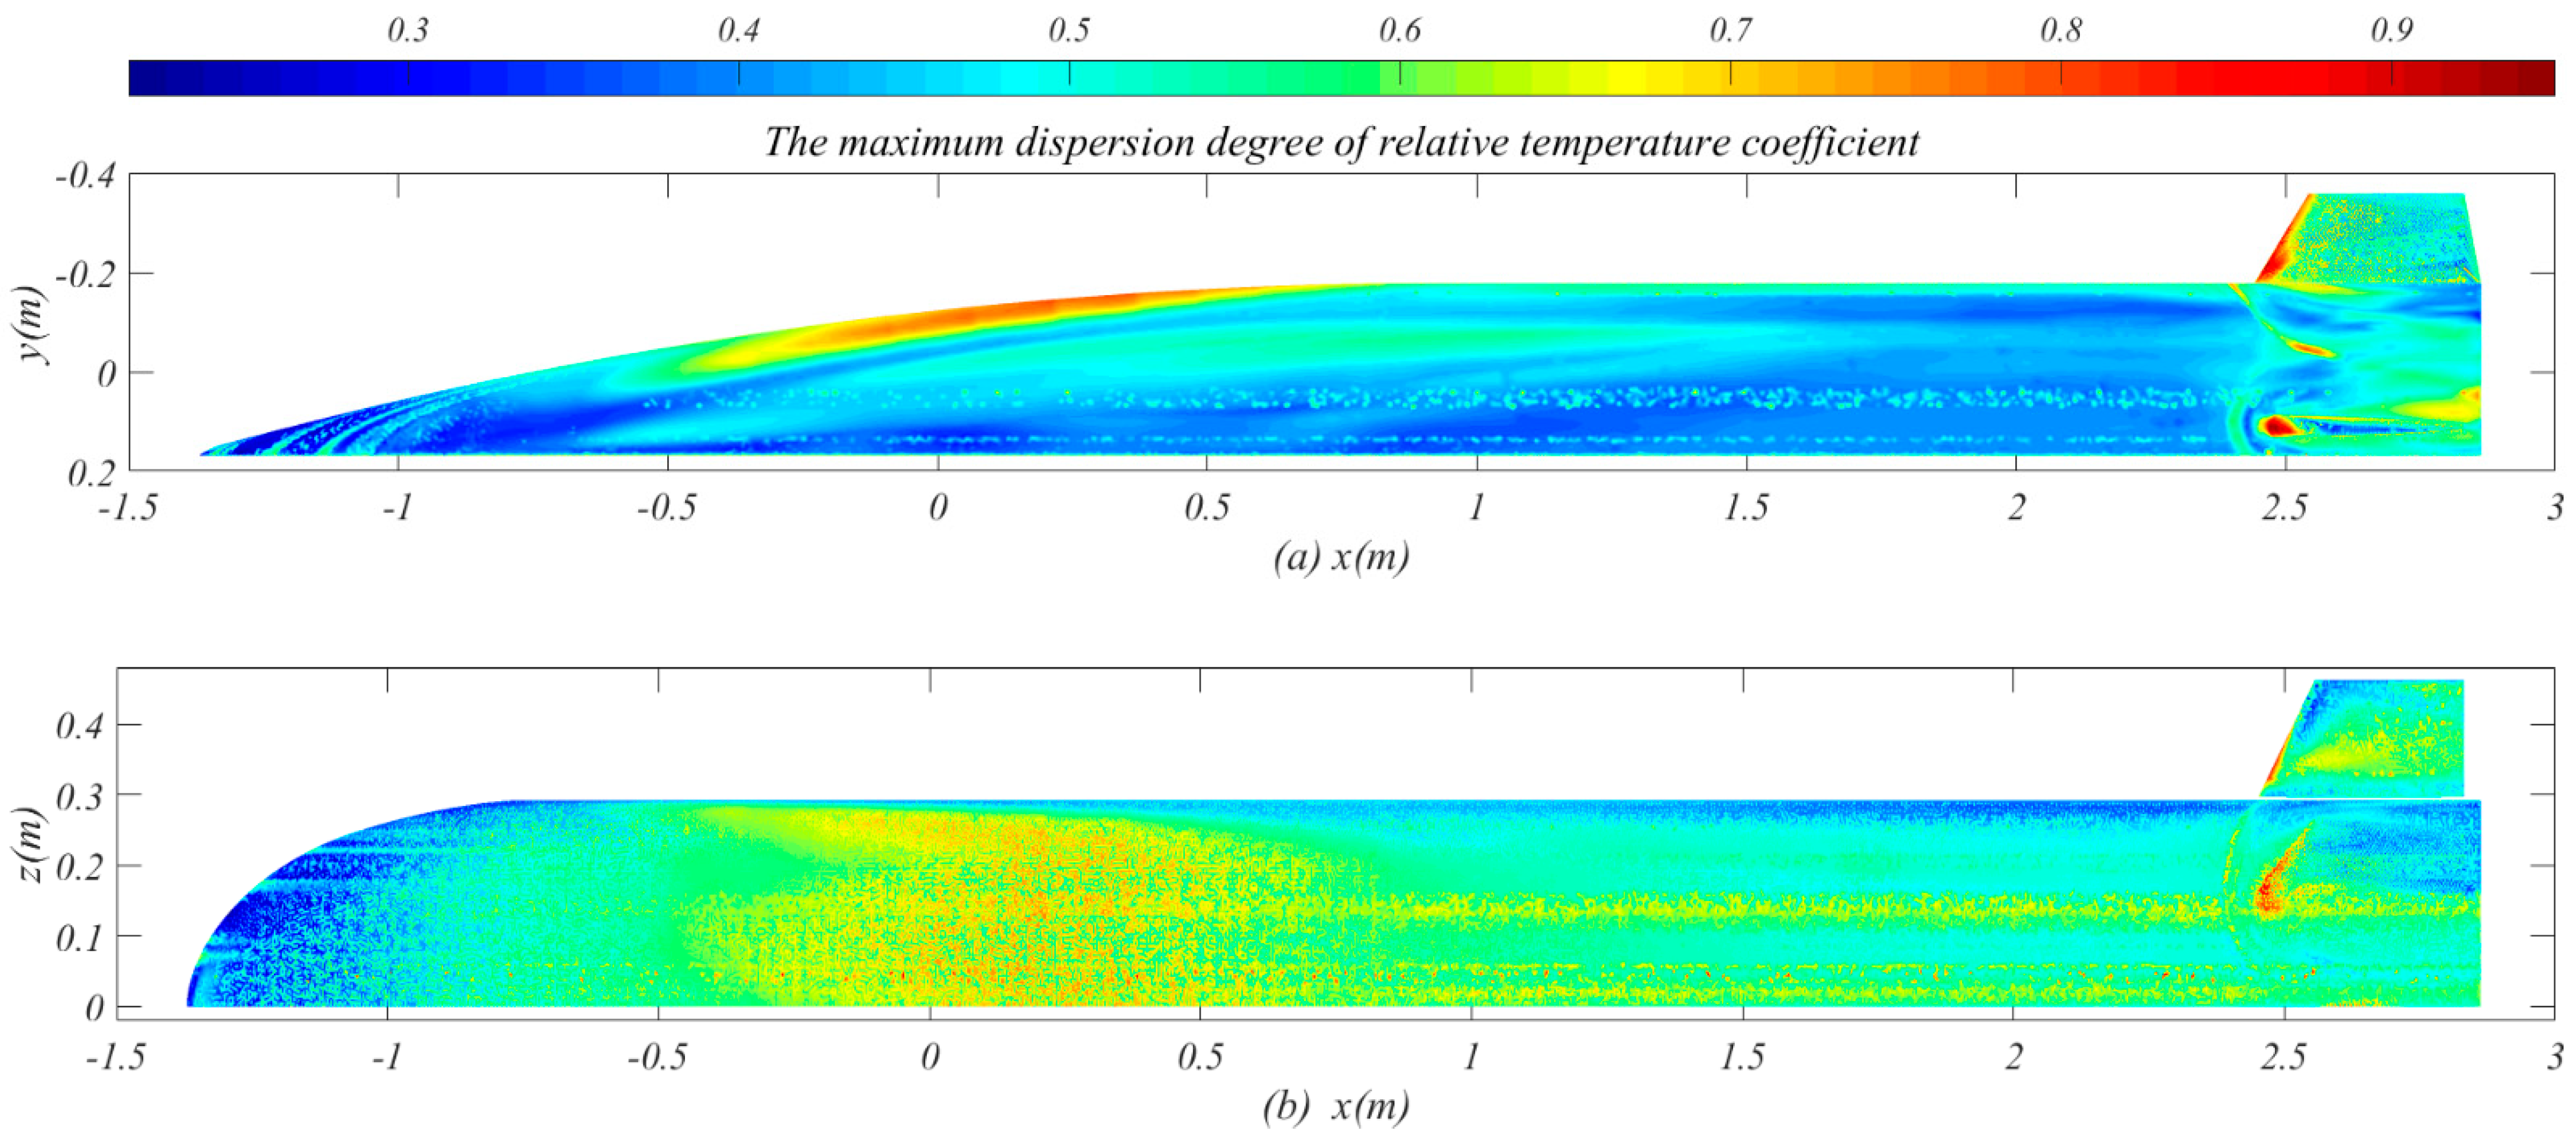
Although the distribution of rt in Figure 8 can reflect the distribution regularity of a high-/low-temperature region, it is difficult to reflect the fluctuation in local wall temperature. Therefore, it is necessary to calculate the maximum difference in local relative temperature coefficient under all flight conditions to reflect the discrete degree of local wall temperature.
Figure 9 shows the maximum dispersion degree of relative temperature coefficient (Δrt), that is, the differential value between the rt,max and the rt,min under various flight conditions. The larger the differential value is, the greater the dispersion degree of local wall temperature is, on the contrary, the smaller the dispersion degree is. Therefore, a certain region should not only have a relatively low temperature, but also have a small temperature dispersion under various flight conditions, that is, it can be used as a low-temperature region. In Figure 9a, the maximum differential value of the rt can reach 0.8 in the wedge-shaped leeward side, while it is below 0.4 in another large region on the leeward side. In Figure 9b, the maximum differential value of the rt at the nose cone is less than 0.4, and the closer to the edge of the nose cone, the smaller the maximum differential value, while the maximum differential value in another region on the leeward side is greater than 0.5. The wedge-shaped leeward side is affected by flight conditions, and the wall temperature changes greatly, so it is not suitable for a high-temperature/low-temperature region. However, in XY view, the rear side of the leeward surface (1 m < x < 2.5 m) changes little under the influence of flight conditions and its rt is less than 0.2, indicating that it can be used as low-temperature region.
4.3. Influence of Flight Conditions on Temperature Distribution
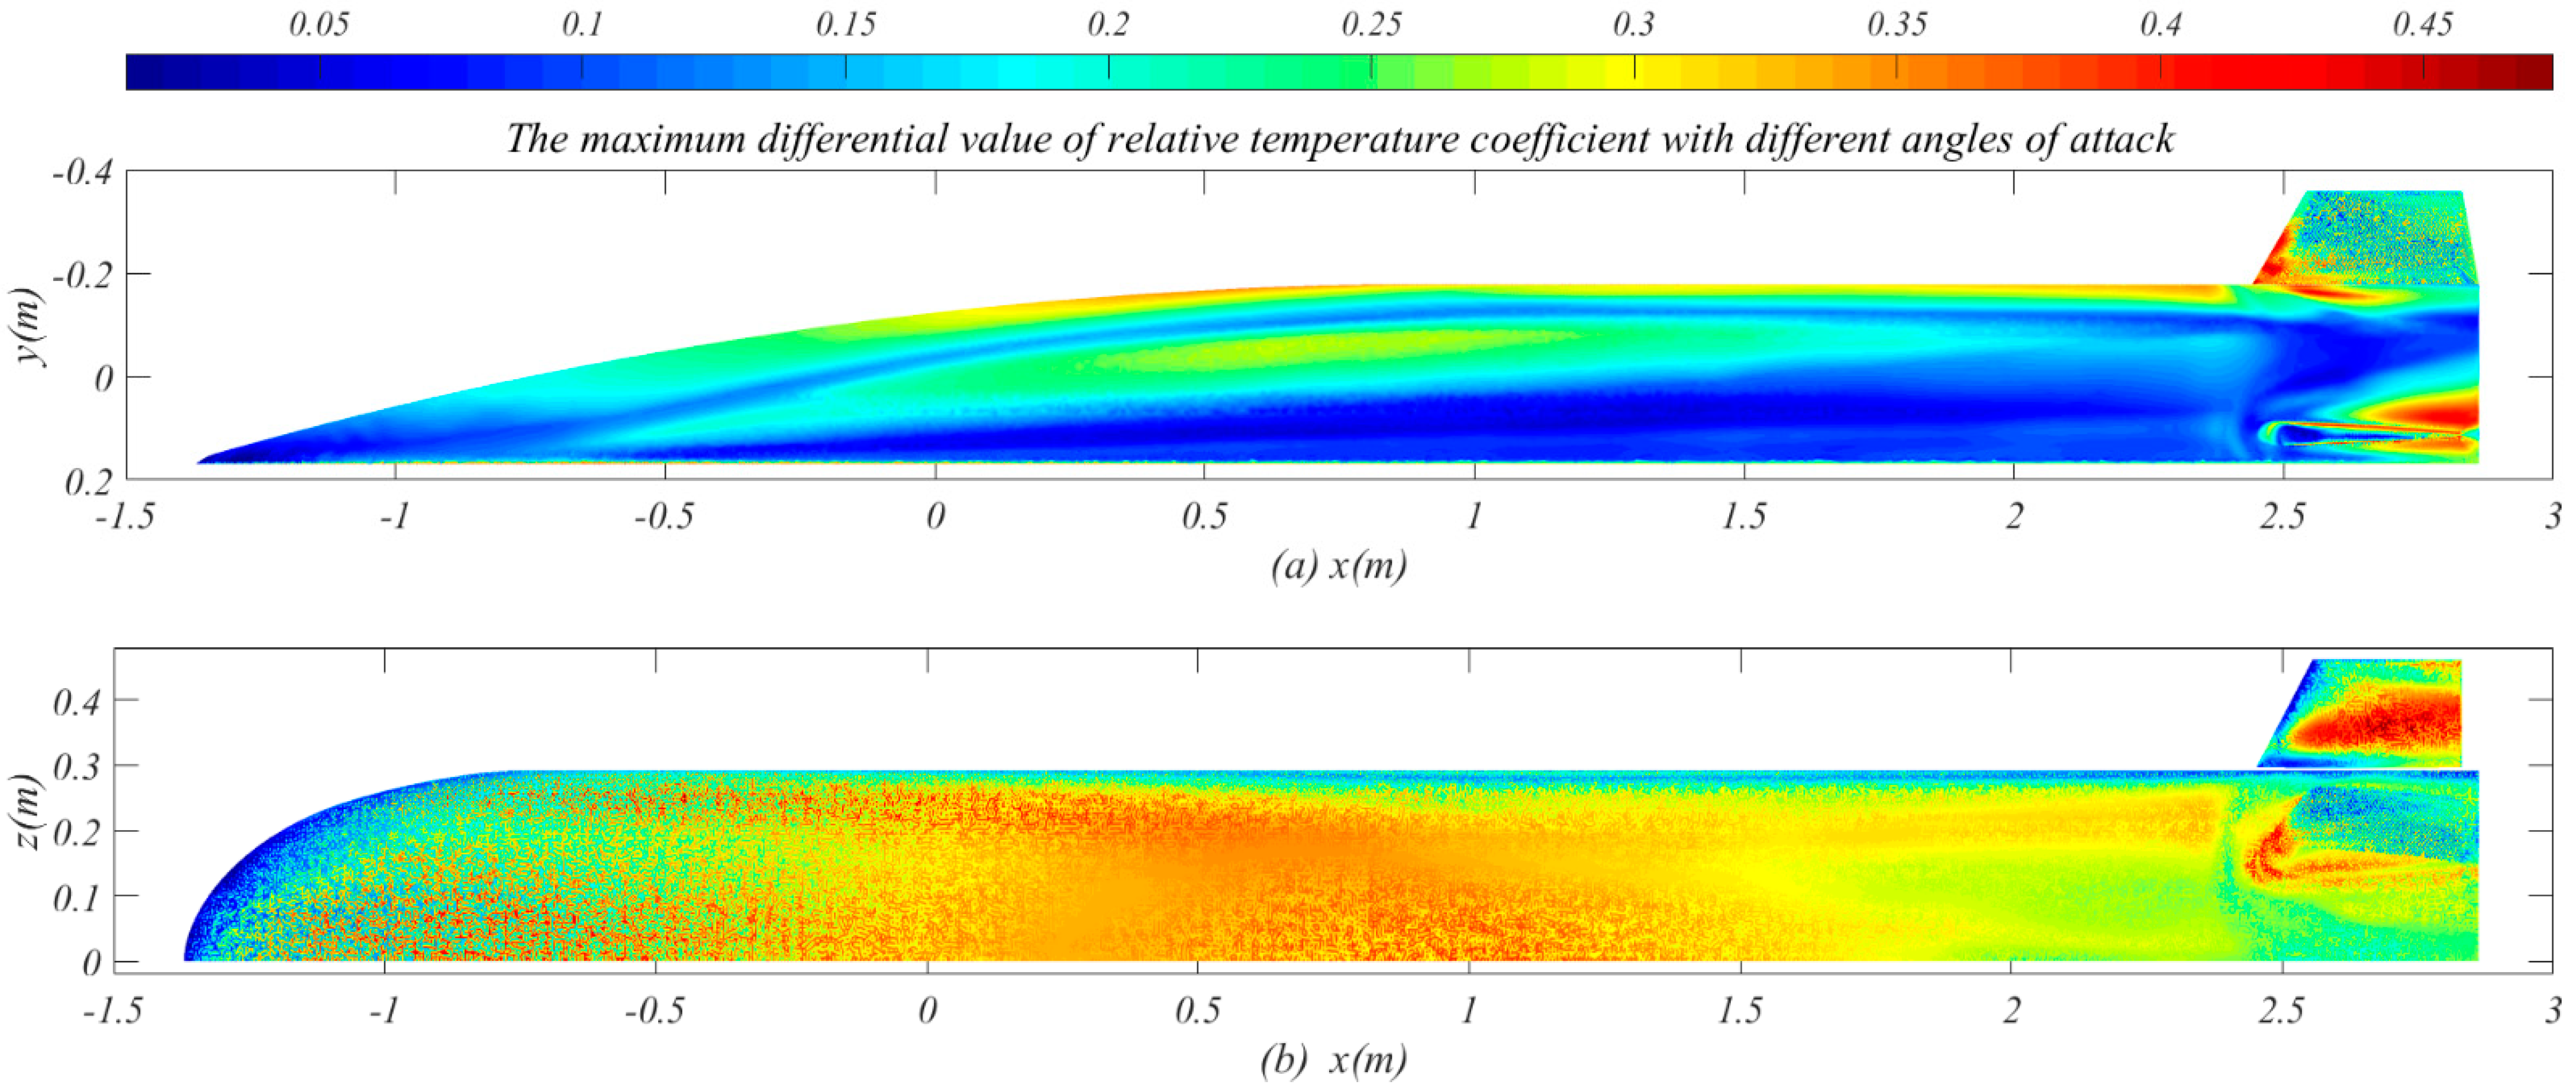
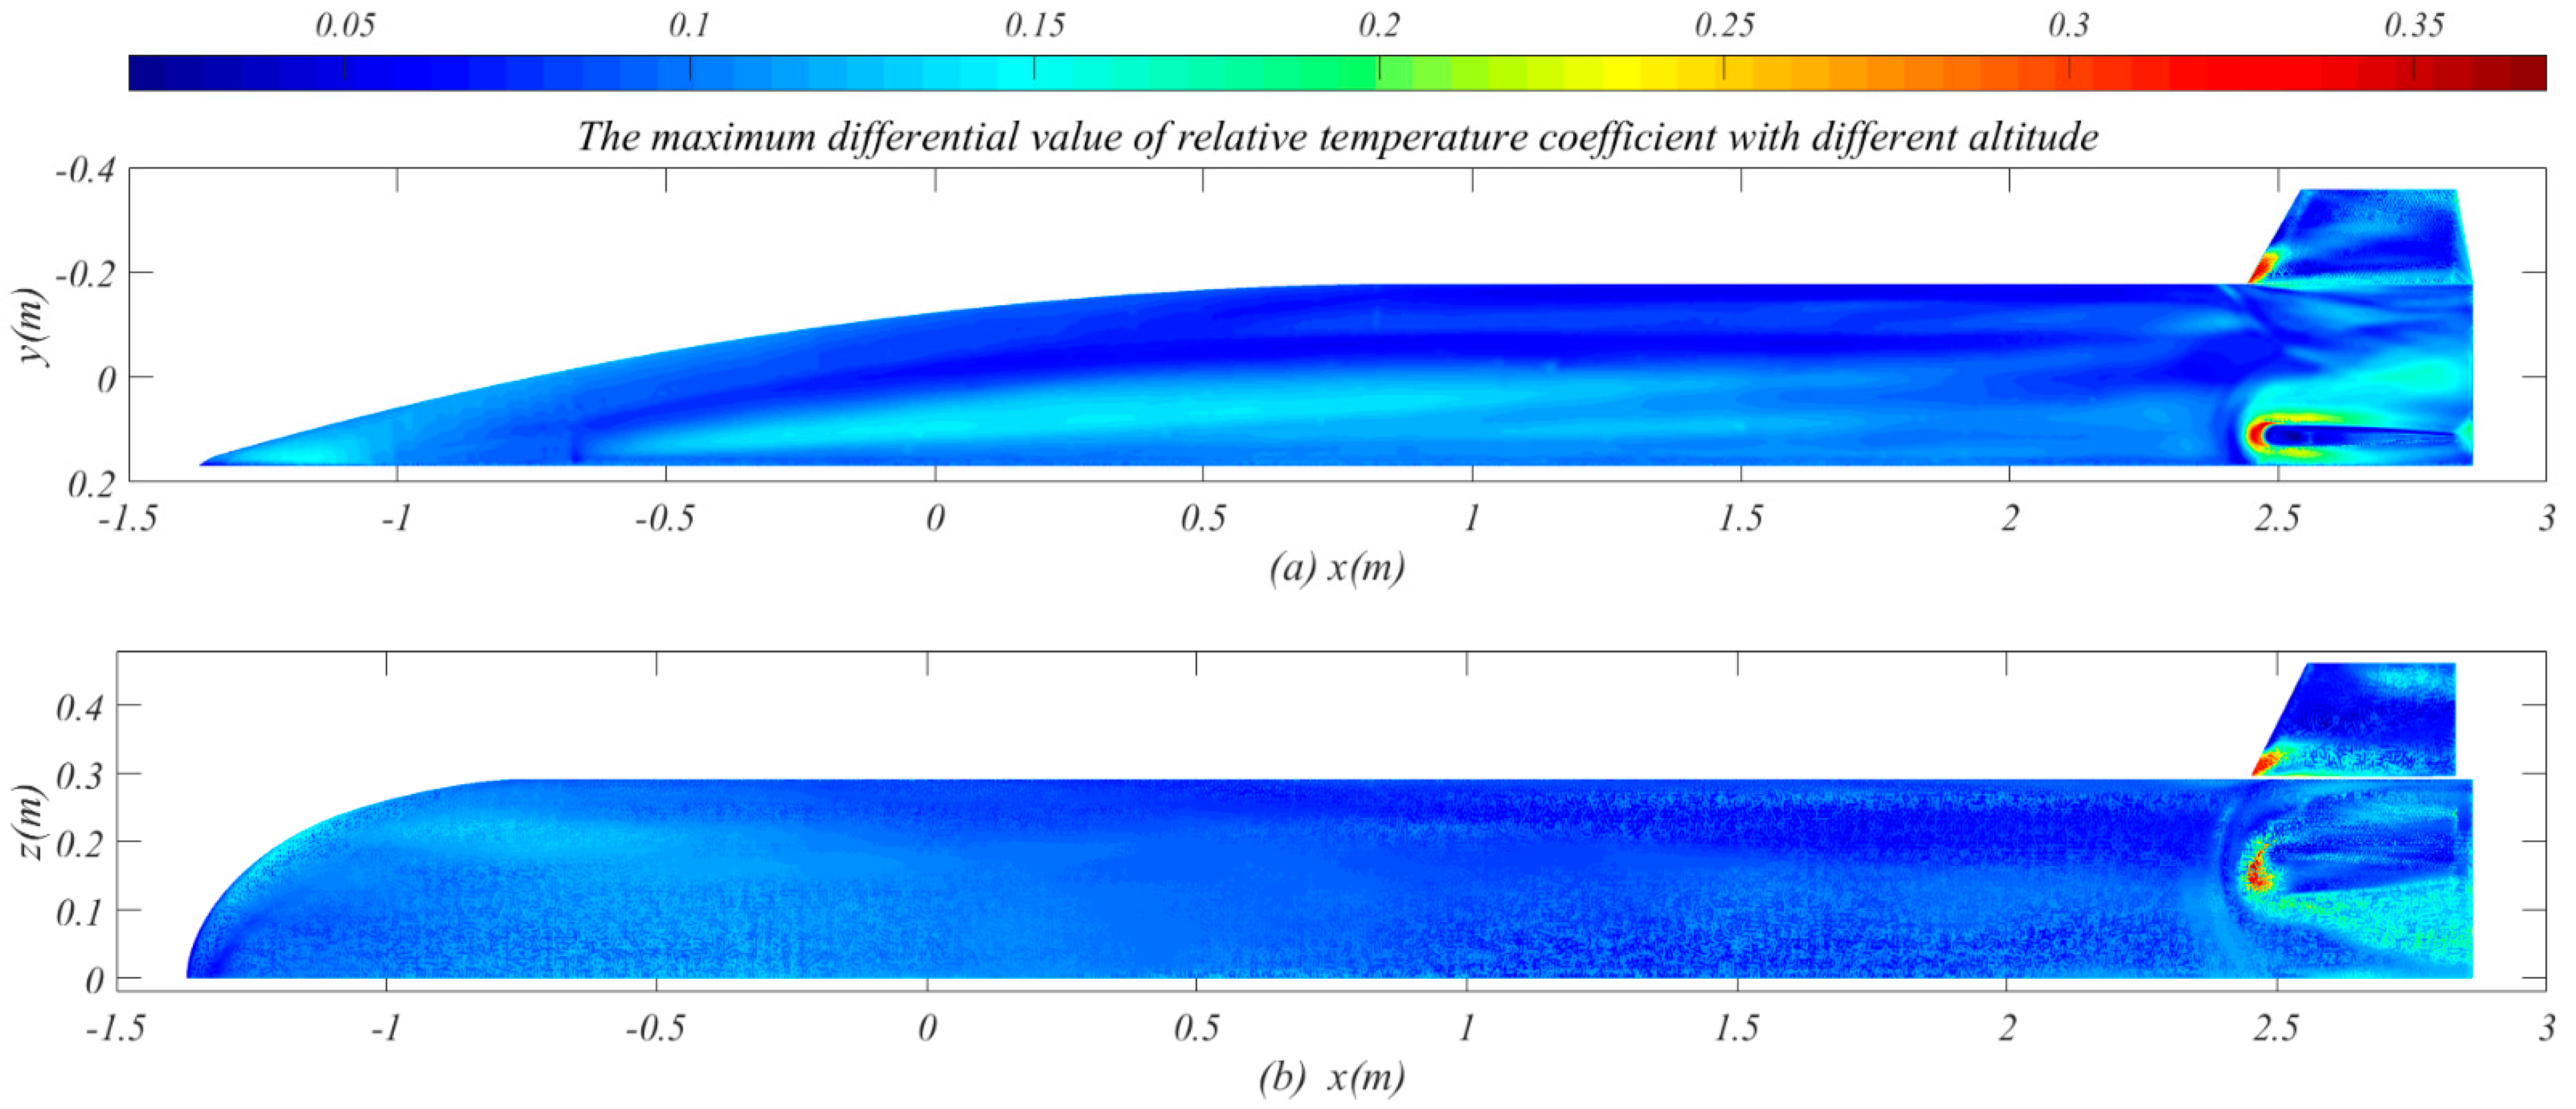
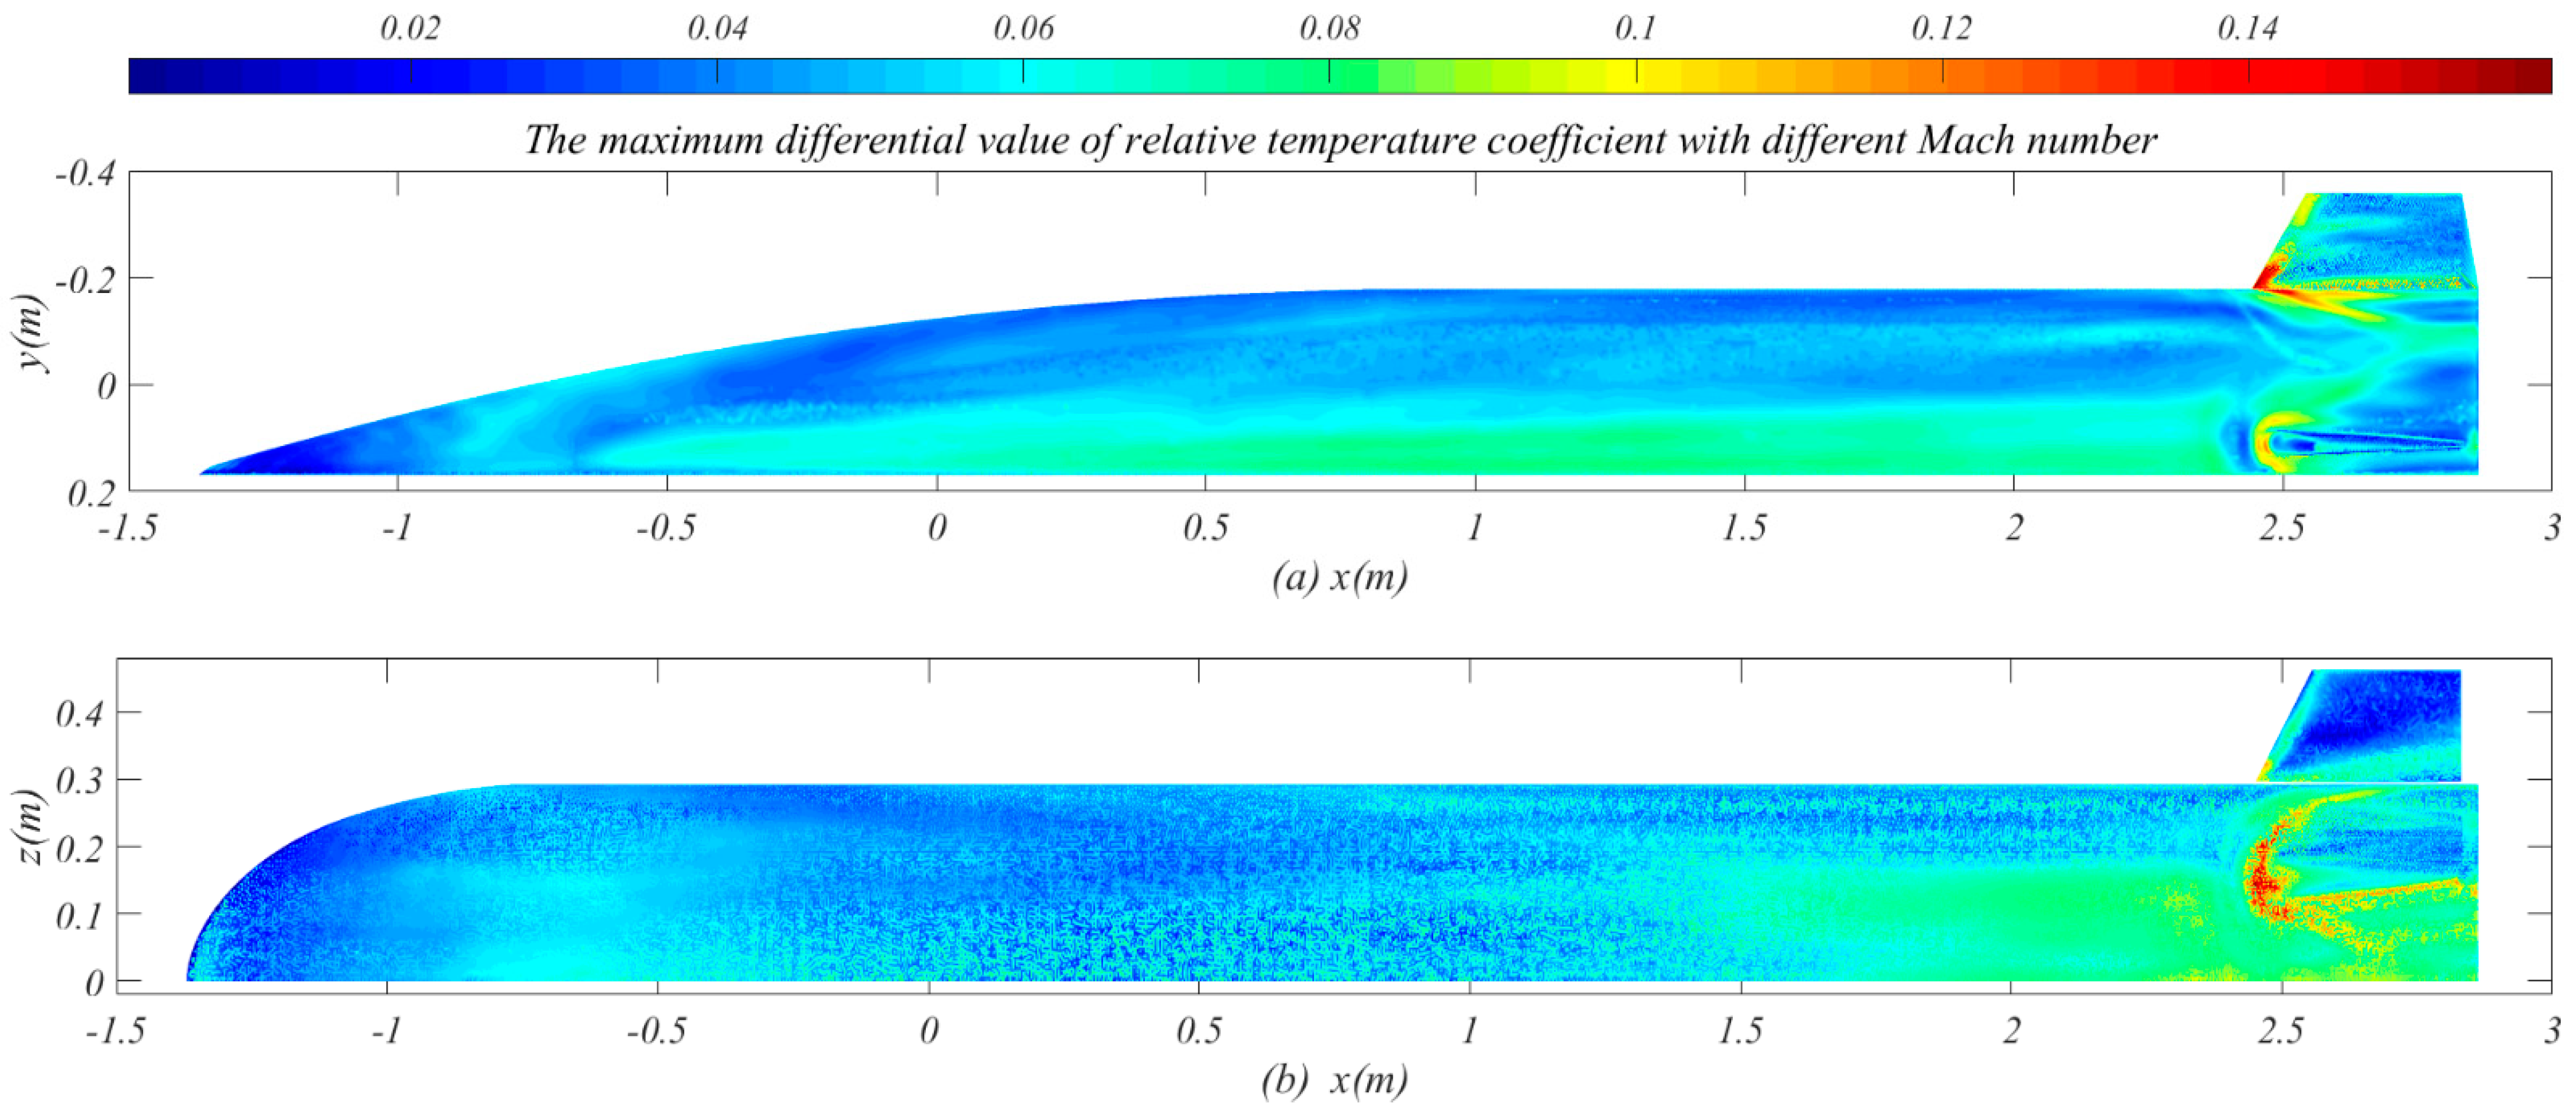
Figure 10 shows the maximum differential value of the rt at different angles of attack. Figure 11 shows the maximum differential value of the rt at different altitude. Figure 12 shows the maximum differential value of the rt at different Mach number. The maximum differential value of the rt can reach 0.45 at different angles of attack, 0.35 at different altitude and 0.15 at different Mach number.
When the flight angle of attack changes, the shock angle changes, which makes the aerodynamic heating area and position change. In Figure 10a, the rear side of the leeward surface is in an area where the shock wave flows around and is far away from the position where the shock wave is generated, so changing the angle of attack has little effect on its wall temperature distribution. However, in Figure 10b, the leeward surface, especially the wedge-shaped region, is close to the head cone shock wave, and the angle of attack has a great influence on it, so the angle of attack has a great influence on the temperature distribution in this area.
When the flight altitude increases, the pressure of the flow field decreases greatly, while the temperature of the incoming air increases gradually; when the Mach number increases, the velocity of incoming flow increases. These flight conditions affect the flow characteristics and state parameters of incoming air, thus affecting the aerodynamic thermal environment and wall temperature, but the shock wave shape and flow characteristics around the fuselage are almost unchanged. Therefore, changing the flight altitude and Mach number affect the wall temperature, but have little influence on the temperature distribution.
4.4. Heat Dissipation Capacity and Characteristics of Low-Temperature Region as Heat Sink
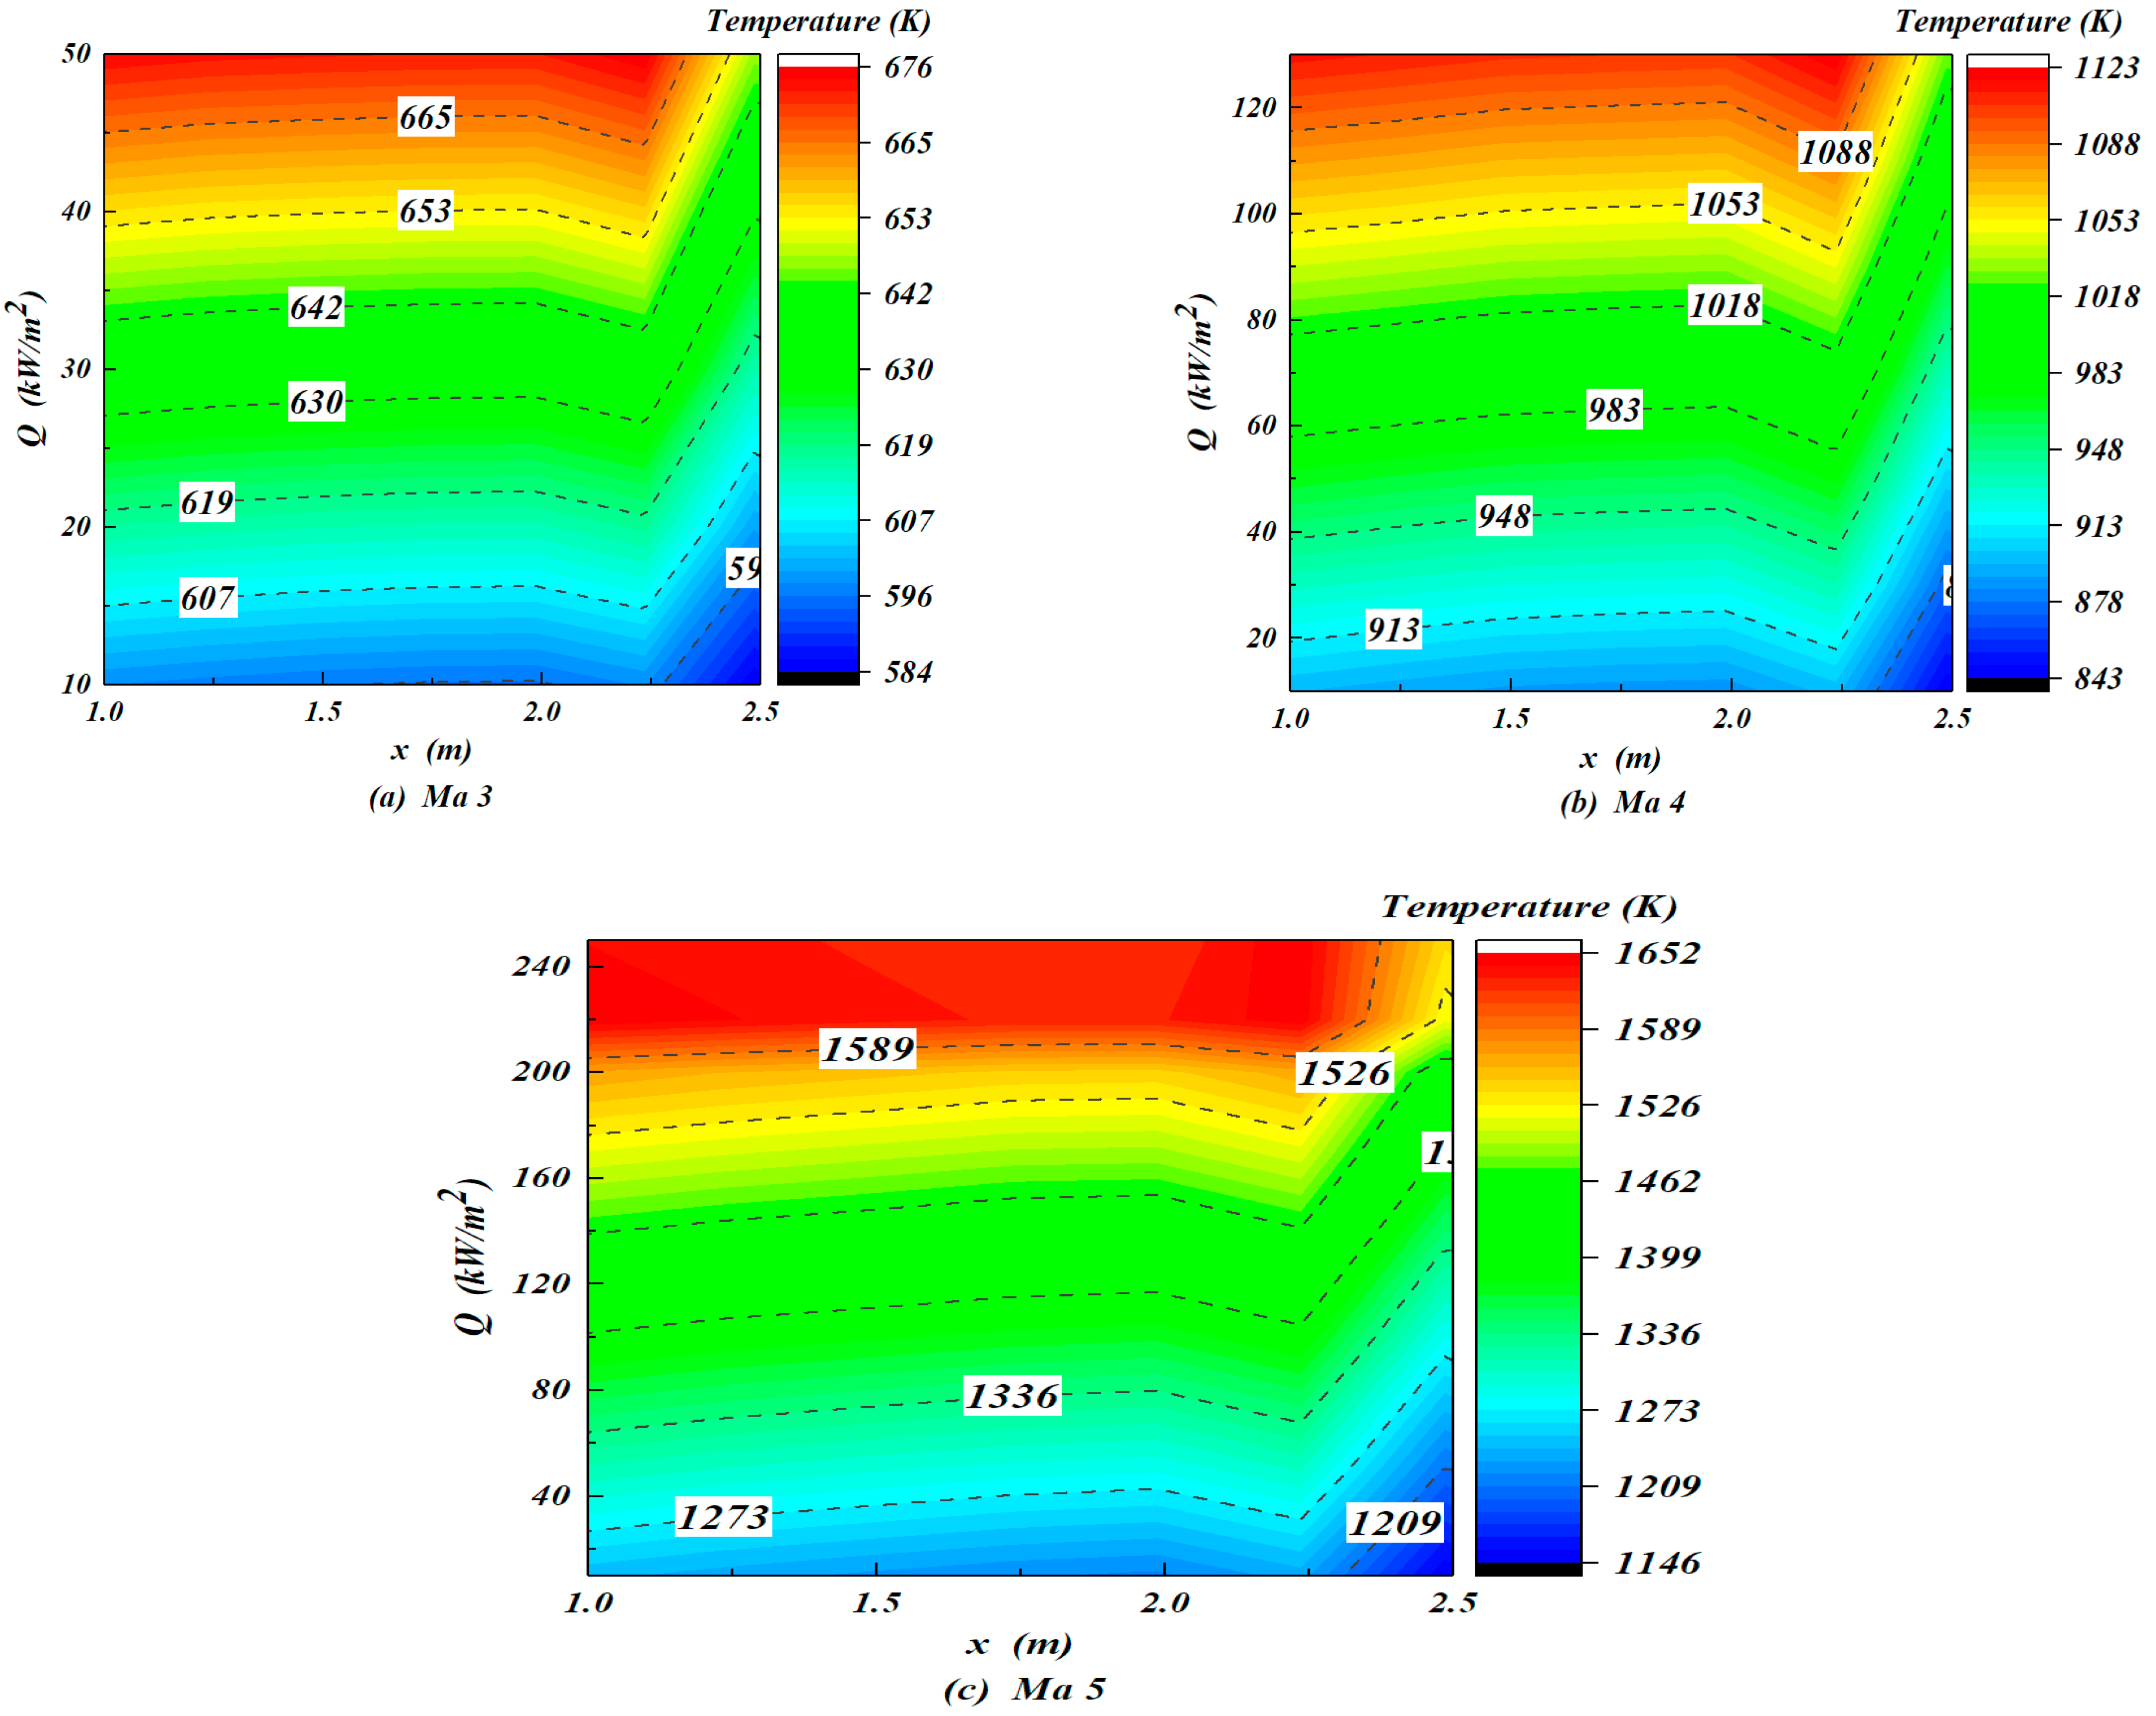
The low-temperature region can be used as a heat sink for heat dissipation. The wall of this area absorbs heat and its temperature rises, then affecting aerodynamic heating and wall radiant heating. Eventually, the heat dissipation capacity Q, aerodynamic heat Qa and radiant heat Qr interact to achieve a new thermal equilibrium:
Figure 13 show that the thermal equilibrium temperature changes with the heat dissipation capacity Q along x direction at the low-temperature region under Mach 3–5. In Figure 13, the heat dissipation capacity (Q) at each position (x/L) corresponds to a thermal equilibrium temperature. Taking stagnation temperature as the highest equilibrium temperature, the maximum heat dissipation capacity can be determined according to the above formula, as shown in Table 2. The maximum capacity is 30 kW/m2 at Ma 3, 90 kW/m2 at Ma 4 and 200 kW/m2 at Ma 5. The low-temperature region has a strong heat dissipation capacity, which gradually increases along the x direction and the increasing Mach number.
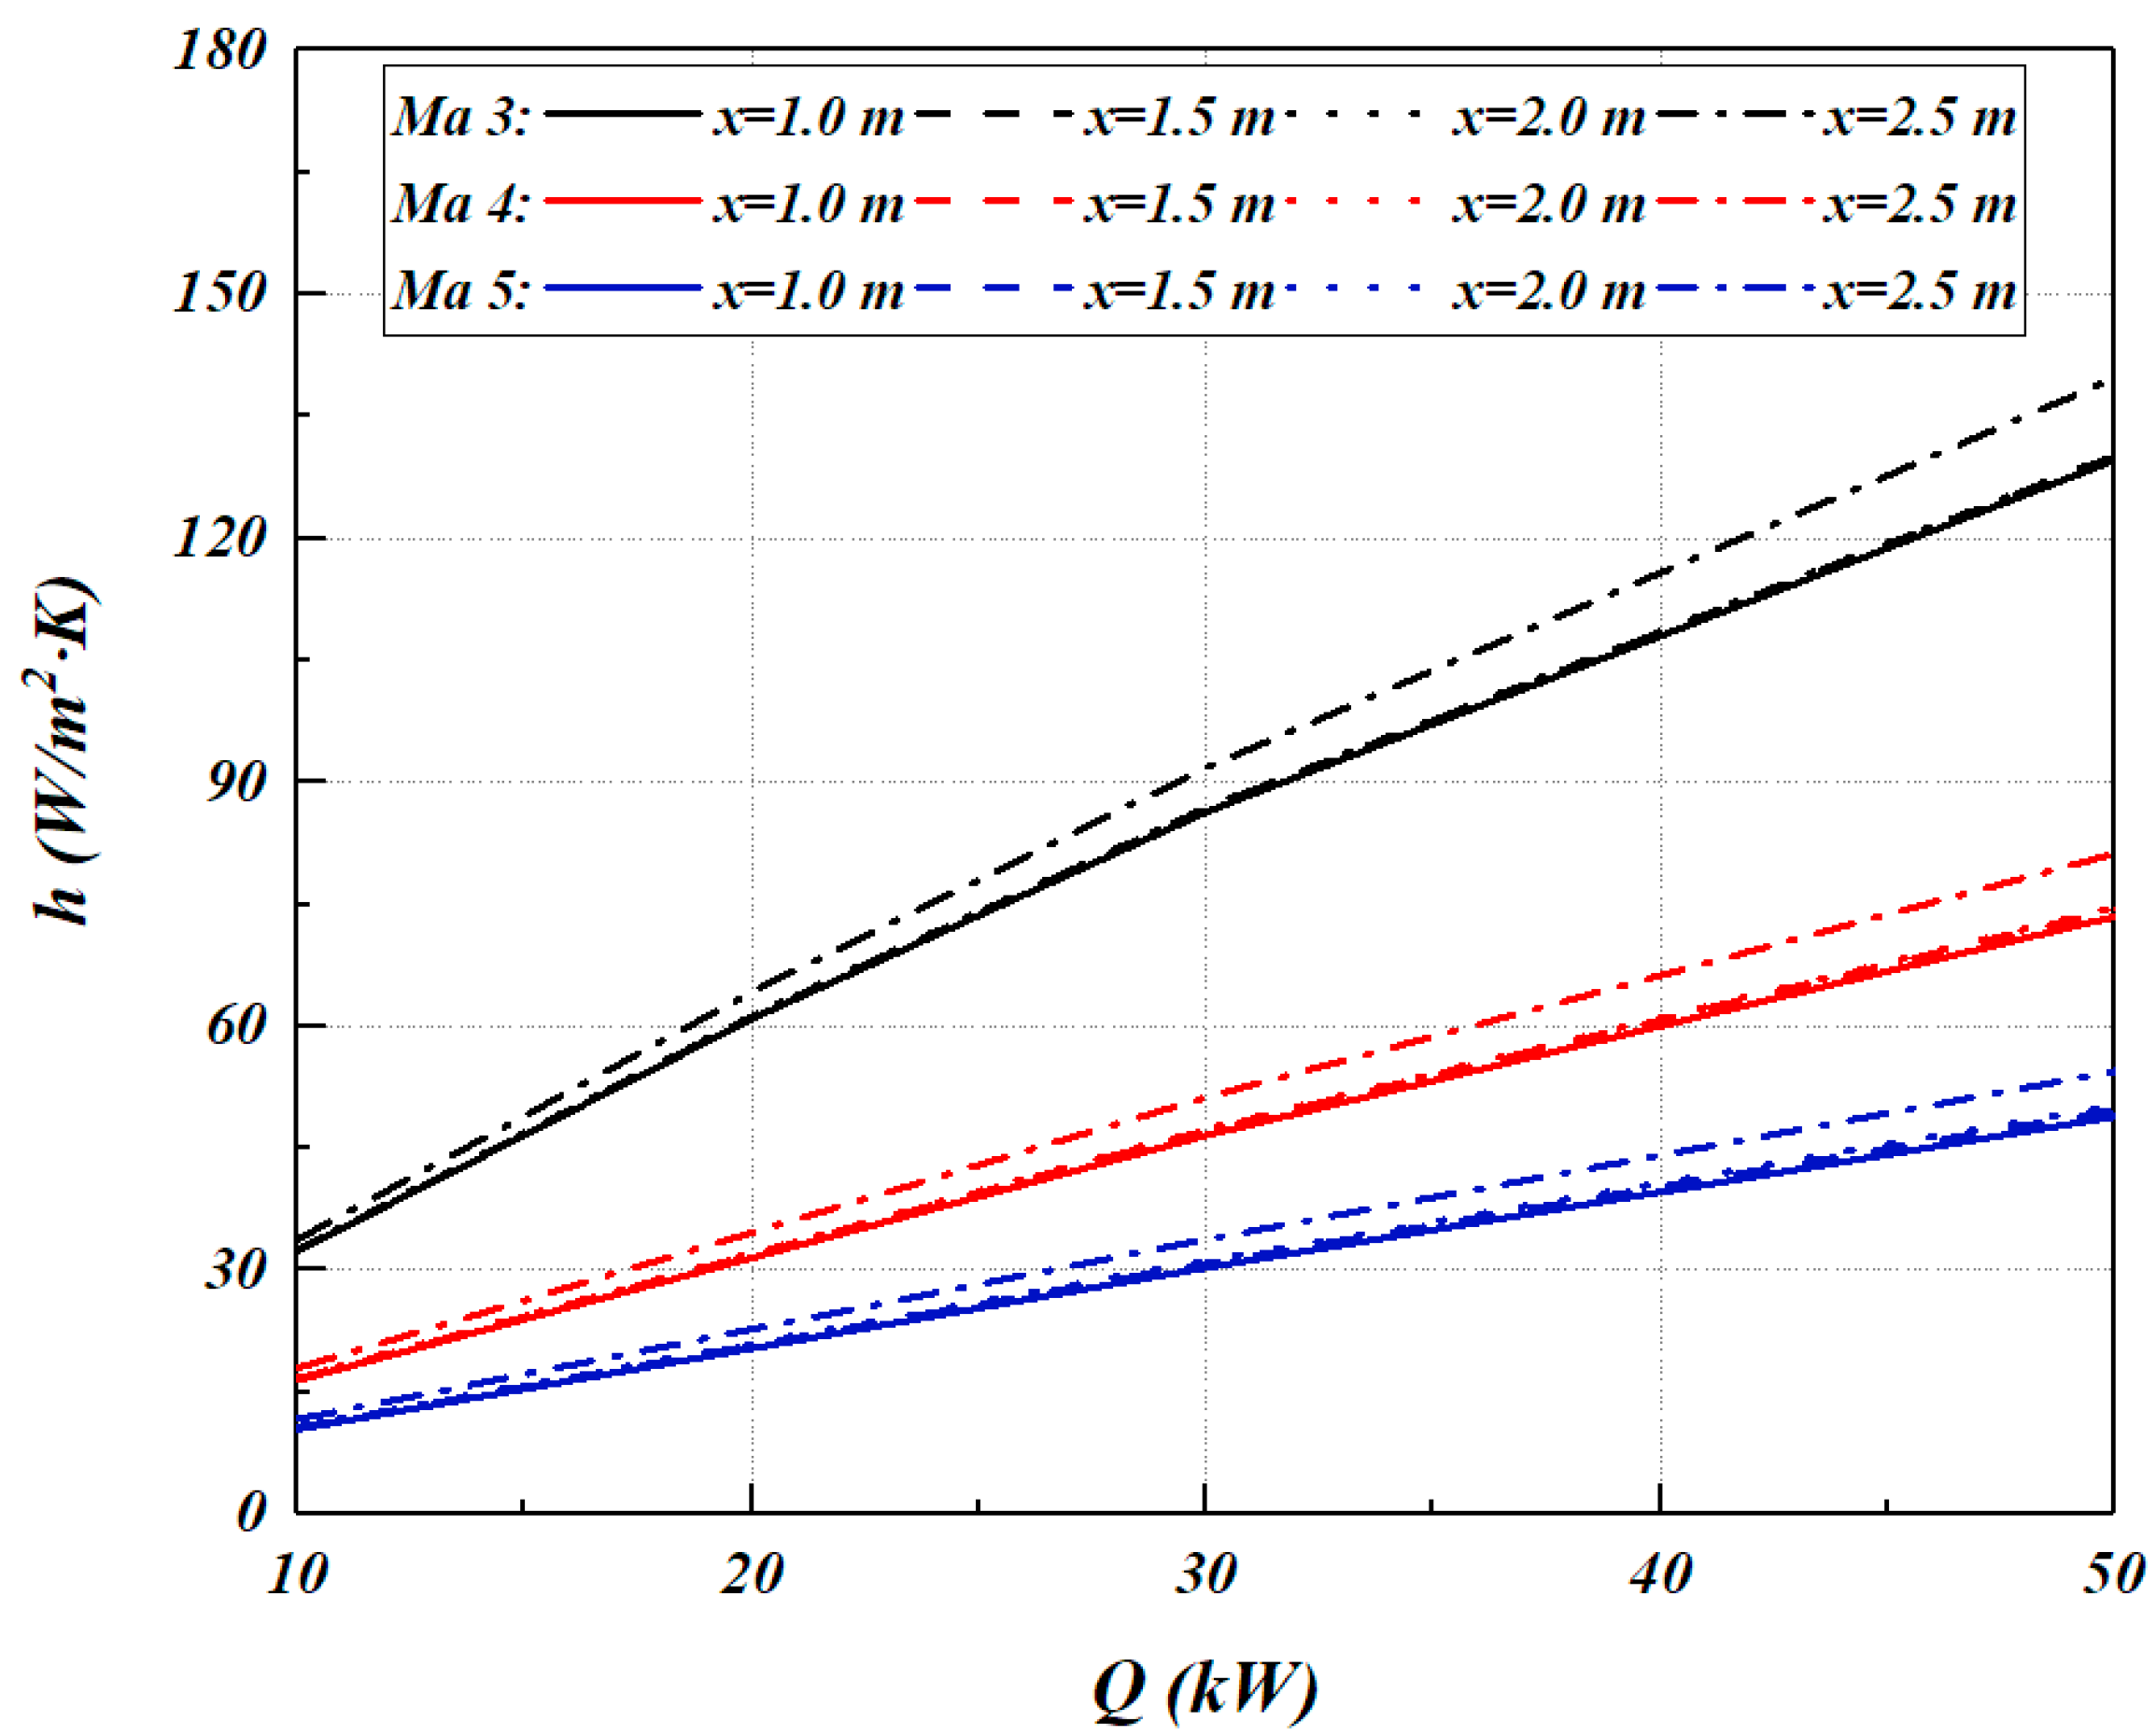
Figure 14 shows the variation trend of convective heat transfer coefficient (h) with heat dissipation capacity (Q) along x direction. At the same Q, h decreases with the increase in Mach number. With the continuous increase in Q, h also increases. After absorbing the heat dissipation capacity, the thermal equilibrium temperature rises and the temperature difference with the near wall flow increases, thus enhancing the convective heat transfer. The fluidity of air near the wall is weak. There is almost no change in heat transfer coefficient along the x direction, but the boundary layer near the wall where x is located at 2.5 m is affected by the tail, and the heat transfer coefficient increases slightly.
5. Conclusions
In this paper, the temperature distribution of the hypersonic vehicle X-51A under different flight conditions is numerically calculated. The distribution regularity and influencing factors of wall temperature are summarized. The relative value of local temperature is characterized by dimensionless parameter, relative temperature coefficient rt, and the low-temperature region, which is less affected by flight conditions, is obtained. The low-temperature region is used as a heat sink to dissipate heat, and its heat dissipation capacity and characteristics are studied, which provides an important reference for the exploration and application of the heat sink. The main conclusions of this study are as follows:
- (1)
- The high-temperature region occupies a small area of the aircraft, mainly concentrated in the nose cone, while the low-temperature region occupies a large area of the fuselage. Additionally, as the Mach number increases, the maximum temperature difference in the aircraft gradually increases;
- (2)
- In XY view the rear side of the leeward surface (1 m < x < 2.5 m) changes little under the influence of flight conditions and its rt is less than 0.2, indicating that it can be used as low-temperature region.
- (3)
- The angle of attack has a great influence on the temperature distribution, while the flight altitude and Mach number affect the wall temperature but have little influence on the temperature distribution.
- (4)
- With the highest wall temperature as the thermal equilibrium temperature, the heat dissipation capacity of the low-temperature region is 30 kW/m2 at Ma 3, 90 kW/m2 at Ma 4 and 200 kW/m2 at Ma 5;
- (5)
- The heat dissipation capacity of the low-temperature region increases greatly as the increasing Mach number. With the continuous increase in heat dissipation capacity Q, the convective heat transfer coefficient h also increases.
Author Contributions
Conceptualization, M.L.; Data curation, X.J.; Formal analysis, X.J.; Methodology, X.J.; Resources, J.Z.; Software, Y.Z.; Supervision, H.W.; Validation, X.J.; Visualization, X.J. All authors have read and agreed to the published version of the manuscript.
Funding
This research received no external funding.
Institutional Review Board Statement
Not applicable.
Informed Consent Statement
Not applicable.
Data Availability Statement
The data presented in this study are available on request from the corresponding author. All data are calculated by the author and have been included in this paper.
Conflicts of Interest
No conflict of interest exists in the submission of this manuscript, and the manuscript is approved by all authors for publication. I would like to declare on behalf of my co-authors that the work described was original research that has not been published previously, and not under consideration for publication elsewhere, in whole or in part. All the authors listed have approved the manuscript that is enclosed.
References
- Baoguo, W.; Weiguang, H. Hypersonic Aerothermodynamic; Science Press: Beijing, China, 2014. [Google Scholar]
- Military Training Textbook Working Committee of General Armament Department of Chinese People’s Liberation Army. Hypersonic Aerodynamic Heat and Thermal Protection; National Defense Industry Press: Beijing, China, 2003. [Google Scholar]
- Fan, X.J. Pneumatic Heating and Thermal Protection System; Science Press: Beijing, China, 2004. [Google Scholar]
- Glass, D.E. Ceramic matrix composite (CMC) thermal protection systems (TPS) and hot structures for hypersonic vehicles. In Proceedings of the 15th AIAA International Space Planes and Hypersonic Systems and Technologies Conference, Dayton, OH, USA, 28 April–1 May 2008. [Google Scholar]
- Lu, I. TABI-The lightweight durable thermal protection system for future reusable launch vehicles. In Proceedings of the 37th Structure, Structural Dynamics and Materials Conference, Salt Lake City, UT, USA, 15–17 April 1996. [Google Scholar]
- Cao, Y.; Cheng, H.F.; Xiao, J.Y. Research Progress of Metal Thermal Protection System in America. In Aerospace Materials & Technology; Department of Defence: Canberra, Australia, 2003; Chapters 9–12. [Google Scholar]
- Myers, D.E.; Martin, C.J.; Blosser, M.L. Parametric Weight Comparison of Advanced Metallic, Ceramic Tile, and Ceramic Blanket Thermal Protection Systems; NASA Langley Technical Report Server; National Aeronautics and Space Administration: Washington, DC, USA, 2000. [Google Scholar]
- Kasen, S.D.; Wadley, H. Heat pipe thermal management at hypersonic vehicle leading edges: A low temperature model study. J. Therm. Sci. Eng. Appl. 2019, 11, 1. [Google Scholar] [CrossRef]
- Steeves, C.A.; He, M.Y.; Kasen, S.D.; Valdevit, L.; Wadley, H.N.; Evans, A.G. Feasibility of metallic structural heat pipes as sharp leading edges for hypersonic vehicles. J. Appl. Mech. 2009, 76, 031014. [Google Scholar] [CrossRef] [Green Version]
- Colwell, G.T.; Modlin, J.M. Heat pipe and surface mass transfer cooling of hypersonic vehicle structures. J. Thermophys. Heat Transf. 1992, 6, 492–499. [Google Scholar] [CrossRef]
- Liu, S.; Bo-ming, Z. Investigation on transpiration active cooling metallic thermal protection systems. J. Astronaut. 2011, 32, 433–438. [Google Scholar]
- Maruyama, S.; Viskanta, R.; Aihara, T. Active thermal protection system against intense irradiation. J. Thermophys. Heat Transf. 2012, 3, 389–394. [Google Scholar] [CrossRef]
- Rakow, J.F.; Waas, A.M. Thermal buckling of metal foam sandwich panels for convective thermal protection systems. J. Spacecr. Rocket. 2005, 42, 832–844. [Google Scholar] [CrossRef]
- Rakow, J.F.; Waas, A.M. Response of actively cooled metal foam sandwich panels exposed to thermal loading. AIAA J. 2007, 45, 329–336. [Google Scholar] [CrossRef]
- Jungeng, T. Engineering Thermodynamics; Higher Education Press: Beijing, China, 2007. [Google Scholar]
- Shou, R.Z.; He, H.S. Aircraft Environmental Control; Beijing University of Aeronautics and Astronautics Press: Beijing, China, 2004. [Google Scholar]
- He, H.; Spadaccini, L.; Sobel, D. Endothermic heat-sink of jet fuels for scramjet cooling. In Proceedings of the 38th AIAA/ASME/SAE/ASEE Joint Propulsion Conference & Exhibit, Indianapolis, Indiana, 7–10 July 2002. [Google Scholar]
- Zhang, X.J.; Zhang, Z.Q.; Gao, F. Fuel temperature analysis of advanced fighter aircraft during supersonic cruise. J. Aerosp. Power 2010, 2, 0258-06. [Google Scholar]
- Berry, S.A.; Horvath, T.J.; Difulvio, M.; Glass, C.; Merski, N.R. X-34 experimental aeroheating at Mach 6 and 10. J. Spacecr. Rocket. 1998, 36, 293–301. [Google Scholar]
- Berry, S.A.; Horvath, T.J.; Weilmuenster, K.J.; Alter, S.J.; Merski, N.R., Jr. X-38 experimental aeroheating at Mach 10. J. Spacecr. Rocket. 2004, 41, 293–301. [Google Scholar] [CrossRef] [Green Version]
- Bahm, C.; Baumann, E.; Martin, J.; Bose, D.; Beck, R.; Strovers, B. The X-43A hyper-X Mach 7 flight 2 guidance, navigation, and control overview and flight test results. In Proceedings of the AIAA/CIRA 13th International Space Planes and Hypersonics Systems and Technologies Conference, Capua, Italy, 16–20 May 2005. [Google Scholar]
- Hank, J.; Murphy, J.; Mutzman, R. The X-51A scramjet engine flight demonstration program. In Proceedings of the 15th AIAA International Space Planes and Hypersonic Systems and Technologies Conference, Dayton, OH, USA, 28 April–1 May 2008. [Google Scholar]
- Zhang, Z.; Gao, Z.; Jiang, C.; Lee, C. Grid generation criterions in hypersonic aeroheating computations. J. Beijing Univ. Aeronaut. Astronaut. 2015, 4, 594–600. [Google Scholar]
- Klopfer, G.H.; Yee, H.C. Viscous hypersonic shock-on-shock interaction on blunt cowl lips. In Proceedings of the 26th Aerospace Sciences Meeting, Reno, NV, USA, 11–14 January 1988. [Google Scholar]
- ANSYS. ANSYS Fluent 19.0 User’s Guide; ANSYS, Inc.: Canonsburg, PA, USA, 2019. [Google Scholar]
- Miller, C.G.; Gnoffo, P.A.; Wilder, S.E. Measured and predicted heating distributions for biconics at Mach 10. J. Spacecr. Rocket. 1986, 23, 251–258. [Google Scholar] [CrossRef]
Figure 1.
Three-dimensional model of X-51a cruise body: (a) Three-dimensional model; (b) The top view; (c) The side view; (d) The rear view.
Figure 1.
Three-dimensional model of X-51a cruise body: (a) Three-dimensional model; (b) The top view; (c) The side view; (d) The rear view.

Figure 2.
The comparison of the aerodynamic heat flux (qw) between numerical data and experimental data in [26].
Figure 2.
The comparison of the aerodynamic heat flux (qw) between numerical data and experimental data in [26].

Figure 3.
Grid independence verification of numerical calculation in this study.

Figure 4.
Isothermal distribution of leeward side at Ma 3.

Figure 5.
Isothermal distribution of leeward side at Ma 4.

Figure 6.
Isothermal distribution of leeward side at Ma 5.

Figure 7.
Variation trend of wall temperature along x/L at the axis of the aircraft and its maximum temperature difference.
Figure 7.
Variation trend of wall temperature along x/L at the axis of the aircraft and its maximum temperature difference.

Figure 8.
The average value of relative temperature coefficient (rt) distribution on leeward side under all flight conditions: (a) the side view of aircraft; (b) the top view of aircraft.
Figure 8.
The average value of relative temperature coefficient (rt) distribution on leeward side under all flight conditions: (a) the side view of aircraft; (b) the top view of aircraft.

Figure 9.
The maximum dispersion degree of relative temperature coefficient on leeward side considering all flight conditions: (a) the side view of aircraft; (b) the top view of aircraft.
Figure 9.
The maximum dispersion degree of relative temperature coefficient on leeward side considering all flight conditions: (a) the side view of aircraft; (b) the top view of aircraft.

Figure 10.
The maximum differential value of relative temperature coefficient with different angles of attack: (a) the side view of aircraft; (b) the top view of aircraft.
Figure 10.
The maximum differential value of relative temperature coefficient with different angles of attack: (a) the side view of aircraft; (b) the top view of aircraft.

Figure 11.
The maximum differential value of relative temperature coefficient with different altitude: (a) the side view of aircraft; (b) the top view of aircraft.
Figure 11.
The maximum differential value of relative temperature coefficient with different altitude: (a) the side view of aircraft; (b) the top view of aircraft.

Figure 12.
The maximum differential value of relative temperature coefficient with different Mach number: (a) the side view of aircraft; (b) the top view of aircraft.
Figure 12.
The maximum differential value of relative temperature coefficient with different Mach number: (a) the side view of aircraft; (b) the top view of aircraft.

Figure 13.
The heat equilibrium temperature changes with the heat dissipation capacity Q at the low-temperature region along x/L: (a) Ma 3; (b) Ma 4; (c) Ma 5.
Figure 13.
The heat equilibrium temperature changes with the heat dissipation capacity Q at the low-temperature region along x/L: (a) Ma 3; (b) Ma 4; (c) Ma 5.

Figure 14.
Variation trend of convective heat transfer coefficient (h) with heat dissipation capacity (Q) along x direction at the low-temperature region.
Figure 14.
Variation trend of convective heat transfer coefficient (h) with heat dissipation capacity (Q) along x direction at the low-temperature region.


Table 1.
The flight conditions.
| Mach Number | Ma | 3, 4, 5 |
| Altitude | H/km | 18, 25, 35 |
| Angle of Attack | AOA/° | −10, −5, 0, 5, 10 |
Table 2.
Heat dissipation capacity (Q) of the low-temperature region with the highest wall temperature (Tw,max) as thermal.
Table 2.
Heat dissipation capacity (Q) of the low-temperature region with the highest wall temperature (Tw,max) as thermal.
| Ma | Tw,max (K) | Q (kW/m2) |
|---|---|---|
| 3 | 636.9 | 30 |
| 4 | 1038.57 | 90 |
| 5 | 1592.03 | 200 |
Publisher’s Note: MDPI stays neutral with regard to jurisdictional claims in published maps and institutional affiliations. |
© 2021 by the authors. Licensee MDPI, Basel, Switzerland. This article is an open access article distributed under the terms and conditions of the Creative Commons Attribution (CC BY) license (https://creativecommons.org/licenses/by/4.0/).
Share and Cite
MDPI and ACS Style
Jiang, X.; Liu, M.; Wu, H.; Zheng, Y.; Zhuang, J. Numerical Study on Low-Temperature Region as Heat Sink and Its Heat Dissipation Capacity for Hypersonic Vehicle. Aerospace 2021, 8, 238. https://doi.org/10.3390/aerospace8090238
AMA Style
Jiang X, Liu M, Wu H, Zheng Y, Zhuang J. Numerical Study on Low-Temperature Region as Heat Sink and Its Heat Dissipation Capacity for Hypersonic Vehicle. Aerospace. 2021; 8(9):238. https://doi.org/10.3390/aerospace8090238
Chicago/Turabian StyleJiang, Xinying, Meng Liu, Hao Wu, Yonggui Zheng, and Junjun Zhuang. 2021. "Numerical Study on Low-Temperature Region as Heat Sink and Its Heat Dissipation Capacity for Hypersonic Vehicle" Aerospace 8, no. 9: 238. https://doi.org/10.3390/aerospace8090238
Note that from the first issue of 2016, this journal uses article numbers instead of page numbers. See further details here.