Article

Influence of Novel Airframe Technologies on the Feasibility of Fully-Electric Regional Aviation

Institute of Aircraft Design and Lightweight Structures, Technical University Braunschweig, 38106 Braunschweig, Germany
*
Authors to whom correspondence should be addressed.
Aerospace 2021, 8(6), 163; https://doi.org/10.3390/aerospace8060163
Submission received: 3 May 2021 / Revised: 25 May 2021 / Accepted: 4 June 2021 / Published: 10 June 2021
(This article belongs to the Special Issue Aircraft Design (SI-3/2021))

Abstract

:
The feasibility of regional electric aviation to reduce environmental impact highly depends on technological advancements of energy storage techniques, available battery energy density, and high-power electric motor technologies. However, novel airframe technologies also strongly affect the feasibility of a regional electric aircraft. In this paper, the influence of novel technologies on the feasibility of regional electric aviation was investigated. Three game-changing technologies were applied to a novel all-electric regional aircraft: active flow control, active load alleviation, and novel materials and structure concepts. Initial conceptual design and mission analysis of the aircraft was performed using the aircraft design framework SUAVE, and the sensitivity of the most important technologies on the aircraft characteristics and performance were studied. Obtained results were compared against a reference ATR-72 aircraft. Results showed that an all-electric aircraft with airframe technologies might be designed with the maximum take-off weight increase of 50% starting from the battery pack energy density of 700 Wh/kg. The overall emission level of an all-electric aircraft with novel technologies is reduced by 81% compared to the ATR-72. On the other hand, novel technologies do not contribute to the reduction in Direct Operating Costs (DOC) starting from 700 Wh/kg if compared to an all-electric aircraft without technologies. An increase in DOC ranges from 43% to 30% depending on the battery energy density which creates a significant market obstacle for such type of airplanes. In addition, the aircraft shows high levels of energy consumption which concerns its energy efficiency. Finally, the sensitivity of DOC to novel technologies and sensitivities of aircraft characteristics to each technology were assessed.

Graphical Abstract

1. Introduction

Significant climate changes and potential environmental impact due to increased transportation in the near future have motivated many industries to focus on reducing CO2 and NOx emissions. As a major transportation method, the aviation industry also follows the trend to reduce the emission of new generations of aircraft. Improvements in airframe and engine technologies increase aircraft efficiency and reduce their emission. However, a potential increase in air transportation may still lead to an increase in overall CO2 and NOx emissions. Under Flightpath 2050 [1], The European Commission has set a future challenge for the new generation of aircraft to reduce their total emission. 
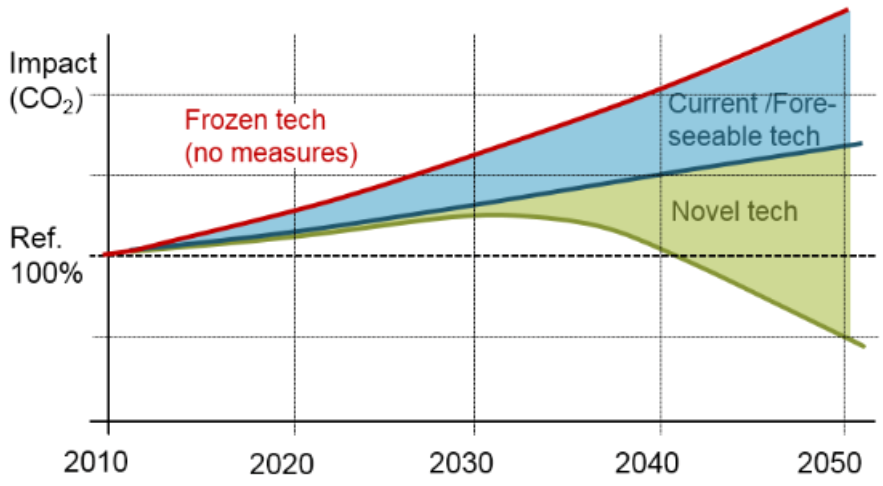
Figure 1 shows three schematic trends: if no advancements in aircraft technologies are present, if currently feasible technology advancements are achieved, and if novel technologies are introduced. This challenge leads to developing alternative environmentally-friendly energy sources as one of the main solutions for environmental impact reduction. Aircraft electrification has become one of the most popular approaches to reduce aircraft emissions. Today, many companies work in various directions to make electric flights available: improve battery energy capacity, modify and develop new propulsion systems, and introduce new aircraft configurations more applicable for future electrification.
At the moment, research is highly focused on hybrid- and all-electric propulsion systems and aircraft configurations to reduce the environmental impact produced by aircraft. Friedrich introduced a simulation technique for a single-seat hybrid-electric demonstrator, designed the aircraft, and performed a scaling analysis to determine a large fuel savings impact for the small- and mid-scale sector of aircraft [2]. Hamilton investigated the effect of hybrid-electric aircraft from the operational perspective to reach an optimal aircraft operation with battery energy density constraints [3]. A lot of work is also dedicated to the introduction of distributed electric propulsion (DEP) energy networks and aircraft concepts featuring DEP. Kim summarized major contributions towards the development of DEP aircraft and relative technologies [4]. Finger focused on sizing methodologies, and aircraft design of future general aviation aircraft that could be not only hybrid-electric but also fully electric [5,6,7]. De Vries also developed initial sizing methodologies for hybrid-electric aircraft for conceptual aircraft design but introduced effects of DEP at early conceptual design stages [8,9]. Pornet also introduced a sizing methodology for hybrid-electric aircraft and compared performance between the conventional reference aircraft and its hybrid version [10]. Sgueglia introduced an MDO framework for hybrid-electric aircraft with coupled derivatives and performed various optimization analyses to demonstrate the capabilities of the framework [11]. The work of Hepperle [12] addressed the potentials and limitations of all-electric aircraft specifically and introduced aircraft modifications that could potentially improve the aircraft performance at given battery energy densities. The ultimate goal of aircraft electrification is to achieve a fully-electric flight at adequate aircraft weight characteristics to maximize the emission reduction at the aircraft level. However, the availability of all-electric aircraft is limited to the General Aviation sector due to low battery energy density compared to the Jet-A fuel and relatively low maximum power capabilities of modern electric motors. Multiple all-electric concepts have already been introduced or are being developed at the moment. From existing airplanes, Pipistrel has already certified a twin-seat all-electric aircraft that has a maximum speed of 185 km/h and a maximum range of 139 km [13]. Bye Aerospace is currently performing flight tests on a one-seat general aviation aircraft that will be certified under the FAR Part 23 category. The eFlyer has a maximum cruise speed of 250 km/h and endurance of three hours [14]. In 2016, Siemens tested an all-electric energy network by retrofitting the Extra 300 aerobatic aircraft and set two world records [15]. The Equation Aircraft has also demonstrated an all-electric twin-seat amphibious aircraft with the empennage-mounted engine that can fly up to 240 km/h and up to 200 km [16] Airbus has also developed several versions of an experimental all-electric E-fan aircraft to test the capabilities of an all-electric aircraft [17]. The E-Fan concept had multiple versions, from a technology demonstrator to a production variant. MagniX has introduced an all-electric propulsion system and first retrofitted De Havilland Beaver and then 208B Cessna Grand Caravan. The electrified Caravan became the largest all-electric airplane until today [18]. It must be noted that the list of existing all-electric aircraft companies is incomplete and more companies exist and are at different design stages.
To achieve all-electric regional aviation faster, not only the energy source and propulsion system technologies must be improved, but also advanced airframe technologies need to be considered. Such novel technologies may significantly increase the aircraft performance characteristics and overall efficiency that will enable earlier integration of all-electric commercial aircraft into the market before. Liu introduced initial estimations of the impact of novel technologies for a range of aircraft from the short-range to the long-range [19]. Results showed that novel airframe technologies may significantly improve aircraft energy efficiency.
Under the Excellence Cluster Se
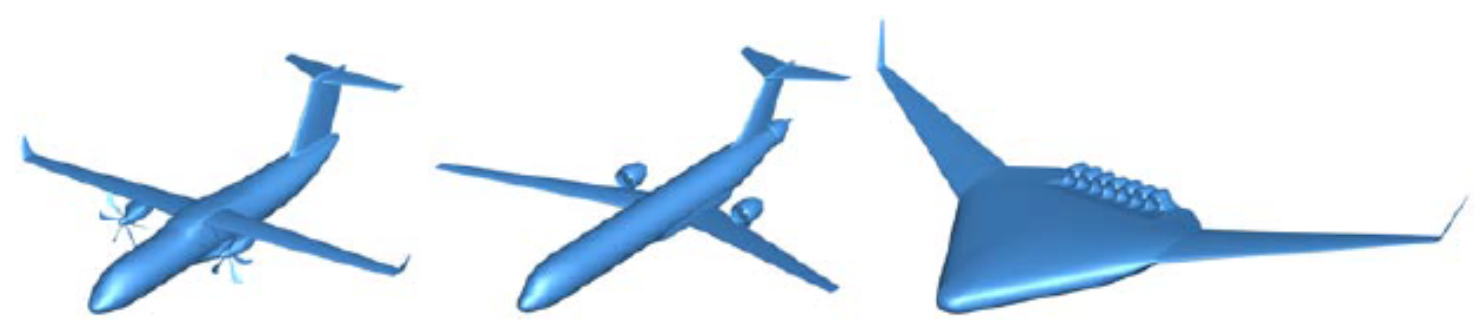
2A (Sustainable and Energy Efficient Aviation), three energy-efficient aircraft are to be designed to cover the majority of commercial aircraft operations. Figure 2 shows three sample new energy-efficient airplanes: a short-range propeller aircraft that shall be applicable to the ATR-72, the medium-range aircraft having similar mission requirements to the Airbus A320, and the long-range aircraft to cover ranges similar to the Boeing B777.
The initial cluster requirement for the short-range aircraft was to investigate the feasibility and availability of an all-electric short-range aircraft if novel airframe and propulsion technologies are introduced. A few novel technologies have been considered for the design of future regional aircraft. Hybrid laminar flow control (HLFC), load alleviation, and advanced materials and structure concepts. In addition, high-temperature superconducting motors and high-energy capacity batteries have been considered for the present research. An aircraft with similar top-level requirements as ATR-72 is designed considering the mentioned technologies and a battery-based full electric propulsion system.
The present work is divided into multiple sections. Section 2 describes novel technologies implemented in the new short-range aircraft. Section 3 describes methodologies, models, assumptions, and software used to perform novel technology assessments to design the aircraft. Section 4 describes the aircraft’s top-level requirements (TLRs). Section 5 describes the aircraft concept selection and its initial sizing. Section 6 presents multidisciplinary design optimization studies of the SE2A aircraft to refine the design and make important design decisions. Finally, Section 7 assesses the influence of novel technologies on aircraft availability and the strength of each technology impact.

2. Novel Airframe and Propulsion Technologies

2.1. Hybrid Laminar Flow Control

The generation and extension of laminar flow over the aircraft surface significantly affect the overall aircraft drag, reducing aircraft weights, fuel burn, and operating costs. Preliminary estimations of an aircraft that features extended laminar flow along the wing, empennage, and fuselage demonstrated significant reduction (up to 50%) in overall drag and proved the importance of laminar flow control (LFC) [20]. Figure 3 shows the effects of the new wing design featuring the LFC and compares overall drag to the reference aircraft.
However, natural laminar flow (NLF) is limited along the shape, so to extend it even more, hybrid laminar flow control (HLFC) is required: the laminar boundary layer is not only extended using NLF design but also using the active suction technology. In this technology, the air is sucked from the aircraft’s outer surface to delay the transition of the boundary layer and enable substantially higher percent laminarization compared to conventional surfaces. The skin of each aircraft component is split into two segments: a porous sheet and an inner sheet that supports the outer sheet. The inner sheet has orifices that suck the air from the boundary layer and delay transition. In each chamber, an individual pressure is adjusted by the throttle orifices, so that the pressure difference between the outside and the chamber delivers the locally desired amount of mass flow through the surface. Figure 4 shows a schematic image of the skin layout and the HLFC system for a wing section. The applied technology in this project is based on [20,21], which describes numerical approaches with active laminar flow control and also describes current progress in this technology.

2.2. Load Alleviation

Load alleviation introduces various techniques to reduce the bending moment experienced by the aircraft and that have a passive or active nature. Reduction of maximum bending moment enables the design of lighter wings for lower limit load factors, which will improve aircraft fuel efficiency.
Passive load alleviation solutions consider nonlinear stiffness material design [22], viscoelastic damping design [23], new structural concepts [24,25], and local morphing structures [22]. Nonlinear stiffness materials may improve the load distribution on the wing under low load cases (0.5 g to 1.5 g) and improve performance efficiency at those load cases. Finally, both aeroelastic tailoring and local morphing structures aim to extend the aeroelastic design space. Morphing is considered into two scenarios: deliberate structural non-linearity that affects the wing deformation and reduces effective angle-of-attack of the wing section under the load and change in airfoil shape to achieve load reduction [22].
The wing active load alleviation uses different types of flow control over the wing to achieve a more favorable wing load distribution and reduce the wing bending moment. Previously, researchers have approached the design of active load alleviation systems in different ways. Rossow et al. [26] investigated the feasibility of an aircraft featuring load alleviation technologies; Sun et al. [27] looked at active load alleviation from the control system perspective; and Zing et al. [28] demonstrated the experimental results of the high aspect-ratio wing wind-tunnel test with active load alleviation while using piezoelectric control. The work of Fezans et al. focused on novel sensors and control systems technologies to enable rapid and robust active load alleviation [29,30,31,32]. Finally, active load alleviation could also be reached by fluidic or micro-mechanical flow actuators that change the load distribution along the wing and reduce the bending moment [33].

2.3. New Materials and Structure Concepts

Novel structural concepts and materials are being developed to improve the aircraft structure in terms of stiffness and weight. Bishara et al. [34] describe advanced structural design with the integration of active flow control, which is directly applicable to the presented research. Under the excellence cluster, the reduction in the airframe weight is assumed to be reached by application of CFRP thin ply laminates. In addition, new structural concepts must be applied to satisfy HLFC requirements [22].

2.4. High-Power Superconducting Motors

One of the major problems in hybrid- and all-electric commercial aircraft deals with limitations of maximum available electric motor power. The motor resistance increases rapidly with the increase of its power, which rapidly diminishes the engine efficiency. One solution to preserve the motor efficiency and even increase it is to use superconducting motors. Such motors can be synchronous, trapped flux, and fully superconducting. They may also operate at low and high temperatures. To maintain required temperatures inside the motor, a cryogenic cooling system is required. High-temperature superconducting (HTS) motors can achieve high power-to-weight ratios with high power densities without major weight losses compared to low-temperature superconducting motors. Ref. [35] provides a descriptive survey of HTS motors and their future trends. For the present research, a high-temperature, fully superconducting motor was considered.

2.5. High Energy Capacity Batteries

Currently, the gravimetric energy density of modern batteries generally does not exceed 300 Wh/kg [36]. Such energy densities may be suitable for ultra-light or limited general aviation all-electric aircraft. However, they are insufficient to enable not only all-electric aircraft of the size of ATR-42 and larger, but even the hybrid-electric version of such aircraft is infeasible at the moment since the energy capacities are around 50 times less compared to kerosene-based fuels. On the other hand, the research of high-capacity batteries makes progress. The latest laboratory research demonstrated battery energy capacities of 800 Wh/kg on the cell level and 500 Wh/kg on the pack level for military applications [36]. In addition, the National Academy of Sciences predicts battery pack energy density to achieve 400–600 Wh/kg at Technology Readiness Level (TRL) 6 in the next 20 years (roughly, by 2035) and be commercially available in 30 years [37]. If the prediction becomes real and the linear trend remains, then batteries may reach TRL 6 with energy densities of 550–850 Wh/kg and be commercially available by 2060. To investigate potential scenarios for the far future and examine battery energy impact on the aircraft feasibility, it is assumed that the pack energy densities may range between 500 and 1100 Wh/kg.

3. Implementation of Novel Technologies in Aircraft Analysis and Design

3.1. Initial Aircraft Sizing

The conceptual design was performed using various tools. OpenVSP [38] and CATIA were used for the aircraft geometric modeling, and SUAVE [39] was used for more defined aircraft sizing, performance, and mission analysis. To have more capabilities from the aircraft performance analysis standpoint, SUAVE was extended to have classical performance analysis methods used in [40,41,42,43].
The aircraft sizing within SUAVE is performed iteratively. First, initial geometric specifications based on TRLs and any available information are input into the SUAVE. The information includes the initial wing planform, its section properties, flaps characteristics, empennage and fuselage geometries, the definition of the propulsion system, and all required components such as batteries, gearboxes, power management systems (PMAD), cables, etc. Finally, initial guesses of aircraft weight are input. Then, the first iteration of constraint analysis using equations provided by Gudmundsson [41] is performed. The constraint diagram block includes rapid estimation methods for gas-turbine, piston, and electric aircraft power lapse with altitude and has options to either estimate required aerodynamic properties for the constraint diagram or have them as fixed inputs based on historical trends. Based on the design point selection, the wing loading and power-to-weight ratio are used to run the SUAVE mission analyses to estimate the aircraft performance and its required weight. Then, obtained maximum take-off mass (MTOM) is compared to the initial guess and updated if the tolerance is not reached. In addition, parameters such as the minimum drag coefficient ( C D m i n ), Oswald efficiency (e), and maximum lift coefficient ( C L m a x ) for clean and flapped configurations are input into the constraint diagram again to update all constraint curves and run the loop again. When the tolerance is reached, the program moves to the aircraft performance block to obtain performance plots for the given aircraft. Particular care was taken to size the wing flaps to meet take-off and landing field length requirements. Methods of Torenbeek [42] and Roskam [43] were implemented within SUAVE to analyze various types of leading- and trailing-edge devices. The empennage sizing within SUAVE is based on the fixed tail volume ratio and then updated and corrected separately based on the desired CG envelope. Performance analyses within SUAVE included take-off, all engines operative (AEO), and one engine inoperative (OEI) climb, cruise, descent, and landing. Figure 5 shows the sizing process within SUAVE.

3.2. Energy Network

In the SUAVE analysis framework, a propeller electric energy network with HTS motors was implemented. Figure 6 shows the all-electric energy network layout.
Propeller modeling was performed using the cubic spline method described by Gudmundsson [41]. Propeller thrust can be described with a cubic spline based on design operating conditions. The thrust is defined by:
T = A V 3 + B V 2 + C V + D
where A , B , C , D are the coefficients required to fit the curve accurately. To obtain those coefficients, a system of four equations is established. The first equation is the equation for the static thrust. The second equation is derived for the cruise speed and the desired propeller efficiency. The third equation is the derivative of the curve at the cruise speed, which is equal to zero. Finally, the last equation is derived for the desired maximum cruise speed. The final system of equations for the thrust as a function of cruise speed becomes:
0 0 0 1 V C 3 V C 2 V C 1 3 V C 2 2 V C 1 0 V H C 3 V H 2 V H 1 A B C D T s t a t i c T C η p r o p P s h / V C 2 T H
Solving Equation (2), a general thrust expression is found, which then is used to find the propulsive efficiency of the propeller. Then, knowing efficiencies of components of the energy network shown in Figure 6, the total power at the battery is found to be used during the SUAVE mission analysis.
The propeller was sized using a combination of propeller diameter trends provided by [44] and the sizing method described by Torenbeek [42] where the required propeller RPM depends on the tip Mach number was used to estimate the maximum propeller RPM.
The assumption of the battery gravimetric energy density remains one of the most influential assumptions for aircraft design. Since the availability of a full-electric regional aircraft is challenging to achieve, an optimistic scenario of the energy density at TRL 6 was assumed. This way, if the aircraft is feasible, the task will be to investigate more realistic bounds of minimum energy densities. Otherwise, the availability of the all-electric airplane is highly unlikely. Consequently, the average optimistic pack energy density ( ω B ) of 700 Wh/kg was assumed. To ensure safe battery operation, the state-of-charge of 20% was assumed.
High-temperature, fully superconducting motors were used for the airplane since the required power frequently reaches the order of Megawatts. All superconducting components also have cooling systems to enable desired operating temperatures. The cooling system power loss was estimated using the survey provided in [45] and assuming the Carnot efficiency ( ϵ ) of 30%. Table 1 summarizes all assumptions considered for the gas turbine engine and an electric propulsion network.

3.3. Weights Estimation

Weights estimation analysis was performed using the FLOPS [47] method programmed within SUAVE. To improve the accuracy of high aspect ratio wing weight estimation, FLOPS was coupled with the physics-based wing weight estimation tool EMWET [48]. The EMWET analysis was performed for a metal wing structure and was corrected by a factor based on the composite wing technology level. Loads used for the EMWET weight estimation were obtained within SUAVE using coupling with AVL [49] Vortex-Lattice method software. In the case where the aircraft wing span reaches Class-C airport regulation limits, an additional weight penalty function due to the wing folding was introduced, so the aircraft can maneuver at the airport and maximize its flight efficiency. The estimation method is based on [50] and accounts for the weight of the insert, the folding mechanism, and the pin to fix the wing. The wing weight corrected by the weight of the folding mechanism is defined by
m w f o l d = m w n o n f o l d ( 1 + m ¯ f o l d i n s + m ¯ f o l d m e c h + m ¯ f o l d p i n )
where m ¯ w f o l d is the mass of the wing with the folding mechanism, m ¯ w n o n f o l d is the mass ratio without the folding mechanism, m ¯ i n s is the mass ratio of the folding insert, m ¯ f o l d m e c h is the mass ratio of the folding mechanism inside the insert, and m ¯ f o l d p i n is the mass ratio of the folding pin. The insert mass ratio was defined based on the curve-fitting of three separate formulations available from [50]: folding at 32%, 48%, and 64% of the span
m ¯ f o l d i n s =   0.24 ( m ¯ P W S 0.924 ) 2 0.007 , 32 %   span 0.45 ( m ¯ P W S 0.916 ) 2 0.02 , 48 %   span 0.84 ( m ¯ P W S 0.98 ) 2 0.107 , 64 %   span
where m ¯ P W S is the mass ratio of the section outboard of the folding pivot point defined by
m ¯ P W S ( y ) = ( C y + C t ) ( 0.5 b y ) ( t y C y + t t C t ) ( C r + C t ) ( t r C r + t t C t ) b
where C is the chord length, b is the wing span, t is the wing thickness-to-chord ratio, and y is the spanwise location of the folding insert. Subscripts r, t, and y correspond to the wing root, tip, and the folding insert.
Finally, folding mechanism and pin masses are defined by
m ¯ f o l d m e c h = 3.76 ( m ¯ P W S 0.2 ) 2 + 0.08
m ¯ p i n m e c h = 0.6 ( m ¯ P W S 0.2 ) 2 + 0.02
Figure 7 shows the wing weight penalty as a function of the wing joint location along the semi-span.
HTS motor weight estimation was based on relations defined by Stuckl [35] and account for both the motor and the cooling system weight. The motor power-to-weight ratio is defined by
P W = 2.63 ( P M o t ) 0.277
where P M o t is the motor power in kW and the power-to-weight ratio P / W is defined in kW/kg.
The cryogenic cooling system weight is defined by
m c o o l i n g = 27.5 P l o s s · e 1.225 ( log 10 ( P l o s s ) )
where P l o s s is the cooling system input power loss in kW and m c o o l i n g is the cooling system weight in kg.
Propeller weight was estimated using a relation described in [51] where the propeller weight depends on the number of blades, the activity factor, the motor power, propeller maximum RPM, and its material. A composite propeller with six blades was considered for the present design.
The gearbox weight was estimated using relations provided by [52] and is defined by
m g e a r b o x = K P g e a r b o x 0.76 · R P M m o t o r 0.13 R P M p r o p e l l e r 0.89
where P is the power at the gearbox, K is the gearbox technology factor equal to 26 for future gearboxes, R P M m o t o r is the motor power assumed at 4800 RPM, the R P M m o t o r , and the m g e a r b o x is the gearbox mass in kg.

3.4. Novel Airframe Technologies Assumptions

At the conceptual design stage, novel technologies have been integrated into the design process in terms of coefficients and correction factors. Laminar flow control is estimated by modifying the flow transition location along the wing profile. The desired goal within the SE2A for the flow transition is set to 70% for the wing if no disturbances such as the propeller wake or the location of other components is present. Otherwise, specific transition assumptions are prescribed. Wing folding also affects the application of the HLFC. The folding location has four general locations. If the wingspan is less than 36 m (Class C airport limitation), then no folding is applied, and the wing features the HLFC along the complete span. If the wingspan is longer than 36 m but not longer than 110% of the Part C requirement, then the tip folding is applied, the wing has HLFC until the wing folding location, and the folding tips feature natural laminar flow (NLF). If the folding location occurs at any position which splits the aileron, then the folding position is automatically moved to the position where the flap ends and the aileron start, so the aileron design is significantly simplified. The portion of the wing after the folding joint does not feature HLFC and only has NLF. Finally, if the wingspan is such that the aileron can be located at the folding portion of the wing, the folding joint is fixed to 18 m, and the flap is limited to the outboard position of 18 m. HLFC is also applied before the folding joint. The transition location of the NLF portion of the wing is assumed at 45% [53]. The fuselage laminar flow shall be preserved until the wing-body fairing, which is specified based on the wing position, which is determined by the center-of-gravity (CG) envelope and the empennage characteristics. The active load alleviation effect is estimated by reducing the aircraft limit load factor from the required 2.5 [54] to 2.0. For the load alleviation, it is also assumed that regulations of CS-25 may allow lower limit loads if sufficient maturity of the technology is reached. Advanced structure configurations and material effects are assumed to reduce the empty weight by 19% compared to the metal structure.

4. Top-Level Requirements of the SE2A SR Aircraft

Top-level requirements have been set to match the reference ATR-72 aircraft. Table 2 shows the summary of the SE2A SR TLRs.
Figure 8 shows a mission profile considered for the design. The mission includes the main flight segment, where the airplane cruises at 7300 m, and the required reserve segment which consists of the divert segment and the 30 min hold. In addition, 5% battery energy contingency was assumed after the reserve mission.

5. Initial Aircraft Design

Concept Selection

In this work, two concepts were considered for the initial aircraft design. The first concept was the top-wing conventional configuration with wing-mounted engines. The battery was split between the fuselage belly and the engine pylons: one segment was located before the landing gear, and the other one was located after the gear. The battery distribution was based on the CG envelope to satisfy all possible passenger loading cases. Battery modules feature a ’quick-swap mechanism, so a mechanic can switch batteries between the flights using a mechanism similar to a high loader. The second configuration is the low-wing configuration with aft-mounted engines. Such configuration, unlike the first configuration, has a fully clear wing which enables laminar flow control along the entire wingspan. Engines are mounted at the aft of the fuselage. The vertical location of the engines approached their maximum to minimize the adverse effect from the wing at high angles of attack. Batteries also feature the ’quick-swap mechanism. Figure 9 shows the described configurations schematically modeled in OpenVSP.
Each configuration has its assumptions, features, and limitations. Assumptions are based on research goals of the SE2A research groups that focus on the research and development of each technology separately. The first concept has a limited range of laminar flow along the wingspan. The region which is subjected to the propeller wash is assumed to have a fully turbulent flow. The remaining wing portion has 70% laminar flow due to the application of the HLFC. To have a favorable CG envelope, the location of the wing was set to 43% of the fuselage length. The second concept has limited laminar flow control before the landing gear at the wing pressure side. The remaining pressure side and the suction side are 70% laminar. It was also possible to shift the wing further aft to 53% of the fuselage length so that extra 10% could be laminarized compared to the conventional configuration.
Comparison among the concepts was performed using the sizing methodology as was described in Section 2. Due to the presence of various novel technologies and, as a consequence, increased aircraft development, and operating costs, the concept selection was based on the magnitude of Direct Operating Costs (DOC). DOC was calculated using the method presented in [55] where the DOC is divided into energy, maintenance, capital, crew costs, and fees. 2121 flight cycles per year were assumed for both aircraft. For the battery pack, 2000 cycles were assumed. The electricity price was taken from [56] for the year 2050 and is equal to 0.118 EUR/kWh that year. The airframe price was assumed similar to the ATR-72 [55] and is equal to 1595 EUR/kg. The remaining parameters for all required cost components were taken from [55]. A major concern is related to the modification of DOC due to novel technologies. It is unknown how much the DOC will increase due to an early stage of all technologies presented in this work. However, the complexity related to the introduction of the porous skin, the suction system and its structure, which is subject to maintenance complexities, NLF front portion, integration of various load alleviation technologies, and the structure to support the wing laminarization and load alleviation will increase maintenance costs by an order of magnitude. As an optimistic assumption, a scaling factor of 2 was used for the maintenance DOC gain. After the introduction of the maintenance DOC gain, the total DOC formulation becomes
D O C T o t a l = D O C E n e r g y + D O C C r e w + k g D O C M a + D O C C a p + D O C F e e s
where D O C E n e r g y are costs of energy, D O C C r e w are crew costs, D O C M a are maintenance costs, D O C C a p are capital costs, D O C F e e s are costs of fees, and k g is the maintenance cost gain factor. Finally, all costs were calculated in 2020 EUR.
Due to the presence of an all-electric propulsion system, a conventional assumption of the best design point at the lowest power-to-weight ratio may not hold, as was previously shown by Finger [5] where the best design points were sensitive to the energy type of networks and could show points of minimum take-off or fuel weight at wing loadings larger than the one with minimum power-to-weight ratio. To ensure that a good initial guess for each concept is selected, an aspect ratio and wing loading trade study were performed using the initial sizing procedure described in Section 3. The procedure has multiple steps. First, the initial aircraft sizing is performed to find the design point corresponding to the maximum possible wing loading. Assuming that the selection of an arbitrary design point will not change the constraint diagram significantly, a set of sample wing loadings ranging from 60% of the maximum wing loading to the maximum possible wing loading were selected. Figure 10 shows the sweep of possible design points along the constraint diagram boundary. The aircraft is then sized for each selected wing loading using SUAVE, and the DOC is estimated. This approach is repeated for a selected set of aspect ratios to determine the combination of the wing loading and aspect ratio that may give the lowest desired aircraft characteristics important for the decision making. A sample set of weights and DOC for a low-wing configuration as a function of the wing loading and the AR is shown in Figure 11. Multiple trends can be observed from the Figure 11. First of all, the battery weight generally reduces with the AR, while the operating empty weight (OEW) and maximum take-off mass (MTOM) trends do not follow such trends. Moreover, DOC and weights show discontinuities for some aspect ratios and particular wing loadings. Points of the curve discontinuity correspond to the folding penalty, which is introduced starting from a specific wing loading.
Table 3 shows the summary of the high-wing and the low-wing configurations that have the lowest DOC. Based on the given results, the high-wing configuration has larger weights due to more battery required to complete the mission with less laminar flow. Consequently, the airframe with less possible drag is more favorable. Consequently, the low-wing configuration is more efficient from the performance standpoint.
Due to an unconventional configuration of the low-wing configuration, a concern related to the aircraft stability and control may occur. Coe [57] has investigated the stability and control characteristics of an aircraft with aft-mounted propeller engines. Results demonstrated a reduction of longitudinal stability for this configuration due to the propeller–pylon interaction. However, minor destabilization can be compensated by a minor increase of the horizontal tail. Lateral stability is not significantly affected by aft-mounted propellers and may improve directional control due to the boundary layer control introduced by the propeller slipstream. Riley [58] also provided a detailed description of business/commuter turboprop aircraft configuration with aft engines. Although the configuration is a twin-pusher, general information about handling qualities during the approach can be extracted. Generally, the aircraft can have acceptable handling qualities and can be certified, but more care to achieve proper dynamic stability and desired handling characteristics may be required.

6. SE2A SR Design Refinement Using MDO

To refine the initial design, a set of multi-disciplinary design optimizations (MDO) were performed. The main goal of the refinement is to reduce the aircraft DOC further. Multiple cases were considered. The first MDO featured all prescribed assumptions. The second MDO assumed that no folding penalty is present to estimate the influence of the folding penalty of the aircraft. This case is used only as a comparative study to investigate the folding mechanism effect on the optimal design. Finally, a special case of battery weight minimization was calculated to investigate the reduction of the battery weight and increase of DOC with respect to the aircraft optimized for the DOC. This case also directly influences the aircraft CO2 emission.
Production of electricity also involves emission CO2 and other greenhouse gases, since modern electricity generation is not a product of renewable energy sources. A major portion of electricity today comes from fossil fuels, consequently, an all-electric aircraft cannot be considered as a zero-emission one. Since the goal of the study was to design and assess the aircraft from the environmental perspective as well as performance and costs, proper metrics of preliminary emission rates must be introduced. Scholz describes a rapid and useful procedure of comparing kerosene-based and battery-electric emission [59,60] to calculate the CO2 emission including additional factors for each energy source. For aircraft operating with kerosine-based fuels, additional chemicals other than CO2 contribute to the emission level. In addition, the altitude at which the emission happens plays an important role. To account for secondary effects, the equivalent CO2 emission level per flight can be described by
m C O 2 , e q = ( E I C O 2 f k m + E I N O x f k m C F m i d p o i n t , N O x + C F m i d p o i n t , A I C ) R k m
where f k m is the fuel flow per km, E I is the emission index for each species, C F is the characterization factor, and R k m is the range in km. The E I C O 2 is equal to 3.16 kg CO2 per kg fuel [60]. The E I N O x is found using the Boeing Method 2 [61] where the index is computed based on existing data from the ICAO Engine Emissions Databank [
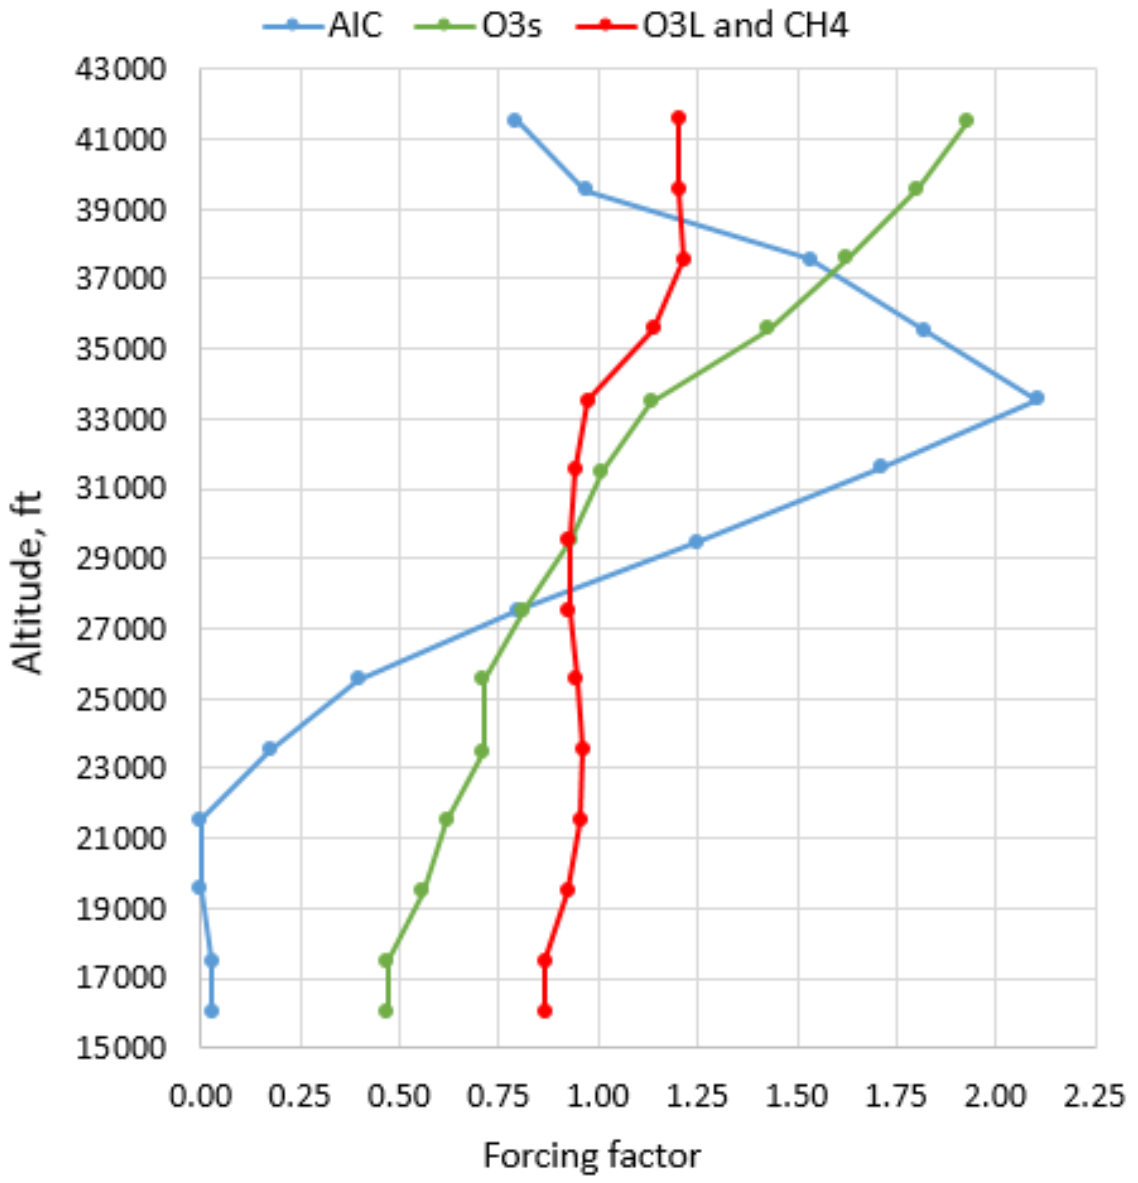
62] and is corrected with respect to the flight altitude. Characterization factors are calculated by
C F m i d p o i n t , N O x = S G T P O 3 s , 100 S G T P C O 2 , 100 s O 3 s + S G T P O 3 L , 100 S G T P C O 2 , 100 s O 3 L + S G T P C H 4 , 100 S G T P C O 2 , 100 s C H 4
C F m i d p o i n t , A I C = S G T P c o n t r a i l s , 100 S G T P C O 2 , 100 s c o n t r a i l s + S G T P c i r r u s , 100 S G T P C O 2 , 100 s c i r r u s
where S G T P is the sustained global temperature potential, summarized in Table 4 and s is the forcing factor which depends on the altitude and is shown in Figure 12 for each species.
The formulation given in Equation (12) was used for each flight segment of the reference ATR-72 and then added to obtain the total mission equivalent emission level. Segments with variable altitude such as climb and descent used average values of forcing factors s and emission index E I N O x . If the value of the forcing factor was for the altitude lower than the available data, the minimum value represented in the Figure 12 was used.
Battery emission, on the other hand, depends on the amount of energy used to charge them. The emission then depends on the share of fossil fuel to non-fossil fuel sources participating in the electricity production and the primary efficiency factor—the factor which describes the ratio between the energy required to produce electricity and the final output energy amount. Including all factors described above, the equivalent emission per flight becomes
m C O 2 , e q = E I C O 2 x f f k P E F m b a t C b a t η c h a r g e C J e t A
where x f f is the fossil fuel share ratio equal to 0.39 according to the forecast of 2050 [63], k P E F is the primary efficiency factor assumed equal to 2 [59], η c h a r g e is the battery charging efficiency equal to 0.9 [59], and C b a t and C J e t A are battery and Jet-A fuel energy densities, respectively. From Equation (15), the CO2 emission is directly proportional to the battery mass, so the optimization for the minimum battery weight corresponds to the minimum emission case.
All problems have similar design variables and constraints, as shown in 
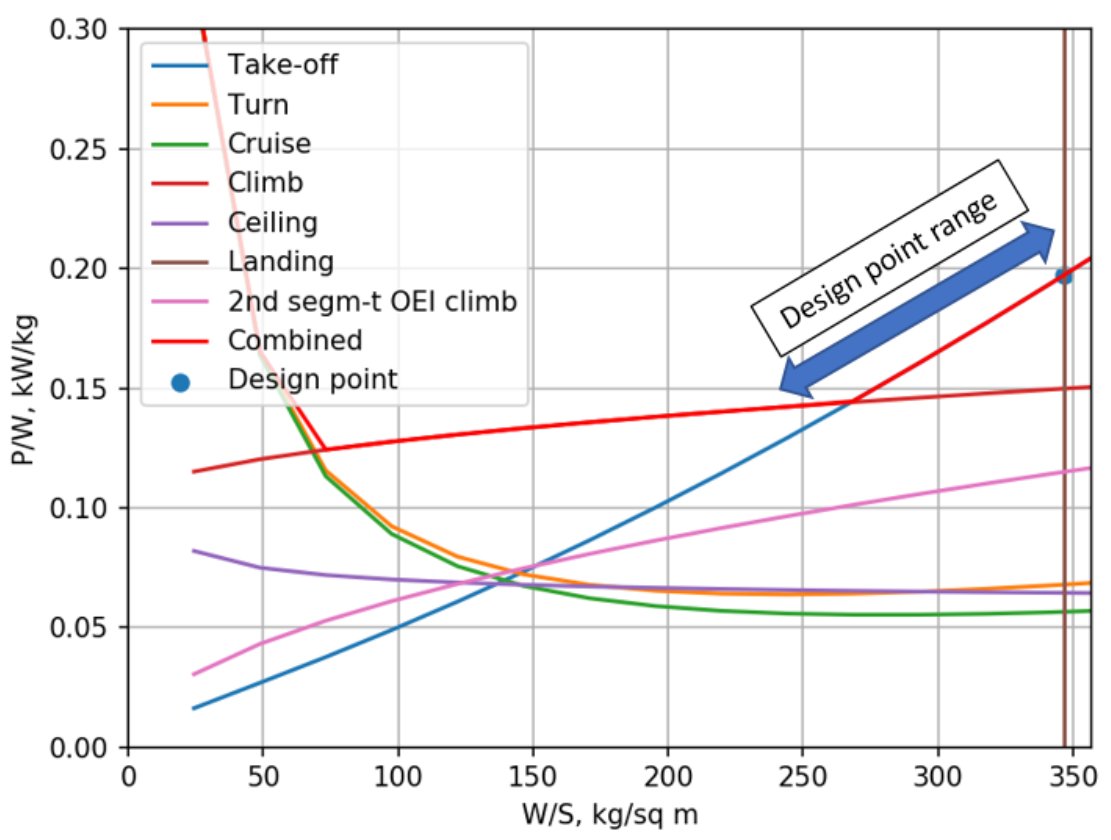
Table 5. Due to the application of new airframe technologies, requirements for the sea-level climb, take-off, and landing are more significant compared to cruise and OEI requirements, as shown in Figure 10. Such behavior occurs due to a substantial reduction of the cruise drag, which strongly diminishes the required cruise power. Consequently, optimization problem constraints can be limited to these three main performance metrics. Additional geometric constraints of 51.8 m wingspan (similar to the wingspan of the NASA N+3 strut-braced wing concept [64]) and the wingtip of no larger than 1.4 m were introduced to limit further increase in the wing slenderness. Table 5 describes the formulation of the optimization problem. There, C r and C t are the wing root and tip chords, respectively, t / c is the wing thickness, and η m a x is the maximum throttle during the flight. To perform the MDO, SUAVE was coupled with MATLAB, and the Genetic algorithm was used to find optimal solutions.
To account for the constraints, the penalty function similar to the one defined in [65] was used. The penalty function is defined by
f p = μ ( y y c ) y y c γ
where y is the design variable, y c is the design variable constraint, μ is the unit step function equal to zero for y y c , and γ = 3 . With the introduction of the penalty function, the objective function becomes
f = f + i = 1 N f p
where N is the total number of design variables. Sixty species per generation were set to have sufficient population size without major accuracy losses. Take-off and landing constraints were calculated using physics-based time-dependent performance formulations presented in [41]. The climb power-to-weight ratio constraint was calculated using a similar formulation used for the constraint analysis.
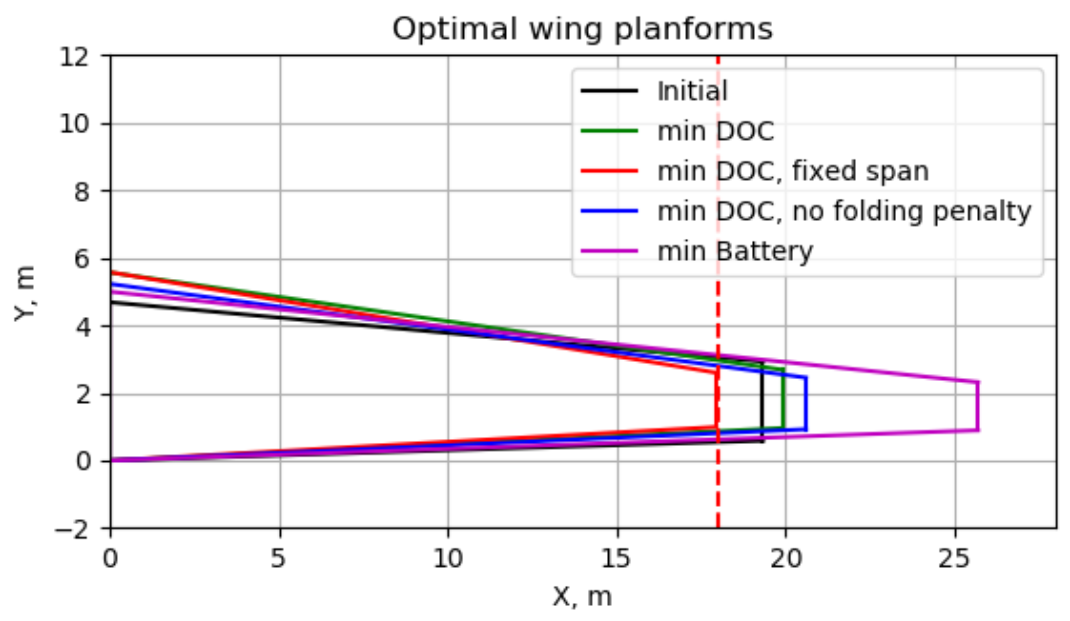
Figure 13 shows the aircraft planforms for each optimization problem and Table 6 summarizes important properties of each optimized configuration. Limiting constraints for each optimization were similar to the constraint diagram: the solution was trying to minimize the power-to-weight ratio which reached the constraint limit of either the climb or the take-off. In addition, the top-of-climb throttle constraint was an additional constraint which dominated the others.
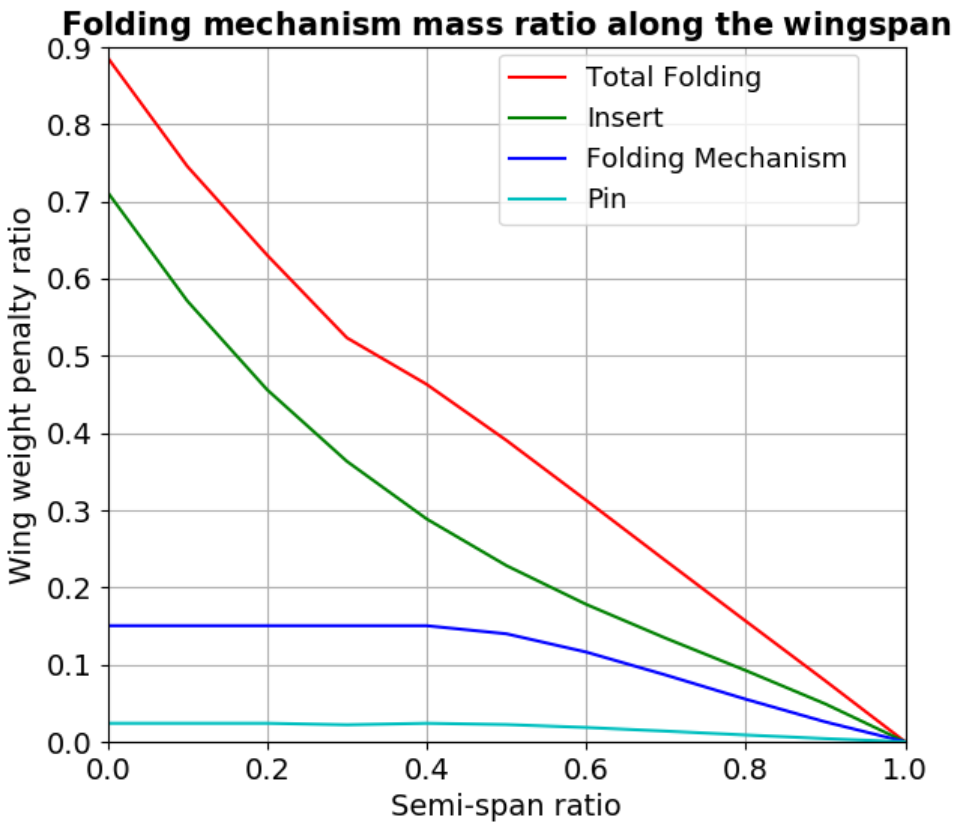
As shown in Table 6, the optimized aircraft with all imposed assumptions reduced all weights, slightly reduced the aspect ratio, increased the wingspan, reduced the taper ratio, and reduced the aircraft power-to-weight ratio. Minor differences in the field performance occurred. The DOC for the optimized aircraft reduced by 124 EUR/flight. In addition, the difference in emission between the initial and DOC-optimized designs is equal to 84 kg per flight which is not substantial. If the folding penalty is removed, then the wing has more freedom to increase its span and aspect ratio due to the absence of the folding weight penalty. The optimized aspect ratio increased by 1.23, the wingspan increased by 2.6 m compared to the initial design. However, the power-to-weight ratio increased due to a reduced wing planform area. All weights were further reduced compared to the aircraft configuration with the folding mechanism. The DOC was reduced by 206 EUR/flight compared to the initial configuration, which indicates a relatively strong effect of the folding mechanism on the aircraft. The emission level reduced by 201 kg compared to the initial design which is more substantial. Comparing the DOC optimal solutions with and without the folding mechanism, it becomes evident that wing folding affects the final design and cannot be neglected. If the battery minimization strategy is considered, then the wing planform approaches design limits. Due to a stronger reduction of the battery weight compared to the increase in the wing weight, minor reductions of the MTOM and empty weights are observed. Finally, DOC increased by 235 EUR/flight compared to the initial design or by 359 EUR/flight compared to the optimized configuration. The battery weight reduced by 2404 kg and 1883 kg compared to the initial and DOC-optimized aircraft, respectively. The emission level, however, reduced by 385 kg compared to the initial configuration. In addition, the wing span of the aircraft increases to 51.7 m and the folding portion from each side of the wing becomes 7.85 m. Such a large folding portion may affect the operational convenience at the airport and will make the aircraft taller when the wings are folded. That may create additional difficulties related to the aircraft storage.
If DOC and emission levels are compared against the reference aircraft, the increase in DOC demonstrates a substantial increase compared to the reference ATR-72. The most cost-effective aircraft version has 41% increase in DOC which is a substantial cost growth from the market standpoint. The DOC for the battery-optimal configuration increases by 46%. On the other hand, if emission levels are compared, the most DOC-efficient version has a reduction in equivalent CO2 emission of 83% compared to the ATR-72, and the battery-optimal configuration has 86% emission reduction. From the comparison, the emission level of the all-electric aircraft reduces substantially, but such reduction of the emission comes at a significant cost increase. Moreover, DOC shows more sensitivity with respect to the configuration compared to the emission level. To minimize costs as much as possible, the DOC-optimal configuration was selected for future analyses.
Observing the wingspan deviations from the Part C airport requirements of 36 m, aircraft configurations minimized for DOC did not show major increases in wingspans. Consequently, it is possible to design an aircraft that will have no folding mechanism and will not have a significant DOC penalty so that the wing design complexity may be reduced substantially. An additional MDO study with a fixed wingspan constraint was performed to investigate the sensitivity of DOC to the configuration with a fixed span of 36 m. Table 7 demonstrates a comparison between the initial design, the optimal design without the span constraint, the optimal aircraft with a constrained span, and a reference ATR-72 to compare optimal models to their reference.
The aircraft with a fixed span has a higher weight due to a restricted planform and, as a consequence, more battery is required for the mission. The battery weight increased by 1600 kg compared to the optimal design without the span constraint. The power-to-weight ratio also increased to satisfy the take-off requirement. However, the wing area is reduced, so it is less expensive to increase the motor power than increase the wing area. The DOC increased by 94 EUR/flight, which is not a large increase. At the same time, the wing has no folding mechanism and is easier to design and maintain. However, the emission level increases by a relatively small margin compared to the initial DOC-optimal configuration. At this moment, the configuration without folding is selected as the final decision.
The geometric summary of the selected aircraft is shown in Table 8. Single-slotted Fowler flaps were used for this aircraft. The empennage was initially sized within SUAVE using a constant tail volume fraction similar to existing aircraft in the class using data from Raymer [40] and then refined using AVL to ensure sufficient stability and trim during critical flight cases for the complete CG envelope obtained separately. The vertical tail was sized based both on the one-engine inoperative (OEI) case and the lateral stability condition of C N β > 0.01573 [66]. The propeller was positioned vertically as far as possible to reduce the possibility of the wing wake impinging on the propeller blades. The angle between the wing trailing edge and the propeller’s lowest blade tip is equal to 14 deg, which should be sufficient for the majority of operational cases. The propeller features six blades and has a diameter of 3.56 m.
The CG envelope was created using available information about the stick-fixed and stick-free neutral points, payload clouds, and multiple baggage arrangement cases. The CG-range is equal to 21.5% mean aerodynamic chord (MAC) starting at 12% and ending at 33.5% MAC.
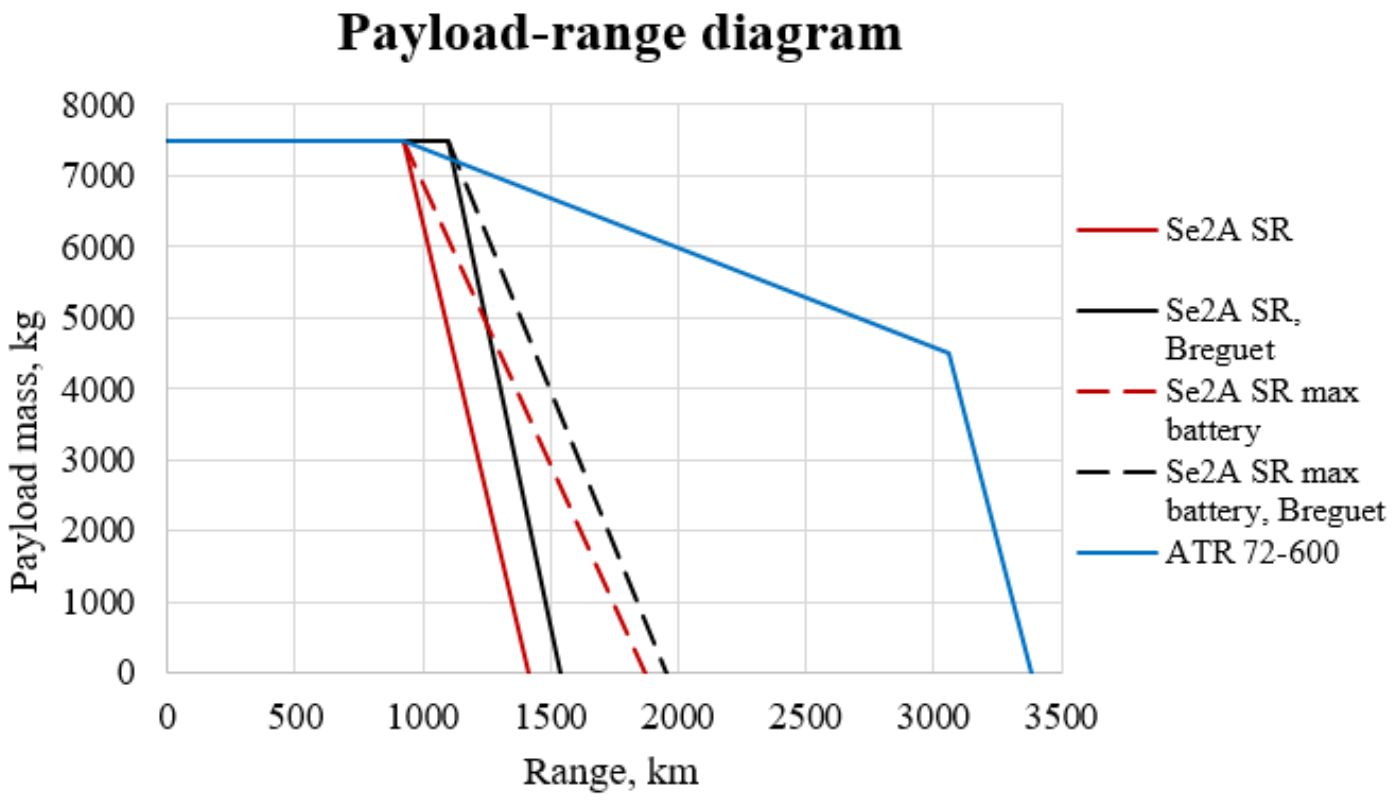
Figure 14 shows the SE2A SR payload-range diagram compared to the reference ATR-72 [67]. In addition, the obtained payload-range diagram was validated using a Breguet range equation for an all-electric aircraft defined by
R = 1 g η t o t a l C b a t L D m b a t m 0
where m 0 is the maximum take-off mass, g is the gravitational acceleration, and L / D is the cruise lift-to-drag ratio.
For the range analysis, multiple options were considered. The first option is the case when the battery mass remains constant, independent of changes in payload weight. This way, the battery volume is fixed and equal to the one used for the maximum passenger case. The second option is to have sufficient battery volume to replace missing passengers with an extra battery. Such an option is more problematic to achieve due to the increased battery size and additional growth of the already large belly fairing but is useful to analyze for the range sensitivity analysis. The comparison shows that although the SE2A SR satisfies the harmonic range requirement, which matches the ATR-72, the ferry range is significantly limited due to the battery energy density and weight limitations. The absence of the payload extends the aircraft range to 1415 km, which is substantially smaller than the ATR-72 with its ferry range of 3380 km. Introduction of more battery which replaces the payload increases the ferry range until 1870 km, which is 455 km longer than the fixed battery weight case. However, this ferry range still does not introduce major range improvements compared to the ATR-72. Comparison between the SUAVE payload-range and Breguet payload-range diagrams show a difference of both harmonic and ferry ranges of 100 km. Such tendency happens due to the higher fidelity of SUAVE which includes all mission segments and calculates incremental energy consumption and aerodynamic characteristics, unlike the Breguet equation which considers a constant lift-to-drag ratio. On the other hand, minor deviations are expected and are satisfactory for the selected analysis.
To summarize current design outcomes, an all-electric SE2A SR aircraft is capable of achieving the harmonic range similar to the reference ATR-72 and satisfies all prescribed TLRs. Moreover, its emission level is reduced by 81% compared to the reference aircraft. On the other hand, the ferry range of the all-electric aircraft is limited to no more than 1870 km compared to 3380 km for the ATR-72 and has a 42% increase in DOC with respect to the reference which will create substantial market application problems for this type of airplane.
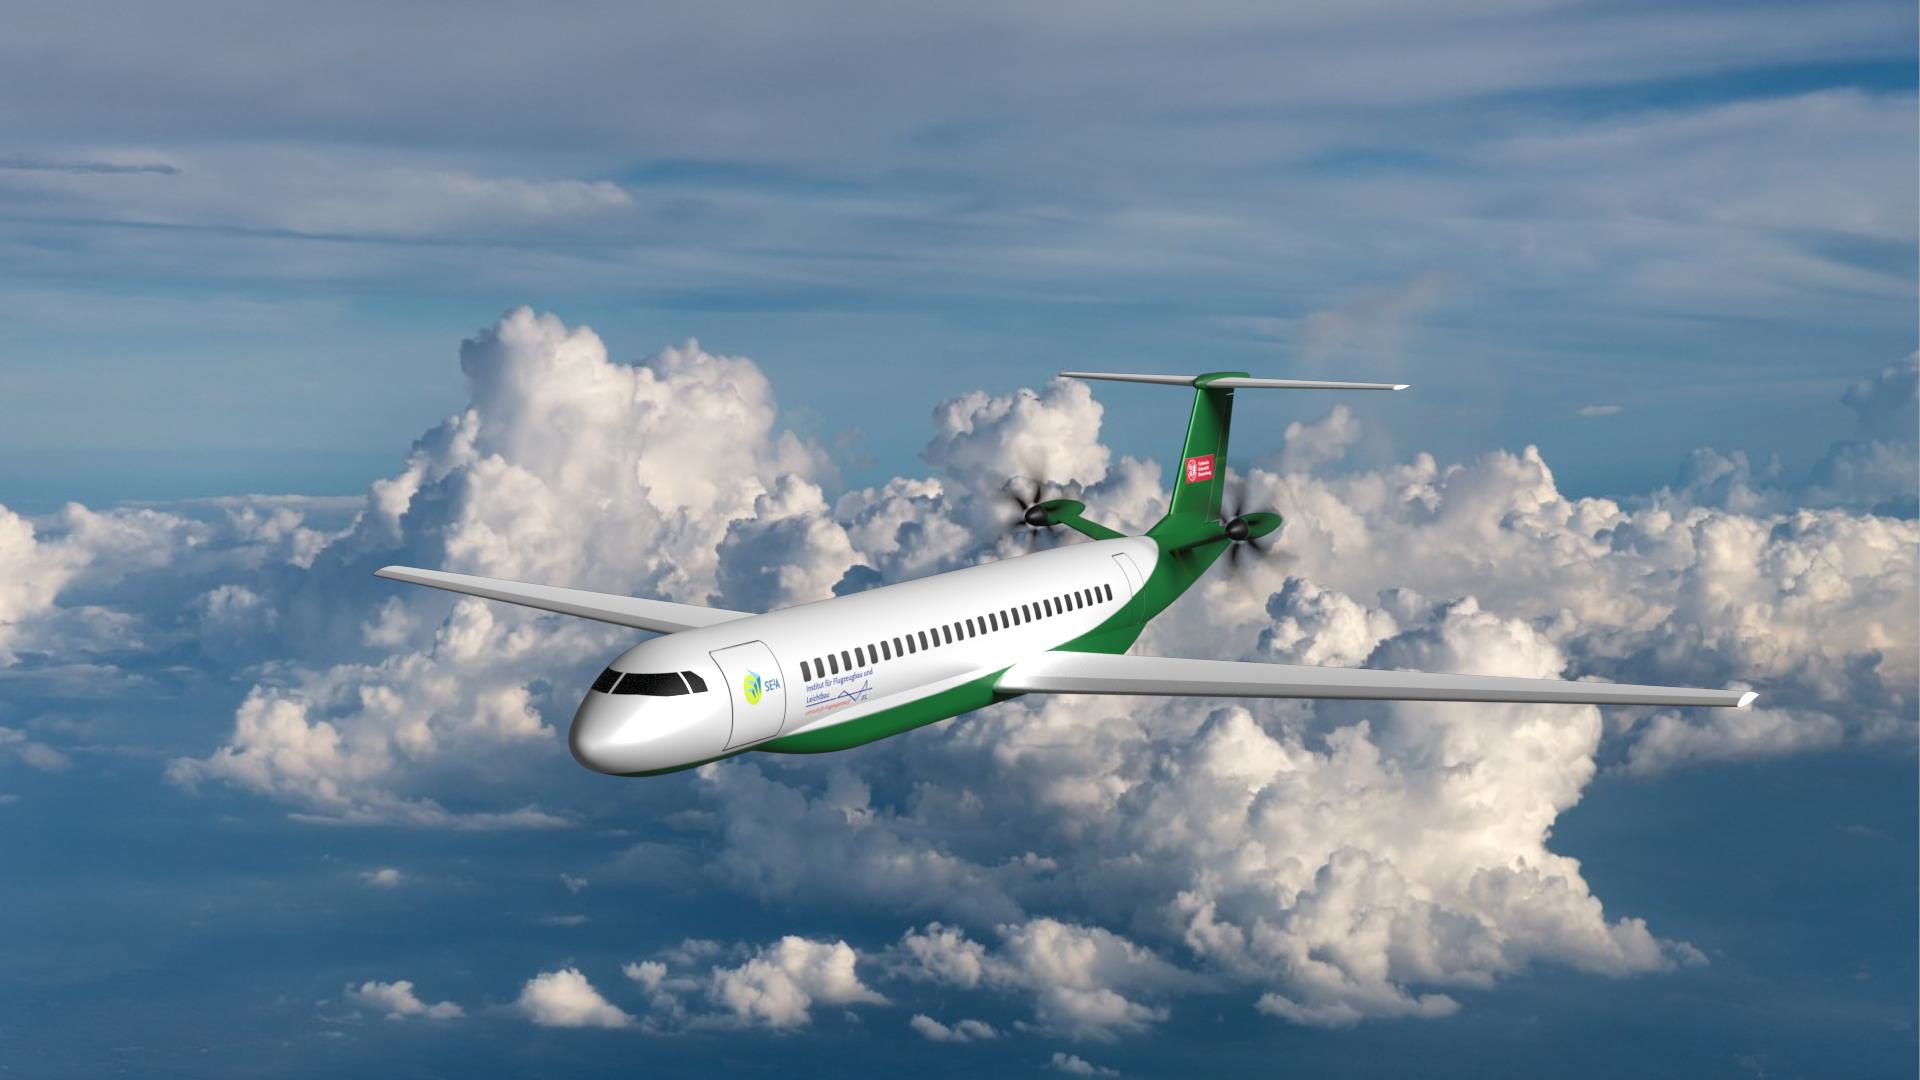
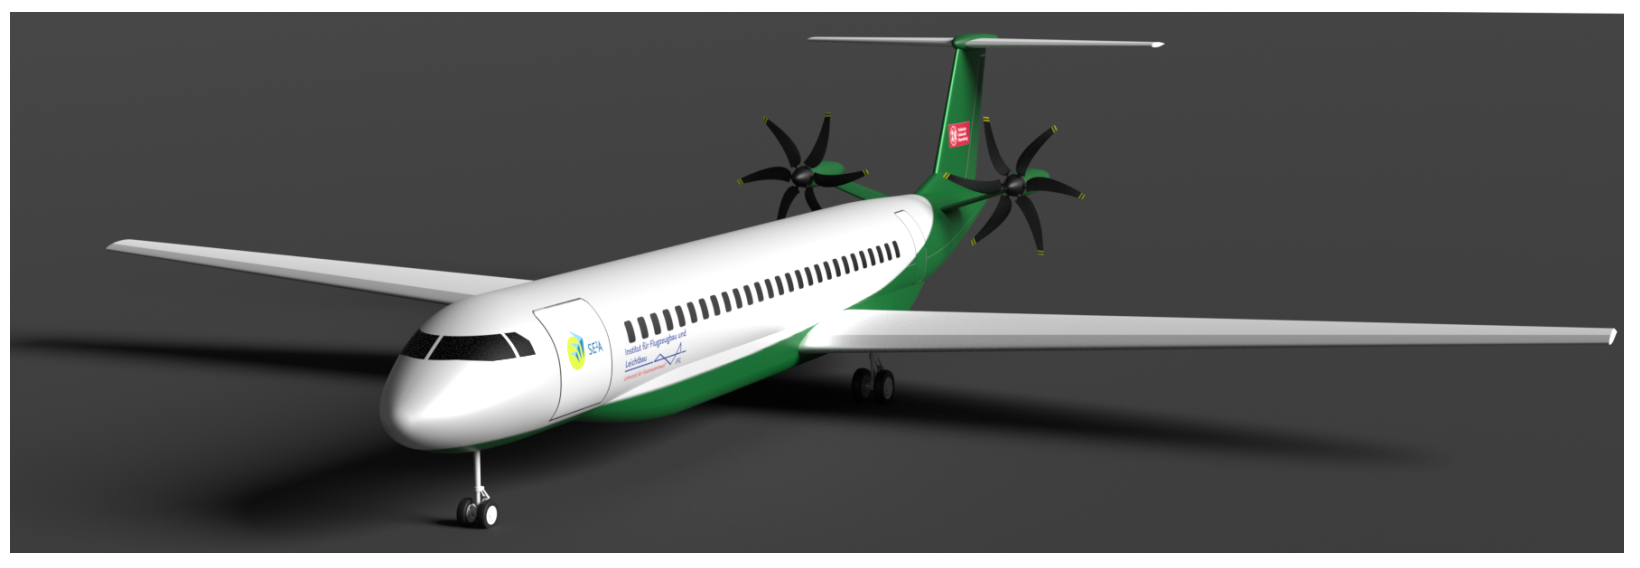
Figure 15 shows a rendered image of the optimized SE2A SR aircraft.

7. Sensitivity Analysis of the Aircraft Characteristics to Technology Advancements

After performing a conceptual design of a regional all-electric aircraft and analyzing obtained results, several questions still remain: What is the influence of novel technologies on the aircraft configuration? How much do the deviations of novel technology assumptions affect the airplane configuration? What technologies affect the aircraft geometry the most?
A sensitivity analysis of the SE2A SR aircraft to the battery energy density with the absence of all novel airframe technologies was performed to determine what potential energy density could make all-electric regional aviation possible and how the aircraft characteristics are affected. The aircraft without novel airframe technologies assumed 5% laminar flow on the wing and empennage, 5% laminar flow for the fuselage, a limit load factor of 2.5, and no weight reduction due to composite materials. Technologies related to the propulsion system such as HTS motors remained since their absence immediately leads to the aircraft’s infeasibility due to the Megawatt-level power required per motor. Furthermore, the performance characteristics of the aircraft without novel technologies were compared against the case if all technologies met the desired requirements. The sizing procedure for all configurations was performed for a similar mission profile and used similar methods to those described in Section 3 to ensure the satisfaction of all TLRs. Similar constraints based on TLRs were also implemented. As for the initial sizing, wing loading and aspect ratio sensitivity analyses were performed to determine a sweep of all possible aircraft that satisfy TLRs. For all possible configurations, the ones with minimum DOC were selected for each selected battery energy density. Finally, all characteristics were compared against the reference ATR-72 aircraft. 
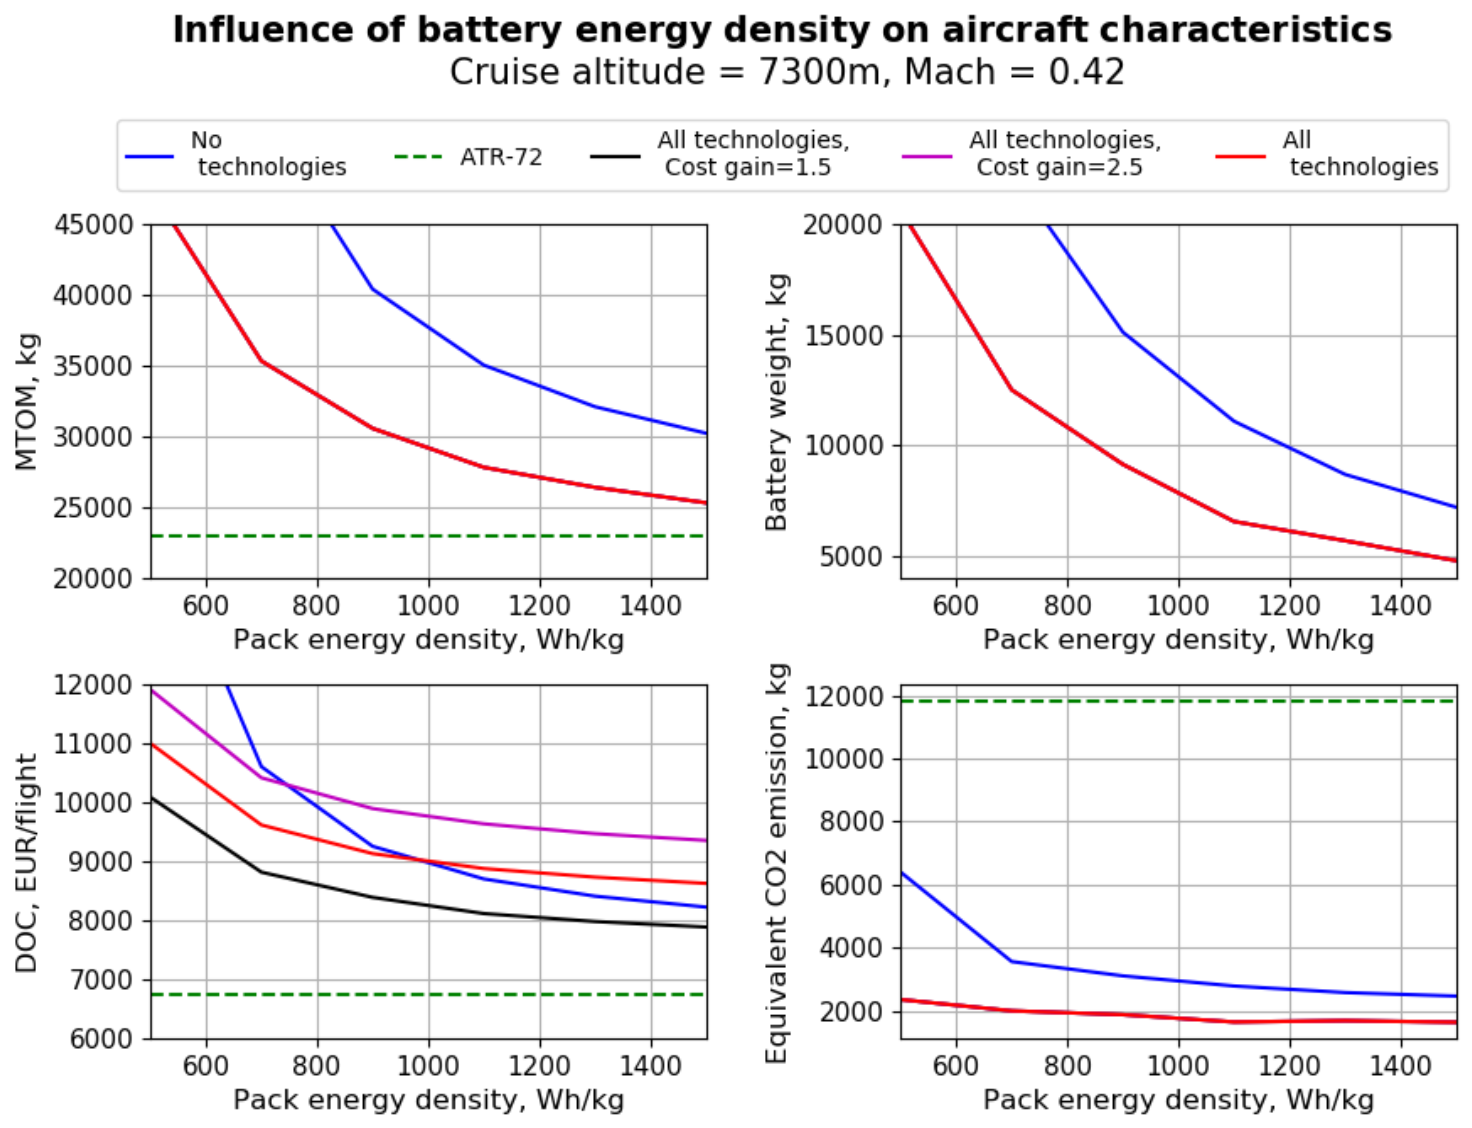
Figure 16 shows the effect of battery energy density on the aircraft gross weight.
Results demonstrate that the absence of novel technologies significantly limits the feasibility of all-electric regional aviation unless substantially higher battery cell energy densities are reached. For instance, if the aircraft with all available airframe technologies can reach the MTOM of 40,000 kg at the pack energy density of 600 Wh/kg, the aircraft without airframe technologies can reach similar weights at 900 Wh/kg. In addition, weights approach an asymptotic value at high energy densities, so the effect of airframe technologies becomes more significant for high energy densities. For instance, if the pack energy density reaches 1000 Wh/kg, then the aircraft MTOW with all technologies becomes slightly less than 30,000 kg while similar weight is achieved by the aircraft without airframe technologies only at 1500 Wh/kg.
To compare the DOC values, the aircraft without technologies did not include an additional maintenance cost penalty introduced for the aircraft with all airframe technologies. Moreover, a sensitivity analysis of the maintenance cost gain factor was performed to investigate its effect on the overall DOC and predict potential future DOC behavior. If DOC is compared, two trends can be observed. First, both aircraft have substantially higher DOC compared to the reference ATR-72, and the difference remains large even for high energy densities. On the other hand, the application of technologies affects the DOC. Comparing aircraft with and without technologies, there exists a point after which the DOC increases due to the airframe technologies and their maintenance complications and is equal to 980 Wh/kg. After this energy density, an aircraft without airframe technologies becomes cheaper to operate. Such a trend is a consequence of the maintenance cost gain and redistribution of dominant cost drivers, as shown in Table 9. For low battery energy densities, the most dominant DOC component is the capital cost which depends on the airframe and propulsion system weights. Due to significantly larger weights, these costs contribute to total DOC such that benefits of maintenance costs disappear. Moreover, more battery energy is required for the aircraft without technologies and slightly higher fees also contribute to a larger total DOC. On the other hand, with the increase in energy density, aircraft weights reduce substantially, so capital costs reduce as well. The overall distribution of costs becomes more evenly distributed for the aircraft without technologies, so lower maintenance cost effects become more significant. On the other hand, maintenance costs for the aircraft with technologies start dominating. That relationship leads to higher overall DOC for the aircraft with technologies at high battery energy densities. The present aircraft was designed having 700 Wh/kg of pack energy density which is still more beneficial than the aircraft without technologies. However, the maintenance penalty factor of 2 may be too optimistic. If the maintenance costs increase more, then the equilibrium point between the two DOCs will shift towards lower energy densities, as shown in Figure 16. The only possibility of approaching the reference aircraft DOC exists if maintenance cost gain is equal to 1. The maintenance cost of novel airframe technologies shall be considered later to ensure the financial applicability of novel technologies further.
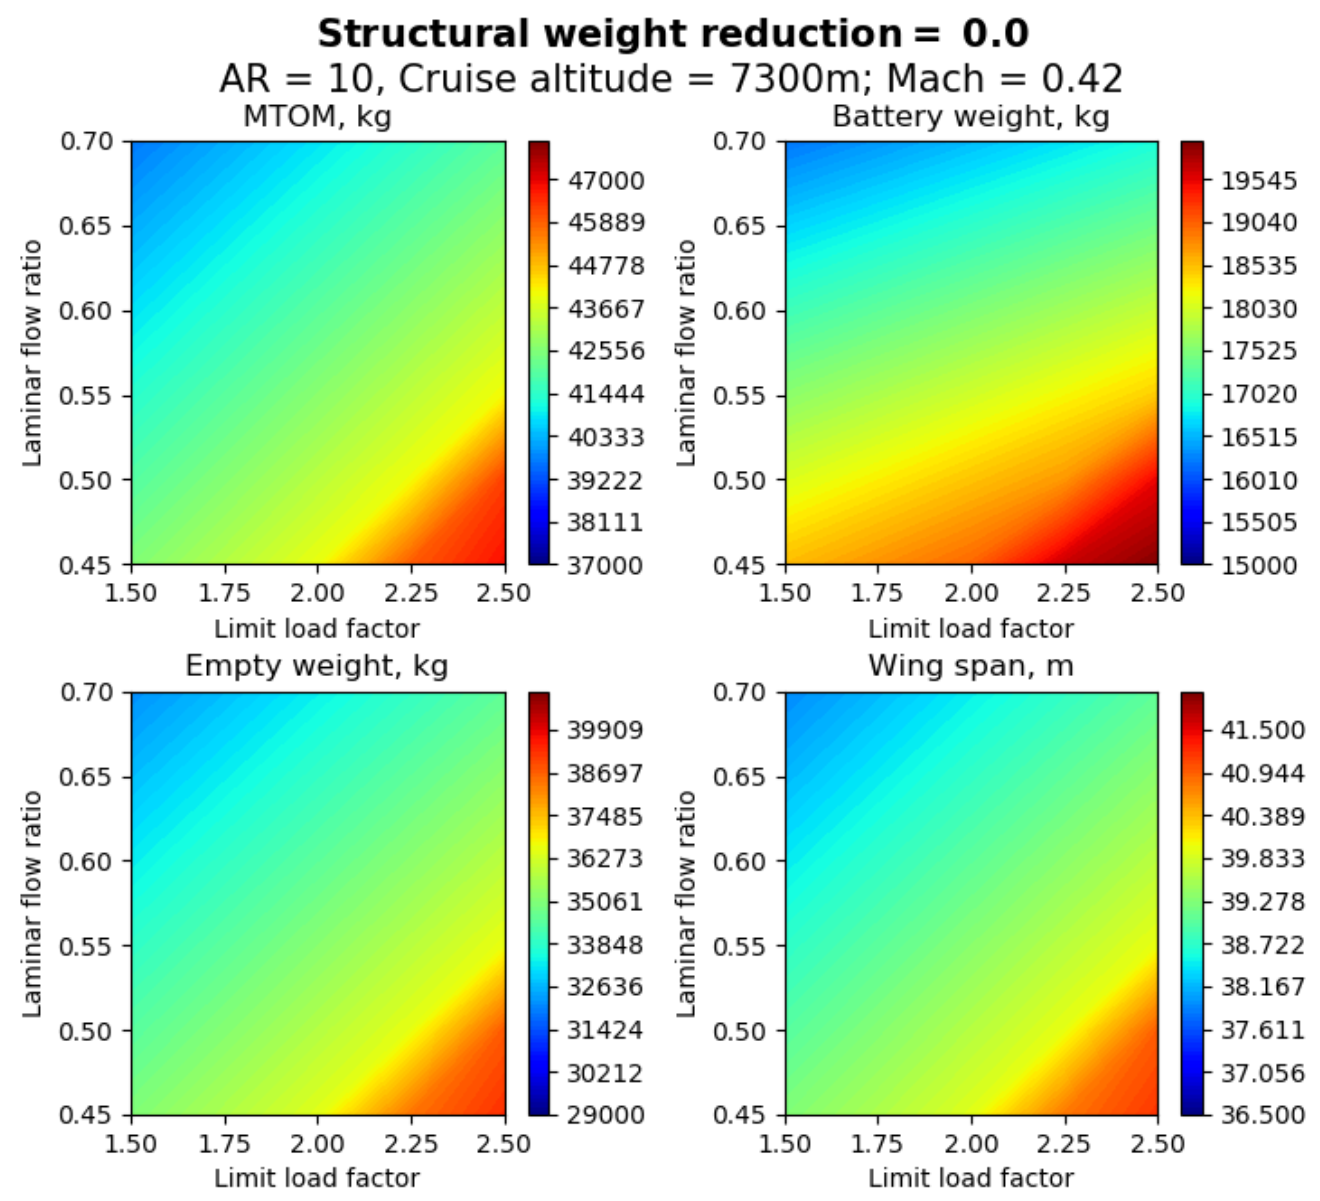
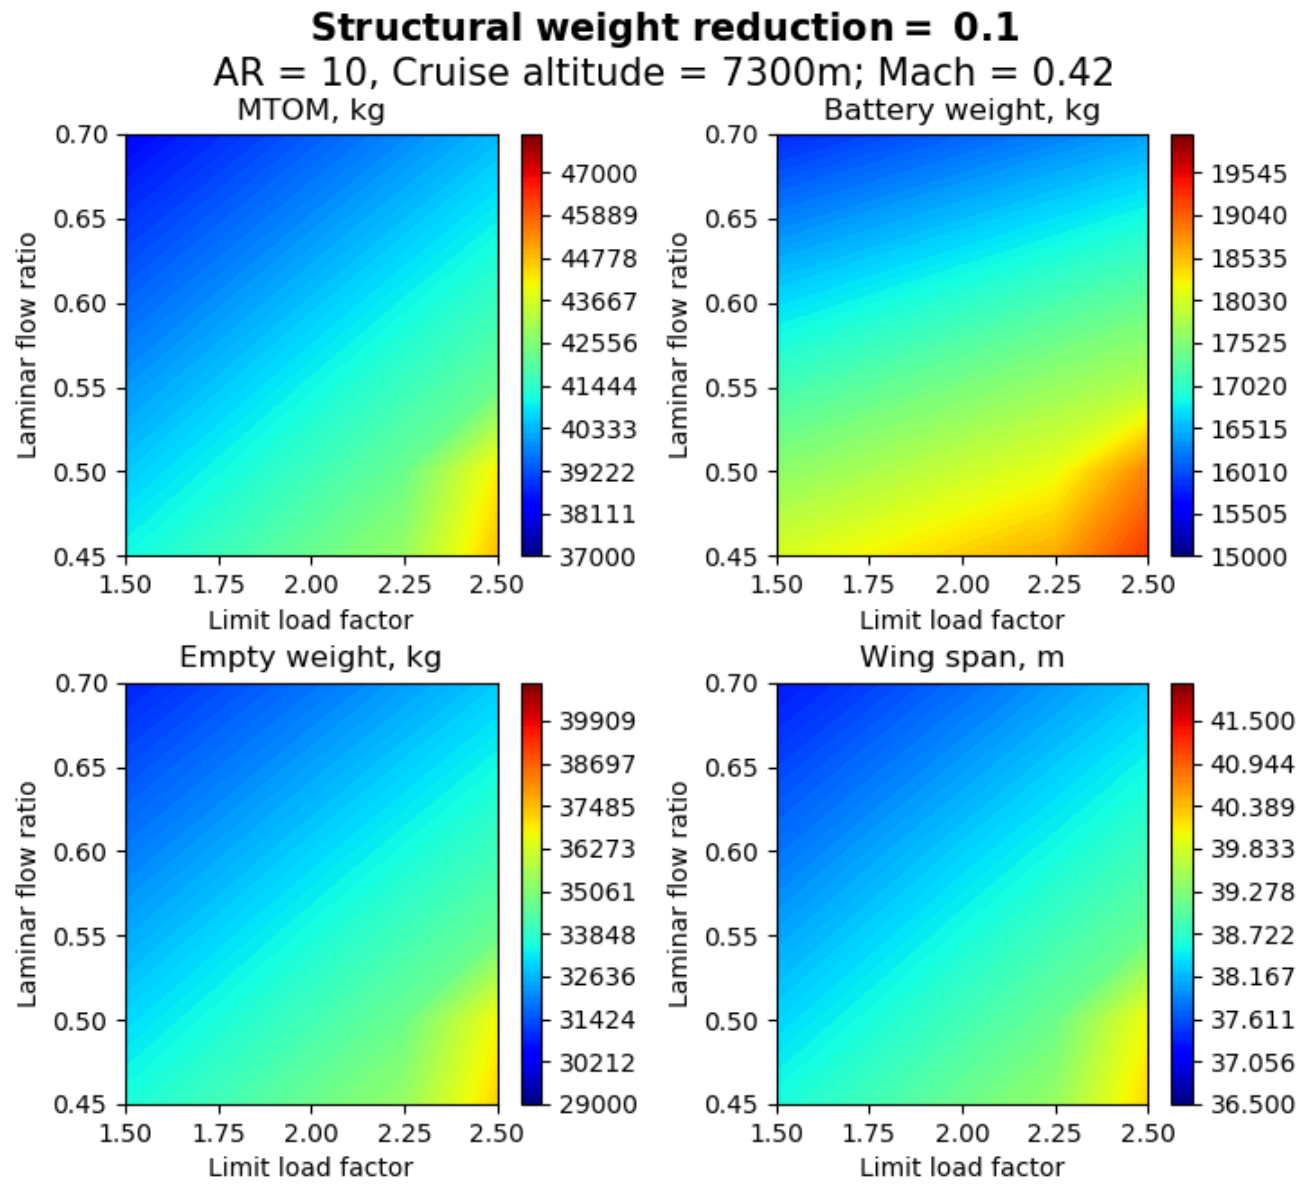
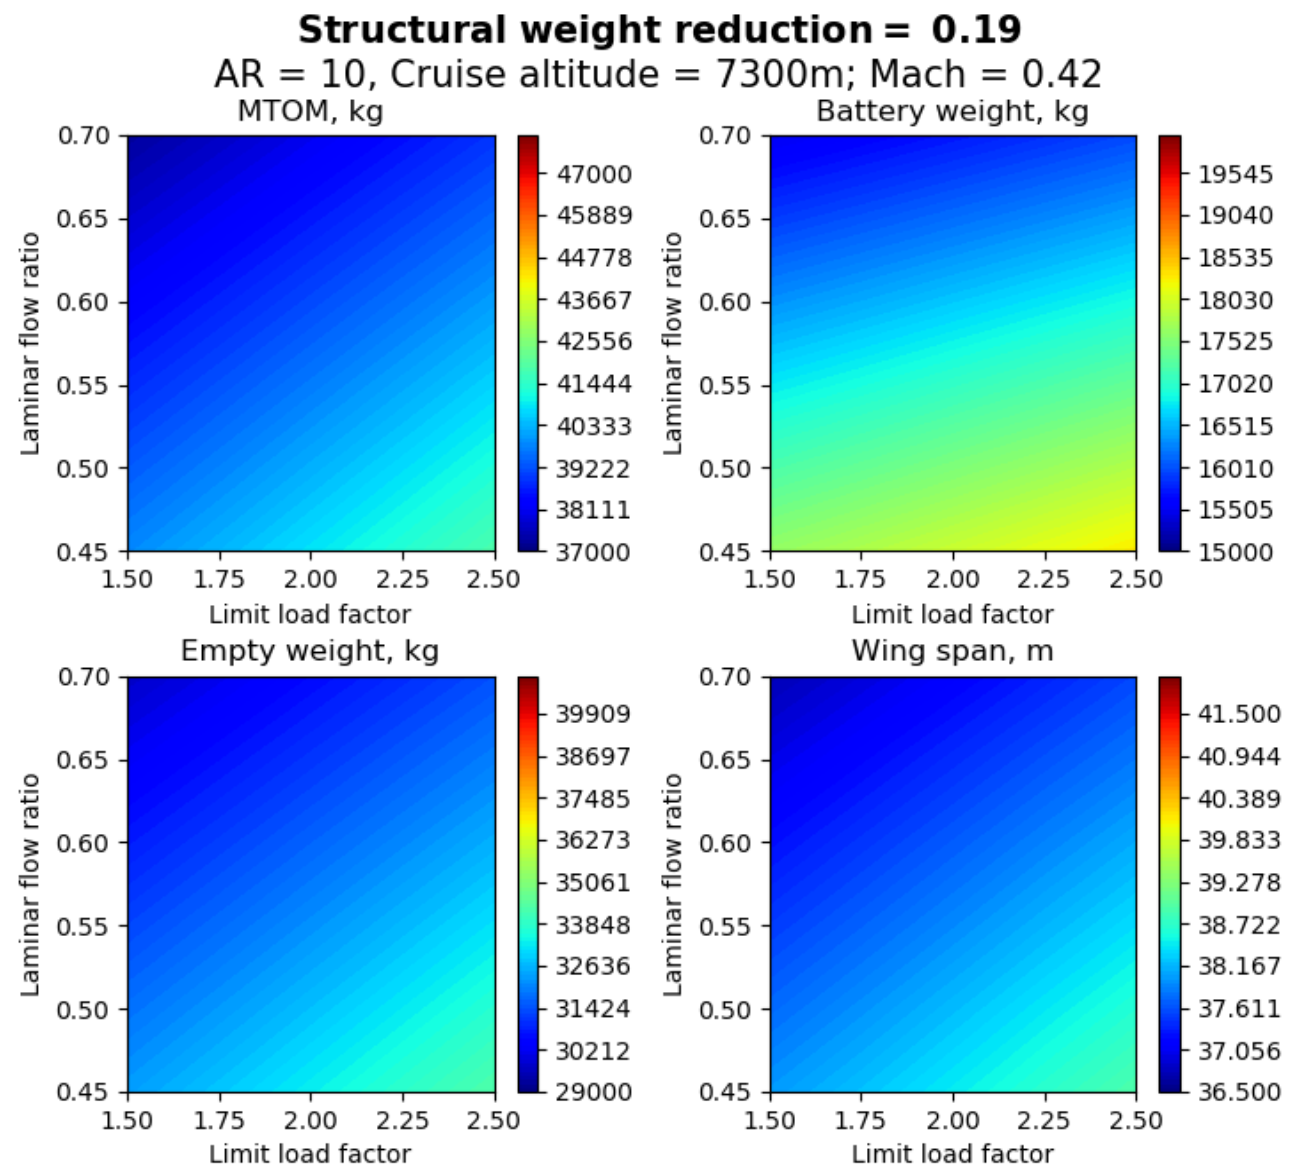
The effect of technology deviations on the aircraft weights and, as a consequence, applicability of all-electric aircraft is shown in Figure 17, Figure 18 and Figure 19. In addition, points for extreme technology cases are summarized in Table 10, Table 11, Table 12 and Table 13. A similar sizing approach, as discussed in Section 3, was used for the sizing with technology deviations. The wing loading, however, was fixed to the one that occurred after the MDO of the aircraft. In addition, to simplify the sensitivity and account for significant complexities to design an appropriate suction system for the fuselage, the fuselage was assumed fully turbulent for all technology sensitivities.
Based on obtained results, if the weight sensitivity on the technology is compared for two other technologies where one technology has a constant value and the other technology is fixed at either their minimum or maximum, the laminar flow control shows the largest influence on the MTOM. Structural weight reduction plays the second most important role, and the load alleviation affects the aircraft MTOM the least compared to the other two technologies. For instance, for the airframe reduction of 0%, if the maximum possible boundary layer transition is possible, then the change in MTOW due to the load alleviation is equal to 2435 kg. However, if for the same airframe reduction factor, the load alleviation has its minimum value, then the change in MTOM is equal to 2835 kg due to the HLFC technology. If technologies are combined, then the effect of the MTOM is magnified.

8. Conclusions

The present manuscript investigated the influence of novel technologies on the feasibility of all-electric short-range aircraft with passenger capacity and performance characteristics similar to ATR-72. Three novel airframe technologies were considered: hybrid laminar flow control, active load alleviation, and advanced materials and structure concepts. In addition, superconducting electric motors and high energy density batteries were considered for the aircraft energy system.
Multiple tools were used and improved to assess the feasibility question. SUAVE was used to perform the initial sizing and sensitivity analyses and was also coupled with MATLAB to perform MDO studies. EMWET and FLOPS weight estimation methods and a weight penalty function for folding wings were integrated into SUAVE. The cubic spline method for a propeller was used to enable the aircraft sizing. AVL was used to assess the aircraft stability and control.
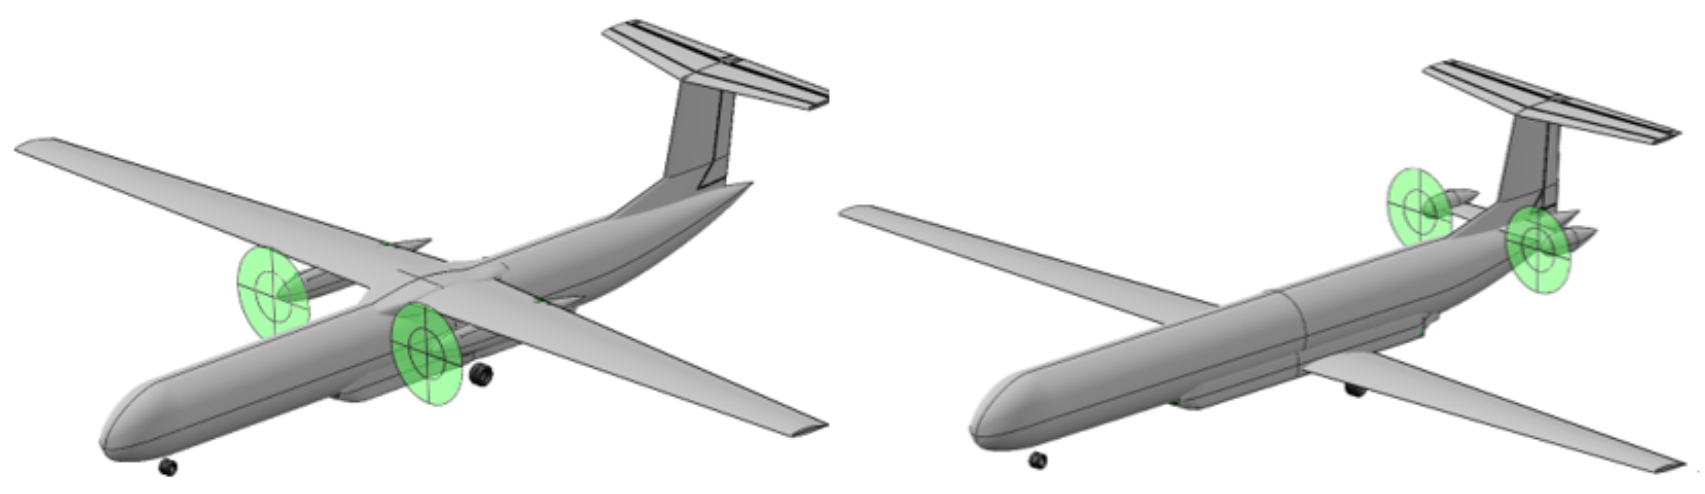
Two aircraft configurations were considered for the design: the conventional configuration with a high wing and wing-mounted propellers and the low wing with propellers mounted at the aft of the fuselage. The low-wing configuration was selected because it had lower DOC, lower weights, and is possible to have certifiable stability and control characteristics.
To refine the selected concept and determine the aircraft characteristics’ sensitivity to the folding penalty and the objective function, a set of MDO studies were performed. The configuration without folding wings was selected due to a relatively small increase in DOC due to the fixed wingspan and reduced complexity of the wing design and maintenance due to the absence of the wing folding mechanism.
The importance of airframe technologies was assessed by comparing aircraft configurations with and without them. The presence of airframe technologies may reduce the required battery pack energy density by 300 Wh/kg compared to their absence. The difference in required energy density also increases with the increase of the battery energy density. However, the application of technologies becomes more expensive than their absence if the battery pack energy density exceeds 980 Wh/kg for a given maintenance cost gain factor of 2.
Comparison of the all-electric aircraft to the reference ATR-72 showed substantial reduction of CO2 emission by 81% of the all-electric aircraft. On the other hand, DOC increase of 42% presents a significant limit to market success of such aircraft. Moreover, neither increase in battery energy density, nor reduction of maintenance costs change aircraft DOC significantly. The only possibility to have a comparable DOC level may appear if maintenance cost gain is absent and battery pack energy density exceeds 1000 Wh/kg. Moreover, the all-electric aircraft consumes a lot of energy to complete the mission which creates major uncertainties related to its energy-efficiency from the operational standpoint.
Finally, a sensitivity analysis of technology availability on the aircraft characteristics was performed. Simulations were performed for each technology combination from the most optimistic to its absence. Results demonstrated high sensitivity of aircraft weights to technology levels where the HLFC has the most influence, followed by the aircraft weight reduction and finishing with the load alleviation. The combined effect of technologies magnifies the differences in weight even further.
Future research steps will include a detailed conceptual design of the SE2A SR aircraft. First of all, the design with available models for the laminar flow required power and additional weight penalties due to the implementation of all technologies and additional hardware will be performed. A more sophisticated assessment of the aircraft stability and control must be performed to ensure adequate flying qualities. Finally, higher fidelity analysis for the energy network and modeling of the motors and propellers will be considered.

Author Contributions

Conceptualization, S.K.; methodology, S.K.; software, S.K.; validation, S.K.; investigation, S.K.; writing—original draft preparation, S.K.; writing—review and editing, A.E.; visualization, S.K.; supervision, A.E.; project administration, A.E.; funding acquisition, A.E. All authors have read and agreed to the published version of the manuscript.

Funding

This research was funded by the Deutsche Forschungsgemeinschaft (DFG, German Research Foundation) under Germany’s Excellence Strategy-EXC 2163/1-Sustainable and Energy Efficient Aviation-Project-ID 390881007.

Conflicts of Interest

The authors declare no conflict of interest.

References

  1. Flightpath 2050-Europe’s Vision for Aviation: Advisory Council for Aeronautics Research in Europe; Publications Office of European Union: Brussels, Belgium, 2011. [CrossRef]
  2. Friedrich, C.; Robertson, A. Hybrid-electric propulsion for aircraft. J. Aircr. 2015, 52. [Google Scholar] [CrossRef]
  3. Hamilton, T.; German, B. Optimal airspeeds for scheduled electric aircraft operations. J. Aircr. 2019, 56. [Google Scholar] [CrossRef]
  4. Kim, D.; Perry, A.; Ansell, J. A Review of Distributed Electric Propulsion Concepts for Air Vehicle Technology. In Proceedings of the 2018 AIAA/IEEE Electric Aircraft Technologies Symposium, Cincinnati, OH, USA, 12–14 July 2018. [Google Scholar] [CrossRef] [Green Version]
  5. Finger, D.; Cees, B.; Braun, C. Initial Sizing Methodology for Hybrid-Electric General Aviation Aircraft. J. Aircr. 2020, 57, 1–11. [Google Scholar] [CrossRef]
  6. Finger, D.; Cees, B.; Braun, C. Impact of Battery Performance on the Initial Sizing of Hybrid-Electric General Aviation Aircraft. J. Aerosp. Eng. 2020, 33, 1–18. [Google Scholar] [CrossRef]
  7. Finger, D.; Cees, B.; Braun, C. Comparative Assessment of Parallel-Hybrid-Electric Propulsion Systems for Four Different Aircraft. J. Aircr. 2020. [Google Scholar] [CrossRef]
  8. De Vries, R.; Hoogreef, F.; Vos, R. Range Equation for Hybrid-Electric Aircraft with Constant Power Split. J. Aircr. 2020, 67. [Google Scholar] [CrossRef]
  9. De Vries, R.; Brown, M.; Vos, R. Preliminary Sizing Method for Hybrid-Electric Distributed-Propulsion Aircraft. J. Aircr. 2019, 56. [Google Scholar] [CrossRef]
  10. Pornet, C.; Gologan, C.; Vratny, P.; Seitz, A.; Schmitz, O.; Isikveren, A.; Hornung, M. Methodology for Sizing and Performance Assessment of Hybrid Energy Aircraft. J. Aircr. 2015, 52. [Google Scholar] [CrossRef]
  11. Sgueglia, A.; Schmollgruber, P.; Bartoli, N.; Benard, E.; Morlier, J.; Jasa, J.; Martins, J.; Hwang, T.; Gray, S. Multidisciplinary Design Optimization Framework with Coupled Derivative Computation for Hybrid Aircraft. J. Aircr. 2020, 57. [Google Scholar] [CrossRef]
  12. Hepperle, M. Electric Flight-Potential and Limitations. October 2012, AVT-209 Workshop on Energy-efficient Technologies and Concepts Operation. Available online: https://elib.dlr.de/78726/ (accessed on 21 May 2021).
  13. Pipestrel; Alpha Electro. 2021. Available online: https://perma.cc/7G4P-TBD3 (accessed on 3 June 2021).
  14. Bye Aerospace; eFlyer. 2021. Available online: https://perma.cc/SW5M-MMH2 (accessed on 3 June 2021).
  15. Siemens; Extra 330 LE Aircraft. 2017. Available online: https://perma.cc/5RC3-SWD8 (accessed on 3 June 2021).
  16. Equation Aircraft; Equator P2 Xcursion. 2021. Available online: https://perma.cc/AR56-GTVR?type=image (accessed on 3 June 2021).
  17. Jackson, P. Jane’s All the World’s Aircraft; IHS Markit: London, UK, 2015. [Google Scholar]
  18. MagniX; MagniX Engines. 2021. Available online: https://perma.cc/ZA7W-Z75R (accessed on 3 June 2021).
  19. Liu, Y.; Elham, A.; Horst, P.; Hepperle, M. Exploring Vehicle Level Benefits of Revolutionary Technology Progress via Aircraft Design and Optimization. Energies 2018, 11, 166. [Google Scholar] [CrossRef] [Green Version]
  20. Beck, N.; Landa, T.; Seitz, A.; Boermans, L.; Liu, Y.; Radespiel, R. Drag Reduction by Laminar Flow Control. Energies 2018, 11, 252. [Google Scholar] [CrossRef] [Green Version]
  21. Risse, K.; Stumpf, E. Conceptual Aircraft Design including Hybrid Laminar Flow Control. CEAS Aeronaut. J. 2014, 5, 333–343. [Google Scholar] [CrossRef]
  22. Horst, P.; Elham, A.; Radespiel, R. Reduction of Aircraft Drag, Loads and Mass for Energy Transition in Aeronautics. In Proceedings of the DLRK 2020 Conference, Darmstadt, Germany, 1–3 September 2020. [Google Scholar] [CrossRef]
  23. Gröhlich, M.; Böswald, M.; Winter, R. An iterative eigenvalue solver for systems with frequency dependent material properties. In Proceedings of the DAGA 2020, Hanover, Germany, 12–14 July 2020; pp. 900–903. Available online: https://elib.dlr.de/134937 (accessed on 3 June 2021).
  24. Dähne, S.; Hühne, C. Gradient Based Structural Optimization of a Stringer Stiffened Composite Wing Box with Variable Stringer Orientation. In Proceedings of the World Congress of Structural and Multidisciplinary Optimisation, Braunschweig, Germany, 5–9 June 2020; pp. 814–826. [Google Scholar] [CrossRef]
  25. Wunderlich, F.T.; Dähne, S.; Reimer, L.; Schuster, A.; Brodersen, O. Global Aero-Structural Design Optimization of More Flexible Wings for Commercial Aircraft. In Proceedings of the AIAA Aviation 2020 Forum, Virtual Event, 15–19 June 2020; Volume 33, pp. 1–18. [Google Scholar] [CrossRef]
  26. Rossow, C.; Geyr, H.; Hepperle, M. The 1g-Wing, Visionary Concept or Naive Solution? DLR-IB-AS-BS-2016-121, Braunschweig. 2016. Available online: https://elib.dlr.de/105029/ (accessed on 3 June 2021).
  27. Liu, X.; Sun, Q. Gust Load Alleviation with Robust Control for a Flexible Wing. Shock Vib. 2016, 2016. [Google Scholar] [CrossRef] [Green Version]
  28. Ying, B.; Changchum, X. Gust load alleviation wind tunnel tests of a large-aspect-ratio flexible wing with piezoelectric control. J. Aeronaut. 2017, 30, 292–309. [Google Scholar] [CrossRef]
  29. Beyer, Y.; Kuzolap, A.; Steen, M.; Diekmann, H.; Fezans, N. Adaptive Nonlinear Flight Control of STOL-Aircraft Based on Incremental Nonlinear Dynamic Inversion. In Proceedings of the 2018 AIAA Aviation Forum, Atlanta, GA, USA, 25–29 June 2018. [Google Scholar] [CrossRef] [Green Version]
  30. Khalil, A.; Fezans, N. A Multi-Channel H Preview Control Approach to Load Alleviation Function Design. In Proceedings of the 2019 CEAS Conference on Guidance, Navigation and Control, Milano, Italy, 3–5 April 2019; Available online: https://elib.dlr.de/128625/ (accessed on 3 June 2021).
  31. Fezans, N.; Joos, D.; Deiler, C. Gust Load Alleviation for a Long-Range Aircraft with and without Anticipation. CEAS Aeronaut. J. 2019, 10, 1033–1057. [Google Scholar] [CrossRef] [Green Version]
  32. Ehlers, J.; Fezans, N. Airborne Doppler LiDAR Sensor Parameter Analysis for Wake Vortex Impact Alleviation Purposes. In Proceedings of the 2015 CEAS Conference on Guidance, Navigation and Control, Toulouse, France, 13–15 April 2015. [Google Scholar] [CrossRef]
  33. Khalil, K.; Asaro, S.; Bauknecht, A. Active Flow Control Devices for Wing Load Alleviation. In Proceedings of the AIAA Aviation 2020 Forum, Virtual Event, 15–19 January 2020; pp. 1–22. [Google Scholar] [CrossRef]
  34. Bishara, M.; Horst, P.; Madhusoodanan, H.; Brod, M.; Daum, B.; Rolfes, R. A Structural Design Concept for a Multi-Shell Blended Wing Body with Laminar Flow Control. Energies 2018, 11, 383. [Google Scholar] [CrossRef] [Green Version]
  35. Stückl, S. Methods for the Design and Evaluation of Future Aircraft Concepts Utilizing Electric Propulsion Systems. Ph.D. Thesis, Technical University Munchen, Munchen, Germany, 2015. Available online: http://nbn-resolving.de/urn:nbn:de:bvb:91-diss-20160701-1255732-1-0 (accessed on 3 June 2021).
  36. Thielmann, A.; Sauer, A.; Isenmann, R.; Wietschel, M. Technology roadmap energy storage for electric mobility 2030. Fraunhofer 2012. Available online: https://perma.cc/6EKP-Z45X (accessed on 21 May 2021).
  37. National Academies of Sciences, Engineering, and Medicine. Commercial Aircraft Propulsion and Energy Systems Research: Reducing Global Carbon Emissions; National Academies Press: Washington, DC, USA, 2016. [Google Scholar] [CrossRef]
  38. Mconald, R. Advanced modeling in OpenVSP 48th. In Proceedings of the AIAA Aerospace Sciences Meeting Including the New Horizons Forum and Aerospace Exposition, Washington, DC, USA, 13–17 June 2016. [Google Scholar] [CrossRef]
  39. Lukaczyk, T.; Wendroff, A.; Colonno, M.; Economon, T.; Alonso, J.; Orra, T.; Ilario, C. SUAVE: An Open-Source Environment for Multi-Fidelity Conceptual Vehicle Design. In Proceedings of the 16th AIAA ISSMO Multidisciplinary Analysis and Optimization Conference, Dallas, TX, USA, 22–26 June 2015. [Google Scholar] [CrossRef] [Green Version]
  40. Raymer, D. Aircraft Design: A Conceptual Approach, 6th ed.; American Institute of Aeronautics and Astronautics: Washington, DC, USA, 2018. [Google Scholar] [CrossRef] [Green Version]
  41. Gudmundsson, S. General Aviation Aircraft Design: Applied Methods and Procedures, 1st ed.; Butterworth-Heinemann: Oxford, UK, 2013. [Google Scholar] [CrossRef]
  42. Torenbeek, E. Synthesis of Subsonic Airplane Design; Springer: Delft, The Netherlands, 1982. [Google Scholar] [CrossRef]
  43. Roskam, J. Airplane Design, 2nd ed.; Darcorporation: Lawrence, KS, USA, 2003; Volume 1–8. [Google Scholar]
  44. Ibrahim, K. Selecting Principal Parameters of Baseline Design Configuration for Twin Turboprop Transport Aircraft. In Proceedings of the 22nd Applied Aerodynamics Conference and Exhibition, Providence, RI, USA, 16–19 August 2004. [Google Scholar] [CrossRef]
  45. Brake, H.; Wiegerinck, G. Low-power Cryocooler Survey. Cryogenics 2002, 42. [Google Scholar] [CrossRef] [Green Version]
  46. Welstead, J.; Feldder, J. Conceptual Design of a Single-aisle Turboelectric Commercial Transport with Fuselage Boundary Layer Ingestion. In Proceedings of the 54th AIAA Aerospace Sciences Meeting, San Diego, CA, USA, 4–8 January 2016. [Google Scholar] [CrossRef] [Green Version]
  47. Wells, D.; Horvath, B.; McCullers, L. The Flight Optimization System Weights Estimation Method; NASA TM 20170005851; NASA: Hampton, VA, USA, 2017. Available online: https://core.ac.uk/display/84913944 (accessed on 3 June 2021).
  48. Elham, A.; La Rocca, G.; van Tooren, M. Development and Implementation of an Advanced, Design-sensitive Method for Wing Weight Estimation. Aerosp. Sci. Technol. 2013, 29, 100–113. [Google Scholar] [CrossRef]
  49. Drela, M.; Youngren, H. Athena Vortex-lattice Method. Available online: https://perma.cc/D3J8-U8U5 (accessed on 3 June 2021).
  50. Yarygina, V.; Popov, M. Development of the Weight Formula for a Folding Wing. Russ. Aeronaut. (Iz.VUZ) 2012, 55, 120–126. [Google Scholar] [CrossRef]
  51. Senty, R.; Wickenheiser, T. Propeller Performance and Weight Predictions Appended to the NAVY/NASA Engine Program; NASA TM 83458; NASA: Cleveland, OH, USA, 1983. Available online: https://core.ac.uk/display/42851585 (accessed on 3 June 2021).
  52. Brown, G.; Kascak, A.; Ebihara, B.; Johnson, D.; Choi, B.; Siebert, M.; Buccieri, C. NASA Glenn Research Center Program in High Power Density Motors for Aeropropulsion; NASA TM-2005-213800; NASA: Cleveland, OH, USA, 2005. Available online: https://core.ac.uk/display/10516384 (accessed on 3 June 2021).
  53. Fujino, M.; Yoshizaki, Y.; Kawamura, Y. Natural-Laminar-Flow Airfoil Development for the Honda Jet. In Proceedings of the 20th AIAA Applied Aerodynamics Conference, St. Louis, MO, USA, 24–26 June 2002. [Google Scholar] [CrossRef]
  54. Certification Specifications and Acceptable Means of Compliance for Large Aeroplanes CS-25. 2020. Available online: https://bit.ly/3uJCREt (accessed on 3 June 2021).
  55. Hoelzen, J.; Liu, Y.; Bensmann, B.; Winnefeld, C.; Elham, A.; Friedrichs, J.; Hanke-Rauschenbach, R. Conceptual Design of Operation Strategies for Hybrid-Electric Aircraft. Energies 2018, 11, 217. [Google Scholar] [CrossRef] [Green Version]
  56. U.S. Energy Information Administration. Annual Energy Outlook 2021. Available online: https://bit.ly/3wNOKKM (accessed on 3 June 2021).
  57. Coe, P.; Applin, Z. Low-Speed Stability and Control Characteristics of a Transport Model with Aft-Fuselage-Mounted Advanced Turboprops; NASA TM-2535; NASA: Hampton, VA, USA, 1986. Available online: https://core.ac.uk/display/42841676 (accessed on 3 June 2021).
  58. Riley, D.; Brandon, J.; Glaab, L. Piloted Simulation Study of an ILS Approach of a Twin-pusher Business/Commuter Turboprop Aircraft Configuration; NASA TM-451; NASA: Hampton, VA, USA, 1994. Available online: https://core.ac.uk/display/42787573 (accessed on 3 June 2021).
  59. Scholz, D. Limits to Principles of Electric Flight. In Proceedings of the Deutscher Luft- und Raumfahrtkongress 2019, Darmstadt, Germany, 30 September–2 December 2019. [Google Scholar] [CrossRef]
  60. Dallara, E. Aircraft Design for Reduced Climate Impact. Dissertation, Stanford University. 2011. Available online: https://perma.cc/3TDH-TB2S (accessed on 3 June 2021).
  61. Baughcum, S.; Tritz, T.; Henderson, S.; Pickett, D. Scheduled Civil Aircraft Emission Inventories for 1992: Database Development and Analysis; NASA Contractor Report 4700; NASA: Hampton, VA, USA, 1996. Available online: https://core.ac.uk/display/42776850 (accessed on 3 June 2021).
  62. Aircraft Engine Emissions Databank.ICAODoc 9646-AN/943, Excel Data-Base. 2019. Available online: https://bit.ly/34xCPEP (accessed on 3 June 2021).
  63. Capuano, L. International Energy Outlook 2020 (IEO2020). Center for Strategic and International Studies 14 October 2020. Available online: https://perma.cc/9L4A-KAHA (accessed on 3 June 2021).
  64. Greitzer, E.; Bonnefoy, P.; de la Rosa Blanco, E.; Dorbian, C.; Drela, M.; Hall, D.; Hansman, R.; Hileman, J.; Liebeck, R.; Lovegren, J.; et al. N+3 Aircraft Concept Designs and Trade Studies; NASA/CR—2010-216794/VOL1; NASA: Cleveland, OH, USA, 2010. Available online: https://core.ac.uk/display/10557296 (accessed on 3 June 2021).
  65. Andersson, J.P.; Krus, P. A Multi-Objective Optimization Approach to Aircraft Preliminary Design. In Proceedings of the SAE World Aviation Congress, Montreal, QC, Canada, 8–11 September 2003. [Google Scholar] [CrossRef]
  66. Donlan, C. An Interim Report on the Stability and Control of Tailless Airplanes. NACA Technical Report 796. August 1944. Available online: https://core.ac.uk/display/10516173 (accessed on 3 June 2021).
  67. ATR-72 Series 600 Brochure. 2014. Available online: https://perma.cc/95KA-S7XS (accessed on 3 June 2021).
Figure 1. Forecast of CO2 emission impact due to increased transportation and emission reduction goals [1].
Aerospace 08 00163 g001
Figure 2. A family of energy-efficient aircraft under the Se2A cluster.
Aerospace 08 00163 g002
Figure 3. Effect of laminar flow control on overall aircraft drag [20].
Aerospace 08 00163 g003
Figure 4. Schematic views of the active suction system [20].
Aerospace 08 00163 g004
Figure 5. Initial aircraft sizing framework using SUAVE.
Aerospace 08 00163 g005
Figure 6. Battery-electric energy network layout.
Aerospace 08 00163 g006
Figure 7. Wing folding penalty as a function of the wing semi-span [50].
Aerospace 08 00163 g007
Figure 8. SE2A SR mission profile.
Aerospace 08 00163 g008
Figure 9. OpenVSP models of two configurations for the selection.
Aerospace 08 00163 g009
Figure 10. A sample constraint diagram and the range of possible design point or the initial sizing.
Aerospace 08 00163 g010
Figure 11. Sensitivity of weights and DOC to the aircraft AR and wing loading for the low-wing configuration (pack energy density of 700 Wh/kg).
Aerospace 08 00163 g011
Figure 12. Forcing factor as a function of altitude [60].
Aerospace 08 00163 g012
Figure 13. Wing planforms for selected optimization problems.
Aerospace 08 00163 g013
Figure 14. Payload-range diagrams for the SE2A SR and ATR-72.
Aerospace 08 00163 g014
Figure 15. SE2A SR aircraft geometry.
Aerospace 08 00163 g015
Figure 16. Sensitivity to the battery energy density based on minimum DOC concepts.
Aerospace 08 00163 g016
Figure 17. Sensitivity of aircraft characteristics to changes in technology levels at Structural weight reduction of 0.0.
Aerospace 08 00163 g017
Figure 18. Sensitivity of aircraft characteristics to changes in technology levels at Structural weight reduction of 0.1.
Aerospace 08 00163 g018
Figure 19. Sensitivity of aircraft characteristics to changes in technology levels at Structural weight reduction of 0.19.
Aerospace 08 00163 g019
Table 1. SE2A SR energy network assumptions.
ComponentParameterValueReference
High-power electric motorEfficiency η M = 99.5 % [35]
Motor cryo-cooling systemPower loss P l o s s = 10 kW[45]
Carnot efficiency ϵ = 0.3 [45]
PMADEfficiency η P M A D = 99 % [46]
BatteryEnergy density ω B = 700   Wh kg [35]
Electric cablesDensity ρ c a b l e = 3.9   kg m [46]
Efficiency η c a b l e = 99.5 % [46]
Table 2. SE2A SR top-level requirements.
RequirementValueUnits
Design range for maximum payload926km
Maximum payload7500kg
Cruise Mach number0.42
Service ceiling7620m
Take-off field length1400m
Landing distance1100m
CertificationCS-25 [54]
Table 3. Comparison between the high-wing and low-wing concepts.
ParameterHigh WingLow WingUnits
MTOM ( W 0 )38,23835,369kg
OEW ( W e )30,73827,869kg
Battery weight ( W b )14,62912,783kg
AR11.011.0-
Wing span (b)40.238.7m
taper ratio ( λ )0.50.5-
Wing area ( S w )147.0136.0m2
Power-to-weight ratio ( P / W )0.1440.146kW/kg
DOC10,0749603EUR/flight
Table 4. SGTP values [60].
Species SGTP i , 100 Units
CO23.58 × 10 14 K/kg CO 2
O 3 s 7.79 × 10 12 K/kg NO x
O 3 L −9.14 × 10 13 K/kg NO x
C H 4 −3.90 × 10 12 K/kg NO x
Contrails1.37 × 10 13 K/km
Cirrus4.12 × 10 13 K/km
Table 5. SE2A SR aircraft optimization problem definition.
LowerUpperUnits
minimize1. D O C
2. W b
wrt A R 8.0016.00
λ 0.250.75
C r 3.007.00m
t / c | r o o t 12.0018.00%
t / c | t i p 12.0018.00%
P / W 0.050.30
subject toTake-off field length (TOFL) 1400.0m
P / W P / W | c l i m b 0.0
Landing field length (LFL) 1100.0m
η m a x 1.0
b 50.0m
C t 1.4m
Table 6. Comparison between optimized concepts.
ParameterInitial DesignDOC-Optimal DesignDOC-Optimal Design (No Folding)Battery-Optimal DesignATR-72Units
W 0 35,36934,44133,64934,78323,000kg
W e 27,86926,94126,14927,28313,311kg
W b 12,78312,26211,52710,379-kg
W f u e l , m i s s i o n ----1913kg
A R 11.010.8612.2316.012.0-
b38.739.641.351.727.05m
λ 0.50.310.30.2850.55-
C r 4.685.835.235.002.74m
S w i n g 136.0145.4139.6165.561.0m2
t / c | r o o t 0.180.180.180.170.18-
t / c | t i p 0.130.130.130.120.13-
P / W 0.1430.1250.130.110.16kW/kg
DOC96039479939798386740EUR/flight
m C O 2 204519611844166011,838kg
TOFL13381381136813601367m
LFL10259729859341207m
Table 7. Comparison between optimized concepts with and without the wing span constraint.
ParameterInitial DesignDOC-Optimal DesignDOC-Optimal Design (Fixed Span)ATR-72Units
W 0 35,36934,44135,74523,000kg
W e 27,86926,94128,24413,311kg
W b 12,78312,26213,861-kg
W f u e l , m i s s i o n ---1913kg
A R 11.010.8610.012.0-
b38.739.636.027.05m
λ 0.50.310.290.55-
C r 4.685.835.572.74m
S w i n g 136.0145.4129.361.0m2
t / c | r o o t 0.180.180.180.18-
t / c | t i p 0.130.130.120.13-
P / W 0.1430.1250.140.16kW/kg
DOC9603947995736740EUR/flight
m C O 2 20451961221711,838kg
TOFL1338138113921367m
LFL102597210271207m
Table 8. Geometric properties of the SE2A SR aircraft.
ParameterWingHorizontal TailVertical TailUnits
A R 10.05.071.25-
b36.010.03.5m
λ 0.290.550.8-
Λ C / 4 0.015.026.0deg
Γ 4.00.00.0deg
C r 5.582.53.13m
S p l a n f o r m 129.317.89.80m2
t / c | r o o t 0.180.100.10-
t / c | t i p 0.120.100.10-
Flap span ratio0.6---
Flap chord ratio0.2---
Aileron span ratio0.25---
Aileron chord ratio0.20---
Elevator span ratio-1.0--
Elevator chord ratio-0.25--
Rudder span ratio-1.00.8-
Rudder chord ratio-0.250.25-
V H T -0.59--
V V T --0.024-
Table 9. Comparison of DOC components depending on the battery energy density for the SE2A SR aircraft in EUR/flight.
DOC Component700 Wh/kg with Technologies700 Wh/kg without Technologies1300 Wh/kg with Technologies1300 Wh/kg without Technologies
Energy80814387001037
Crew1369136913691369
Maintenance3199189129371596
Capital2233355419282514
Fees1994235017991928
Total960310,60487348446
Table 10. MTOM values for the airframe weight reduction of 0%.
70% Laminar Flow45% Laminar FlowUnits
limit load 1.539,66542,500kg
limit load 2.542,10046,800kg
Table 11. MTOM values for the airframe weight reduction of 19%.
70% Laminar Flow45% Laminar FlowUnits
limit load 1.537,30039,800kg
limit load 2.538,90041,800kg
Table 12. MTOM values for the limit load factor of 1.5.
0% Airframe Weight Reduction19% Airframe Weight ReductionUnits
70% laminar flow39,66537,300kg
45% laminar flow42,50039,800kg
Table 13. MTOM values for the limit load factor of 2.5.
0% Airframe Weight Reduction19% Airframe Weight ReductionUnits
70% laminar flow42,10042,500kg
45% laminar flow46,80041,800kg
Publisher’s Note: MDPI stays neutral with regard to jurisdictional claims in published maps and institutional affiliations.

