
Global Skewness and Coherence for Hypersonic Shock-Wave/Boundary-Layer Interactions with Pressure-Sensitive Paint


1
Department of Mechanical and Aerospace Engineering, University of Dayton, Dayton, OH 45469, USA
2
Department of Aerospace and Mechanical Engineering, University of Notre Dame, Notre Dame, IN 46556, USA
*
Author to whom correspondence should be addressed.
Aerospace 2021, 8(5), 123; https://doi.org/10.3390/aerospace8050123
Submission received: 29 March 2021
/
Revised: 9 April 2021
/
Accepted: 20 April 2021
/
Published: 22 April 2021
(This article belongs to the Special Issue Hypersonics: Emerging Research)
Abstract
:The global surface pressure was measured on a 7 half-angle circular cone/flare model at a nominally zero angle of attack using pressure-sensitive paint (PSP). These experiments were conducted to illustrate fast PSP’s usefulness and effectiveness at measuring the unsteady structures inherent to hypersonic shock-wave/boundary-layer interactions (SWBLIs). Mean and fluctuating surface pressure was measured with a temperature-corrected, high-frequency-response (≈10 kHz) anodized-aluminum pressure-sensitive paint (AA-PSP) allowing for novel, global calculations of skewness and coherence. These analyses complement traditional SWBLI data-reduction methodologies by providing high-spatial-resolution measurements of the mean and fluctuating locations of the shock feet, as well as the frequency-dependent measure of the relationship between characteristic flow features. The skewness indicated the mean locations of the separation and reattachment shock feet as well as their fluctuations over the course of the test. The coherence indicated that the separation and reattachment shock feet fluctuate about their mean location at the same frequency as one another, but 180 degrees out of phase. This results in a large-scale ‘breathing motion’ of the separated region characteristic of large separation bubbles. These experimental findings validate the usefulness of AA-PSP, and associated data-reduction methodologies, to provide global physical insights of unsteady SWBLI surface behavior in the hypersonic flow regime. Similar methodologies can be incorporated in future experiments to investigate complex and novel SWBLIs.
1. Introduction
The steady and unsteady aerodynamic loads on hypersonic vehicles with complex geometries are often strongly influenced by shock-wave/boundary-layer interactions (SWBLIs) [1]. These loads can have a significant influence on the lift, drag, and moments experienced by flight vehicles [2]. Accurate knowledge of the SWBLI behavior on a vehicle is needed to design the control system hardware (e.g., fin size and shape) and software (control laws to ensure the deflection inputs achieve the desired moment output). The unsteadiness of the phenomenon is of particular concern for flight applications because the associated wall pressure fluctuations have significant energy content between 10 and 1000 Hz, the range of typical resonant frequencies for flat panels on high-Mach-number aircraft [3,4]. A highly unsteady flowfield can cause aircraft buffeting, inlet instability, severe thermal loading, and aerostructure fatigue when the pressure oscillations couple to panel resonant frequencies [5,6].
This SWBLI phenomenon has been studied with traditional point sensors for more than 70 years (see reviews [1,5,7,8,9,10]). During this time, the interactions with an incident shock or compression ramp (i.e., two-dimensional interactions) have been the most documented cases [11]. However, some flight-test vehicles (e.g., the United States Air Force Research Laboratory’s HIFiRE-1 [12] and the German Aerospace Center’s ROTEX-T [13]) experience nominally axisymmetric SWBLIs, illustrating the need to understand the associated flowfield. In addition, as Holden explained, “two-dimensional configurations lack well-defined boundary conditions, which has always provided a major stumbling block for the numerical simulations of these flows” [14]. A number of previous works [15,16,17,18,19,20,21] have investigated axisymmetric SWBLIs on hollow cylinder/flare geometries; however, from both an experimental and a computational viewpoint, a cone/flare geometry represents a more practical and definable solution [22,23]. Experimental cone/flare SWBLIs have been investigated by a smaller subset of researchers [14,22,23,24,25,26,27] and will be the focus of the current study.
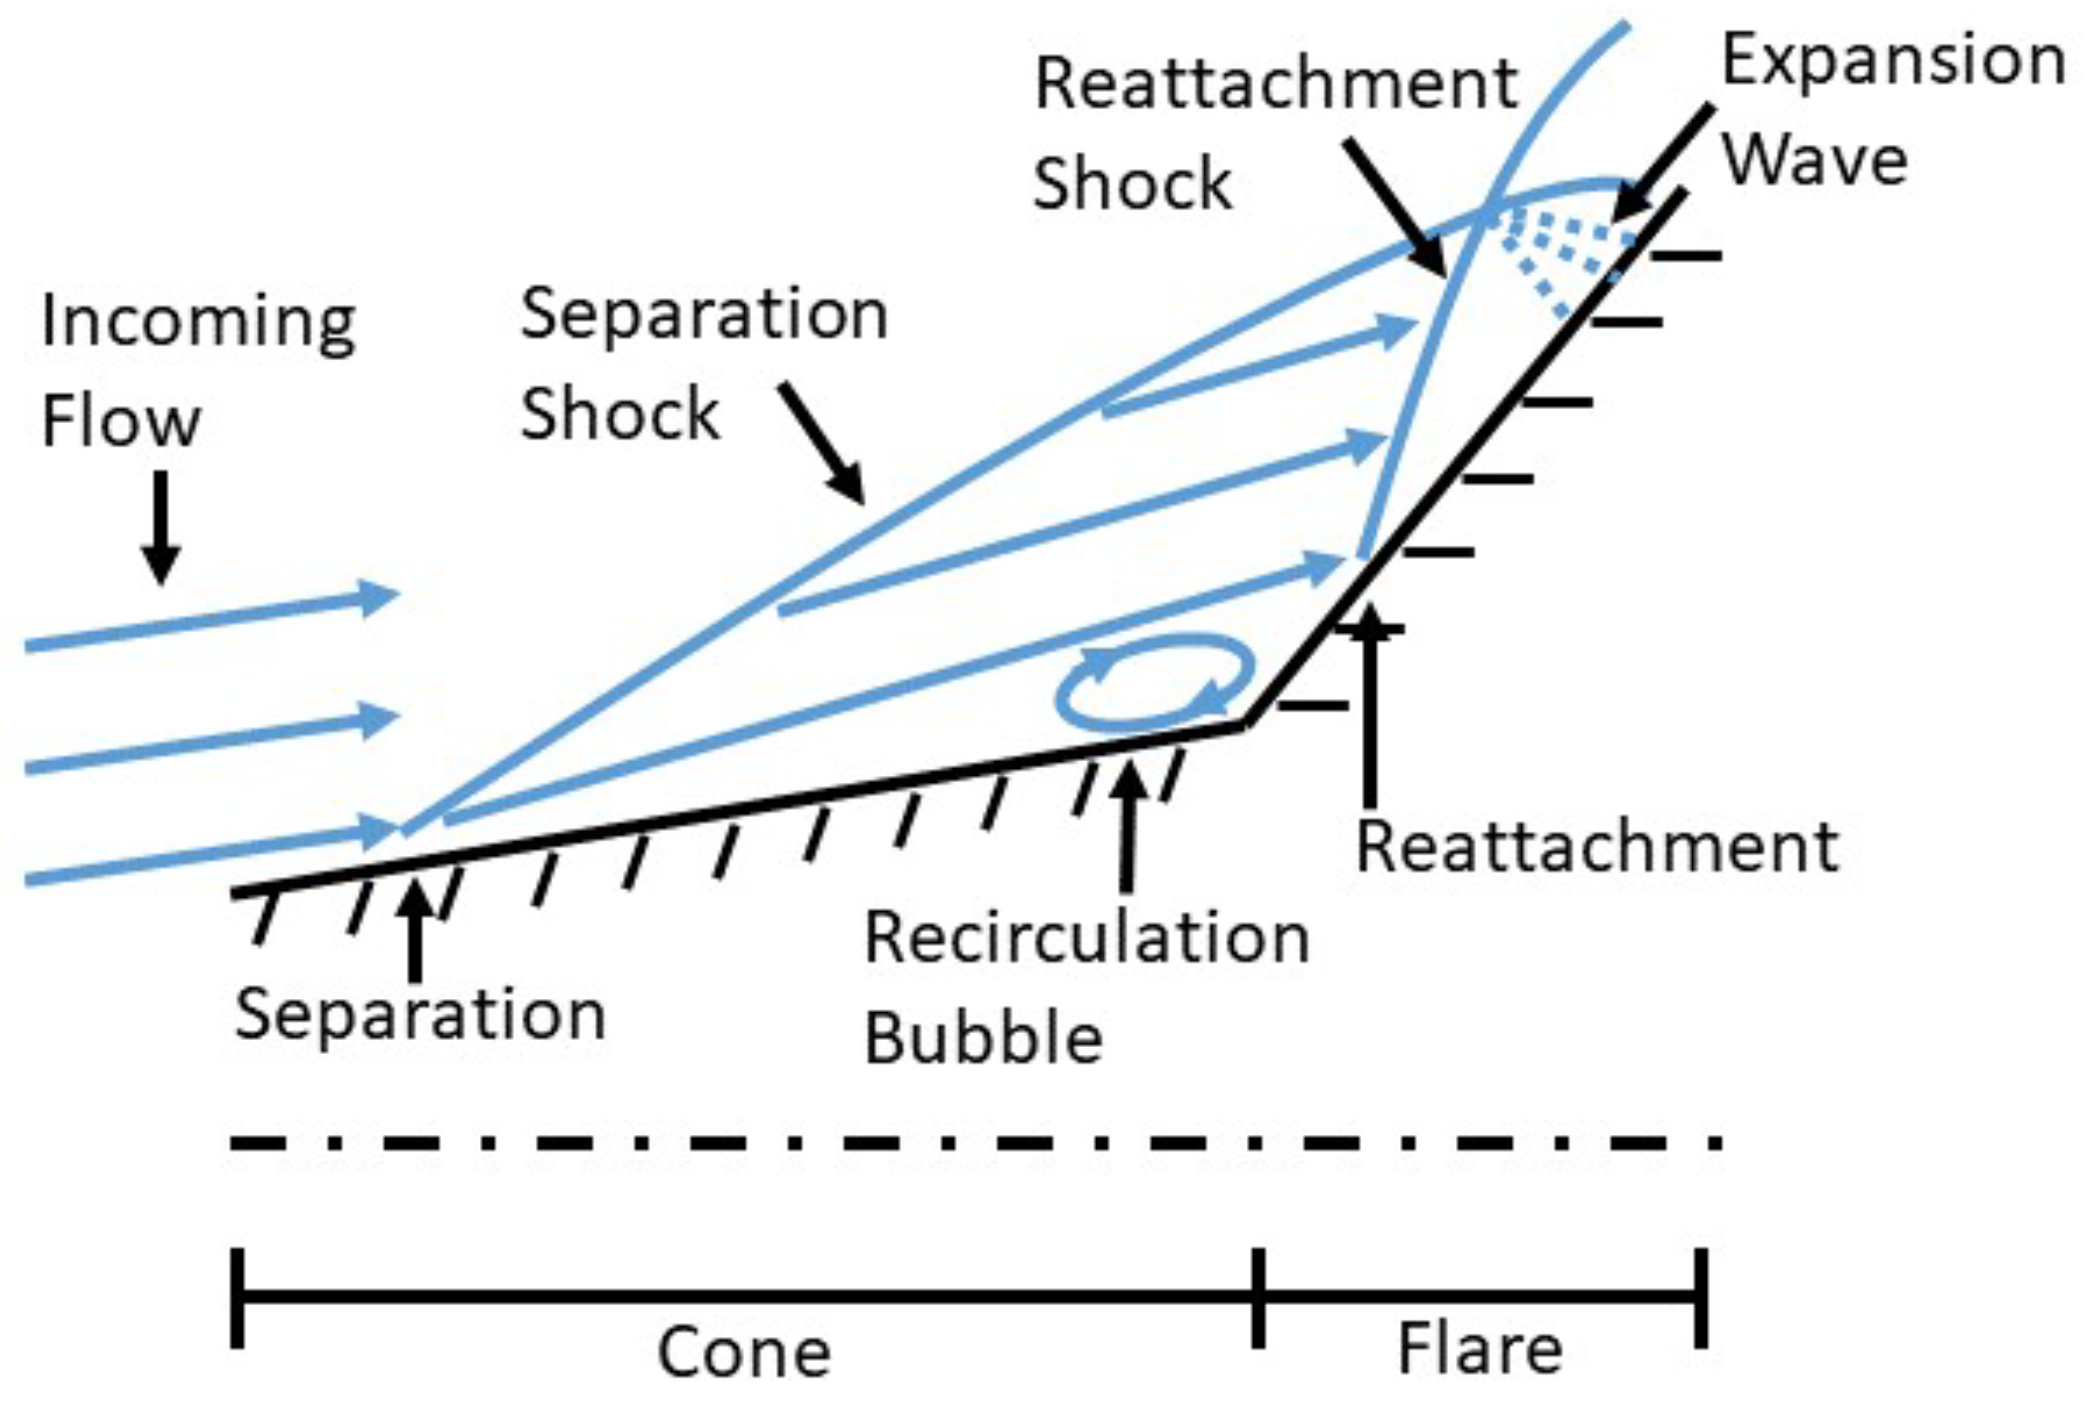
SWBLIs on an axisymmetric cone/flare geometry are illustrated in Figure 1 (from Running et al. [27]). As the boundary layer grows along the cone frustum, it faces an adverse pressure gradient due to the presence of the flare, potentially causing it to locally separate from the surface. Because the high pressure caused by the flare feeds upstream through the subsonic portion of the boundary layer, the separation takes place ahead of the cone/flare junction [2]. The upward deflection of the separated flow induces a shock wave, identified in Figure 1 as the separation shock [5]. If the flare is long enough, the separated boundary layer will reattach at some downstream location causing a second shock wave, the reattachment shock. Measurements on the model surface can indicate the locations of each of these shock feet. Below the slip line, in between the two shocks, a recirculation bubble forms. Upon reattachment, the boundary layer has become relatively thin and the pressure and density are high. Thus, this becomes a region of high local aerodynamic heating. An expansion wave emanates from the point where the separation and reattachment shocks intersect (i.e., the triple point) [28].
If the shock waves associated with the SWBLI pictured in Figure 1 are intense enough to cause separation, flow unsteadiness appears to be the “almost inevitable outcome” [1]. Early SWBLI studies conducted in the 1950s, 1960s, and 1970s (i.e., Bogdonoff [29], Price and Stallings [30], Kaufman et al. [31], and Winkelmann [32]) noted this unsteady phenomenon in a qualitative sense. The work of Kistler [33] was the first to make quantitative high-frequency measurements of the behavior. Past research has shown that this unsteadiness is characterized by a low-frequency, large-scale motion of the separation and reattachment shock feet. The frequency of this unsteadiness is low relative to the typical large-eddy frequency of the incoming boundary layer. The scale of this unsteadiness is relatively large because the length of the intermittent region can be several boundary-layer thicknesses, depending on the model geometry being tested [34]. The research community has come to the general consensus that strong interactions, which exhibit large separation bubbles (such as those observed in the current study), are primarily driven by a downstream instability, whereas weakly separated interactions can be strongly influenced by fluctuations in the upstream boundary layer [5]. It appears that for strong separation, the separation bubble pulsates in response to a global instability that leads to fluctuations of the reattachment point. The reattachment point fluctuations cause expansion/contraction of the bubble and a synchronous movement of the separation shock foot on the model surface [5].
Significant improvements in global surface temperature techniques, such as infrared thermography, have allowed a number of researchers to investigate SWBLI heating phenomena on a global scale; however, due to limited frame rates and slow surface temperature response, these studies were not able to measure or characterize the unsteady system behavior [20,24,25,26,27,35,36,37]. Surface pressure measurements of SWBLIs in both ground- and flight-test environments have almost exclusively been conducted with traditional piezoelectric point sensors (e.g., Kulites or PicoCoulomB’s) [1,5,9,38]. Relatively high spatial resolution is desired, if not required, when studying this phenomenon due to the oscillating shock waves, large intermittent regions, and variety of dominant length scales. Tens to hundreds of sensors are sometimes needed to obtain an acceptable surface pressure field [39].
Recent advances in high-frequency-response (i.e., “fast”) pressure-sensitive paint (PSP) have made it a more reliable and practical alternative for studying unsteady flow phenomena in high-Mach-number environments [40]. PSP addresses the spatial-resolution limitations of point-sensor measurements by offering a non-intrusive, global surface pressure technique at a lower cost [39]. It offers a number of substantial advantages for measuring the dynamics of SWBLIs. The global surface pressure contours that result provide high-spatial-resolution data everywhere in the field of view. This allows for more accurate measurements of boundary-layer separation and reattachment, shock-foot oscillations, intermittent regions, and recirculation-bubble structures using the same definitions as other surface pressure studies. These phenomena are measured on a global scale up to the highest relevant frequencies. The ability to investigate spanwise or azimuthally varying phenomena is another improvement over point sensors located along a single ray. The locations of the relevant flow structures do not need to be known before an experimental campaign, freeing the researcher/designer from the need to know where to place point sensors. This is critical as the next generation of hypersonic vehicles become more sophisticated and induce more complex flowfields. PSP also provides unique and insightful global surface data for comparison to computations. For example, it has been shown that without accurate modeling of unsteadiness, not even mean SWBLI quantities can be computed accurately for many flows [9]. The unsteady SWBLI computational abilities continue to grow, but as Dolling’s review points out, more experimental data sets with high-spatial-resolution measurements and sufficient boundary conditions are needed for computational validations [9]. In addition, reduced-order modeling and investigations into the effectiveness of novel flow-control techniques can be more easily evaluated with global data by decreasing the dimensionality of the phenomenon using tools such as proper orthogonal decomposition [41].
Global surface pressure data are nearly non-existent in the SWBLI literature, mostly due to the relatively recent technical advances achieved by the PSP community. Most recently, Running and Juliano [42] reported mean surface pressure and power-spectral results from the same data presented here. To the authors’ knowledge, the impinging-shock/flat-plate work by Currao et al. [43] is the only other PSP application to a hypersonic SWBLI. There have been a handful of other works conducted in the supersonic regime [44,45,46,47,48].
The motivation for the current study is to illustrate the PSP technique’s unique ability to measure hypersonic unsteady SWBLIs with high spatial resolution. Moving beyond traditional data-reduction methodologies such as mean/fluctuating surface pressure and power spectra, the PSP data will be used to calculate the skewness and magnitude-squared coherence spectra on a global scale. The skewness results will complement those from Mears et al. [48] for a two-dimensional geometry; however, magnitude-squared coherence for SWBLIs has not been presented on a global scale in the literature to the authors’ knowledge. These analyses will provide high-spatial-resolution insights into the unsteady dynamics of the shock feet and structures under the separated shear layer.
2. Materials and Methods
The experimental setup and data-reduction methodologies used in the current study are identical to those described in Running and Juliano [42], and will only be briefly described here for conciseness. The data presented herein were collected in the pulsed arc-heated hypersonic wind tunnel (ACT-1) in White Field Laboratory at the University of Notre Dame [49,50]. Root-mean-squared pitot pressure fluctuations are approximately 2% of the mean pitot pressure [50]. Hoberg et al. [50] showed non-negligible amounts of radial, azimuthal, and axial variation in measured freestream Mach number (). The authors of that work also indicated flow condensation ≈125 mm downstream of the nozzle exit plane. The cone/flare model was placed in the tunnel such that its measurement area was within the core flow and upstream of any anticipated condensation. The data used were collected during the period of steady flow (i.e., s). Table 1 summarizes the test conditions including the freestream unit Reynolds number and model angle of attack . A digital protractor was used to ensure that the sting was perpendicular to gravity within 0.0. A foible of the ACT-1’s design is that the nozzle is bolted to the same port that provides access to the model—closing the tunnel after adjusting model alignment can alter nozzle alignment. In Running et al., the alignment was found to vary by about [51]. The angle of attack is thus . This misalignment is manifested in the current data set as gently curving separation and reattachment locations.
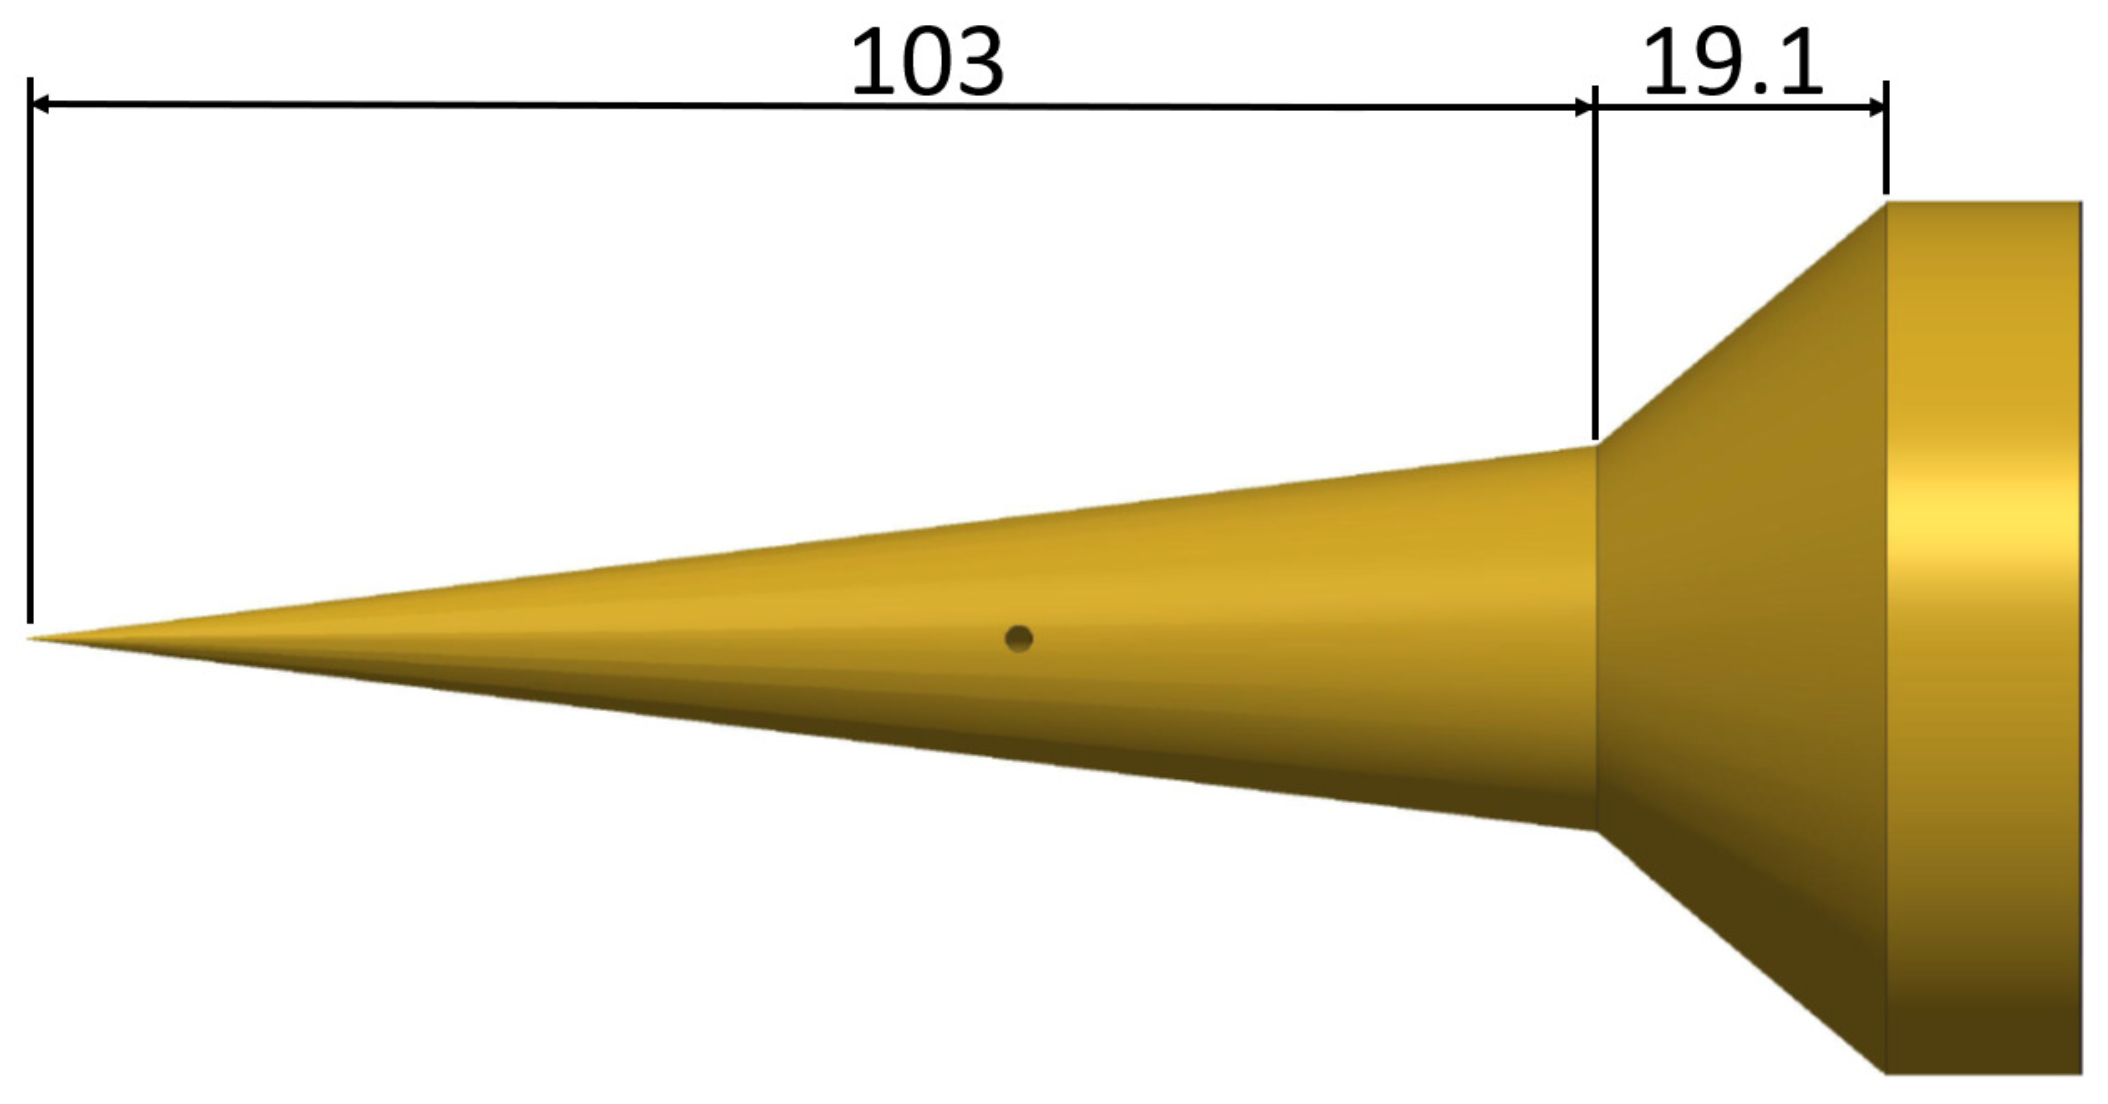
The model consisted of a 7 half-angle circular cone connected to a 19.1-mm-long flare. The diameter at their junction is 25.4 mm, and the model’s length is 122.1 mm. The model is made of one piece of aluminum 6061 and has a nominally sharp nosetip. The flare half angle is 40. Figure 2 (from Running and Juliano [42]) illustrates the model geometry with the through hole for a flush-mounted Kulite pressure transducer. The entire model was anodized and coated with the PSP luminophore. The axial distance x in this work has units of mm, where at the tip of the nosetip. The spanwise distance y in this work also has units of mm, where on the model’s centerline.
Simultaneous wind-on measurements of surface temperature and PSP intensity were sampled at 355 Hz and 20 kHz with an infrared camera (InfraTec 8300 hp, Dresden, Germany) ( pixel resolution) and high-speed camera (Phantom V2512, Wayne, NJ, USA) ( pixel resolution), respectively. The infrared camera measured the surface temperature of the anodized-aluminum frustum and flare on one half of the model while the high-speed camera measured the the PSP intensity on the other half. Both measurements spanned from mm through the end of the flare. The surface temperature data were used to correct for the paint luminophore’s inherent temperature dependency [42,51,52]. Because the infrared-thermography and PSP images were collected with different cameras at different distances, viewing angles, frame rates, etc., an image-mapping technique was developed [53,54] and implemented to generate precise coordinate transformations to both images. The PSP used was an anodized-aluminum pressure-sensitive paint with Bathophen Ruthenium (RuDPP) as the luminophore.
Based on the rms surface pressure fluctuations and size of the separation region, Running [54] showed that the boundary layer entering the separation region is laminar. The state of the boundary layer upon reattachment is not known with certainty; however, looking at the raw data for other laminar tests at different , a clear trend of decreasing separation length with increasing is observed. This indicates that the boundary-layer transition process has likely started upon/near reattachment [1,15,26,55], initiating an unsteady reattachment intermittent region driving the global system unsteadiness [56].
The surface pressure is decomposed into mean and fluctuating components as shown in Equation (1),
where p is the temperature-corrected surface pressure calculated directly from the PSP calibration, is the mean (in time) surface pressure, and is the fluctuating surface pressure. The mean component of the surface pressure is calculated by finding a linear fit for the p versus t trace during the portion of the test exhibiting constant flow properties (i.e., s). See Figure 12a in Running and Juliano [42] for an example p time history. is then defined as the mean value of this fit line, thereby providing a single value for the test at each pixel.
This method is equivalent to treating each pixel on the model’s surface as an individual pressure sensor. As discussed in Running and Juliano [42], there are uncertainty bounds on any reported p value. This uncertainty accounts for the PSP calibration, paint uniformity, temperature-correction scheme, and luminescent photodegradation. Following the methodology outlined in Funderburk and Narayanaswamy [46], the unsteady signal attenuation of the PSP has been corrected for, and the system-level spectral signal-to-noise ratio has been found to be greater than one for frequencies less than 10 kHz (i.e., the Nyquist frequency of the PSP system) [42]. See Sections 3.3.4 and 4.3 in Running and Juliano [42] for further details on the spectral uncertainty of the PSP and direct PSP-to-Kulite steady/unsteady comparisons.
One potential concern is that frequencies above 10 kHz might contain critical unsteady information; however, the literature consistently indicates frequency bands characteristic of shock-foot oscillations to be much less than 10 kHz. In addition, recent unsteady SWBLI experiments from references [55,57] both indicate significant spectral roll-off at frequencies above 10 kHz; however, due to the limiting frequency response of the PSP system, it is possible that unsteady flow features reside above 10 kHz. This remains to be determined.
3. Results and Discussion
Skewness
Mean and fluctuating surface pressure data are frequently used to measure the mean (in time) locations of the separation () and reattachment () shock feet for SWBLIs [1,28,38,58,59]. If these data are measured in an instantaneous sense, and on a global scale, they can also provide information regarding the upstream and downstream movement of each shock foot (i.e., the intermittent regions) [42]. Skewness is a statistical parameter that can be calculated from the PSP surface pressure data to supplement these commonly used metrics.
Skewness is the third standardized moment of a random variable, which is a measure of how much the signal distribution differs from a Gaussian normal distribution due to the influence of infrequent high-amplitude events, or “tails” [60]. Skewness provides a measure of the degree of asymmetry of a random distribution about its mean, and can therefore be applied to the time history of a pressure signal [61]. The concept is analogous to intermittency, which is traditionally defined as the percentage of time that a shock foot is upstream of a given axial location [34].
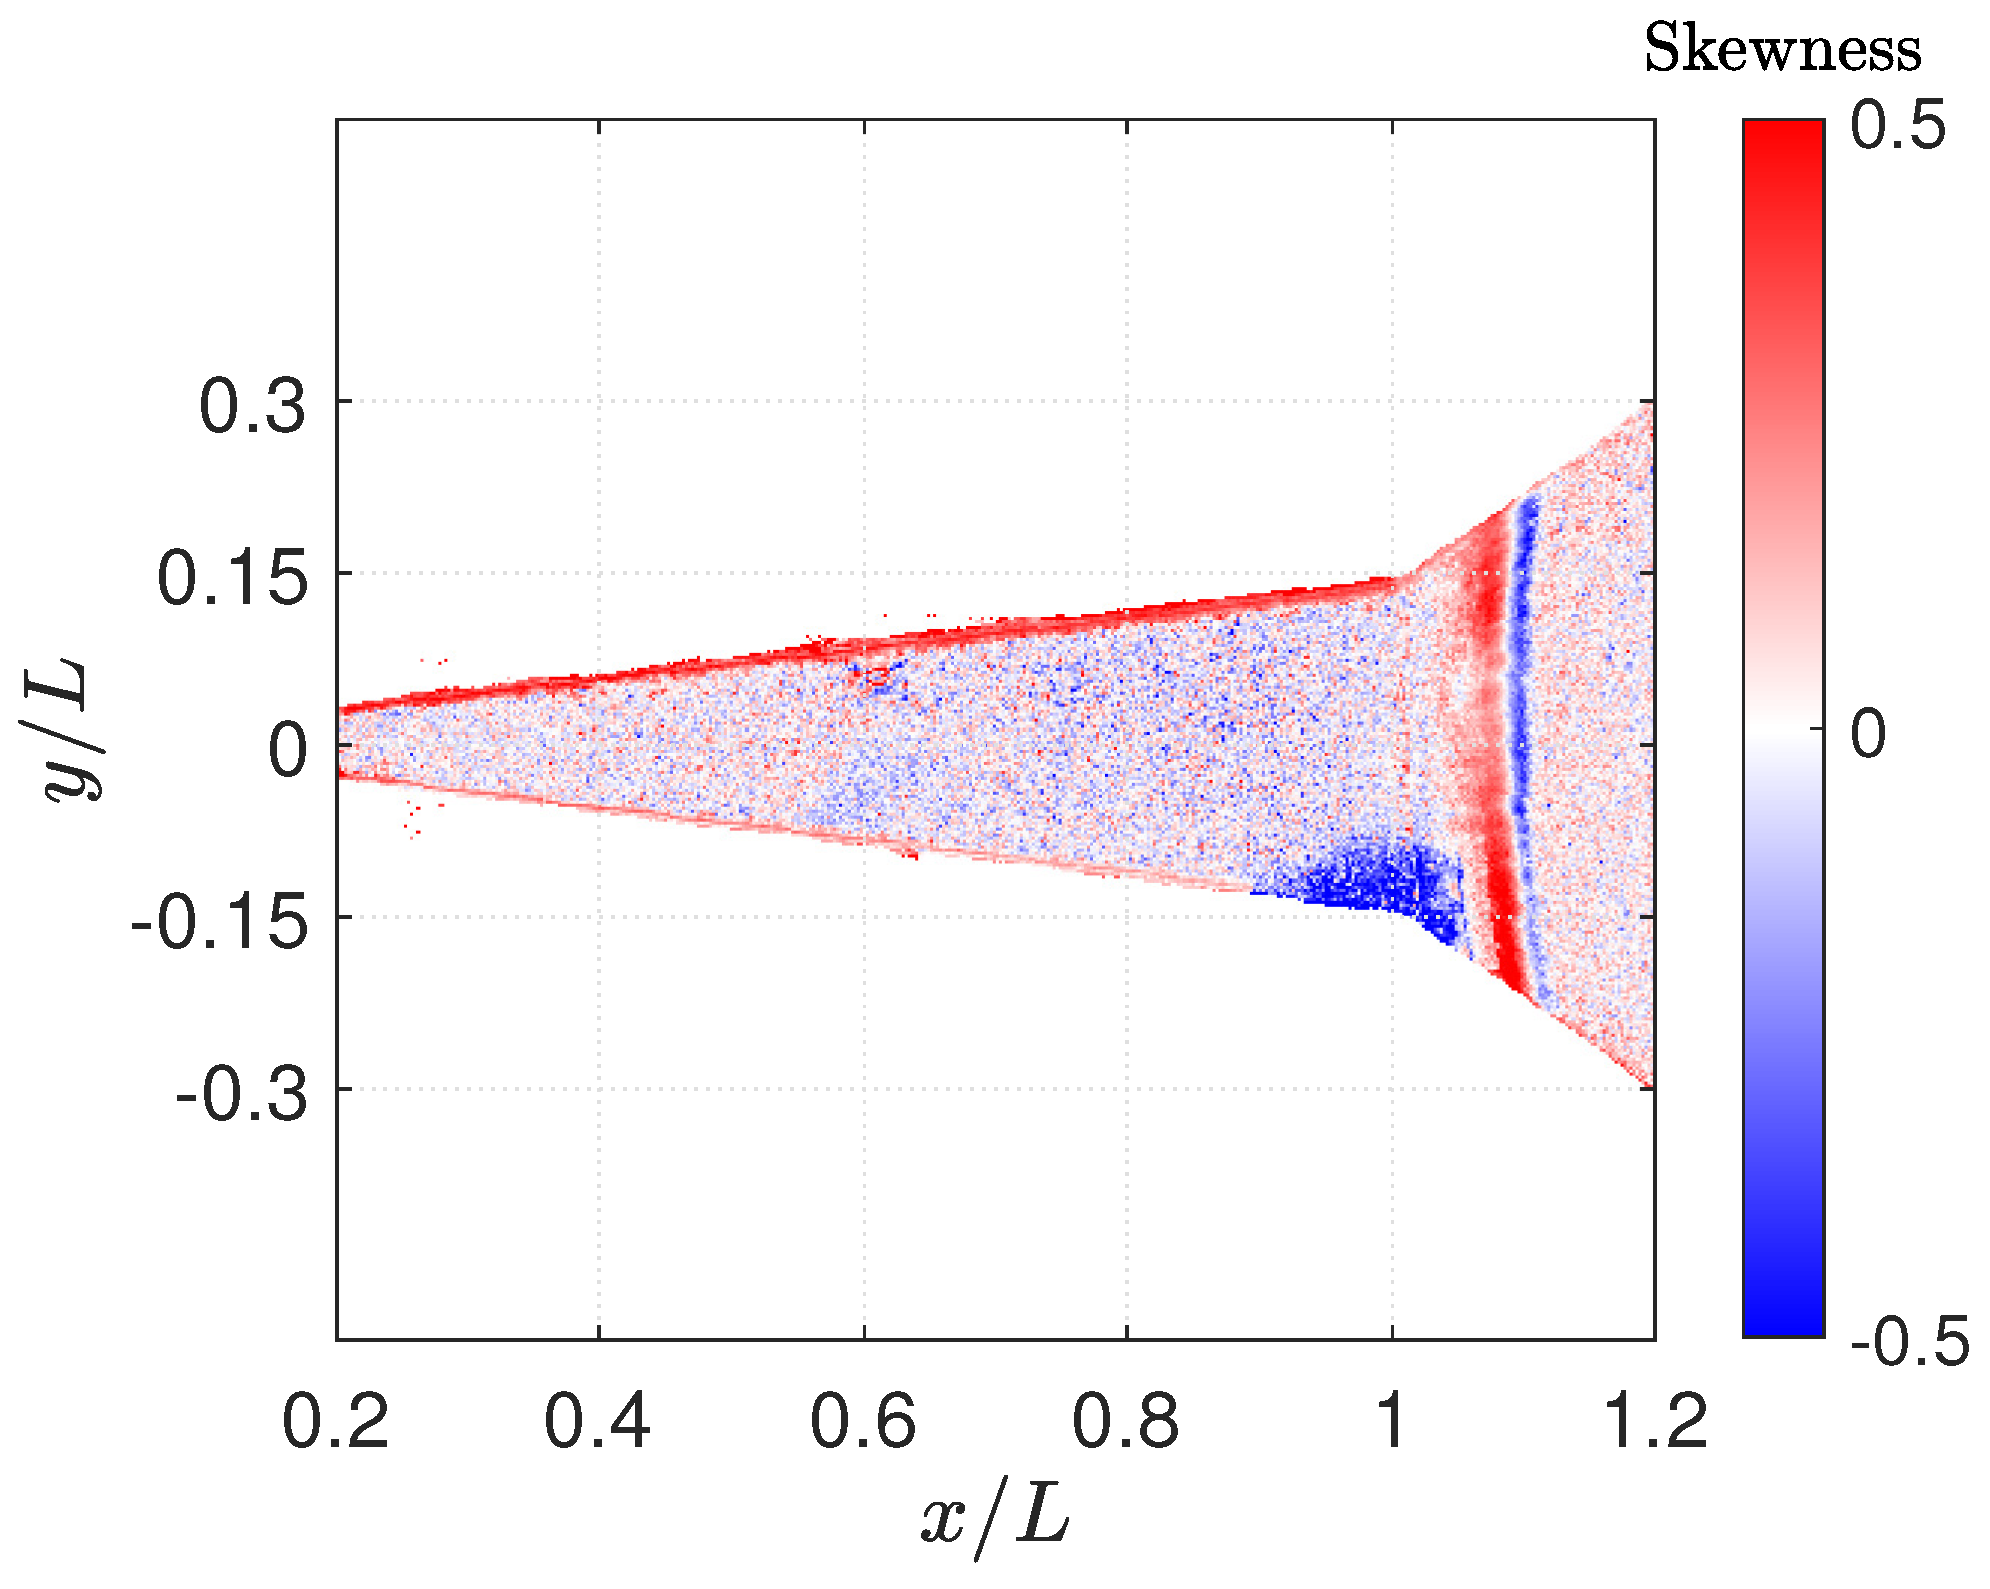
The sample skewness in this work was calculated for the time history of at every pixel location. The time history of for each pixel was temporally filtered by 0.55 ms (11 frames) for these calculations. Spatial filtering was not applied. The global contour of skewness, mapped to – coordinates, is provided in Figure 3. The x and y coordinates have been non-dimensionalized by the distance from the nosetip of the cone to the cone/flare junction location, mm. Since at the nosetip, the cone/flare junction occurs at .
At the mean shock-feet locations (i.e., 50% intermittency), the skewness is zero. Upstream of the mean locations (i.e., <50% intermittency), the skewness is positive, indicating overall lower surface pressure with occasional high excursions as the shock sweeps upstream. The return to zero skewness demarcates the upstream extent of the shock-foot motion (i.e., 0% intermittency). Similarly, negative skewness is connected to >50% intermittency. These data supplement traditional surface pressure measurements by indicating the direction of shock-foot oscillation—generally between positive and negative skewness (i.e., red and blue, respectively), with zero skewness indicating the mean location (i.e., white) [61]. These structures are observed most clearly in Figure 3 for the reattachment shock foot on the flare due to the relatively high signal in that region; however, the same features are visible along streamwise profiles for the separation shock foot, as shown in Figure 4 below. The line of positive (i.e., red) skewness along the top edge of the conical forebody and the patch of negative (i.e., blue) skewness near along the bottom of the image are artifacts of imperfect model alignment relative to the incoming flow, and are therefore not believed to be indicative of relevant flow features.
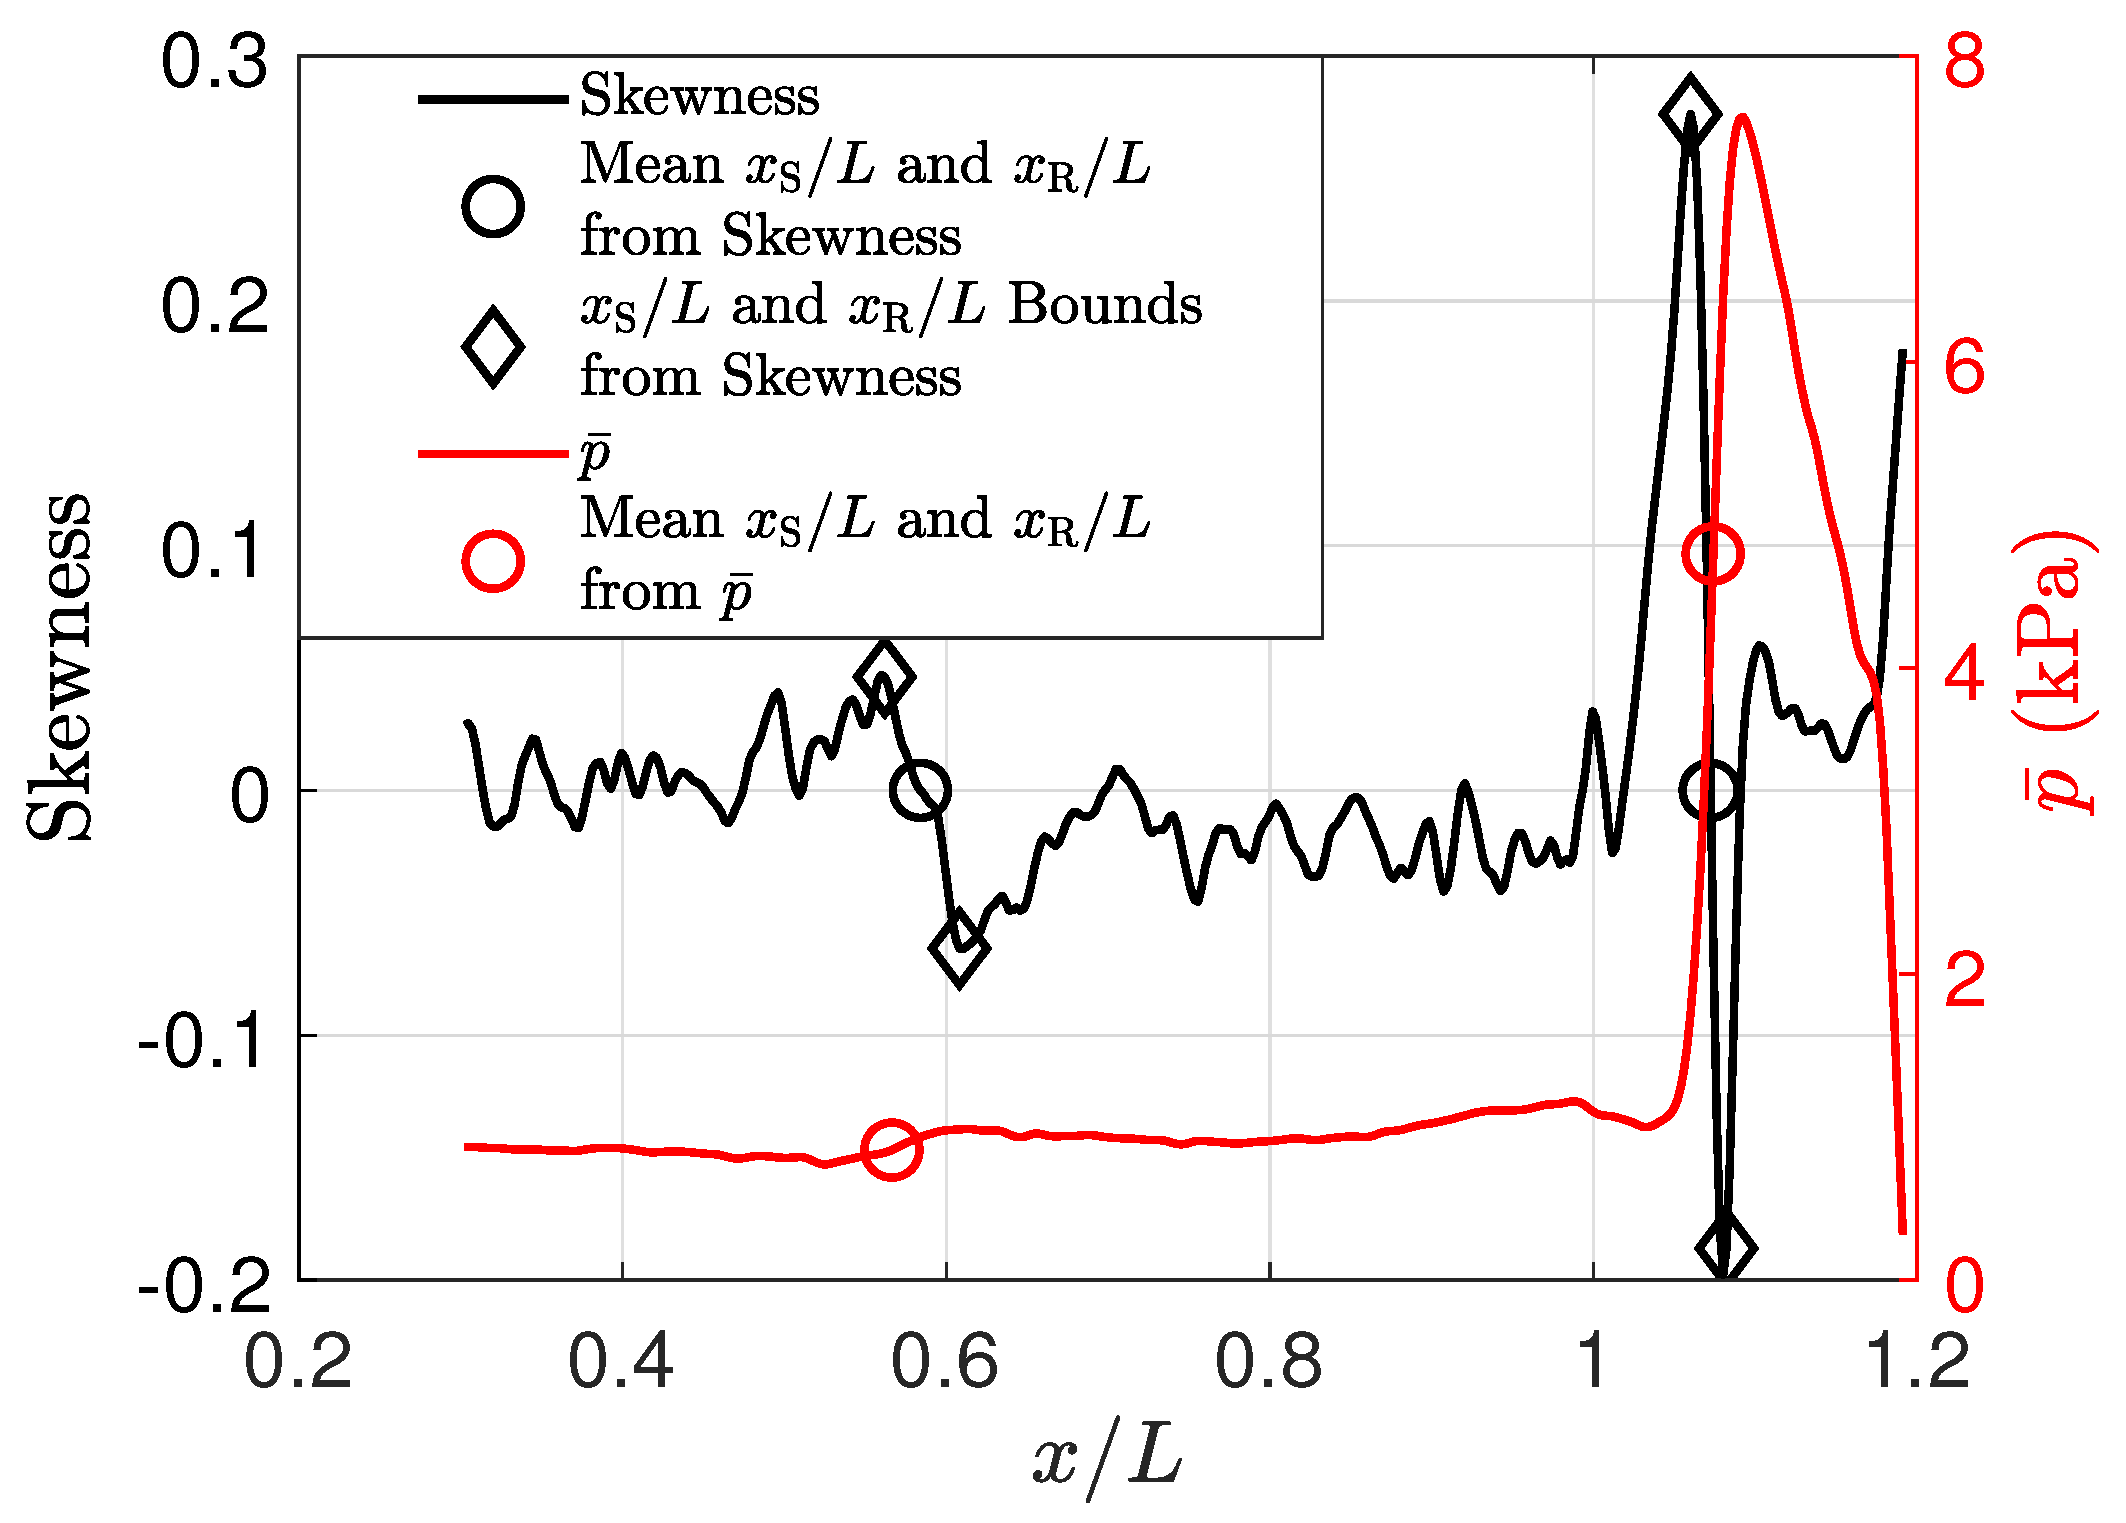
The streamwise skewness profile, averaged over a range of mm (i.e., ), for the contour in Figure 3 is provided by the black line in Figure 4. This centerline profile provides a more quantitative picture of the shock-feet locations and fluctuating behavior. It was observed that over the course of the test, the upstream and downstream extents defined by a return to zero skewness bounded all of the separation and reattachment shock-foot oscillations indicated by the instantaneous surface pressure metrics discussed in Running and Juliano [42]. These bounds are tightened axially by instead defining the upstream and downstream extents by the local skewness peaks and troughs, respectively. This tighter definition still bounded 99% of the separation and reattachment shock-foot oscillations. This tighter definition is illustrated by the black open-diamond markers in Figure 4.
Also shown in Figure 4 (by the red line) is the streamwise mean-pressure profile , remade from Figure 8b in Running and Juliano [42]. The two red open-circle markers indicate the mean locations of the separation and reattachment shock feet (i.e., and ), which were inferred to correspond to the maximum streamwise gradient upstream and downstream of the cone/flare junction, respectively [42]. The black open-circle markers denote separation and reattachment as identified by zero skewness (i.e., and ). Separation locations inferred from skewness coincided very closely—within 2%—with those inferred from .
The black open-diamond markers identify local maximum and minimum skewness associated with each of the shocks and demarcate the most substantially intermittent regions. The intermittent regions associated with the separation and reattachment shock feet are 0.562–0.608 and 1.060–1.082, respectively. It is important to note that the separation shock-foot data provided in Figure 4 are nearing the noise floor of the measurement system. The minimum and maximum skewness in the separation region are only about three times larger than the nearby standard deviation of the skewness profile, and one-fifth of the absolute magnitude of the skewness at reattachment.
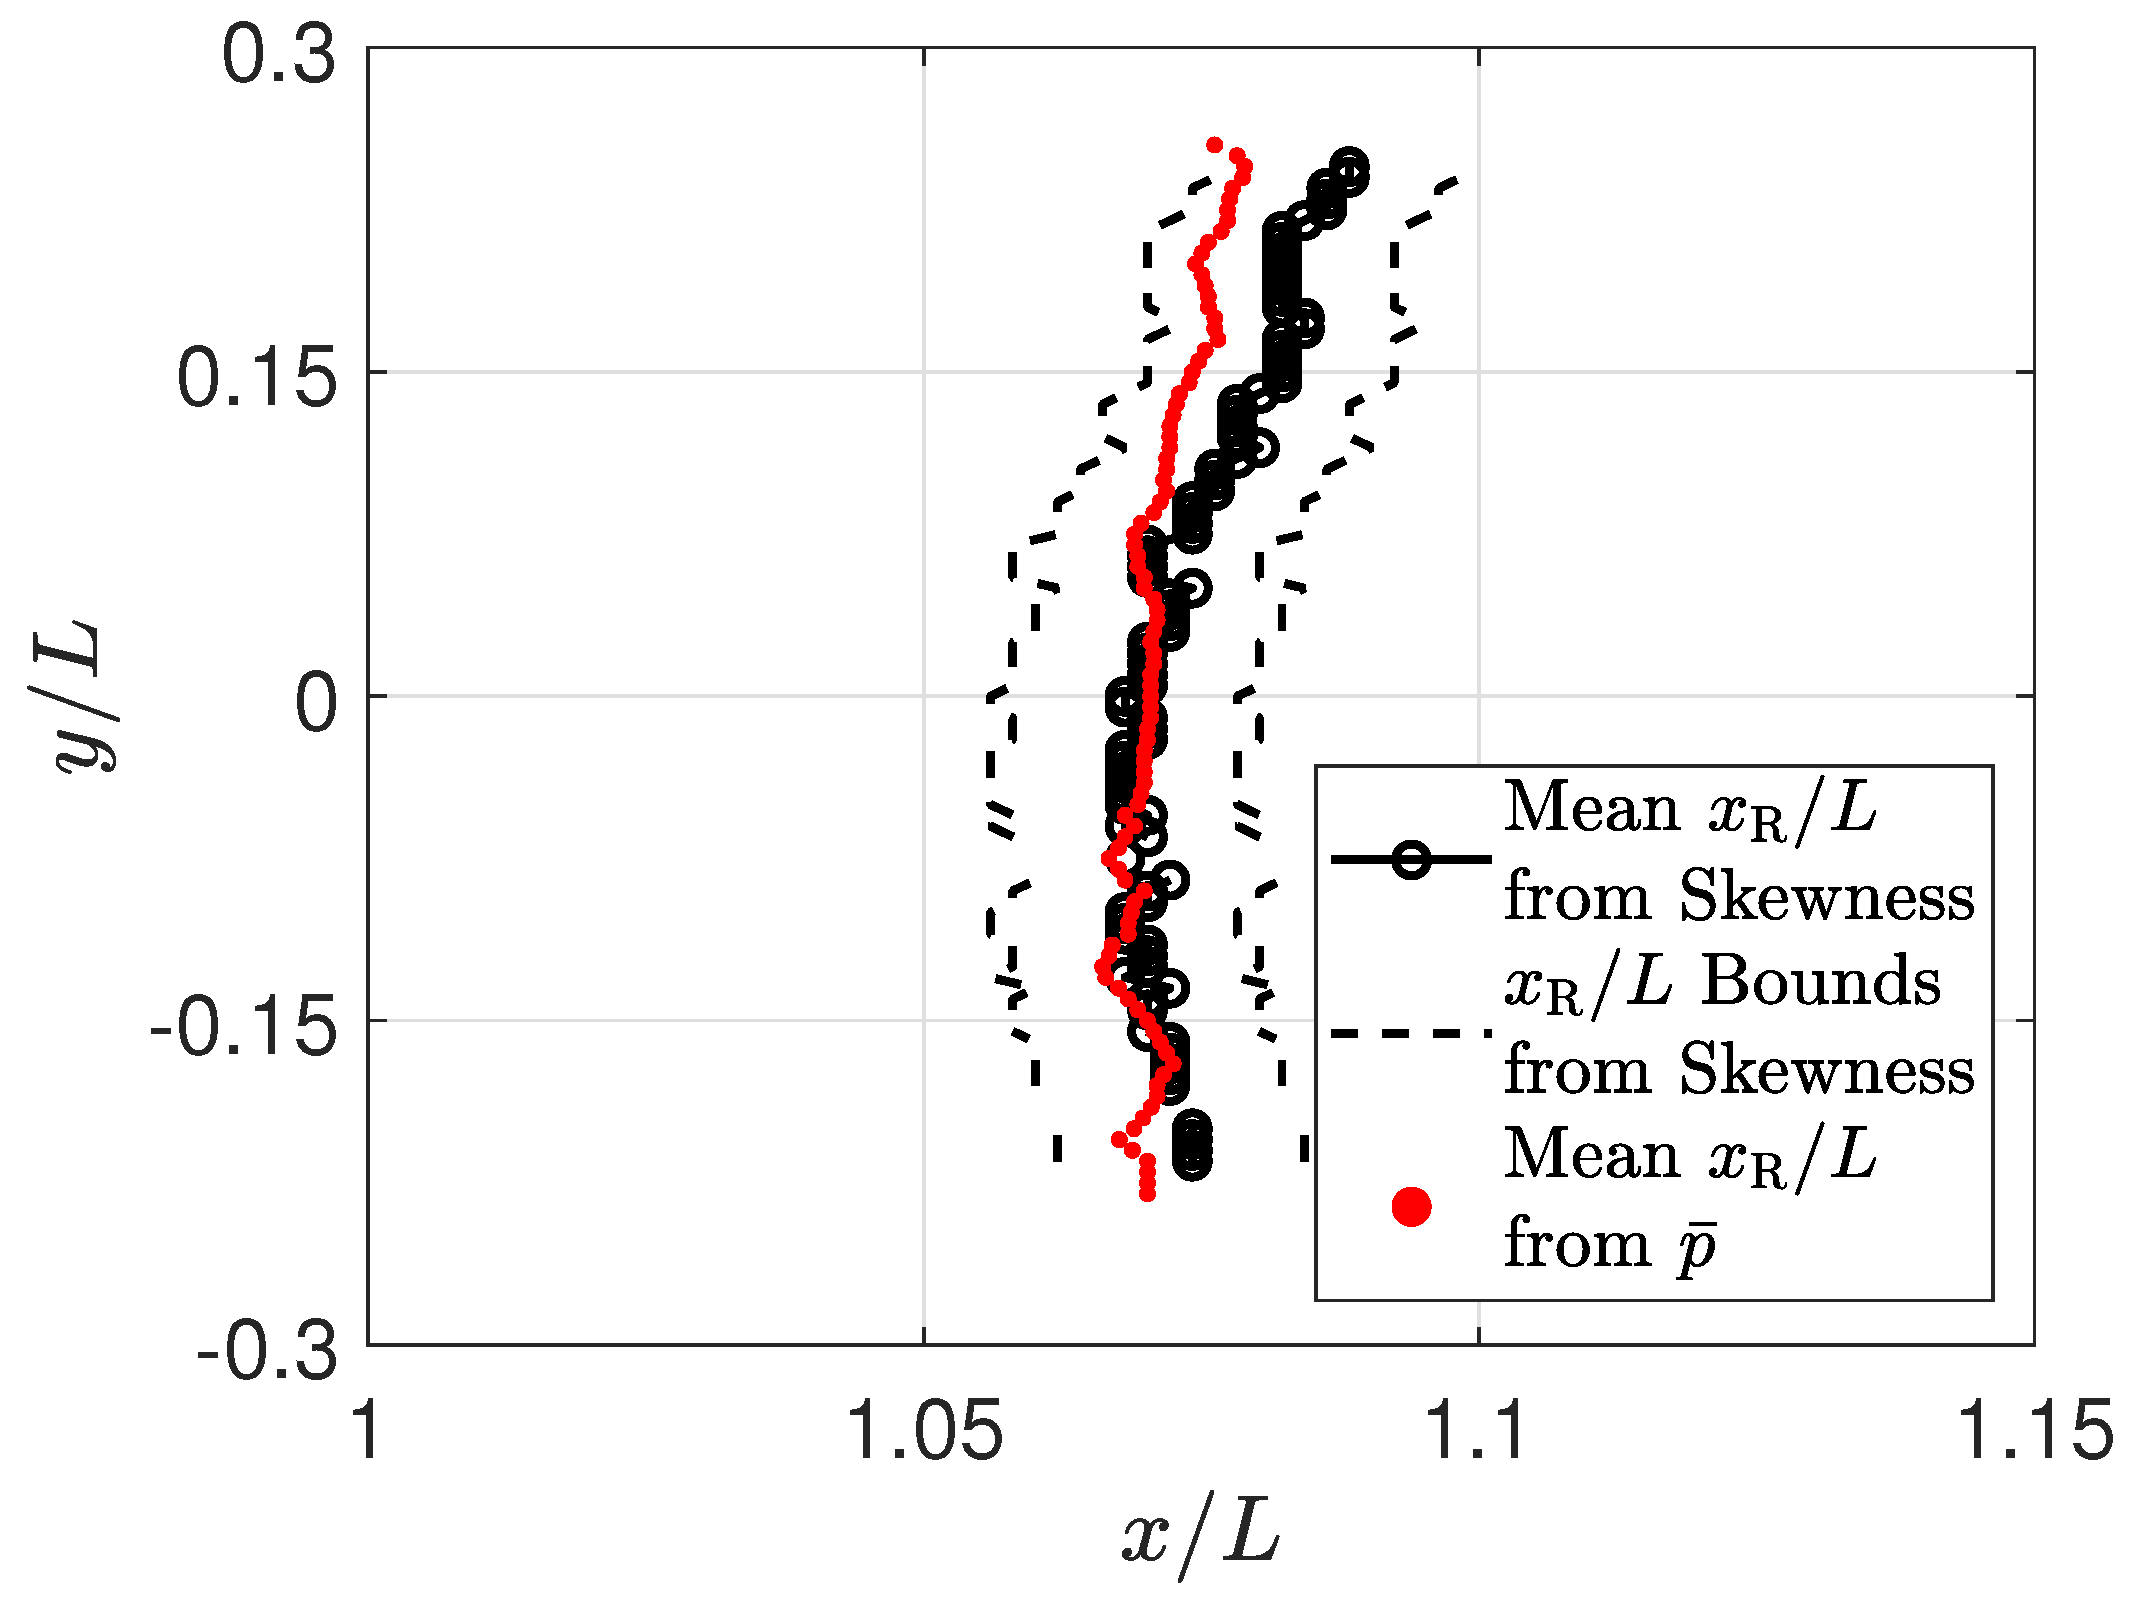
Compared to traditional point sensors along a single ray, the use of PSP allows for quantitative spanwise analyses. Zero skewness along every ray on the flare indicates the mean location of the reattachment shock foot, as illustrated by the connected black open-circle markers in Figure 5. The adjacent peaks and troughs map out the spanwise upstream and downstream reattachment shock-foot bounds, respectively. The black dashed lines in Figure 5 depict these bounds. For comparison, the red dots in Figure 5 (remade from Figure 11 in Running and Juliano [42]) indicate the mean reattachment shock-foot location from the maximum-streamwise--gradient. Similar to the streamwise data in Figure 4, excellent agreement is observed between the skewness and metrics—the data for spanwise are always within 2% of each other. However, it is observed that the results from the two metrics start to diverge slightly near the edges of the flare. It is observed in Figure 3 that although positive skewness is spanwise uniform, the negative skewness is somewhat asymmetric. This may be indicative of high sensitivity to a slightly non-zero angle of attack and cause the small difference between the skewness and results for (see Dieudonne et al. [24] and Benitez et al. [62] for similar global measurements of axisymmetric SWBLIs at a non-zero angle of attack). This postulation remains to be confirmed, but the utility of skewness as a highly sensitive determination of model alignment is an interesting possibility.
As discussed in Running and Juliano [42], the reattachment line pictured in Figure 5 does not simply occur at a constant due to unsteady, spanwise-varying flow features. A growing number of recent works have indicated the need to investigate SWBLIs on a global scale to properly account for and study these spanwise phenomena [42,43,63]. The global skewness analysis with PSP discussed in this section addresses this potential hole in the literature by providing high-spatial-resolution measurements of both the mean and unsteady components of the shock feet at separation and reattachment. Conveniently, this skewness metric of shock-feet location does not depend on the magnitude of the surface pressure, and is therefore not biased by any uncertainties in the measurement amplitudes.
4. Coherence
The coherence between two signals has previously been utilized to gather information about the physical dynamics driving unsteady SWBLI systems [11,64,65]; however, to the authors’ knowledge it has never been calculated on a global scale with a measurement technique such as PSP. The idea is that the inherent global nature and high spatial resolution of PSP coupled with calculations of coherence might glean some physical insights not previously observed in traditional experiments.
The magnitude-squared coherence spectrum provides a frequency-dependent measure of the linear relationship between two time series, which can also be interpreted as a correlation coefficient in the frequency domain [66]. is defined by:
where and are the power spectral densities of at arbitrary locations 1 and 2 on the model, and is the cross-spectrum between the signals at the same two arbitrary locations. f is the temporal frequency. is calculated via the Welch method [67]. The calculations incorporated 800-point segments, at 50% overlap. Each segment was windowed with a Hamming window. can vary between values of 0 and 1. A value of 1 indicates an ideal linear relationship, while a value of 0 indicates no relationship.
The associated phase spectrum is given by:
where is the quadrature spectral density function (i.e., the imaginary part of the cross-spectrum), and is the coincident spectral density function (i.e., the real part of the cross-spectrum). can vary between values of radians. A value of indicates that the signals are perfectly out of phase (i.e., move opposite each other), while a value of 0 indicates that the signals are perfectly in phase (i.e., move in lockstep).
Global contours of band-limited relative coherence between the reattachment shock foot and every pixel on the model were created by integrating under the spectra for the characteristic low- (i.e., Hz) and high-frequency (i.e., Hz) bands (Figure 6). Schematics of the shock structures and recirculation bubble described in Section 1 above have been overlaid on the data in Figure 6. As discussed in Running and Juliano [42], the low-frequency band is indicative of shock-foot fluctuations. The higher-frequency band is characteristic of the flow structures under the separated shear layer. The white circle on the flare in Figure 6 indicates the location of from which was calculated with respect to every other pixel. These coherence data were not filtered in space or time.
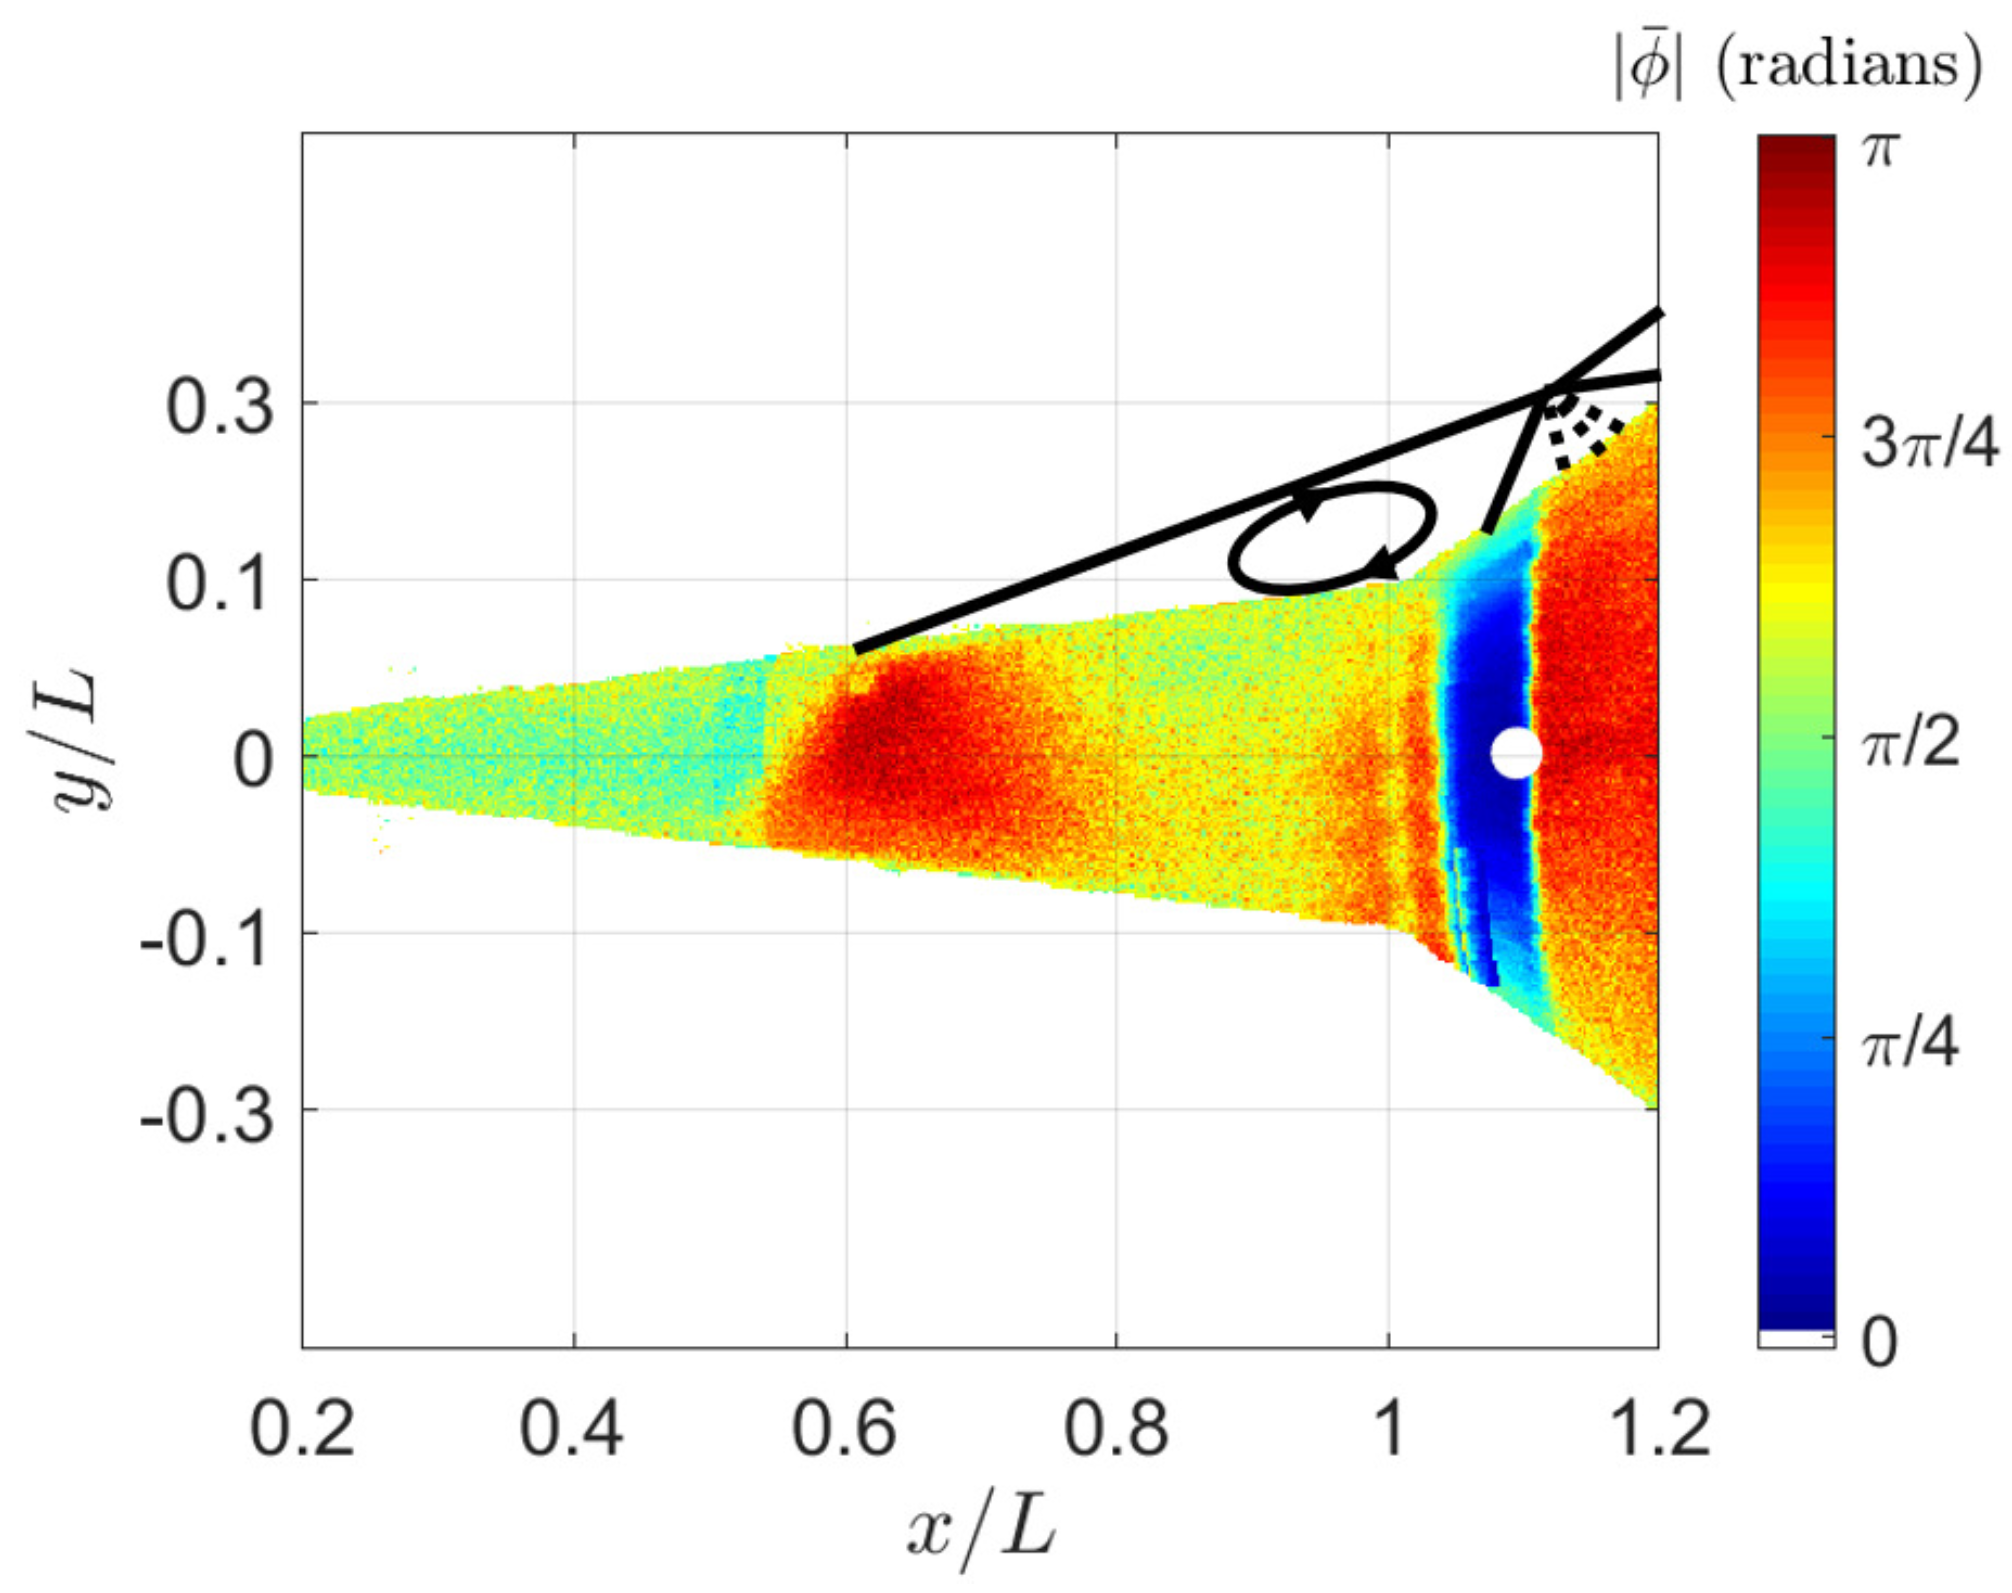
Global contours of band-limited phase between the reattachment shock foot and every pixel on the model were created in a similar fashion by calculating the mean value of for the characteristic low-frequency (i.e., Hz) band (Figure 7). The phase spectrum was dominated by noise for the high-frequency (i.e., Hz) band, and is therefore not included.
Although the quantitative spectra from these PSP measurements were found to be fairly noisy, the band-limited contours in Figure 6 provide good physical insights regarding the dynamical system behavior. The only structures apparent in the low-frequency band (i.e., Figure 6a) are the intermittent regions of the separation and reattachment shock feet. This indicates that for this bandwidth characteristic of the shock-foot oscillations, these two regions act similar to a linear system. The average phase value between the separation and reattachment intermittent regions in this frequency band is approximately radians (Figure 7). This indicates that the separation and reattachment shock feet oscillate almost exactly out of phase. The patch of higher coherence downstream of observed in Figure 6a is likely due to the expansion fan emanating from the triple point as seen in Figure 1. This expansion fan also oscillates nearly radians out of phase (Figure 7). The regions that are phase locked—have high coherence—appear even more uniform on the phase contour than the coherence contour and have comparatively little pixel-to-pixel noise. The average phase value between the white circle and other pixels in the reattachment region is zero, indicating that the reattachment line moves in lockstep across its full span, which is expected.
The higher-frequency band does not show any coherence between and , as expected; however, it does indicate that the cone/flare-junction vicinity and the intermittent region are relatively well correlated at higher frequencies. Figure 6b indicates this respectable coherence between the region of = 0.90–1.02 and . Since the entire separated shear-layer region falls between and (i.e., = 0.584–1.072), it is interesting that only this smaller region in the immediate vicinity of the cone/flare junction is well correlated with the intermittent region. This phenomenon is attributed to the wall-normal depth of the separated shear layer, which is governed by the model geometry. This depth slowly grows in a linear fashion from to . It is a maximum at , and then quickly decreases linearly until . This behavior leads to an inflection point in unsteady peak frequency due to trapped acoustic modes, which are especially significant in hypersonic flowfields. The larger-scale, coherent recirculation bubble forms and rolls over on itself only very near the cone/flare junction where the separation depth is large. The thin band of negligible coherence between the cone/flare junction and the reattachment intermittent region indicates the downstream extent of this bubble.
These results corroborate much of the recent discussion in the SWBLI literature, and add to it with a clear global picture of the dynamical system. For this relatively large/strong SWBLI, it is observed that the separation and reattachment shock feet are highly correlated in the frequency band characteristic of the shock-foot oscillations. Further, it has been shown that they are approximately radians out of phase, which means that the entire unsteady separated region can be described by a breathing motion of the separation bubble. Although these findings do not preclude an upstream driving mechanism of the unsteadiness, they certainly do suggest that reattachment shock-foot oscillations play a major role in the system’s unsteady behavior. These observations are in agreement with analogous recent studies in the literature [5,11,34,64,65]; however, they do highlight the necessity of separation and reattachment measurements, and the further convenience of a global surface measurement technique for studying the system dynamics.
A few novel findings have also come from these results. Firstly, the well correlated expansion-fan region would seem to indicate that this structure moves along with the separation bubble, which would make sense since it is integrally linked to the system dynamics. The data also show high spanwise coherence along the reattachment shock front in agreement with Thomas et al. [64]. Lastly, the separated shear-layer dynamics are further fleshed out with the use of this global coherence technique. The shear layer immediately following separation is best described by different frequencies and dynamics compared to the larger-scale separation bubble recirculating about the cone/flare junction region farther downstream. It is this larger-scale bubble that is well-correlated with the driving oscillatory dynamics of the system.
5. Conclusions
A series of wind-tunnel tests has been carried out in the ACT-1 wind tunnel on a 7 half-angle circular cone/flare model to investigate the unsteady behavior of SWBLIs. Surface pressure measurements were made using a high-frequency-response (≈10 kHz), temperature-corrected AA-PSP system, which allowed for novel, global calculations of skewness and magnitude-squared coherence. These analyses complement traditional SWBLI data-reduction methodologies by providing high-spatial-resolution measurements of the mean and fluctuating locations of the shock feet, as well as the frequency-dependent measure of the linear relationship between characteristic flow features.
The skewness results indicated the mean locations of the separation and reattachment shock feet as well as the upstream and downstream bounds of each foot’s fluctuations over the course of the test. These values were in excellent agreement with the results indicated by the metrics used in Running and Juliano [42]. Further, they supplement traditional surface pressure measurements by indicating the direction of shock-foot oscillation, all on a global scale allowing for both streamwise and spanwise analyses.
Coherence results indicated a large-scale breathing motion of the separated region analogous to that described by Thomas et al. [64]. The separation and reattachment intermittent regions were relatively well correlated in the low-frequency bandwidth characteristic of the shock-foot oscillations. They were approximately radians out of phase. Two distinct regions under the separated shear layer were observed in the global coherence contours. The large-scale separation bubble near the cone/flare junction was well correlated with the oscillatory behavior of the shock feet, while the upstream separated shear-layer region was not.
This AA-PSP technique, and associated data-reduction methodologies, have proven useful for investigating the unsteady behavior of the SWBLI system. As hypersonic vehicle design continues to become more complex, these high-spatial-resolution, global approaches will illustrate a fuller picture of the associated sophisticated flowfields.
Author Contributions
Conceptualization, C.L.R. and T.J.J.; methodology, C.L.R. and T.J.J.; software, C.L.R.; validation, C.L.R. and T.J.J.; formal analysis, C.L.R. and T.J.J.; investigation, C.L.R. and T.J.J.; resources, C.L.R. and T.J.J.; writing—original draft preparation, C.L.R. and T.J.J.; writing—review and editing, C.L.R. and T.J.J.; visualization, C.L.R. and T.J.J.; supervision, T.J.J.; project administration, T.J.J. All authors have read and agreed to the published version of the manuscript.
Funding
This research received no external funding.
Institutional Review Board Statement
Not applicable.
Informed Consent Statement
Not applicable.
Data Availability Statement
The data presented in this study are available on request from the corresponding author.
Acknowledgments
The authors would like to thank Hirotaka Sakaue and graduate research assistant Daiki Kurihara for their assistance developing the AA-PSP. In addition, thanks goes out to Sergey Leonov and Seongkyun Im for allowing access to ACT-1.
Conflicts of Interest
The authors declare no conflict of interest.
References
- Babinsky, H.; Harvey, J. Shock Wave-Boundary-Layer Interactions; Cambridge: New York, NY, USA, 2011. [Google Scholar]
- Anderson, J. Hypersonic and High Temperature Gas Dynamics; American Institute of Aeronautics and Astronautics, Inc.: Reston, VA, USA, 2006; Chapter 7. [Google Scholar]
- Dupont, P.; Haddad, C.; Debiéve, J.F. Space and time organization in a shock-induced separated boundary layer. J. Fluid Mech. 2006, 559, 255–277. [Google Scholar] [CrossRef]
- Poggie, J.; Bisek, N.J.; Kimmel, R.L.; Stanfield, S.A. Spectral Characteristics of Separation Shock Unsteadiness. AIAA J. 2015, 53, 200–214. [Google Scholar] [CrossRef]
- Clemens, N.T.; Narayanaswamy, V. Low-Frequency Unsteadiness of Shock Wave/Turbulent Boundary Layer Interactions. Annu. Rev. Fluid Mech. 2014, 46, 469–492. [Google Scholar] [CrossRef] [Green Version]
- Casper, K.M.; Beresh, S.J.; Henfling, J.F.; Spillers, R.W.; Hunter, P.; Spitzer, S. Hypersonic Fluid-Structure Interactions on a Slender Cone. In Proceedings of the 2018 AIAA Aerospace Sciences Meeting, Kissimmee, FL, USA, 8–12 January 2018. [Google Scholar]
- Green, J. Interactions Between Shock Waves and Turbulent Boundary Layers. Prog. Aerosp. Sci. 1970, 11, 235–340. [Google Scholar] [CrossRef]
- Degrez, G.; Simeonides, G.; Delery, J.; Vandromme, D.; Dolling, D.; Knight, D. Shock-Wave/Boundary-Layer Interaction in Supersonic and Hypersonic Flows; Report 792; Advisory Group for Aerospace Research and Development: Rhode-Saint-Genése, Belgium, 1993. [Google Scholar]
- Dolling, D.S. Fifty Years of Shock-Wave/Boundary-Layer Interaction Research: What Next? AIAA J. 2001, 39, 1517–1531. [Google Scholar] [CrossRef]
- Gaitonde, D. Progress in Shock Wave/Boundary Layer Interactions. Prog. Aerosp. Sci. 2015, 72, 80–99. [Google Scholar] [CrossRef]
- Piponniau, S.; Dussauge, J.P.; Debiéve, J.F.; Dupont, P. A Simple Model for Low-Frequency Unsteadiness in Shock-Induced Separation. J. Fluid Mech. 2009, 629, 87–108. [Google Scholar] [CrossRef]
- Kimmel, R.L.; Adamczak, D.W.; Paull, A.; Shannon, J.; Pietsch, R.; Frost, M.; Alesi, H. HIFiRE-1 Preliminary Aerothermodynamic Measurements. In Proceedings of the 41st AIAA Fluid Dynamics Conference and Exhibit, Honolulu, HI, USA, 27 June–30 June 2011. [Google Scholar]
- Thiele, T.; Gülhan, A.; Olivier, H. Instrumentation and Aerothermal Postflight Analysis of the Rocket Technology Flight Experiment ROTEX-T. J. Spacecr. Rockets 2018, 55, 1050–1073. [Google Scholar] [CrossRef]
- Holden, M.; Carr, Z.; MacLean, M.; Wadhams, T. Measurements in Regions of Shock Wave/Turbulent Boundary Layer Interactions from Mach 5 to 6 at Flight Duplicated Velocities to Evaluate and Improve the Models of Turbulence in CFD Codes. In Proceedings of the 2018 Fluid Dynamics Conference, Atlanta, GA, USA, 25–29 June 2018. [Google Scholar]
- Heffner, K.; Chpoun, A.; Lengrand, J. Experimental Study of Transitional Axisymmetric Shock-Boundary Layer Interactions at Mach 5. In Proceedings of the 23rd Fluid Dynamics, Plasmadynamics, and Lasers Conference, Orlando, FL, USA, 6–9 July 1993. [Google Scholar]
- Vandomme, L.; Chanetz, B.; Benay, R.; Perraud, J. Transitional Shock Wave Boundary Layer Interactions in Hypersonic Flow at Mach 5. In Proceedings of the 12th AIAA International Space Planes and Hypersonic Systems and Technologies Conference, Norfolk, VA, USA, 15–19 December 2003. [Google Scholar]
- Benay, R.; Chanetz, B.; Mangin, B.; Vandomme, L.; Perraud, J. ShockWave/Transitional Boundary-Layer Interactions in Hypersonic Flow. AIAA J. 2006, 44, 1243–1254. [Google Scholar] [CrossRef]
- Wadhams, T.; Mundy, E.; Maclean, M.; Holden, M. Ground Test Studies of the HIFiRE-1 Transition Experiment Part 1: Experimental Results. J. Spacecr. Rockets 2008, 45, 1134–1148. [Google Scholar] [CrossRef]
- Maclean, M.; Wadhams, T.; Holden, M.; Johnson, H. Ground Test Studies of the HIFiRE-1 Transition Experiment Part 2: Computational Analysis. J. Spacecr. Rockets 2008, 45, 1149–1164. [Google Scholar] [CrossRef]
- Bur, R.; Chanetz, B. Experimental study on the PRE-X vehicle focusing on the transitional shock-wave/boundary-layer interactions. Aerosp. Sci. Technol. 2009, 13, 393–401. [Google Scholar] [CrossRef]
- Olivier, F.; Jacques, C.; Jean-Paul, C. Numerical analysis of a separated flow on a supersonic cone-flare model. In Proceedings of the 34th AIAA Applied Aerodynamics Conference, Washington, DC, USA, 13–17 June 2016. [Google Scholar]
- Holden, M. Studies of the Mean and Unsteady Structure of Turbulent Boundary Layer Separation in Hypersonic Flow. In Proceedings of the 22nd Fluid Dynamics, Plasma Dynamics and Lasers Conference, Honolulu, HI, USA, 24–26 June 1991. [Google Scholar]
- Holden, M. Shock Interaction Phenomena in Hypersonic Flows. In Proceedings of the 29th AIAA Plasmadynamics and Lasers Conference, Albuquerque, NM, USA, 15–18 June 1998. [Google Scholar]
- Dieudonne, W.; Boerrigter, H.; Charbonnier, J. Hypersonic Flow on a Blunted Cone-Flare Model and in the VKI-H3 Mach 6 Wind Tunnel; von Karman Institute Technical Note 193; Karman Institute in Rhode-Saint-Genése: Rhode-Saint-Genése, Belgium, 1997. [Google Scholar]
- Asma, C.; Paris, S.; Tapsoba, M. Transitional Shock-Wave Boundary Layer Interaction over a Cone-Flare Model AT Hypersonic Conditions. In Proceedings of the Fourth Symposium on Aerothermodynamics for Space Vehicles, Capua, Italy, 15–18 October 2002. [Google Scholar]
- Schrijer, F.; Scarano, F. Experiments on Hypersonic Boundary Layer Separation and Reattachment on a Blunted Cone-Flare using Quantitative InfraRed Thermography. In Proceedings of the 12th AIAA International Space Planes and Hypersonic Systems and Technologies, Norfolk, VA, USA, 15–19 December 2003. [Google Scholar]
- Running, C.L.; Juliano, T.J.; Jewell, J.S.; Borg, M.P.; Kimmel, R.L. Hypersonic Shock-Wave/Boundary-Layer Interactions on a Cone/Flare. Exp. Therm. Fluid Sci. 2019, 109, 109911. [Google Scholar] [CrossRef]
- Arnal, D.; Délery, J. Laminar-Turbulent Transition and Shock Wave/Boundary Layer Interaction; Technical Report 116; RTO-EN-AVT; von Karman Institute: Rhode-Saint-Gen, Belgium, 2005. [Google Scholar]
- Bogdonoff, S.M. Some Experimental Studies of the Separation of Supersonic Boundary Layers; Report 336; Department of Aeronautical Engineering, Princeton University: Princeton, NJ, USA, 1955. [Google Scholar]
- Price, A.E.; Stallings, R.L. Investigation of Turbulent Separated Flows in the Vicinity of Fin Type Protuberances at Supersonic Mach Numbers; NASA TN D-3840; NASA: Washington, DC, USA, 1967.
- Kaufman, L.G.; Korkegi, R.H.; Morton, L. Shock Impingement Caused by Boundary Layer Separation Ahead of Blunt Fins; ARL 72-0118; National Technical Information Service (NTIS) US Department of Commerce: Springfield, VA, USA, 1972.
- Winkelmann, A.E. Experimental Investigations of a Fin Protuberance Partially Immersed in a Turbulent Boundary Layer at Mach 5; NOLTR-72-33; Naval Air Systems Command: Washington, DC, USA, 1972.
- Kistler, A.L. Fluctuating Wall Pressure Under a Separated Supersonic Flow. J. Acoust. Soc. Am. 1964, 36, 543–550. [Google Scholar] [CrossRef]
- Erengil, M.E.; Dolling, D.S. Unsteady Wave Structure Near Separation in a Mach 5 Compression Ramp Interaction. AIAA J. 1990, 29, 728–735. [Google Scholar] [CrossRef]
- Willems, S.; Gülhan, A. Experiments on Shock Induced Laminar-Turbulent Transition on a Flat Plate at Mach 6. In Proceedings of the European Conference for Aeronautics and Space Sciences (EUCASS), Munchen, Germany, 1–5 July 2013. [Google Scholar]
- Schülein, E. Effects of Laminar-Turbulent Transition on the Shock-Wave/Boundary-Layer Interaction. In Proceedings of the 44th AIAA Fluid Dynamics Conference, Atlanta, GA, USA, 16–20 June 2014. [Google Scholar]
- Willems, S.; Gülhan, A.; Steelant, J. Experiments on Shock Induced Laminar-Turbulent Transition on the SWBLI in H2K at Mach 6. Exp. Fluids 2015, 56, 1–19. [Google Scholar] [CrossRef]
- Stanfield, S.A.; Kimmel, R.L.; Adamczak, D.W. HIFiRE-1 Flight Data Analysis: Turbulent Shock-Boundary-Layer Interaction Experiment During Ascent. In Proceedings of the 42nd AIAA Fluid Dynamics Conference and Exhibit, New Orleans, LA, USA, 25–28 June 2012. [Google Scholar]
- Liu, T.; Campbell, B.; Bruns, S.; Sullivan, J.P. Temperature- and Pressure-Sensitive Luminescent Paints in Aerodynamics. Appl. Mech. Rev. 1997, 50, 227–246. [Google Scholar] [CrossRef]
- Gregory, J.W.; Sakaue, H.; Liu, T.; Sullivan, J.P. Fast Pressure-Sensitive Paint for Flow and Acoustic Diagnostics. Annu. Rev. Fluid Mech. 2014, 46, 303–330. [Google Scholar] [CrossRef]
- Taira, K.; Brunton, S.L.; Dawson, S.T.M.; Rowley, C.W.; Colonius, T.; McKeon, B.J.; Schmidt, O.T.; Gordeyev, S.; Theofilis, V.; Ukeiley, L.S. Modal Analysis of Fluid Flows: An Overview. AIAA J. 2017, 55, 4013–4041. [Google Scholar] [CrossRef] [Green Version]
- Running, C.L.; Juliano, T.J. Global measurements of hypersonic shock-wave/boundary-layer interactions with pressure-sensitive paint. Exp. Fluids 2021. [Google Scholar] [CrossRef]
- Currao, G.M.D.; McQuellin, L.P.; Neely, A.J.; Zander, F.; Buttsworth, D.R.; McNamara, J.J.; Iahn, I. Oscillating Shock Impinging on a Flat Plate at Mach 6. In Proceedings of the AIAA Aviation 2019 Forum, Dallas, TX, USA, 17–21 June 2019. [Google Scholar]
- Lash, L.E.; Combs, C.S.; Kreth, P.A.; Schmisseur, J.D. Study of the Dynamics of Transitional Shock Wave-Boundary Layer Interactions using Optical Diagnostics. In Proceedings of the 47th AIAA Fluid Dynamics Conference, Denver, CO, USA, 5–9 June 2017. [Google Scholar]
- Vanstone, L.; Goller, T.; Clemens, N.T.; Mears, L.J. Separated Flow Unsteadiness in a Mach 2 Swept Compression-Ramp Interaction using High-Speed PSP. In Proceedings of the AIAA Aviation 2019 Forum, Dallas, TX, USA, 17–21 June 2019. [Google Scholar]
- Funderburk, M.L.; Narayanaswamy, V. Spectral Signal Quality of Fast Pressure Sensitive Paint Measurements in Turbulent Shock-Wave/Boundary Layer Interactions. Exp. Fluids 2019, 60, 1–20. [Google Scholar] [CrossRef]
- Varigonda, S.V.; Narayanaswamy, V.; Boxx, I. Investigations of FSI Generated By an Impinging SBLI on a Thin Panel Using Multivariate Imaging of Flow/Structural Properties. In Proceedings of the AIAA Aviation 2020 Forum, Online, 15–19 June 2020. [Google Scholar]
- Mears, L.J.; Baldwin, A.; Ali, M.Y.; Kumar, R.; Alvi, F.S. Spatially resolved mean and unsteady surface pressure in swept SBLI using PSP. Exp. Fluids 2020, 61, 1–14. [Google Scholar] [CrossRef]
- Baccarella, D.; Liu, Q.; Passaro, A.; Lee, T.; Do, H. Development and testing of the ACT-1 experimental facility for hypersonic combustion research. Meas. Sci. Technol. 2016, 27, 045902. [Google Scholar] [CrossRef]
- Hoberg, E.M.; Huffman, C.; Sanchez-Plesha, N.; Running, C.L.; Kato, N.; Im, S.; Juliano, T.J. Characterization of Test Conditions in the Notre Dame Arc-Heated Wind Tunnel. In Proceedings of the AIAA Aviation 2019 Forum, Dallas, TX, USA, 17–21 June 2019. [Google Scholar]
- Running, C.L.; Sakaue, H.; Juliano, T.J. Hypersonic Boundary-Layer Separation Detection with Pressure-Sensitive Paint for a Cone at High Angle of Attack. Exp. Fluids 2019, 60, 1–13. [Google Scholar] [CrossRef]
- Juliano, T.J.; Peng, D.; Jensen, C.; Gregory, J.W.; Liu, T.; Montefort, J.; Palluconi, S.; Crafton, J.; Fonov, S. PSP Measurements on an Oscillating NACA 0012 Airfoil in Compressible Flow. In Proceedings of the 41st AIAA Fluid Dynamics Conference and Exhibit, Honolulu, HI, USA, 27–30 June 2011. [Google Scholar]
- Running, C.L.; Thompson, M.J.; Juliano, T.J.; Sakaue, H. Boundary-layer Separation Detection for a Cone at High Angle of Attack in Mach 4.5 Flow with Pressure-Sensitive Paint. In Proceedings of the 47th AIAA Fluid Dynamics Conference, Denver, CO, USA, 5–9 June 2017. [Google Scholar]
- Running, C.L. Global Measurements of Axisymmetric Hypersonic Shock-Wave/Boundary-Layer Interactions. Ph.D. Thesis, University of Notre Dame, Notre Dame, IN, USA, 2020. [Google Scholar]
- Pandey, A.; Casper, K.M.; Spillers, R.; Soehnel, M.; Spitzer, S. Hypersonic Shock Wave-Boundary-Layer Interaction on the Control Surface of a Slender Cone. In Proceedings of the AIAA Scitech 2020 Forum, Orlando, FL, USA, 6–10 January 2020. [Google Scholar]
- Sansica, A.; Sandham, N.D.; Hu, Z. Instability and Low-Frequency Unsteadiness in a Shock-Induced Laminar Separation Bubble. J. Fluid Mech. 2016, 798, 5–26. [Google Scholar] [CrossRef]
- Whalen, T.; Kennedy, R.; Laurence, S.; Sullivan, B.; Bodony, D.; Buck, G. Unsteady Surface and Flowfield Measurements in Ramp-Induced Turbulent and Transitional Shock-Wave Boundary-Layer Interactions at Mach 6. In Proceedings of the AIAA Scitech 2019 Forum, San Diego, CA, USA, 7–11 January 2019. [Google Scholar]
- Vermeulen, J.P.; Simeonides, G. Parametric Studies of Shock Wave/Boundary Layer Interactions Over 2D Compression Corners at Mach 6; Technical Report 181; von Karman Institute for Fluid Dynamics: Rhode-Saint-Gen, Belgium, 1992. [Google Scholar]
- Souverein, L.J.; Bakker, P.G.; Dupont, P. A scaling analysis for turbulent shock-wave/boundary-layer interactions. J. Fluid Mech. 2013, 714, 505–535. [Google Scholar] [CrossRef] [Green Version]
- Bendat, J.S.; Piersol, A.G. Random Data: Analysis and Measurement Procedures; Wiley: New York, NY, USA, 2010. [Google Scholar]
- Mears, L.J.; Arora, N.; Alvi, F.S. Flowfield Response to Controlled Perturbations in Swept Shock/Boundary-Layer Interaction Using Unsteady Pressure-Sensitive Paint. In Proceedings of the AIAA Scitech 2019 Forum, San Diego, CA, USA, 7–11 January 2019. [Google Scholar]
- Benitez, E.K.; Jewell, J.S.; Schneider, S.P. Separation Bubble Variation Due to Small Angles of Attack for an Axisymmetric Model at Mach 6. In Proceedings of the AIAA Scitech 2021 Forum, Online, 11–15 and 19–21 January 2021. [Google Scholar]
- Priebe, S.; Tu, J.H.; Rowley, C.W.; Martin, M.P. Low-Frequency Dynamics in a Shock-Induced Separated Flow. J. Fluid Mech. 2016, 807, 441–477. [Google Scholar] [CrossRef] [Green Version]
- Thomas, F.O.; Putnam, C.M.; Chu, H.C. On the Mechanism of Unsteady Shock Oscillation in Shock Wave/Turbulent Boundary Layer Interactions. Exp. Fluids 1994, 18, 69–81. [Google Scholar] [CrossRef]
- Dupont, P.; Haddad, C.; Ardissone, J.P.; Debiéve, J.F. Space and time organization of a shock wave/turbulent boundary layer interaction. Aerosp. Sci. Technol. 2005, 9, 561–572. [Google Scholar] [CrossRef]
- Stoica, P.; Moses, R. Spectral Analysis of Signals; Prentice Hall: Hoboken, NJ, USA, 2005. [Google Scholar]
- Welch, P.D. The use of Fast Fourier Transform for the estimation of power spectra: A method based on time averaging over short, modified periodograms. IEEE Trans. Audio Electroacoust. 1967, 15, 70–73. [Google Scholar] [CrossRef] [Green Version]
Figure 1.
Cone/flare shock-wave/boundary-layer interaction schematic (from Running et al. [27]).
Figure 1.
Cone/flare shock-wave/boundary-layer interaction schematic (from Running et al. [27]).

Figure 2.
Cone/flare model geometry (dimensions are in mm) (from Running and Juliano [42]).
Figure 2.
Cone/flare model geometry (dimensions are in mm) (from Running and Juliano [42]).

Figure 3.
Global skewness contour.

Figure 4.
Centerline streamwise skewness and profiles.

Figure 5.
Spanwise skewness and reattachment profiles.

Figure 6.
Band-limited
contours.

Figure 7.
Mean contour for low-frequency (i.e., Hz) band.


Table 1.
Flow conditions in the ACT-1 wind tunnel.
| (kPa) | (K) | (×10/m) | () | |
|---|---|---|---|---|
| 6.25 | 440 | 296 | 8.3 |
Publisher’s Note: MDPI stays neutral with regard to jurisdictional claims in published maps and institutional affiliations. |
© 2021 by the authors. Licensee MDPI, Basel, Switzerland. This article is an open access article distributed under the terms and conditions of the Creative Commons Attribution (CC BY) license (https://creativecommons.org/licenses/by/4.0/).
Share and Cite
MDPI and ACS Style
Running, C.L.; Juliano, T.J. Global Skewness and Coherence for Hypersonic Shock-Wave/Boundary-Layer Interactions with Pressure-Sensitive Paint. Aerospace 2021, 8, 123. https://doi.org/10.3390/aerospace8050123
AMA Style
Running CL, Juliano TJ. Global Skewness and Coherence for Hypersonic Shock-Wave/Boundary-Layer Interactions with Pressure-Sensitive Paint. Aerospace. 2021; 8(5):123. https://doi.org/10.3390/aerospace8050123
Chicago/Turabian StyleRunning, Carson L., and Thomas J. Juliano. 2021. "Global Skewness and Coherence for Hypersonic Shock-Wave/Boundary-Layer Interactions with Pressure-Sensitive Paint" Aerospace 8, no. 5: 123. https://doi.org/10.3390/aerospace8050123
Note that from the first issue of 2016, this journal uses article numbers instead of page numbers. See further details here.