Article

Wind-Tunnel Measurement of Differential Pressure on the Surface of a Dynamically Inflatable Wing Cell

by
Diego Muniz Benedetti
1,*,† and
Carlos Alberto Gurgel Veras
2,†
1
National Civil Aviation Agency (ANAC), Brasilia 70308-200, DF, Brazil
2
Mechanical Engineering Department, University of Brasilia, Brasilia 70910-900, DF, Brazil
*
Author to whom correspondence should be addressed.
These authors contributed equally to this work.
Aerospace 2021, 8(2), 34; https://doi.org/10.3390/aerospace8020034
Submission received: 2 November 2020 / Revised: 25 November 2020 / Accepted: 30 November 2020 / Published: 29 January 2021

Abstract

:
An instrumentation system for in-situ measurement of the inner-outer pressure differential at the upper and lower surfaces of dynamically inflatable wings is designed and tested, revealing important insights into the aerodynamic characteristics of inflatable airfoils. Wind tunnel tests demonstrated full capability of low-pressure differential readings in the range of 1.0–120 Pa, covering speeds from 3 to 10 m/s at angles of attack from −20 to +25°. Readings were stable, presenting coefficients of variation from 2% to 7% over the operational flight envelope. The experimental data confirmed the occurrence of a bottom leading-edge recirculation bubble, linked to the low Reynolds regime and the presence of an air intake. It supported the proposition of a novel approach to aerodynamic characterization based on local pressure differentials, which takes in account the confined airflow structure and provides lift forces estimations compatible with practical observation. The results were also compatible with data previously obtained following different strategies and were shown to be effective for parameterizing the inflation and stall phenomena. Overall, the instrumentation may be applied straightforwardly as a flight-test equipment, and it can be further converted into collapse alert and prevention systems.

1. Introduction

Application of paragliders, parafoils, and other dynamically inflatable wings (DIW) has increased drastically in the past thirty years [1,2,3]. In the 1960s, inflatable wings were began as deceleration systems, for which no performance or flight qualities aspects were relevant. However, evolution turned flexible wings to be more similar to the conventional rigid counterpart, making them aerodynamically efficient, stable, and maneuverable, which are essential design requirements. Instead of merely assuring a softer landing, inflatable wings evolved into efficient, maneuverable air-sport vehicles. They were also applied for dragging ships, running wind power generators, positioning military troops and cargo, and recovering launch vehicle parts. A recent instance can be seen in the work of Dek et al. [4], who proposed a recovery system for key components of the first stage of a heavy launch vehicle using a parafoil with a surface area of about 836 m2. Table 1 lists the main characteristics differentiating rigid and inflatable wings.
Unlike rigid wings, parafoils exhibit singular aerodynamic phenomena linked to their particular operational nature. The in-flight shape deformability frequently culminates in collapse situations [5]; the air-intake opening at the leading edge causes a significant drawback on aerodynamic efficiency [6]; and the inflation mechanism imposes additional flight envelope constraints regarding the angle of attack (AOA) and speed ranges [7]. These specificities make traditional approaches to aerodynamic characterization unsuitable or incomplete for those wings. For instance, dealing only with conventional pressure coefficient distributions neglects relevant effects related to internal pressure variations.
The inflatable wing will be deformed by the aerodynamic load and the dynamic variation of the in-flight shape results both airflow and wing motion reactions. These reactions are hard to anticipate using geometry-based aerodynamic coefficients, but can be identified and parameterized using a pressure differential distribution profile.
The flight dynamics of most inflatable wing systems are based on the pendulum mechanism [8], which is obtained by positioning the center of gravity (CG) of the system far below and after the aerodynamic center (AC). Such a construction provides mechanical and aerodynamic stability through the dynamic balance between the wing’s relative airspeed and incidence. Starting from a steady glide condition, any variation on speed or incidence will modify the aerodynamic forces resulting rotation in respect to the CG in a way that compensates the original cause. For instance, a disturbance increasing AOA increases lift and drag and rotates the wing positively because the aerodynamic center is higher and in front of the CG. The rotation decreases the relative velocity observed by the wing reducing aerodynamic forces and positioning the aerodynamic center behind the CG inverting the sense of rotation and completing the pendulum motion. This is perceived as a short-period pendulum motion, which keeps speed and AOA under control. As this motion is not always uniform over the wing, the same mechanism that provides stability may induce a concerned wing’s shape deformation along with other unpredicted aerodynamic effects. Under severe disturbances it can also reach extreme situations where inflation or stall limits are trespassed. The ability to monitor differential pressure at the surface of the airfoil may prevent approaching such limits.
Several works devoted to the development of control models, guidance systems, and trajectory optimization can be found in the literature [9,10,11,12,13,14,15]. Further, a representative number of computational fluid dynamics (CFD)-based aerodynamic characterization is available [6,16,17,18,19,20]. However, few experimental results related to the paraglider cell deformation can be found in recent literature [21]. Only a modest number of papers explore aerodynamic flow properties over inflatable airfoils based on experiments [22,23,24,25], and yet most of them relied on heavy wind-tunnel instrumentation, which are unsuitable for in-flight measurements, and no experiment was found measuring differential pressure directly. The challenges to attach reliable instrumentation to the canopy fabric make in-flight experimental measurements either impossible or extremely difficult [6]. While recent efforts focusing on control and guidance have successfully used in-canopy motion sensors [9,10,12,26], the in-flight measurement of the airfoil aerodynamic characteristics remains a challenge. None of these works, however, attempted to use outer-inner local pressure-differential analysis as an alternative to the classic external pressure coefficient assessments. It would bring the benefit of taking in account the internal pressure dynamic variations.
In 2006, Mashud and Umemura [7] investigated the aerodynamic characteristics of a paraglider from an aerodynamics perspective. In their work, wind tunnel experiments were conducted in an inflatable cell model designed to represent each cell’s dynamic behavior along the wing. Pressure measurements relied on pressure probes connected to a digital pressure gauge. While such a device does not apply to in-flight data collection due to the impossibility to be attached to the wing, it was proven to be very efficient in disclosing important characteristics of inflatable airfoils, including aerodynamic coefficient ranges and airfoil inflation as a function of the angle of attack—AOA. Later, in 2009, Mohammad and Johari [27] predicted the flow over an inflatable wing using CFD analysis to compare the baseline airfoil with a sectioned air-intake airfoil. Results suggested that the flow about the parafoil creates a separation bubble on the lower leading edge and an entrapped vortex near the cell opening. This structure forms a buff leading edge that closes the airflow profile. Both lift and drag were affected, but lift reduction seemed limited while drag was at least twice the baseline airfoil drag. Fluid-structure interaction analyses were developed by Fogell [6], confirming a recirculation bubble at the bottom leading edge, causing a 15% decrease in lift, accompanied by a 210% increase in drag. The experiments confirmed that the introduction of a leading-edge dramatically cut the affects the flow. The author also highlights that examining changes in structure or behavior of the airflow during flight is still extremely challenging because the interactions are more complicated than in airfoils with the purely external flow, requiring consideration of internal forces, a factor not previously acknowledged by the literature.
The previous observations find support on the wide discussion toward low-Reynolds-number flow [28]. Inflatable wings normally operates at Reynolds Numbers below 1 × 10⁶, which is considerably below the normal range for conventional small aircrafts [29]. It favors the appearance of laminar separation bubbles [30], triggered by several sources, from geometric discontinuities to pressure gradients due to internal or external flow disturbances. This basic aerodynamic characteristic, along with the specificities of the sectioned-flexible airfoil, results in a somewhat complex and necessary topic for researching.
Following these remarks, there is room for improvement in terms of both experimental techniques and aerodynamics analysis of dynamically inflatable wings. The former is still a challenge on account of fewer technological appliances to support the research. As addressed by Cochrane et al. [31], traditional sensors are neither flexible nor compatible with the deformations of fabrics. The same authors present a sensor based on a Conductive Polymer Composite as a possible but costly solution. Burns and Burns [32] also presented a successful prototype designed for parachutes based on optical sensors linked through wiring from the canopy to the control board at the payload point. Sensor accuracy was proven adequate. Notwithstanding, we anticipate possible vibration issues due to the use of such long wires when applied to a maneuvering parafoil. McCarthy [33] presented encouraging results on flow characterization after applying low-cost pressure sensors placed along a strip (pressure belt), which was further attached to rigid wings.
Finally, considering all the constraints explored by previous research and the significant evolution of sensor manufacturing [34], it was possible to design an innovative system for direct measurement of differential pressure at the airfoil surfaces, which contributes to design optimization and the safety of such flying devices. This article presents the first phase of development of a flight-test instrumentation system designed for inflatable wings, as well as the results of the wind tunnel tests, which qualified the system for future in-flight experiments and revealed pertinent aerodynamic singularities based on local differential pressure monitoring, useful to expand scientific comprehension about dynamically inflatable airfoils.
The rest of the paper is organized as follows. In Section 2, the Materials and Methods are applied in designing the instrumentation system and the experimental procedures are explained in detail. In Section 3, the Tests Results are discussed and a complete analysis of the identified aerodynamic phenomena is presented. Finally, conclusions are drawn in Section 4, highlighting the qualification of the instrumentation designed and indicating future steps on dynamically inflatable wings research.

2. Materials and Methods

The developments presented here are based on two main purposes: The first one is to qualify, by wind tunnel tests, the instrumentation designed for in-flight tests. The second one is to present an alternative means of characterizing aerodynamic phenomena by analyzing the dynamic distribution of outside–inside pressure differential at selected points on the surface of an inflatable airfoil, instead of using fixed traditional aerodynamic coefficients.
The present results were obtained after four years of research in which five different prototypes were built and tested. Challenges like sensors accuracy, excessive vibration, data filtering and transfer issues, boundary layer disturbances, and others, were faced and overcome. The wind-tunnel campaign using the fifth prototype was successful in terms of both mechanical and aerodynamic capabilities. Furthermore, the precise identification of relevant aerodynamic phenomena allows us to state that dealing directly with local pressure differentials is a better approach for dynamically inflatable wings.

2.1. Differential Pressure Measurement Standards

The designed system is based on direct pressure differential readings, whereas traditional aerodynamics analysis is mostly based on external pressure coefficient, which remains an important parameter to be used comparatively and for airfoil design. Therefore, establishing the correlation of pressure coefficient and pressure differentials measurement is the first step for setting the ground rules for aerodynamic characterization based on local differential pressure analysis.
Pressure coefficient is obtained by the equation:
C p = P e P a t m 1 2 · ρ a i r · V 2 ,
where P e is the external pressure at the surface, P a t m is the local atmospheric pressure, ρ a i r is the air density, and V is the undisturbed flow speed.
The inner-outer differential pressure at some given point on the airfoil surface is given by
p = P e ( κ · q + P a t m ) ,
where q = 1 2 · ρ a i r · V 2 is the reference dynamic pressure, and κ is defined as the internal flow factor, reflecting its role as a indicator of how much of the maximum available dynamic pressure is observed at each point of the internal surface.
Acknowledging the existence of a recirculation internal flow, an inner pressure distribution is established due to the flow conditions and airfoil geometry, which are also affected by airfoil thickness and the air intake design. Therefore, for a defined baseline airfoil, the internal flow factor is supposed to vary from 0 to 1 as a function of speed, angle of attack, air intake orientation and size. Therefore, the internal flow factor can also be seen as an internal pressure coefficient.
Substituting Equation (1) for Equation (2), the local differential pressure can be described as
p = ( C p κ ) · q .
Equation (3) shows the direct relation between the pressure differential and pressure coefficient, highlighting the influence of the internal flow factor, a variable brought by the inflatable nature of the wing. Experimental data of parafoils and paragliders [5,22,24,25] using absolute pressure measurements have shown an external pressure coefficient ranging from −1.5 to 1.0. These results support computational predictions from which the C p distribution follows the baseline airfoil pattern, with a relevant modification limited to the air intake region [6,18,27]. Considering a steady glide speed of 10 m/s, typical of inflatable wings [8], a differential pressure range of 0–150 Pa is expected throughout the surface.
The expected level of pressure differential to be measured at each condition dictates the range for sensor selection. In the same way, the capability of detecting relevant variations caused by aerodynamic phenomena dictates the accuracy. The derivative of Equation (3) with respect to C p reveals, for a defined airflow condition, how the pressure measurement is affected by a local variation on the pressure coefficient ( C p ˜ ).
p ˜ = C p ˜ · q ,
For the same steady glide flight speed, a 0.1 variation on C p represents a 6 Pa variation of local pressure differential. Such a small variation is attainable for differential pressure sensors, but constitutes a real challenge for absolute pressure sensors. Looking from another angle, Equation (4) reveals how the external pressure coefficient, indirectly measured, is affected by the sensor’s error, considering the internal flow factor to be unaltered. Considering that the accuracy of a differential pressure sensor is given in terms of a constant percentage of the reading ( ϵ % ), the maximum error affecting C p is given by:
C p ˜ m a x = ϵ % · ( | C p m a x | + 1 ) .
Equation (5) reveals that, for a 5% error, typical of small differential pressure sensors, and considering the previously defined C p range, the contribution to the pressure coefficient measurement error stays between 0.05 and 0.125, which is completely acceptable for most evaluations.
Finally, it is important to highlight that, in addition to the fact that differential pressure sensors present range and accuracy more suitably for aerodynamic pressure levels, measuring the outside–inside local differential instead of external absolute pressure allows for the capturing of the effects of both external and internal flow simultaneously. In this way, it is possible to capture the final effect that results from aerodynamic forces without the trouble of investigating external and internal pressure separately.

2.2. Test Bench and Instrumentation

The data collecting system was designed and applied, as illustrated in Figure 1. The instrumentation consisted of a measurement strip with six ordained differential pressure sensors connected to a control board assembled in a wing mockup. The test bench was built as a three-cell wing with zero anhedral angles, representing the central portion of an inflated wing. The ASCENDER profile [35] was chosen as the baseline airfoil because it has been employed in previous studies of paragliders. It included a pulley mechanism to allow for the changing of the incidence angle from outside the tunnel. The wood rib’s chord was 80 cm long, and each cell was 12 cm wide, resulting in a 36 cm span. The rigid skeleton was covered with a lightweight paraglider’s fabric named Porcher Sport Skytex weighing 38 g/m2 and the sensor units glowed and were sewed to the upper and lower surfaces to represent real flight test conditions.
A semi-rigid structure has been used to qualify the instrumentation system in order to allow for the reaching out-of-envelope conditions. Without a rigid skeleton, it would not be possible to explore regions of pre-inflation speed, negative AOA or post-stall situations. These scenarios are of great relevance to judge the capability of the system measuring pressure differentials under extreme situations like collapsing. Nevertheless, the system was fully designed to operate airborne and both the theoretical assessments of mechanical constraints and the wind tunnel tests practical observations assured the suitability of immediate in-flight application. The only additional consideration made necessary by the test bench structure was related to the effects of the horizontal bar used to fix the ribs on the internal flow.
As demonstrated by Zovatto and Pedrizzetti [36], the flow over a confined cylinder leads to a circulation vortex, altering the surrounding pressure distribution. As the bar is located at the aerodynamic center, at 25% of the wing, it stays close enough to the middle sensors to be able to cause a perceptible disturbance at the inner pressure around this region in case of significant airfoil confined recirculation flow. The combined factors of undetermined internal flow patterns, sensor cases geometry features, and test-bench horizontal bar made it clear that internal pressure readings can be the main source of uncertainties. Nonetheless, this potential inaccuracy is mostly relevant for pressure coefficient estimations. Monitoring local differential pressure helped reveal the state of the external flow related to the internal one at specific regions of the wing. Then, even if the air inside the wing is not at rest, the important information was whether the differential is sufficiently negative (pressure effort from inside to outside) and how it evolves throughout the chord. The presence of the bar could alter the internal flow leading to perceptible changes to the readings of sensors S2 and S5; however, analyzing the variations throughout the range of AOA and speed tested, no relevant effect has been identified.
Based on typical pressure coefficient distribution profiles, sensor location planned to cover the three main portions of the mockup airfoil. The first pair of sensors (S1 and S4) was positioned at 8% of the baseline chord, which is the region that contributes the most to the airfoil lift. The sensors installed near to the aerodynamic center (S2 and S5), at 30% of the baseline chord, cover the portion of the profile where circulation flow should be fully developed, and pressure distribution is still significantly affected by changes in the angle of attack. Finally, the sensors (S3 and S6) located at 65% of the baseline chord aimed to monitor the final portion of the airfoil, where differential pressure favors stability. These rear measurements provided a relevant baseline to evaluate the pressure distribution gradient along the chord.
Instrumentation was designed to comply with the following requirements: precision, low interference in flight, reliability, and robustness. The Sensirion® SDP32-Digital [37] is a low-cost pre-calibrated and temperature compensated sensor capable of measuring differential pressures up to 125 Pa with a zero-point accuracy of 0.08 Pa and a span accuracy of 3% (RD). It presents a typical measurement time of 45 ms and resists overpressure up to 1.0 bar. Sensor communication was made via the I2C protocol, a two-wire serial interface generally used for moderate frequencies data transmission. The instrumentation integrates six sensor units to an ESP32 microprocessor module, which comes with a WIFI/Bluetooth transceiver and antenna. A single 3.7 V Li-ion battery cell was used to supply the microcontroller’s power and a set of sensors. Sensors were connected to the control board using lightweight cables, freely disposed inside the airfoil cell to minimize confined flow disturbances. Data was recorded directly onto a local SD-card and simultaneously sent via WIFI for remote monitoring.
The sensor unit was mounted inside a 3D printed ABS plastic case designed to be glowed or sewed to the wing’s fabric, providing a perfect attachment to the airfoil surface and motion resistance. For the external pressure, the access was fully vertical and unobstructed, whereas, for internal pressure access, a transverse duct was used. The complete sensor unit weighted 7.0 g distributed over a 2.6 cm × 2.9 cm surface, resulting in a 0.93 g/cm2 load. The cell had an 8.76 cm maximum cross-section height and was made with nylon fabric with a 0.6 mm thickness.

2.3. Wind-Tunnel Test Procedures

The open-circuit wind tunnel from the Laboratory of Energy and Environment of the University of Brasília was employed for the test campaign. It has a 2 m long test chamber with a 1.2 m × 1.2 m cross-section and can deliver airflow speeds up to 20 m/s. The wind-tunnel has been used for several academic purposes. As detailed by Macias [38], free-flow speed is adjusted by an integrated Pitot-static tube, providing speed-accuracy of 0.3%. The sensor was positioned 20 cm inside the chamber at the upper right corner, with a distance of 14 and 10 cm from the lateral and superior walls, respectively.
The error regarding flow speed must be considered taking into consideration the blockage effect. Becker and Paul [22] highlight that, as no previous studies define specific corrections for parafoils, a viable strategy is to keep the blockage ratio low to minimize the effect. Therefore, following Chang-Koon and Kwon’s [39] suggestion, using Equation (6), a blockage ratio under 5% was considered sufficient for the present research.
b · c · sin ( AOA ) S t u n n e l = 0.36 · 0.80 1.2 2 · sin ( AOA ) .
Applying the test-bench and wind-tunnel dimensions in Equation (6), it was shown that, for AOA up to 15°, the blockage ratio is below 5%. For angles above 15°, a dedicated analysis could be recommended depending on data uniformity evaluation. However, considering the defined objectives, the operational range of interest (0–15° AOA) and data uniformity, no corrections were applied. It is important to say that, although the blockage effect may lead to modifications on the pressure-differential distribution observed at high AOA, it does not impair sensors’ capability evaluation or phenomena identification.
The wind-tunnel tests covered most of the flight envelope expected for common inflatable wings. Static tests were carried out by selecting angles of attack (AOA) from −20° to 25° in 5° steps and free-flow airspeeds of 3, 6, 9, and 10 m/s for each AOA. Dynamic excursions, at low and high speeds, were executed by varying AOA to evaluate the system’s capability to capture dynamic changes in pressure distributions during maneuvers and to evaluate instrumentation integrity. It is worth clarifying that the operational range concept is related to normal flight conditions, which is limited to speeds between 9 to 12 m/s and AOA from 0° to 10° [8]. For most paragliders and parafoils, the steady glide is maintained at speeds near 10 m/s and AOA around 5°. Wing motion and maneuvering leads to global variations attaining speeds between 6 m/s and 12 m/s and AOA between 0° and 15°, but local variations can be much higher. Situations outside these limits are transient, and then, considered as the exploratory range. It comprehends pre-inflation situations, which are represented by speeds below 6 m/s, and pre-collapsing situations, which are represented by negative incidences or an AOA above 15°.
The Reynolds Number (Re) is an important parameter in the aerodynamics study of aircraft systems. For inflatable wings, the low-Reynolds number becomes a relevant aspect linked to the occurrence of flow separation and reattachment during the wind-tunnel tests. Considering the test-bench geometry and the conditions tested, Re varied from 1.6 × 10⁵ to 5.6 × 10⁵. The range is inside the envelope of 104 < Re < 106, defined by King [30] as that subjected to laminar separation bubbles. The Re assessment from wind-tunnel measurements needs no corrections since it corresponds to the same range of actual-flight operation. Therefore, no scale effects are supposed to affect the validity of experimental results.
It is worth highlighting that measurements at speeds near or under 6 m/s were useful, especially to set inflation thresholds, as well as measurements at negative AOA and at AOA above 15°, which were useful to characterize collapse and stall. However, the data acquired under conditions inside the interval of 9–10 m/s and 0–15° AOA are especially relevant to demonstrate the capability of the instrumentation to monitor the pressure differential variations that are relevant for the dominant flight conditions. Speeds above 10 m/s are achievable in flight, however, sensor’s range limit prevented tests at higher speeds. It does not impair any evaluation, since the important task to be accomplished by the instrumentation is to capture relevant variations at low-pressure levels. The speed level makes the pressure reaching the sensor’s limit (125 Pa) wing certainly fully inflated and fly far from any aerodynamic limit. Additionally, sensor overpressure capability up to 1 bar (105 Pa) guarantees that no expected acceleration could ever reach levels that may damage the sensors.
The results obtained in the wind tunnel qualify the instrumentation for both static and dynamic readings and demonstrate basic phenomena occurring on inflatable wings with no perceptible elastic deformation. These results are immediately applicable to stable conditions, since size and speed are both representative of real operational wings. Although test bench and wind-tunnel features may, at some level, affect the accuracy of the data, none of these potential effects compromise instrumentation qualification or phenomenon identification. In-flight, dynamic elastic deformations will affect the differential pressure measurements, revealing local reactions due to the aerodynamic load. The capacity of identifying these reactions is assured based on the instrumentation performance verified by the wind-tunnel campaign. Following the next step on the research, moving to a wing prototype, any relevant elastic deformations are captured as local pressure differential variation. Parameterizing these variations based on a set of defined flight-test maneuvers allows for the characterizing of the wing in terms of responsiveness and stability.

2.4. Mechanical and Aerodynamic Constraints

For in-flight applications, the combined adverse effect of flow disturbances and wing surface deformation due to the presence of instrumentation was also investigated. Previous results have shown that, even for thin sensors, their attachment to the external surface may alter the boundary layer significantly [33]. It is worth mentioning that the first prototype designed for the present research used sensors attached externally to the surface of the wing and faced the same problems that are reported. This drawback was prevented by redesigning the system that attached the sensors to the inner surface. The local differential pressure and the fabric tensile strength interactions counterbalance sensor weight in a highly complex phenomenon. Methods for fluid-structure analysis of membrane behavior represent a particular field of research [40,41] and is beyond the scope of the present work. Nevertheless, a simplified evaluation was developed to limit the operational mass of the sensor component.
The effect of a localized additional load was estimated with a simplistic but effective approximation considering the inflated cell as a pressure vessel [42]. For that, the minimum tension supported by the fabric should equal the longitudinal stress, as depicted in Figure 2.
The tensile strength of the standard fabric is exceptionally high compared to the load imposed by small sensors. For very small deflections and neglecting the fabric specific weight, the weight of the sensor not sustained by the local differential pressure is compensated by the vertical component of fabric tension generated by inflation.
W · g π · r s 2 · q ˜ = π · ( r s + r i ) · τ · δ .
In a conservative approach, assuming a cylindrical vessel, the diameter is the maximum height of the cell, the longitudinal stress, providing the expected minimum level of tension, which is given by
τ = q · r c 2 · t f .
Equation (6) indicates that tension ( τ ) is proportional to the total dynamic pressure ( q ) that inflates the cell, and to the ratio between the reference radius of the cross-section of the inflated cell ( r c ) and fabric thickness ( t f ). The radius of influence can be directly determined by the area that makes the force, resulting from the average local differential pressure ( q ˜ ), which is sufficiently high to sustain the weight ( W ) of the sensor unit
π · r i 2 · q ˜ = W · g ,
where
q ˜ = | C p ( x , A O A ) 1 | · q .
Finally, from Equation (7), the estimated deflection can be inferred as
δ = 2 · t f · ( W · g π · r s 2 · q ˜ ) π · r c · ( r s + r i ) · q .
Using the instrumentation physical proprieties, Equation (11) suggests that, for the worse situation, when C p = 0 , and V = 5 m/s, a wing surface deflection of 0.6 mm is expected. For the same situation, the minimum boundary layer thickness can be calculated, as suggested by Ferreira [43] using
δ ( x ) = 4.64 · μ c · x V .
At 5 m/s airspeed, considering a standard air kinetic viscosity of 14 m/s2, a 2.2 mm boundary layer thickness is anticipated at the location of the sensor S1. It demonstrates that the predicted deflection is far below the boundary layer thickness even at pre-inflation speeds. As speed increases, deflection decreases rapidly, providing an additional margin relative to the boundary layer thickness. For speeds inside the operational flight envelope (≈9 m/s), the predicted deflection approaches 0.2 mm, which is completely unable to affect aerodynamic characteristics or measurements.
During wind-tunnel tests, it was possible to notice that for speeds above 6 m/s there was no perceptible effect of the instrumentation on the wing’s shape. There were no indications of deformation, vibration or flow detachment that could anticipate the restrictions for immediate on-board installation. Additionally, a visual windsock test was performed using dummy weight cases representing the total weight of the instrumentation. It was observed that even using a windsock, with no rigid parts, the inflation at speeds above 6 m/s was stable and had no visible signs of deformations due to the presence of the weights. Therefore, the system is considered to eb ready for in-flight application, which is the next phase of the research project.

3. Results and Discussion

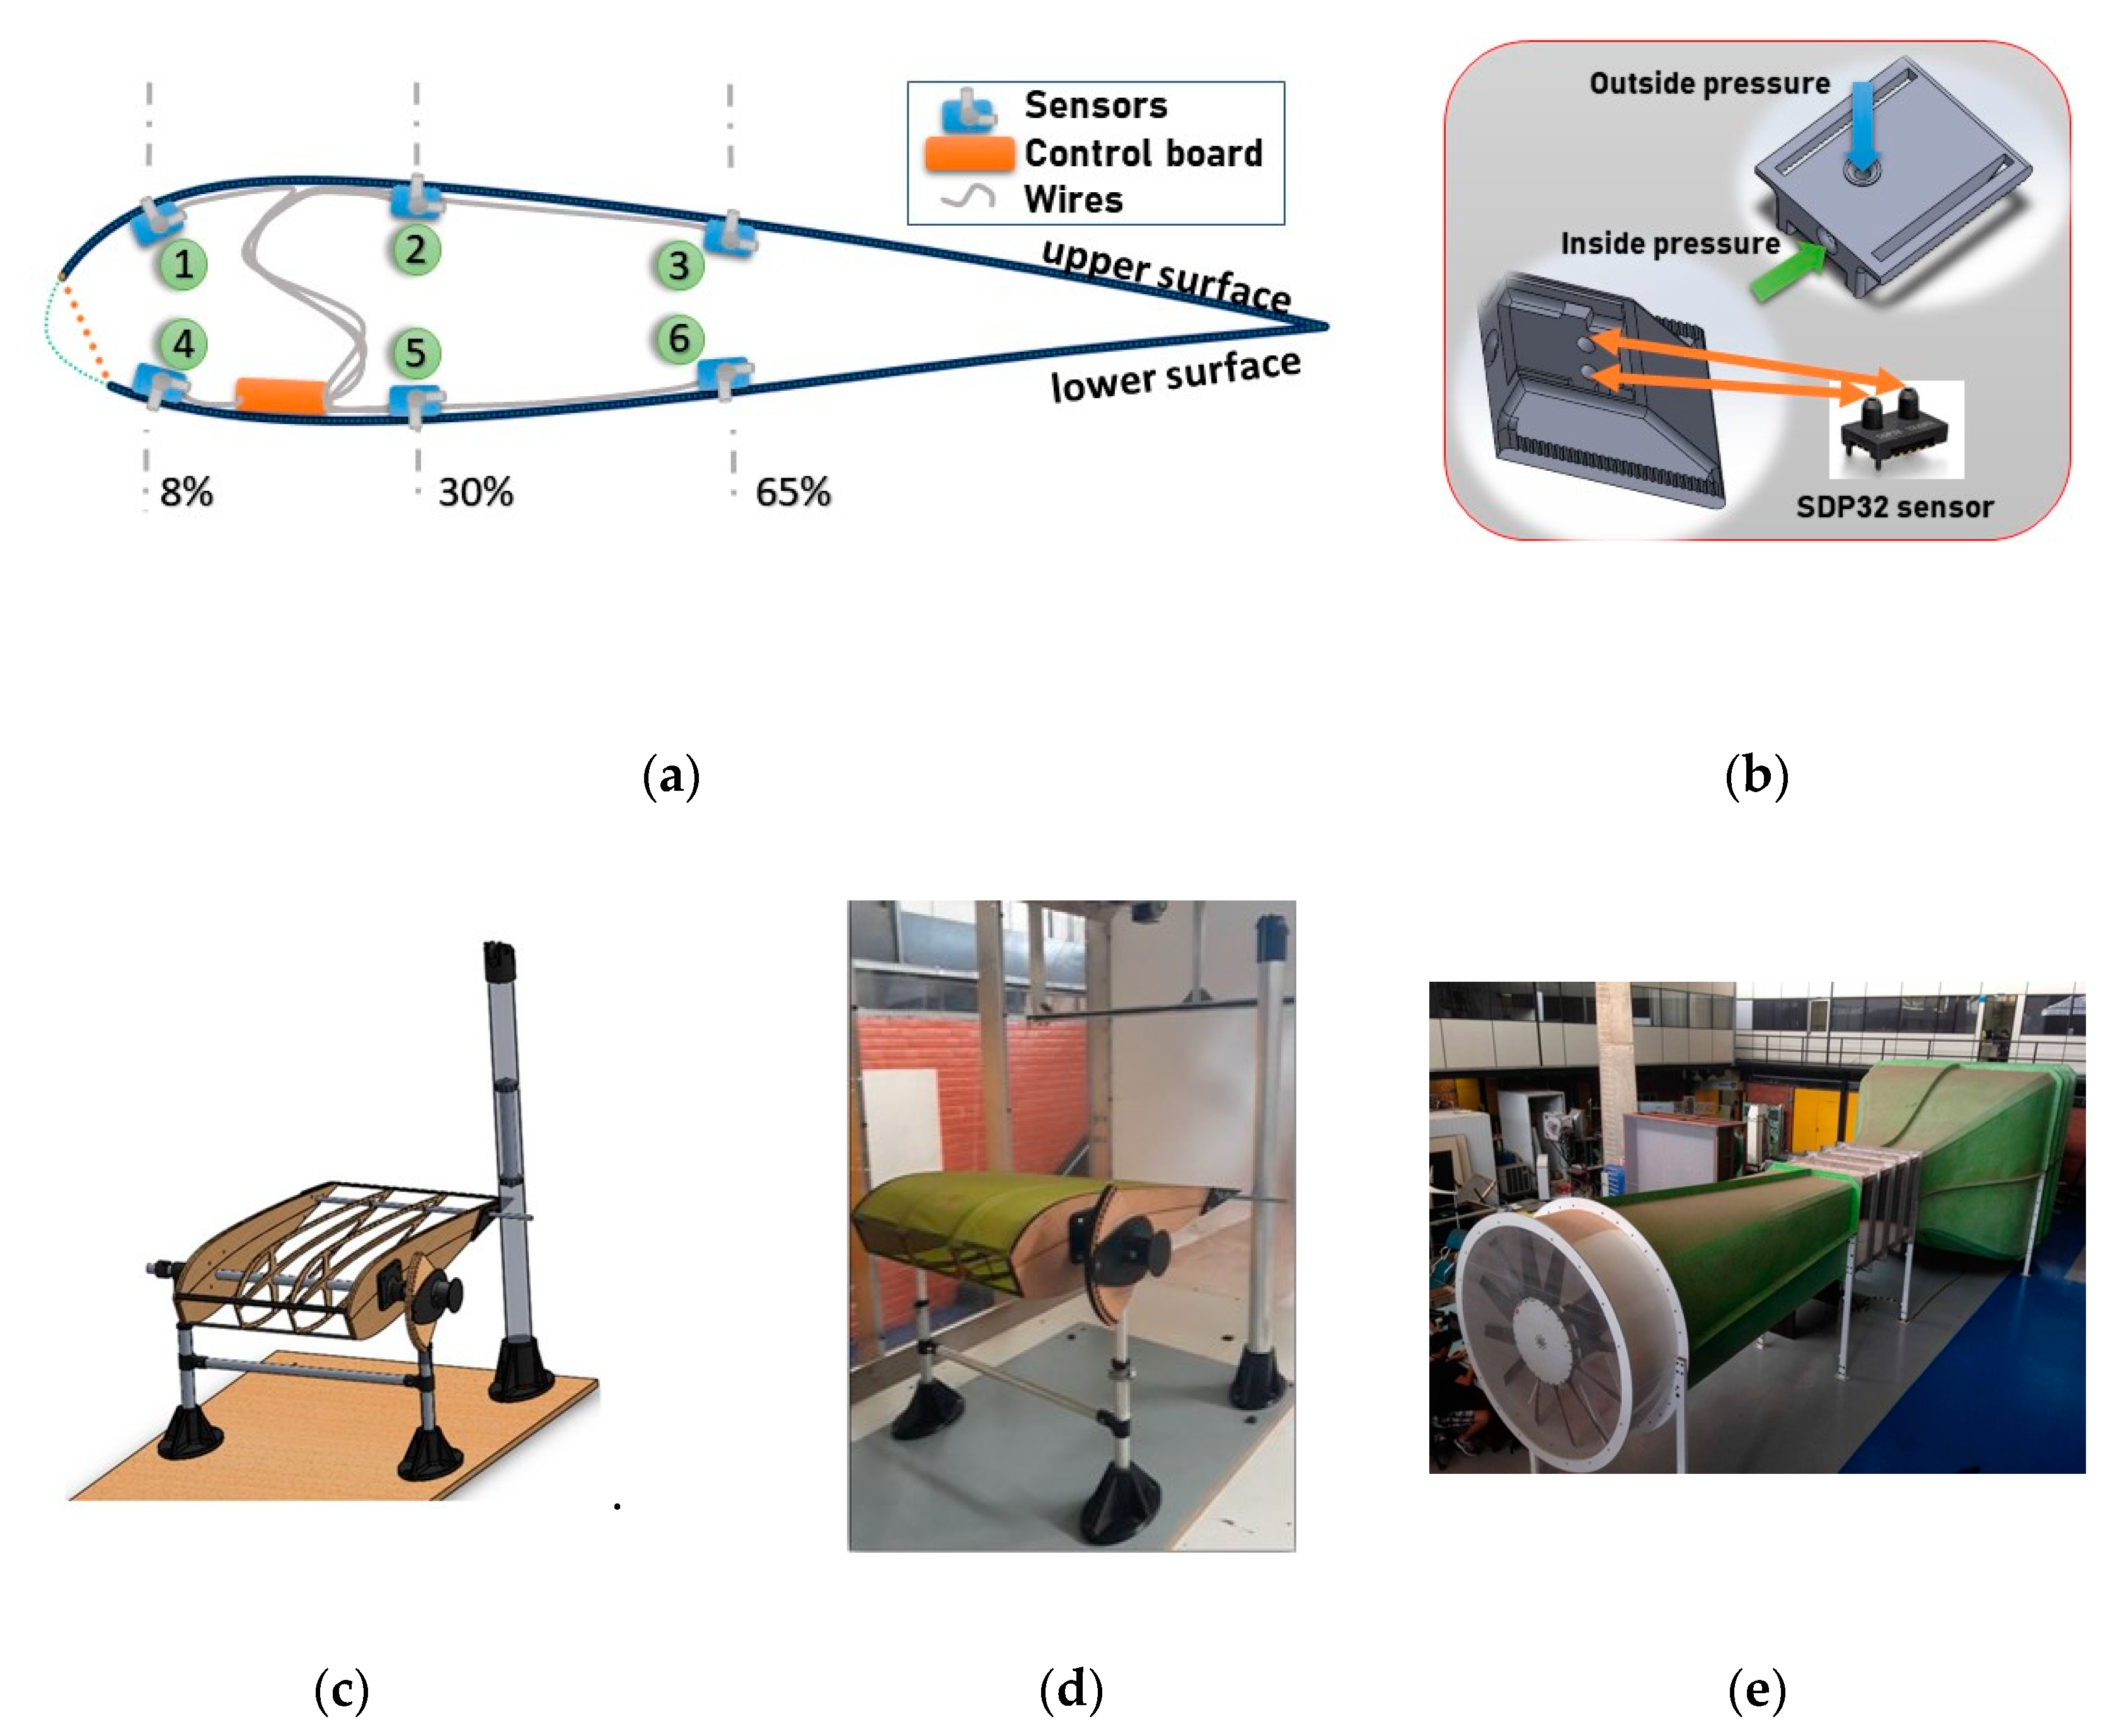
3.1. Differential Pressure Readings

The wind-tunnel tests covered normal flight conditions (operational range) and out-of-envelope conditions (exploratory range), which included pre-inflation speeds, negative incidence, and post-stall angles of attack. Data shows that, at the operational range (0° < AOA < 15°), the aerodynamic behavior follows the principles observed in rigid airfoils, whereas, in the exploratory range, the inflatable nature of the wing overcomes typical characteristics.
An initial measurement with no flow speed was conducted to evaluate sensors setting at zero speed. The sensors presented stable readings under 1.0 Pa. Another measurement at 12 m/s, representing the maximum speed, was executed and the range limit of the sensors was reached as expected (125 Pa). No adverse measurement behavior was identified in any condition. Static measurements were evaluated in 10 s of stabilization intervals. 
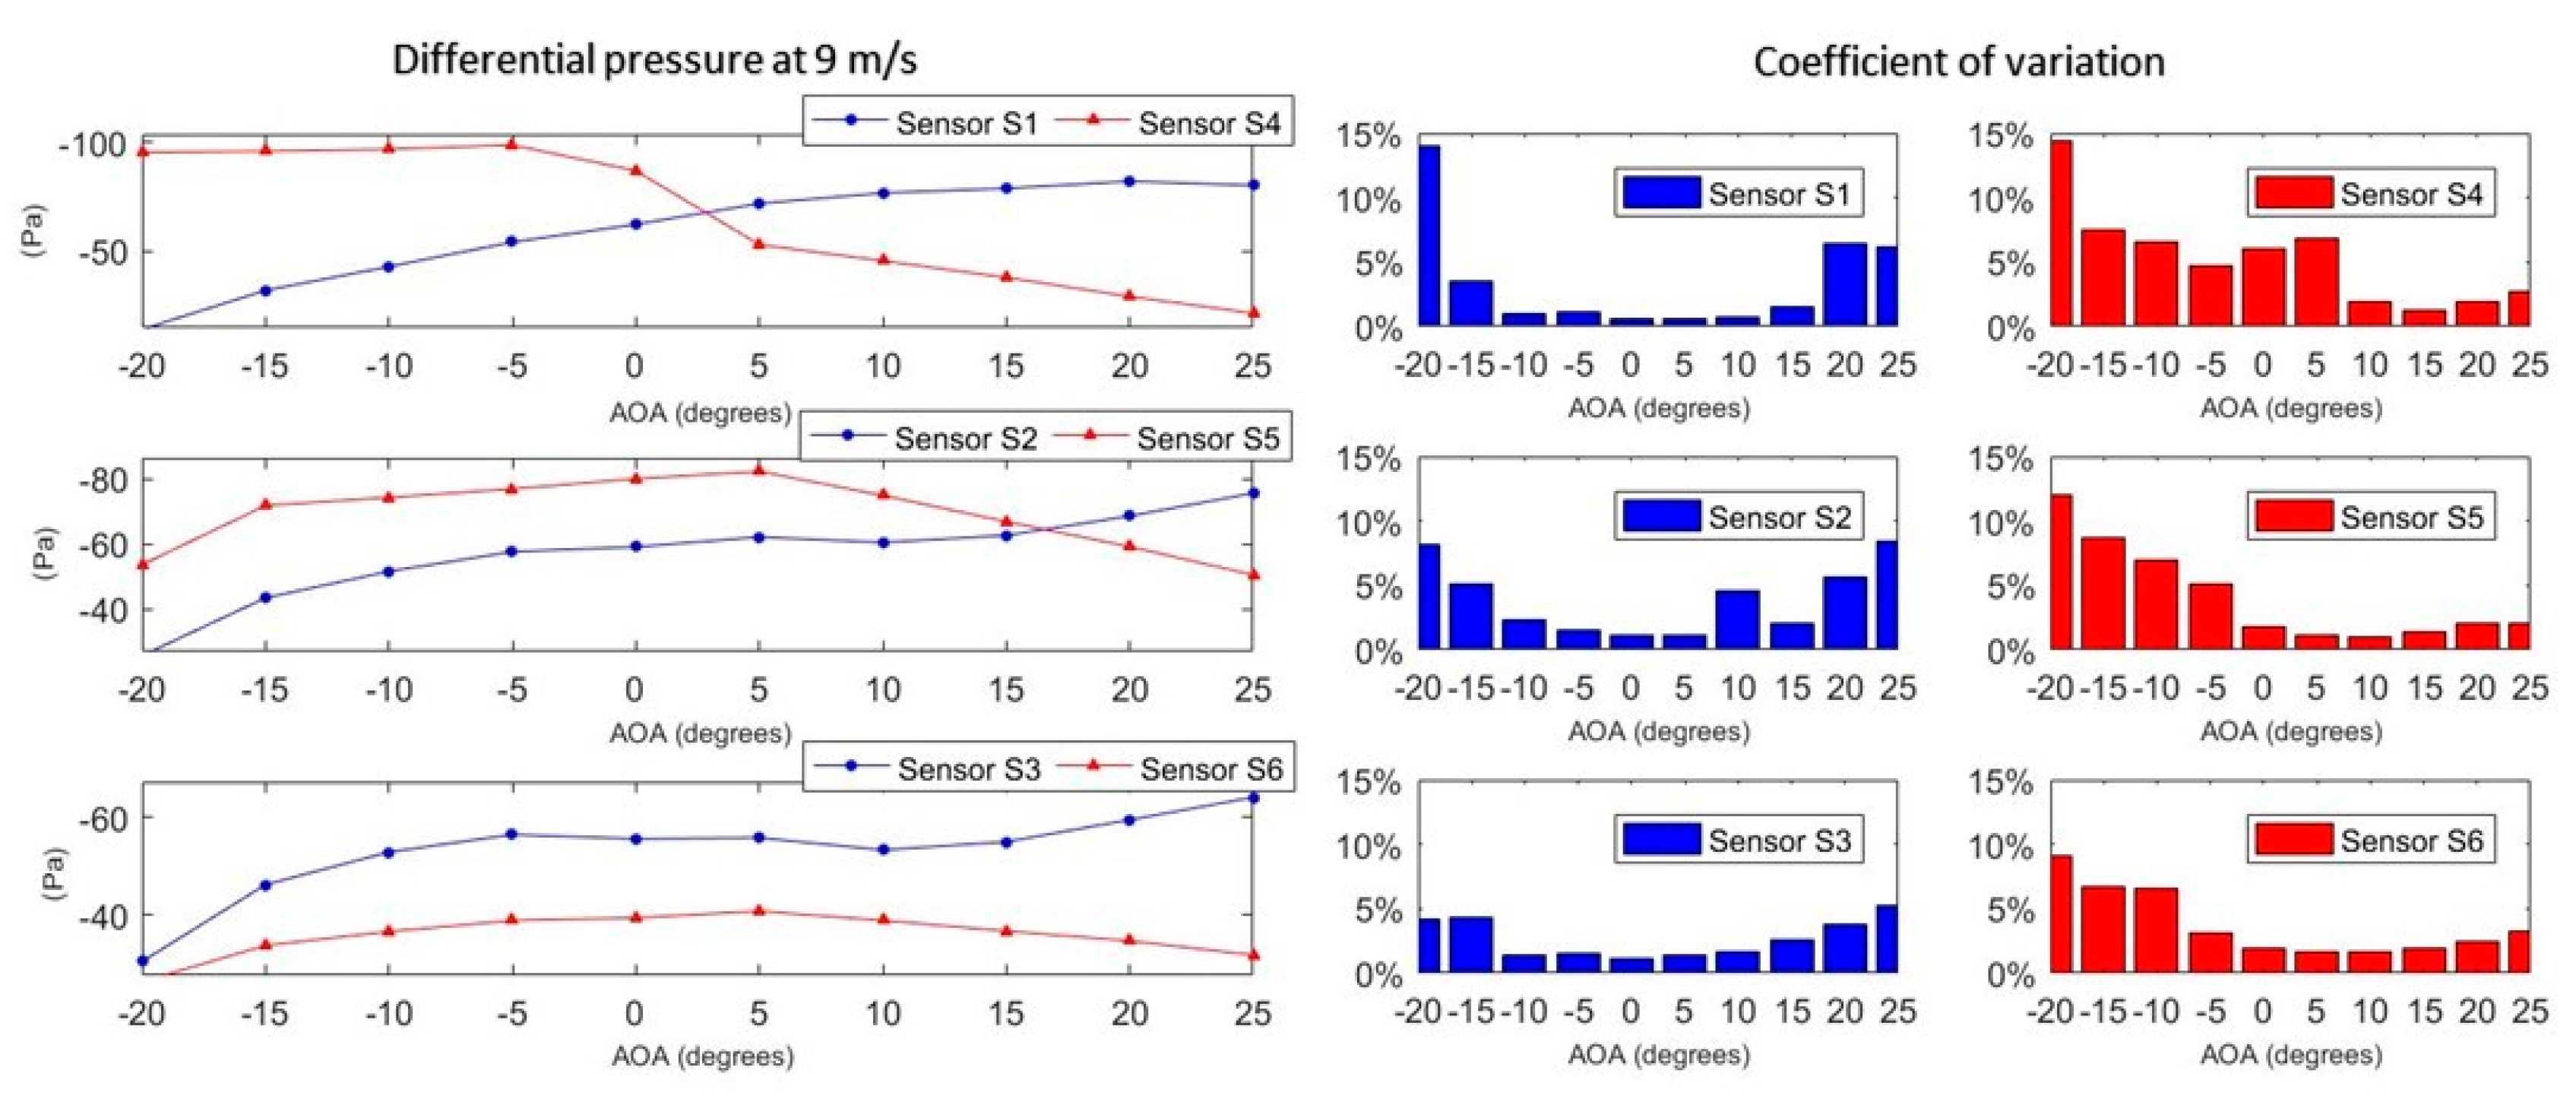
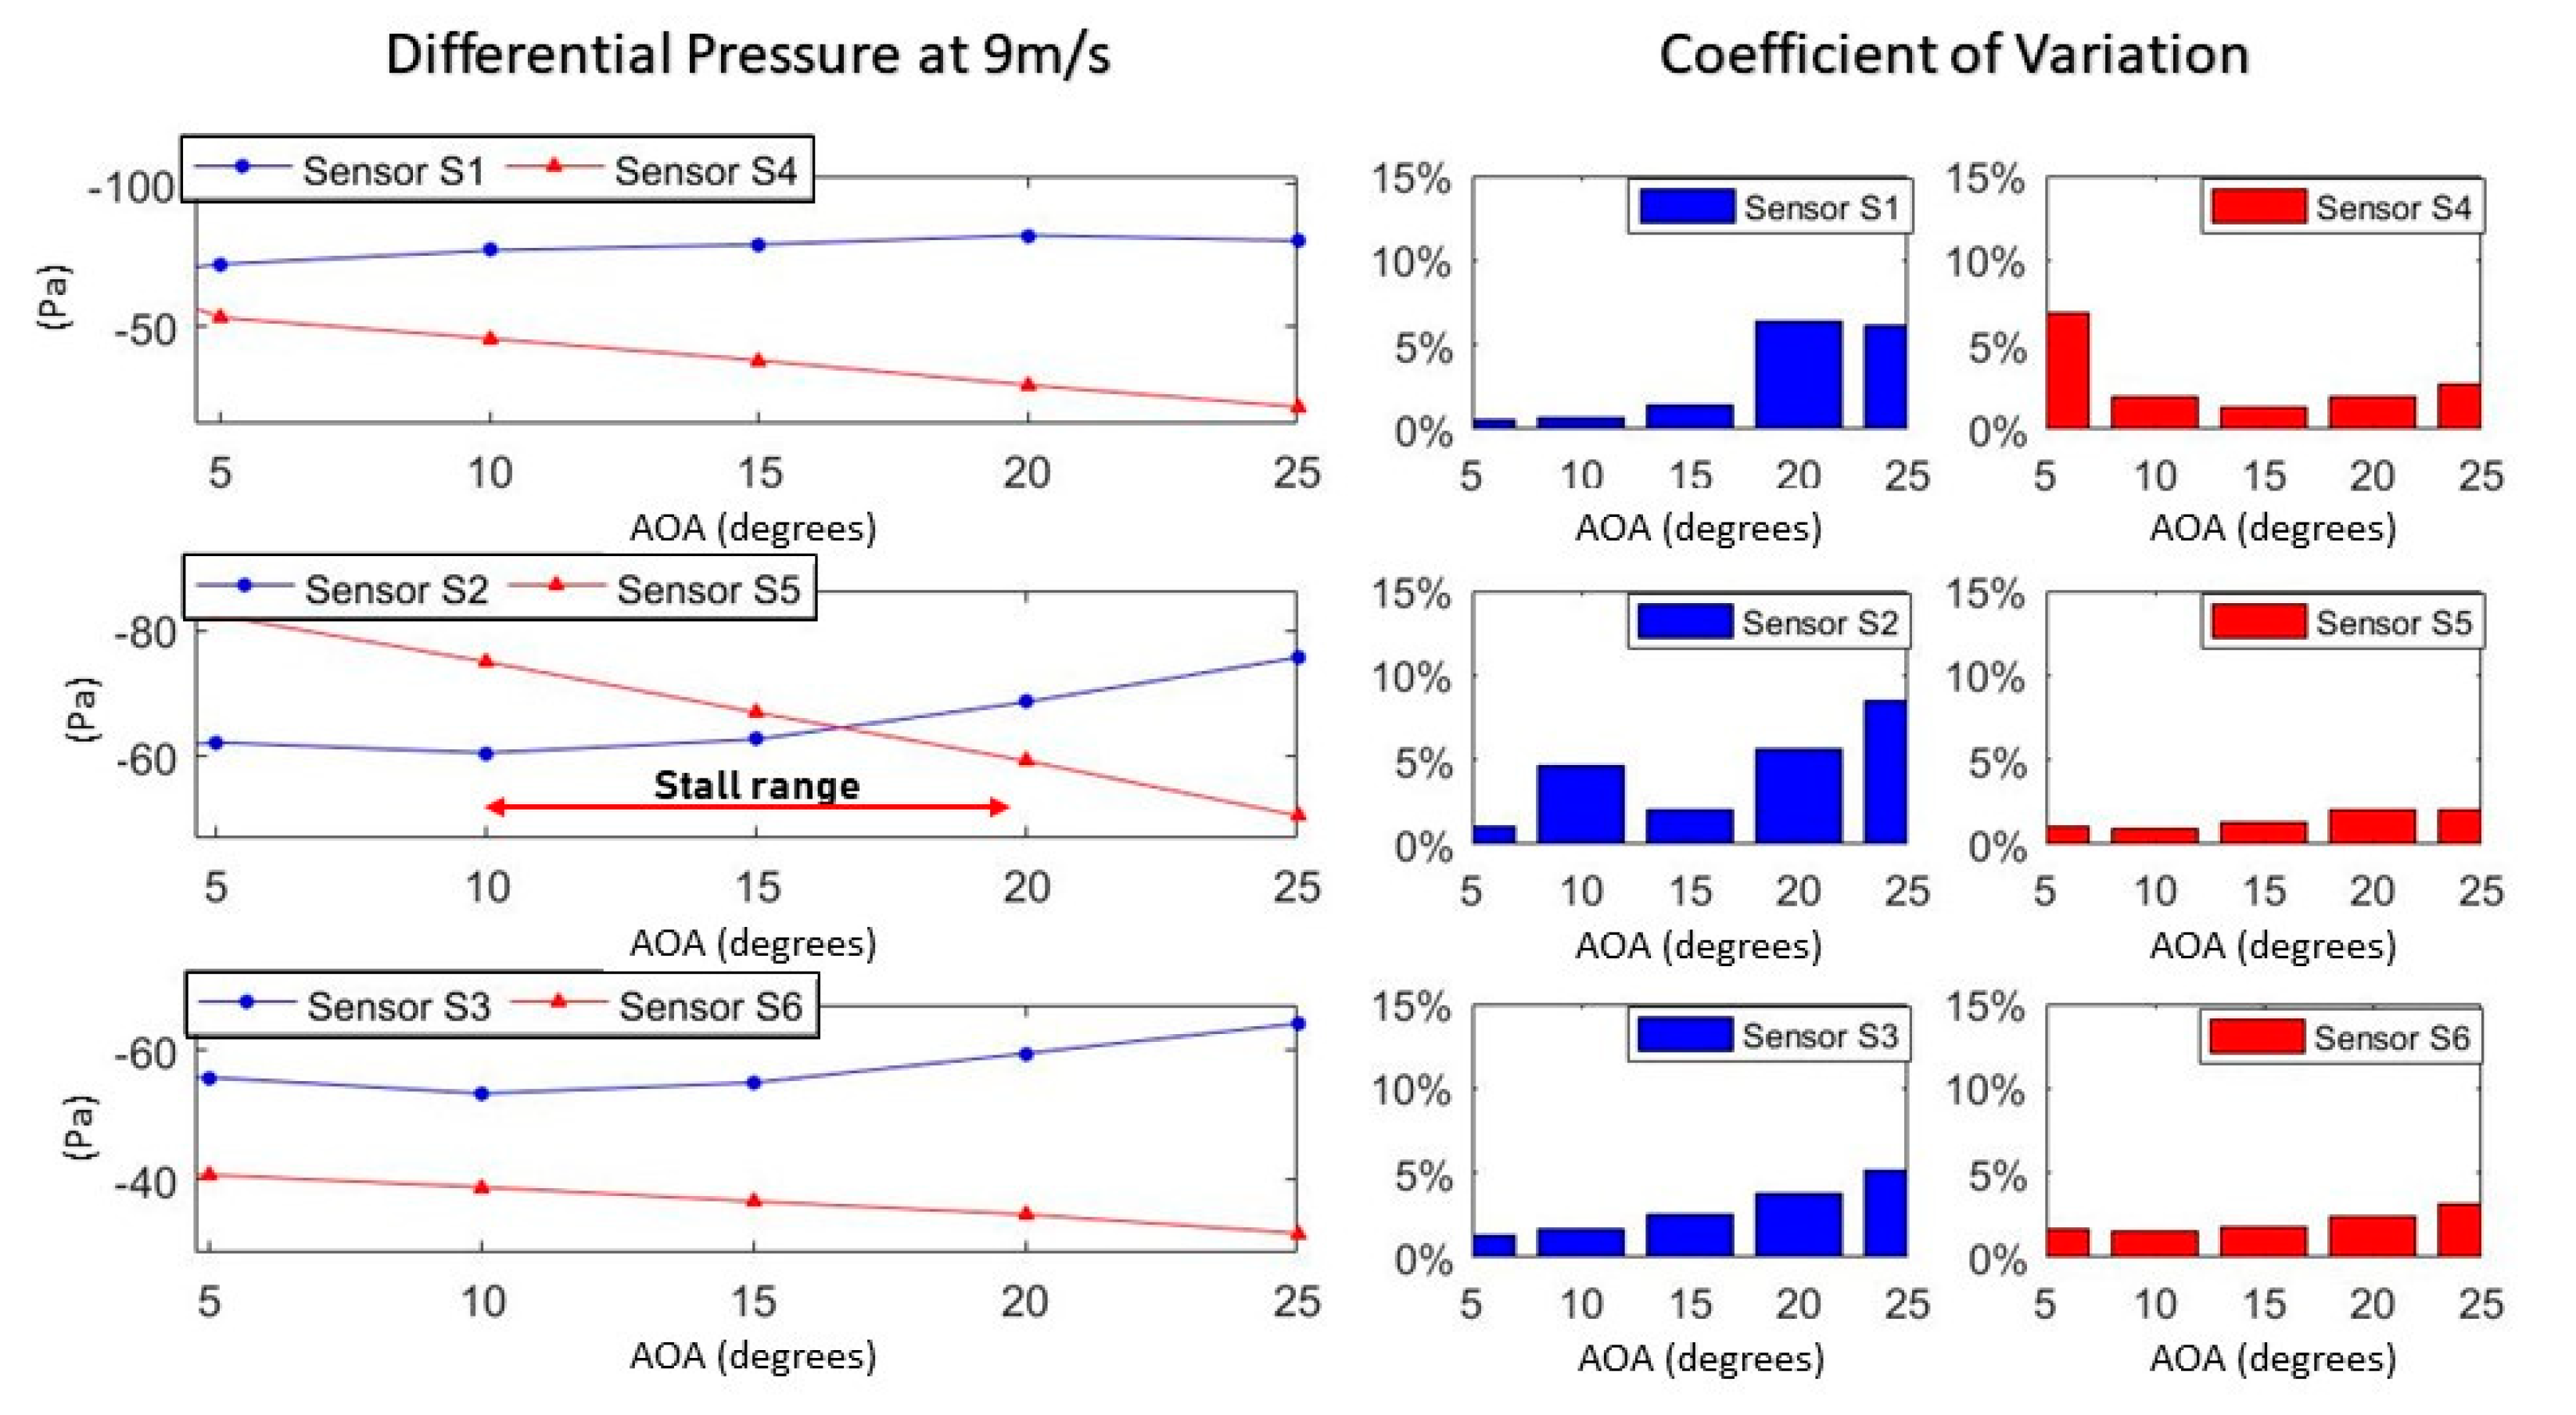
Figure 3 shows differential pressure readings for an airspeed of 9 m/s as a function of the wing’s angle of attack, along with the calculated coefficient of variation.
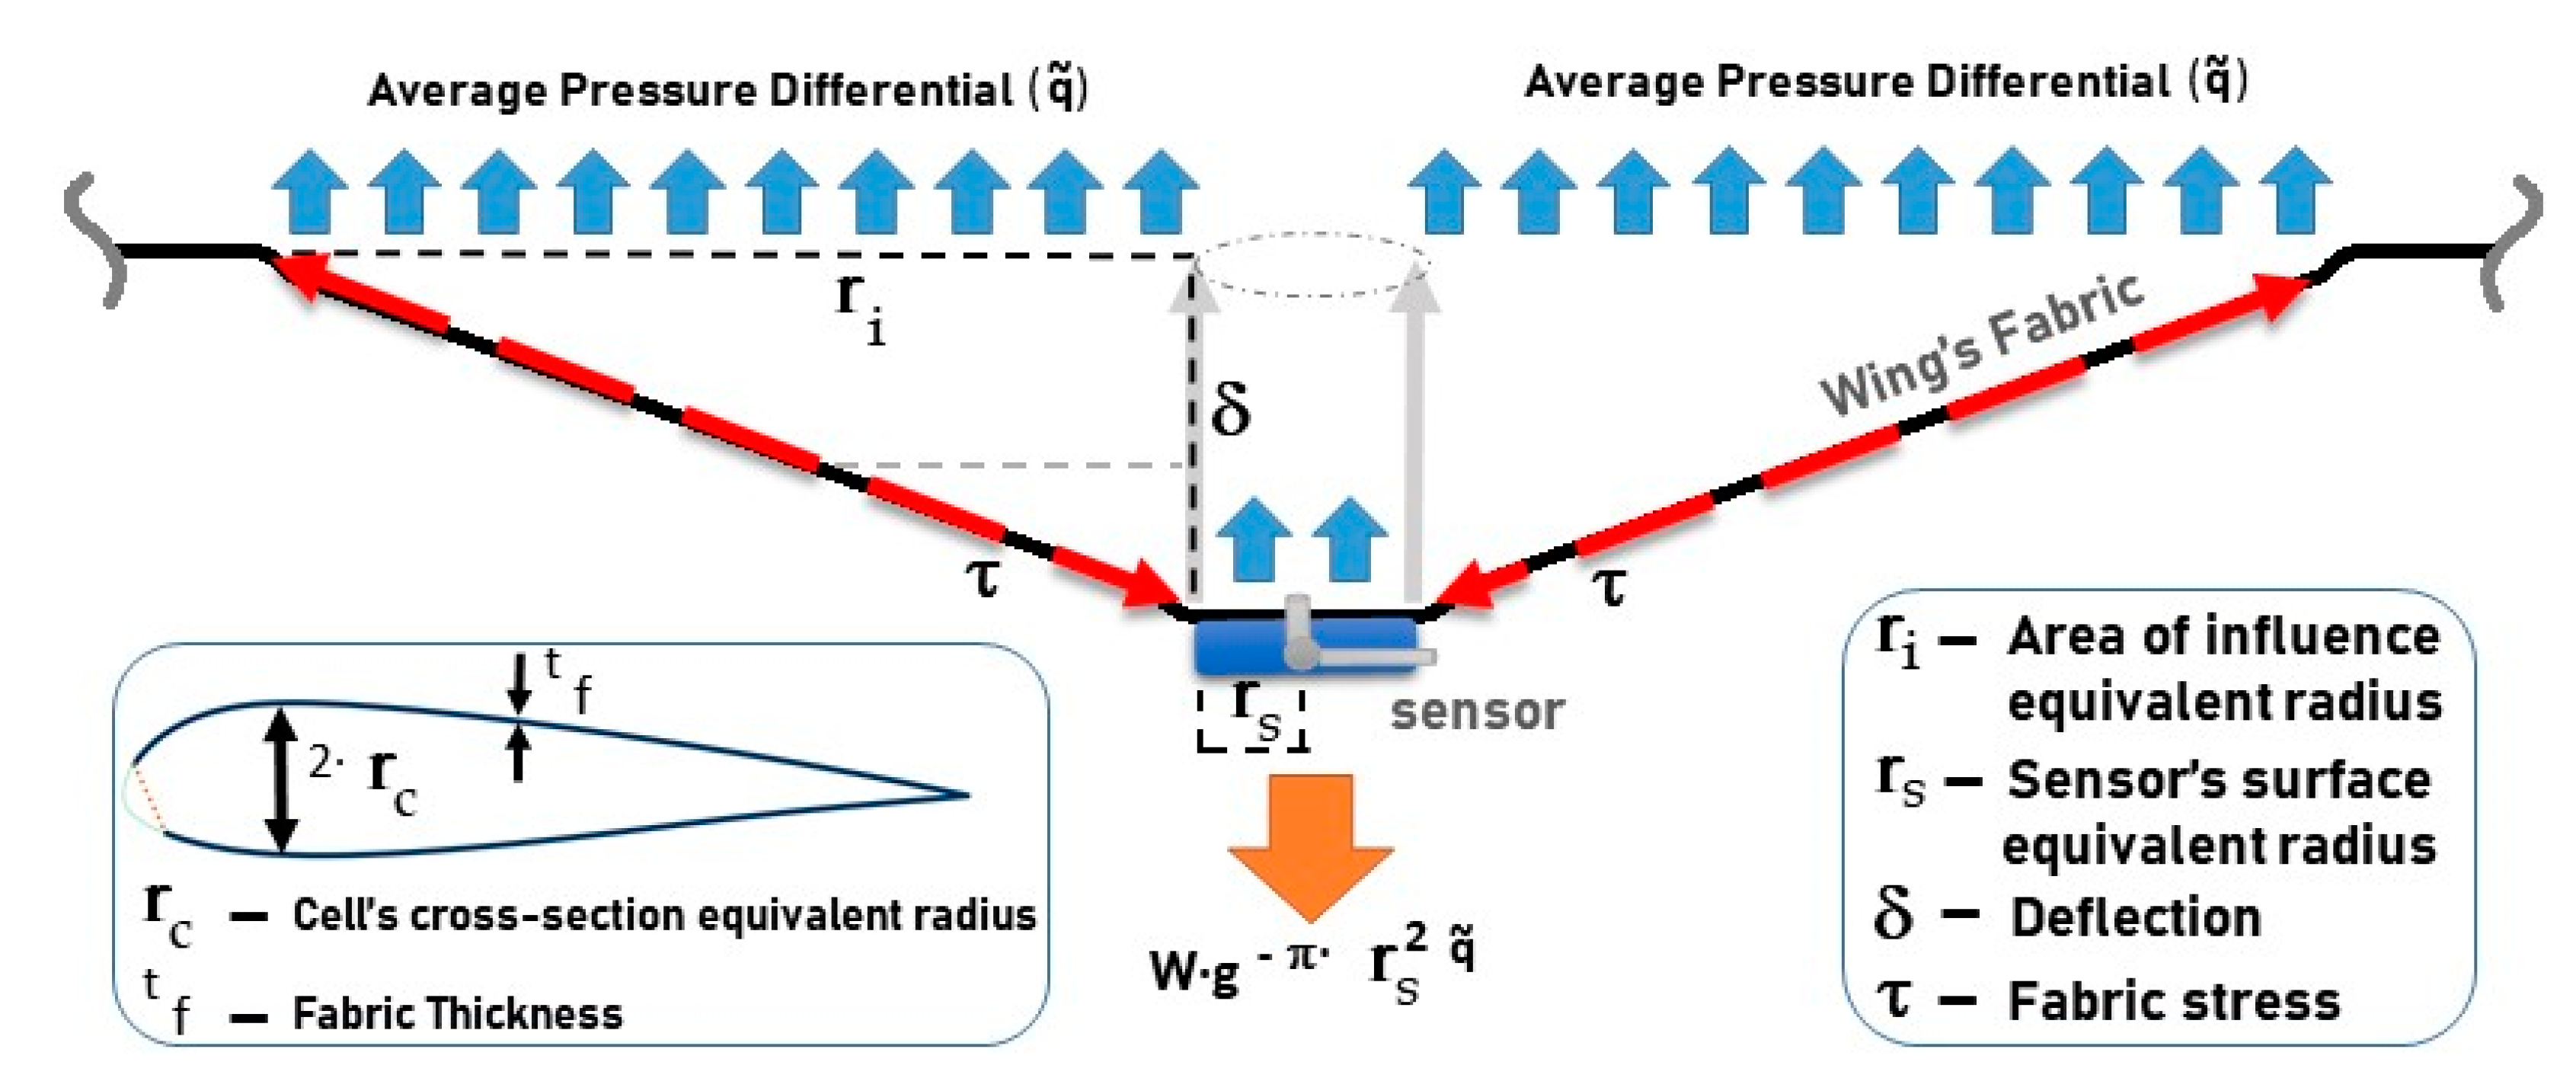
Figure 3 present the data obtained at 9 m/s grouped by airfoil regions. As can be seen, differential pressures varied from less than −10 Pa to about −100 Pa. The upper-front (S1) and the bottom-front (S4) sensors present a wider range, as expected, since lift is concentrated at the initial portion of the airfoil. For the same reason, the upper-rear (S3) and the bottom-rear (S6) sensors present a more stable pattern. The upper-middle (S2) and bottom-middle (S5) sensors present the intermediate conditions linking the leading and trailing edges, which reveals a distinctive behavior at the bottom surface, which is strongly affected by the air intake. It is worth reaffirming the intention of working with pressure differentials and not with traditional external pressure coefficients, since the direct measurement of pressure differentials reveals the combined effect of external and internal flow dynamics, which are crucial for inflatable wings.
The coefficient of variation (CV) consistently shows increased data scattering outside the operational flight envelope (0° < AOA < 15°). At negative incidences or at angles above stall CV up to five times higher. It demonstrates the system’s capability of indicating detachment vortex formation. For angles of attack inside the operational envelope, the coefficients of variation were very close to the sensor’s resolution (3%), as informed by the manufacturer, except for the bottom-front sensor at low angles of attack, which have reached about 7%. This higher deviation corroborates Fogell’s observation [6] about the occurrence of a recirculation bubble at the bottom leading edge of the wing due to the air intake. The significant data scattering from sensor S4 materializes the effect of a vortex linked to the recirculation bubble acting on that region. It becomes even more noticeable by inspecting the change on sensor S4 measure pattern after entering the operational envelope. This effect is linked to both the low Reynolds number regime and the existence of an air-intake at the leading edge.
Another didactic way of looking into the data is taking the pressure differentials at the rear sensors (S3 and S6) as a baseline. These readings are supposed to be more stable in respect to AOA and to reflect the pressure-differential potential provided by the flow speed. Table 2 represents data extracted from Figure 3 for the operational flight envelope measured as a percentage of the baseline pressure differentials:
At 9 m/s, the average pressure measured by S3 and S6 are, respectively, 55 Pa and 39 Pa at 65% of the chord, revealing enough of a pressure differential to sustain inflation and a difference of 16 Pa between pressure differentials at the upper and lower surfaces, indicating lift at that region. These measures are almost unaffected by AOA variation inside the operational flight envelope, presenting standard variations of ± 1.7 Pa and ± 1.1 Pa, respectively. However, the frontal and middle sensors’ readings vary considerably with AOA. In the same way, it is made clear how perceptible is the pressure-differential variation throughout the chord at both upper and lower surfaces for each flight condition. These observations are extremely important because it shows that the measurement of local pressure-differentials at the selected regions of the cell can provide an effective way of characterizing flight condition. For instance, increases in the pressure gradient at the upper surface, together with the decreasing in pressure gradient at the lower surface, between the second and third lines in Table 2, clearly indicates a pitching up from 5° to 10° AOA.
The pressure-differential distribution profile defines a standard in-flight signature for a particular wing model. Measuring the differential pressure profile at the steady glide condition provides a baseline, which can be used to identify in-flight dynamic reactions through pressure profile variation. As the inflatable wing will be dynamically deformed by aerodynamic loads originating from maneuvering or atmospheric disturbances, local variations on the pressure differential readings will be perceived, revealing reactions that can be linked to wing motion. Therefore, the wing can be characterized by correlating its motion, using standard accelerometers and inertial sensors, to the aerodynamic loads captured as pressure differential variation.
Considering the exploratory range, Figure 3 also shows that the coefficient of variation follows a path driven by the position of the vorticities. It moves from the bottom surface (at negative AOA) to the upper surface (at post-stall AOA) causing data scattering. Such a phenomenon can be better visualized in 
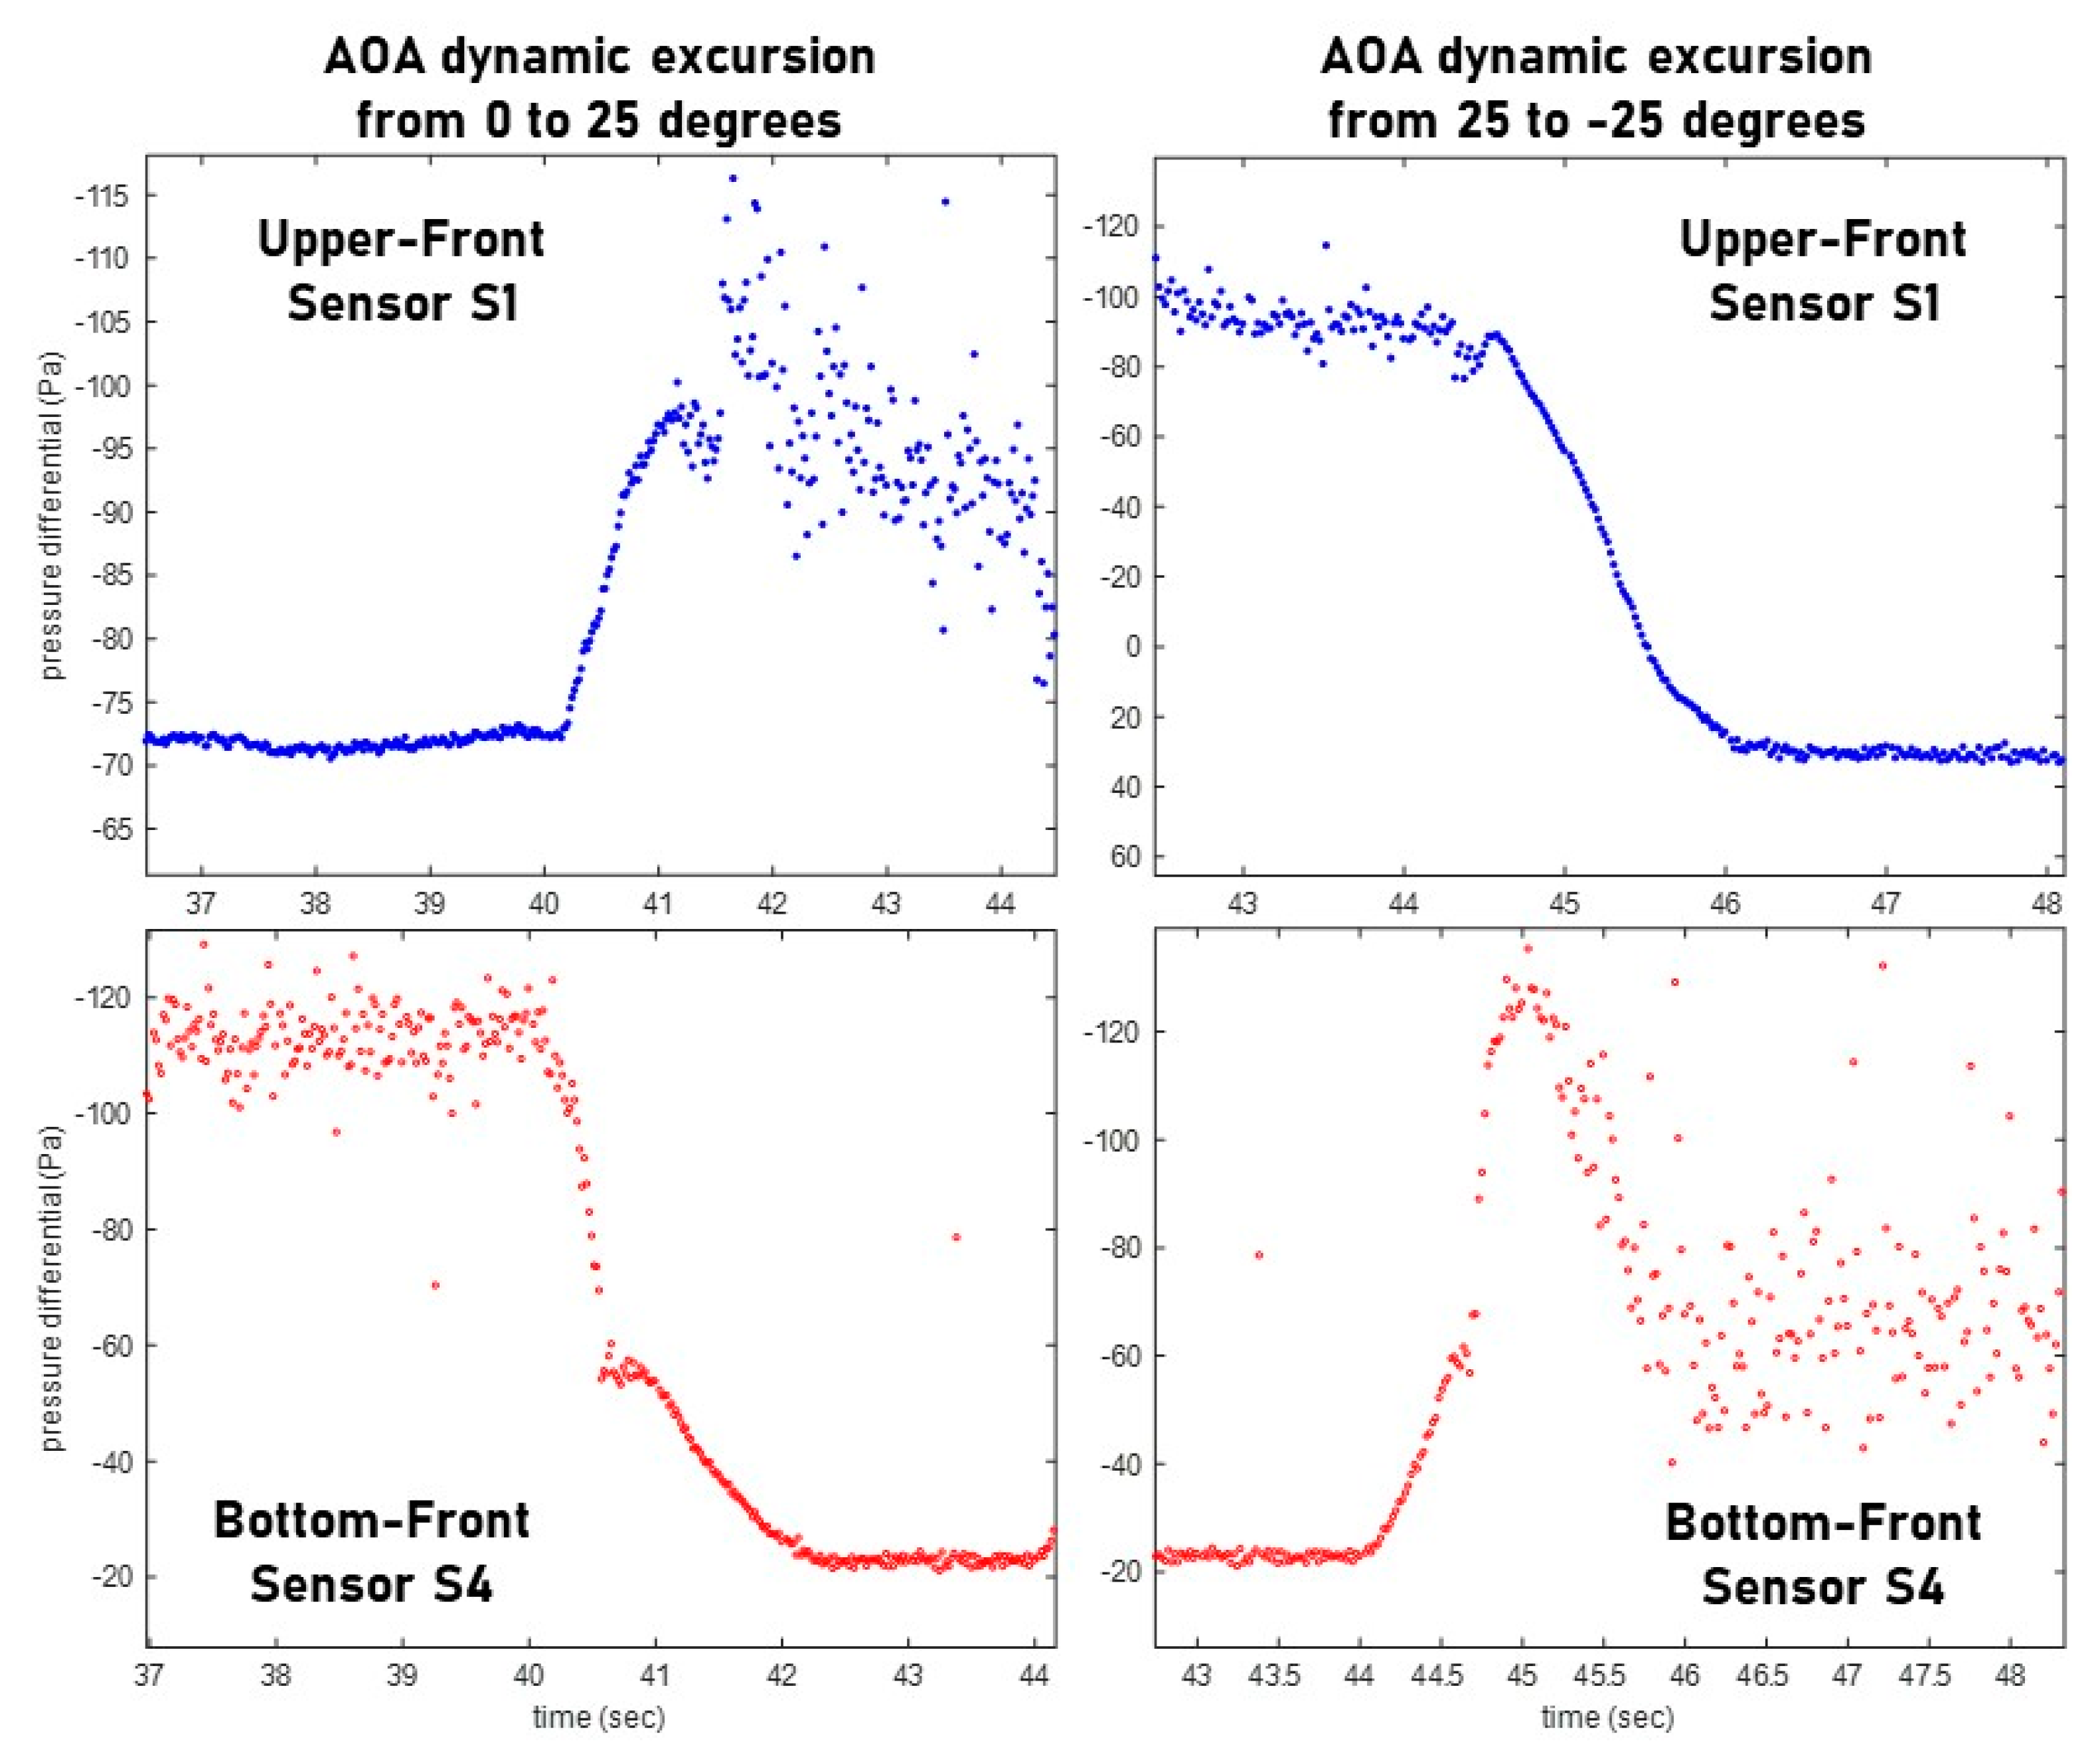
Figure 4, which presents two dynamic AOA excursions, from −25° to 25°, at an airspeed of 10 m/s.
Data corroborates the consistency of readings under dynamic variation. When the wing is pitched down, the differential pressure over the upper surface is inverted and becomes positive. The appearance of a vortex at the bottom surface is detected by the scattering of data from sensor S4. When the wing is pitched up, there is a clear manifestation of a post-stall vortex at the upper surface, however some air still enters the airfoil providing residual internal pressure, which sustains a low negative differential at the bottom surface.
The observed values remain fully consistent with those obtained for the stabilized conditions. It is interesting to point out that the bottom-front recirculation bubble disappears when the wing if fully pitched-up. It ascertains the source of deviations systematically observed for sensors S4 and S5, corroborating the existence of strong flow disturbances at the wing’s bottom leading edge at operational conditions.
Figure 4 is important for demonstrating instrumentation capability of continuously capturing relevant pressure differential variation caused by in-flight motion, and the ability to distinctly identify change in the flow regime. It must be considered that such capabilities make the system, as it is, a tool for shape stability monitoring.

3.2. The Inflation Phenomenon

The inflation phenomenon is characterized by the provision of minimum conditions, in terms of speed and AOA, for the wing to inflate. The limits associated to AOA are related to aerodynamic stability, whereas the limits related to speed are related to minimum dynamic pressure, thus providing wing stiffness.
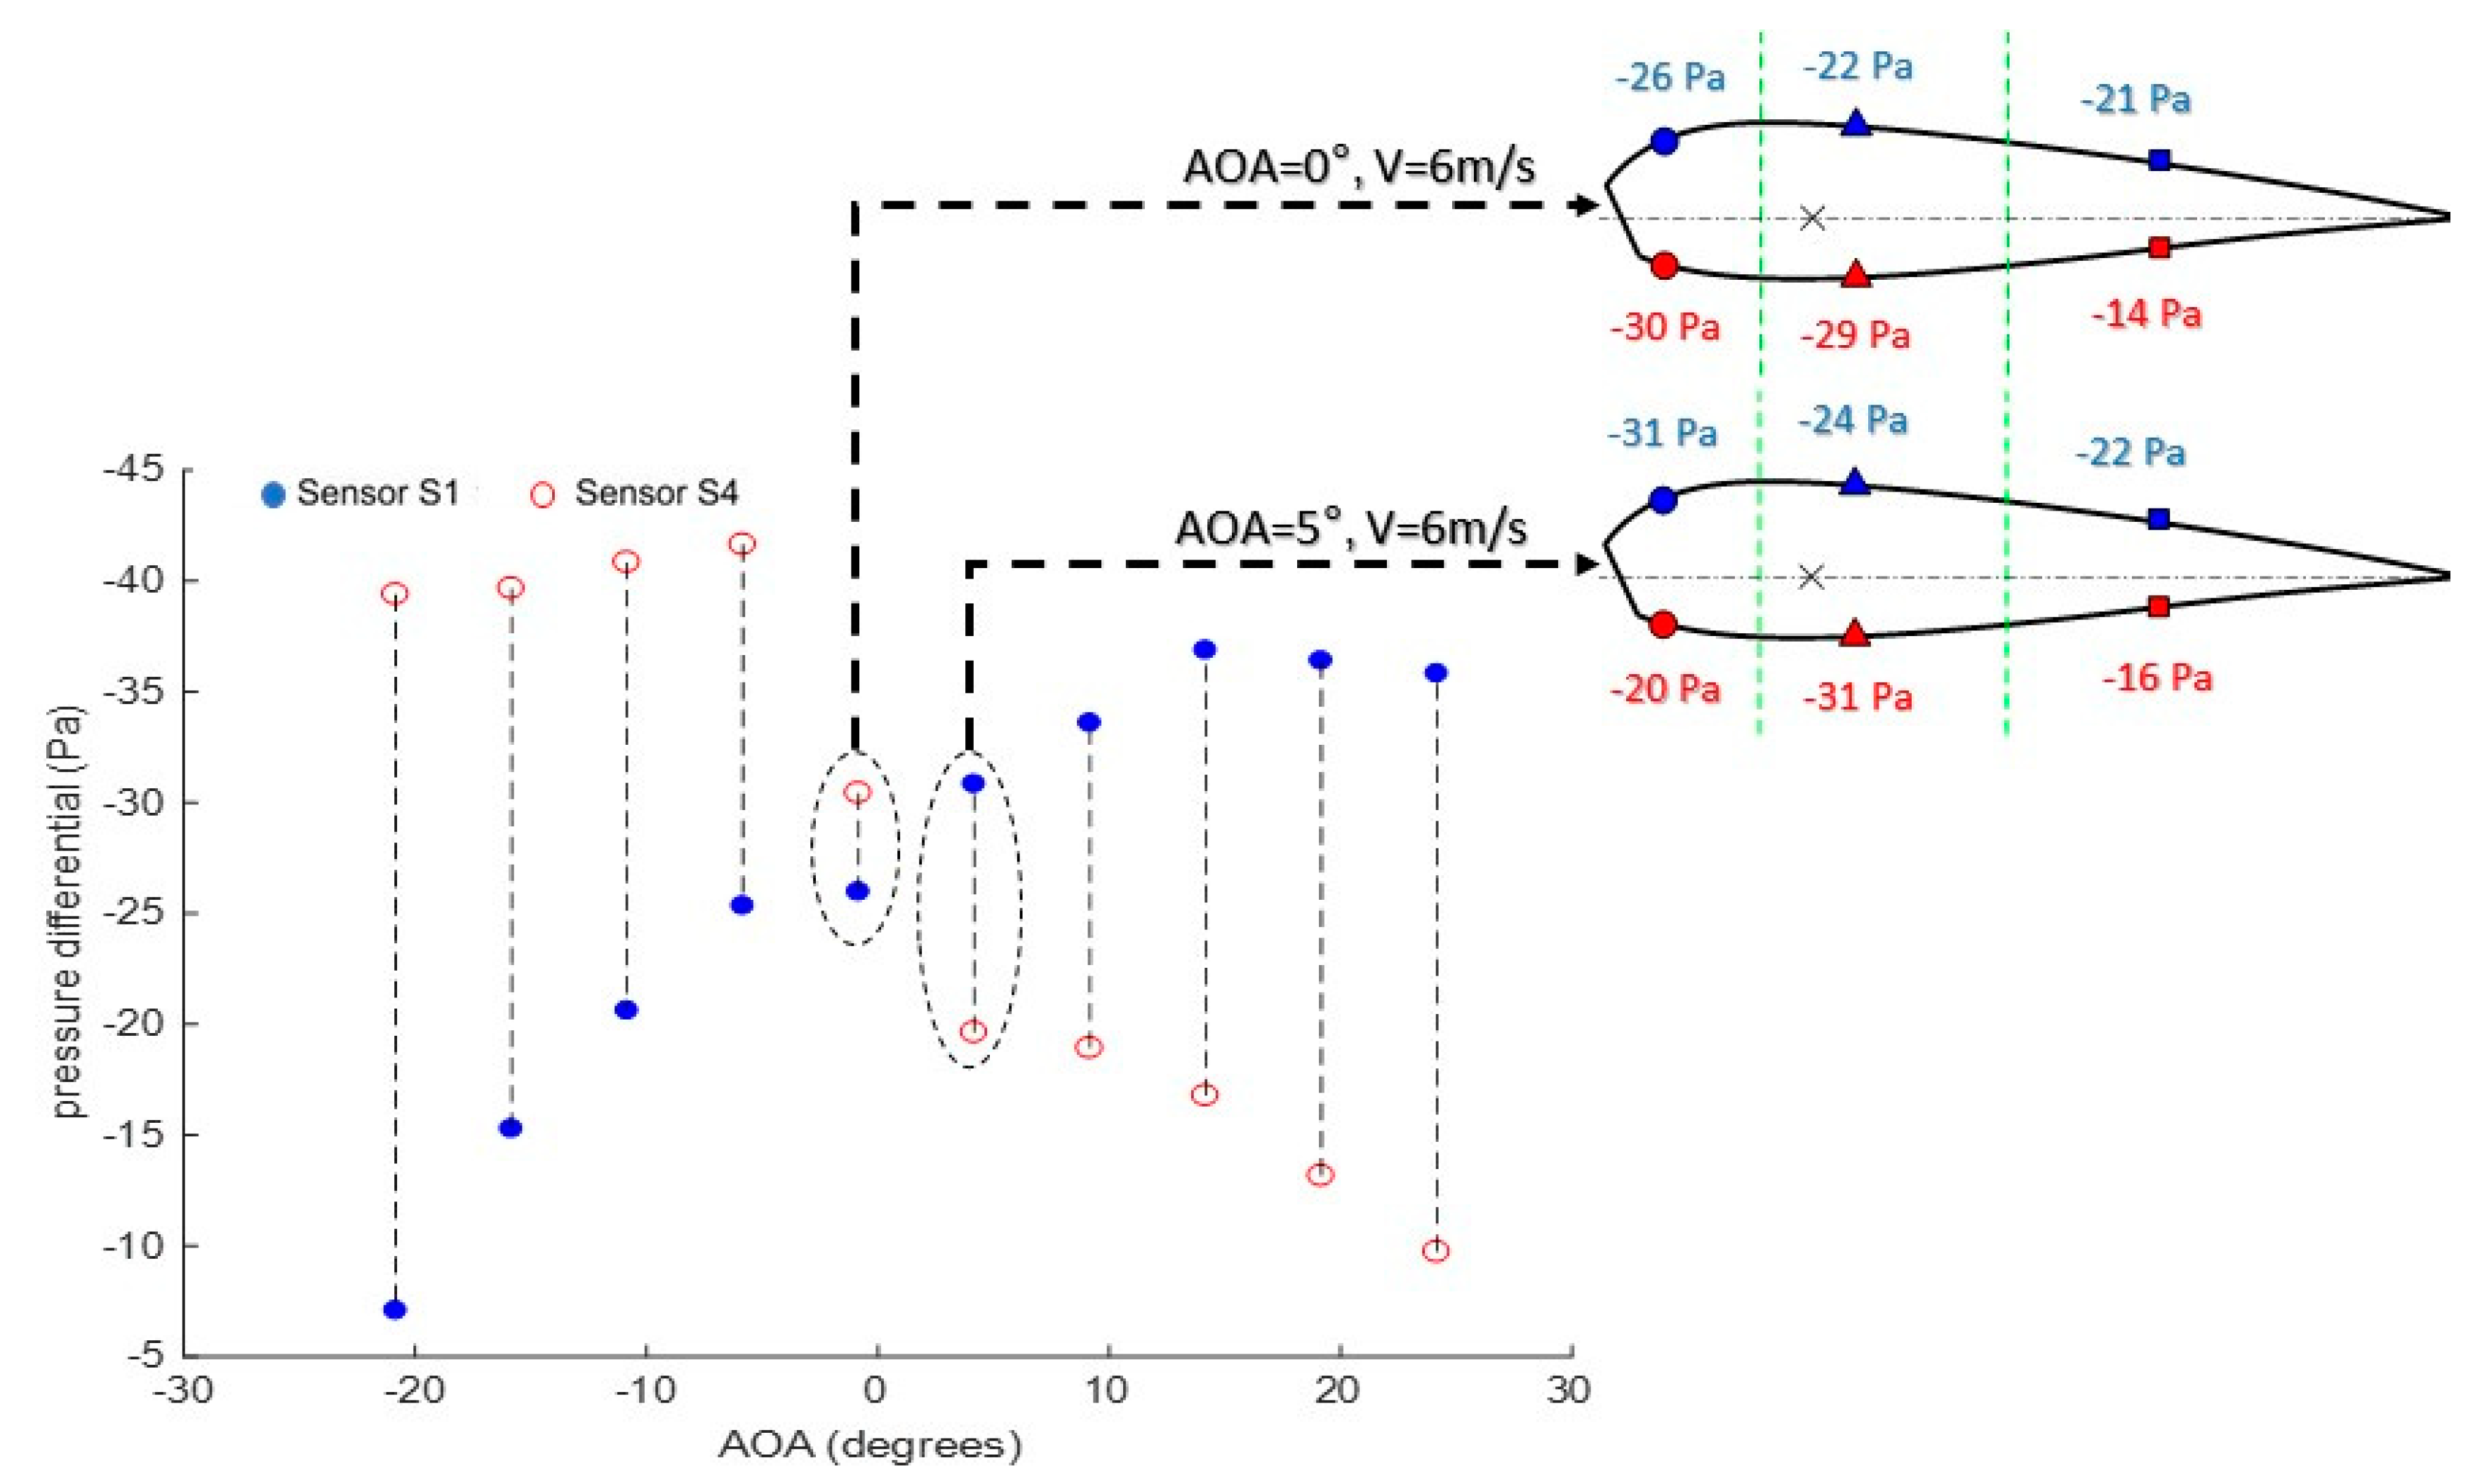
Figure 5 presents the readings for sensors S1 and S4 at airspeeds of 6 m/s and highlights differential pressure distribution for two angles of attack, before and after inflation. It makes clear that, for negative angles, or even for a very small AOA depending on the air intake’s geometry, the airfoil condition is unstable because the moment generated by higher-pressure differentials at the bottom leading edge and at the upper trailing edge tends to rotate the cell downwards, leading to a frontal collapse. After the incidence angle is further increased, the internal pressure augments, and the difference between the upper and bottom pressure-differentials at the leading edge is inverted. The expressive frontal lift tends to rotate the airfoil clockwise, providing stability conditions. In-flight, the pendulum mechanism would automatically adjust the speed and AOA, reaching the stable glide condition. In a wind-tunnel, the supports or actuators balance the resultant pitching moment.
As is known from the classic airfoil theory, the frontal part of the airfoil is responsible for most of the lift, meaning that this region drives airfoil behavior depending on the local ratio of the upper-lower pressure. Data plots from sensors S1 and S4, as depicted in Figure 5, reveal a substantial change in differential pressure distribution as the angle of attack goes from zero to five degrees. The sharp alteration of the differential pressure from sensor S4 characterizes the inflation of the cell, as observed by Mashud and Umemura [5,7]. This takes place when the stagnation point coincides with the air intake, which rapidly increases the wing internal pressure, thus making the cell potentially stable.
Prior to inflation, when the wing is pitched down, causing high levels of differential pressure at the bottom leading edge, the air accelerates through the upper surface, absorbing most of the dynamic pressure imposed by the flow. In such a case, the wing is sustained by the test-bench ribs but would collapse in an actual flight. When AOA increases, the inner pressure is sufficient to provide structural stiffness, and the flow over the airfoil becomes stable as in the rigid wing. Both internal and external pressure at the bottom leading edge is entirely reconfigured. Table 3 present data for 6 m/s between −10° and 10° AOA, illustrating the abrupt change in the pressure gradient at the leading edge of the airfoil:
For the tested airfoil, a linear interpolation based on the frontal differential pressures indicates that inflation occurs near 1.43°, which is compatible with those reported by other researchers [5,7]. It is possible that the presence of a rigid structure has slightly dislocated the point of inflation, favoring cell’s stiffening at a lower AOA. These characteristics can be used to design collapse prevention automatic systems, which can monitor the difference between pressure at the upper and lower leading edge, avoiding further reductions in AOA when this value decreases.
Finally, it is important to mention that speed itself plays an important part in inflation, as better explained in Section 3.4. Tests at 3 m/s proved that, even at favorable AOA, speeds lower than 6 m/s do not provide sufficient airfoil stiffness, resulting in shape instability, visual fabric deflections, vibration, and consequently, unrepresentative data.

3.3. The Stall Approximation

The stall condition is reached as the AOA is increased and the airflow can no longer contours the airfoil. Different wings present different stall characteristics, which may be progressive, starting from the trailing edge region, or abrupt, depending on the geometric proprieties and flight conditions as rotation rate or air density. However, a full stall is characterized by complete flow detachment at the upper surface. It is essential to highlight that, for inflatable wings, the stall itself may not result in an immediate collapse but has major effects on it.
Figure 6 shows the stall approximation at 9 m/s represented by a consistent decrease in the bottom surface differential pressures (S4, S5, and S6) combined with an increase in the upper surface differentials (S1–S3), resulting in a substantial increase in data scattering at the upper surface when detachment is complete.
This shows that, as AOA increases, the global pressure differential increases, and then there is lift and drag. This combined effect leads to a progressive decrease in speed to a point where inflation is jeopardized, and collapse is imminent. As represented in Figure 3 and Figure 4, when a full-stall condition is reached, the low-pressure vortex formed at the upper surface can sustain inflation, even if the flow is detached. The aerodynamic stall does not directly cause collapse. However, such a situation will abruptly increase drag, decelerating the wing down to a point where dynamic pressure is too low to sustain inflation. This observed time lag between stall and collapse can be explored to build collapse prevention systems.
Figure 6 show that throughout the operational range (0–15°), the upper-middle differential pressure (S2) shows an inflection point between 10° and 15° AOA, revealing a perceptible change on the pattern of pressure-differential variation with AOA. At the same time, pressure-differentials at the lower surface diminish consistently as the wing pitches up. The rapid decay in the upper-middle readings (S2) from 5° to 25° confirms previous findings [22,23,27], indicating that, for paragliders and parafoils, stall effects are triggered above nine degrees and are fully characterized above 13°. The full stall configuration can be identified by the jump on data scattering at 20° indicated by the coefficient of variation, however the relations between sensors S2 and S5 are useful parameters to identify stall approximation before it reaches dangerous levels of flow detachment.
The rate of variation of the upper-middle pressure and the difference between up and bottom middle readings are relevant aspects for the central portion of the cell. The first one reveals lift evolution and the second one reveals the pressure gradient at the middle of the profile. Setting a reference at the steady glide condition (V = 9m/s and AOA = 5°), it is possible to judge stall eminence by monitoring the climbing in upper-middle readings (S2/S2std) and the difference between upper-middle and bottom-middle readings. The first parameter reveals whether the characteristic of the flow has changed perceptibly, and the second parameter reveals how far from the inflation condition the system might be. Table 4 illustrates the use of these parameters.
Finally, the sharp variation of values on Table 4 demonstrates that stall approximation can be efficiently identified using these parameters, which opens the path to a stall alert and prevention system based on local pressure-differential monitoring.

3.4. Collapse Triggers and Shape Stability

Collapses are phenomena particularly important for inflatable wings. Naturally, there are several levels of wing collapse, starting from the perceptible loss of internal pressure, which might evolve into partial transient deflations, and then into a complete loss of the wing’s shape and stiffness. Three primary triggers might lead to collapse situations. One is a negative incidence resulting in an angle of attack below inflation. A second one is an excessive incidence resulting in a full stall. The third refers to the relative speed drops, which may be caused by maneuvering and atmospheric disturbances.
The effects directly linked to AOA limits were already explored in previous sections. However, there may be conditions where, even at an operational AOA, a general reduction on internal-external differential pressure results in a noticeable loss of wing’s stiffness. For instance, when a tailwind gust hits the wing, the relative speed is suddenly reduced with a perceived pressure loss. The lift reduction will cause the wing to accelerate regaining equilibrium. Notwithstanding, the reactions are not instantaneous and result in a period in which the low inner-outer differential pressure causes perceptible shape instability. The disturbance may be transient, but a high-speed drop may lead to stall or to an intense pendulum reaction that leads to an negative incidence. Then, it is interesting to evaluate the level of differential pressures captured by the sensors at different levels of flow speed tested. Table 5 presents the mean value obtained with the readings from the six sensors at 5° AOA for an unsustainably low speed (3 m/s), an inflation speed (6 m/s), and an operational speed (9 m/s):
Table 5 reveals that the level of pressure-differentials change perceptibly with speed, and the mean value can be used to characterize the level of available dynamic pressure. It should also be noticed that the general level of pressure-differential measured is directly related to the wing load, a factor traditionally used as a design parameter. None of these values correspond to the final wing load, which requires integration throughout the surface, but they are a fair indicative based on local evaluations. Considering that common paragliders and parafoils present wing-loads around 40 Pa [8], the collected data show that the average reading at operational speed (9 m/s) is substantially above this value, whereas, at inflation speed (6 m/s), the average differential pressure is much lower. Consequently, a calibrated system can dynamically monitor wing stiffness using the average differential pressure, and its time derivative sign, to provide an alert preventing further reductions in speed.

3.5. Pressure Coefficient (Cp) Distribution and Lift Estimation

One of the main objectives of the present work is to sustain the use of local pressure differential measurements to characterize inflatable wings instead of using classic approaches based on external pressure coefficients or global lift and drag coefficients. The use of geometry-based aerodynamic coefficients for wing design encounters relevant limitations even in cases where the wing is fully closed. For example, dealing with inflatable-wing drones for planetary exploration, as discussed in the work by Hassanalian et al. [44], the same issues originating from elastic deformation can be anticipated. For these situations the use of local differential pressure monitoring can, as well, represent a more suitable approach, since it provides information about the external pressure field and the wing stiffness simultaneously. However, Cp assessments can still be useful with the only purpose of comparing data obtained from previous experiments and numerical simulations, demonstrating that the pressure differential approach generates consistent results and, at the same time, provides important information about the internal flow, which is a major player for inflatable wings.
Previous studies show conflicting conclusions regarding the confined flow structure due to the method through which data was obtained. Some researchers claim that relevant flow occurs inside the cell [22,27], leading to significant effects on global lift and drag, whereas others [5,7] affirm that the encapsulated air is mostly stationary in the cell cavity, being slightly affected at low angles of attack. Data obtained from differential pressure readings indicated that the inner flow is a relevant phenomenon and proves that methods using absolute pressure are not the best option for characterizing dynamically inflatable wings.
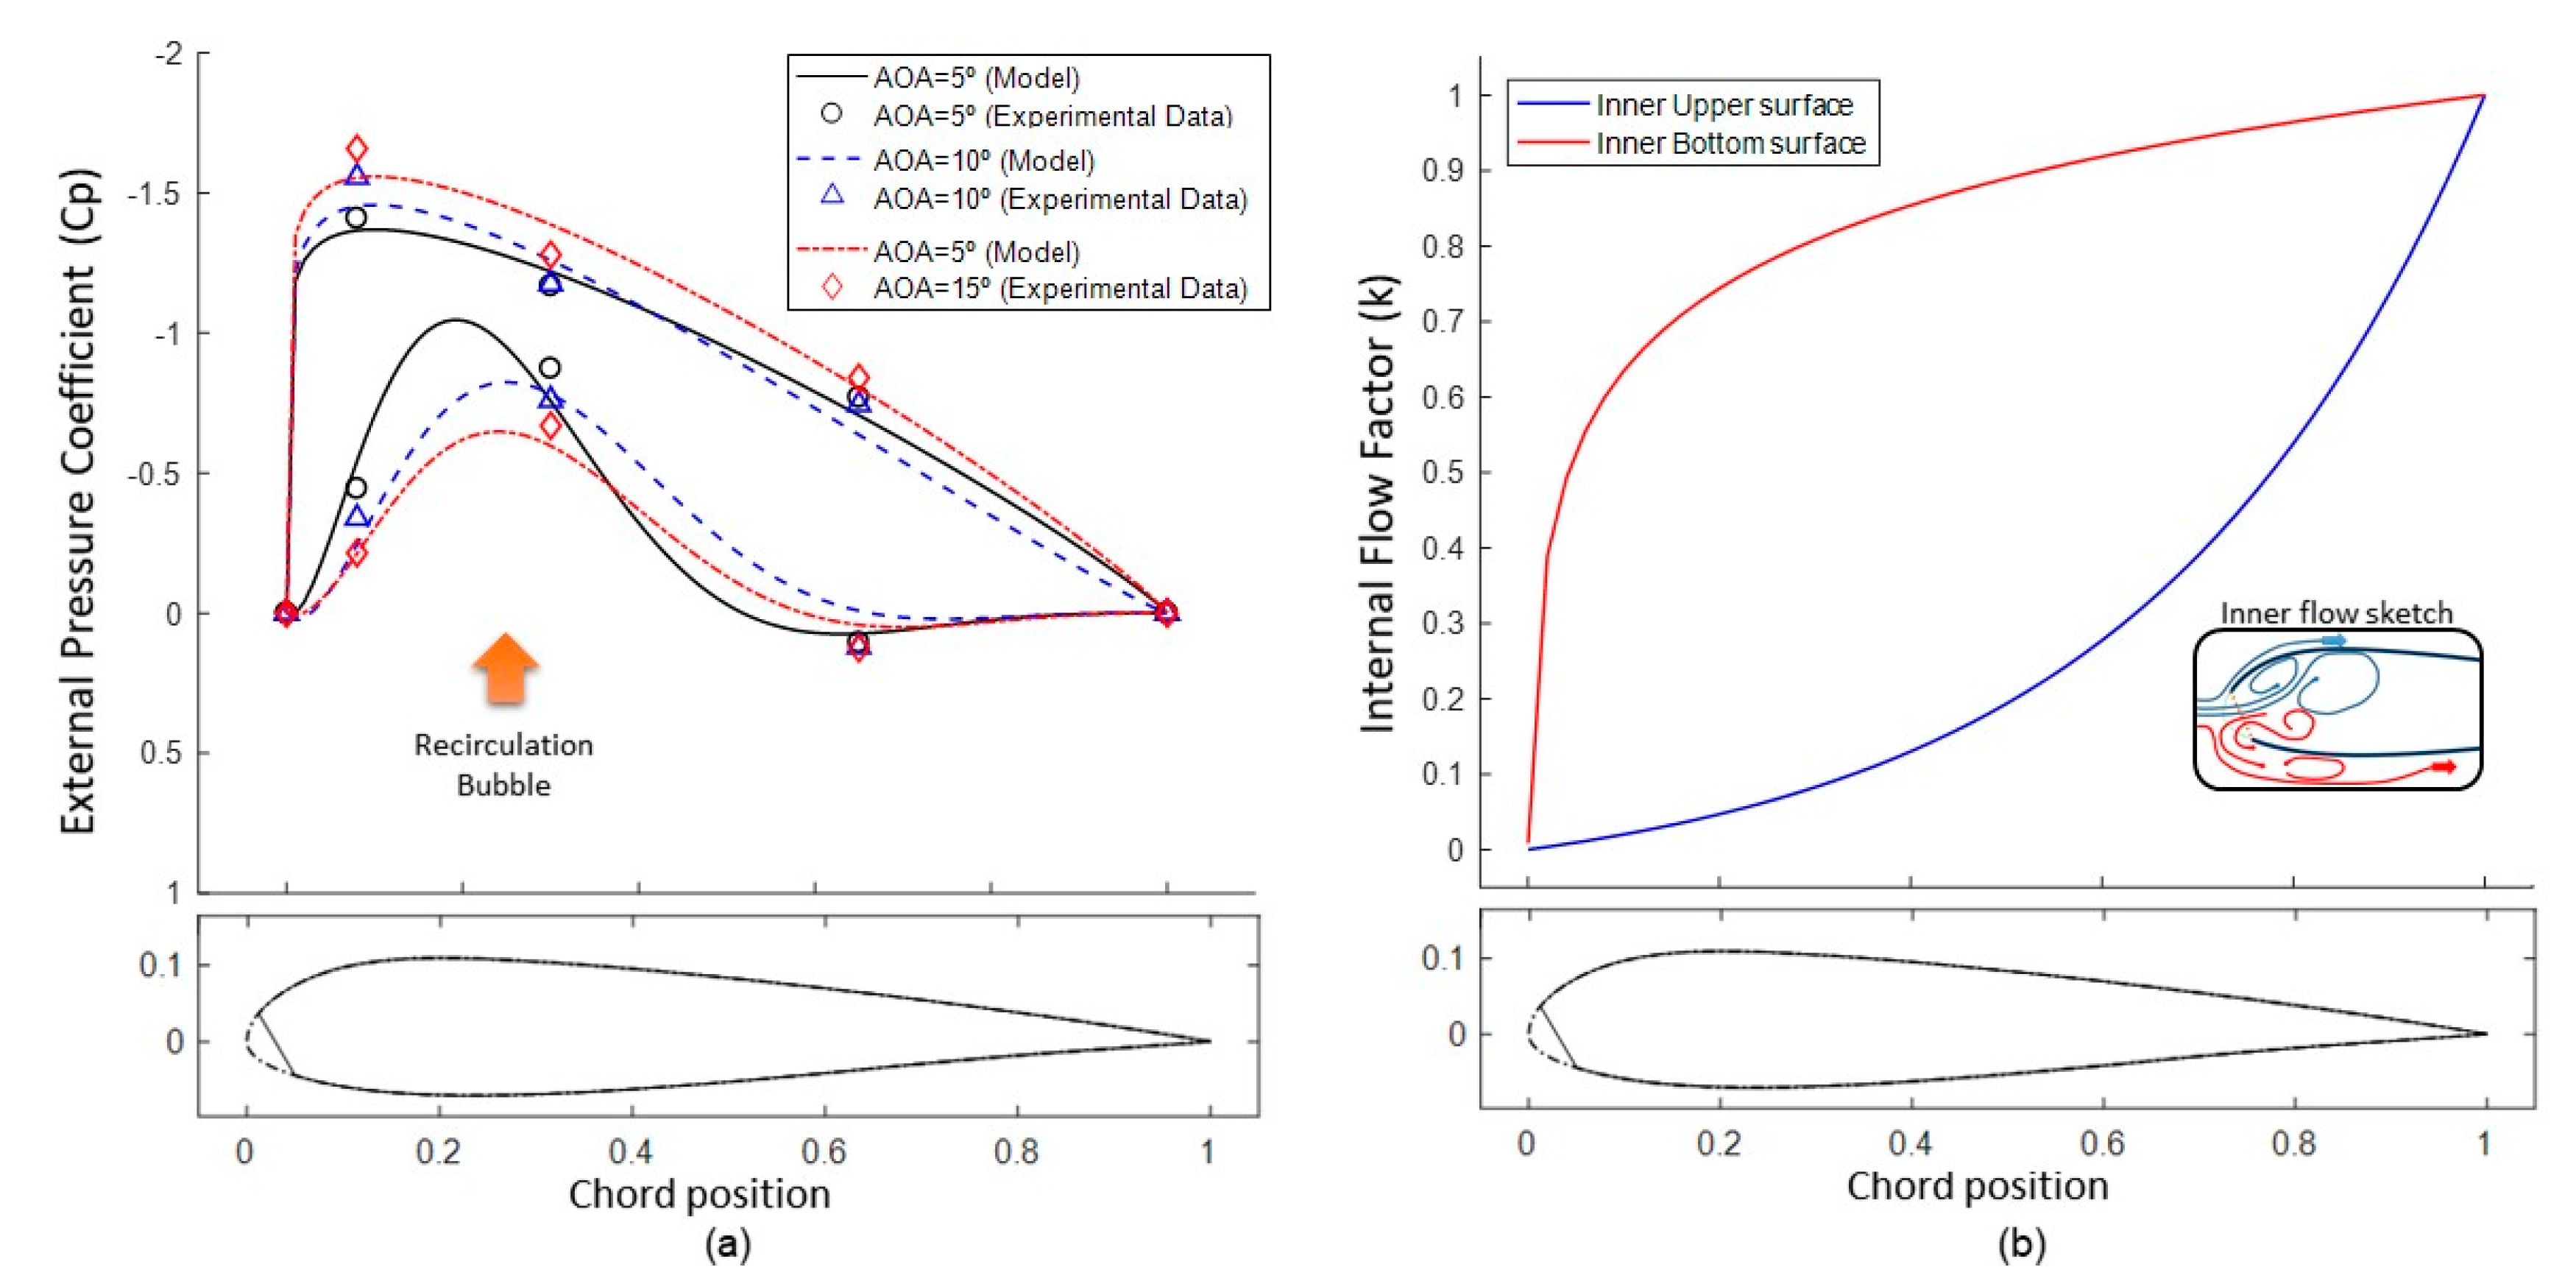
From basic aerodynamic theory, it is expected that the pressure at the upper surface should be consistently lower than the pressure at the bottom surface for positive AOA. If the inner pressure was constant and near the stagnation level, upper differential pressures should be considerably higher than the bottom differential pressures in the same region. However, as illustrated in Figure 3, the bottom-middle differential pressure was consistently higher for a considerable range of operational AOAs. Further, at a low AOA, the difference between the upper and bottom differential pressures at the middle diminished as AOA increased, which is a singular response. The logical explanation for such behavior comes from the internal pressure gradients. This means that the cell’s internal flow increases the pressure at the inner bottom surface more than it does at the inner upper surface, around the initial portions of the wing. The internal flow is highly dependent on the airfoil thickness, the air intake geometry and the airflow condition. Therefore, further experiments exploring these variables are needed to fully model the phenomenon. However, for the purpose of establishing the suitability of differential-pressure based analysis, a simplified approach is enough.
When the air intake is perfectly aligned with the incoming air, the inflation process is more productive through the ram effect. It is also important to realize that the recirculation bubble observed at the bottom leading edge is linked to the internal flow, thus affecting its extension and magnitude. At the virtual origin of the reference chord, the internal flow factor is almost null, since there is no airfoil surface and the incoming flow is nearly undisturbed. At the end of the cell, on the other hand, where the air was already contained, and the internal pressure gradients were dumped, the pressure approaches its stagnation value. As the flow passes the air intake, at positive AOA, the bottom flow is supposed to decelerate much faster than the upper flow, which may be even in acceleration when filling up the airfoil internal space. The expected result is a complementary behavior between upper and bottom inner pressure coefficients, which rise from zero to one following a different pattern. The bottom pressure rapidly increases, whereas the upper flow only starts a definitive pressure rise after passing the maximum thickness of the airfoil. Therefore, as a theoretical model, the following correlations are proposed for the internal flow factor, at the upper and bottom surfaces, respectively:
κ u = e x a 1 e 1 a 1 .
κ b = l n ( 1 + e b · x ) l n ( 1 + e b ) .
An accurate characterization of the internal flow can be achieved by designing additional experiments combining differential and absolute pressure readings. Such an approach is scientifically relevant but moves away from the objective of minimizing instrumentation to deliver a suitable on-board system. An alternative way of separating the effects of internal flow using only differential pressure is to rely on computational simulations, setting averaged parameters (a, b) for Equations (13) and (14). Considering airflow speed of 10 m/s and AOA varying from 5° to 15°, simulation data revealed that, where the thickness is maximum (x = 0.21), the inner bottom pressure coefficient should be near 80 ± 5%, and the upper-pressure coefficient should be around 10 ± 5%. It allowed for the defining of the theoretical curve for the internal flow factor (a = 0.35, b = 6.25), associated to the ASCENDER airfoil at 10 m/s and 5° < AOA < 15°.
For the external pressure coefficient, considering the baseline airfoil, a wide number of traditional methods are available providing the Cp distribution curve, which can also be averaged for a defined AOA range. Equations (15) and (16) present the mathematical modeling reflecting the Cp distribution observed on the same computational simulations:
C p u = γ u · x ( α u 1 ) · ( 1 x ) ( β u 1 ) ,
C p b = γ b · x ( α b 1 ) · ( 1 x ) ( β b 1 ) + δ b · e ( x p q ) ,
While Equations (15) and (16) define the type of curve representing the Cp distribution based on the characteristics observed computationally, the specific parameters were numerically adjusted to fit the model to the experimental data based on Equation (3). The results applying the suggested model are illustrated in Figure 7, and the specific values were obtained by adjusting the parameters to the experimental data, as presented in Table 6.
The distribution calculated using the proposed model to fit experimental data reveals an upper-surface Cp distribution pattern fully compatible with Cp distribution obtained theoretically for the same baseline airfoil. It also presents levels of Cp that are fully coherent with previous experimental results [5,7], as obtained by completely different methods.
The most distinct observation brought up by Figure 7 is the singularity present at the bottom surface resulting from the recirculation bubble at the bottom leading edge. This phenomenon, which was already observed following a completely independent rationale, presents itself as a major player that helps explain the significant reduction in lift and the increase in drag informed by several researches.
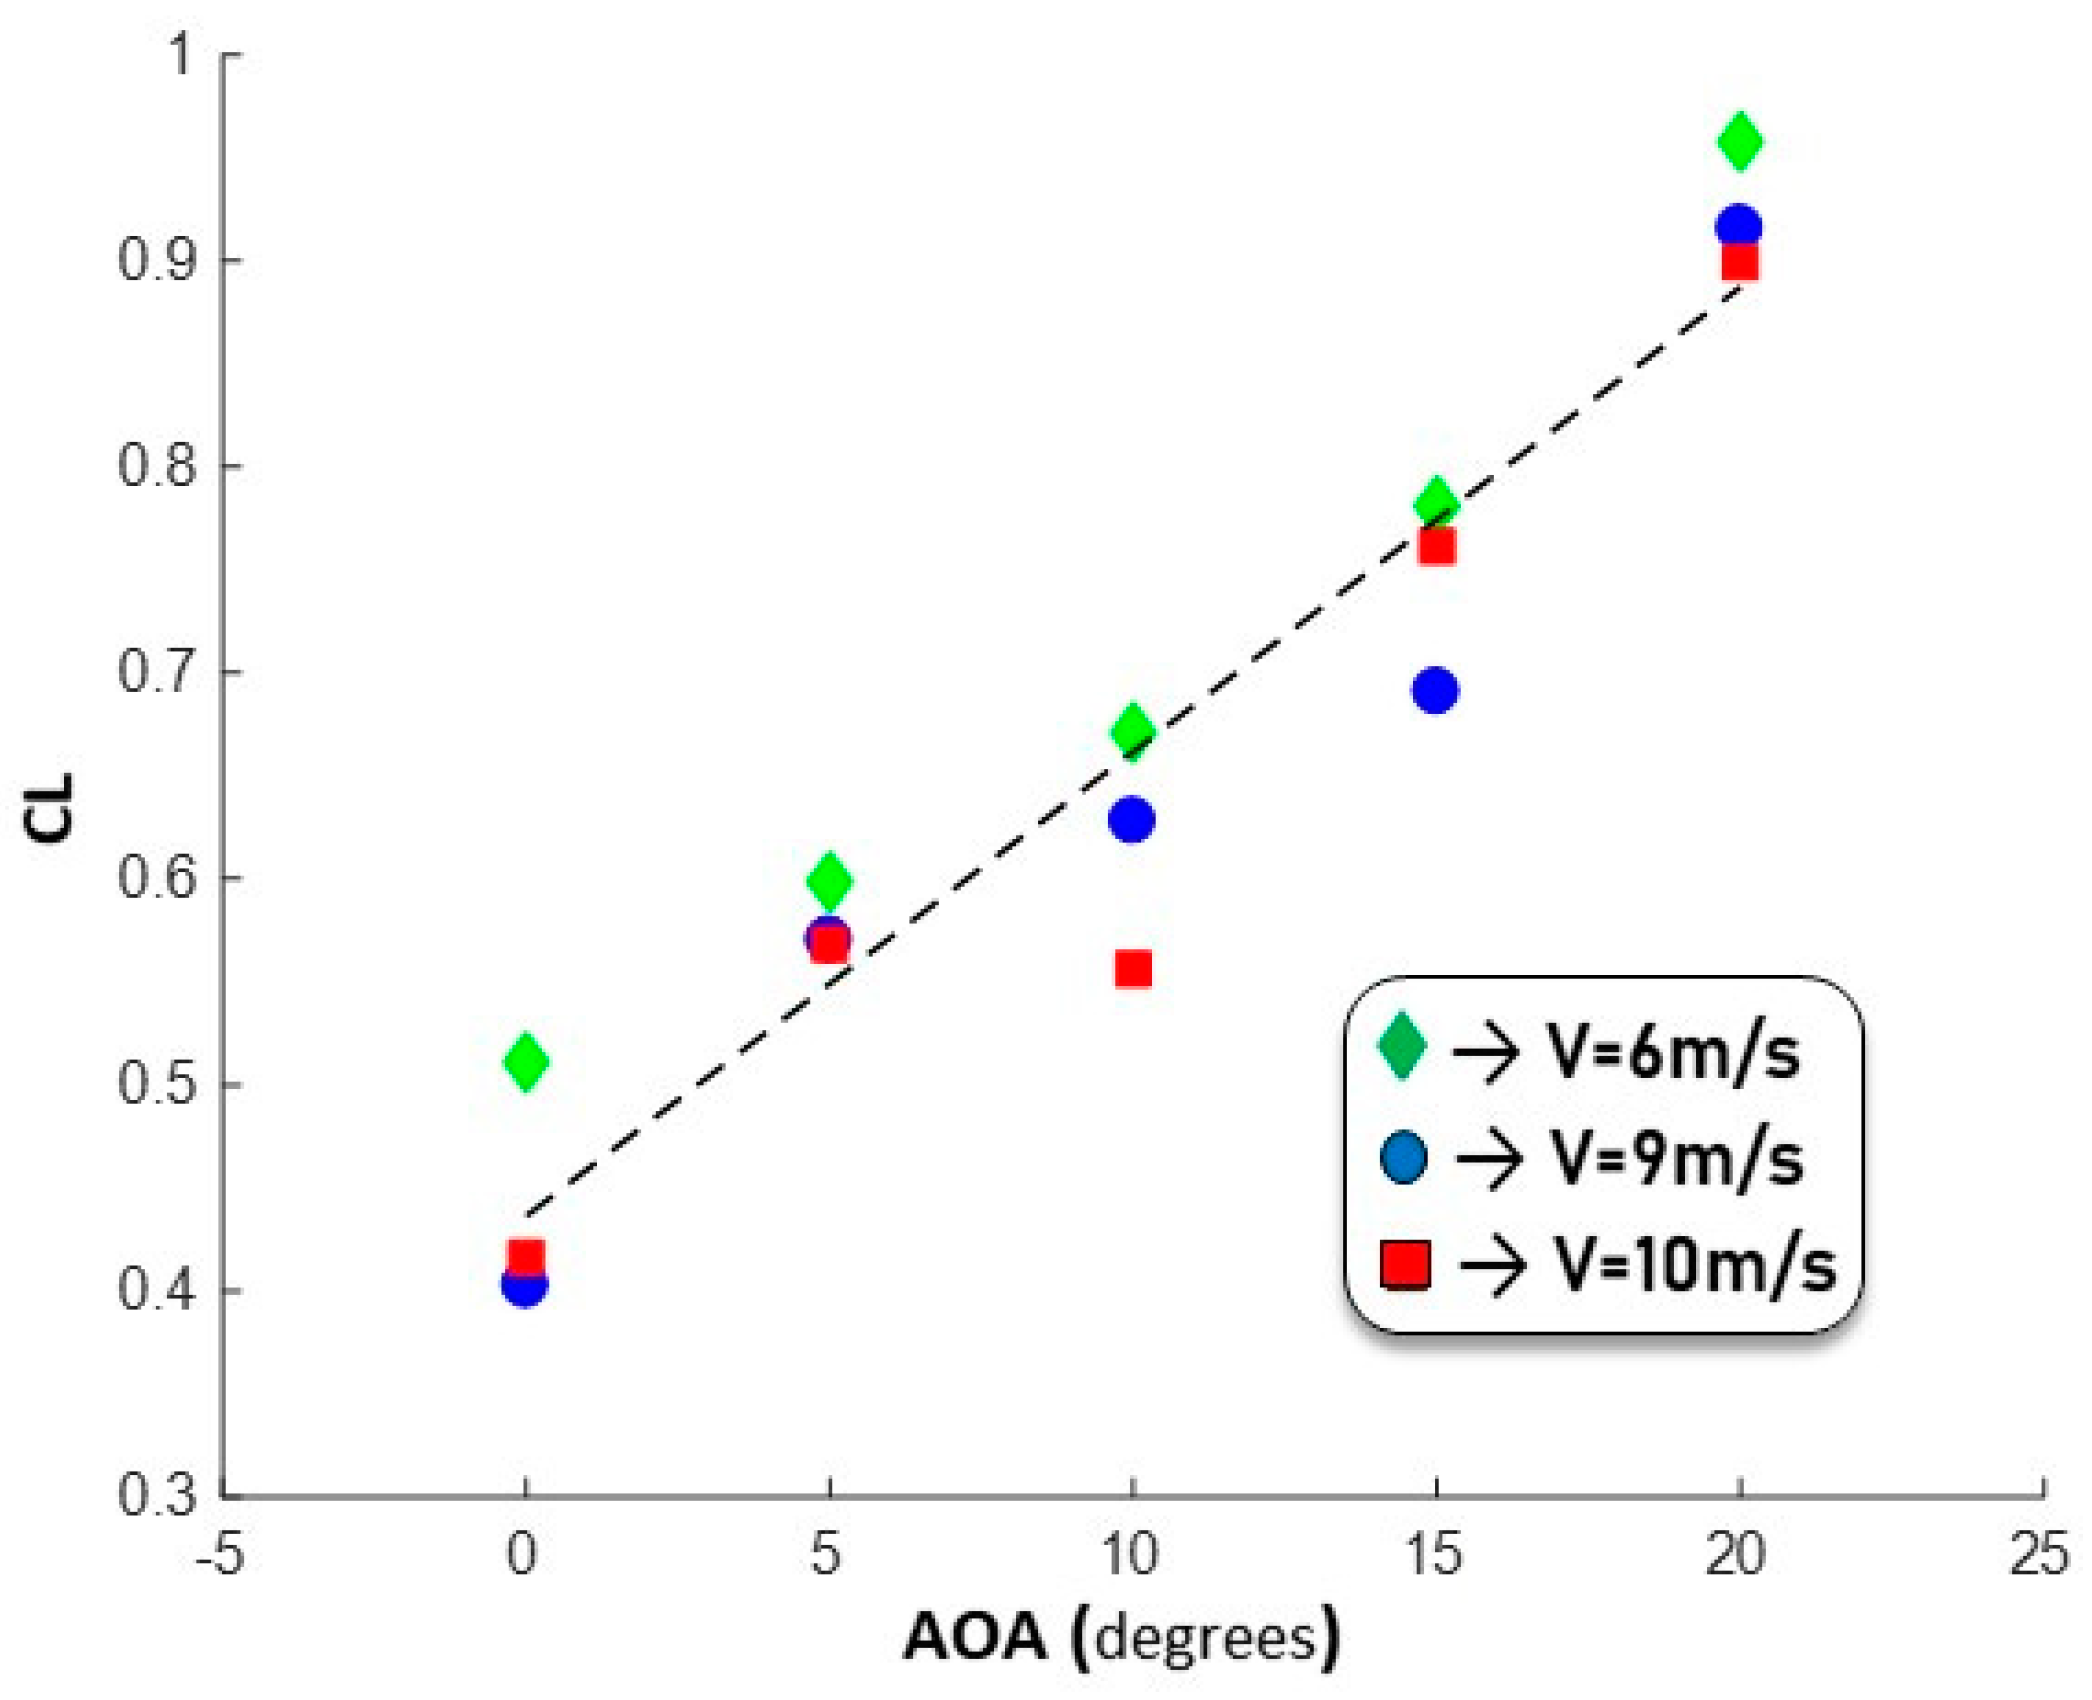
Combining the external Cp estimation and the airfoil geometry, it is possible to integrate lift coefficients for different AOA. Drag was not calculated, since the pressure coefficients would provide only a small component of the total drag, which is highly affected by parasites and induce drag. These two components require force measurement methods, which are out of scope of the present experiments. Nonetheless, the estimated CL is useful to characterize the wing and to corroborate the methodological adequacy.
The CL-Alpha curve plotted in Figure 8, presenting an average lift slope of 0.024 per degree, is fully compatible with the results obtained by previous researchers [27]. Further, the resulting wing load range from 30 Pa to 50 Pa corresponds precisely to the expected range previously calculated [8]. Therefore, parallel observations seem to lead to consistent results, reinforcing the usefulness of the differential pressure measurement approach, and the relevance of the inner flow.
It is never enough to emphasize that the external pressure coefficient, the internal flow factor, and the lift coefficient were derived in Section 3.5 to provide a classic representation of the observed characteristics, allowing useful reflections about the collected data. However, no theoretical model was used for analyzing the main characteristics in Section 3.1, Section 3.2, Section 3.3 and Section 3.4, but only the differential pressure data directly measured. Therefore, the potential uncertainties related to modeling pressure coefficients distribution profiles do not impair the main objective, which is demonstrating that a pressure-differential approach is more suitable for inflatable wing analysis and can be used to characterize the wing and to prevent undesirable in-flight conditions.

4. Conclusions

The development of a flight-test instrumentation system for the outer–inner differential pressure measurements at the upper and lower surfaces of dynamically inflatable wings was developed and tested. Data were gathered from a wind-tunnel test campaign and allowed us to describe aerodynamic phenomena, including inflation and stall approximation, using direct measurements of local pressure differentials. Data analysis confirmed the previous findings regarding the existence of a minimum AOA for inflation and the appearance of a recirculation bubble at the bottom leading edge that considerably affects airfoil performance. The existence of significant internal flow was confirmed in the first half of the cell. A theoretical model for pressure coefficient distribution along open-airfoils was proposed based on estimations of the confined airflow structure. Calculated wing lift forces and loads were compatible with practical observations. Airfoil shape stability and boundary layer disturbances were also evaluated, anticipating the instrumentation’s suitability for in-flight applications. Wind-tunnel results are fully representative of stable in-flight conditions, and the instrumentation performance assures the capacity to identify in-flight dynamic reactions originating from dynamic loads. On the whole, the instrumentation may be applied straightforwardly to tests on actual inflatable wings, and further advances may convert it into a collapse alert and prevention tool. The combined use of the proposed instrumentation with computational and wind-tunnel data may improve the parafoil and paragliders’ design techniques. Future work will be carried out on a real manned paraglider to characterize the differential pressure variations during typical maneuvers and under collapse.

Author Contributions

Conceptualization, D.M.B.; methodology, D.M.B. and C.A.G.V.; validation, C.A.G.V.; formal analysis, D.M.B. and C.A.G.V.; writing—original draft preparation, D.M.B.; writing—review and editing, C.A.G.V.; supervision, C.A.G.V.; project administration, D.M.B. Both authors are responsible for the entire research and have read and agreed to the published version of the manuscript.

Funding

This research received no external funding.

Acknowledgments

The authors would like to thank the Brazilian Research Agency—CAPES.

Conflicts of Interest

The authors declare no conflict of interest.

References

  1. Lingard, J.S. Precision Aerial Delivery System—Ram-Air Parachute Design. In Proceedings of the 13th AIAA Aerodynamic Decelerator Systems Technology Conference, Clearwater Beach, FL, USA, 15–18 May 1995. [Google Scholar]
  2. Puskas, E. Ram-Air Parachute Design Considerations and Applications. In Proceedings of the 8th Aerodynamic Decelerator and Balloon Technology Conference, Hyannis, MA, USA, 2–4 April 1984; pp. 255–259. [Google Scholar] [CrossRef]
  3. Dunker, S. Ram-air Wing Design Considerations for Airborne Wind Energy. Airborne Wind Energy 2013, 517–546. [Google Scholar] [CrossRef]
  4. Dek, C.; Overkamp, J.L.; Toetert, A.; Hoppenbrouwer, T.; Slimmens, J.; van Zijl, J.; Rossi, P.A.; Machado, R.; Hereijgers, S.; Kilic, V.; et al. A recovery system for the key components of the first stage of a heavy launch vehicle. Aerosp. Sci. Technol. 2020, 100, 105778. [Google Scholar] [CrossRef]
  5. Mashud, M.; Umemura, A. Improvement in Aerodynamic Characteristics of a Paraglider Wing Canopy. Trans. Jpn. Soc. Aeronaut. Space Sci. 2006, 49, 154–161. [Google Scholar] [CrossRef] [Green Version]
  6. Fogell, N.A.T. Fluid-Structure Interaction Simulations of the Inflated Shape of Ram-Air Parachutes. Ph.D. Thesis, Imperial College London, London, UK, 2014. [Google Scholar] [CrossRef]
  7. Mashud, M.; Umemura, A. Experimental Investigation on Aerodynamic Characteristics of a Paraglider Wing. Trans. Jpn. Soc. Aeronaut. Space Sci. 2006, 49, 9–17. [Google Scholar] [CrossRef] [Green Version]
  8. Benedetti, D.M.; Pinto, R.F.; Ferreira, R. Paragliders Stability Characteristics; SAE Technical Paper 2013-36-0355; SAE: Warrendale, PA, USA, 2013; Available online: https://saemobilus.sae.org/content/2013-36-0355/ (accessed on 13 December 2017). [CrossRef]
  9. Wachlin, J.; Ward, M.; Costello, M. In-canopy sensors for state estimation of precision guided airdrop systems. Aerosp. Sci. Technol. 2019, 90, 357–367. [Google Scholar] [CrossRef]
  10. Burdette, S.; Costello, M.; Scheuermann, E. Using an Array of In-Canopy Sensors for Guided Airdrop System State Estimation. In Proceedings of the 24th AIAA Aerodynamic Decelerator Systems Technology Conference, Denver, CO, USA, 5–9 June 2017. [Google Scholar] [CrossRef]
  11. Ghoreyshia, M.; Bergeronb, K.; Jiráseka, A.; Seidela, J.; Lofthousea, A.J.; Cummingsa, R.M. Computational aerodynamic modeling for flight dynamics simulation of ram-air parachutes. Aerosp. Sci. Technol. 2016, 54, 286–301. [Google Scholar] [CrossRef] [Green Version]
  12. Gorman, C.M.; Slegers, N. Evaluation of Multibody Parafoil Dynamics Using Distributed Miniature Wireless Sensors. J. Aircr. 2011, 49. [Google Scholar] [CrossRef]
  13. Tanaka, K.; Tanaka, M.; Takahashi, Y.; Wang, H.O. Waypoint Following Control Design for a Paraglider Model with Aerodynamic Uncertainty. IEEE/ASME Trans. Mechatron. 2018, 23. [Google Scholar] [CrossRef]
  14. Zhang, Z.; Zhao, Z.; Fu, Y. Dynamics analysis and simulation of six DOF parafoil system. Clust. Comput. 2019, 22, 1–12. [Google Scholar] [CrossRef]
  15. Tan, P.; Sun, M.; Sun, Q.; Chen, Z. Dynamic Modeling and Experimental Verification of Powered Parafoil with Two Suspending Points. IEEE Access 2020, 8, 12955–12966. [Google Scholar] [CrossRef]
  16. Belloc, H.; Chapin, V.; Manara, F.; Sgarbossa, F.; Forsting, A.M. Influence of the air inlet configuration on the performances of a paraglider open airfoil. International Journal of Aerodynamics. Indersci. Publ. 2016, 5, 83–104. [Google Scholar] [CrossRef] [Green Version]
  17. Tao, J.; Sun, Q.; Liang, W.; Chen, Z.; He, Y.; Dehmer, M. Computational fluid dynamics based dynamic modeling of parafoil system. Appl. Math. Model. 2018, 54, 136–150. [Google Scholar] [CrossRef]
  18. Takizawa, K.; Tezduyar, T.E.; Terahara, T. Ram-air parachute structural and fluid mechanics computations with the Space–Time Isogeometric Analysis (ST-IGA). Comput. Fluids 2016, 141, 191–200. [Google Scholar] [CrossRef]
  19. Burk, S.M.; Ware, G.M. Static Aerodynamic Characteristics of Three Ram-Air-Inflated Low-Aspect-Ratio Fabric Wings; Technical Report NASA TN D-4182; NASA Langley: Hampton, VA, USA, 1967.
  20. Abdelqodus, A.A.; Kursakov, I.A. Optimal Aerodynamic Shape Optimization of a Paraglider Airfoil Based on the Sharknose Concept. MATEC Web Conf. 2018, 221, 05002. [Google Scholar] [CrossRef]
  21. Kulhánek, R. Identification of a degradation of aerodynamic characteristics of a paraglider due to its flexibility from flight test. Aircr. Eng. Aerosp. Technol. 2019, 91, 873–879. [Google Scholar] [CrossRef]
  22. Becker, S.; Paul, B. Experimental Study of Paraglider Aerodynamics. Master’s Thesis, Imperial College London, London, UK, 2017. [Google Scholar] [CrossRef]
  23. Mashud, M.; Umemura, A. Three-Dimensional Measurements of Aerodynamic Characteristics of Paraglider Canopy Cells. Trans. Jpn. Soc. Aeronaut. Space Sci. 2006, 49, 146–153. [Google Scholar] [CrossRef] [Green Version]
  24. Keitaro, Y.; Akira, U.; Manabu, H. Experimental Study on the Wing Formation of a Paraglider Canopy Cell (Inflatable Wing). J. Jpn. Soc. Aeronaut. Space Sci. 2005, 53, 68–74. [Google Scholar] [CrossRef]
  25. Uddin, M.; Mashud, M. Wind Tunnel Test of a Paraglider (flexible) Wing Canopy. Int. J. Mech. Mechatron. Eng. IJMME-IJENS 2010, 10, 7–13. [Google Scholar]
  26. Coleman, J.; Ahmad, H.; Toal, D. Development and Testing of a Control System for the Automatic Flight of Tethered Parafoils. J. Field Robot. 2016, 1–20. [Google Scholar] [CrossRef]
  27. Mohammadi, M.A.; Johari, H. Computation of Flow over a High Performance Parafoil. In Proceedings of the 20th AIAA Aerodynamic Decelerator Systems Technology Conference and Seminar, Seattle, WA, USA, 4–7 May 2009. [Google Scholar] [CrossRef]
  28. Traub, L.; Coffman, C. Efficient Low-Reynolds-Number Airfoils. J. Aircr. 2019, 56, 1–17. [Google Scholar] [CrossRef]
  29. Genç, M.; Karasu, L.; Hakan, H.; Akpolat, T. Low Reynolds Number Aerodynamics and Transition; Intech: Rijeka, Croatia, 2012. [Google Scholar] [CrossRef] [Green Version]
  30. King, R.M.; Chokani, N.; Mangalam, S.M. Control of Laminar Separated Bubbles Using an Adaptive Mechanical Turbulator. In Proceedings of the 40th AIAA Aerospace Sciences Meeting and Exhibit, Reno, NV, USA, 14–17 January 2002. [Google Scholar] [CrossRef]
  31. Cochrane, C.; Lewandowski, M.; Koncar, V. A Flexible Strain Sensor Based on a Conductive Polymer Composite for in situ Measurement of Parachute Canopy Deformation. Sensors 2010, 10, 8291. [Google Scholar] [CrossRef] [PubMed] [Green Version]
  32. Burns, D.W.; Burns, D.B. Compact, Lightweight Pressure Sensors for Aerodynamic Parachute Measurements. In Proceedings of the 19th AIAA Aerodynamic Decelerator Systems Technology Conference and Seminar, Williamsburg, VA, USA, 21–24 May 2007. [Google Scholar] [CrossRef] [Green Version]
  33. McCarty, M. The Measurement of the Pressure Distribution over the Wing of an Aircraft in Flight; Australian Defence Force Academy: Campbell, Austrália, 2008.
  34. Song, P.; Ma, Z.; Ma, J.; Yang, L.; Wei, J.; Zhao, Y.; Zhang, M.; Yang, F.; Wang, X. Recent Progress of Miniature MEMS Pressure Sensors. Micromachines 2020, 11, 56. [Google Scholar] [CrossRef] [PubMed] [Green Version]
  35. Casellas, P.H. Paraglider Design Handbook—Chapter 2—Airfoils. Available online: http://www.laboratoridenvol.com/paragliderdesign/airfoils.html#5 (accessed on 20 April 2020).
  36. Zovatto, L.; Pedrizzetti, G. Flow about a circular cylinder between parallel walls. J. Fluid Mech. 2001, 440, 1–25. [Google Scholar] [CrossRef]
  37. Sensirion®. Datasheet SDP3x-Digital, Version 1. Available online: https://www.sensirion.com/fileadmin/user_upload/customers/sensirion/Dokumente/8_Differential_Pressure/Datasheets/Sensirion_Differential_Pressure_Sensors_SDP3x_Digital_Datasheet.pdf (accessed on 13 December 2017).
  38. Macias, M.M. Estudo Experimental em Túnel de Vento de Turbinas de Eixo Horizontal. Master’s Thesis, Departamento de Engenharia Mecânica, Universidade de Brasília, Brasília, DF, Brazil. Publicação ENM.DM-230 A/2016. Available online: http://repositorio.unb.br/handle/10482/22013 (accessed on 13 December 2017).
  39. Chang-Koon, C.; Kwon, D.K. Wind tunnel blockage effects on aerodynamic behavior of bluff body. Wind Struct. Int. J. 1998, 1, 351–364. [Google Scholar] [CrossRef]
  40. Lu, K.; Accorsi, M.; Leonard, J. Finite element analysis of membrane wrinkling. Int. J. Numer. Methods Eng. 2001, 50, 1017–1038. [Google Scholar] [CrossRef]
  41. Milosevic, V.; Marković, B.; Stojić, D. Effects of point loads on membrane structures. Građevinar 2018, 70, 1033–1041. [Google Scholar] [CrossRef] [Green Version]
  42. Ibrahim, A.; Ryu, Y.; Saidpour, M. Stress Analysis of Thin-Walled Pressure Vessels. Mod. Mech. Eng. 2015, 5, 1–9. [Google Scholar] [CrossRef] [Green Version]
  43. Ferreira, G.F.L. Um Cálculo da Espessura da Camada Limite. Rev. Bras. Ensino Fís. 2002, 24. [Google Scholar] [CrossRef]
  44. Hassanalian, M.; Rice, D.; Abdelkefi, A. Evolution of space drones for planetary exploration: A review. Prog. Aerospace Sci. 2018, 97, 61–105. [Google Scholar] [CrossRef]
Figure 1. (a) Sensors’ strip scheme; (b) sensor module with case; (c) test bench skeleton; (d) assembled prototype; (e) wind-tunnel.
Aerospace 08 00034 g001
Figure 2. The simplified mechanism for sensor’s weight balance.
Aerospace 08 00034 g002
Figure 3. Differential pressures and coefficient of variation against AOA for an air speed of 9 m/s.
Aerospace 08 00034 g003
Figure 4. Dynamic AOA excursions at an air speed of 10 m/s.
Aerospace 08 00034 g004
Figure 5. Cell inflation dynamics.
Aerospace 08 00034 g005
Figure 6. Inflatable wing stall dynamics.
Aerospace 08 00034 g006
Figure 7. (a) External Pressure Coefficients for V = 10 m/s and 5° ≤ AOA ≤ 15°; (b) Internal Flow Factor for V = 10 m/s and 5° ≤ AOA ≤ 15°.
Aerospace 08 00034 g007
Figure 8. Inflatable wing lift Curve (CL-Alpha) as a function of the angle of attack.
Aerospace 08 00034 g008
Table 1. Main characteristics differentiating rigid and inflatable wings.
R i g i d   F i x e d W i n g D y n a m i c a l l y   I n f l a t a b l e   W i n g
Structural AspectsRigid materials provide enough stiffness for all expected in-flight conditions by design.The inflatable nature makes folding and wing collapse a constant risk imposing additional in-flight limits
AerodynamicsAirflow characteristics are fully defined by geometry, airspeed and incidence.Airflow is substantially affected by the air intake, the internal flow, and in-flight elastic deformations.
Flight DynamicsSix degree-of-freedom models are normally enough to fully describe wing’s motion.Relative motion between the wing and center of gravity in pendular systems adds complexity to the model.
PerformanceThe wide range of optimized airfoils allows reaching excellent levels of performance.The presence of an air intake and the dynamic shape deformation imposes severe performance penalties.
Design and Optimization ToolsThe rigid structure makes easy the use of conventional flight-test equipment and standard computational models.The inflatable-flexible nature imposes severe restrictions to instrumentation and demands considering internal flow in computational models.
Modelling ComplexityShape stability allows using geometric-based aerodynamic coefficients for modelling the wing.Elastic deformations and extreme flexibility limit the use of conventional aerodynamics approaches.
Table 2. Relative pressure differential readings at 9 m/s and angle of attack between 0° and 15°.
AOA ( S 1 S 3 1 ) % ( S 2 S 3 1 ) % ( S 4 S 6 1 ) % ( S 5 S 6 1 ) %
12.56.4120.8103.5
28.711.430.4102.2
10°43.913.517.793.1
15°43.214.03.982.7
Table 3. Pressure differential readings at 6 m/s and an angle of attack between −10° and 10°.
AOAS1 [Pa]S4 [Pa]S1 – S4 [Pa]
−10°20.640.8−20.2
−5°25.341.6−16.3
26.030.4−4.5
30.819.611.2
10°33.618.914.7
Table 4. Stall monitoring parameters at 9 m/s and an angle of attack between 5° and 25°.
AOA ( S 2 S * 2 s t d 1 ) % ( S 2 S 5 S * 2 s t d S ** 5 s t d ) % C V   ( S 1 ) %
01000.5
10°−2.7700.7
15°0.8201.4
20°10.4−506.4
25°21.7−1206.2
* S2std (V = 9m/s; AOA = 5°) = 62.2 Pa; ** S5std (V = 9m/s; AOA = 5°) = 82.3 Pa.
Table 5. Pressure-differential readings at 5° AOA for different speeds.
V   [ m / s ]   S 1   [ P a ] S 2   [ P a ] S 3   [ P a ] S 4   [ P a ] S 5   [ P a ] S 6   [ P a ] 1 6 S   [ P a ]
38.66.05.64.97.34.06.1
630.823.722.019.630.915.523.8
971.862.255.853.182.340.761.0
Table 6. Pressure coefficients’ model parameters for the ASCENDER airfoil at 10 m/s and an angle of attack between 5° and 15°.
AOA γ u α u β u γ b α b β b δ b p q
1.101.90−1.892.04.004.002.707.80−102.63
10°1.122.12−2.182.04.004.092.756.25−64.37
15°1.101.90−2.162.13.572.932.856.55−61.02
Publisher’s Note: MDPI stays neutral with regard to jurisdictional claims in published maps and institutional affiliations.

