
Spillage-Adaptive Fixed-Geometry Bump Inlet of Wide Speed Range


Abstract
:1. Introduction
2. Analysis and the Candidate Solution for Inlet Start Issues
2.1. SES Effects Caused by Overlarge Lateral Compression
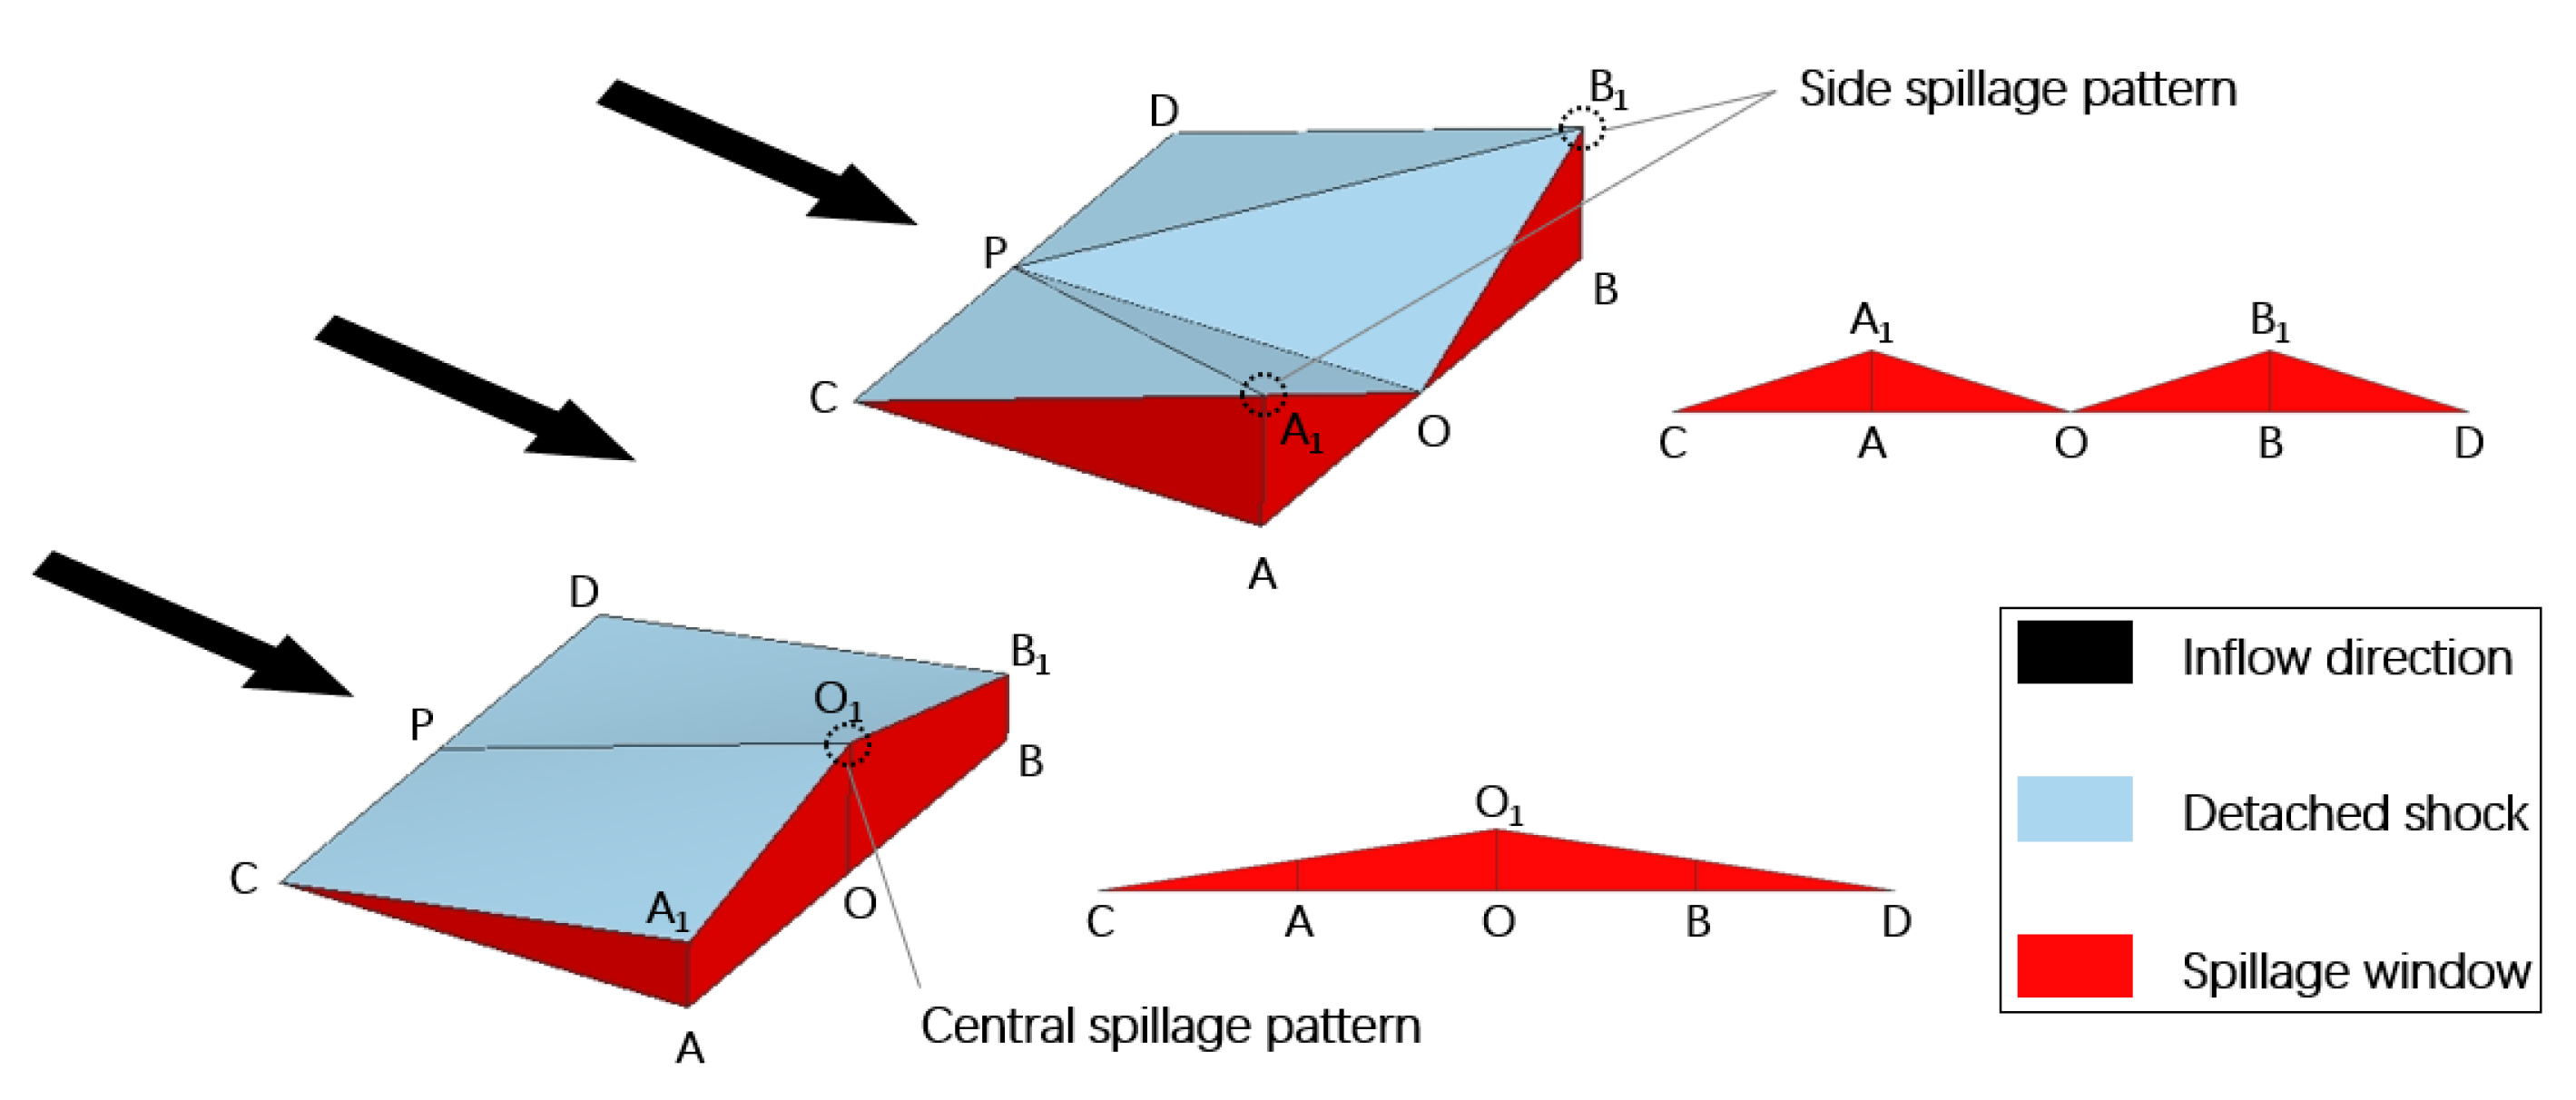
2.2. Modular Assessment Approach for the Spillage Pattern Analysis
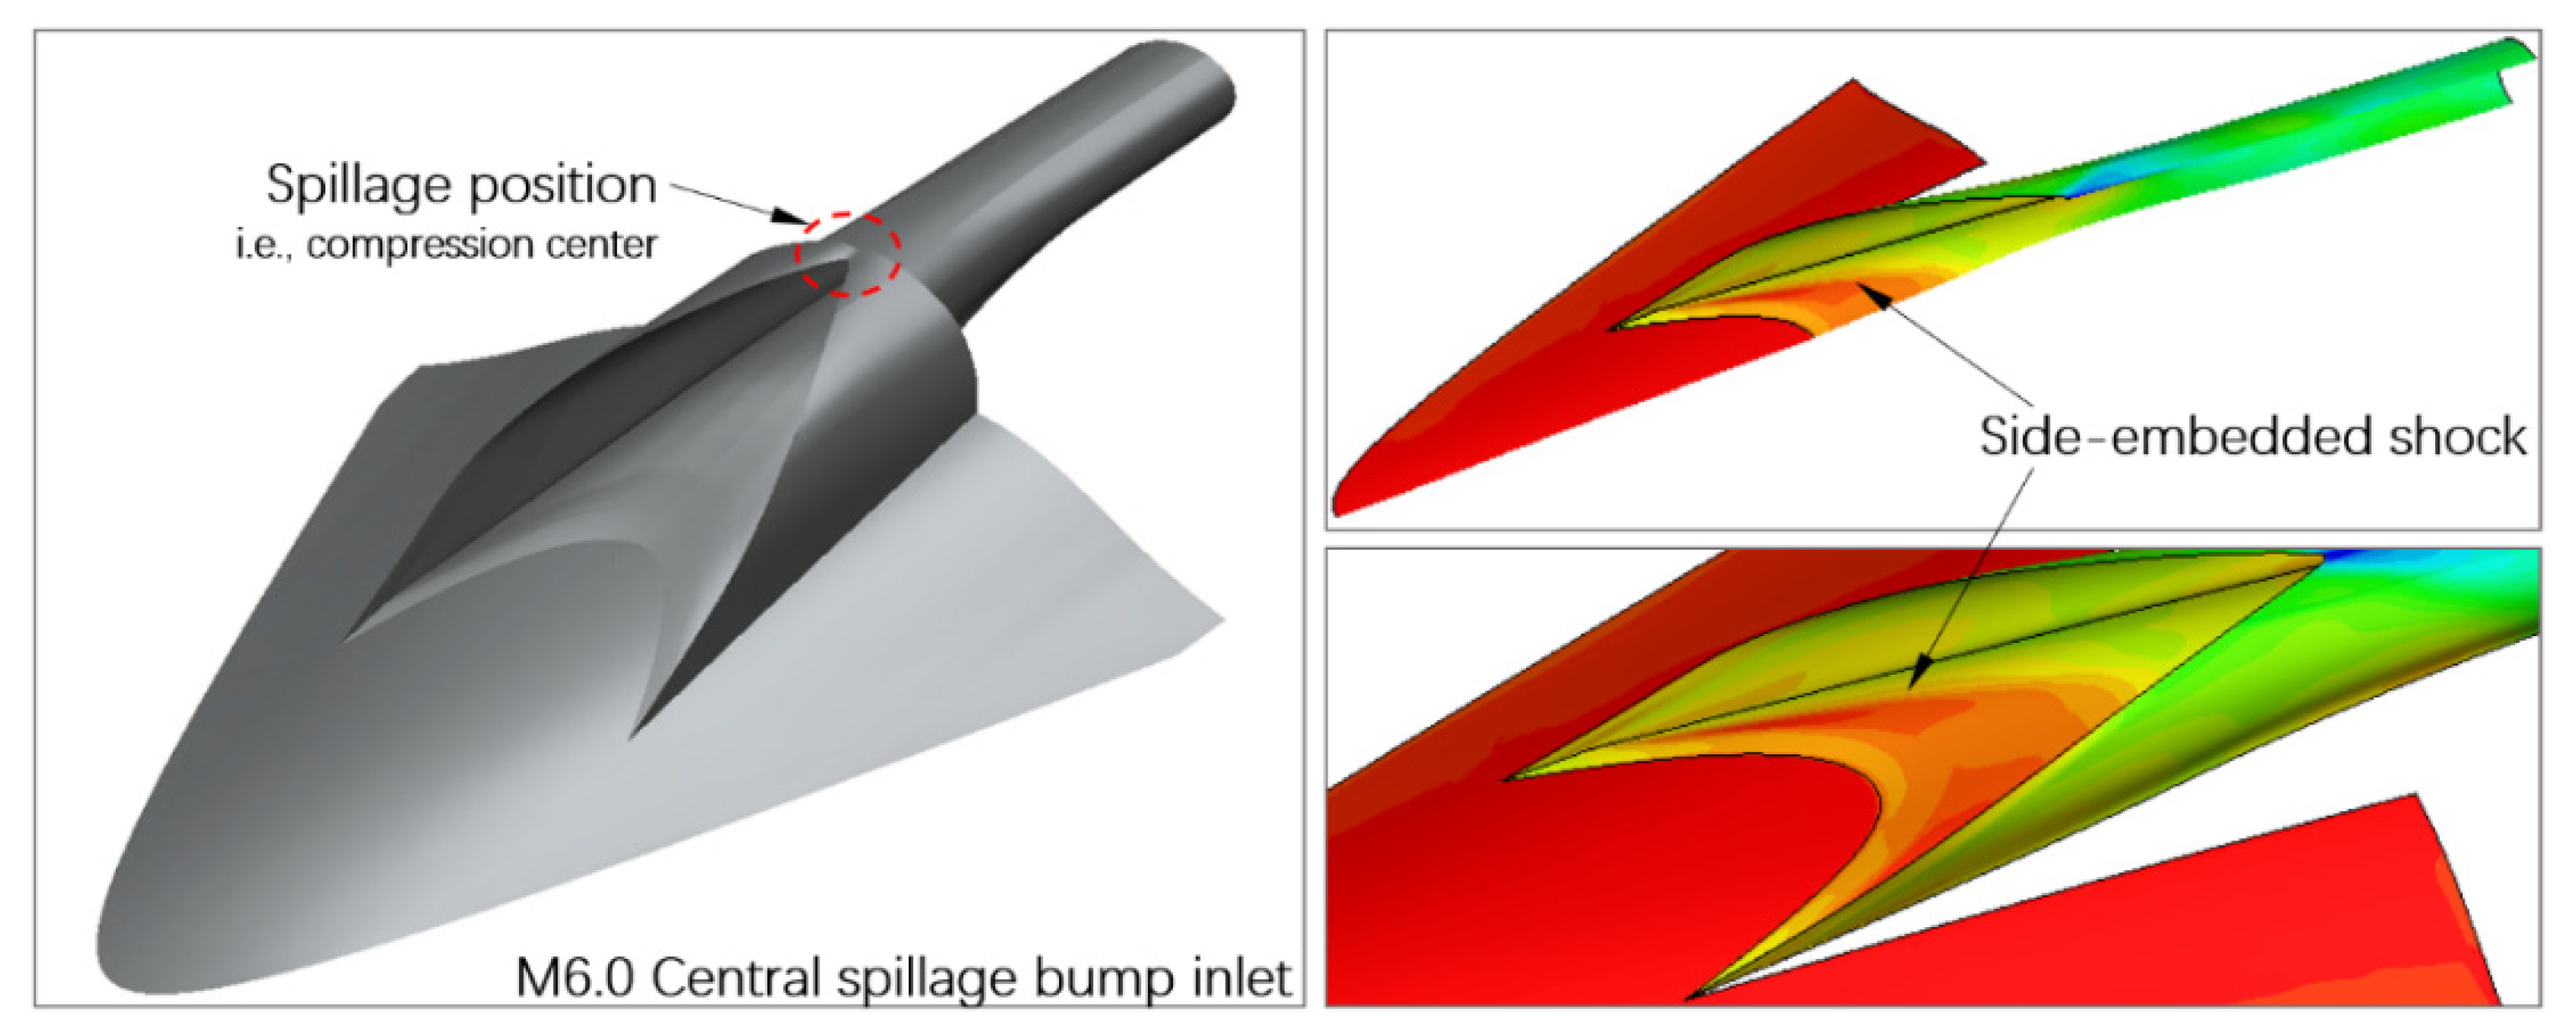
2.3. Novel Spillage-Adaptive Integration Pattern
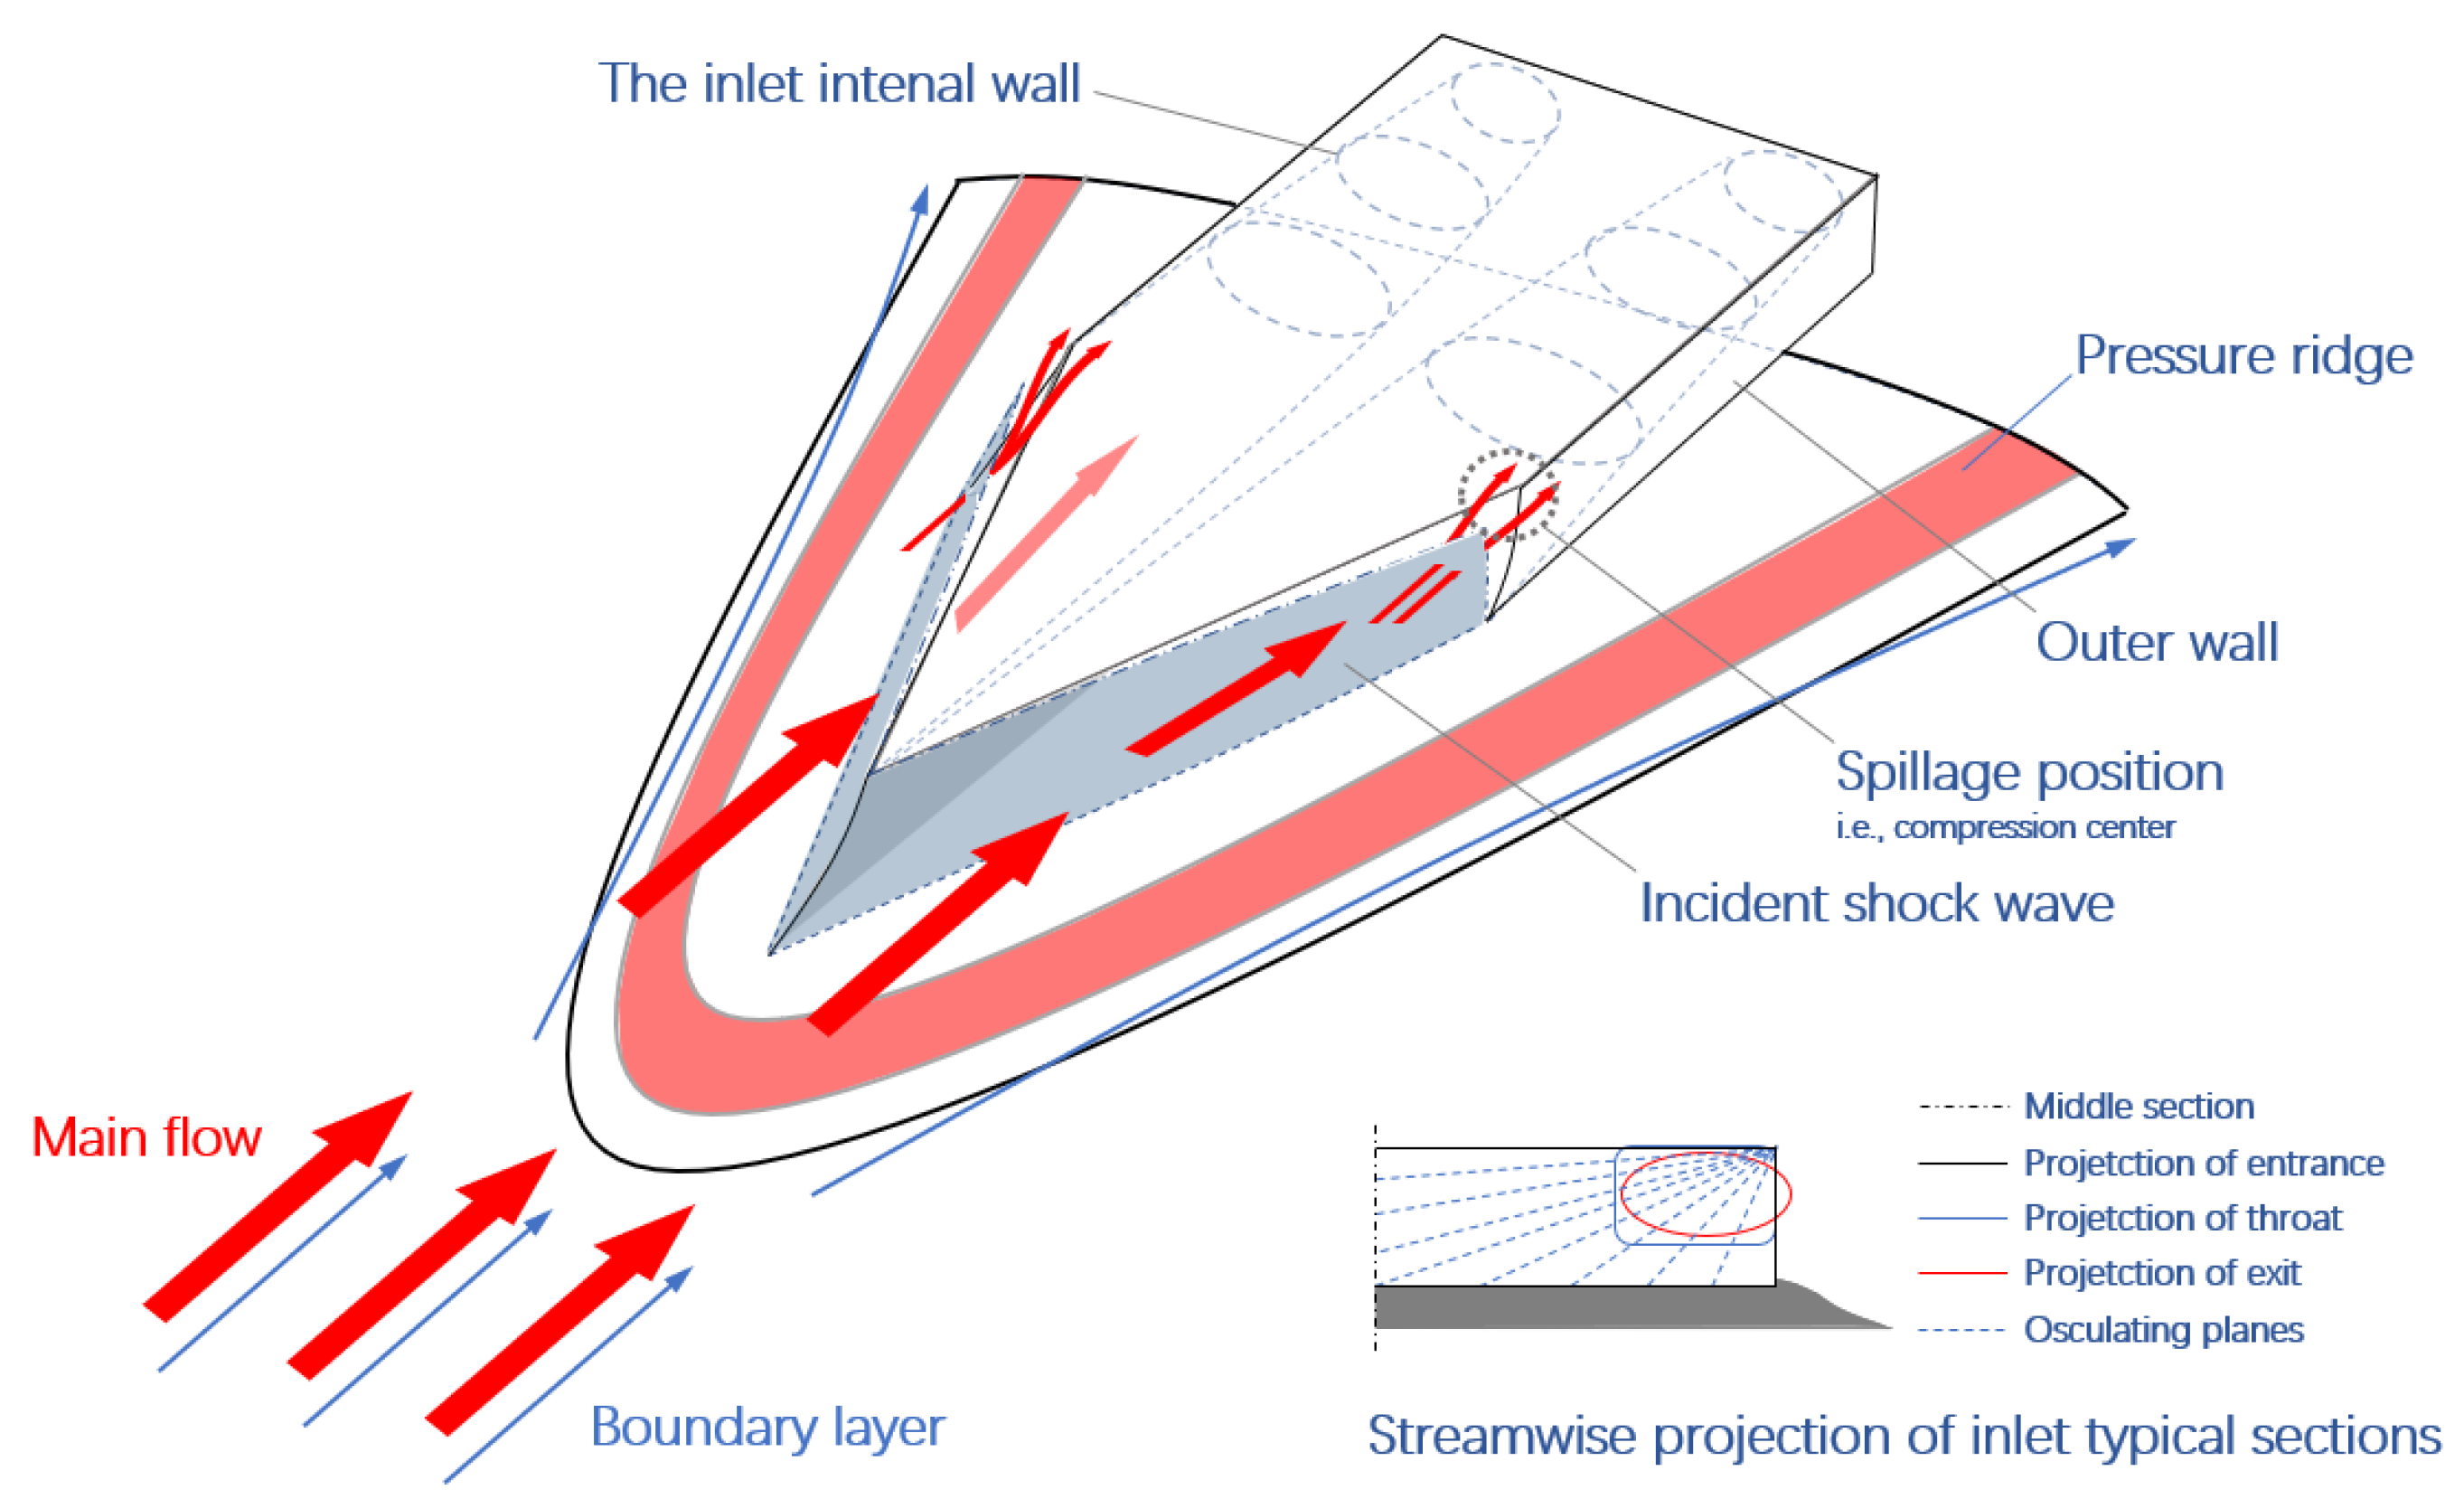
3. Integrated Design of the Spillage-Adaptive Bump Inlet
4. Aerodynamic Characteristics of the New Bump Inlet
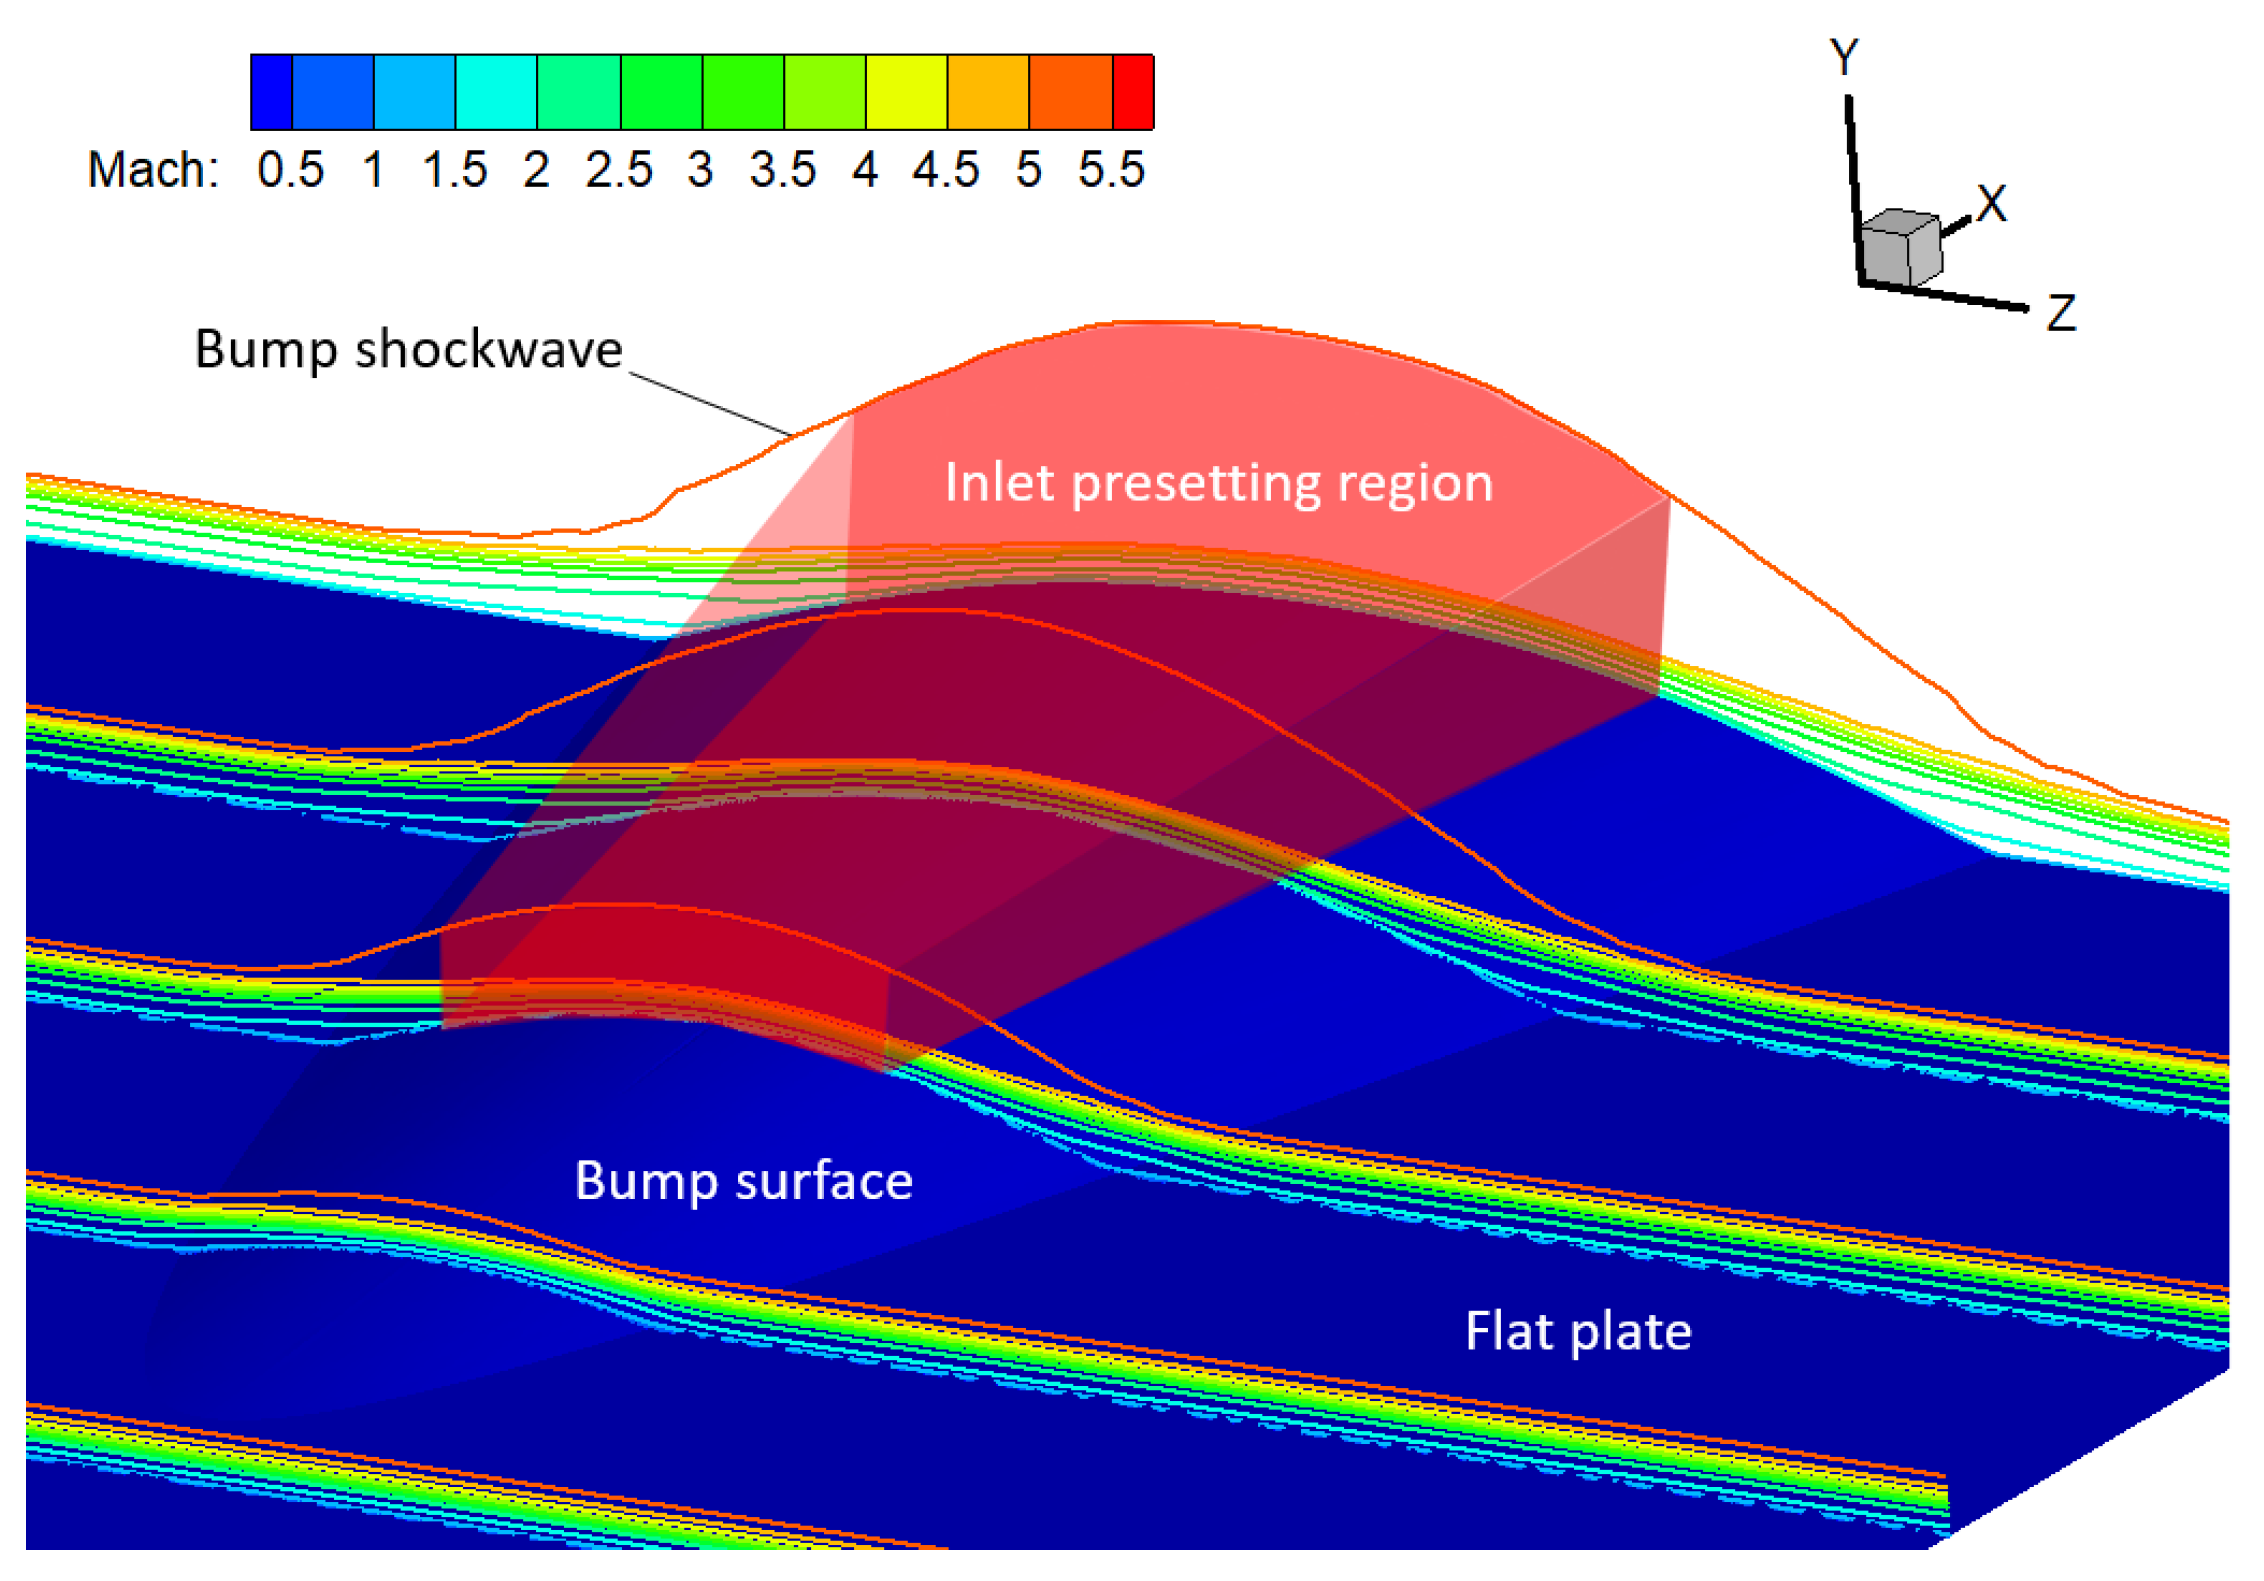
4.1. Preparation of Numerical Simulation
4.2. Aerodynamic Characteristics of the Spillage-adaptive Integration at the Design Condition
4.3. Start-Ability of the New Spillage-Adaptive Bump Inlet
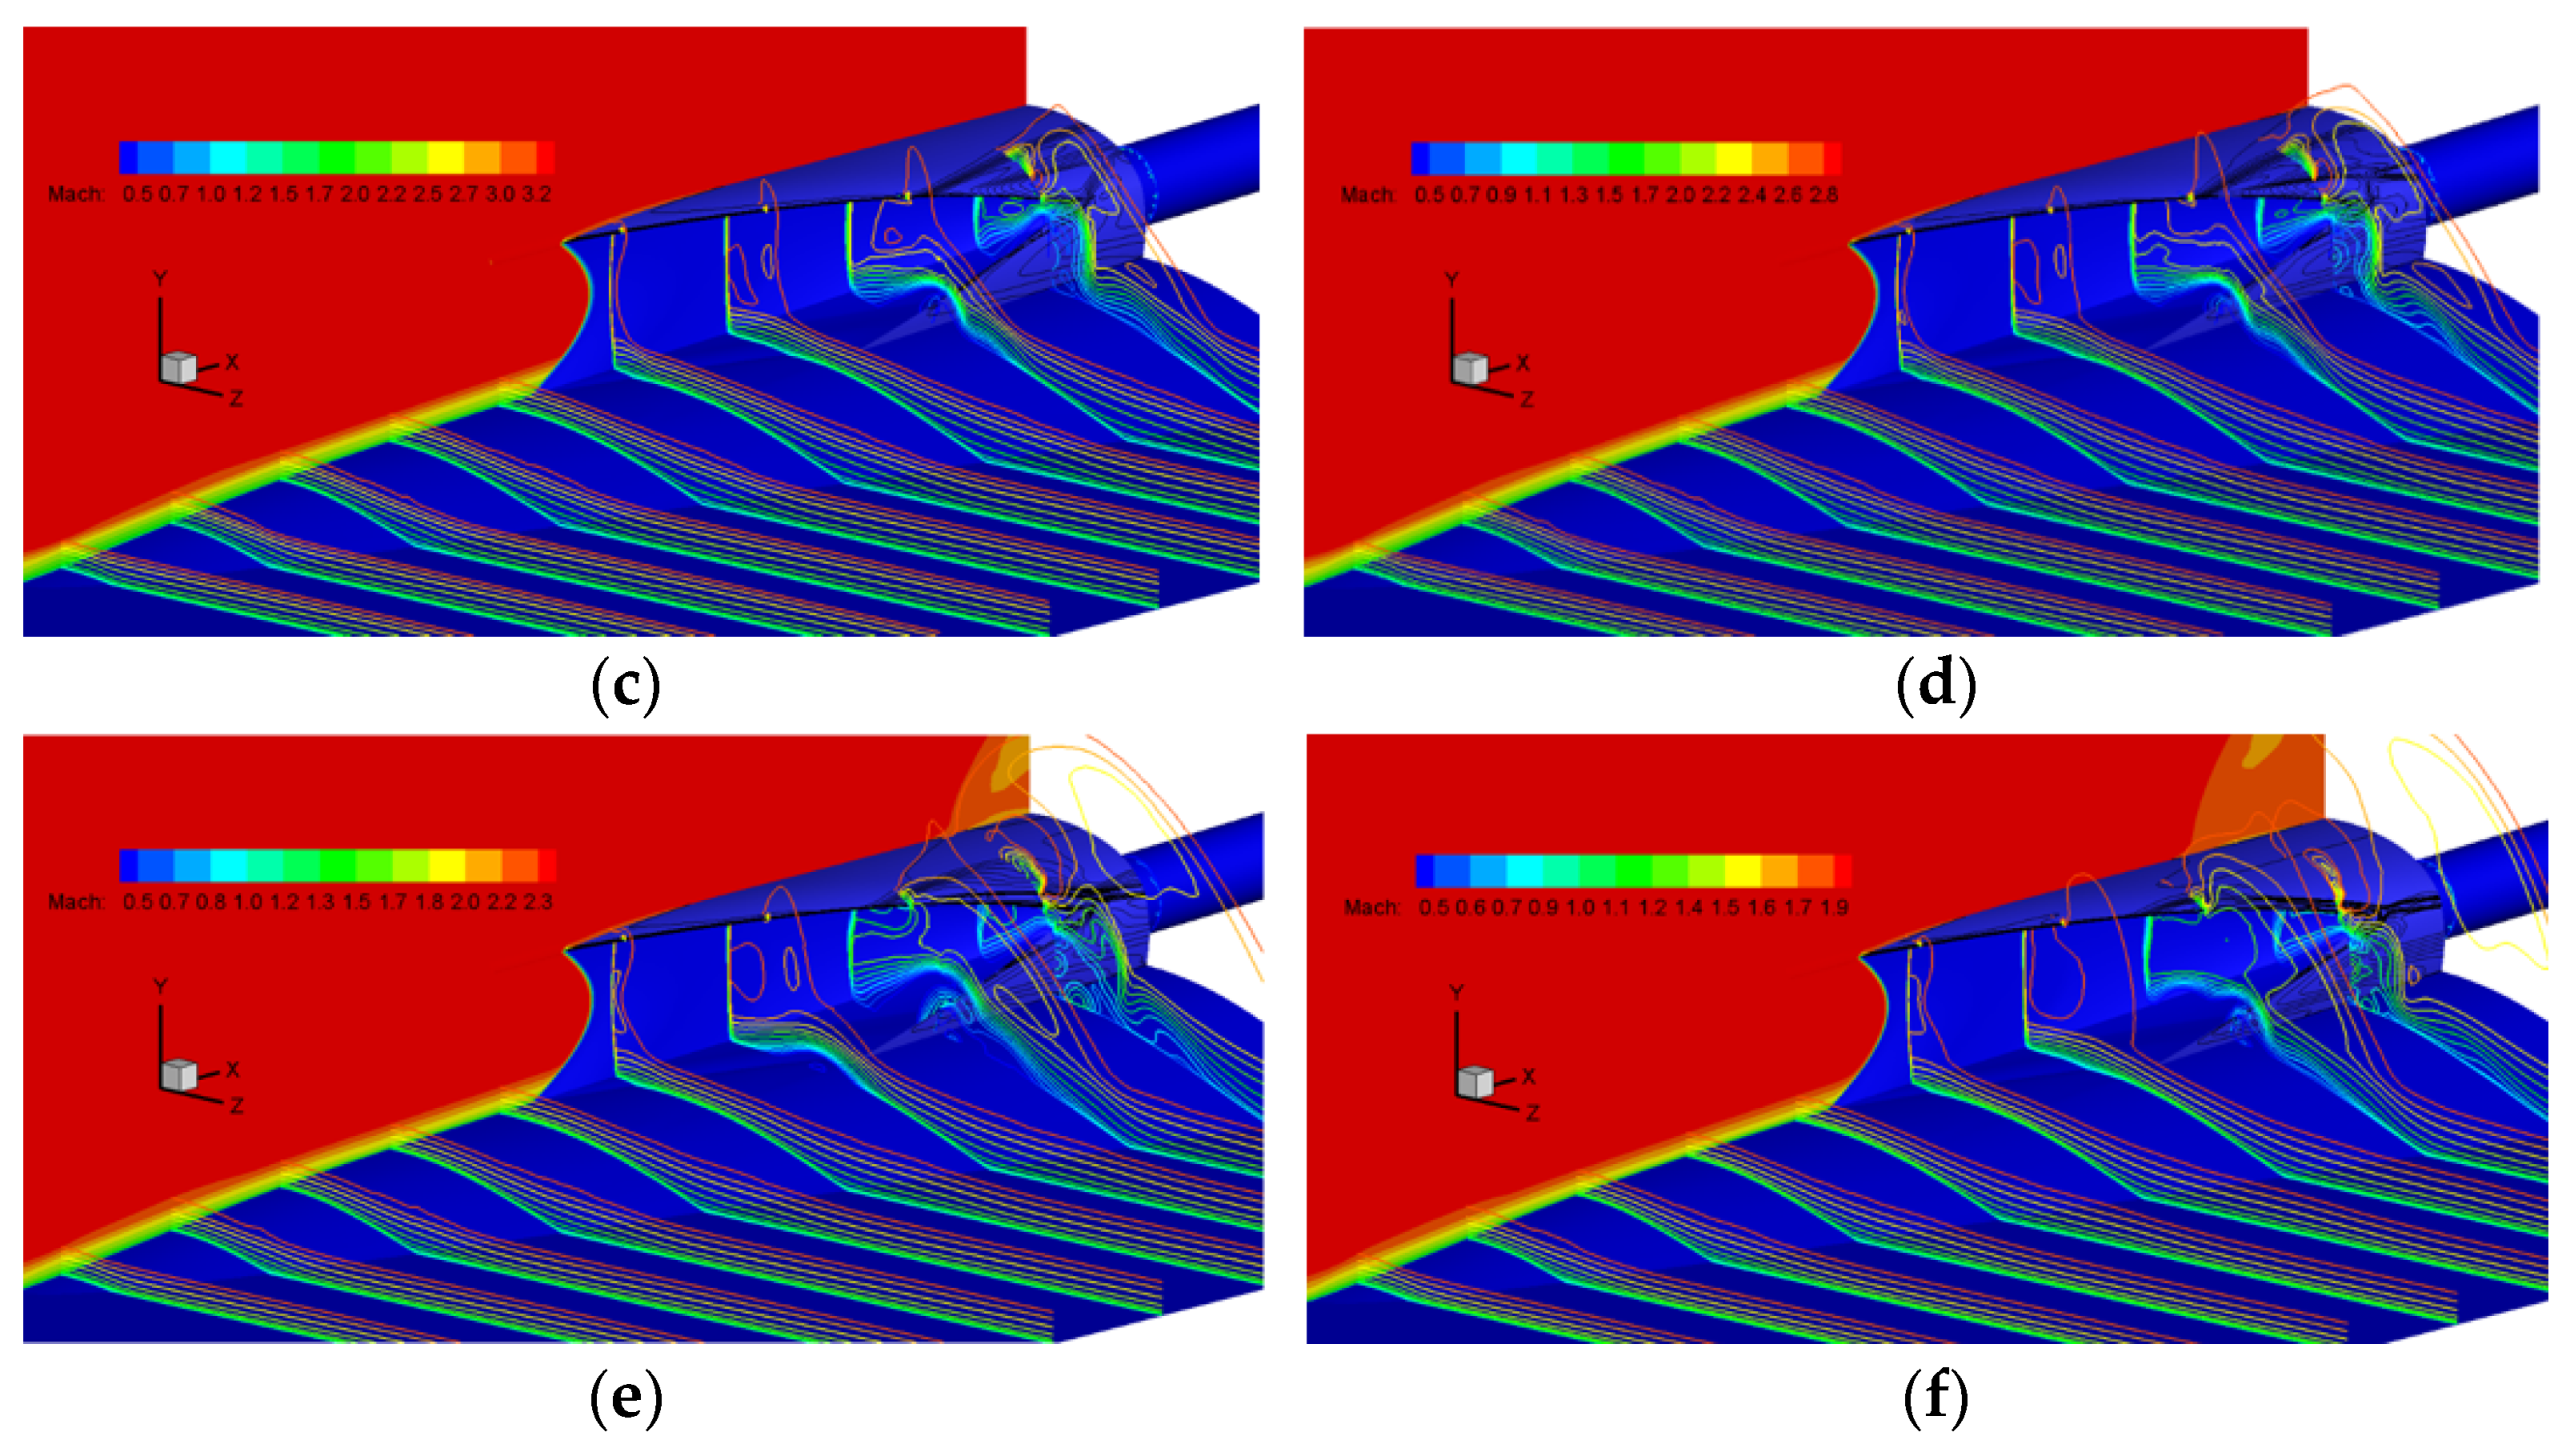
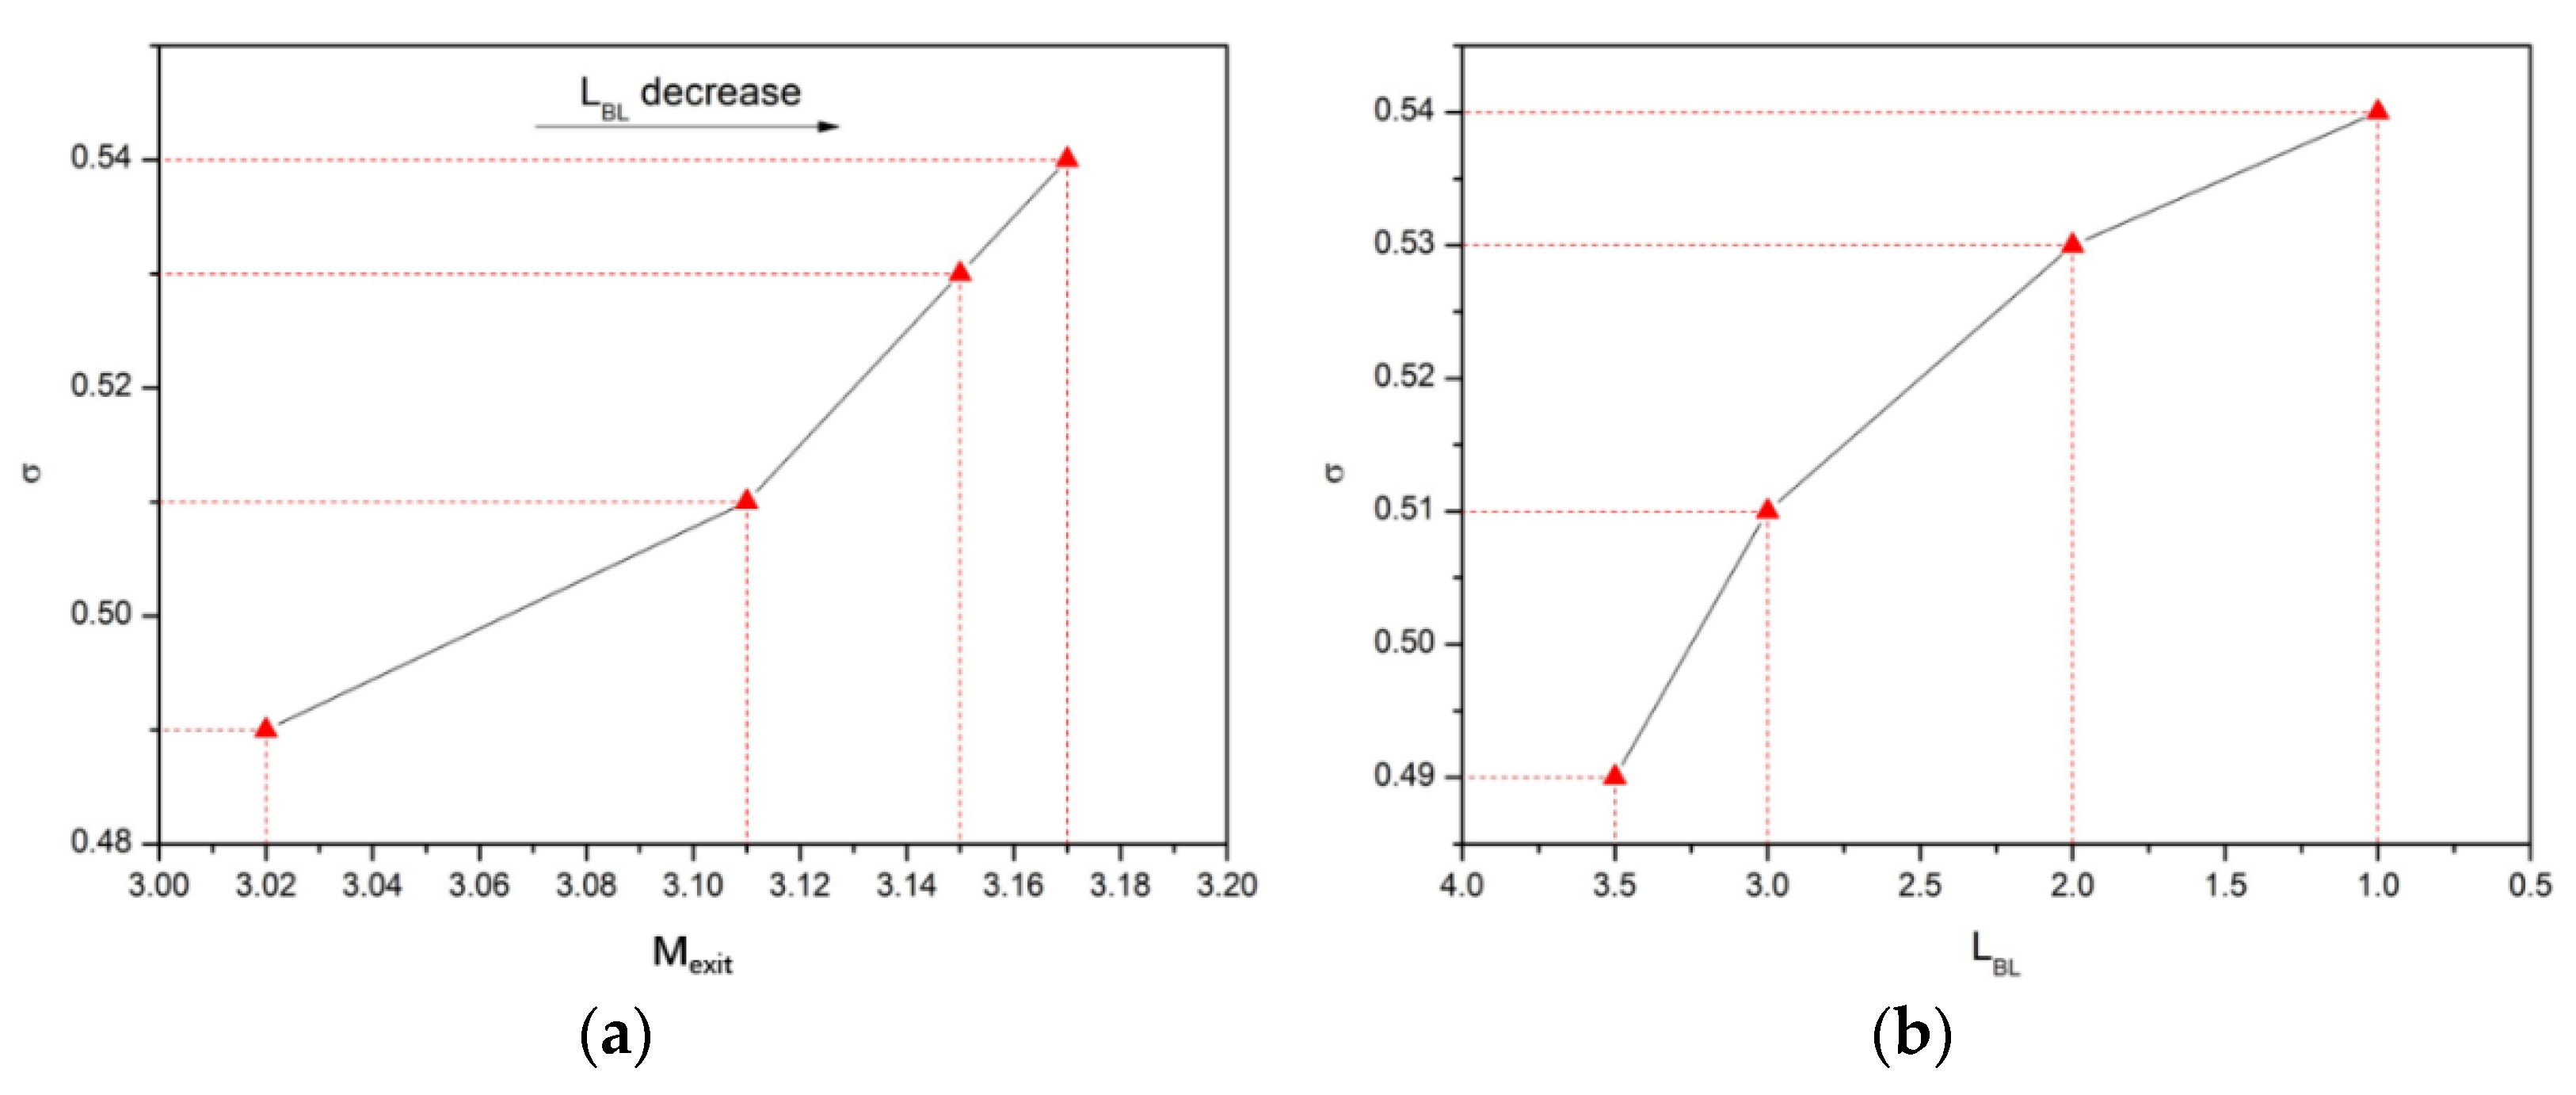
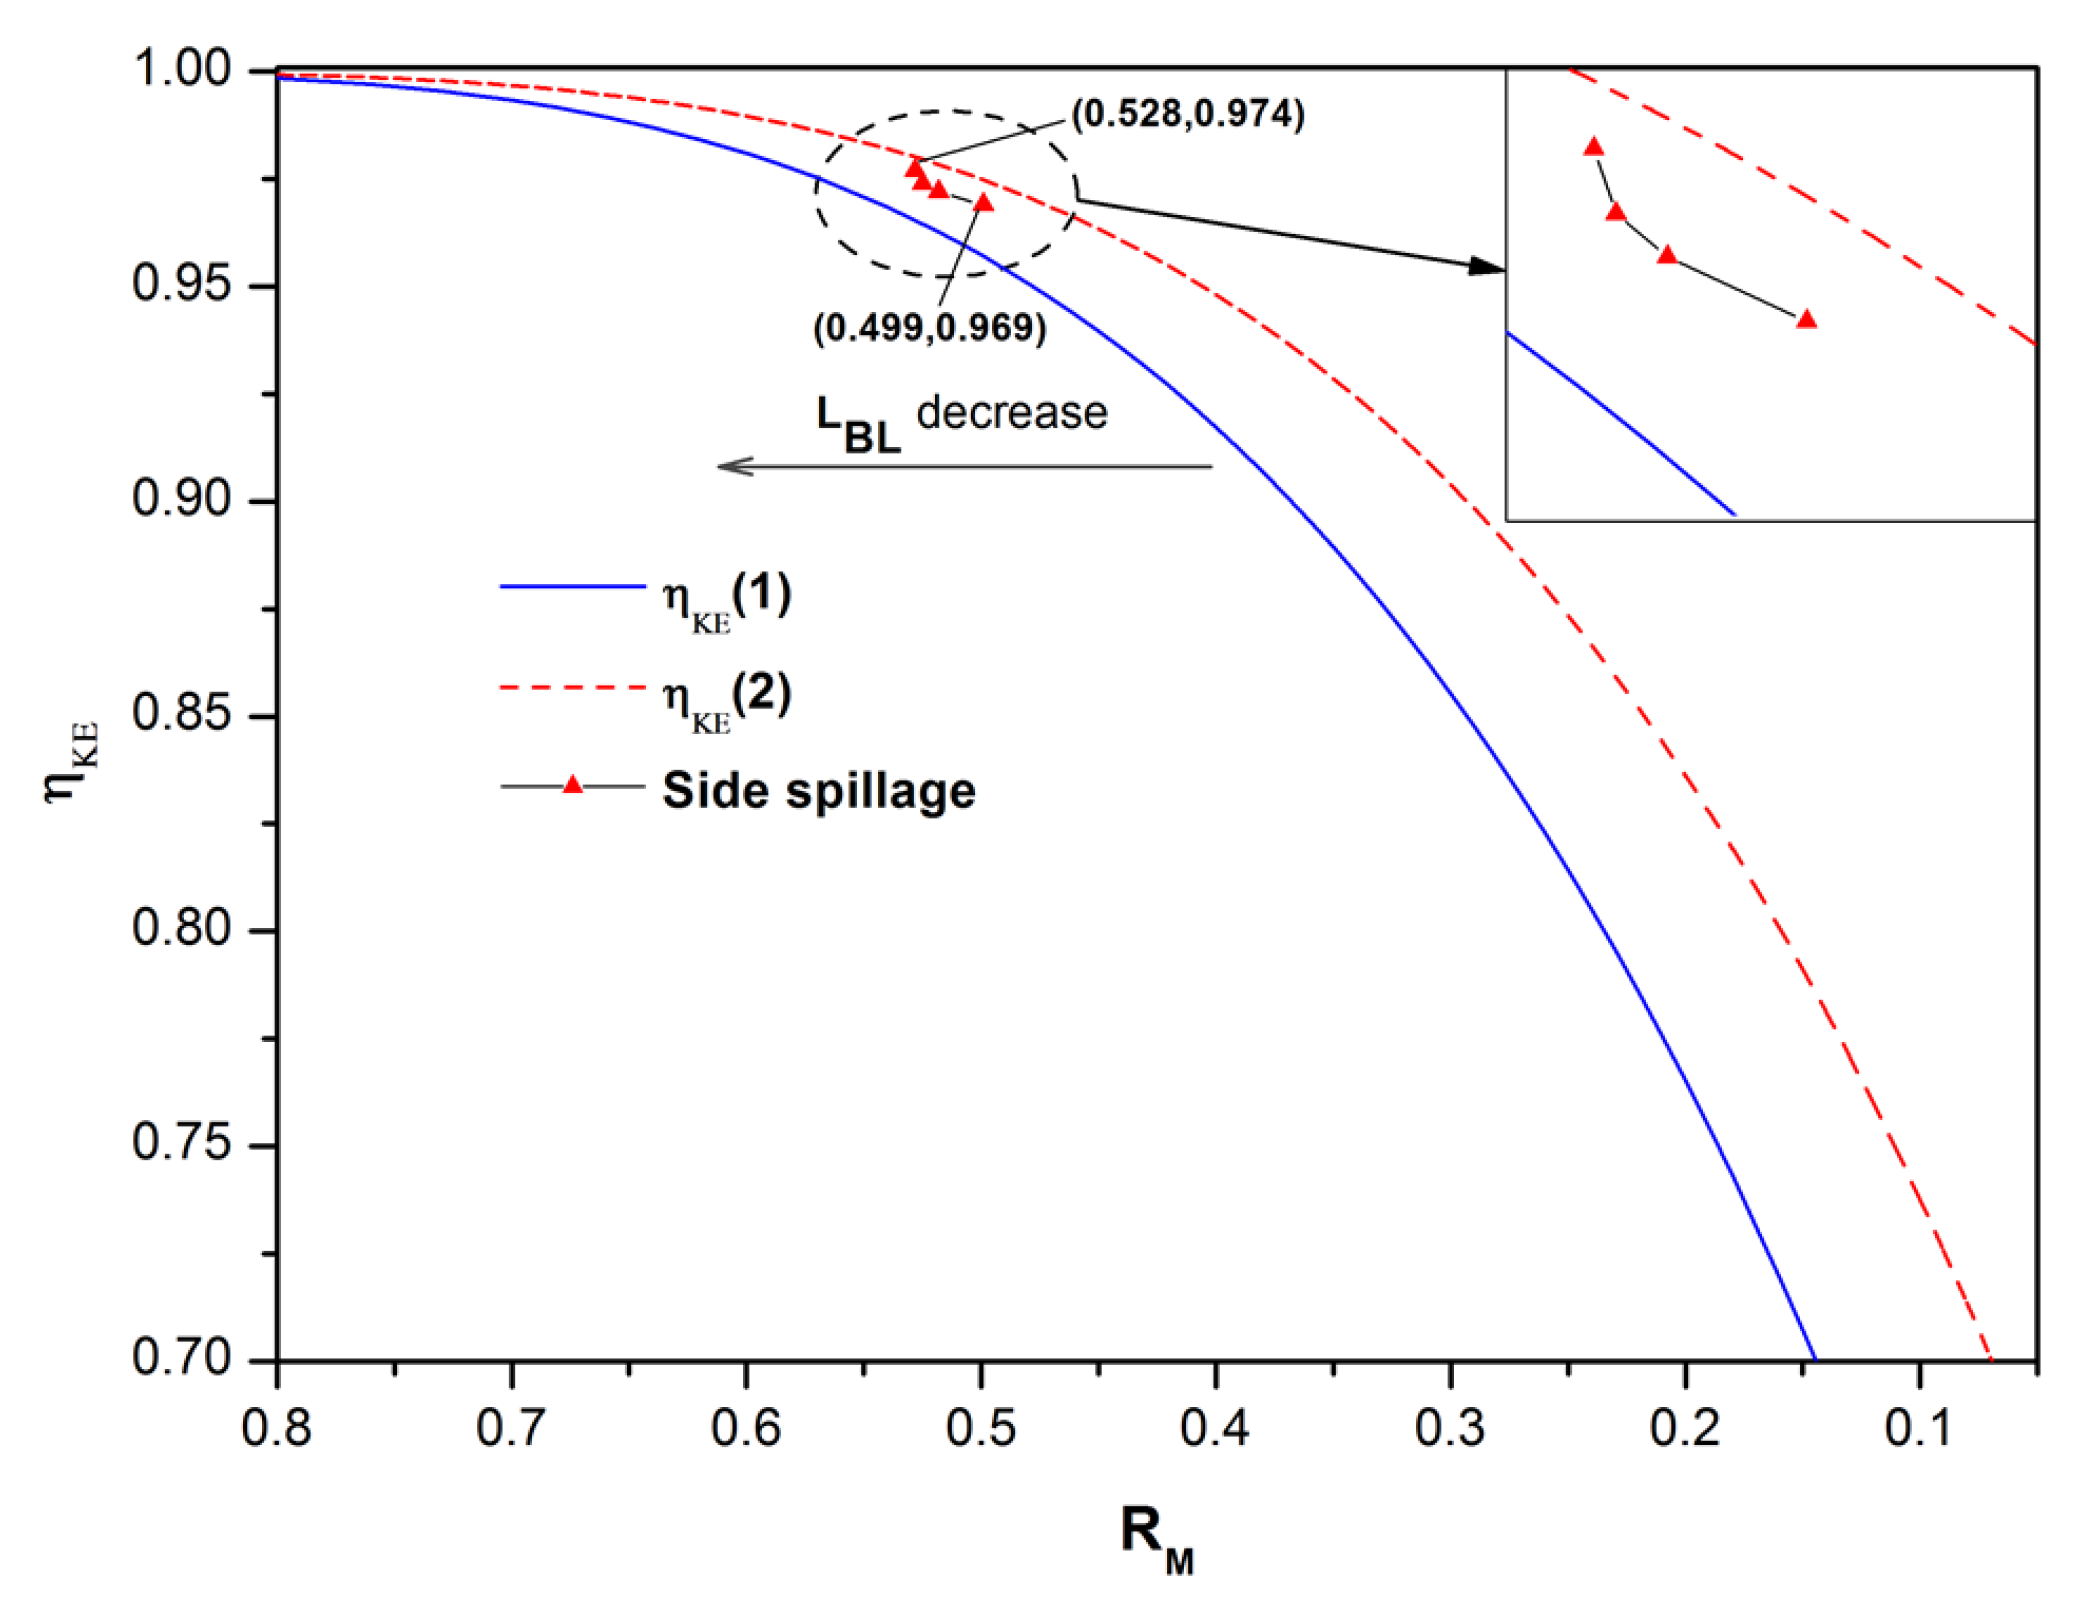
4.4. Effects of Boundary Layer Thickness to Aerodynamic Characteristics
5. Conclusions
Author Contributions
Funding
Data Availability Statement
Acknowledgments
Conflicts of Interest
References
- Ding, F.; Liu, J.; Shen, C.B.; Huang, W. Novel inlet-airframe integration methodology for hypersonic waverider vehicles. Acta. Astronaut. 2015, 111, 178–197. [Google Scholar] [CrossRef]
- Shi, L.; Yang, Y.; Zhao, G.; Liu, P.; He, G. Research and development on inlets for rocket based combined cycle engines. Prog. Aerosp. Sci. 2020, 117, 100639. [Google Scholar] [CrossRef]
- Sziroczak, D.; Smith, H. A review of design issues specific to hypersonic flight vehicles. Prog. Aerosp. Sci. 2016, 84, 1–28. [Google Scholar] [CrossRef] [Green Version]
- Can, A.; Ashish, A.S.; Apostolos, P. Conceptual Advanced Transport Aircraft Design Configuration for Sustained Hypersonic Flight. Aerospace 2018, 5, 5030091. [Google Scholar]
- Yu, Z.; Huang, G.; Xia, C. Inverse design and Mach 6 experimental investigation of a pressure controllable bump. Aerosp. Sci. Technol. 2018, 81, 204–212. [Google Scholar] [CrossRef]
- Brahmachary, S.; Fujio, C.; Ogawa, H. Multi-point design optimization of a high-performance intake for scramjet-powered ascent flight. Aerosp. Sci. Technol. 2020, 107, 106362. [Google Scholar] [CrossRef]
- Yu, C.; Jiang, J.; Zhen, Z.; Bhatia, A.K.; Wang, S. Adaptive backstepping control for air-breathing hypersonic vehicle subject to mismatched uncertainties. Aerosp. Sci. Technol. 2020, 107, 106244. [Google Scholar] [CrossRef]
- Zhang, D.; Tang, S.; Cao, L.; Cheng, F.; Deng, F. Research on control-oriented coupling modeling for air-breathing hypersonic propulsion systems. Aerosp. Sci. Technol. 2019, 84, 143–157. [Google Scholar] [CrossRef]
- Shi, W.; Chang, J.; Wang, Y.; Bao, W.; Liu, X. Buzz evolution process investigation of a two-ramp inlet with translating cowl. Aerosp. Sci. Technol. 2019, 84, 712–723. [Google Scholar] [CrossRef]
- Shi, W.; Chang, J.; Zhang, J.; Ma, J.; Wang, Z.; Bao, W. Numerical investigation on the forced oscillation of shock train in hypersonic inlet with translating cowl. Aerosp. Sci. Technol. 2019, 87, 311–322. [Google Scholar] [CrossRef]
- Ma, K.; Zhang, Z.; Liu, Y.; Jiang, Z. Aerodynamic principles of shock-induced combustion ramjet engines. Aerosp. Sci. Technol. 2020, 103, 105901. [Google Scholar] [CrossRef]
- Kantrowitz, A.; Donaldson, C.D. Preliminary Investigation of Supersonic Diffusers. NACA 1945, 1945, WRL-713. [Google Scholar]
- Xie, W.Z.; Yang, W.; Jin, Y.; Yang, S.; Guo, S. Prediction of self-starting limit of two-dimensional supersonic inlets considering viscous effects. Aerosp. Sci. Technol. 2020, 106, 106229. [Google Scholar] [CrossRef]
- Xie, W.; Jin, Y.; Ge, Y.; Yang, S.; Zeng, C.; Guo, S. Feasibility of employing the restarting process to evaluate the self-starting ability for hypersonic inlets. Aerosp. Sci. Technol. 2020, 107, 106347. [Google Scholar] [CrossRef]
- Wang, C.; Yang, X.; Xue, L.; Kontis, K.; Jiao, Y. Correlation Analysis of Separation Shock Oscillation and Wall Pressure Fluctuation in Unstarted Hypersonic Inlet Flow. Aerospace 2019, 6, 8. [Google Scholar] [CrossRef] [Green Version]
- Yu, Z.; Huang, G.; Xia, C.; Huihui, H. An Improved Internal-Waverider-Inlet with High External-Compression for Ramjet Engine. In Proceedings of the 20th AIAA International Space Planes and Hypersonic Systems and Technologies Conference, Glasgow, UK, 6–9 July 2015. [Google Scholar]
- Xiong, B.; Fan, X.Q.; Wang, Y. Parameterization and optimization design of a hypersonic inward turning inlet. Acta Astronaut. 2019, 164, 130–141. [Google Scholar] [CrossRef]
- Chen, S.; Liu, J.; Ding, F.; Huang, W. Novel design methodology of integrated waverider with drip-like intake based on planform leading-edge definition method. Acta Astronaut. 2020, 167, 314–330. [Google Scholar] [CrossRef]
- Ding, F.; Liu, J.; Shen, C.B.; Huang, W. Novel approach for design of a waverider vehicle generated from axisymmetric supersonic flows past a pointed von Karman ogive. Aerosp. Sci. Technol. 2015, 42, 297–308. [Google Scholar] [CrossRef]
- Qiao, W.; Anyuan, Y.U.; Gao, W.; Wang, W. Design method with controllable velocity direction at throat for inward-turning inlets. Chin. J. Aeronaut. 2019, 32, 1403–1415. [Google Scholar] [CrossRef]
- Qiao, W.; Yu, A.; Yang, D.; Le, J. Integration design of inward-turning inlets based on forebody shock wave. Acta Aeronaut. Astronaut. Sin. 2018, 39, 60–71. [Google Scholar]
- Zhou, H.; Jin, Z. A novel approach for inverse design of three-dimensional shock waves under non-uniform flows. Acta Astronaut. 2020, 176, 324–331. [Google Scholar] [CrossRef]
- Zhou, H.; Jin, Z.; Ge, N. Design method for non-axisymmetric generalized internal conical flowfield based on double 3D curved shock waves. Aerosp. Sci. Technol. 2020, 105, 105971. [Google Scholar] [CrossRef]
- Youssefi, M.R.; Knight, D. Assessment of CFD Capability for Hypersonic Shock Wave Laminar Boundary Layer Interactions. Aerospace 2017, 4, 4020025. [Google Scholar]
- Running, C.L.; Juliano, T.J. Global Skewness and Coherence for Hypersonic Shock-Wave/Boundary-Layer Interactions with Pressure-Sensitive Paint. Aerospace 2021, 8, 123. [Google Scholar] [CrossRef]
- Ferrero, A. Control of a Supersonic Inlet in Off-Design Conditions with Plasma Actuators and Bleed. Aerospace 2020, 7, 32. [Google Scholar] [CrossRef] [Green Version]
- Häberle, J.; Gülhan, A. Internal Flowfield Investigation of a Hypersonic Inlet at Mach 6 with Bleed. J. Propuls. Power 2007, 23, 1007–1017. [Google Scholar] [CrossRef]
- Goldfeld, M.A. Influence of flow conditions on compression surfaces of hypersonic inlet on characteristics of boundary layer bleed. J. Phys. Conf. Ser. 2019, 1382, 012076. [Google Scholar] [CrossRef]
- Liu, J.; Fan, X.; Tao, Y.; Liu, W. Experimental and numerical study on the local unstart mechanism of hypersonic inlet. Acta Astronaut. 2019, 160, 216–221. [Google Scholar] [CrossRef]
- Cakir, B.O.; Saracoglu, B.H. Numerical Assessment of Ramjet Intake Flow Topology Optimization for Off-Design Operation via Bypass Boundary Layer Bleed. AIAA Propuls. Energy 2020 Forum. 2020. [Google Scholar] [CrossRef]
- Wang, Y.; Yang, S.; Zhang, D.; Deng, X. Design of Waverider Configuration with High Lift-Drag Ratio. J. Aircr. 2007, 44, 144–148. [Google Scholar]
- Huang, G.; Zuo, F.; Qiao, W. Design method of internal waverider inlet under non-uniform upstream for inlet/forebody integration. Aerosp. Sci. Technol. 2018, 74, 160–172. [Google Scholar] [CrossRef]
- Guoping, H.; Zonghan, Y.; Chen, X. 3D inverse method of characteristics for hypersonic bump-inlet integration. Acta Astronaut. 2020, 166, 11–22. [Google Scholar]
- Yu, Z.; Huang, G.; Xia, C.; Sesterhenn, J. A pressure-controllable bump based on the pressure-ridge concept. Aerosp. Sci. Technol. 2019, 87, 133–140. [Google Scholar] [CrossRef]
- Zhang, J.; Yuan, H.; Wang, Y.; Huang, G. Experiment and numerical investigation of flow control on a supersonic inlet diffuser. Aerosp. Sci. Technol. 2020, 106, 106182. [Google Scholar] [CrossRef]
- Lisen, Q. Solution of Shock with Variable Specific Heat for Calculation of Hypersonic Inlet. J. Aerosp. Power 2020, 15, 105–108. [Google Scholar]
- Liang, D.; You, Y.; Guo, R. High Enthalpy Wind Tunnel Tests of Three-Dimensional Section Controllable Internal Waverider Hypersonic Inlet. In Proceedings of the AIAA Aerospace Sciences Meeting Including the New Horizons Forum and Aerospace Exposition, Orlando, FL, USA, 5–8 January 2009. [Google Scholar]
- Van Wie, D. Scramjet inlets. Scramjet Propuls. 2000, 189, 447–511. [Google Scholar]
- Ault, D.A.; van Wie, D.M. Experimental and computational results for the external flowfield of a scramjet inlet. J. Propuls. Power 1994, 10, 533–539. [Google Scholar] [CrossRef]
- van Wie, D. Techniques for the measurement of scramjet inlet performance at hypersonic speeds. In Proceedings of the AlAA 4th International Aerospace Planes Conference, Orlando, FL, USA, 4 December 1992. [Google Scholar]
- van Wie, D.M.; Ault, D.A. Internal flowfield characteristics of a scramjet inlet at Mach 10. J. Propuls. Power 1996, 12, 158–164. [Google Scholar] [CrossRef]
- Tai, K.; Kanda, T.; Kudou, K.; Murakami, A.; Komuro, T.; Itoh, K. Aerodynamic performance of scramjet inlet models with a single strut. In Proceedings of the 31st Aerospace Sciences Meeting, Reno, NV, USA, 11–14 January 1993. [Google Scholar]


| Type | Mesh Number | σexit | πexit | Mexit | φthroat |
|---|---|---|---|---|---|
| Coarse grid | 3.5 million | 0.487 | 17.812 | 3.014 | 0.747 |
| Medium grid | 4.3 million | 0.489 | 18.371 | 3.018 | 0.748 |
| Fine grid | 6.0 million | 0.489 | 18.374 | 3.018 | 0.748 |
| Spillage Position | M∞ | φthroat | Mexit | σexit | πexit | RM | ηKE |
|---|---|---|---|---|---|---|---|
| 1. Side spillage | 6.0 | 0.748 | 3.02 | 0.49 | 18.4 | 0.499 | 0.969 |
| 2. Central spillage | 6.0 | 0.745 | 2.94 | 0.48 | 17.1 | 0.487 | 0.968 |
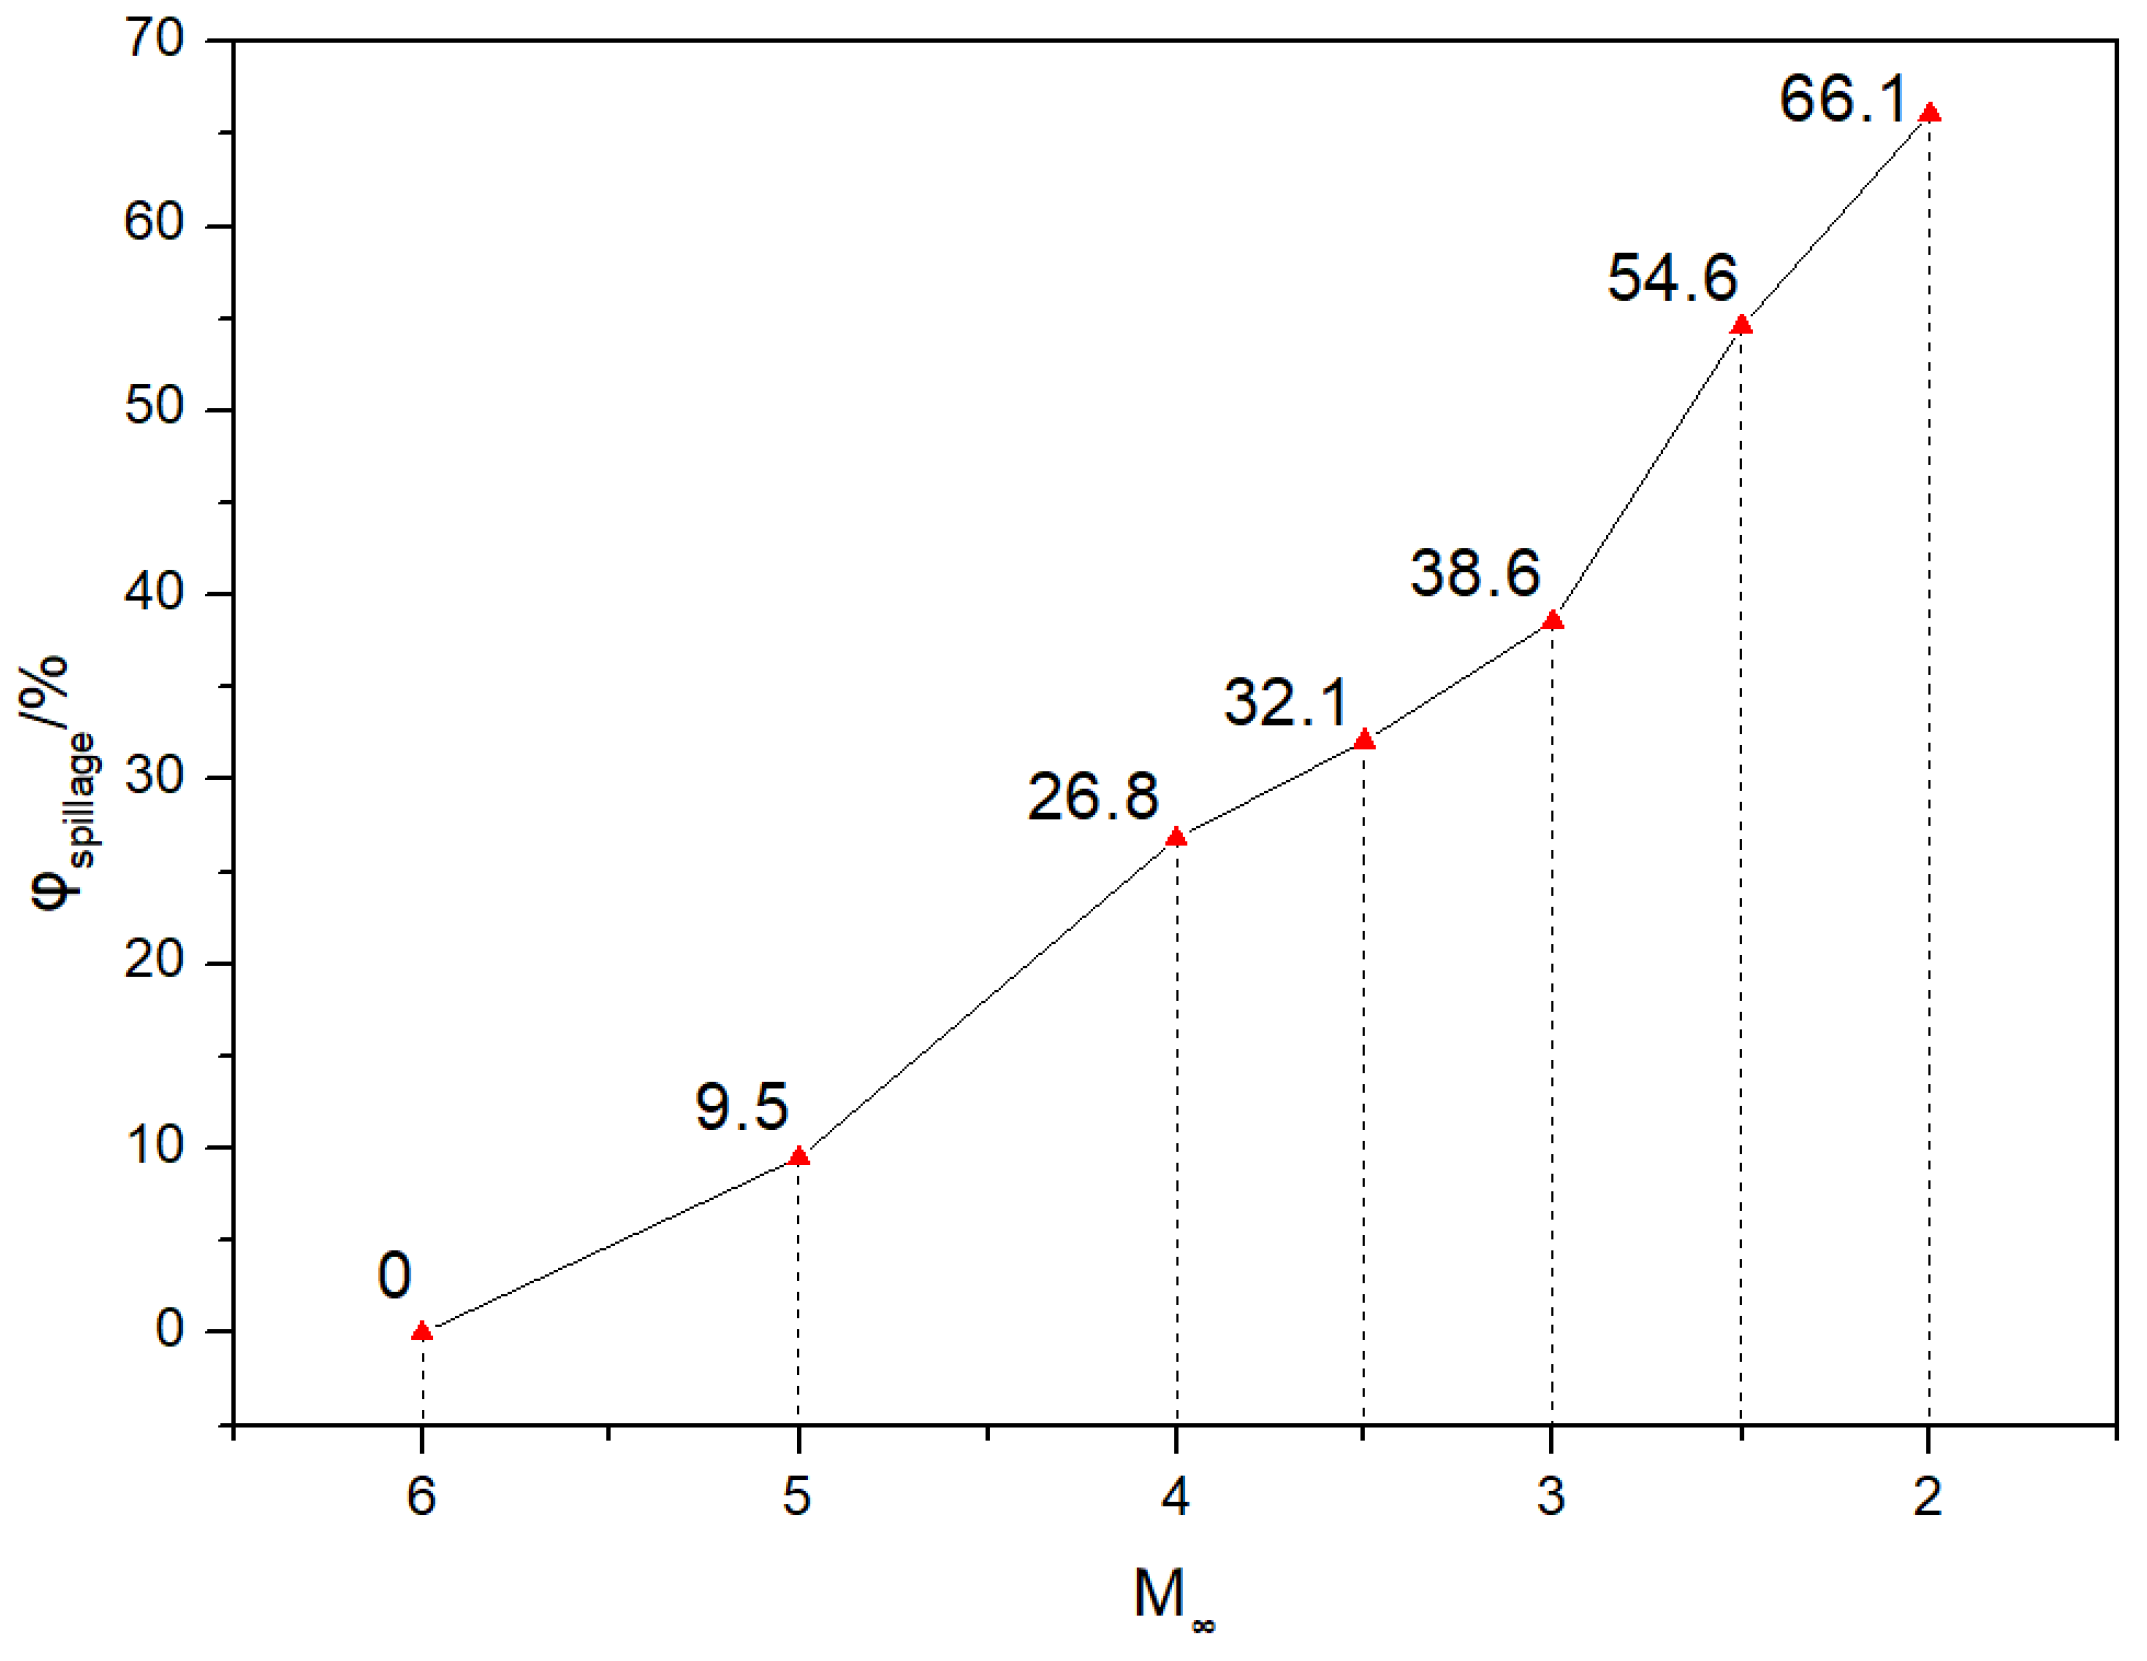
| M∞ | φthroat | φspillage | Mexit | σexit | πexit | RM | ηKE |
|---|---|---|---|---|---|---|---|
| 6.0 | 0.748 | 0 | 3.02 | 0.49 | 18.4 | 0.499 | 0.969 |
| 5.0 | 0.676 | 9.5% | 2.49 | 0.53 | 13.0 | 0.497 | 0.961 |
| 4.0 | 0.547 | 26.8% | 1.78 | 0.45 | 11.1 | 0.445 | 0.921 |
| 3.5 | 0.508 | 32.1% | 1.53 | 0.53 | 9.9 | 0.437 | 0.920 |
| 3.0 | 0.459 | 38.6% | 1.22 | 0.64 | 9.2 | 0.405 | 0.927 |
| 2.5 | 0.339 | 54.6% | 0.81 | 0.75 | 8.2 | 0.324 | 0.933 |
| 2.0 | 0.253 | 66.1% | 0.95 | 0.83 | 3.6 | 0.475 | 0.931 |
Publisher’s Note: MDPI stays neutral with regard to jurisdictional claims in published maps and institutional affiliations. |
© 2021 by the authors. Licensee MDPI, Basel, Switzerland. This article is an open access article distributed under the terms and conditions of the Creative Commons Attribution (CC BY) license (https://creativecommons.org/licenses/by/4.0/).
Share and Cite
Yu, Z.; Huang, G.; Wang, R.; Musa, O. Spillage-Adaptive Fixed-Geometry Bump Inlet of Wide Speed Range. Aerospace 2021, 8, 340. https://doi.org/10.3390/aerospace8110340
Yu Z, Huang G, Wang R, Musa O. Spillage-Adaptive Fixed-Geometry Bump Inlet of Wide Speed Range. Aerospace. 2021; 8(11):340. https://doi.org/10.3390/aerospace8110340
Chicago/Turabian StyleYu, Zonghan, Guoping Huang, Ruilin Wang, and Omer Musa. 2021. "Spillage-Adaptive Fixed-Geometry Bump Inlet of Wide Speed Range" Aerospace 8, no. 11: 340. https://doi.org/10.3390/aerospace8110340