
Aerodynamic Characteristics of Re-Entry Capsules with Hyperbolic Contours


Faculty of Advanced Science and Technology, Ryukoku University, Kyoto 612-8577, Japan
Aerospace 2021, 8(10), 287; https://doi.org/10.3390/aerospace8100287
Submission received: 10 September 2021
/
Revised: 29 September 2021
/
Accepted: 29 September 2021
/
Published: 3 October 2021
(This article belongs to the Special Issue Hypersonics: Emerging Research)
Abstract
:For most re-entry capsules, the shape of the forebody of the capsule is designed based on the blunted nose cone. A similar shape can be created using a hyperboloid of revolution that can control the nose bluntness and the half angle of the cone easily. In this study, the hypersonic aerodynamic characteristics of re-entry capsules designed with hyperbolic contours were investigated using the CFD code, FaSTAR, developed by Japan Aerospace Exploration Agency (JAXA). The CFD results showed that, using the hyperbolic contours, the drag and lift coefficients can be increased compared to those for the Hayabusa re-entry capsule without changing the shape of the capsule drastically. This suggests that shape design based on the hyperbolic contours can improve the aerodynamic characteristics of re-entry capsules.
1. Introduction
One of the most important issues for designing the shape of a re-entry capsule is to protect the capsule from aerodynamic heating. It is well-known that the stagnation point heat flux increases in proportion to , where , , and are the free stream density and velocity, and the blunt nose radius of the capsule, respectively [1]. This simple relation suggests that for mitigating the heat flux and should be reduced and should be large enough. Both and strongly depend on the flight trajectory. The trajectory of the capsule changes drastically depending on the ballistic parameter, ,
where m, , and A are the mass of the capsule, the drag coefficient, and the reference area, respectively. When is small, the capsule can be decelerated at a higher altitude compared to that with the higher value [2]. As a result, both and can be reduced. This indicates that and A should be larger. Based on the above considerations, most of the re-entry capsules are designed based on a blunted nose cone which has a larger nose radius and the larger half angle of the cone. The larger the nose radius and the half angle, the larger and A. On the other hand, from the viewpoint of the longitudinal static stability of the capsule, the half angle should be small to increase the length between the location of the center of pressure and the center of gravity (C.G.). This means that the shape of the capsule is designed by trading among the drag coefficient, the heat flux, and the longitudinal static stability. Thus, the shape of the capsule has been carefully designed through wind tunnel experiments and computational fluid dynamics (CFD) simulations [3]. Some research concerning the shape optimization for the forebody of the entry capsule using detailed CFD analyses [4,5] and Newtonian flow formula [6] are available. The optimum shapes created based on their own constraints were changed drastically from the shape of the current entry capsule. If the shape of the capsule was changed drastically, then it is necessary to confirm the efficacy of the updated design and this is not so cost-effective. In other words, it is helpful to improve the aerodynamic characteristics by slight modification of the shape.
The contours of the forebody of the re-entry capsule based on the blunted nose cone are determined by a combination of the arc and the inclined line. This type of contour can be approximated by the hyperbolic curves. Instead of a combination of the arc and the inclined line, by using hyperbolic curves, the nose area and the cone area can be connected smoothly, and the nose bluntness and the half angle of the cone also can be modified easily. If hyperbolic curves were utilized to design the contour of the forebody of the capsule we will be able to control and improve the aerodynamic characteristics of the capsule without changing the shape drastically. In this study, I tried to improve the aerodynamic characteristics of the re-entry capsule using hyperbolic contours for the forebody of the capsule. For that purpose, CFD analyses were performed to improve the aerodynamic characteristics when compared to that of the capsule designed based on the blunted nose cone.
2. Design of Re-Entry Capsule Shape Using Hyperbolic Contours
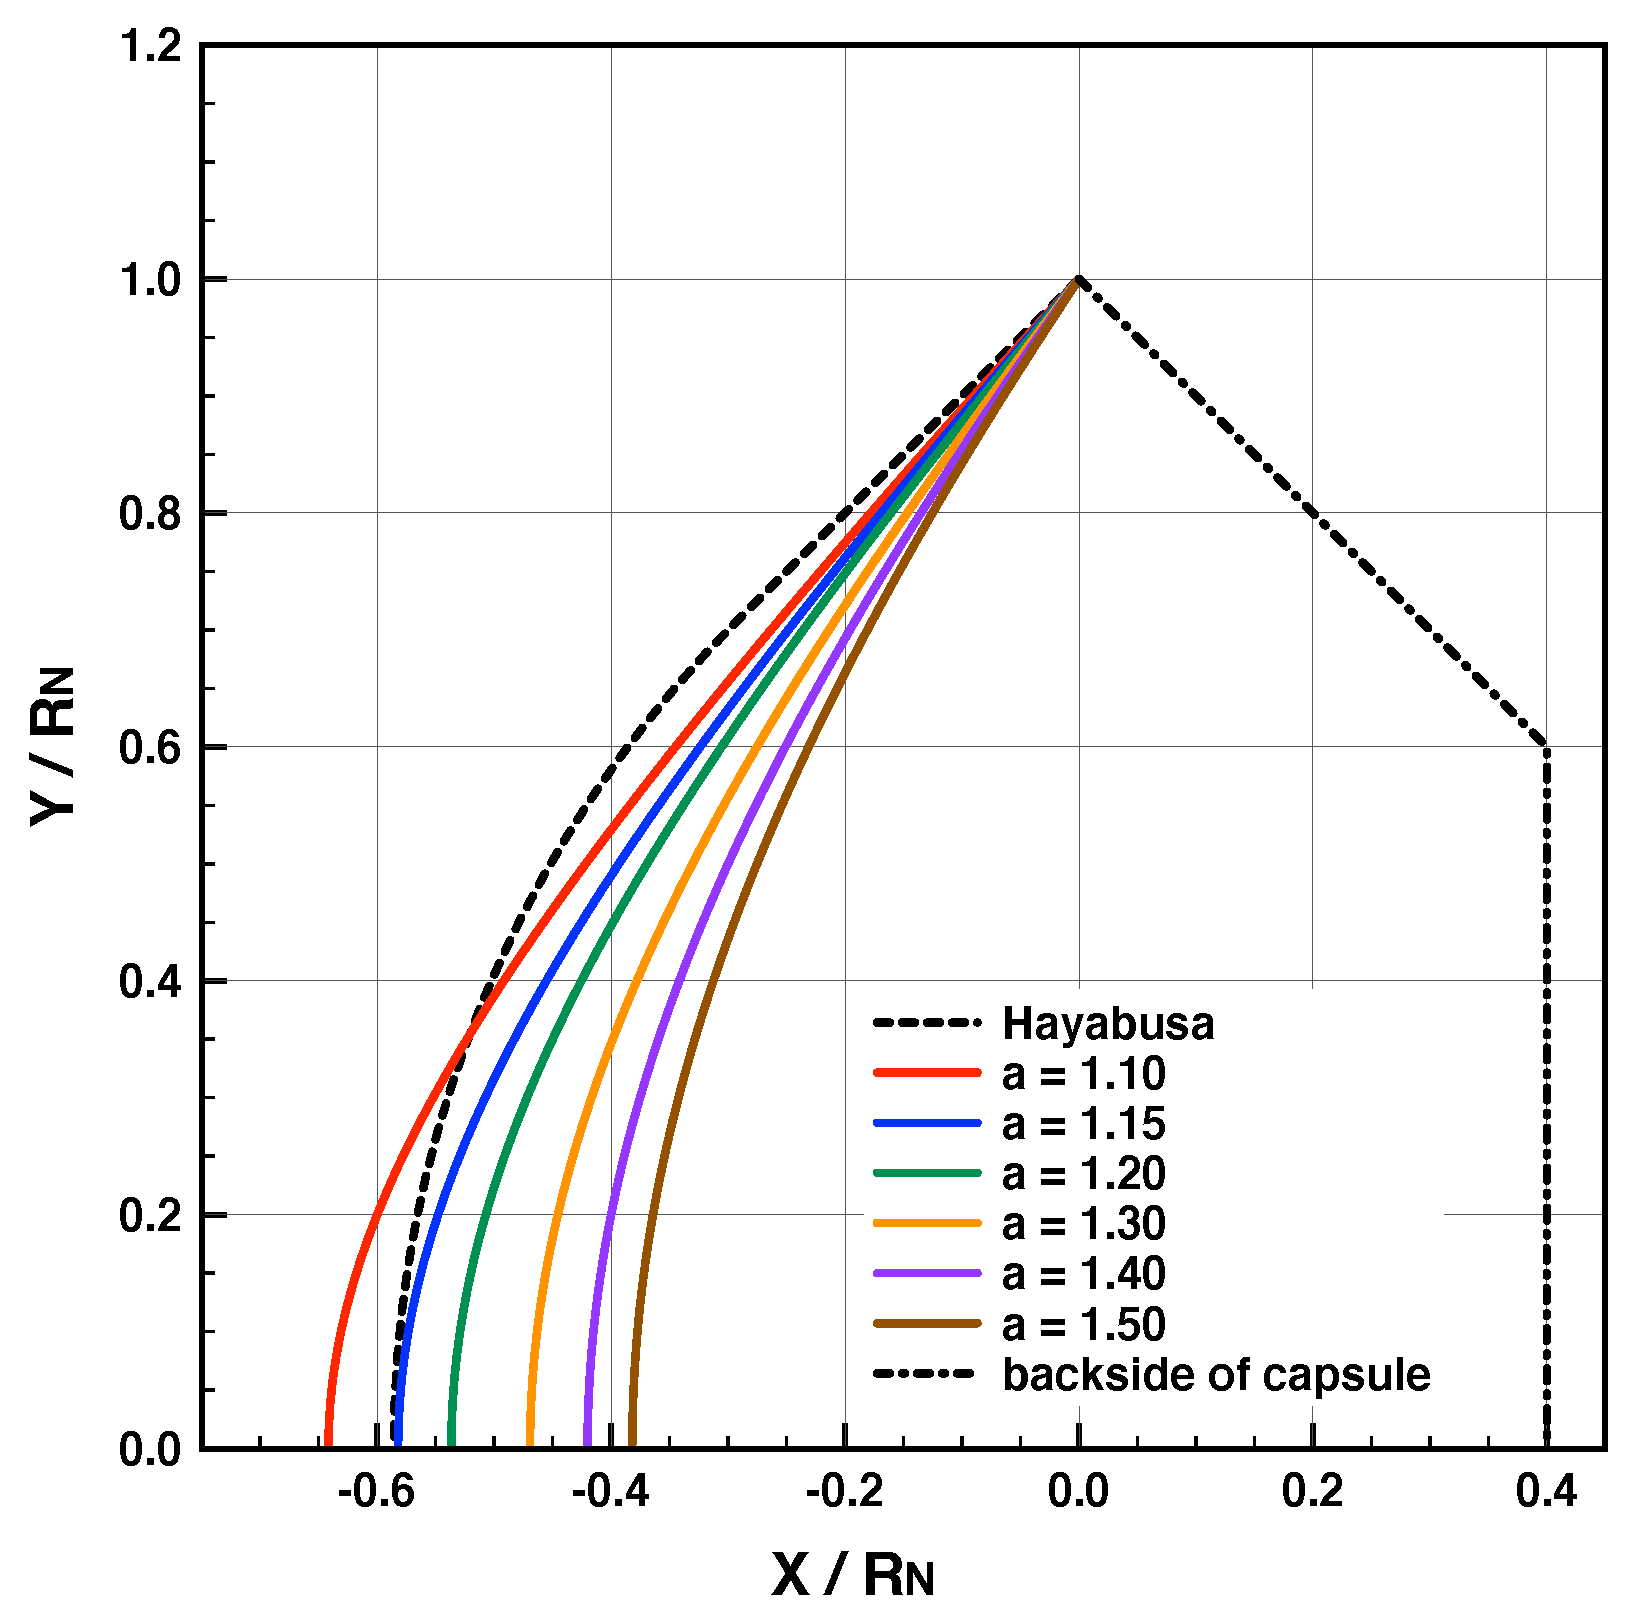
As a sample shape of the re-entry capsule based on the blunted nose cone, I selected the Hayabusa re-entry capsule [7]. The shape of the forebody of the capsule is the blunted nose cone with the half angle of 45 degrees. The nose and base radius are 200 mm. The contour of the above capsule is approximated by the following hyperbola with parameter, a;
This equation is a hyperbola through (0,1), independent of the parameter a. The point (0,1) is set to the shoulder of the capsule. The shape of the forebody of the designed capsule is created as a hyperboloid of revolution. The axis of the revolution is the X-axis as the body axis. The point (0,1) is fixed independent of the parameter a. Then, the base radius is fixed by the constant value. The slope of the asymptotic line of Equation (2) is 1.0, which is equal to the half angle of the Hayabusa capsule. The curvature radius at the stagnation point of Equation (2) is expressed as;
becomes the effective nose radius of the designed capsule. When , is 1.0, which is equal to the base radius. This relationship between the base radius and the nose radius is the same as that of the Hayabusa capsule. Figure 1 shows the contour of the designed capsule using Equation (2) when a is varied from 1.1 to 1.5. The contour of the Hayabusa capsule is also shown in the same figure for comparison. In this figure, all the dimensions are normalized by the nose radius of the Hayabusa capsule, , 200 mm. As can be seen, when a is around 1.15, the designed capsule has almost the same dimensions as the Hayabusa capsule. The same contour was set for all the shapes behind the shoulder of the capsule. In other words, only the shape of the forebody of the capsule was modified.
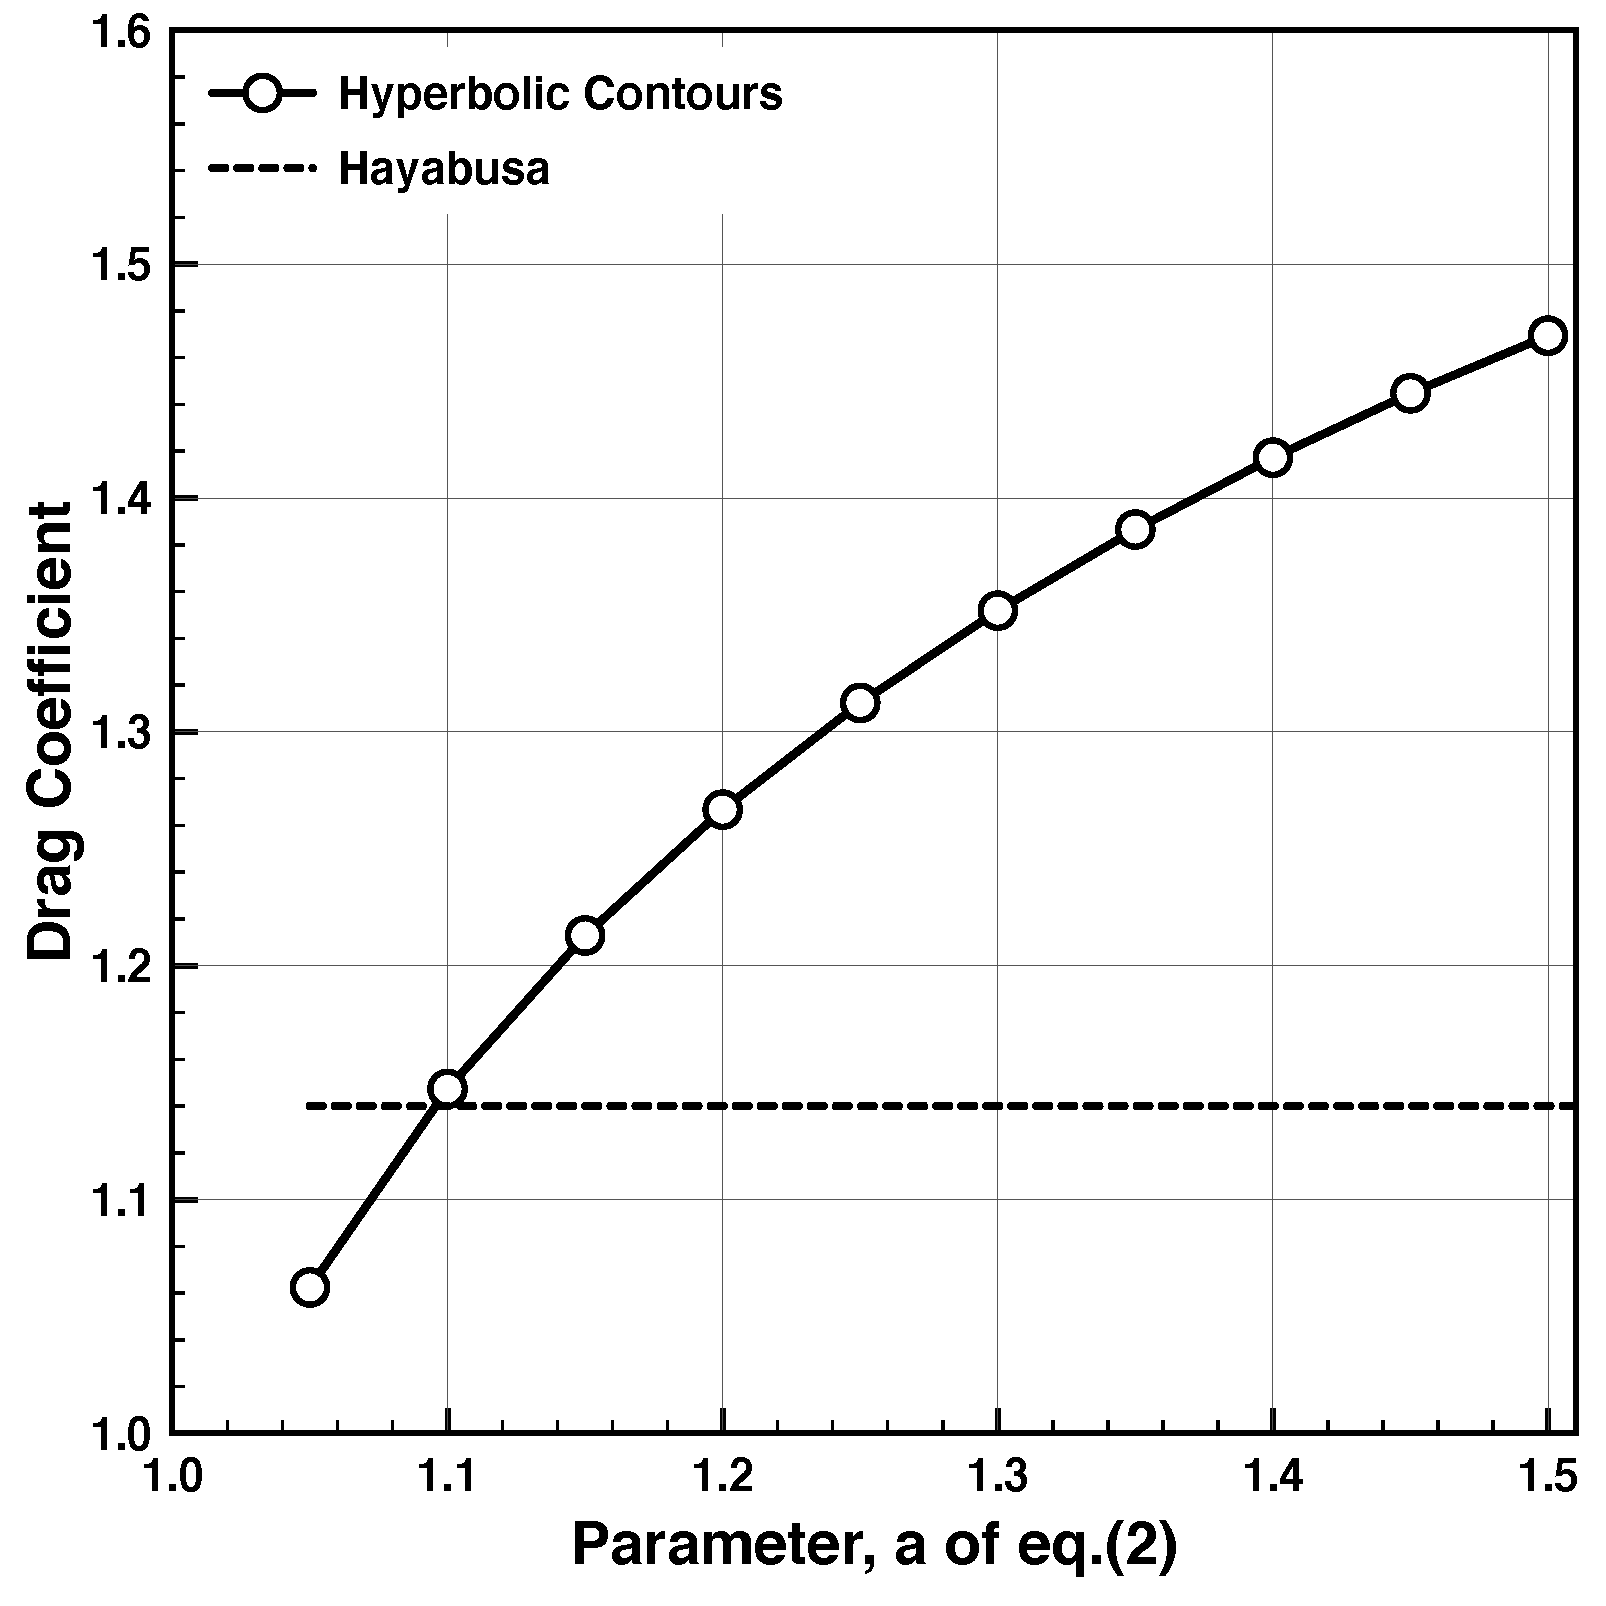
In order to estimate the relationship between the shape of the capsule and the drag coefficient, the modified Newtonian flow formula was utilized. In this formula, the pressure coefficient distribution is calculated by the following relationship;
where and are the pressure coefficient at the stagnation point and the angle between the main flow and the body surface, respectively. When the Mach number is infinity and the specific heat ratio is 1.4, is calculated to be 1.84. Figure 2 shows the relationship between the parameter a, and the drag coefficient. For comparison, the drag coefficient of the Hayabusa re-entry capsule is also shown in the same figure [7]. From this figure, it can be observed that as the parameter a increased, the drag coefficient also increased. When a is 1.1, the estimated drag coefficient is almost the same as that of the Hayabusa capsule. This indicates that a should be greater than 1.1 to enhance the drag coefficient.
3. Numerical Methods and Computational Grid
In order to confirm the efficacy of the designed capsule by hyperbolic contours, CFD analyses were performed. The governing equation is the compressible three-dimensional Navier–Stokes equation. The thermochemical model assumes a perfect gas and does not take into account real gas effects such as chemical reactions. The laminar viscosity is estimated by Sutherland’s formula and the Spalart–Allmaras model is chosen for the turbulence model. The CFD code, FaSTAR, developed by Japan Aerospace Exploration Agency (JAXA), was used for CFD analyses. In this code, the numerical flux can be chosen among several options. In the present study, the HLLE scheme was chosen because this scheme has robustness against the strong shock wave and expansion wave. The computational grid was created using the code HexaGrid v1.1, developed by JAXA. HexaGrid is an automatic grid generator based on a hexahedral grid. The detailed descriptions of FaSTAR and HexaGrid can be found in [8]. FaSTAR has various kinds of aerospace applications such as drag estimation of a full-scale aircraft [9], supersonic aerodynamics of ISAS/JAXA new launch vehicle, Epsilon [10], and a suborbital re-entry of flare-type membrane inflatable vehicle [11].
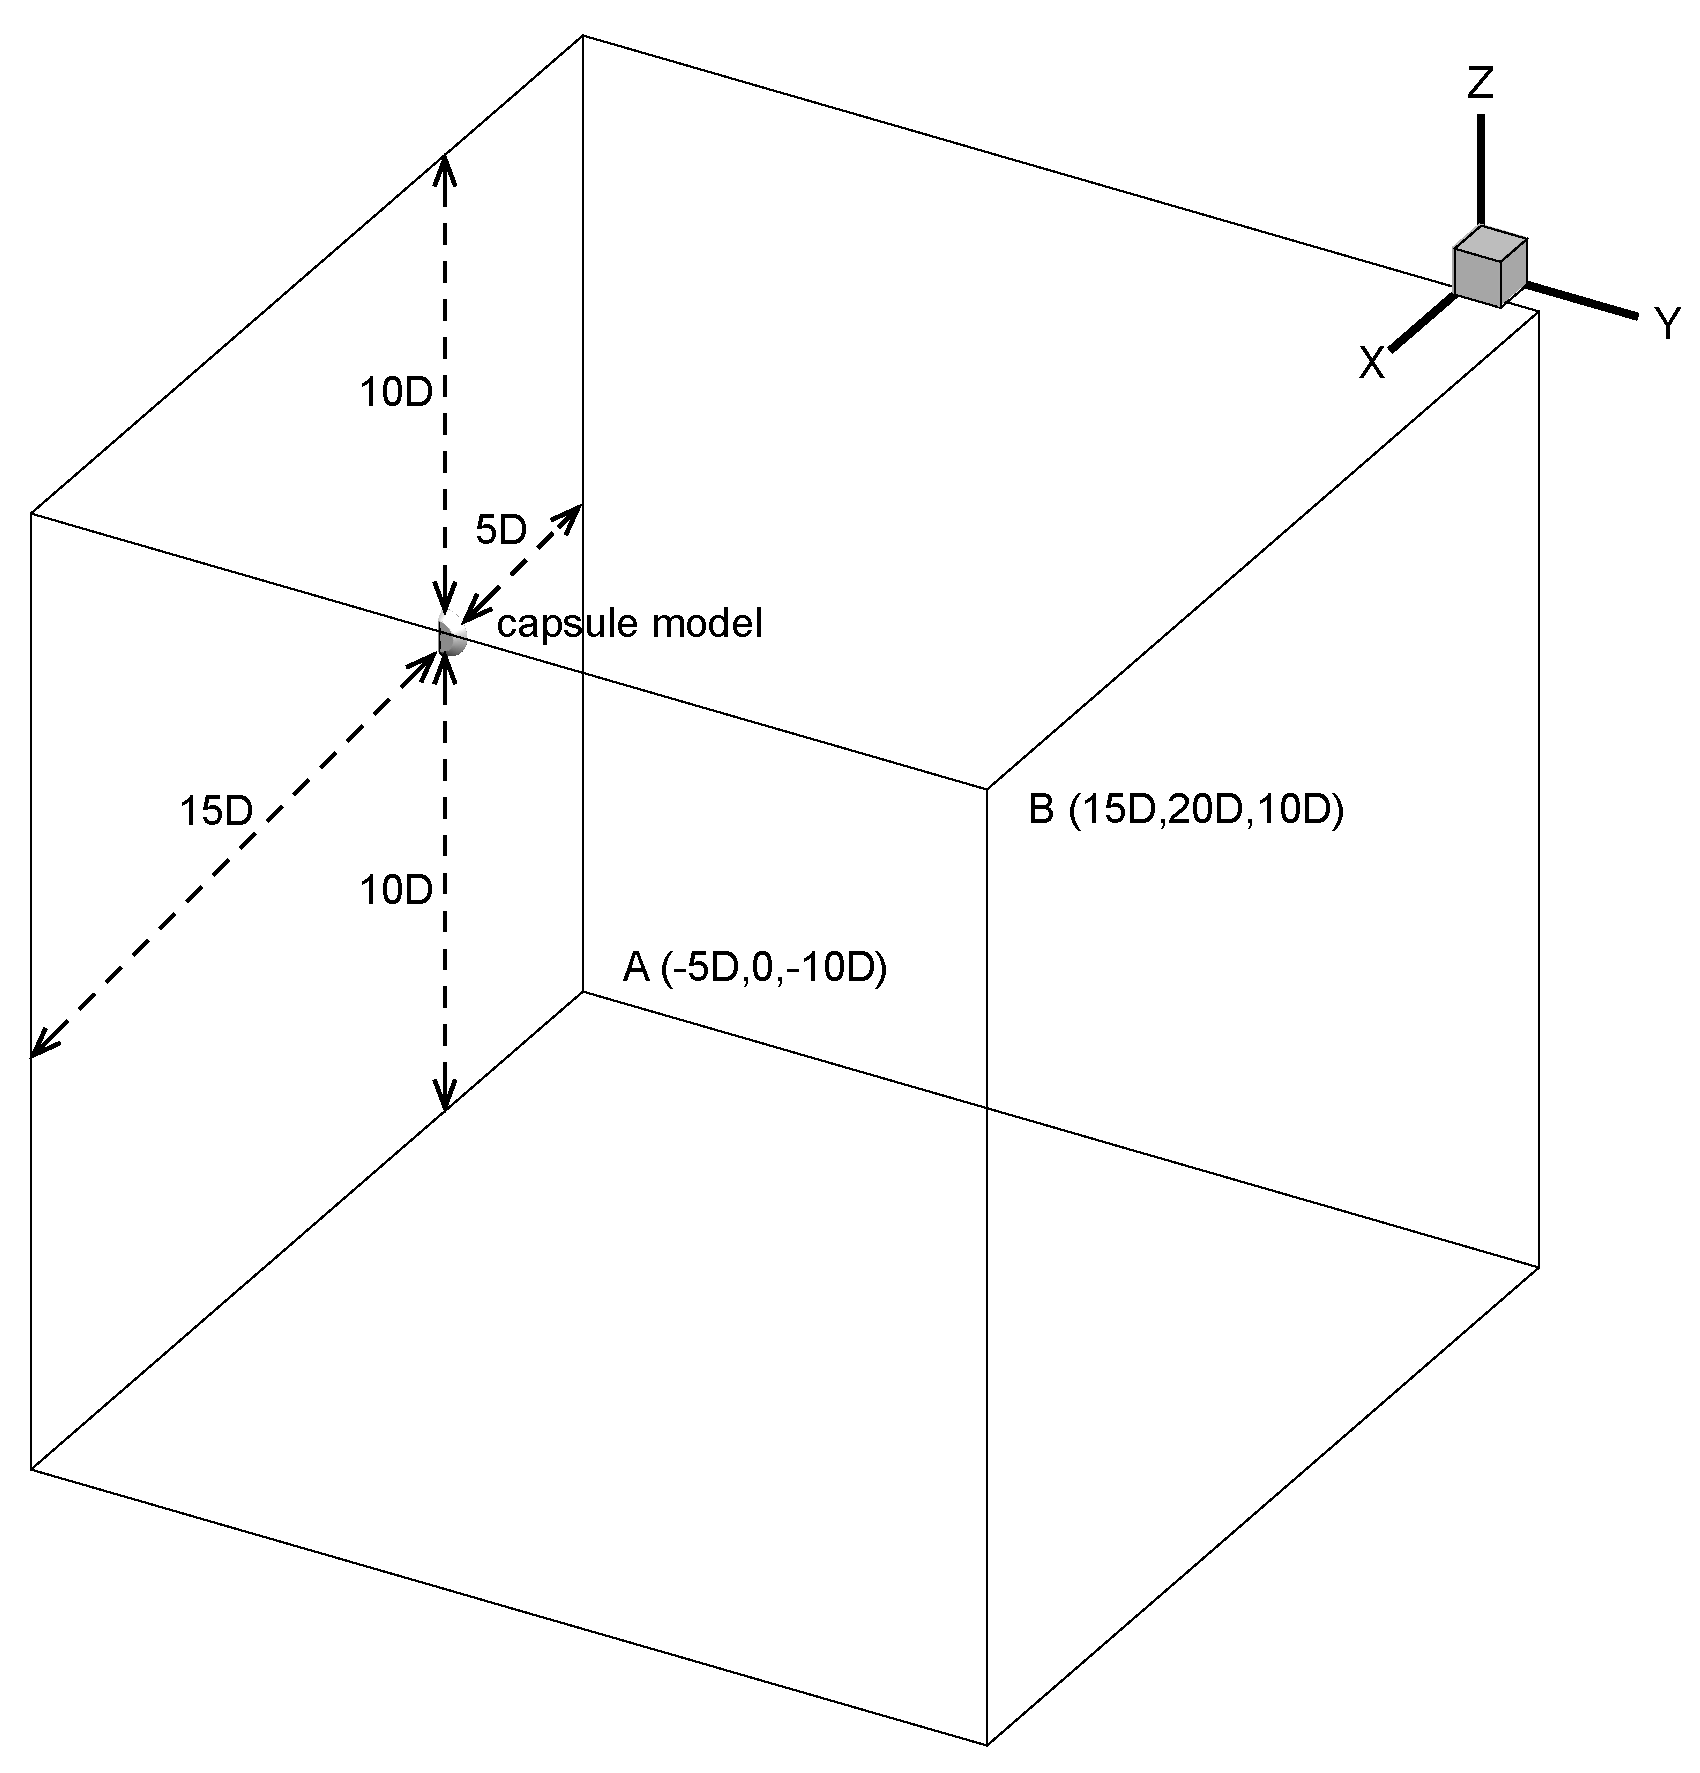
Figure 3 shows the computational domain for the present analyses. The computational domain was a 20D cube, where D is the diameter of the capsule, 400 mm. The cube was defined by two apexes, A and B, shown in Figure 3. In this domain, the center of the capsule is located at (0,0,0). Assuming the flow symmetry against the plane of y = 0, the symmetry condition is applied at the boundary plane of y = 0. At the boundary plane of x = 15D, the supersonic outflow condition is applied and at the other boundary planes, the supersonic inflow condition is applied. At the body surface, the adiabatic wall condition is applied.
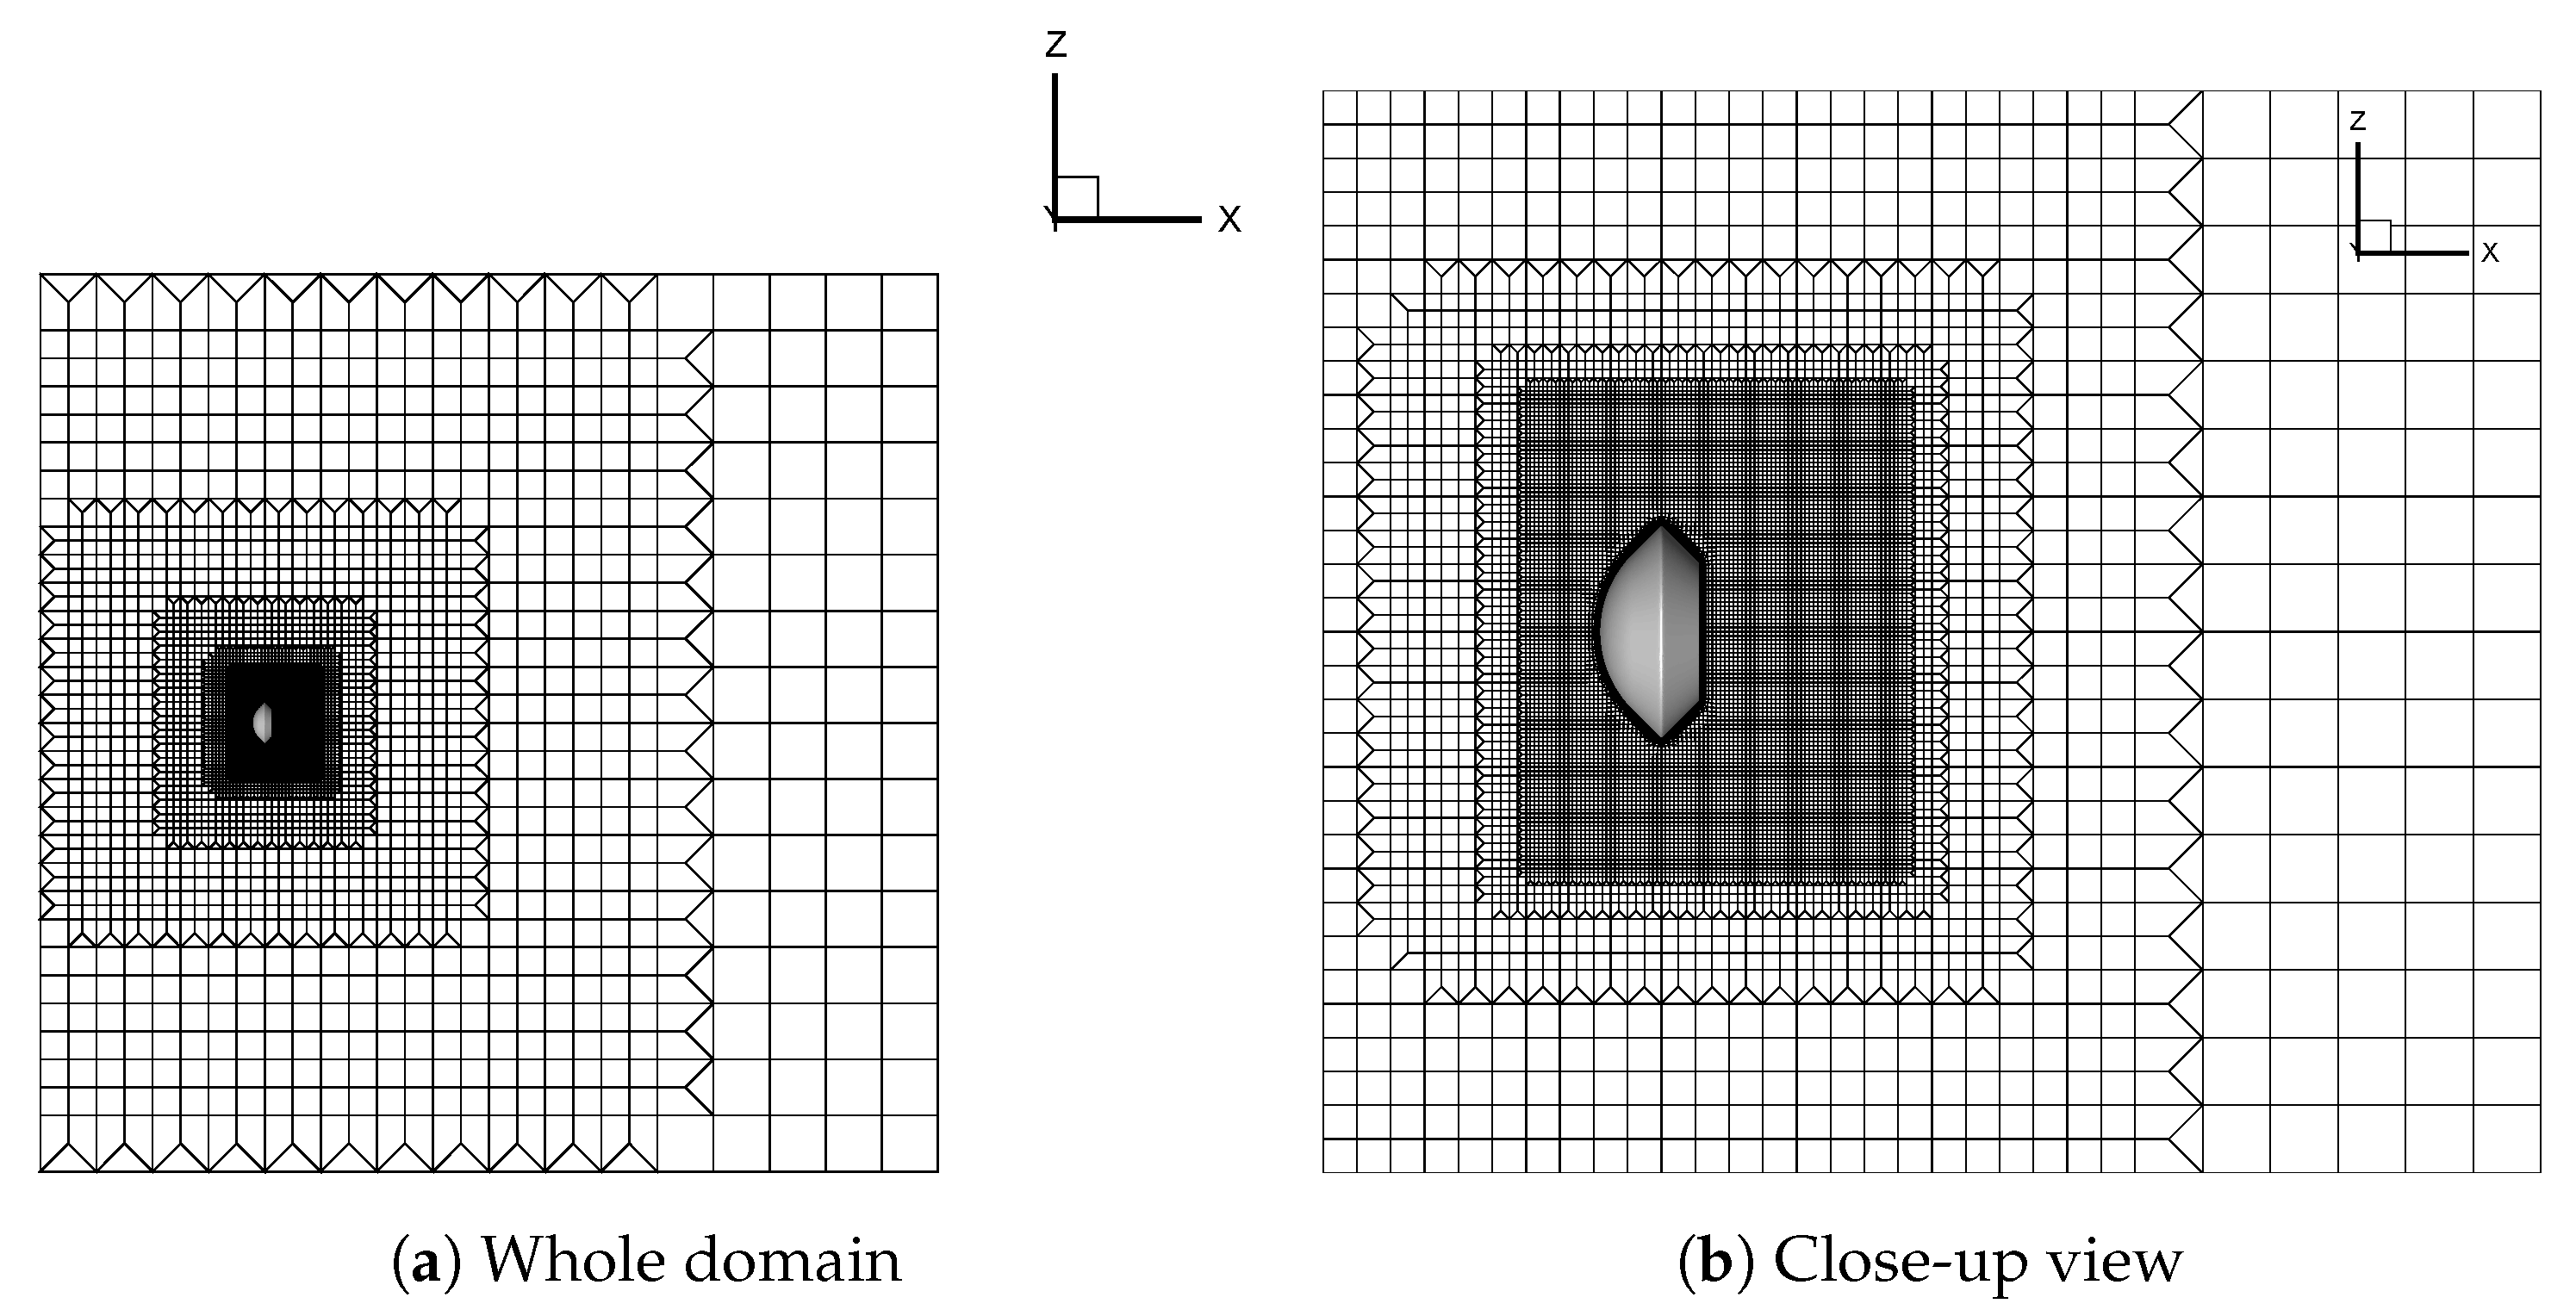
Figure 4 shows the computational grid around the capsule on the symmetry plane. Figure 4a,b show the whole computational domain and the close-up view, respectively. The length of each element near the capsule is set to be 10 mm. The minimum length of the computational grid on the body surface is set to be 0.1 mm to detect the boundary layer flow properties. The total number of cells, faces, and nodes of this computational grid are 963,596, 2,748,156, and 806,003, respectively. The effect of the grid resolution on the computational results is discussed in the next section.
4. Results and Discussions
4.1. Grid Study
In order to confirm the appropriate resolution of the computational grid CFD analyses were performed using a computational grid with different lengths of each element near the capsule. The minimum length of each element near the capsule is set as 20 mm (coarse grid), 10 mm (nominal grid), and 4 mm (fine grid). The free-stream Mach number, pressure, and temperature are set to 7.0, 1.0 kPa, and 250 K, respectively. The angle of attack (AoA) is set to 0 degrees.
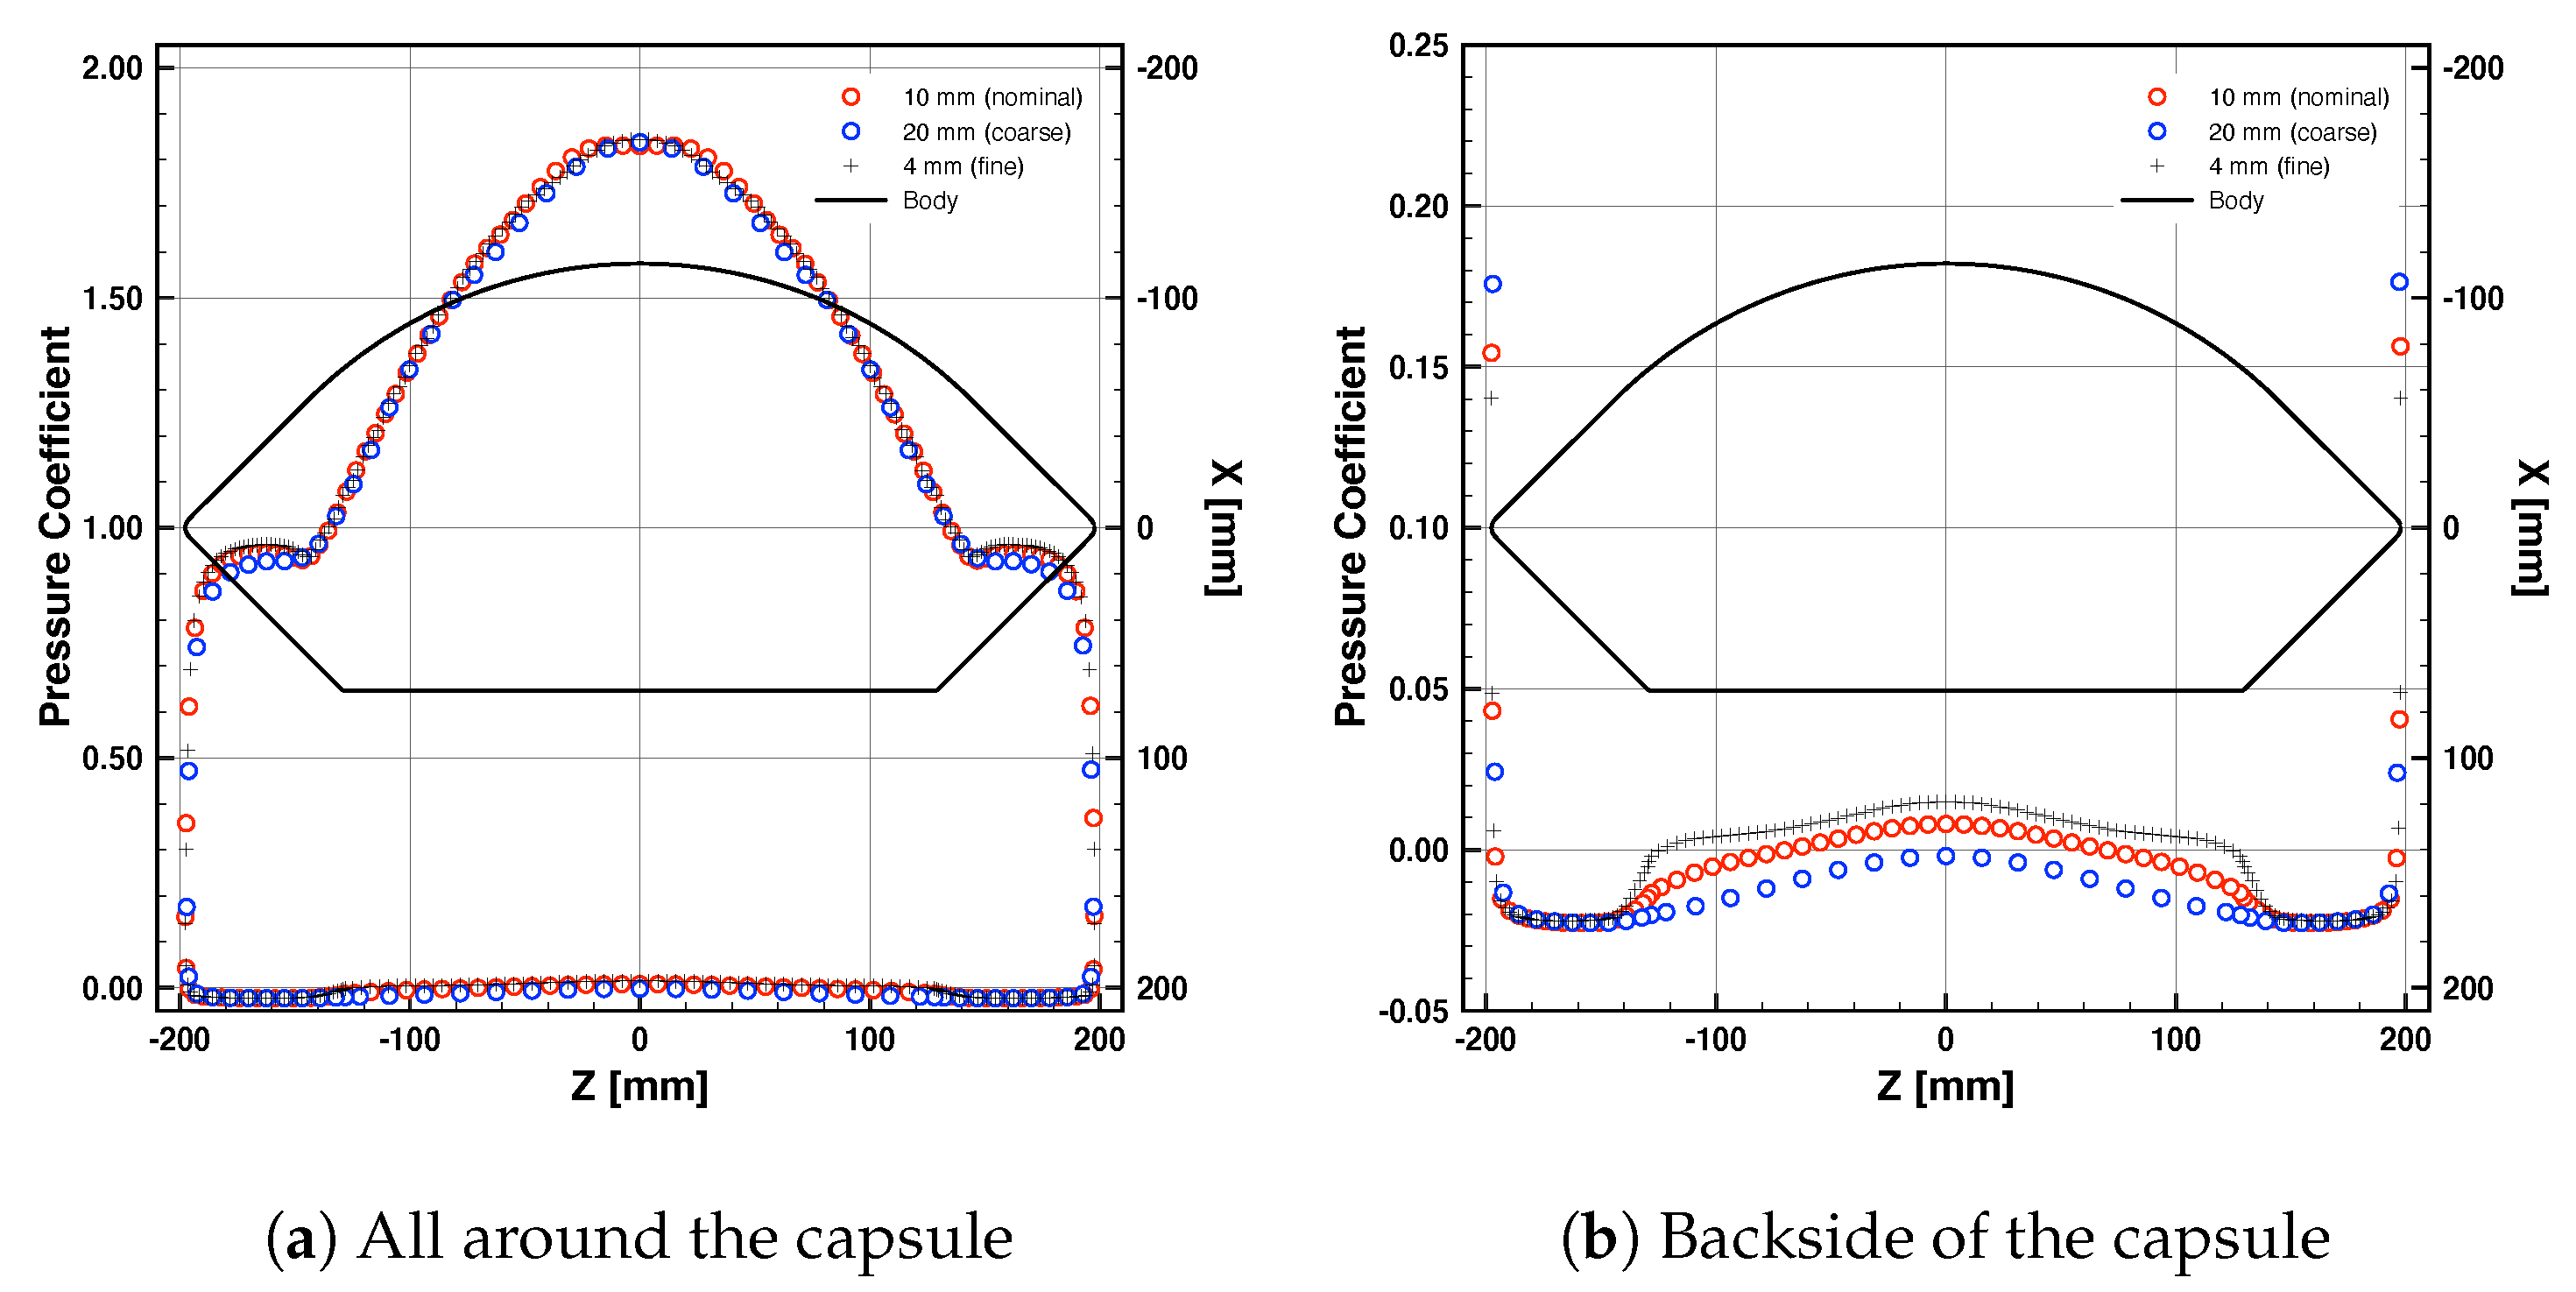
Figure 5 shows the pressure coefficient distribution around the Hayabusa capsule on the symmetry plane. Figure 5a,b show the distribution all around the capsule and the distribution on the backside of the capsule, respectively. From Figure 5a, it can be observed that the pressure coefficient distribution near the stagnation region (−140 mm < z < 140 mm) with all computational grids has similar results. This suggests that all grids can predict a correct pressure distribution. Near the shoulder region (z > 140 mm, z < −140 mm) the pressure coefficient with the coarse grid is lower than that with other grids. This suggests that the coarse grid can not predict a correct pressure distribution near the shoulder region. From Figure 5b, it can be observed that the pressure coefficient computed with the fine grid has the largest value, and as the grid density decreases the pressure coefficient becomes small. The difference in the pressure coefficient between the fine grid and the nominal grid is smaller than that between the fine grid and the coarse grid. The calculated drag coefficients and the number of computational cells with all grids are summarized in Table 1. The drag coefficients normalized by the value with the fine computational grid are also shown.
From this table, it can be observed that the drag coefficient with the fine grid has the largest value. The difference of the drag coefficient between the fine grid and the nominal grid is about 0.5% and the difference between the fine grid and the coarse grid is about 1.7%. From this assessment, I confirmed that the nominal grid had a sufficiently good resolution for estimating the pressure distribution and the drag coefficient. Thus, in the following analyses, the nominal computational grid was used.
4.2. Pressure Distribution
In this section, the pressure distribution for the re-entry capsule with hyperbolic contours was investigated using CFD analyses. The flow condition is the same as the condition used in the above section. The free-stream static pressure is 1.0 kPa, which corresponds to an altitude of about 30 km. The Reynolds number based on the free stream flow condition and the base diameter of the capsule is .
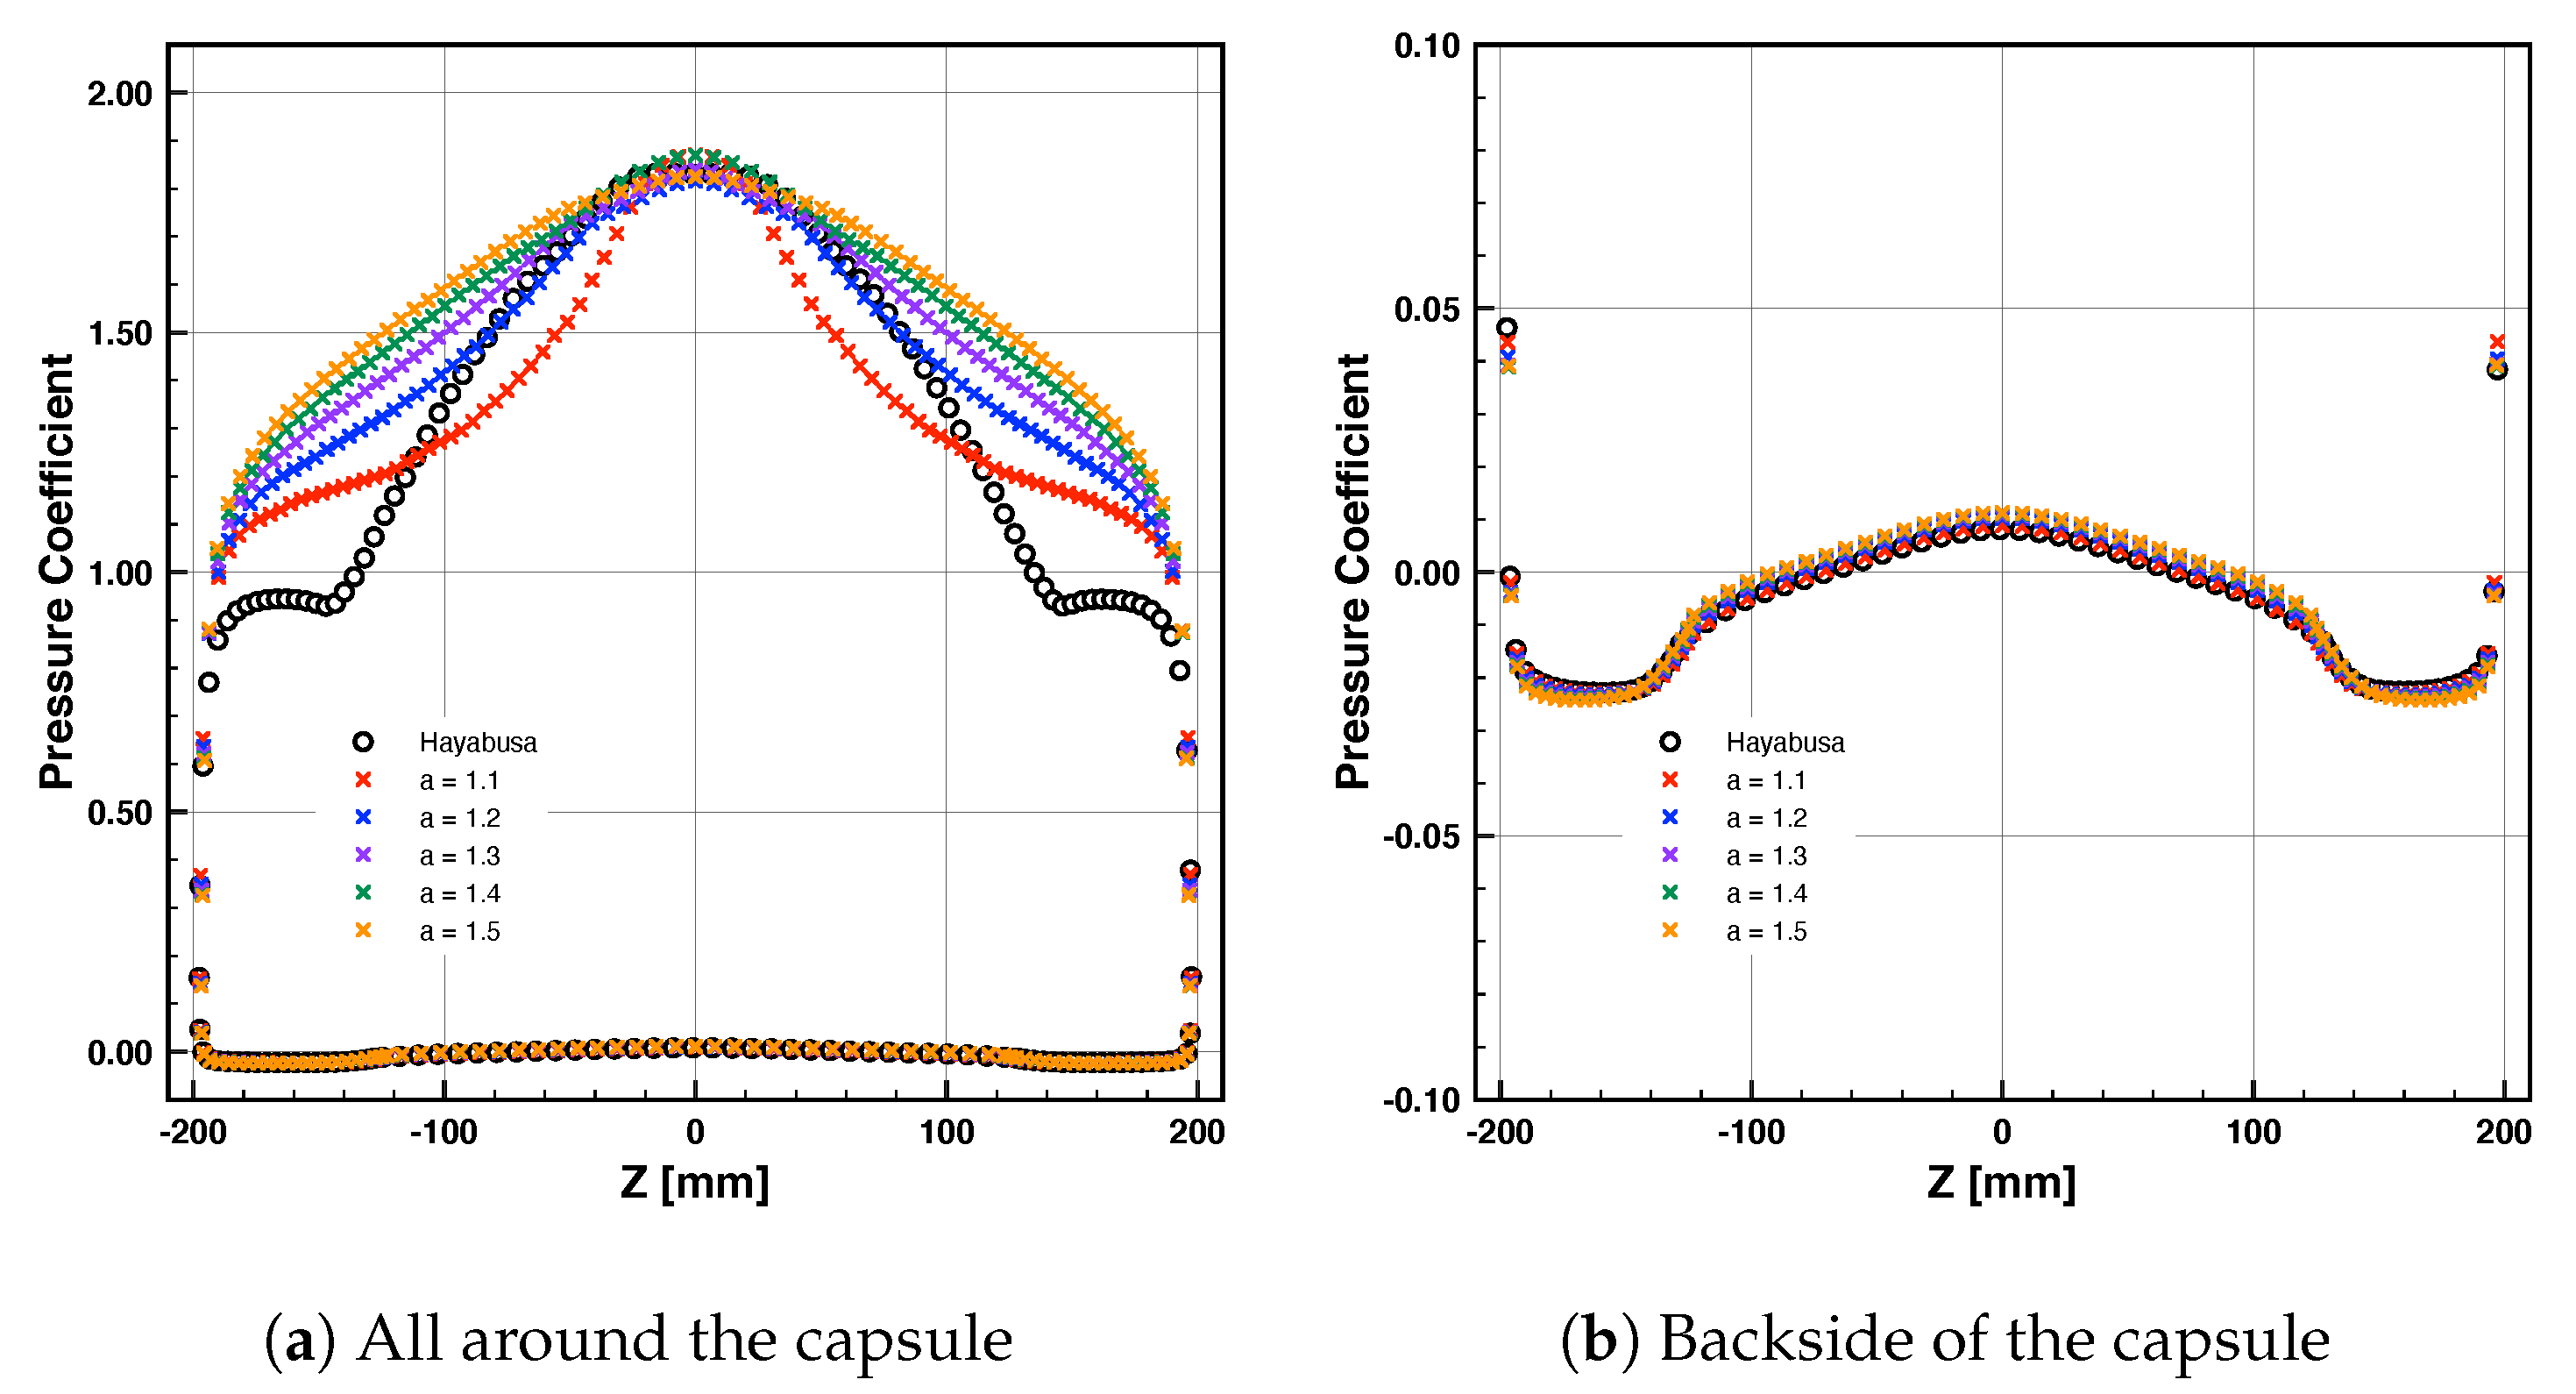
Figure 6 shows the pressure coefficient distribution around the re-entry capsules with hyperbolic contours on the symmetry plane. Figure 6a,b show the distribution all around the capsule and the distribution on the backside of the capsule, respectively. The angle of attack (AoA) is set to 0 degrees. From Figure 6a, it can be observed that when the parameter a of Equation (2) is 1.1 the pressure coefficient near the stagnation region is smaller than that of the Hayabusa capsule but near the shoulder region the pressure coefficient of hyperbolic contours is larger than that of the Hayabusa capsule. When the parameter a is 1.2, the pressure coefficient near the stagnation region is almost the same as that of the Hayabusa capsule. As the parameter a becomes large the pressure coefficient on the forebody of the capsule becomes large. These results suggest that as the parameter a becomes large the drag coefficient becomes large at AoA of 0 degrees. From Figure 6b, it can be observed that regardless of the parameter a the pressure coefficient distributions for all cases are almost the same. These results suggest that the parameter a does not affect the pressure distribution on the backside of the capsule significantly.
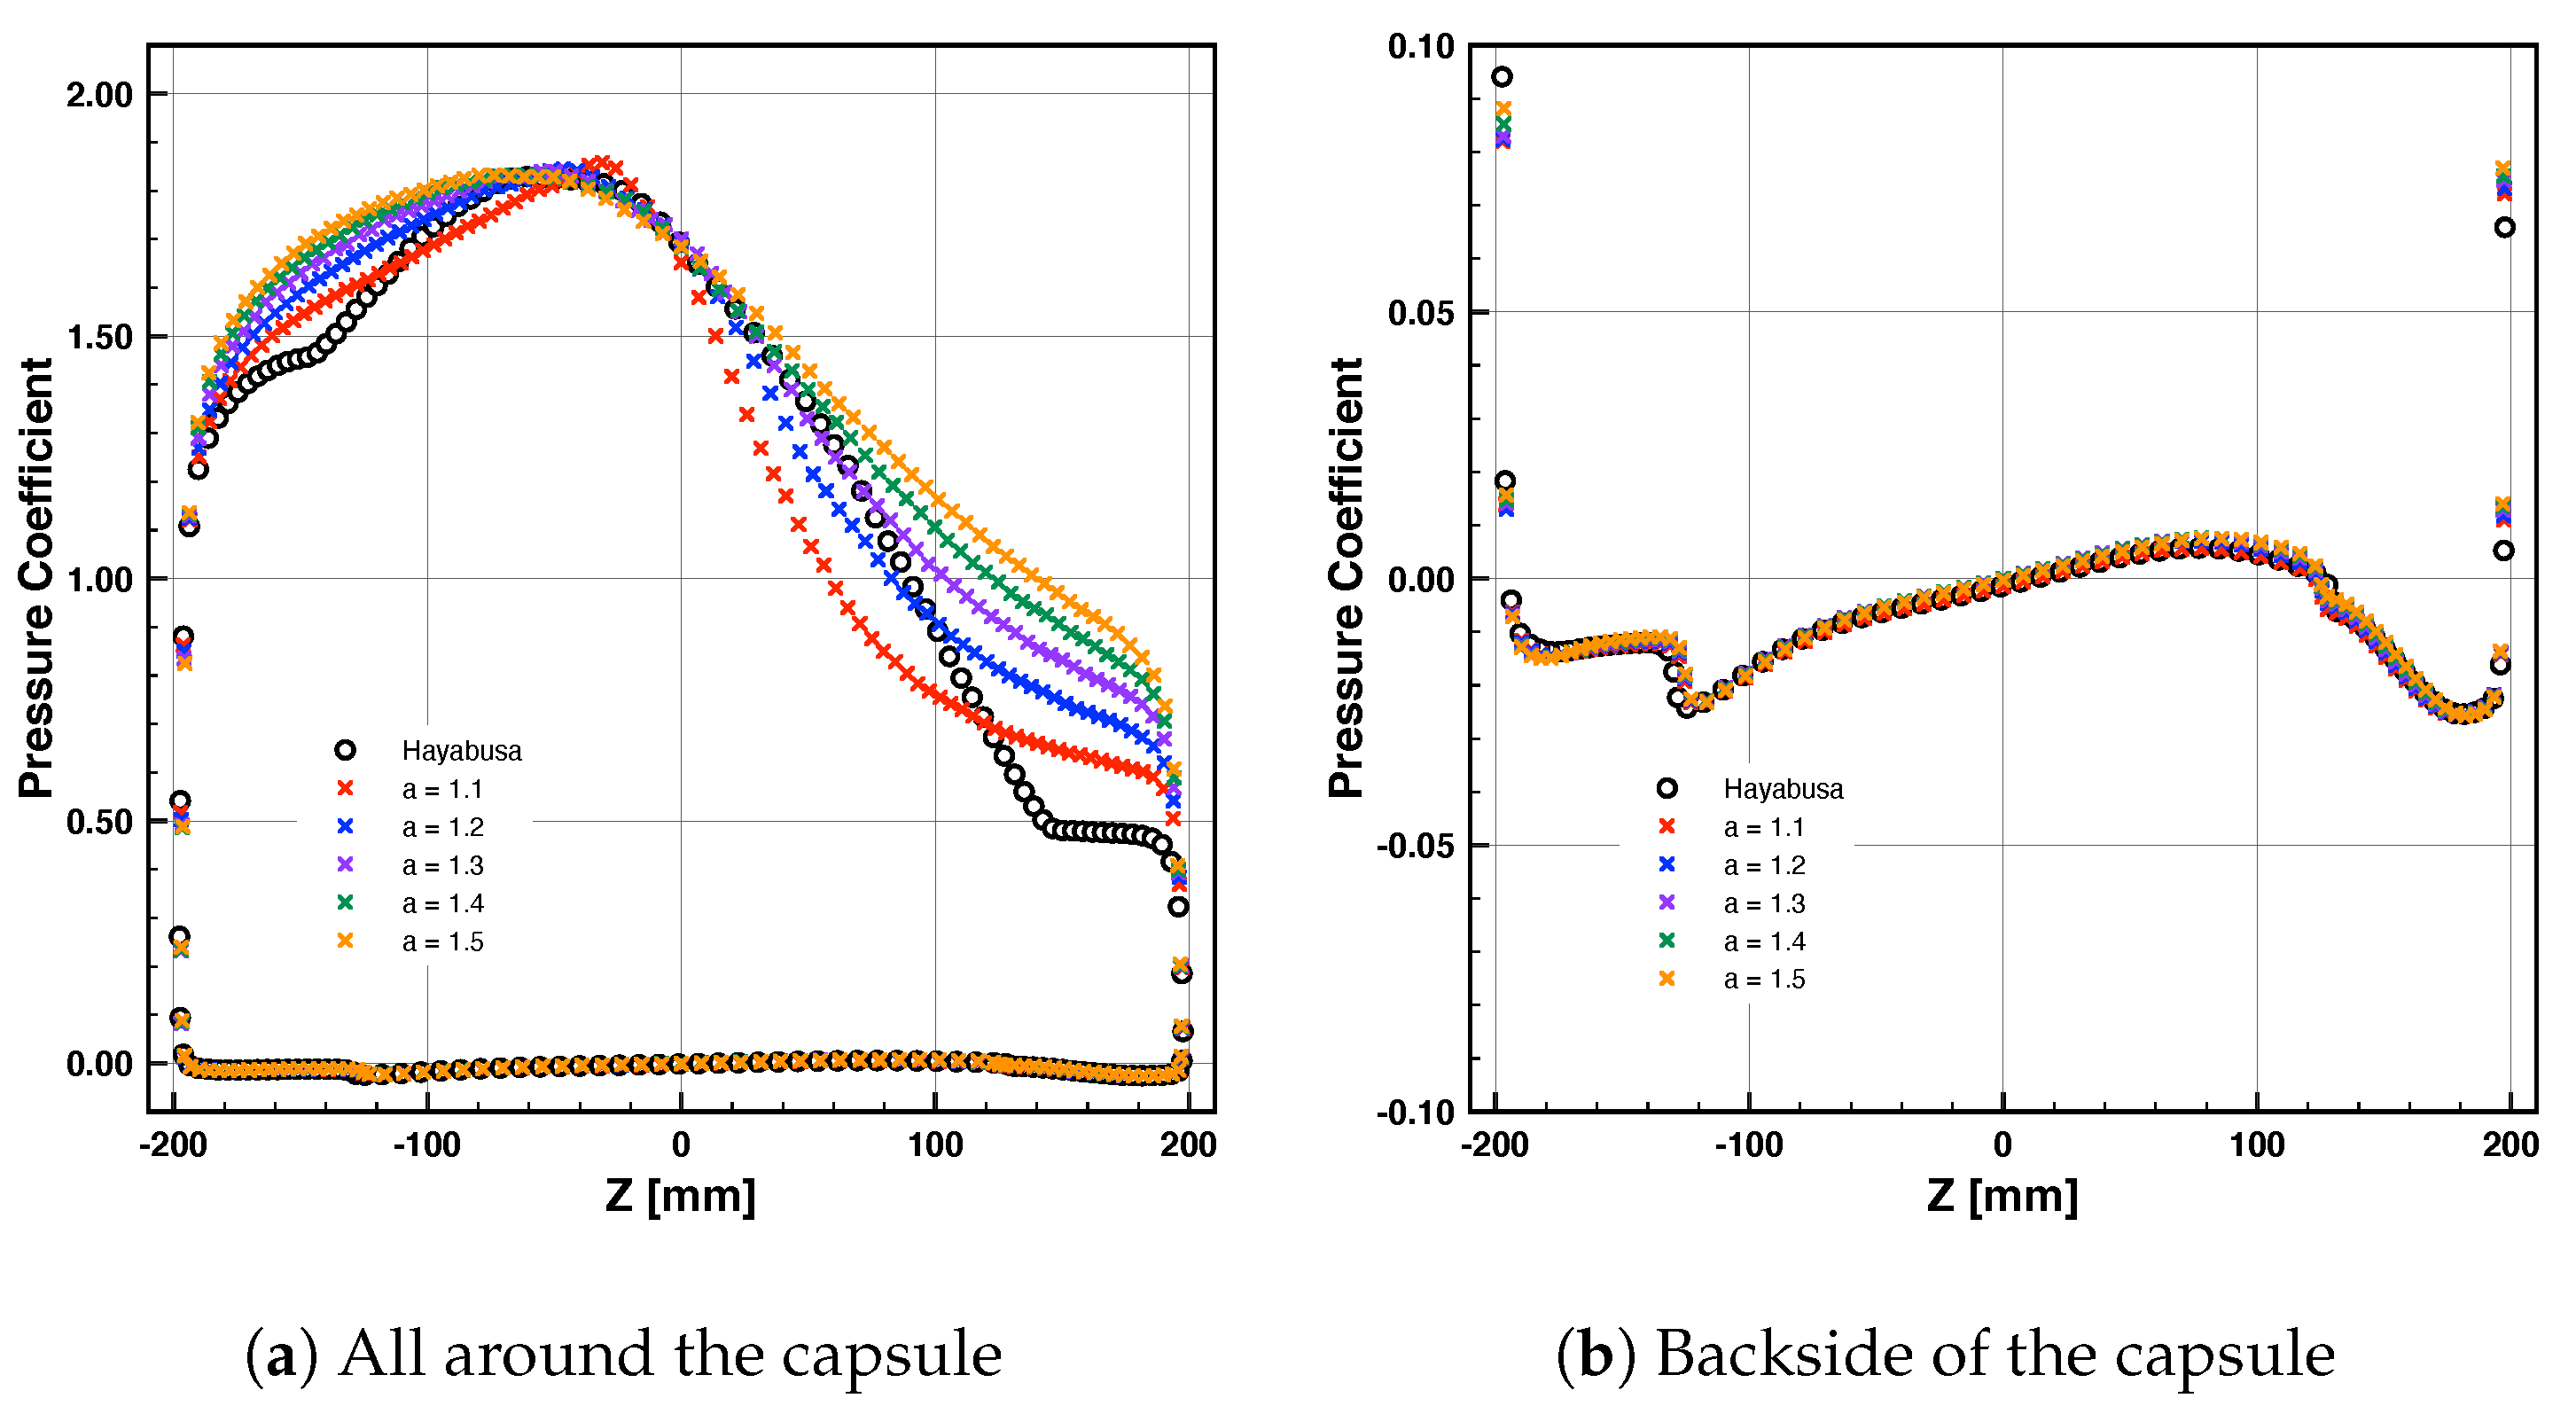
Figure 7 shows the pressure coefficient distribution at an AoA of 15 degrees. Figure 7a,b show the distribution all around the capsule and on the backside of the capsule, respectively. From Figure 7 it can be observed that on the windside (z < −50 mm) the pressure coefficient was larger than that of the Hayabusa capsule when the parameter a was greater than 1.1. On the leeside (z > −50 mm) the pressure coefficient was larger than that of the Hayabusa capsule when the parameter a was greater than 1.2. These results suggest that when the parameter a is greater than 1.2 the drag coefficient will become larger than that of the Hayabusa capsule. From Figure 7b, it can be observed that regardless of the parameter a the pressure coefficient distributions for all cases are almost the same. These trends are almost similar to that with AoA of 0 degrees.
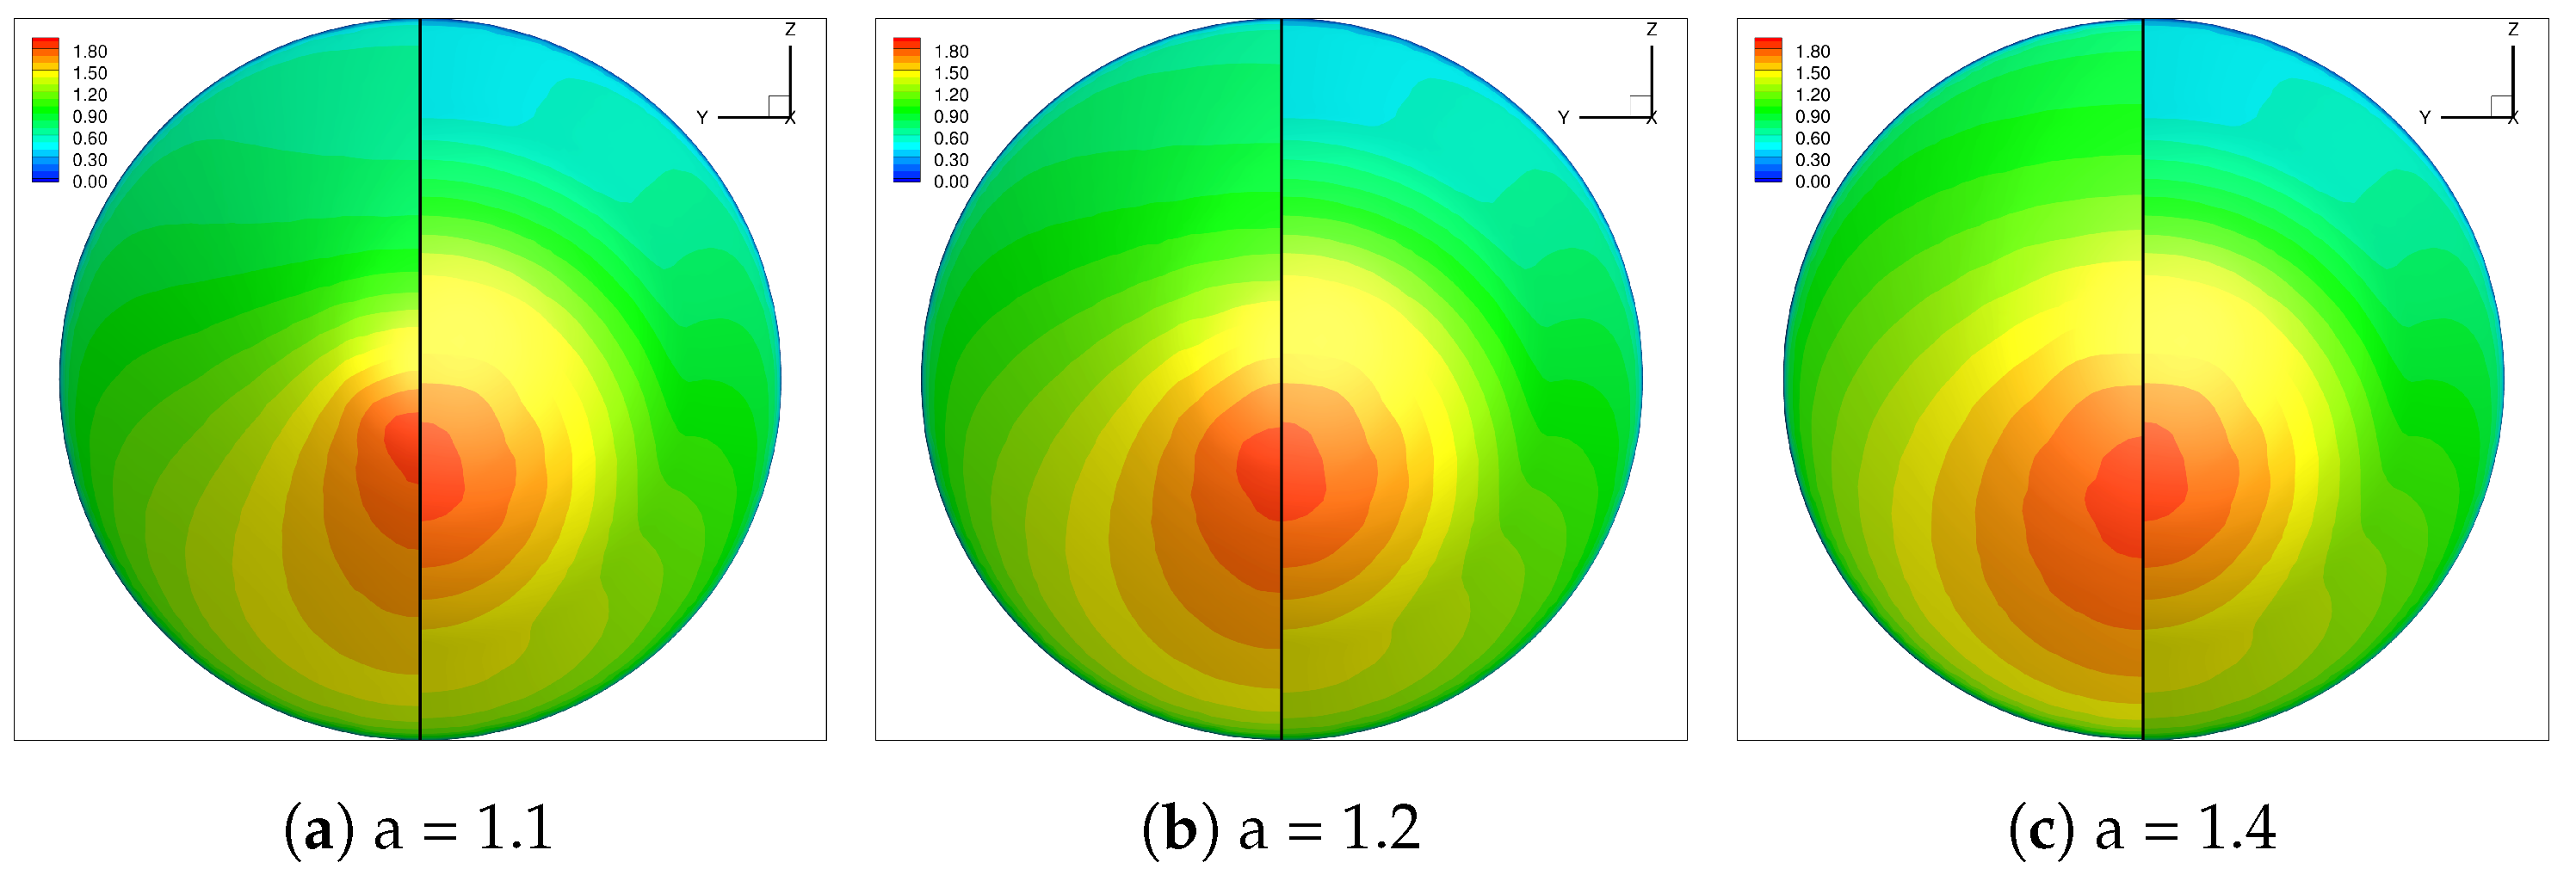
Figure 8 shows the pressure coefficient distribution on the forebody of the re-entry capsules with hyperbolic contours at AoA of 15 degrees. For comparison, that of the Hayabusa capsule is also shown on the right half of each figure. From Figure 8a–c, it can be observed that the stagnation point shifted downward and as the parameter a increased, the high-pressure region was enlarged not only on the symmetry line but also on the whole region of the forebody of the capsule. These results suggest that the shape of the forebody of the capsule with hyperbolic contours will help to enhance the drag force of the capsule.
4.3. Aerodynamic Characteristics
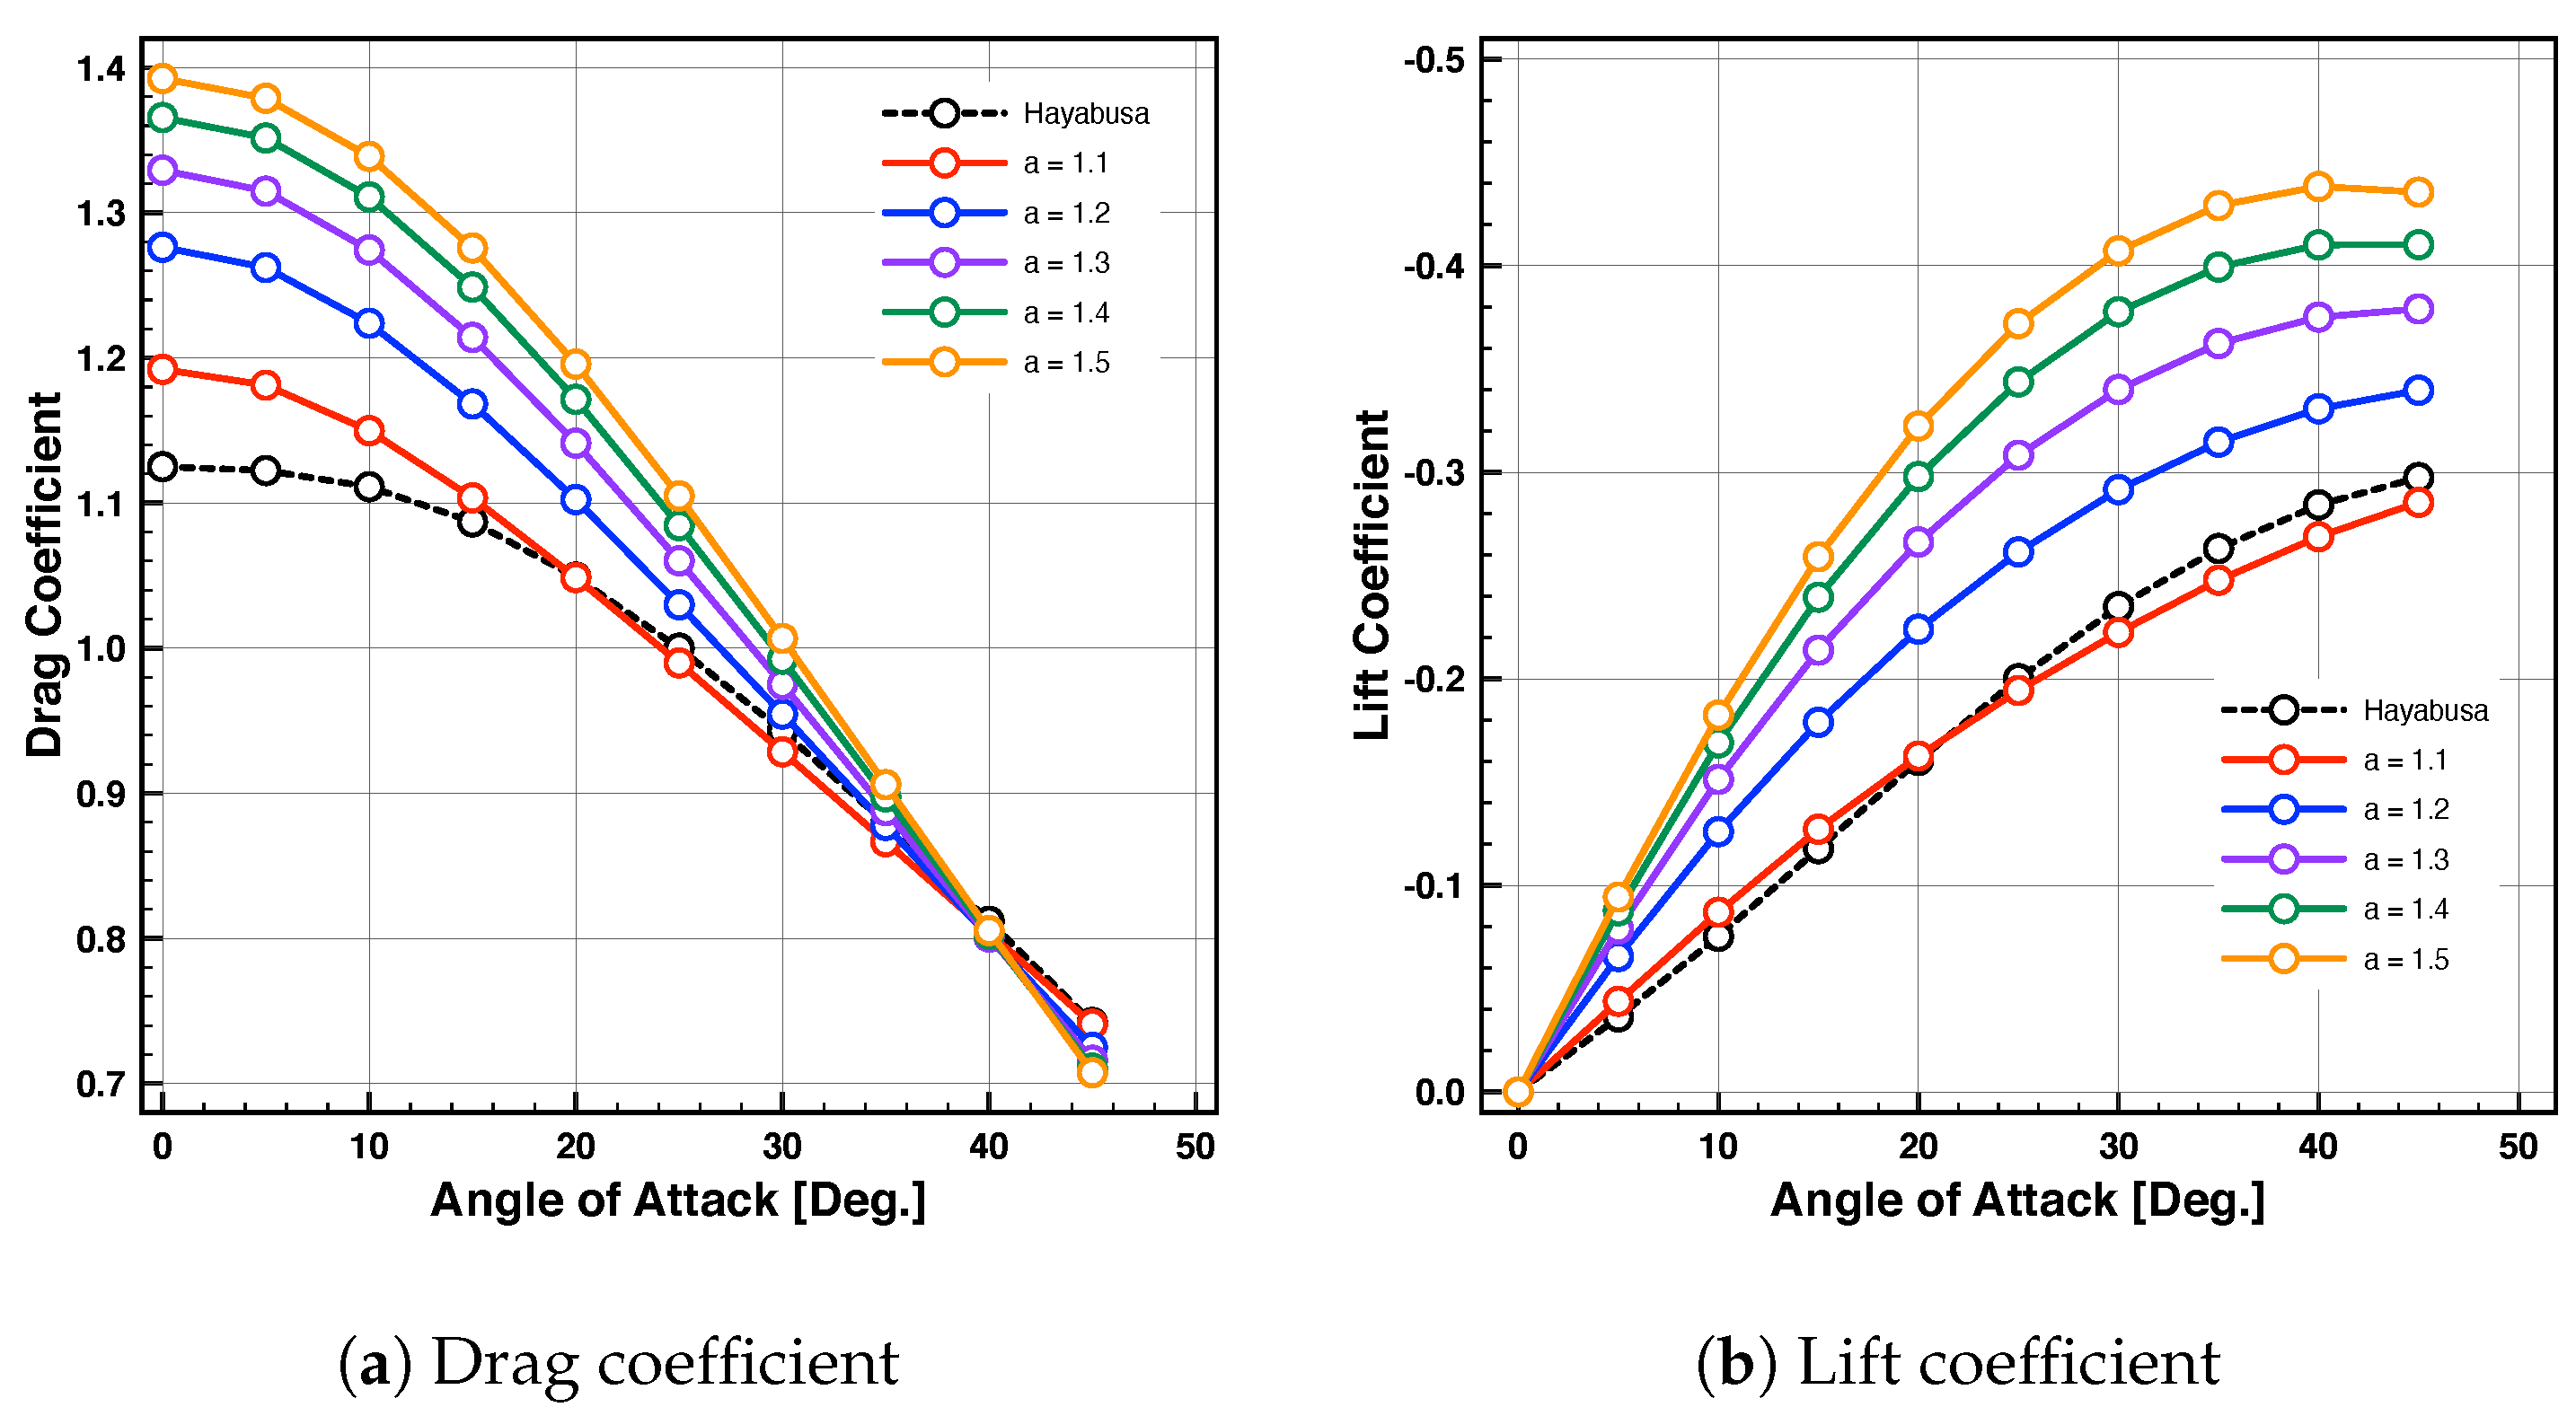
The aerodynamic characteristics are summarized in Figure 9. Figure 9a shows the comparison of the drag coefficients for hyperbolic contours. From this figure, it can be observed that the drag coefficients for all the hyperbolic contours are larger than that of the Hayabusa capsule at an AoA of 0 degrees. This result suggests that the drag coefficient can be increased using hyperbolic contours.
Figure 9b shows the comparison of the lift coefficients for hyperbolic contours. In the present study, when the angle of attack is positive, the nose of the capsule is defined to rotate about the y-axis in the clockwise direction. From this figure, it can be observed that when the parameter a is 1.1, the trend of the relationship between the lift coefficient and AoA is almost similar to that of the Hayabusa capsule and as the parameter a increased the lift coefficient increased. This results suggest that that the lift coefficient also can be increased using the hyperbolic contours.
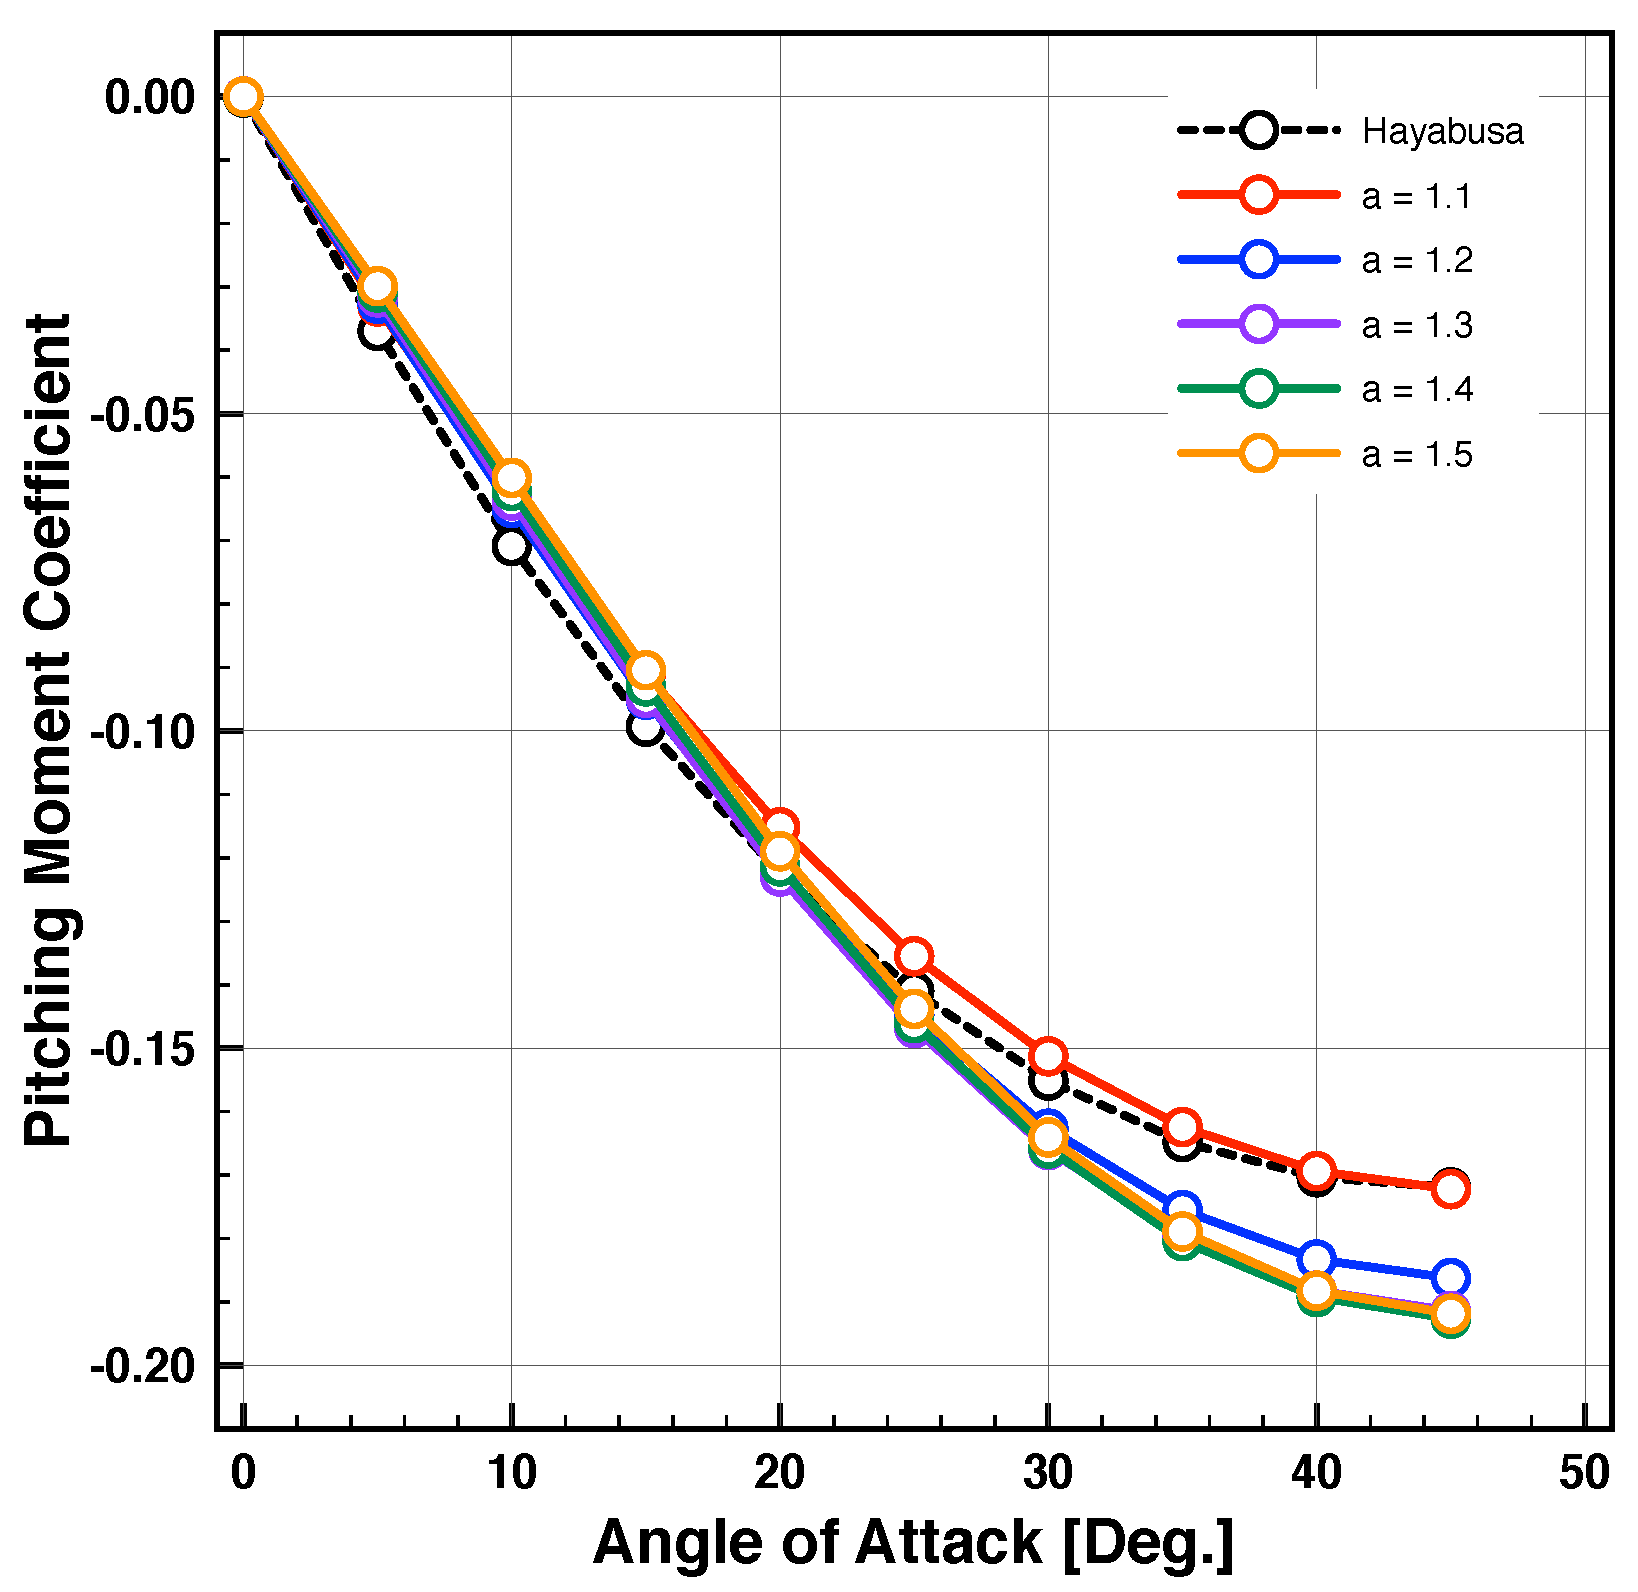
Figure 10 shows the comparison of the pitching moment coefficients for hyperbolic contours. In this calculation, the center of gravity (C.G.) is set at (0,0,0) for all capsules. From this figure, it can be observed that the slope of the curve of the Hayabusa capsule is larger than that of hyperbolic contours. This suggests that the static longitudinal stability of the Hayabusa capsule is better than that of hyperbolic contours. However, the difference among all cases is not so significant. Thus, the difference between the Hayabusa capsule and hyperbolic contours can be cured by shifting C.G.
The dynamic stability of the capsule is also an important point to be discussed. The unstable motion of the capsule was observed mainly at transonic speeds. The dynamic stability of the Hayabusa capsule was investigated at transonic speeds using unsteady CFD analyses [12]. In this study, I focused on the aerodynamics of the capsule at hypersonic speeds. Thus, the dynamic stability of the capsule with hyperbolic contours at transonic speeds will be investigated in the future.
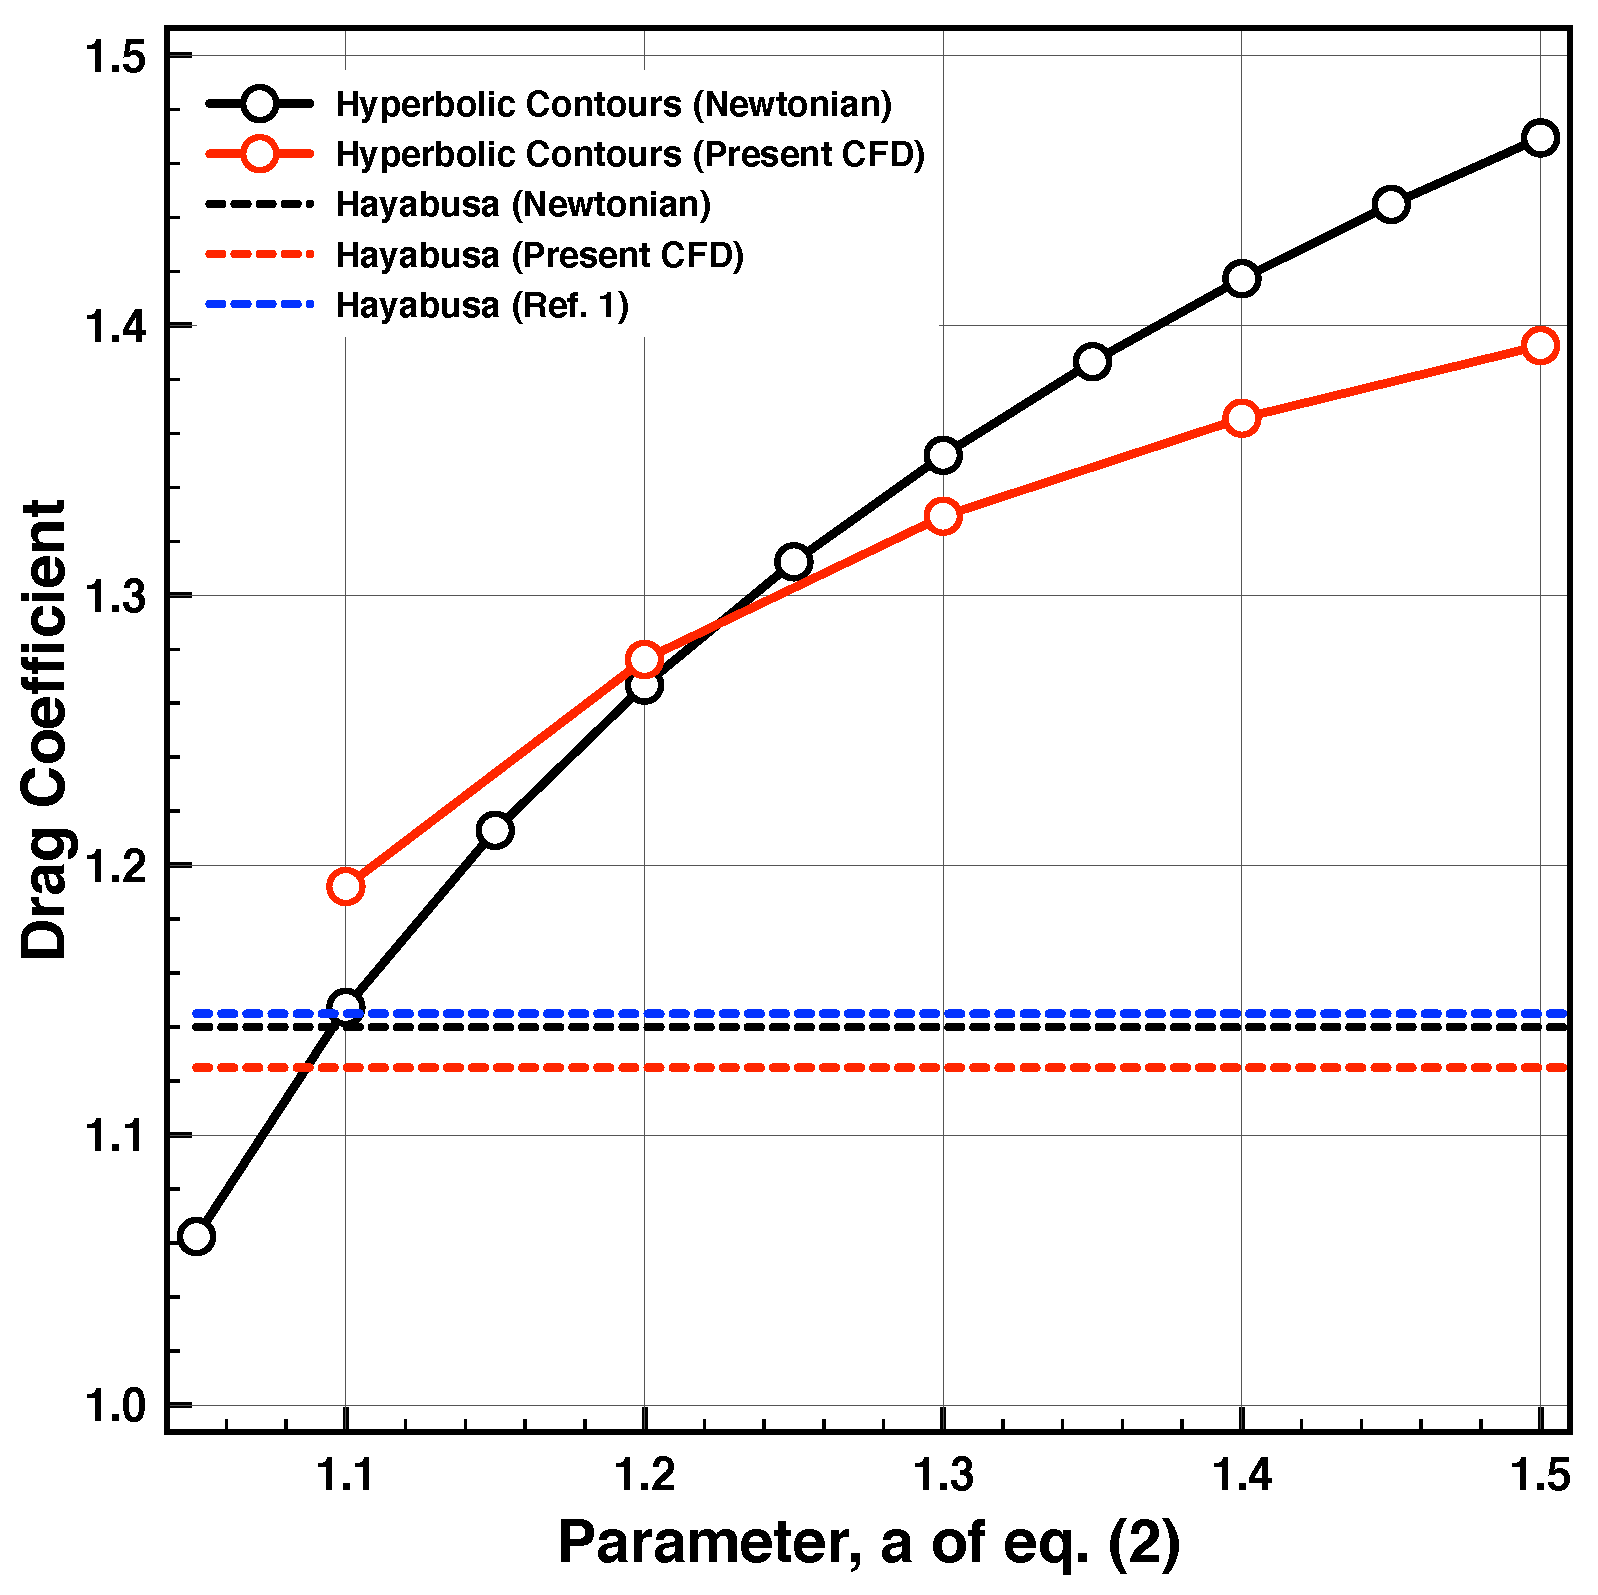
Figure 11 shows the effect of the parameter of hyperbolic contours on the drag coefficients at AoA of 0 degrees. The results of Figure 2 are also shown in the same figure for comparison. From this figure, it can be observed that as the parameter a increased the drag coefficient increased up to about 1.4. This suggests that the aerodynamic characteristics can be improved using the present hyperbolic contours from the viewpoint of the drag and lift coefficients.
4.4. Comparison of Volume and Stagnation Point Heat Flux
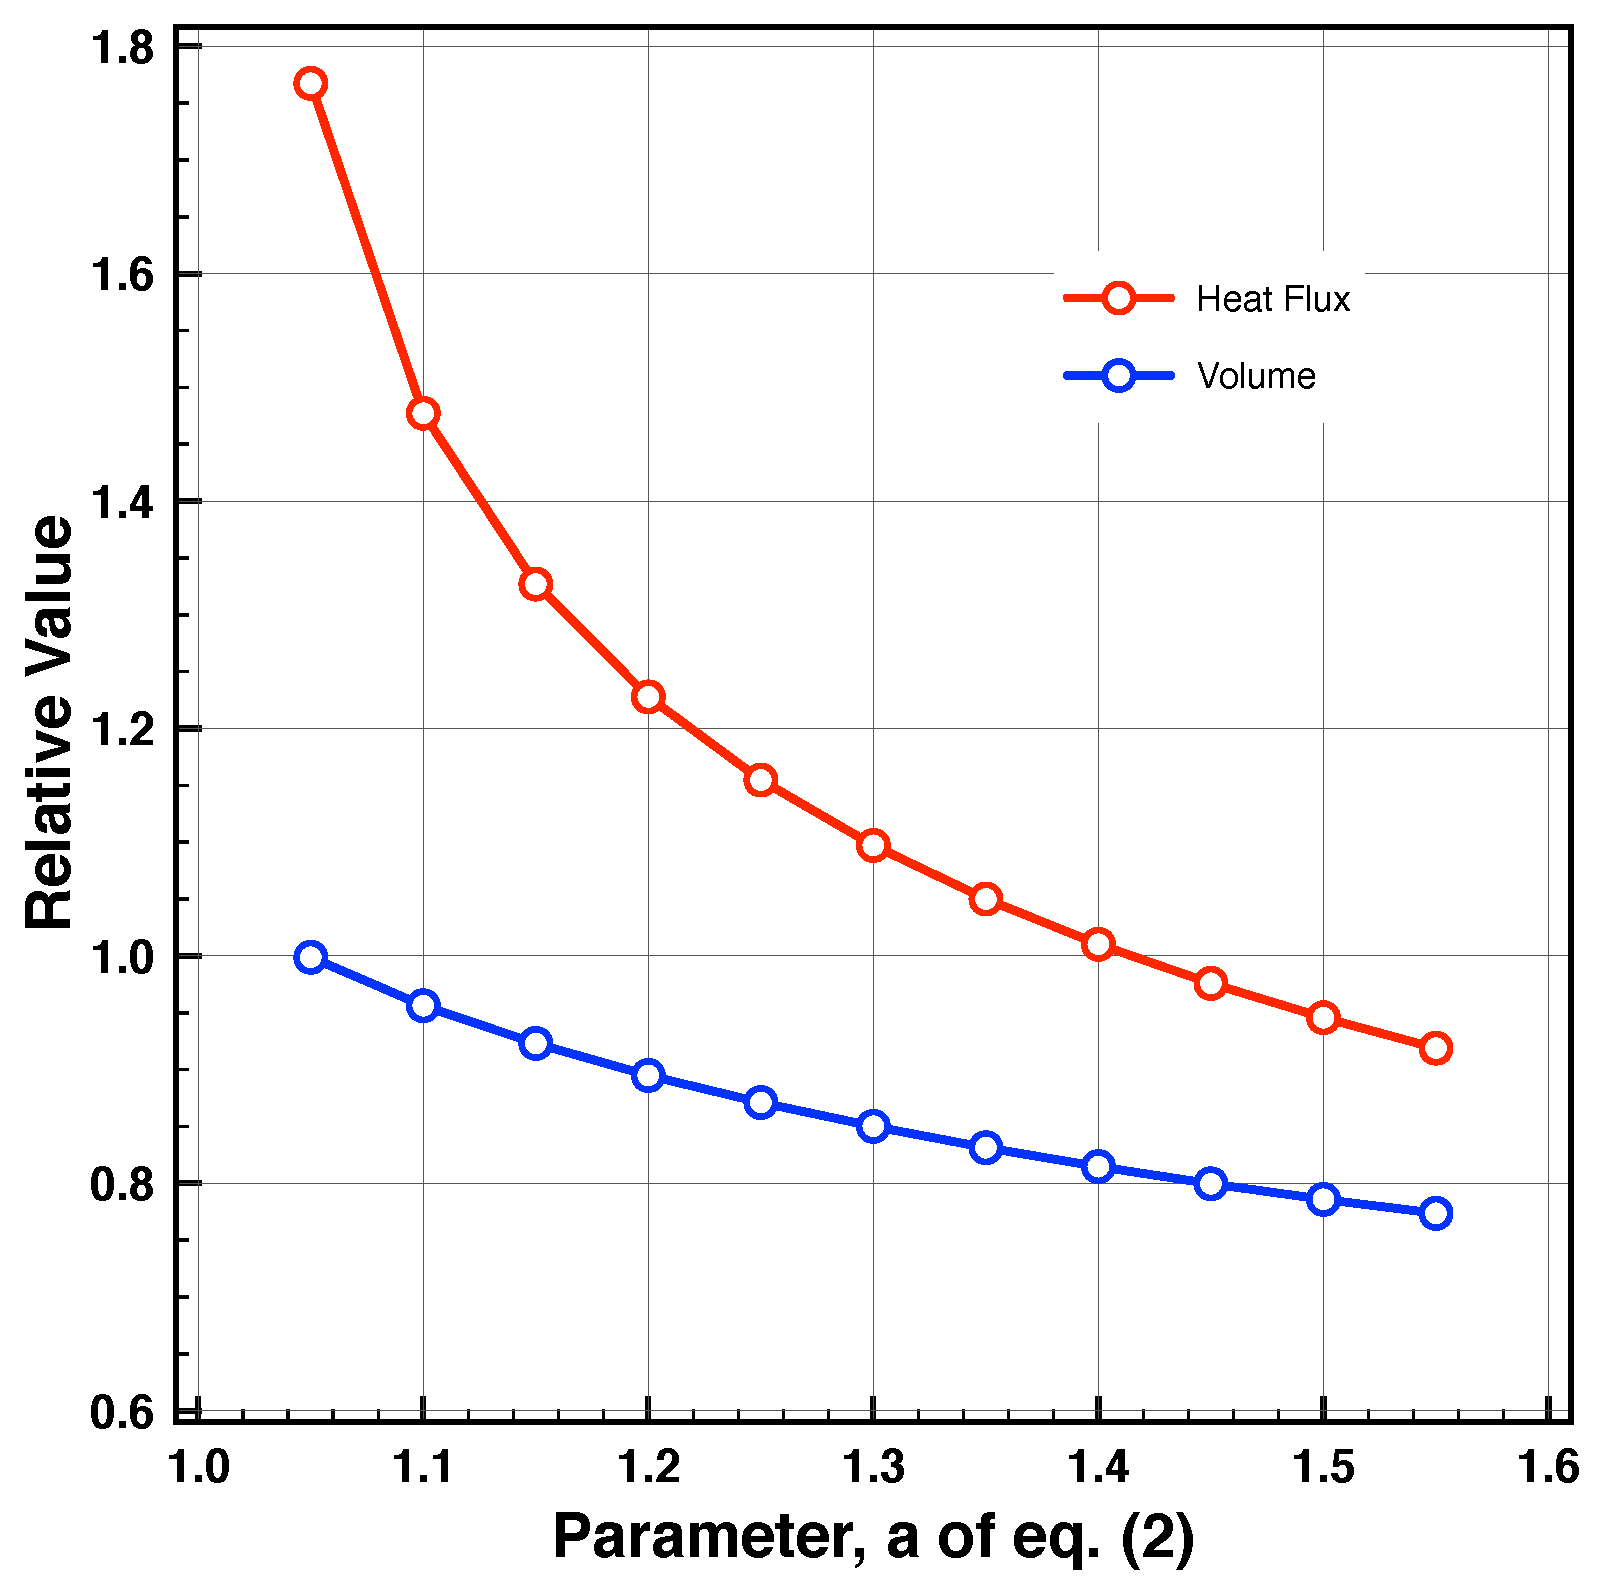
The shape of the capsule should be designed so that the payload must be stored inside the capsule. This means the larger volume inside the capsule should be better from the viewpoint of the payload. Additionally, as the parameter a increased the effective nose radius, , is also increased. The stagnation point heat flux changes depending on . This means the larger nose radius is better from the viewpoint of heat flux. Thus, the effect of the parameter a on the volume and heat flux was investigated. Figure 12 shows the relative values of the volume and the stagnation point heat flux for the capsules with hyperbolic contours. The volume is normalized by that of the Hayabusa capsule and the stagnation point heat flux is estimated by . From Figure 12, it can be observed that as the parameter a increases the volume of the capsule and the stagnation point heat flux decreases. This means that from the viewpoint of the volume the parameter a should be small. On the other hand, from the viewpoint of the stagnation point heat flux and the aerodynamic characteristics, the larger value of the parameter a is better. This suggests that the shape of the capsule with hyperbolic contours can be optimized by trading the aerodynamic characteristics, the stagnation point heat flux, and the volume of the capsule.
5. Conclusions
In this study, the aerodynamic characteristics of a re-entry capsule with hyperbolic contours were investigated by CFD analyses. As a result, the following findings were obtained.
- The drag and lift coefficients can be increased when compared to the Hayabusa capsule.
- The static longitudinal stability was not affected significantly.
From the above results, instead of the blunted nose cone, the hyperbolic contours can be utilized to design the shape of the forebody of the re-entry capsule. By taking account of the aerodynamic characteristics and the volume of the capsule, we will be able to design the optimum shape of the capsule with hyperbolic contours.
Funding
This research received no external funding.
Institutional Review Board Statement
Not applicable.
Informed Consent Statement
Not applicable.
Data Availability Statement
The data presented in this study are available on request from the corresponding author.
Acknowledgments
For CFD analyses in this study, I used the 3D unstructured grid flow solver, FaSTAR, which was developed at JAXA. The grid generator, HexaGrid, was also developed at JAXA. Both pieces of software were kindly provided by JAXA. I would like to thank for their support.
Conflicts of Interest
The author declares no conflict of interest.
References
- Detra, R.W.; Kemp, N.H.; Riddell, F.R. Addendum to Heat Transfer to Satellite Vehicles Reentering the Atmosphere. Jet Propuls. 1957, 27, 1256–1257. [Google Scholar]
- Anderson, J.D., Jr. Hypersonic and High-Temperature Gas Dynamics, 3rd ed.; AIAA Education Series; AIAA: Reston, VA, USA, 2019. [Google Scholar]
- Suzuki, K.; Abe, T. Transonic, Supersonic, and Hypersonic Wind-Tunnel Tests on Aerodynamic Chracteristics of Reentry Body with Blunted Cone Configuration; ISAS Report No. 658; Institute of Space and Astronautical Science: Sagamihara, Japan, 1995. [Google Scholar]
- Neville, A.G.; Candler, G.V. Computational-Fluid-Dynamics-Based Axisymmetric Aeroshell Shape Optimization in Hypersonic Entry Conditions. J. Spacecr. Rocket. 2015, 52, 76–88. [Google Scholar] [CrossRef]
- Seager, C.; Agarwal, R.K. Hypersonic Blunt-Body Shape Optimization for Reducing Drag and Heat Transfer. J. Thermophys. Heat Transf. 2017, 31, 48–55. [Google Scholar] [CrossRef]
- Theisinger, J.E.; Braun, R.D. Multi-Objective Hypersonic Entry Aeroshell Shape Optimization. J. Spacecr. Rocket. 2009, 46, 957–966. [Google Scholar] [CrossRef]
- Ishii, N.; Yamada, T.; Hiraki, K.; Inatani, Y. Reentry Motion and Aerodynamics of the MUSES-C Sample Return Capsule. Trans. Jpn. Soc. Aeronaut. Space Sci. 2008, 51, 65–70. [Google Scholar] [CrossRef] [Green Version]
- Hashimoto, A.; Murakami, K.; Aoyama, T.; Ishiko, K.; Hishida, M.; Sakashita, M.; Lahur, P. Toward the Fastest Unstructured CFD Code ‘FaSTAR’; 2012-1075; AIAA: Reston, VA, USA, 2012. [Google Scholar]
- Ito, Y.; Murayama, M.; Hashimoto, A.; Ishida, T.; Yamamoto, K.; Aoyama, T.; Tanaka, K.; Hayashi, K.; Ueshima, K.; Nagata, T.; et al. TAS Code, FaSTAR, and Cflow Results for the Sixth Drag Prediction Workshop. J. Aircr. 2018, 55, 1420–1432. [Google Scholar] [CrossRef]
- Kitamura, K.; Nonaka, S.; Kuzuu, K.; Aono, J.; Fujimoto, K.; Shima, E. Numerical and Experimental Investigations of Epsilon Launch Vehicle Aerodynamics at Mach 1.5. J. Spacecr. Rocket. 2013, 50, 896–916. [Google Scholar] [CrossRef]
- Takahashi, Y.; Ha, D.; Oshima, N.; Yamada, K.; Abe, T.; Suzuki, K. Aerodecelerator Performance of Flare-Type Membrane Inflatable Vehicle in Suborbital Reentry. J. Spacecr. Rocket. 2017, 54, 993–1004. [Google Scholar] [CrossRef] [Green Version]
- Teramoto, S.; Hiraki, K.; Fujii, K. Numerical Analysis of Dynamic Stability of a Reentry Capsule at Transonic Speeds. Aiaa J. 2001, 39, 646–653. [Google Scholar] [CrossRef]
Figure 1.
Shape of the capsule with hyperbolic contours.

Figure 2.
Relationship between the parameter, a, and the drag coefficient.

Figure 3.
Computational domain.

Figure 4.
Computational grid on the symmetric plane.

Figure 5.
Pressure coefficient distribution on the symmetry plane with different computational grids.
Figure 5.
Pressure coefficient distribution on the symmetry plane with different computational grids.

Figure 6.
Pressure coefficient distribution on the symmetry plane with different hyperbolic contours at an AoA of 0 degrees.
Figure 6.
Pressure coefficient distribution on the symmetry plane with different hyperbolic contours at an AoA of 0 degrees.

Figure 7.
Pressure coefficient distribution on the symmetry plane with different hyperbolic contours at an AoA of 15 degrees.
Figure 7.
Pressure coefficient distribution on the symmetry plane with different hyperbolic contours at an AoA of 15 degrees.

Figure 8.
Pressure coefficient distribution on the forebody of the capsules with hyperbolic contours at an AoA of 15 degrees.
Figure 8.
Pressure coefficient distribution on the forebody of the capsules with hyperbolic contours at an AoA of 15 degrees.

Figure 9.
Comparison of the drag and lift coefficients for hyperbolic contours.

Figure 10.
Comparison of the pitching moment coefficient for hyperbolic contours.

Figure 11.
Effect of parameter of hyperbolic contours on the drag coefficients.

Figure 12.
Effect of parameter of hyperbolic contours on the relative value of the volume and the stagnation point heat flux of the capsule.
Figure 12.
Effect of parameter of hyperbolic contours on the relative value of the volume and the stagnation point heat flux of the capsule.


Table 1.
Comparison of drag coefficient and the number of computational cells, faces, and nodes with different computational grids.
Table 1.
Comparison of drag coefficient and the number of computational cells, faces, and nodes with different computational grids.
| Fine | Nominal | Coarse | |
|---|---|---|---|
| Drag coefficient | 1.12986 | 1.12501 | 1.11057 |
| Normalized drag coefficient | 1.0000 | 0.9957 | 0.9829 |
| Number of cells | 5,032,000 | 963,596 | 265,743 |
| Number of faces | 14,648,152 | 2,748,156 | 740,877 |
| Number of nodes | 4,538,027 | 806,003 | 203,326 |
Publisher’s Note: MDPI stays neutral with regard to jurisdictional claims in published maps and institutional affiliations. |
© 2021 by the author. Licensee MDPI, Basel, Switzerland. This article is an open access article distributed under the terms and conditions of the Creative Commons Attribution (CC BY) license (https://creativecommons.org/licenses/by/4.0/).
Share and Cite
MDPI and ACS Style
Otsu, H. Aerodynamic Characteristics of Re-Entry Capsules with Hyperbolic Contours. Aerospace 2021, 8, 287. https://doi.org/10.3390/aerospace8100287
AMA Style
Otsu H. Aerodynamic Characteristics of Re-Entry Capsules with Hyperbolic Contours. Aerospace. 2021; 8(10):287. https://doi.org/10.3390/aerospace8100287
Chicago/Turabian StyleOtsu, Hirotaka. 2021. "Aerodynamic Characteristics of Re-Entry Capsules with Hyperbolic Contours" Aerospace 8, no. 10: 287. https://doi.org/10.3390/aerospace8100287
Note that from the first issue of 2016, this journal uses article numbers instead of page numbers. See further details here.