Article

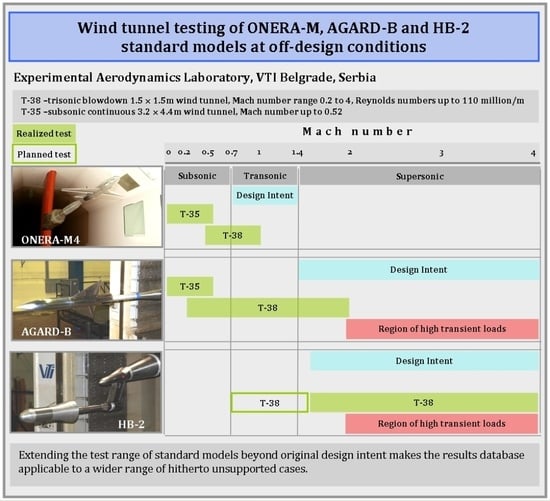
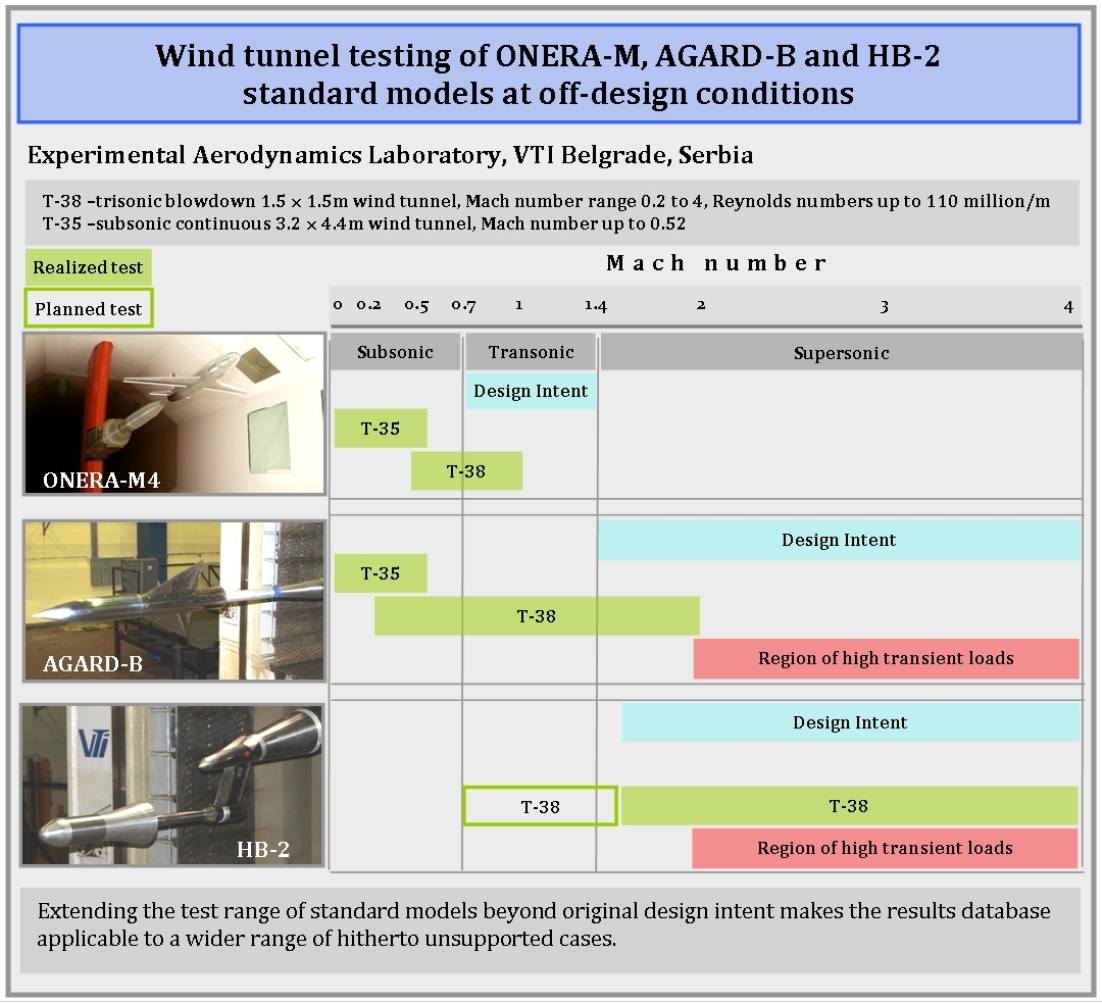
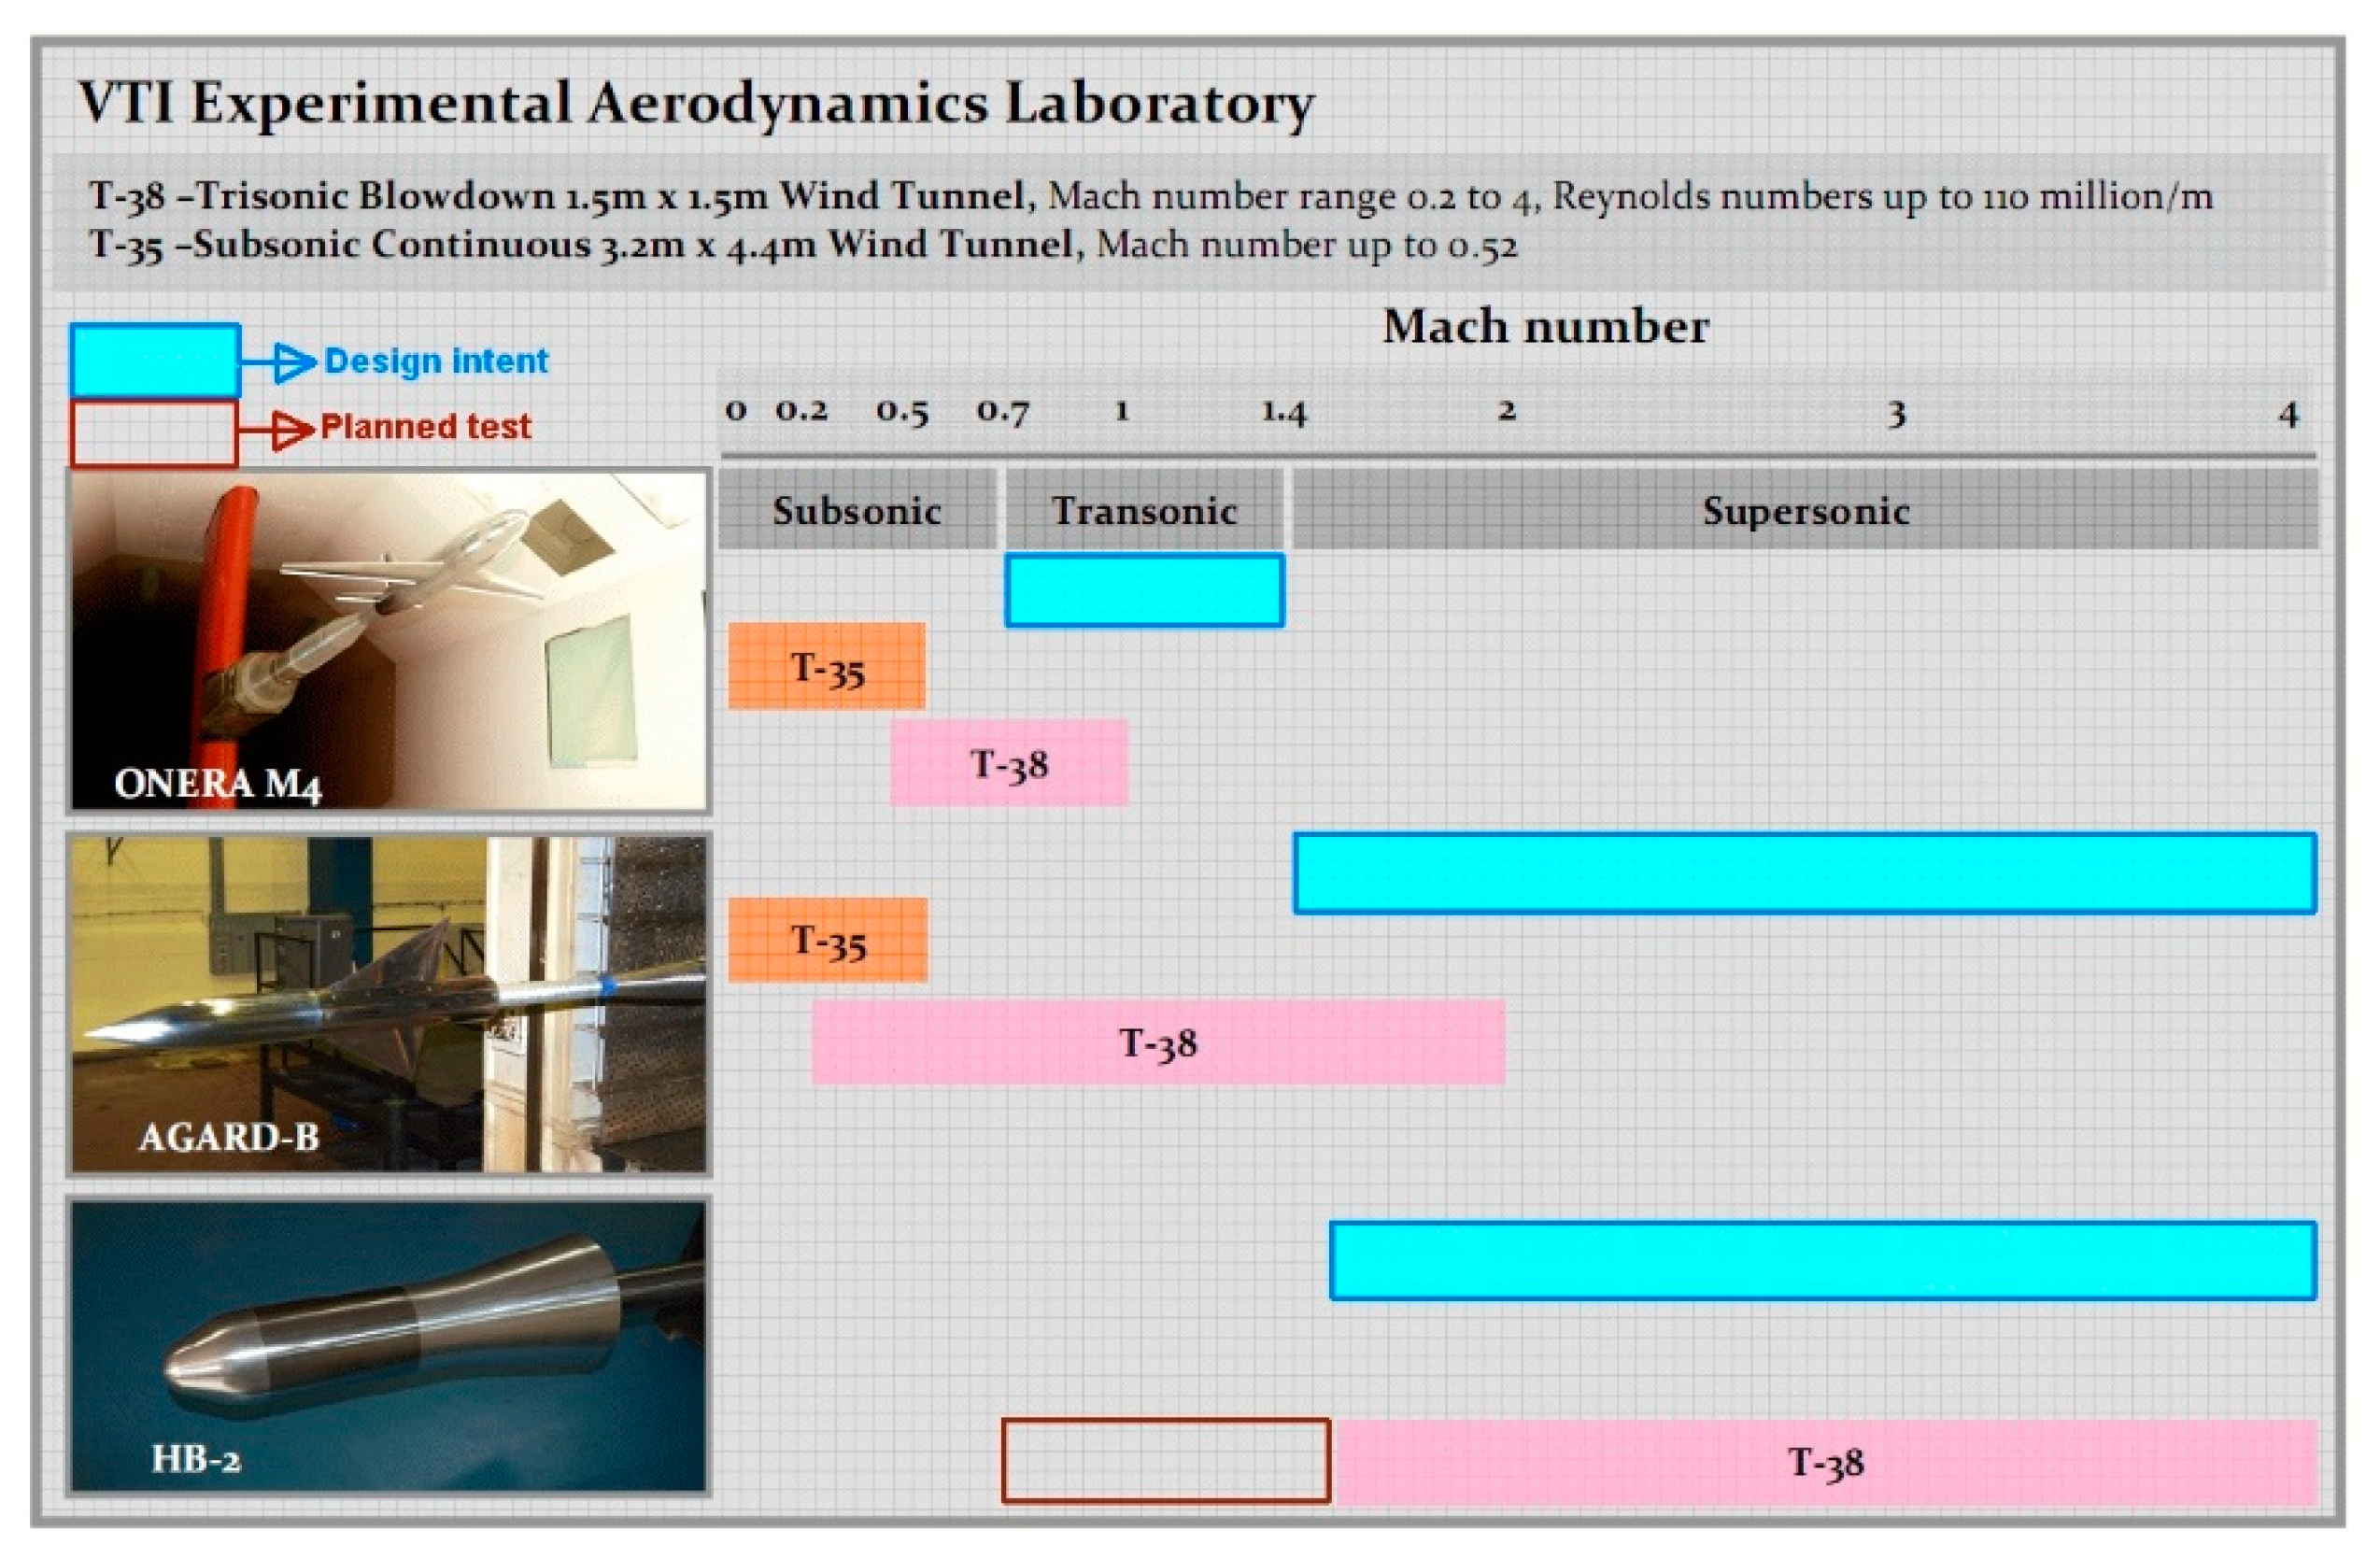
Wind Tunnel Testing of ONERA-M, AGARD-B and HB-2 Standard Models at Off-Design Conditions

1
Military Technical Institute (VTI), Ratka Resanovića 1, 11030 Belgrade, Serbia
2
Faculty of Mechanical Engineering, University of Belgrade, Kraljice Marije 16, 11120 Belgrade, Serbia
*
Author to whom correspondence should be addressed.
Aerospace 2021, 8(10), 275; https://doi.org/10.3390/aerospace8100275
Submission received: 14 July 2021 / Revised: 14 September 2021 / Accepted: 18 September 2021 / Published: 22 September 2021
(This article belongs to the Section Aeronautics)

Abstract

:
Published results for standard wind tunnel models at non-standard test conditions are quite rare and/or may not be available. It has been found that those results are a useful aid in preparations for a number of wind tunnel tests in the Military Technical Institute (VTI) in Belgrade. Test campaigns of standard models at non-standard conditions are performed to serve as an internal database for future wind tunnel tests in such environments. Those tests, that partially overlap the referenced Mach number and/or angle of attack ranges, are conducted in different VTI’s test facilities; different model sizes and support stings were used. The standard models used in static measurements in VTI, ranging from simple missile shapes and re-entry bodies to complicated airplanes, are briefly described and sample non-standard test results are given. The correlation of the test results among models and facilities has been done with references in the available ranges, and, after confirming a good agreement, it is assumed that the results are also valid in the extended ranges of conditions. These results may be useful for researchers in other wind tunnel facilities and for those who handle CFD tools.

Graphical Abstract

1. Introduction

Despite projections dating back to the end of the last century that ground testing facilities workload would be reduced as a consequence of computational fluid dynamics (CFD), the wind tunnel testing community did not see the pronounced decrease in testing requirements during the past decade. Wind tunnel testing is still an indispensable tool for flight regimes where the computational capability is not adequate, as well as for verification and validation of the existing and emerging computational tools. Both industry and academic community now agree that wind tunnel facilities will be needed to address the aerodynamic design challenges in the decades to come [1].
In recent years, however, there has been an increasing emphasis placed on wind tunnel data quality, uncertainty quantification and overall control and improvement of measurement processes. This trend is mostly due to ever more stringent requirements set before wind tunnel facilities to provide highly accurate measurements while operating within tight cost margins. Thus, the current paradigm for wind tunnel testing seeks to reliably and efficiently provide high-quality results at an affordable cost.
As a response to these requirements, a modern design of experiments (MDOE) approach to wind tunnel testing was suggested instead of conventional pitch-polar test designs, in order obtain the necessary data while saving wind-on time and power consumption [2,3,4,5,6]. The MDOE calls for developing highly efficient experiment designs tailored to the specific problem, with an idea to increase efficiency by obtaining as much data as possible from each test entry. In the context of facility verification, it implies performing short, targeted and more frequent wind tunnel calibration campaigns, with the subsequent reduction of test data uncertainties, instead of the former extensive and time-consuming calibration test programs with hundreds of runs.
Nowadays, in addition to regular test section calibrations [7,8,9], wind tunnel data quality assurance initiatives typically include periodic check standard model testing [10,11], which is primarily intended to verify data reliability and in-test and test-to-test data repeatability [12,13]. In general, standard wind tunnel models are simplified representations of typical aeronautic shapes, such as an airplane, a missile or a re-entry body, with precisely defined geometries and known aerodynamic characteristics. Wind tunnel testing of these models is performed in order to verify, by comparison with previously obtained results, the complete measurement chain in a test facility, to check data repeatability over time, as well as to provide a baseline for correlation of the results from different facilities [14]. Standard models are also tested with the aim of confirming the reliability of the data from a new or upgraded test facility [15] by comparison with the results from other wind tunnels. In addition, check standard model testing is used for the validation of new or upgraded data reduction and correction techniques [16], as well as in applied CFD validation studies [17,18,19,20].
Ground test facilities are increasingly faced with a challenge to design and perform non-standard wind tunnel tests. Yet, most standard models have initially been designed for a particular range of ‘conventional’ test conditions, e.g., for a specific speed range, a specific angle-of-attack range, and a specific model support configuration. In addition, the standard models were designed for wind tunnel steady-state loads, without considering transient phenomena typical for many high-speed facilities [21,22].
Two approaches are discernible in the in the efforts to determine off-design behavior of test objects. The first approach involves applying the modeling techniques to extrapolate standard experimental results to non-standard conditions [23]. However, there are many complex aerodynamic phenomena which can make CFD modeling methods unsuitable, inaccurate or unvalidated. Thus, the second approach is based on wind tunnel testing at the actual off-design conditions as the best way to determine the behavior of test objects when analytical and numerical tools may not give reliable predictions [24].
The strategy adopted by the Military Technical Institute (VTI) in Belgrade involves performing check standard model testing prior to the intended non-standard wind tunnel test to verify the experimental setup and increase confidence in the results. This paper presents some results of the off-design tests of standard models performed in the VTI’s test facilities.

2. Wind Tunnel Testing of Standard Model in VTI

Experimental Aerodynamics Laboratory of VTI has a well-established practice of a periodic wind tunnel testing of standard models [25,26]. The practice started with the testing of the AGARD-B/C and ONERA-M models in the T-38 trisonic wind tunnel during the commissioning of the facility [27]. Some tests were then repeated after a number of years [28]. The practice has since grown into a procedure for wind tunnel data quality assurance [29,30,31], similar to those in some other wind tunnel facilities [12,32], comprising testing of standard models and establishing a statistical control by maintaining a database of test results variability. These procedures have started being applied to the T-35 subsonic wind tunnel as well [33]. VTI’s framework for overall wind tunnel data quality control also includes correlation with test results from other experimental aerodynamics laboratories. The continuous work of the VTI provides permanent monitoring of the reliability of VTI wind tunnels, as defined by performance over an approximate three-year period.
It can be noted that correlation of test results from standard models in different wind tunnel facilities inevitably involves comparison of data from models of different sizes and structural designs. The geometric similarity of such models is generally satisfied, providing good correlation. However, there may remain inter-facility differences of Reynolds numbers. As the majority of tests with standards models are performed with natural (i.e., uncontrolled) boundary-layer transitions, this may cause slight differences between results. As the facilities may also differ in test section noise and turbulence levels, and different model designs and sizes may produce different static aeroelastic effects, Reynolds-number-related scale effects may be masked by such additional factors.
Three types of 3D standard wind tunnel models are periodically tested in VTI’s test facilities. The models, typically used in static measurements of forces and moments, are shown in Figure 1, together with their designed Mach ranges versus Mach ranges covered so far by tests in two of VTI’s test facilities.
AGARD-B is perhaps the most popular standard model. Although it was initially designed for the supersonic wind tunnels, it has since been tested in many wind tunnels of various speed ranges, ranging from subsonic to hypersonic [34,35,36]. AGARD-B is the primary standard model used by VTI for the periodic wind tunnel checkouts.
Another model configuration used by VTI is the ONERA-M, a generic transport-aircraft shape, designed by ONERA for use in the transonic wind tunnels [37,38,39].
Recently, the interest in high-speed wind tunnel tests at high angles of attack increased in VTI. Two configurations of the hypervelocity ballistic correlation model, designated as HB-1 and HB-2, have, therefore, been introduced as suitable reference models for experimental verification of the quality of measurements at high Mach numbers in the T-38 wind tunnel. Both configurations are stubby, re-entry-body-like, blunted cone-cylinder shapes [40,41].
On several occasions, the VTI was in need of reference results of standard models at off-design conditions, discovering that such results were scarce or non-existent. Therefore, over the years, several wind tunnel test campaigns of standard models at non-standard conditions were performed, to serve as an internal database for future tests in such environments. Those included:
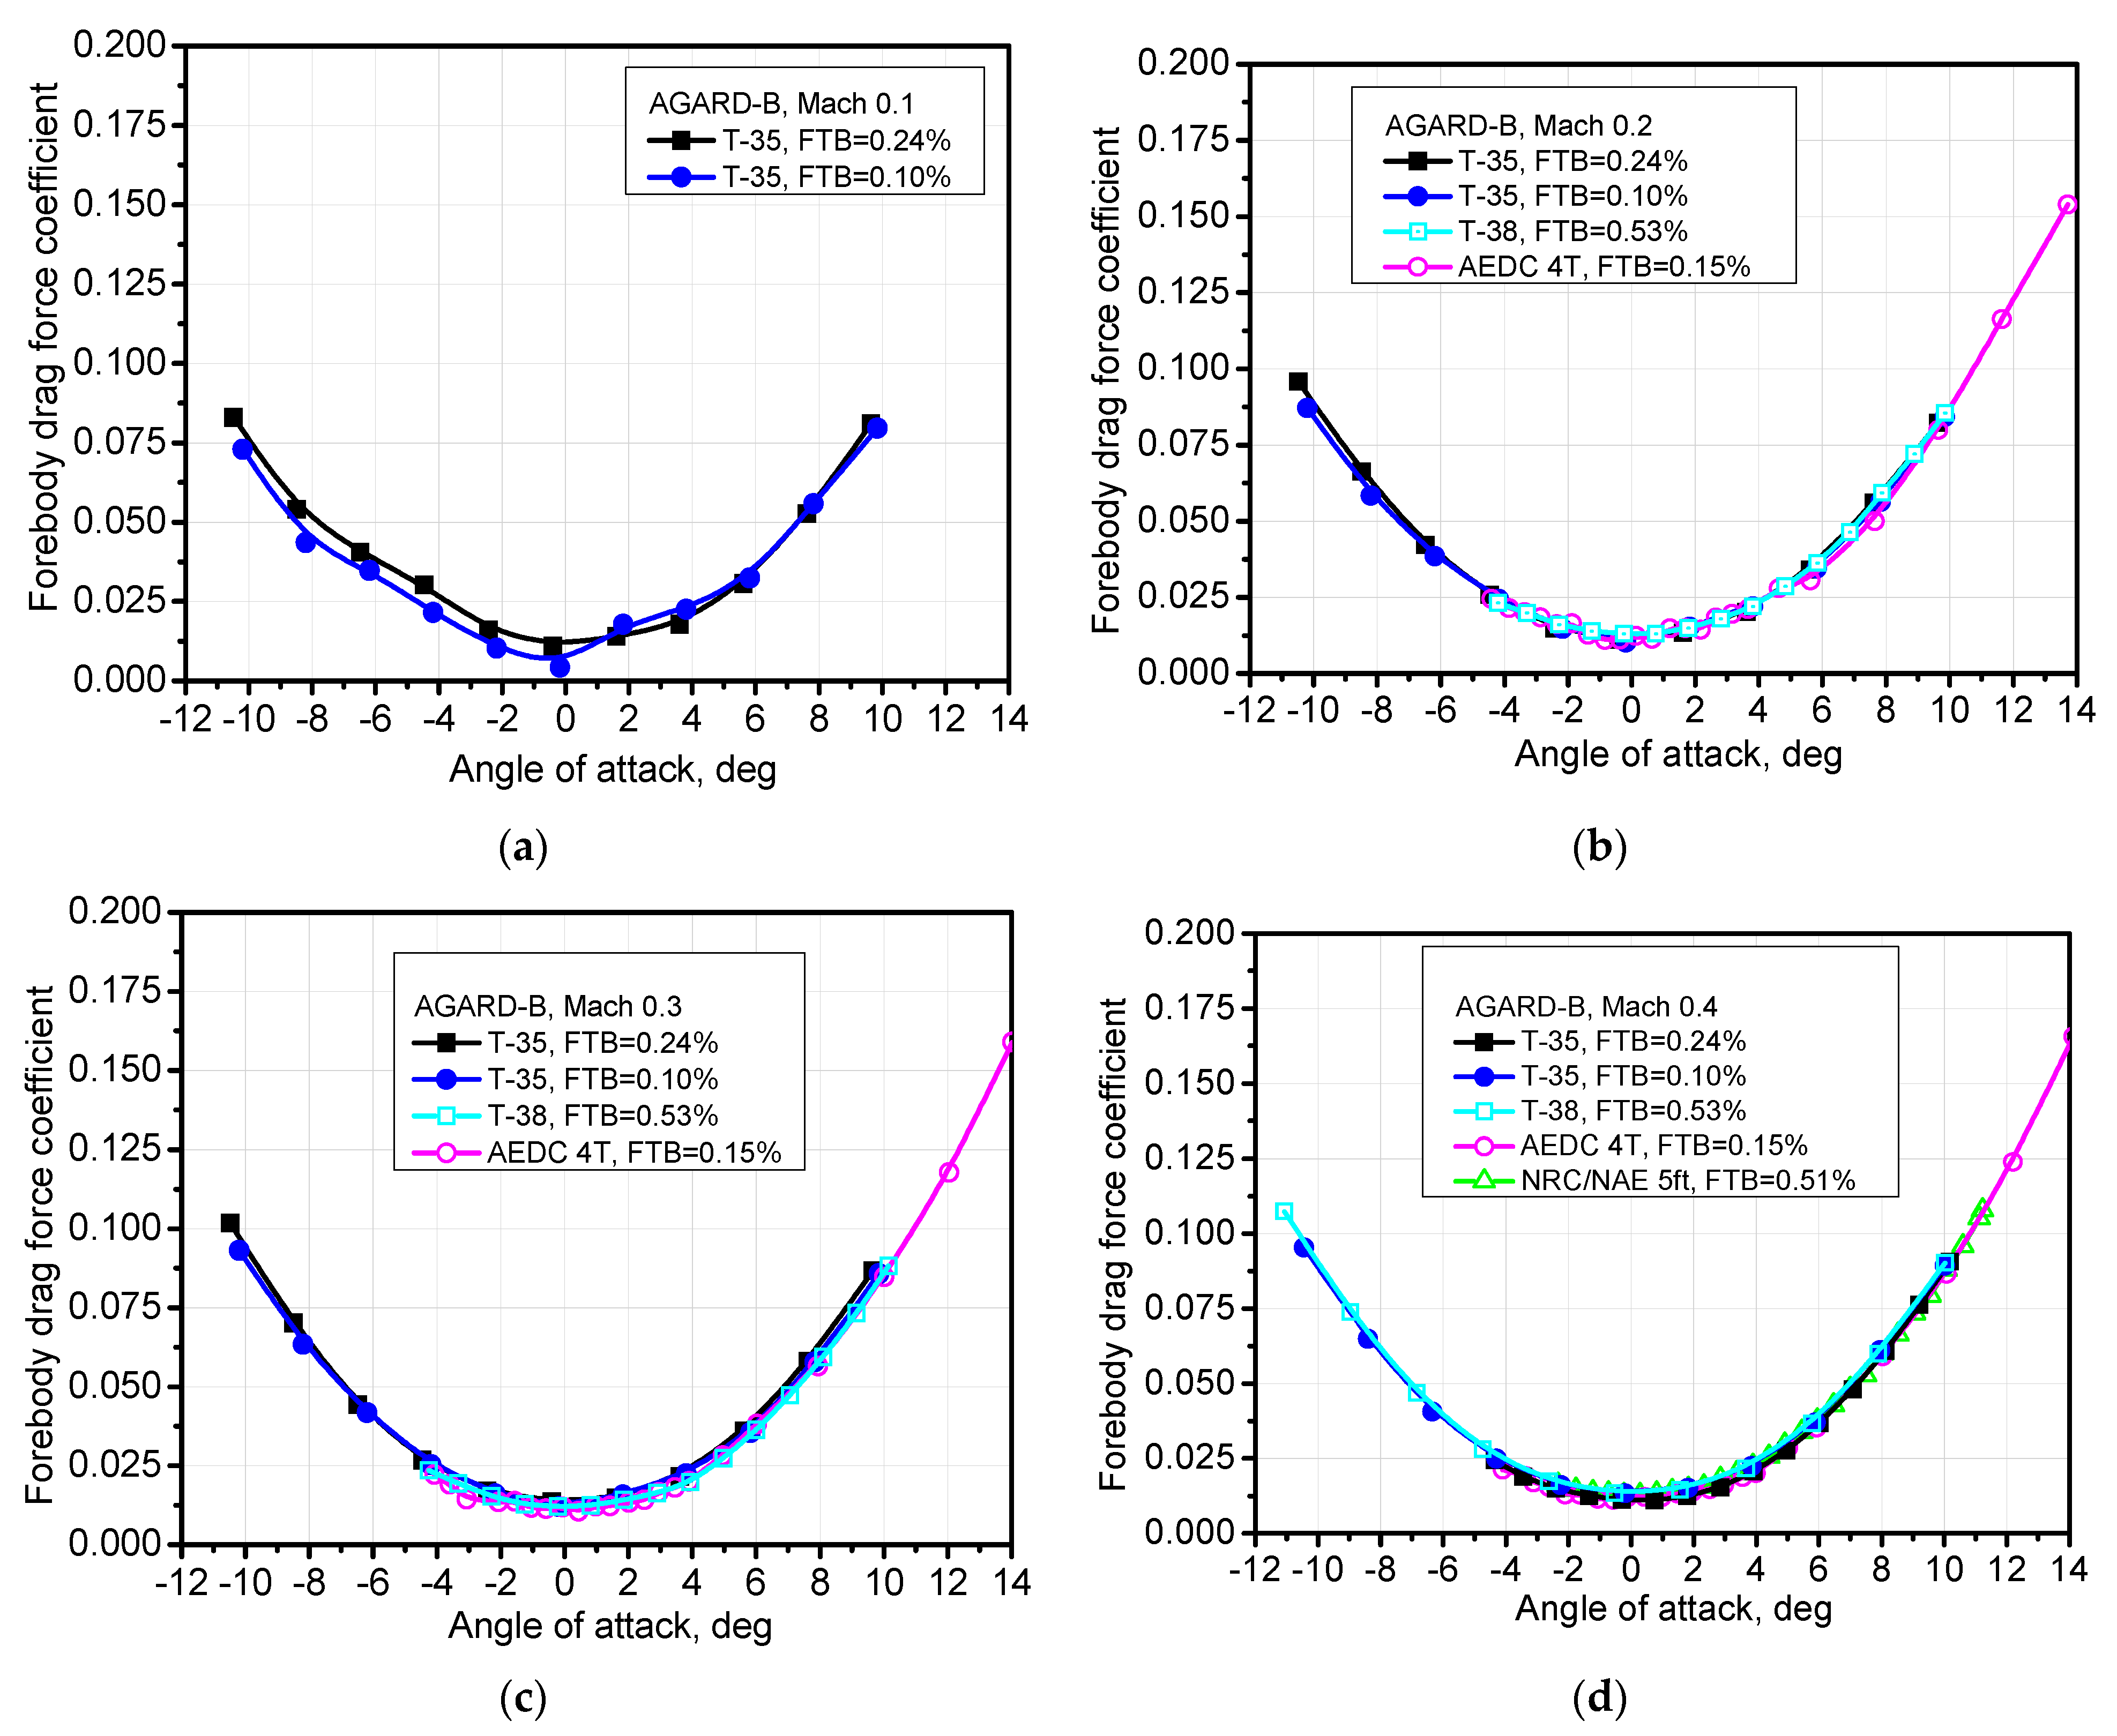
  • Testing of the AGARD-B model at low speeds (down to Mach 0.1),
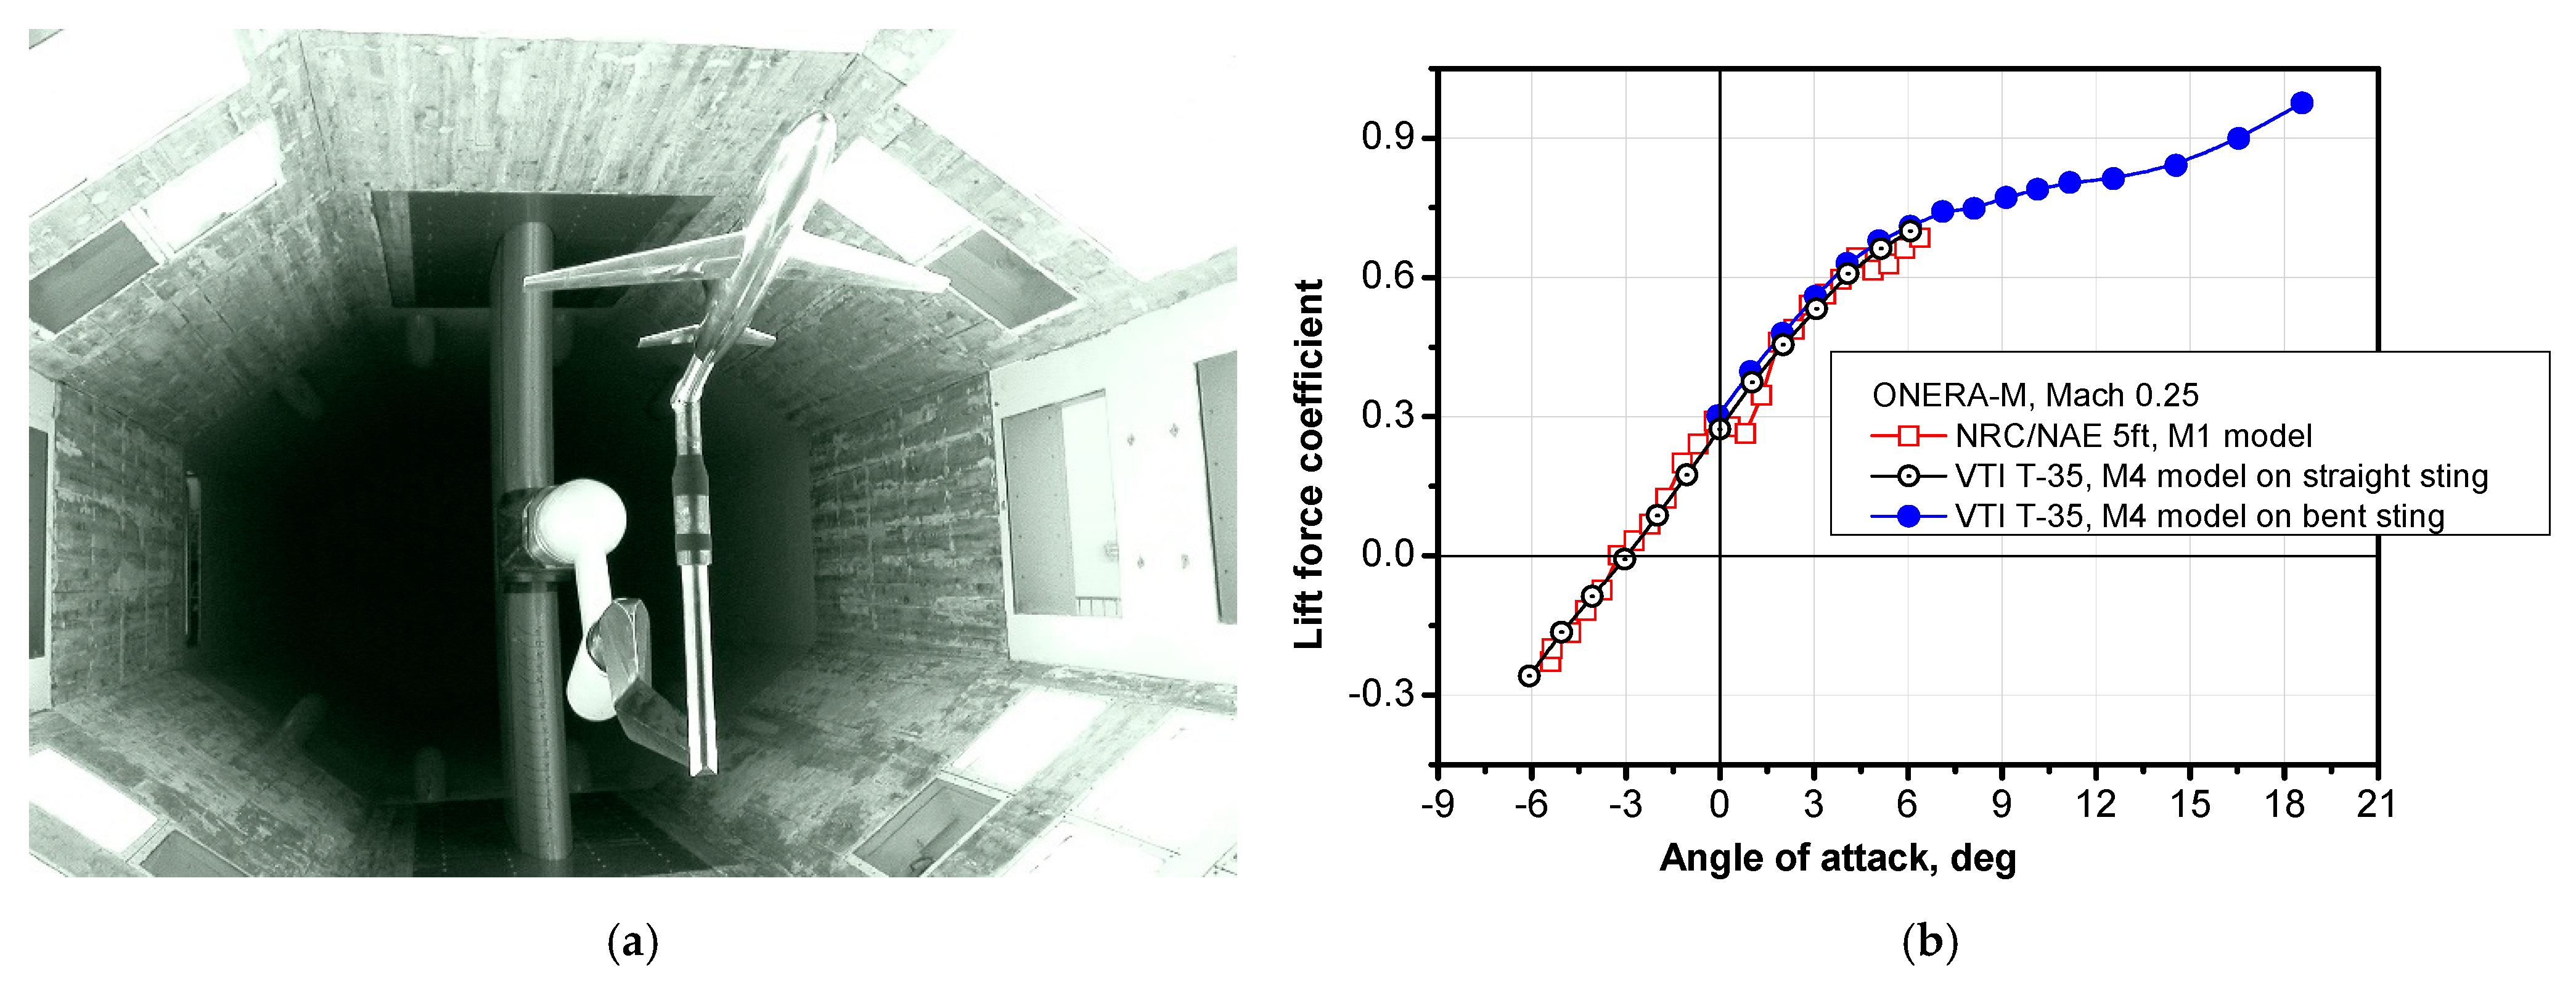
  • Testing of the ONERA-M model at subsonic speeds and at high angles of attack,
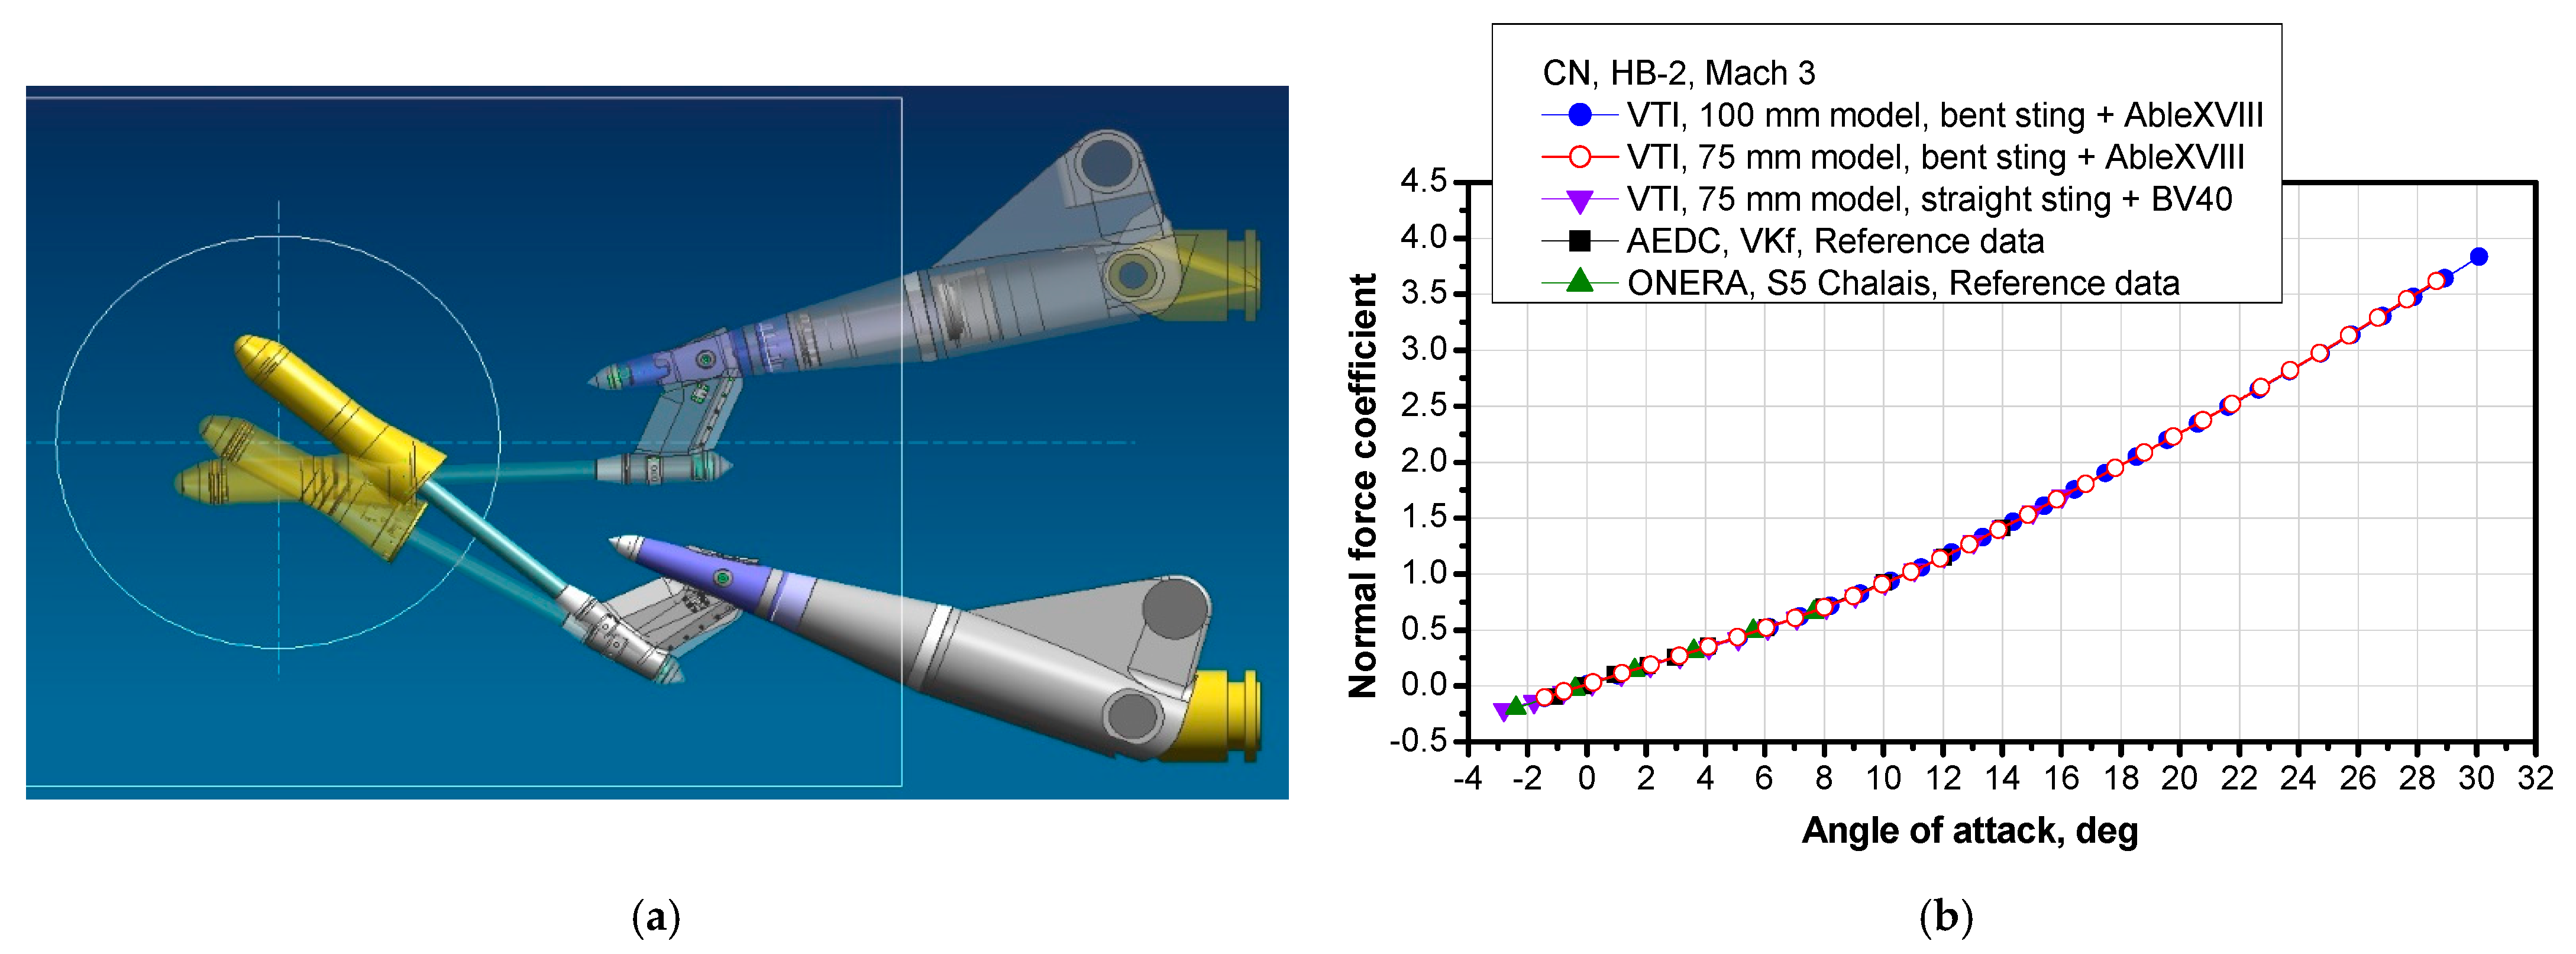
  • Testing of the HB-2 model at high angles of attack,
  • Testing of the AGARD-B, HB-1 and HB-2 models at supersonic-flow-start conditions.
Planned for the near future are also:
  • Testing of the HB-2 model in the transonic speed range, and
  • Testing of the AGARD-B model at high angles of attack.
The off-design tests of standard models are mostly performed after, or as a continuation of the tests on the same models at more common conditions, for which reference results are available. They are conducted so that, when possible, test envelopes partially overlap with the referenced ranges. After confirming good agreement of off-design results with references in the available ranges, it is assumed that, by implication, the obtained results are also valid in the extended ranges of conditions.
Generally, it has been found that a database of test results of standard models at off-design conditions is a useful aid in preparations for wind tunnel tests in VTI.

3. Test Facilities

The growth of VTI as an aeronautical design and testing center has been backed up by development of wind tunnel facilities since 1952, when the first wind tunnel was built. The most significant test facilities, the T-38 and the T-35 wind tunnels, were used to experimentally support projectile and aircraft programs of former Yugoslavia and today Serbia. This article provides general information about T-38 and T-35 facilities. More detailed descriptions of their technical characteristics, measuring techniques used and principles of operation is given in [42,43,44].

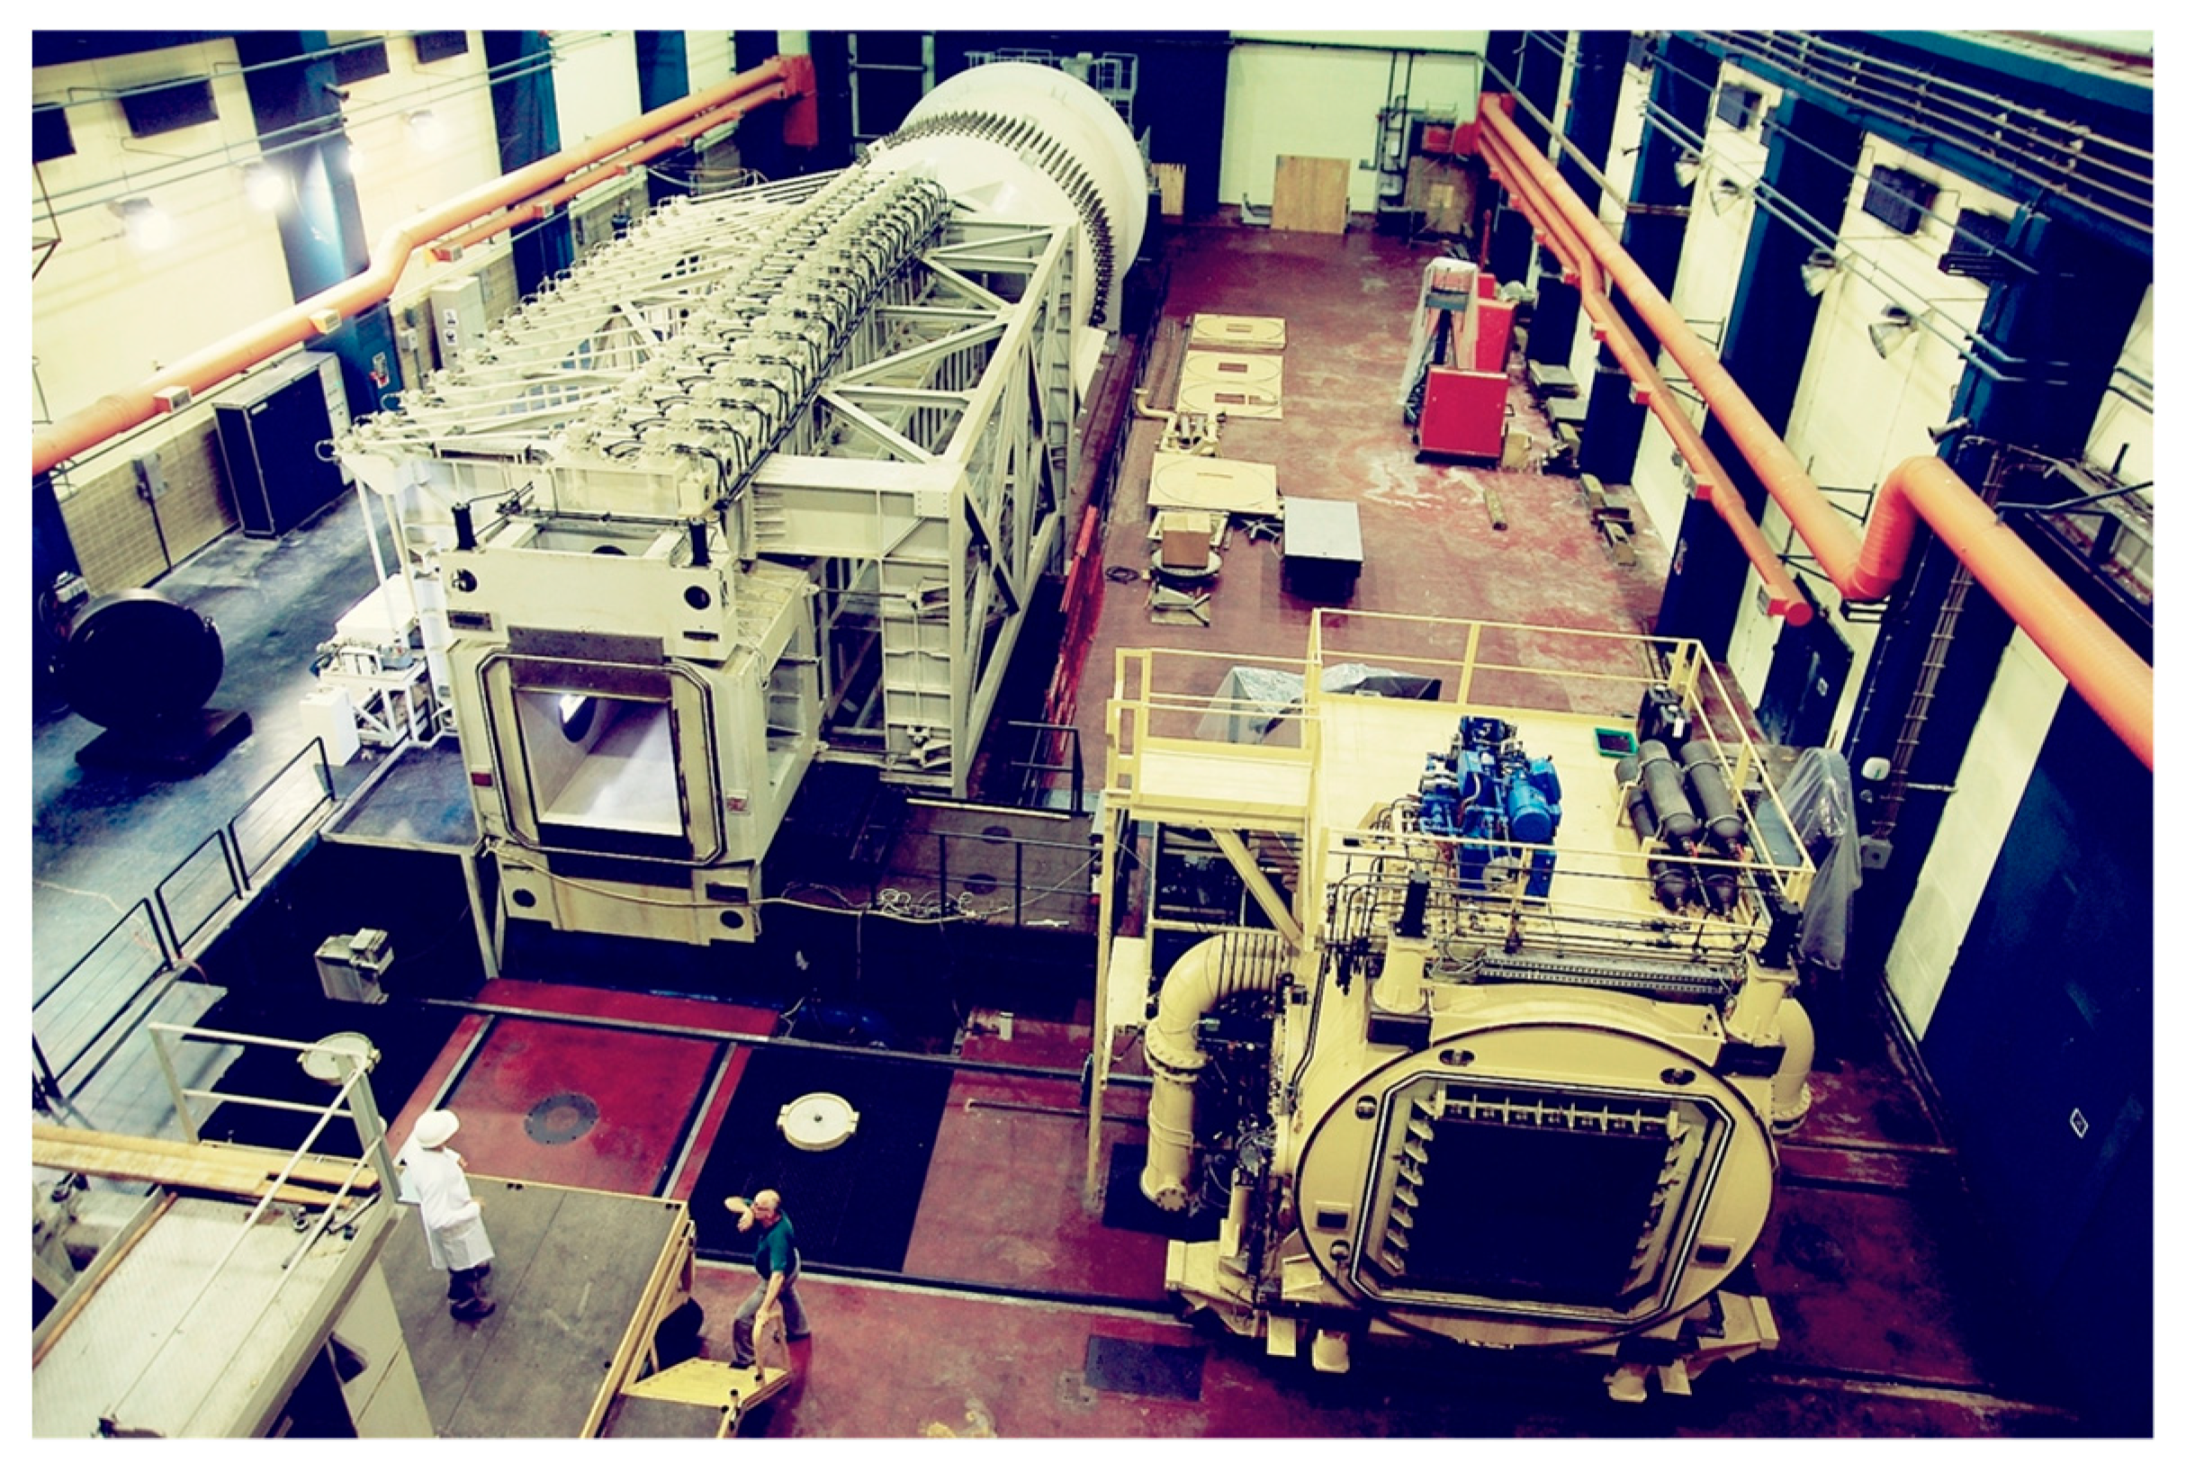
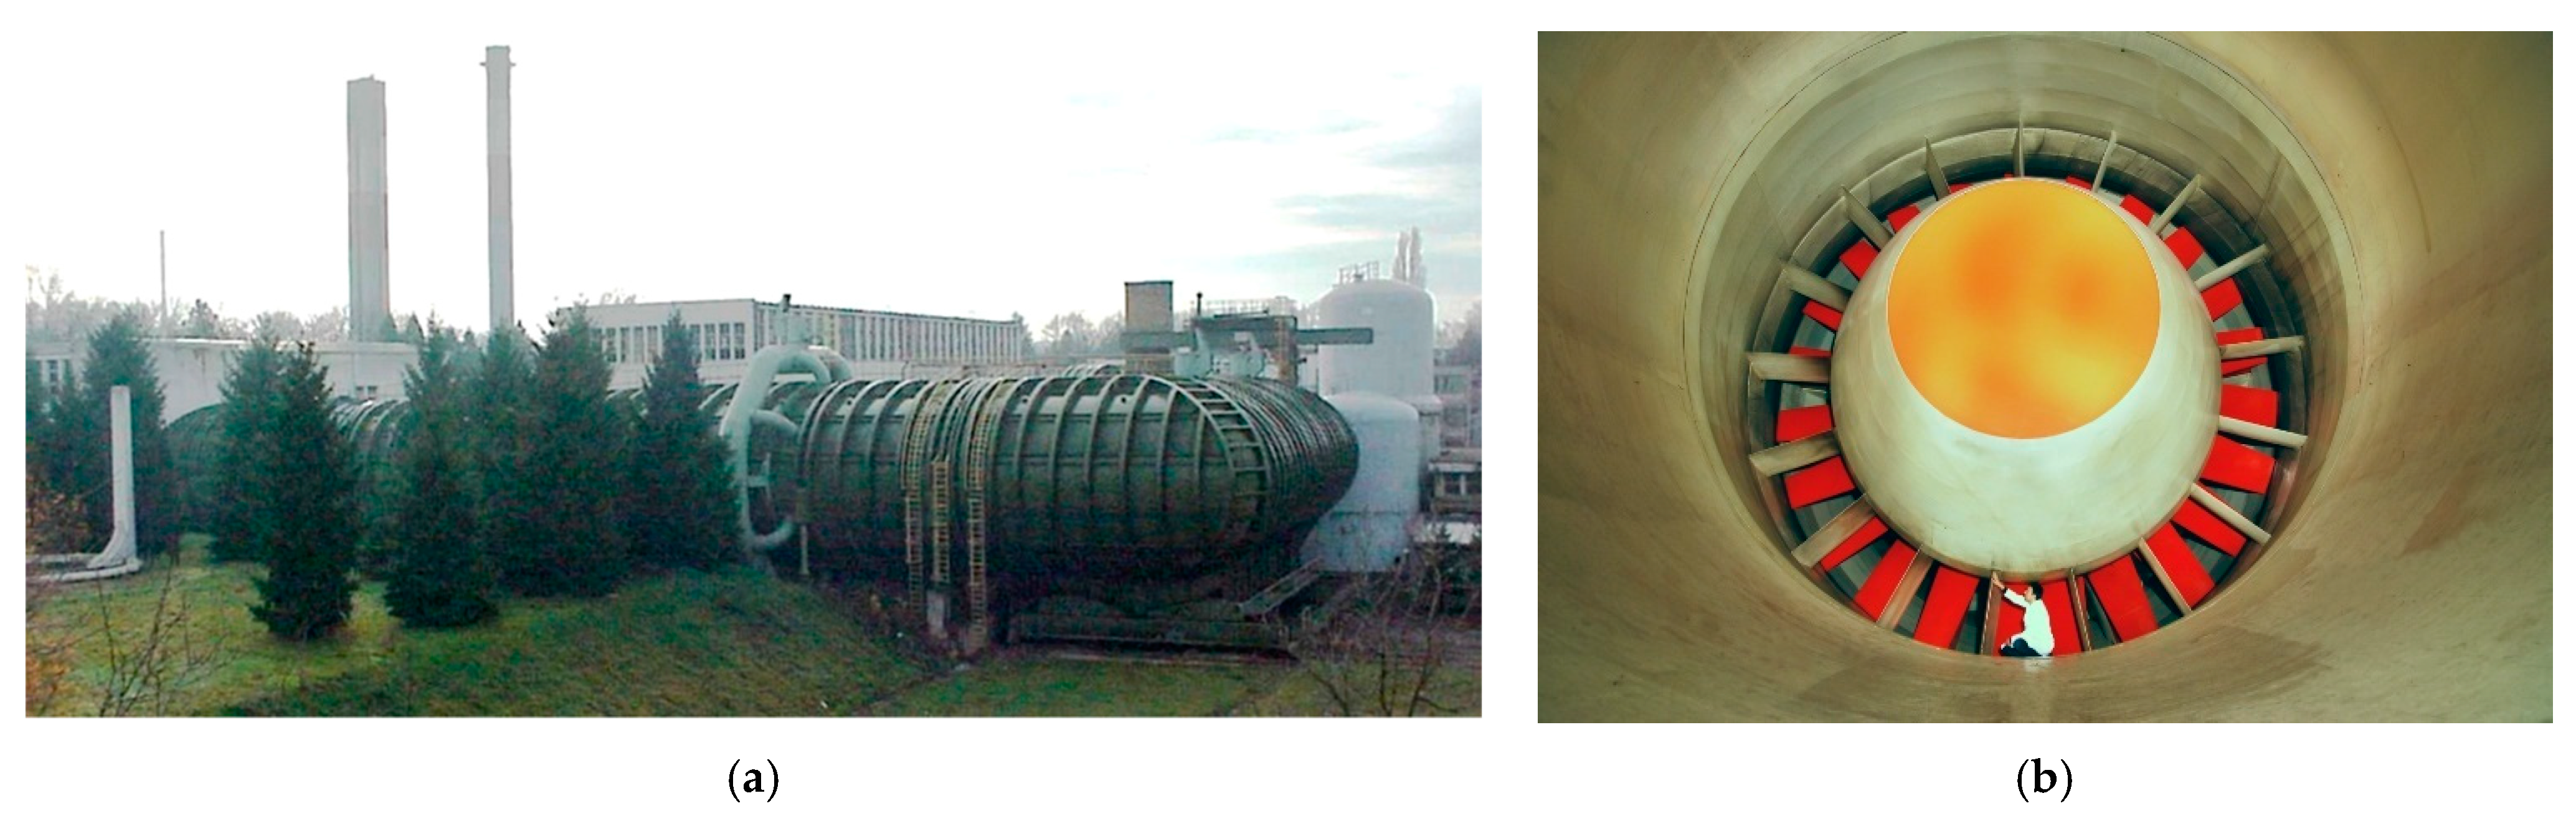
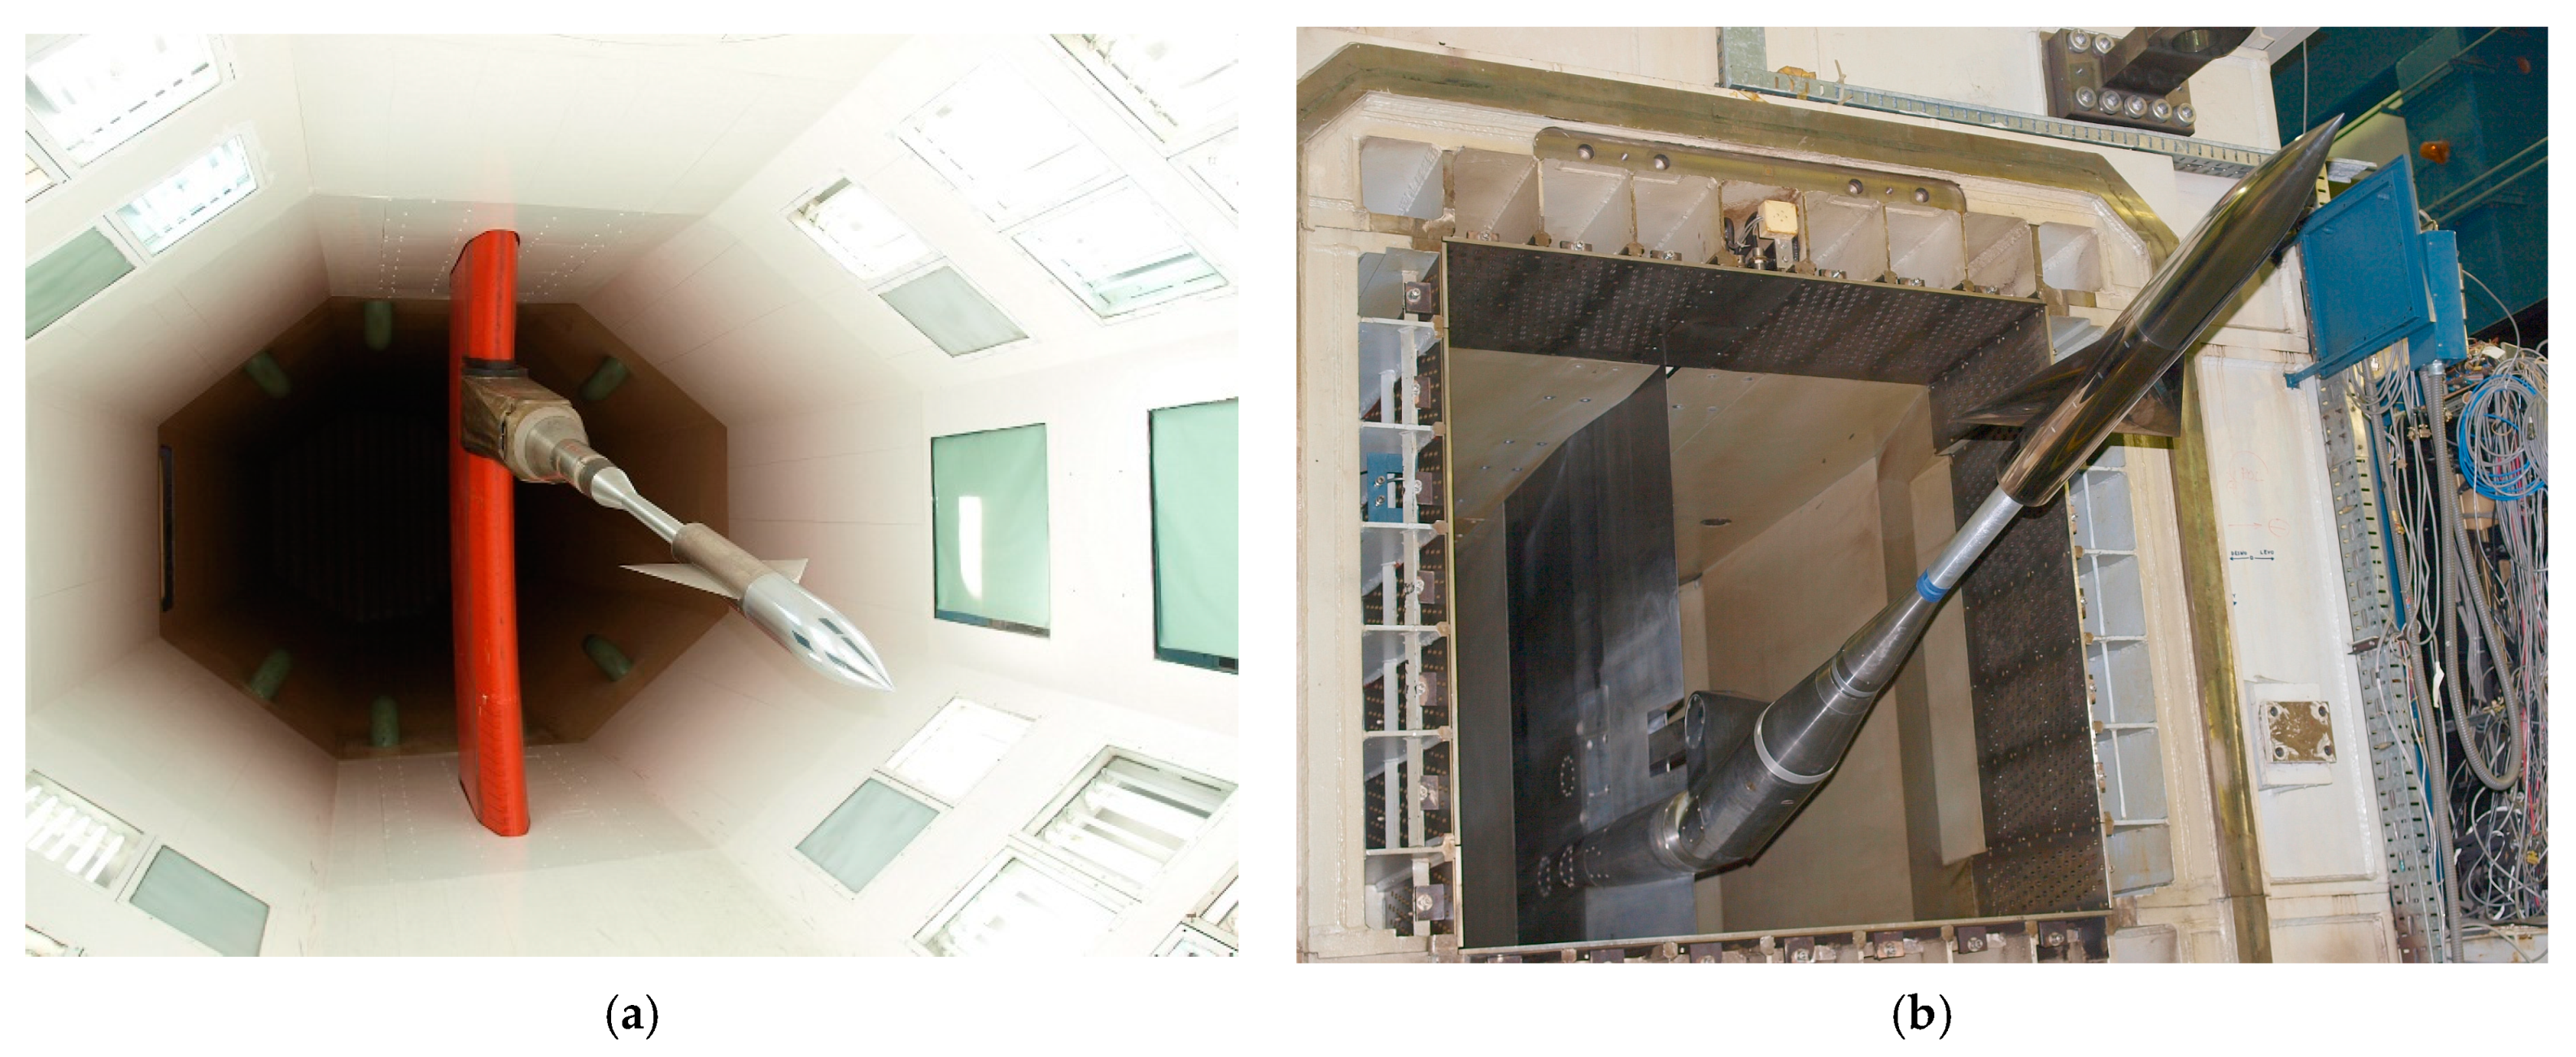
3.1. The VTI T-38 Wind Tunnel

The VTI T-38 test facility in Belgrade is a blowdown-type pressurized wind tunnel [42] with a 1.5 × 1.5 m square test section, operating in subsonic, transonic and supersonic speed ranges (Figure 2). The wind tunnel was designed and built by a Canadian company (DSMA) and has been operational since 1986. In recent years, a number of upgrades have been made to the facility, including the replacement of many sensors with modern, more reliable and more accurate ones, the replacement of the wind tunnel control system and the replacement of the data acquisition system.
A solid-wall test section is used in subsonic and supersonic tests, while a test section with perforated porous walls [43] is added to the wind tunnel configuration in transonic tests. The porosity of walls of the transonic test section is varied between 1.5% and 4%, depending on the Mach number, to achieve the best flow quality and minimize wall interference. Mach number range of the facility is 0.2 to 4.0. Mach number in the subsonic and supersonic speed ranges is set prior to a wind tunnel run, by setting the second throat and the variable-geometry nozzle contour [45], respectively. Additionally, in the transonic speed regime, an active blow-off system performs a fine regulation of the Mach number to within 0.3% of the nominal value.
Stagnation pressure in the test section of the wind tunnel can be between 1.1 and 15 bar, the operating envelope depending on Mach number, and resulting in Reynolds numbers of up to 110 million per meter. Stagnation pressure is regulated to within 0.1% of the nominal value [46]. Run time can be up to approximately 60 s, depending on test conditions. Minimum useful run time is about 10 s at any Mach number within operating range. The primary model support system in the T-38 wind tunnel is a pitch-and-roll mechanism with a tail sting. A sidewall pitch-only half-model support is also available.

3.2. The VTI T-35 Wind Tunnel

The VTI T-35 test facility in Belgrade (Figure 3) is a continual subsonic wind tunnel with 3.2 × 4.4 m octagonal test sections [44]. The wind tunnel was designed by VTI and erected by Yugoslav companies. It has been operational since 1964 and upgraded on several occasions from 1985 to present. The upgrades included the replacement of the main fan, two replacements of the computer systems, and the replacements of sensors with more modern ones. Mach number range of the wind tunnel is up to 0.52. Mach number regulation is achieved by changing the fan rotation rate and the pitch angle of fan blades. Stagnation pressure in the test section is up to 1.2 bar (static pressure is atmospheric) and Reynolds number is up to 12 millions/m. The duration of a run is theoretically unlimited.
Two interchangeable test sections are in use. The first one has an under-floor external balance which also acts as a model support permitting movement in yaw and pitch. The second test section comprises a vertical quadrant strut with a tail sting, providing step-by-step or continuous movement in pitch, yaw and roll.

4. Standard Models

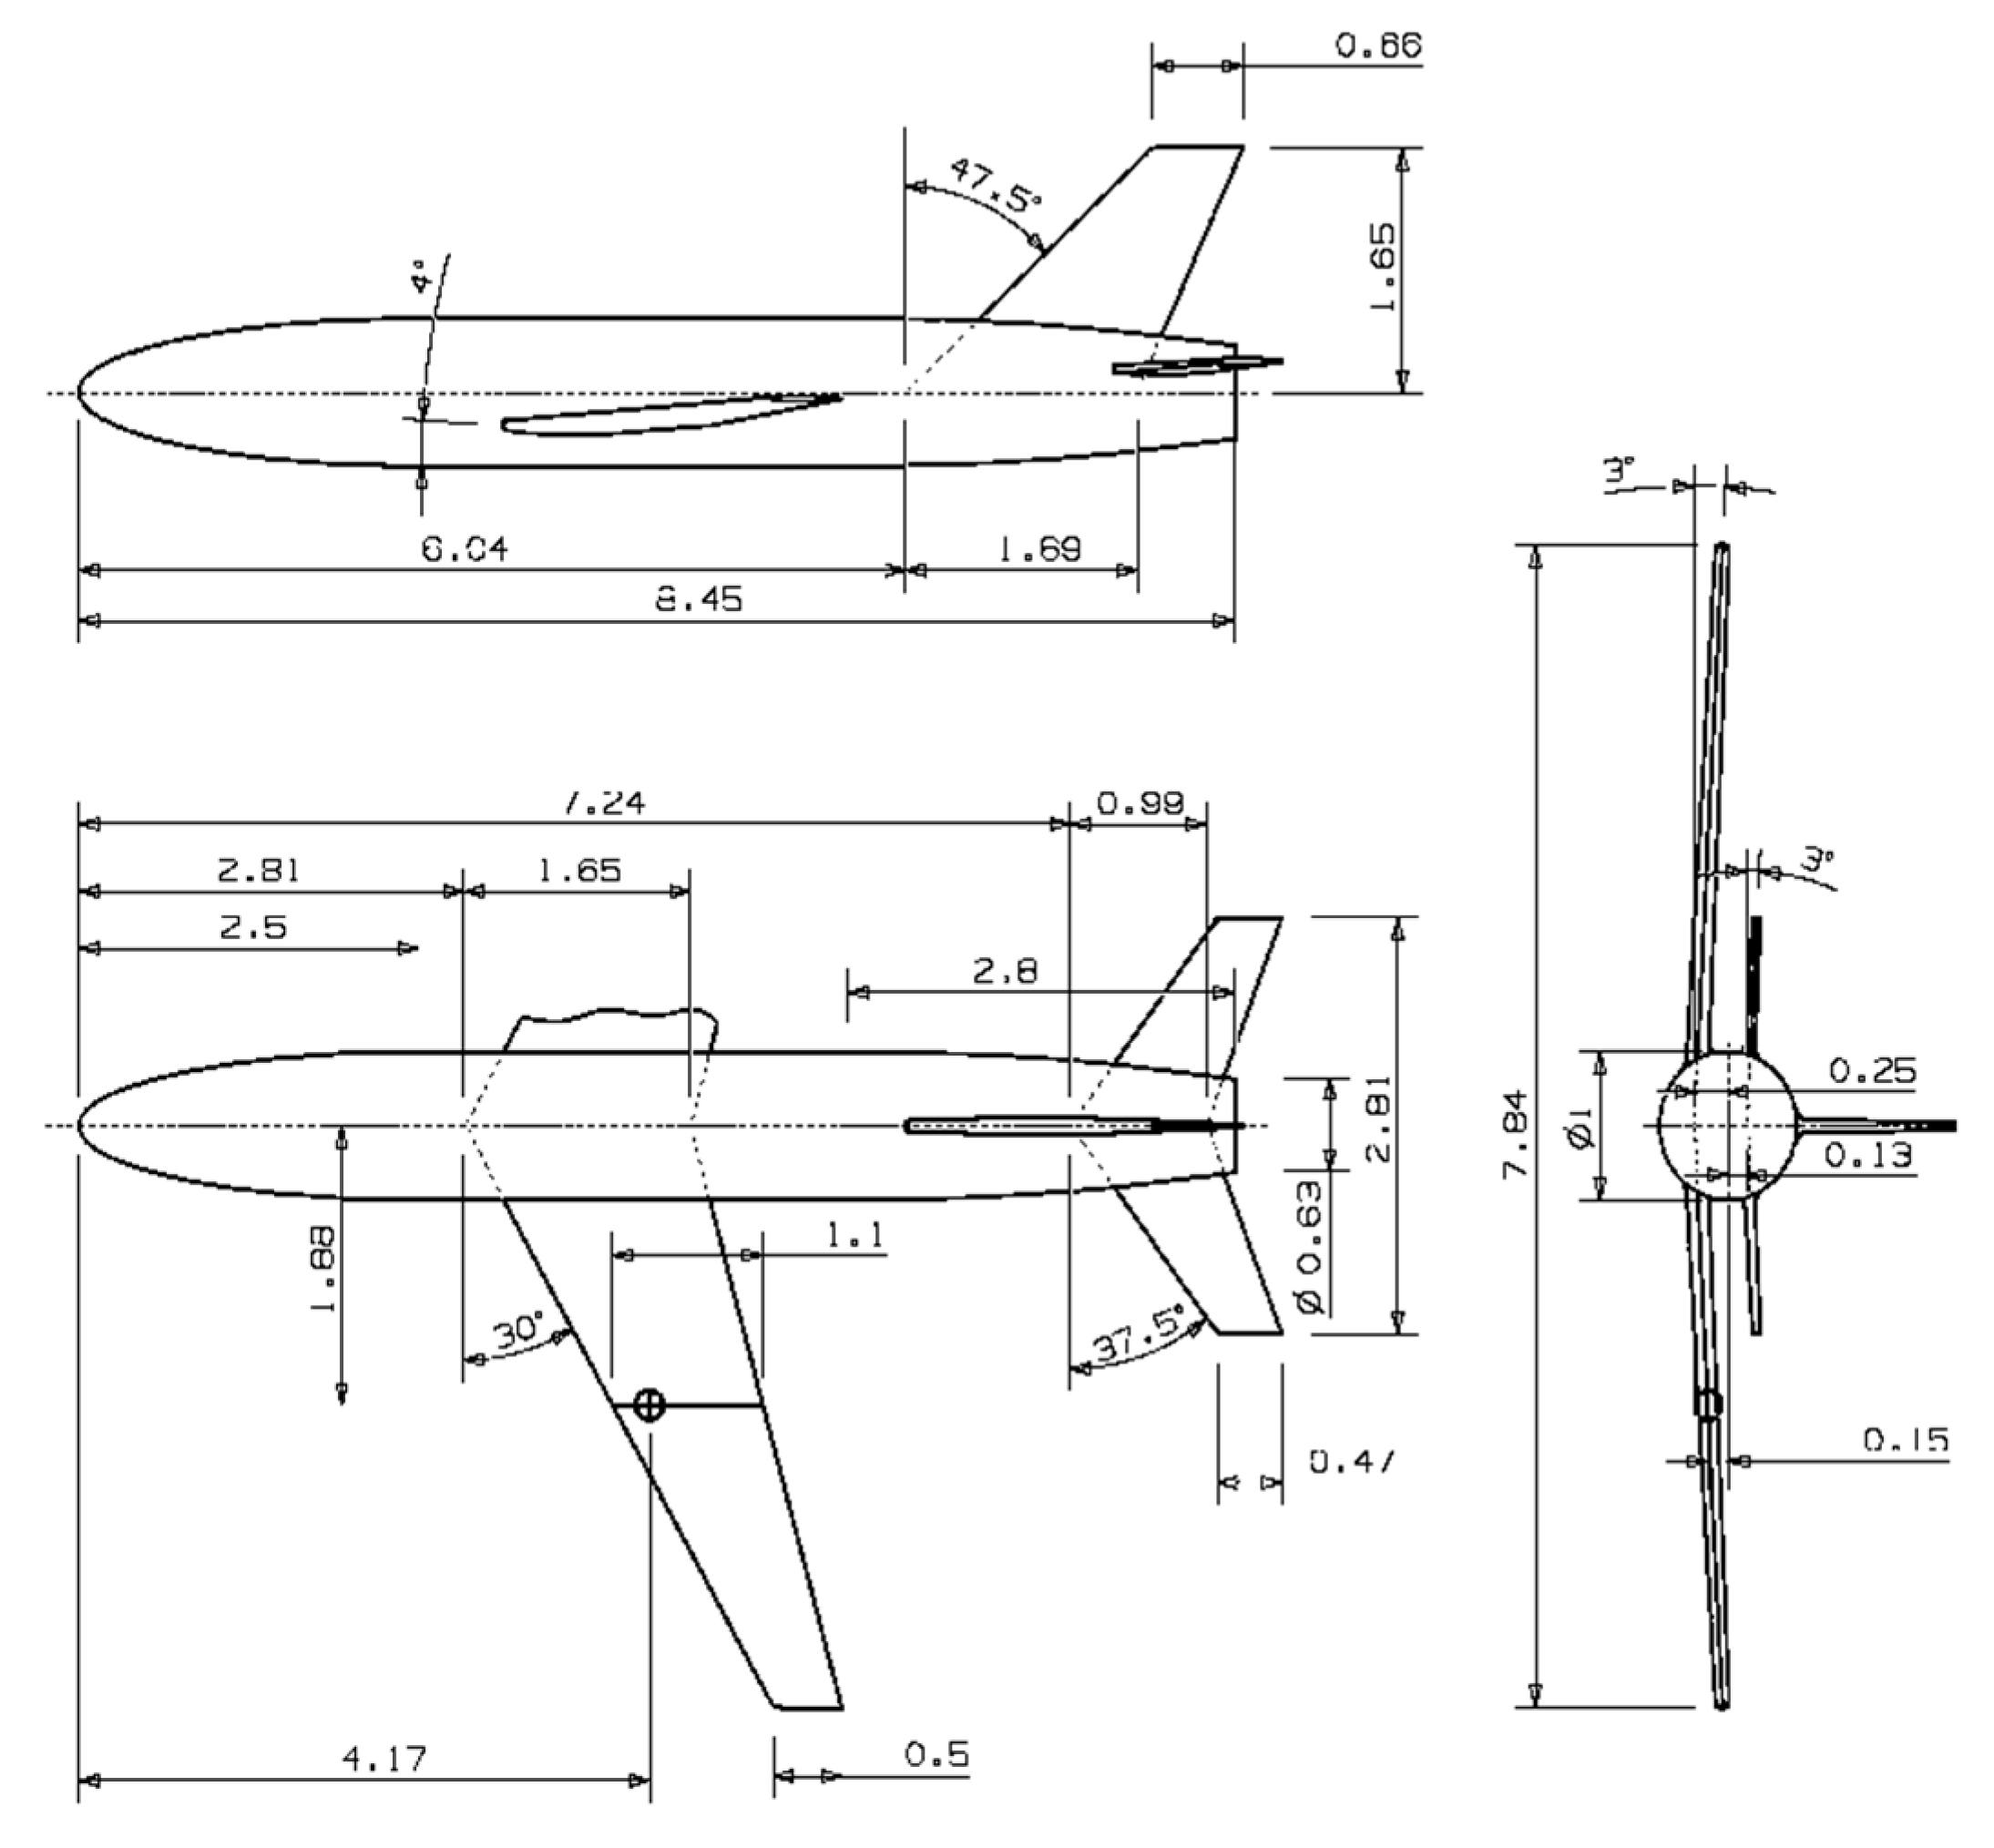
4.1. ONERA-M Transonic Standard Model

The ONERA-M model represents a generic transport-aircraft shape, with sweptback wings, horizontal stabilizer and tail (Figure 4). Typical wind tunnel tests of these models include measurements of forces and moments by an internal balance and pressure distribution on several sections on the wing.
Body of the model is mostly cylindrical, with ogival front and rear ends. Airfoils of the wing, the horizontal and vertical tails are symmetrical, with a maximum thickness of 10.5% at the 37.5% of the chord. Aspect ratio of the wing is 7.31, its leading edge is swept by 30°, and its installation angle is 4° in relation to the fuselage axis. Leading edges of the horizontal and vertical tail are swept 37.5° and 47.5°, respectively. The dihedral angles of the wing and the horizontal tail are 3°.
ONERA-M models are produced in different sizes, fuselage diameter ranging from 36 to 307 mm. Model size is denoted by a numerical suffix after the M in the name (e.g., M1 to M12) [39]. The ONERA-M model tested in the T-35 and T-38 wind tunnel of VTI is of M4 size (Figure 5) with a fuselage diameter of 102 mm.

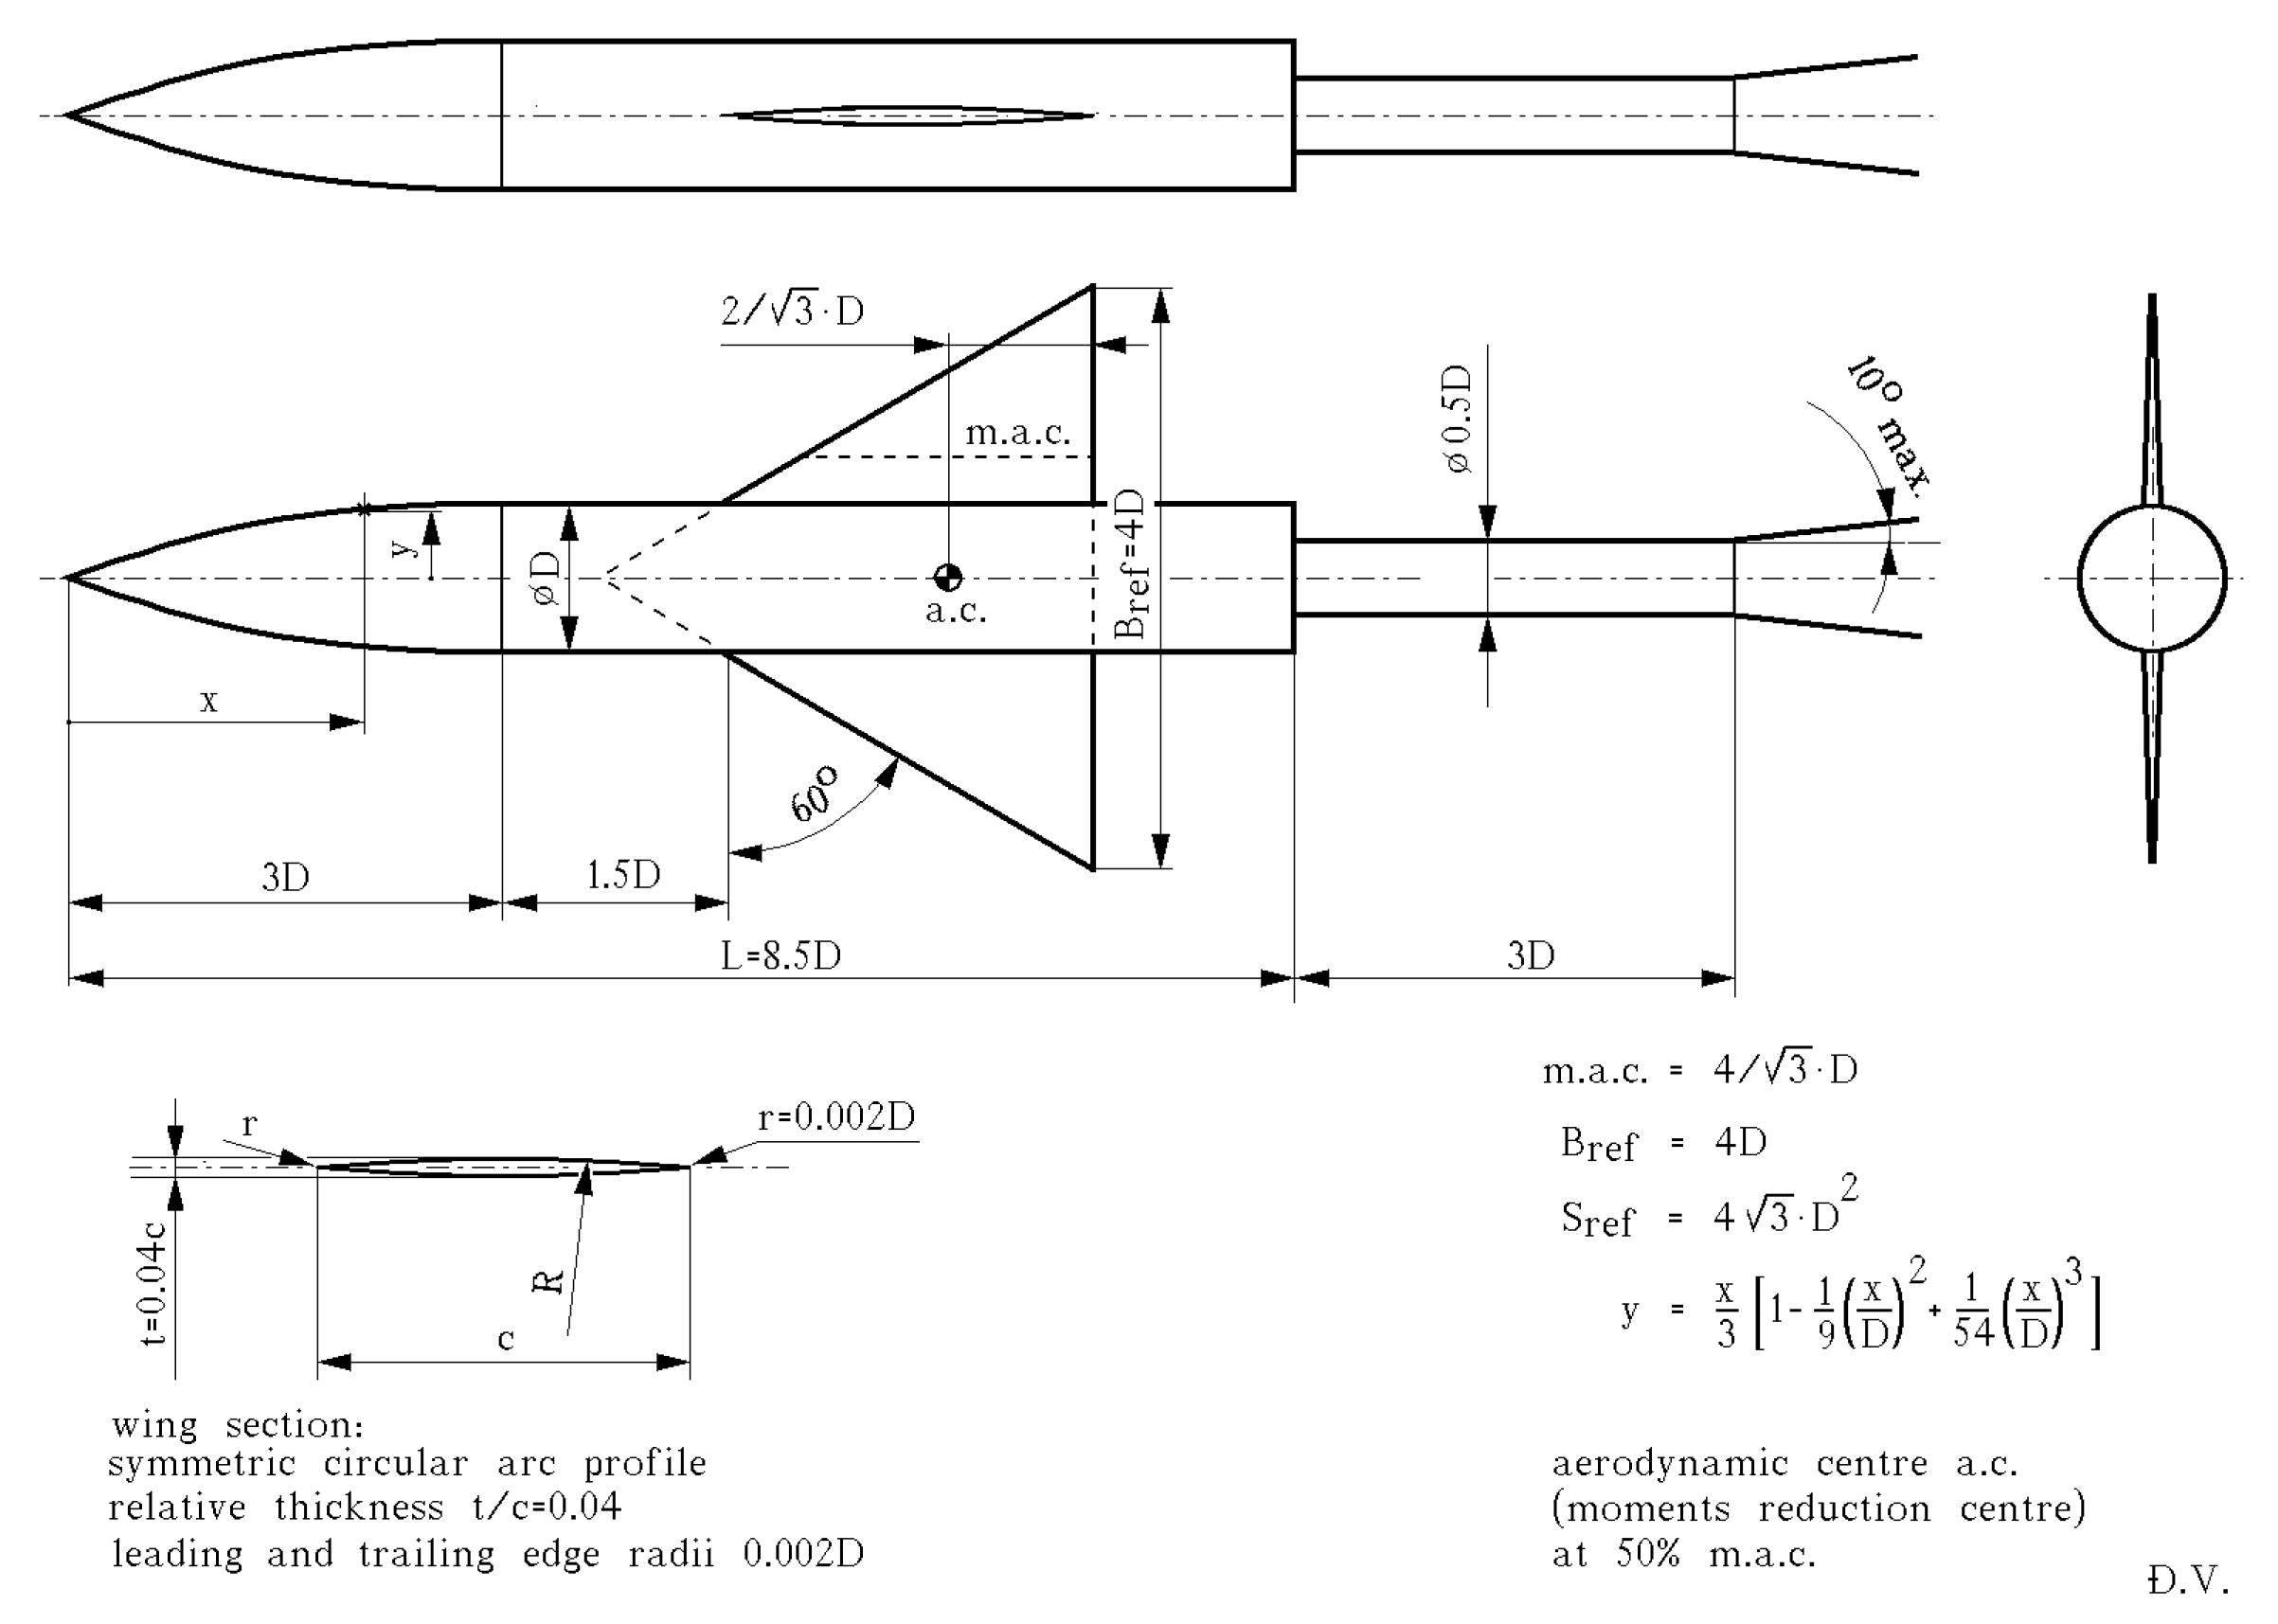
4.2. AGARD-B Supersonic Standard Model

AGARD-B standard model is a body-wing configuration representing a generic winged-missile or a delta-wing high-speed aircraft [34,35]. The model was originally designed for the calibration of supersonic wind tunnels, but it is also used in transonic, subsonic and even hypersonic wind tunnels [36].
Body of the model is cylindrical, with an ogival nose. The delta wing with a 4% thick bi-convex section has a span of four body diameters (Figure 6). Its standard support sting has a diameter of 0.5 body diameter and a length of at least 3 body diameters.
Reference area for the calculation of the coefficients is the theoretical delta-wing area, and the reference lengths are the mean aerodynamic chord for the pitching-moment coefficient, and wingspan for the yawing- and rolling-moment coefficients. Data are reduced to a point (a.c.) at 50% of the mean aerodynamic chord. Test results are presented in the wind-axes system as ‘forebody’ aerodynamic coefficients, i.e., with the axial force due to base drag subtracted from the total axial force.
AGARD-B was selected as a standard for periodic measurement-chain checkouts in a number of wind tunnels, including those in VTI [34,35,36,47]. Therefore, confidence in the validity of the data obtained in the wind tunnels of VTI could be established on the basis of both within-facility and inter-facility comparisons [25,26,27,28,29,30,31].
Two AGARD-B models, with diameters of 115.8 mm and 178 mm are periodically tested in the T-38 and T-35 wind tunnels. The 115.8 mm diameter model has been used in the initial and periodical calibrations of the VTI’s T-38 wind tunnel in subsonic, transonic and supersonic speed ranges, up to Mach 2. The model was produced by Boeing (Figure 7) and it is physically the same model as the one that had earlier been tested in the NRC/NAE 5ft wind tunnel in Canada, 1.2 m trisonic wind tunnel of INCREST in Romania and several wind tunnels in the USA [36]. The 178 mm diameter model was produced by VTI and, so far, used only in the T-35 wind tunnel of VTI. Both models can be tested on several internal strain-gauge wind tunnel balances from the VTI’s repository, using suitable adaptors. For both models, suitable support stings are used. The sting vs. model base diameter ratio, sting length vs. model base diameter ratio and the cone angle of the transition into support mechanism satisfy recommended values for minimum sting interference (Figure 6) [36].
There is an extensive database already existing for comparison of the results obtained from the new test campaigns [25,26,27,28,29,30,31]. Models were used to provide force and moment data and base pressure.

4.3. The HB Hypersonic Standard Models

HB-1 standard model is an axisymmetric cone-cylinder body with 25° nose cone half-angle [40,41]. The more-used HB-2 configuration [40,41,48,49,50] has a 10° tail flare, added to reduce the sensitivity of the model to viscous effects (Figure 8a). The junctures of the nose and the flare with the cylinder are smooth radius fairings. The unit length for the definition of model geometry is the diameter (D) of the cylindrical part of model forebody. The model length is 4.9 D and the moments’ reduction point is at 1.95 D from the nose (though tests in some wind tunnels were executed with the moments’ reduction point defined at 2.45 D from the nose).
A support sting for the HB models should have a constant diameter of no more than 0.3 D and a length of at least 3 D with a downstream fairing having a 20° half-angle (Figure 8b). The specified dimensions of the sting were selected in order to ensure negligible sting interference on the base pressure in turbulent flow.
VTI has produced two HB models, with the 75 mm (Figure 9) and 100 mm forebody diameters, which are used for measurements of forces and moments in the T-38 wind tunnel.
Both models can be configured as either HB-1 or HB-2. The models can be tested, by means of suitable adaptors, on several force balances from the VTI’s repository. The models were designed as quick-check standards that can easily be installed in the wind tunnel instead of any currently tested model. Force tests of these models were conducted mostly in the supersonic Mach number range.

5. Non-Standard Wind Tunnel Tests

5.1. Instrumentation, Measurement and Data Processing

The performed wind tunnel tests comprised measurements of wind tunnel test section flow parameters, measurements of model position, measurements of forces and moments and measurements of base pressure. Additionally, schlieren visualizations were performed in the supersonic tests in the T-38 wind tunnel. Generally, test setups were standard, as used for other “force” tests in the T-35 and T-38 wind tunnels. As the tests spanned a number of years, some parts of the setups were changed/modernized over time, as indicated below.
Test section flow pressures (stagnation pressure, static pressure, and, at supersonic Mach numbers, pitot pressure) were measured by Mensor 11,603 quartz-bourdon-tube analog-output pressure transducers, which formed the “primary measurement systems” in the wind tunnels. In newer tests in the T-38 wind tunnel, these transducers were replaced by CPT6100 piezoresistive transducers from the same manufacturer, which had higher accuracy (0.01% FS vs. 0.02% FS), with digital outputs.
Stagnation temperature was measured by a K-type thermocouple probe in the T-35 wind tunnel and by a platinum RTD probe in the T-38 wind tunnel. Accuracies of the sensors were about 2.5 and 0.5 K, respectively.
Model position (model support angles) was, in older tests, measured by resolvers, which were, in newer tests, replaced by Hengstler-produced, AC-38, digital-output encoders with the accuracy between 0.01° and 0.02°. Model position was always corrected for sting deflections, on the basis of measured loads and previous calibrations of balance-sting assemblies.
Forces and moments on the models were measured using several six-components strain-gauge balances, depending on the model configuration and expected load range, including Able MkXVIII and MkXXVIII 2-inch-diameter assembled force balances, VTI40A and VTI40B VTI-produced monolithic moment balances and an experimental high-stiffness BV40 monolithic balance with semiconductor strain gauges. Generally, the accuracy of the assembled balances was between 0.1% FS and 0.2% FS, mostly because of the hysteresis inherent to the design type, and the accuracy of the monolithic balances was slightly better than 0.1% FS, except for the axial force component on the high-stiffness balance, which was accurate to 0.9% FS. To determine tare loads due to model and balance weight, several recordings of balance outputs were made prior to each wind tunnel run (the tare phase of each run), the model having a different position in pitch for each of the recordings. Tare loads as functions of model position were then estimated using a least-squares approximation [51].
Base pressure was measured by PDCR10 and PDCR42 silicon piezoresistive transducers produced by Druck, with 0.05% FS accuracy.
Data acquisition system for tests in the T-35 wind tunnel was a Neff System 620, with Neff 300, Neff 600 and Neff 500 subsystems. Accuracy of the system was 0.02% FS. Data acquisition systems used in the T-38 tests were first a Teledyne RMDU with 0.05–0.1% FS accuracy, in later tests replaced with a Pacific Instruments PI6000 system with 0.02% FS accuracy.
Flow visualization in the T-38 wind tunnel was performed using the schlieren method. The apparatus was a Toepler-type folded parallel beam setup with 900 mm field-of-view diameter. Circular optical-quality windows of the same diameter exist on the sidewalls of the supersonic test section of T-38. Light source was a xenon lamp (in newer tests replaced by a LED). A striped three-color red/green/blue filter was used instead of an optical knife edge in the receiver cabinet, the filter being so oriented that the density gradients positive in the direction of the main flow appeared in red color, while the negative gradients appeared in blue. In the darkened areas present in the images the gradients exceeded the set sensitivity range of the schlieren system, the effect being exacerbated by the less-than-perfect collimation of the system optics. It should be noted that schlieren technique shows the density gradients (actually, gradients of the refractive index) integrated through the complete width of the test section, not a “cross-section” of the flow field in the model’s plane of symmetry.
Schlieren images were displayed during runs and recorded using a low-fps-rate, low-resolution (640 × 480 pixels) camera, primary for the purpose of monitoring model safety and the correct establishment of supersonic flow.
Data reduction was performed after each run, using the standard VTI-developed application software package in use with all wind-tunnel facilities in VTI. At the beginning of data processing, all measured signals were converted to a common “normalized” format so that they could be further processed irrespective of the wind tunnel, data acquisition system type or sensor/balance type. The processing then proceeded with computation of the flow parameters, determination of model attitude, computation of forces and moments acting on the models, and computation of aerodynamic coefficients.
Estimates of the uncertainty of measurement were made in the sense of two standard deviations of the relevant quantities on the basis of uncertainties of contributing measurements and the sensitivities of those variables to the changes of the contributing variables (combined Type-B uncertainty). Because of the difficulty of analytically determining the necessary sensitivity coefficients as partial derivatives of various quantities in the complex calculations needed to obtain the aerodynamic coefficients, the derivations were performed numerically. Some of the computed estimates of measurement uncertainties of aerodynamic coefficients are shown in the Table 1.

5.2. ONERA-M Transonic Model in a Subsonic Flow

The ONERA-M4 standard model was adopted and tested in the T-35 facility as a check standard to ensure confidence in wind tunnel tests of aircraft models.
Test results were given in the body axes system for the moments’ reduction point at the distance of 425.56 mm from the model nose. The reference length for calculation of the pitching-moment coefficient was the mean aerodynamic chord.
According to the VTI standard testing procedure, a symmetry check was performed for two runs with the model in the upright and inverted positions [44]. A good repeatability of test results was obtained; the small deviations existed due to the measurement uncertainty of the used internal balance (Figure 10a). Task-type balances, with accuracy somewhat lower than that of monolithic ones, had to be used because of the mechanical design of the model. The tests at Mach 0.2, 0.3 and 0.4 were performed and test data are available for the statistical control and the test quality monitoring.
An inter-facility comparison of the obtained data was made with results from tests of an M1-size model at Mach 0.25 in the NRC/NAE 5ft wind tunnel, under the same aerodynamic conditions [37]. The comparison of the axial force, normal force and pitching moment aerodynamic coefficients is given in the Figure 10b–d. The comparison showed a good agreement with the results of the tests in the NRC/NAE 5ft wind tunnel.

5.3. ONERA-M Transonic Model at High Angles of Attack

ONERA-M4 standard model was tested in the T-35 facility as a check standard for wind tunnel tests of models at high angles of attack (Figure 11a).
It was of interest to ensure confidence in this type of measurement prior to the wind tunnel testing of a training combat aircraft at high angles of attack. There were not available ONERA-M test results for correlation in high AoA range. The only available data were from tests in NAE 5 ft [37] and VTI T-35 facilities, with a straight sting and angles of attack ranging to up to +6°. Angle of attack range in the T-35 wind tunnel model was extended to up to +31° by using the 71° bent sting with additional 20° adaptor. Sample T-35 test results are given in Figure 11b and correlated with referential [37].

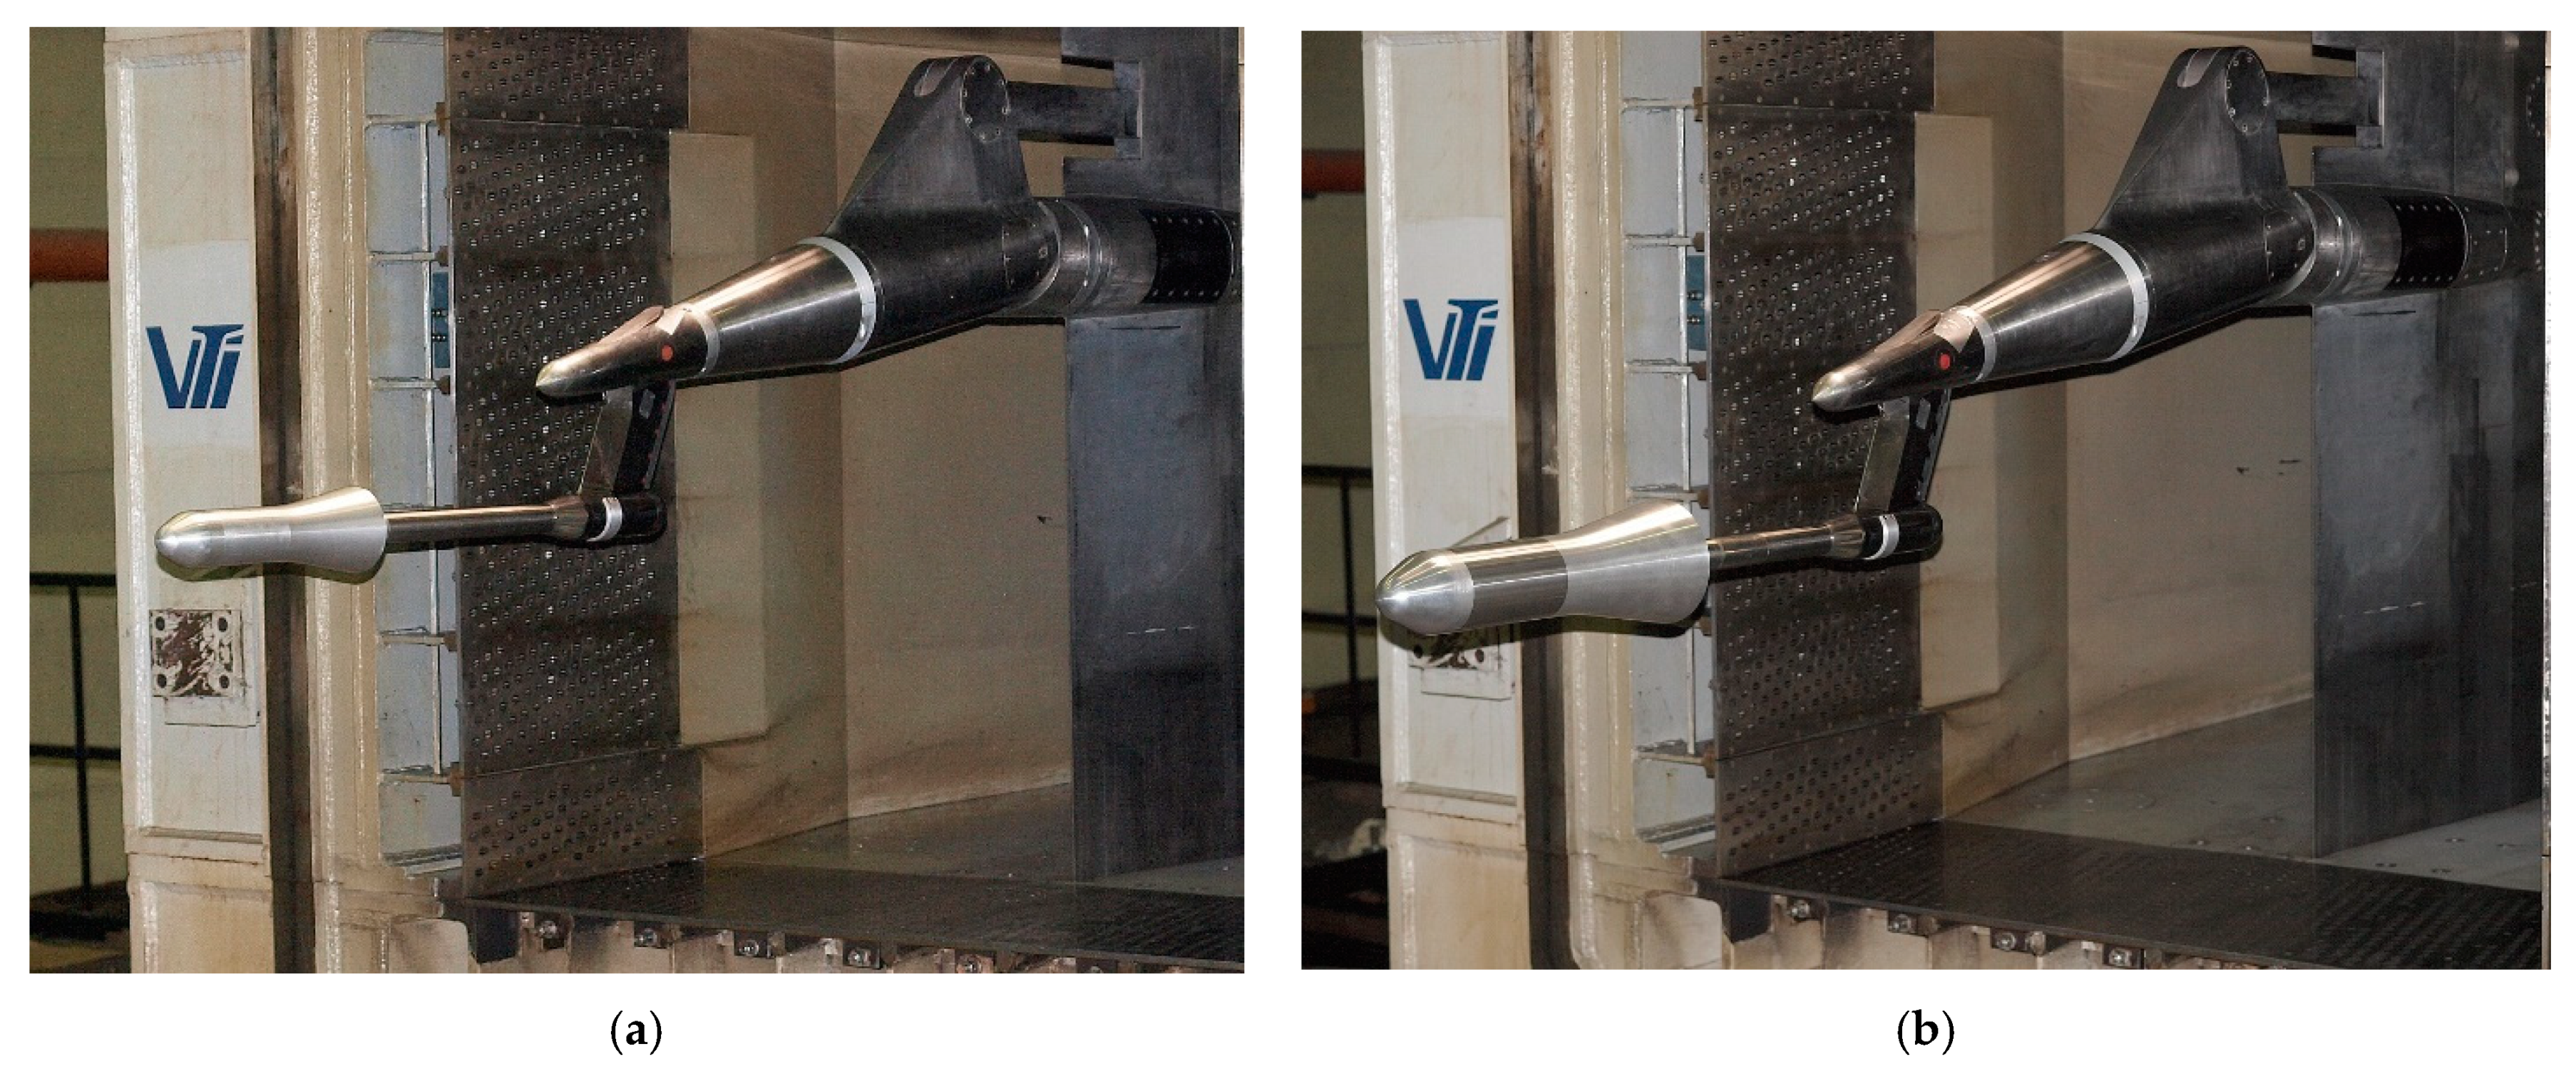
5.4. AGARD-B Supersonic Model in a Subsonic Flow

AGARD-B standard model was adopted and tested in the T-35 facility as a check standard to ensure confidence in wind tunnel tests of winged-missile-like models. AGRAD-B model was used in this facility for the overall verification. The frontal T-35 tunnel blockages of 115.8 and 178 mm diameter models are 0.1% and 0.24% respectively at zero incidence angle.
Sample test results of AGARD-B standard models at Mach numbers 0.1 to 0.4 are presented in Figure 12. As it is customary for the AGARD-B model, test results are given in a wind-axes system located in the reference point of the model at 50% of the mean aerodynamic chord, 5.943D downstream of the model nose. Within-facility correlation was done based on two different model sizes, 115.8 and 178 mm diameter, at Mach numbers from 0.1 to 0.4, Figure 12. Different model sizes were presented with the frontal tunnel blockage (FTB), as a ratio of the model and the test section cross sectional areas in percentage.
The overall facility verification was done on the basis of inter-facility correlation, i.e., test-data from both AGARD-B models were correlated with those from the NRC/NAE 5ft [28] the AEDC 4T [52] and the T-38 wind tunnel (Figure 12), where the same smaller (115.8 mm diameter) model was tested both in VTI T-38 and NRC/NAE 5 ft wind tunnels. A very good correlation was found among the different-model-sizes test-data and among the test-data from different wind tunnel facilities.

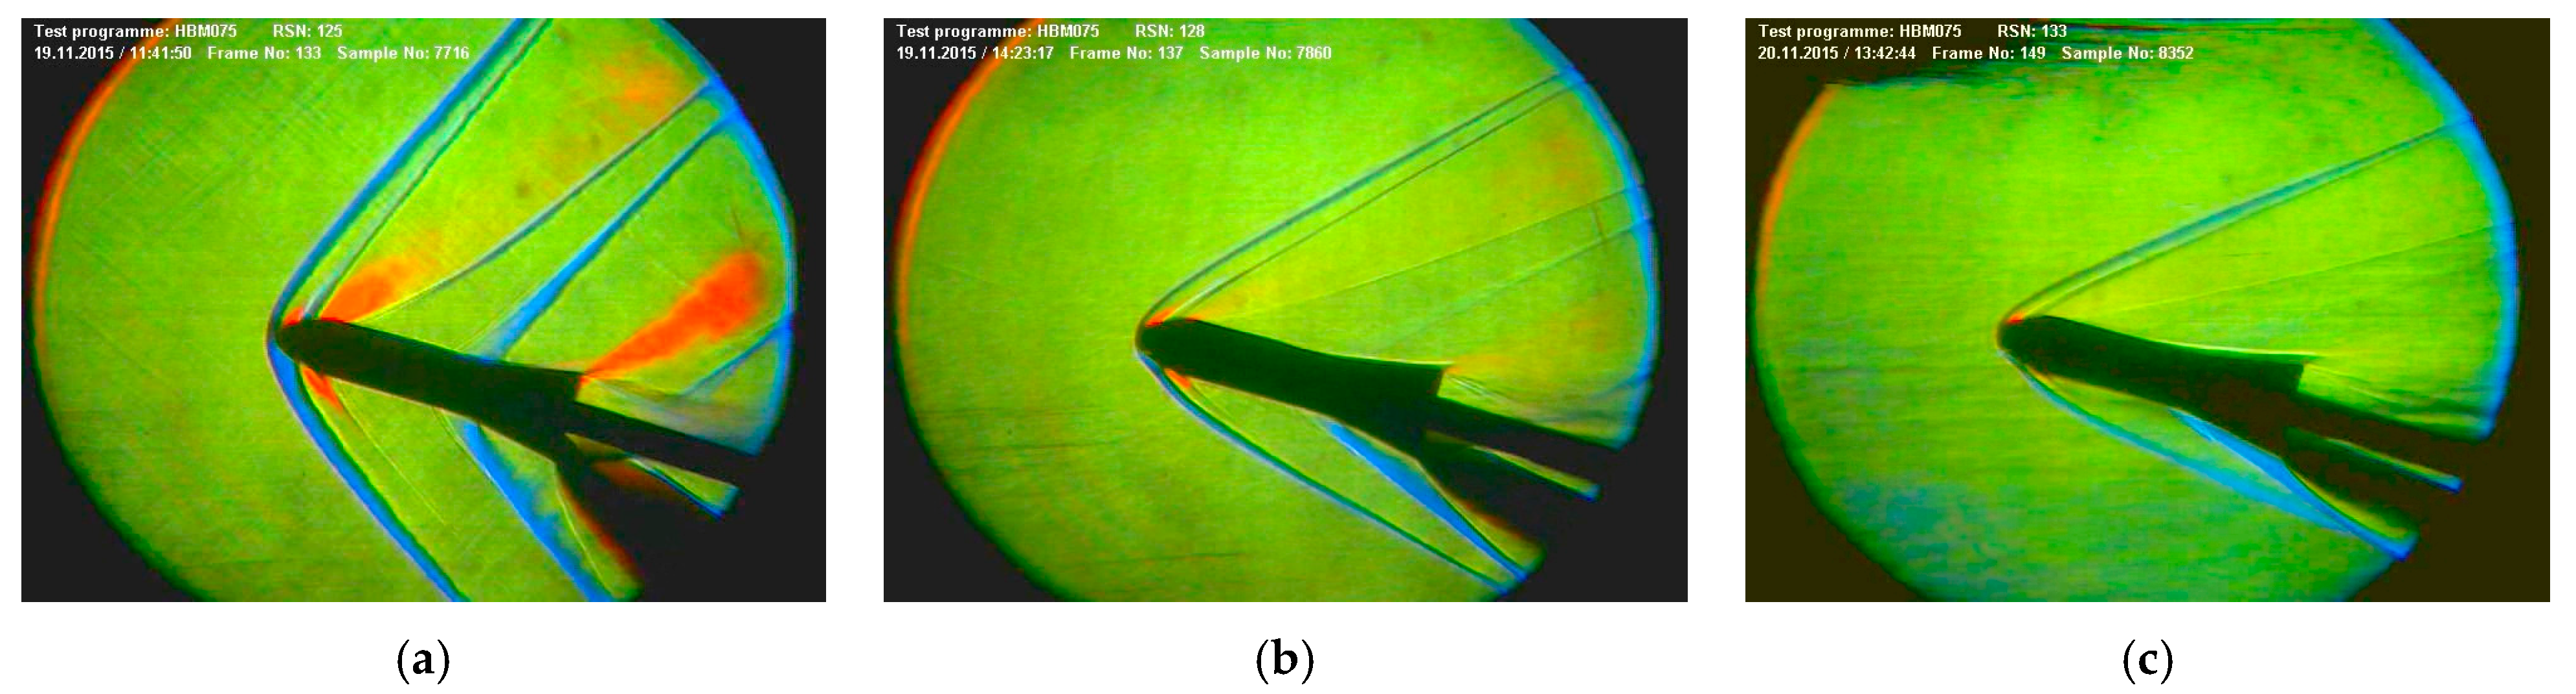
5.5. HB Hypersonic Model in a Transonic Flow

The 100 mm diameter HB-2 standard model has recently been used in the verification tests of a new wind tunnel control system and the data acquisition system [21,22,46]. The model was tested on the 48 mm diameter straight sting using the Able Mk XVIII wind tunnel balance (Figure 13a).
It was found to be of interest to extend test Mach numbers of the HB-2 model [49] to a transonic part of the wind tunnel operating envelope. The larger of the two available HB-2 models produces the frontal blockage of about 0.9% in the test section of the T-38 wind tunnel, i.e., near the recommended maximum blockage for transonic wind tunnels.
Therefore, this configuration can be useful for tuning the Mach number control in the transonic test section of the T-38 wind tunnel. So far, the transonic tests were performed only at Mach 1.2. The extended test data are presented in Figure 13b and correlated with supersonic test results from the same model and the smaller (75 mm diameter) model and with results from the wind tunnels of AEDC and ONERA [40,41,55] and limited free-flight data from NASA Ames Pressurized Ballistic Range [54]. It is planned to perform a more comprehensive transonic wind tunnel test using both the larger and the smaller HB-2 model.

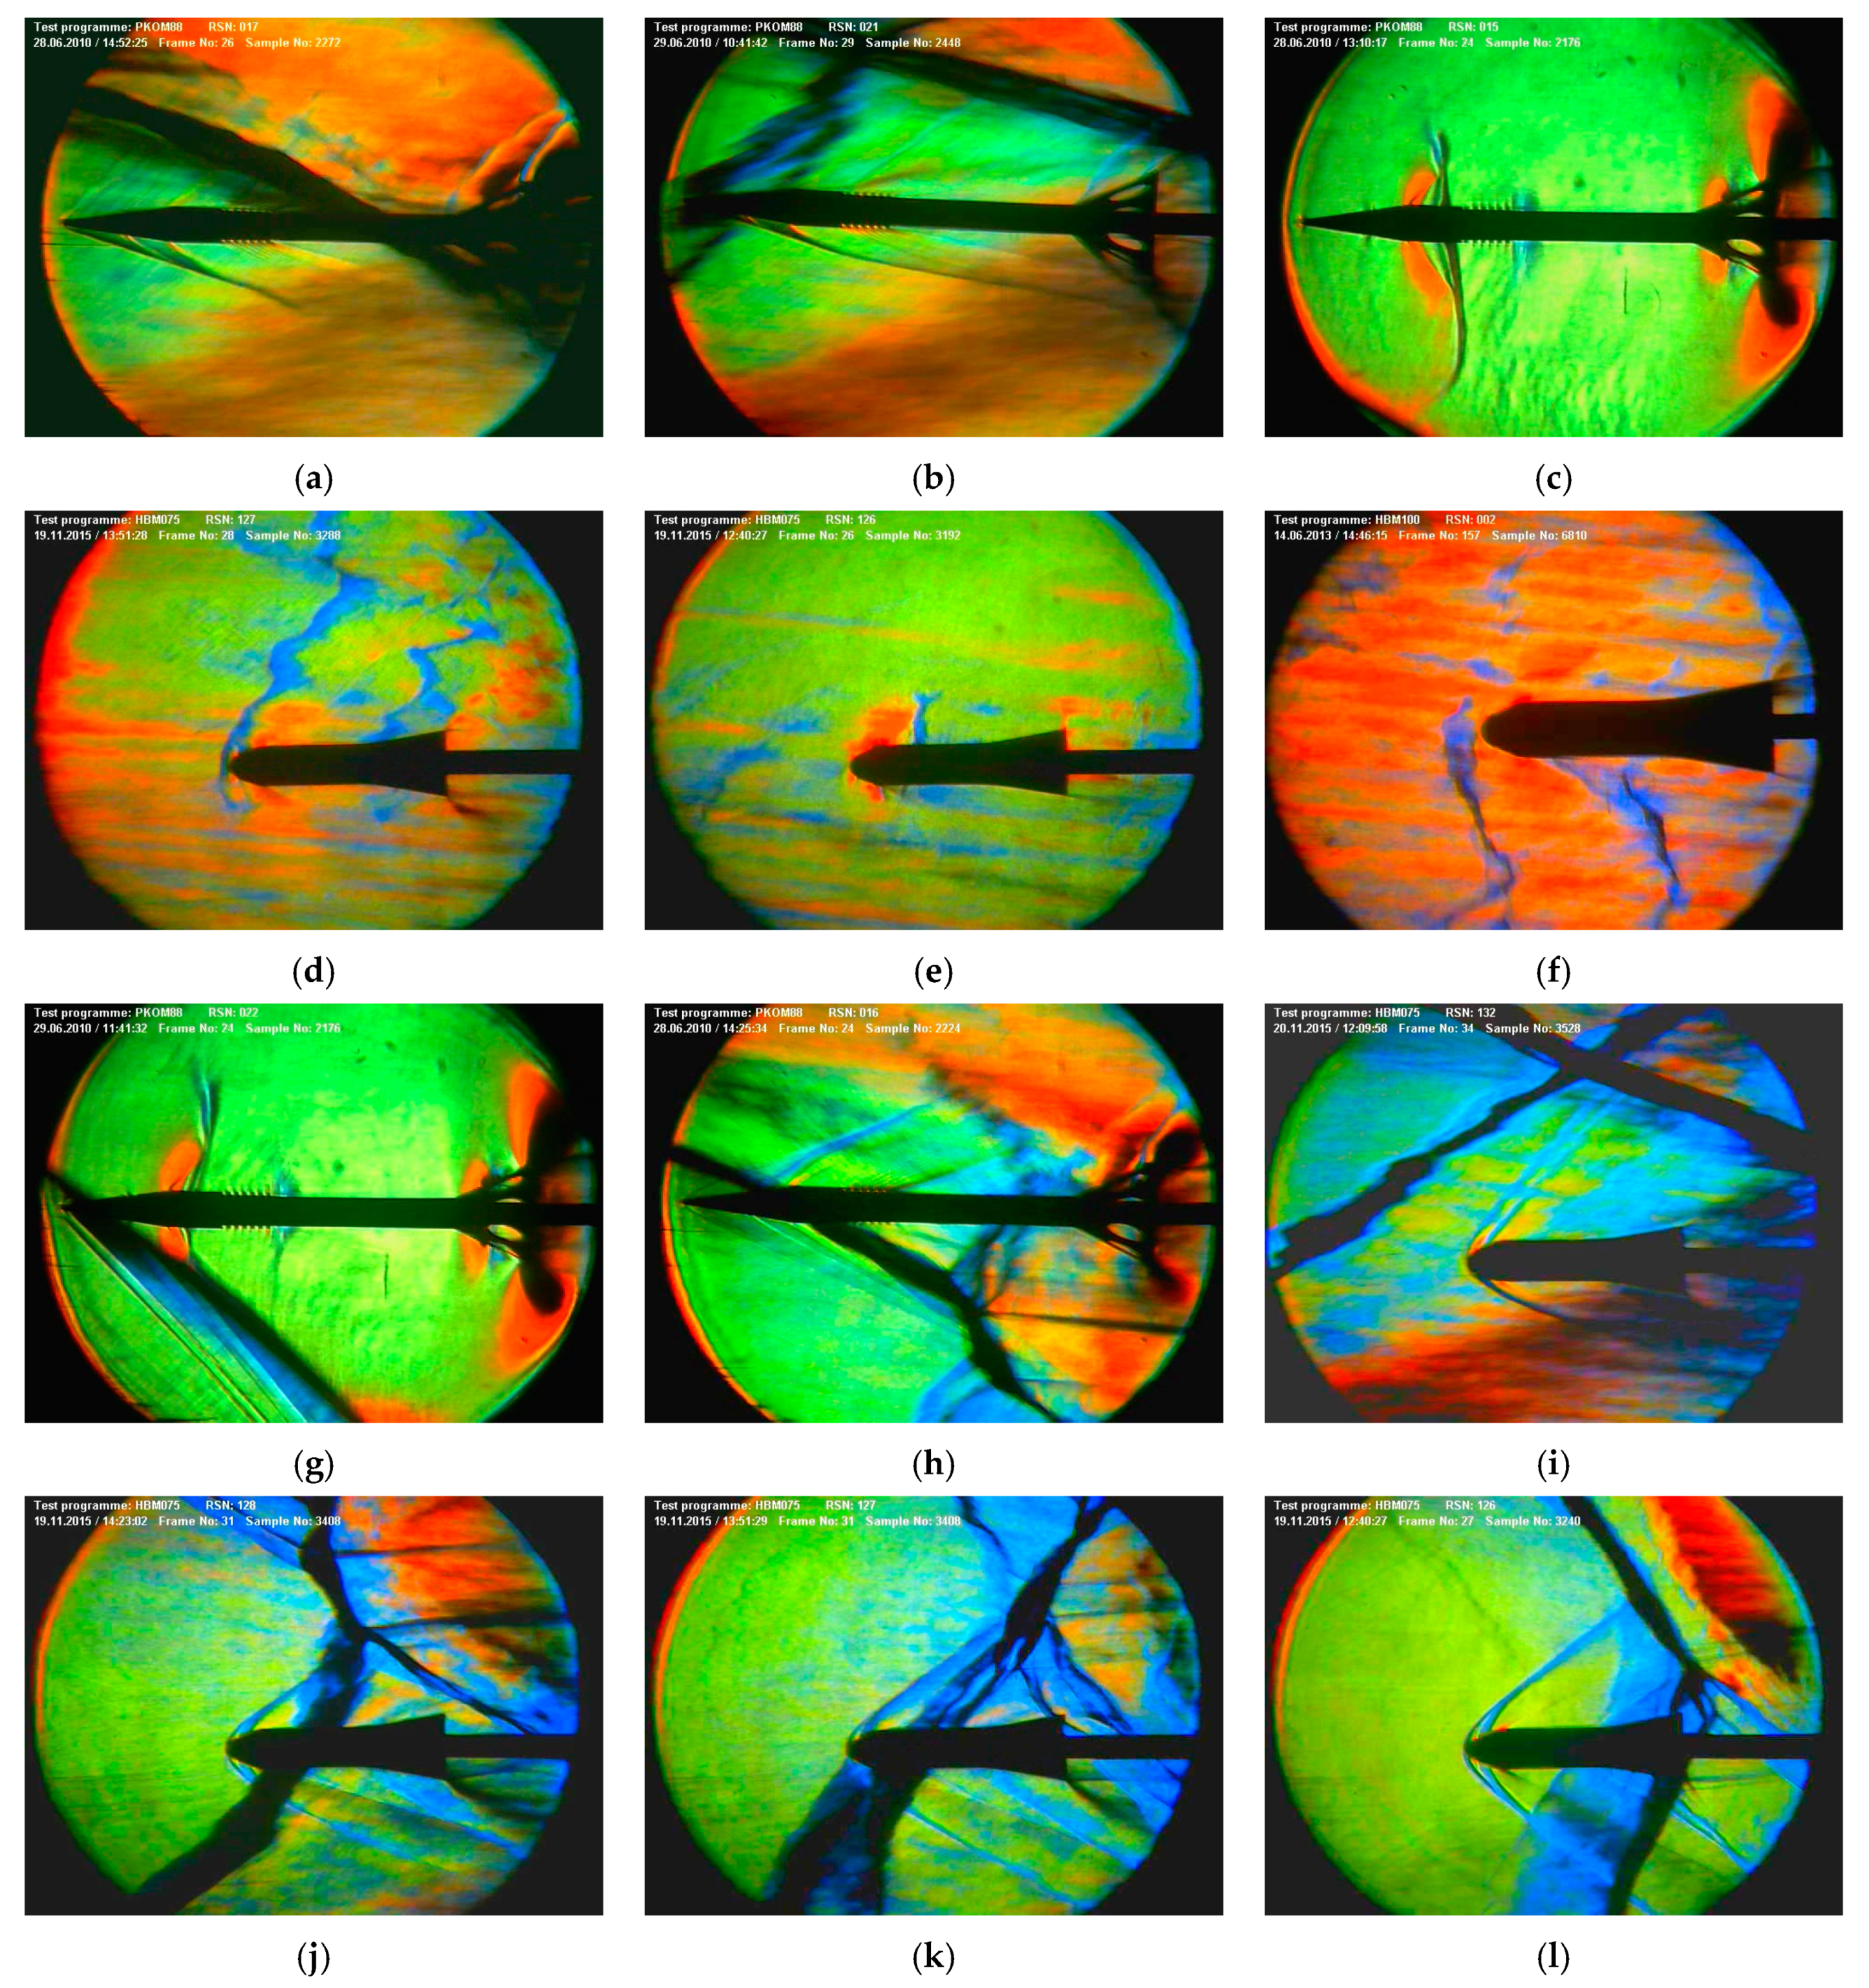
5.6. HB-2 Hypersonic Model at High-Angles-of-Attack

With the increased interest in supersonic wind tunnel tests at high angles of attack, the capability to verify the high-angle-of-attack model-support provisions in the T-38 wind tunnel of VTI was desirable. Such task is conveniently performed by tests of a standard model.
As the reference data on standard models at high angles of attack were scarce, it was decided to create VTI’s own standard-model reference database for future supersonic high-AoA testing. A short series of tests of HB-2 models was performed at Mach numbers 1.5 to 4 at AoA up to 30°. Two sizes of the HB-2 model were tested, having 75 and 100 mm body diameters, on two internal wind tunnel balances, Figure 14.
An articulated sting, with a 10° bend angle was used as the model support, shifting the angle-of-attack range of the model support mechanism from the standard −12°/+20° to −2°/+30°, Figure 15a. Results were correlated to lower-angle-of-attack data from other facilities, Figure 15b. Obtained data was compared to results [50] of previous tests performed in the same wind tunnel in the lower AoA range, and with test results [40,41,55] from the wind tunnels of AEDC and ONERA and limited free-flight data from NASA Ames Pressurized Ballistic Range [54].
Schlieren visualizations of the flow around the 75 mm diameter HB-2 model in the T-38 wind tunnel at Mach numbers 1.5, 2.5 and 3.5 at high AoA are shown in Figure 16.
The collected data were included in the local database of test results for the HB-2 models that is being formed in VTI to be used in future periodic verifications of the T-38 wind tunnel in the supersonic part of the operating envelope. It is also intended to extend the AoA range up to 40° and to collect some data in the transonic speed range as well (some tests were performed at Mach 1.2). The results of the performed tests of the HB-2 models were made available to the wind tunnel community [55], and they may be found to be of use to the researchers in other wind tunnel facilities, and as test cases for the high-angle-of-attack CFD codes.

5.7. AGARD-B and HB Models at Supersonic Flow Start Conditions

The operation of most supersonic wind tunnels is characterized by transient phenomena occurring at the time of the establishing and stopping of the supersonic flow in the test section, when systems of strong normal and oblique shock waves pass through the test section [56]. These shock waves subject the tested model to high aerodynamic loads that can exceed several times the magnitude of loads expected in a steady-state-flow test and can cause unacceptably high stresses in the model and the measuring devices such as force balances. Transient loads generally increase with Mach number and at a particular Mach number they are proportional to minimum operating pressure of the wind tunnel at that Mach number. Often, transient loads are more severe during the stopping of the flow in the wind tunnel than during the starting of the flow, and last for a longer time (in the T-38 wind tunnel of VTI, the starting transient loads last about 0.5 s, while the stopping loads can last up to 3 s).
Flow around the model during the transient processes is very different from the steady state flow in the test section at an established supersonic Mach number. The transient phenomena, illustrated in Figure 17 by color schlieren visualizations of the transient flow around various wind tunnel models, can comprise establishment of the supersonic flow on one side of the model only (Figure 17a,b), symmetric flow patterns with gradual increase of Mach number around the model (Figure 17c), normal shocks existing on one side of the model only (Figure 17d–f), large changes in flow directions along model length, as oblique shock waves pass along the model (Figure 17g–i), and complex flow patterns created by several interacting shock waves (Figure 17h,j–l). The nature of transient loads is dynamic—they are oscillatory, and in the T-38 wind tunnel, their main frequency component is between 10 and 20 Hz.
The magnitudes of supersonic transient normal and side forces on the models are similar to steady-flow loads that can be expected for the same models at angles of attack of about 30°, but transient pitching, yawing and rolling moments exceed several times the magnitudes of moments at any angle of attack or created by any reasonable deflections of control surfaces on the models. Transient pitching and yawing moments also depend on model length, and can be very large for long, slender models (transient moments can be estimated by assuming a force couple, with the magnitude of each force being 1/2 of the maximum total transient force, and the distance of the forces being 1/2 of model length or wing span). Moreover, because of the stochastic nature of the transient loads, they can vary by as much as a factor of two between otherwise identical wind tunnel runs.
Therefore, in supersonic tests, the expected magnitudes of transient loads can be the relevant criterion for the selection of a force balance and a support sting for a particular model. This is of particular interest for supersonic tests of standard models such as AGARD-B or HB-2, because these “reference” tests must often be performed using force balances with a very high load range, or a support sting of a larger diameter, and with a corresponding reduction in the accuracy of measurement. In fact, the relatively-large wing area of the AGARD-B model results in transient loads so large that the testing of this model in the T-38 wind tunnel must be restricted to Mach numbers 2 or lower, as neither of the available force balances nor the standard model-support stings can withstand the transient loads at higher Mach numbers. In the case of the HB-2 model, it proved unsafe [57] to test it at angles of attack above approximately 30° or above Mach 2.5 on a sting having the specified [40] sting diameter of 0.3 D (Figure 8b), and a local de-facto standard sting diameter of 0.5 D was adopted.

6. Conclusions

Modern problems of aircraft aerodynamics are being solved by wind tunnel testing, CFD simulations and/or flight testing. For most aerodynamic problems, none of these disciplines alone can provide all the required information and, ideally, all three would be employed. Although CFD simulation capabilities have seen extensive development in the last few decades, there are many complex aerodynamic phenomena which must be defined in an experimental way, preferably through wind tunnel testing, as flight testing is prohibitively expensive. In recent years, one of the primary roles of wind tunnel testing is providing data for CFD model development and validation, in addition to its traditional role in the aircraft design and performance evaluation.
As experimental aerodynamics will continue to give a critical contribution to aircraft development for the foreseeable future, importance of the validated wind tunnel facility that can produce high-fidelity data cannot be overstated. In recognizing this fact, VTI applies the best practice of continuous monitoring of wind tunnel health by performing periodical check standard tests and transmitting the experience gained for years. Additionally, the constant effort is being made to make standard wind tunnel test data visible and exchangeable among experimental aerodynamics laboratories.
In recent years, VTI’s test facilities responded to increasingly frequent requests for non-standard wind tunnel tests, such as, for example, tests at high angles of attack, by enlarging its repository of standard models, support stings and balances, and embracing the best practice of performing check standard model testing at off-design conditions to verify the experimental setup prior to the intended non-standard wind tunnel test. These activities resulted in further growth of VTI’s check standard testing database, which now includes results of standard model testing at off-design conditions. The accumulated data are used to verify measurement chains in VTI’s test facilities at off-design conditions, as well as for VTI’s inter-facility comparison and correlation. In addition, the standard model testing database extended to off-design conditions can be useful reference and guide for other experimental aerodynamics laboratories.

Author Contributions

Conceptualization, D.D. and Đ.V.; Methodology, Đ.V.; Software, Đ.V. and B.I.; Validation, D.D., Đ.V., G.O. and B.I.; Formal Analysis, D.D., Đ.V. and G.O.; Investigation, D.D., Đ.V., G.O. and B.I.; Resources, G.O.; Data Curation, Đ.V. and B.I.; Writing—Original Draft Preparation, D.D. and Đ.V.; Writing—Review and Editing, B.I.; Visualization, D.D.; Supervision, G.O. and B.R.; Project Administration, G.O.; Funding Acquisition, G.O. and B.R. All authors have read and agreed to the published version of the manuscript.

Funding

This research was funded by the Military Technical Institute (VTI) Belgrade and the Ministry of Education, Science and Technological Development of Republic of Serbia (Project number 451-03-9/2021-14/200325).

Institutional Review Board Statement

Not Applicable.

Informed Consent Statement

Not Applicable.

Data Availability Statement

Not Applicable.

Acknowledgments

This study was supported by the Military Technical Institute (VTI) Belgrade.

Conflicts of Interest

The authors declare no conflict of interest.

References

  1. Ambur, D.; Kegelman, J.; Kilgore, W. Langley Ground Facilities and Testing in the 21st Century. In Proceedings of the 48th AIAA Aerospace Sciences Meeting Including the New Horizons Forum and Aerospace Exposition, Orlando, FL, USA, 4–7 January 2010. [Google Scholar] [CrossRef] [Green Version]
  2. Rhode, M.N.; DeLoach, R. Hypersonic Wind Tunnel Calibration Using the Modern Design of Experiments. In Proceedings of the 41st AIAA/ASME/SAE/ASEE Joint Propulsion Conference and Exhibit, Tucson, AZ, USA, 10–13 July 2005. [Google Scholar] [CrossRef] [Green Version]
  3. DeLoach, R. Applications of Modern Experiment Design to Wind Tunnel Testing at NASA Langley Research Center. In Proceedings of the 36st AIAA Aerospace Sciences Meeting and Exhibit, Reno, NV, USA, 12–15 January 1998. [Google Scholar] [CrossRef]
  4. DeLoach, R. The Modern Design of Experiments for Configuration Aerodynamics: A Case Study. In Proceedings of the 44th AIAA Aerospace Sciences Meeting and Exhibit, Reno, NV, USA, 9–12 January 2006. [Google Scholar] [CrossRef] [Green Version]
  5. Guo, R.; Zeng, Y.; Zhang, J.; Yang, Y.; Li, Z.; Guo, T. A Case Study of Application of Modern Design of Experiment Methods in High Speed Wind Tunnel Tests. Appl. Mech. Mater. 2013, 444–445, 1229–1233. [Google Scholar] [CrossRef]
  6. Zhang, J.; Ma, H.; Qin, Y. Improving Quality of Wind Tunnel Test Data through the MDOE. Procedia Eng. 2015, 99, 1610–1618. [Google Scholar]
  7. Owen, F.K.; Owen, A.K. Measurement and Assessment of Wind Tunnel Flow Quality. Prog. Aerosp. Sci. 2008, 44, 315–348. [Google Scholar] [CrossRef]
  8. Philpott, D.R. Pressure Measurement in a Blowdown Wind Tunnel. Measurement 1985, 3, 107–114. [Google Scholar] [CrossRef]
  9. Reis, M.L.C.C.; Falcão Filho, J.B.P.; Moraes, L.F.G. The TTP Transonic Wind Tunnel Mach Number Uniformity Analysis. Measurement 2014, 51, 356–366. [Google Scholar] [CrossRef]
  10. Bobbit, C.; Everhart, J.; Foster, J.; Hill, J.; McHatton, R.; Tomek, W. National Transonic Facility Characterization Status. In Proceedings of the 38th AIAA Aerospace Sciences Meeting and Exhibit, Reno, NV, USA, 10–13 January 2000. [Google Scholar]
  11. Muylaert, J.; Walpot, L.; Haeuser, J.; Sagnier, P.; Devezeaux, D.; Papirnyk, O.; Lourme, D. Standard Model Testing in the European High Enthalpy Facility F4 and Extrapolation to Flight. In Proceedings of the 28th AIAA Joint Propulsion Conference and Exhibit, Nashville, TN, USA, 6–8 July 1992. [Google Scholar] [CrossRef]
  12. Hemsch, M.; Grubb, J.; Krieger, W.; Cler, D. Langley Wind Tunnel Data Quality Assurance: Check Standard Results. In Proceedings of the 21st AIAA Advanced Measurement Technology and Ground Testing Conference, Denver, CO, USA, 19–22 June 2000. [Google Scholar] [CrossRef] [Green Version]
  13. Adamov, N.P.; Kharitonov, A.M.; Mazhul, I.I.; Vasenyov, L.G.; Zapryagaev, V.I.; Zvegintsev, V.I.; Muylaert, J.M. Investigations of Aerogasdynamics of Re-entry ballistic vehicle Expert. In Proceedings of the International Conference on Methods of Aerophysical Research (ICMAR 2008), Novosibirsk, Russia, 30 June–6 July 2008. [Google Scholar]
  14. DeLoach, R. Check-Standard Testing Across Multiple Transonic Wind Tunnels with the Modern Design of Experiments. In Proceedings of the 28th Aerodynamic Measurement Technology, Ground Testing, and Flight Testing Conference, New Orleans, LA, USA, 25–28 June 2012. [Google Scholar] [CrossRef] [Green Version]
  15. Adamov, N.P.; Vasenev, L.G.; Zvegintsev, V.I.; Mazhul, I.I.; Nalivaichenko, D.G.; Novikov, A.V.; Kharitonov, A.M.; Shpak, S.I. Characteristics of the AT-303 Hypersonic Wind Tunnel, Part 2: Aerodynamics of the HB-2 Reference Model. Thermophys. Aeromech. 2006, 13, 157–171. [Google Scholar] [CrossRef]
  16. Ulbrich, N.M.; Amaya, M.A.; Flach, R. Use of the Ames Check Standard Model for the Validation of Wall Interference Corrections. In Proceedings of the 2018 AIAA Aerospace Sciences Meeting, Kissimmee, FL, USA, 8–12 January 2018. [Google Scholar] [CrossRef] [Green Version]
  17. Vassberg, J.; Dehaan, M.; Rivers, M.; Wahls, R. Development of a Common Research Model for Applied CFD Validation Studies. In Proceedings of the 26th AIAA Applied Aerodynamics Conference, Honolulu, HI, USA, 18–21 August 2008. [Google Scholar] [CrossRef] [Green Version]
  18. Amaya, M.A.; Flach, R.; Garbeff, T.J. A Preliminary Investigation of the Check Standard Model in the NASA Ames Unitary Plan Wind Tunnel. In Proceedings of the AIAA Scitech 2019 Forum, San Diego, CA, USA, 7–11 January 2019. [Google Scholar] [CrossRef]
  19. Kostić, Č.; Bengin, A.; Rašuo, B.; Damljanović, D. Calibration of the CFD Code Based on Testing of a Standard AGARD-B Model for Determination of Aerodynamic Characteristics. Proc. Inst. Mech. Eng. Part G J. Aerosp. Eng. 2021, 235, 1129–1145. [Google Scholar] [CrossRef]
  20. Kryuchkova, A.S. Numerical Simulation of a hypersonic flow over HB-2 model using UST3D programming code. J. Phys. Conf. Ser. 2019, 1250, 012010. [Google Scholar] [CrossRef] [Green Version]
  21. Ilić, B.; Milosavljević, M.; Isaković, J.; Miloš, M. Stagnation Pressure Transient Control in a Supersonic Blowdown Wind Tunnel Test Facility. Mater. Today Proc. 2016, 3, 987–992. [Google Scholar] [CrossRef]
  22. Ilić, B.; Miloš, M.; Milosavljević, M.; Isaković, J. Model-Based Stagnation Pressure Control in a Supersonic Wind Tunnel. FME Trans. 2016, 44, 1–9. [Google Scholar] [CrossRef] [Green Version]
  23. Andreoli, V.; Lavagnoli, S.; Paniagua, G.; Villace, V.F. Robust Model of a Transient Wind Tunnel for Off-Design Aerothermal Testing of Turbomachoinery. Measurement 2016, 82, 323–333. [Google Scholar] [CrossRef]
  24. Kegelman, J.; Danehy, P.; Schwartz, R. Advanced Capabilities for Wind Tunnel Testing in the 21st Century. In Proceedings of the 48th AIAA Aerospace Sciences Meeting Including the New Horizons Forum and Aerospace Exposition, Orlando, FL, USA, 4–7 January 2010. [Google Scholar] [CrossRef]
  25. Damljanovic, D.; Vukovic, D.J.; Ocokoljic, G. Standard Models in the Experimental Aerodynamics Laboratory of VTI. In Proceedings of the 47th International Symposium of Applied Aerodynamics, Paris, France, 26–28 March 2012. [Google Scholar]
  26. Damljanovic, D.; Vukovic, D.J.; Isakovic, J. Standard Wind Tunnel Models and their use in the Wind Tunnels of the Military Technical Institute (in Serbian). In Technical Information; VTI–Military Technical Inst.: Belgrade, Serbia, 2012; pp. 23–90. [Google Scholar]
  27. Isakovic, J.; Zrnic, N.; Janjikopanji, G. Testing of the AGARD B/C, ONERA and SDM Calibration Models in the T-38 1.5 m × 1.5 m Trisonic Wind Tunnel. In Proceedings of the 19th ICAS Congress (ICAS), Anaheim, CA, USA, 18–23 September 1994; pp. 1–9. [Google Scholar]
  28. Damljanovic, D.; Vitic, A.; Vukovic, D. Testing of AGARD-B Calibration Model in the T-38 Trisonic Wind Tunnel. Sci. Tech. Rev. 2006, 56, 52–62. [Google Scholar]
  29. Damljanović, D.; Rašuo, B.; Isaković, J. T-38 Wind Tunnel Data Quality Assurance Based on Testing of a Standard Model. J. Aircr. 2013, 50, 1141–1149. [Google Scholar] [CrossRef]
  30. Damljanović, D.; Isaković, J.; Rašuo, B. An Evaluation of the Overall T-38 Wind Tunnel Data Quality in Testing of a Calibration Model. In Proceedings of the 30th AIAA Applied Aerodynamics Conference, New Orleans, LA, USA, 25–28 June 2012. [Google Scholar] [CrossRef]
  31. Damljanovic, D.; Rasuo, B. Testing of Calibration Models in Order to Certify the Overall Reliability of the Trisonic Blowdown Wind Tunnel of VTI. FME Trans. 2010, 38, 167–172. [Google Scholar]
  32. Kozlovsky, V.A.; Lipnitsky, Y.M.; Lapygin, V.I. A System for Providing Quality of Testing, and Accuracy of Determining Aerodynamic Characteristics of Models at Tsniimash Facilities; TsNIIMash Korolev: Moscow Region, Russia, 2002; pp. 132–137. [Google Scholar]
  33. Ocokoljić, G.; Damljanović, D.; Rašuo, B.; Isaković, J. Testing of a Standard Model in the VTI’s Large-subsonic Wind-tunnel Facility to Establish Users’ Confidence. FME Trans. 2014, 42, 212–218. [Google Scholar] [CrossRef]
  34. AGARD. Specification for AGARD Wind Tunnel Calibration Models AGARD Memorandum; Advisory Group for Aeronautical Research and Development: Paris, France, 1955. [Google Scholar]
  35. AGARD. Wind Tunnel Calibration Models; AGARD Specification 2; Advisory Group for Aeronautical Research and Development: Paris, France, 1958. [Google Scholar]
  36. Hills, R. A Review of Measurements on AGARD Calibration Models; AGARDograph, 64; Hill, A., Ed.; Aircraft Research Association: Bedford, UK, 1961. [Google Scholar]
  37. Galway, R.D.; Mokry, M. Wind Tunnel Tests of ONERA Aircraft Models; Laboratory Technical Report, LTR-HA-5x5/0115; National Aeronautical Establishment: Ottawa, ON, Canada, 1977. [Google Scholar]
  38. Binion, T.W., Jr. Tests of the ONERA Calibration Models in Three Transonic Wind Tunnels; Arnold Engineering Development: Tullahoma, TN, USA, 1978. [Google Scholar]
  39. Yokokawa, Y.; Aoki, Y.; Morita, Y.; Takahashi, H.; Hoshino, H.; Murota, K.; Nonaka, O.; Mashiro, J.; Endo, A.; Yoshida, K.; et al. Transition Measurements of the Aircraft-Model in the 6.5 m × 5.5 m Low-Speed Wind Tunnel. In JAXA Special Publication: Proceedings of the Wind Tunnel Technology Association 71st Meeting; JAXA Special Publication: Tokyo, Japan, 2005. [Google Scholar]
  40. Gray, J.D. Summary Report on Aerodynamic Characteristics of Standard Models HB-1 and HB-2; AEDC-TDR-64-137; Arnold Engineering Development Center: Tullahoma, TN, USA, 1964. [Google Scholar]
  41. Gray, J.D.; Lindsay, E.E. Force Tests of Standard Hypervelocity Ballistic Models HB-1 and HB-2 at Mach 1.5 to 10; AEDC-TDR-63-137; Arnold Engineering Development Center: Tullahoma, TN, USA, 1963. [Google Scholar]
  42. Elfstrom, G.M.; Medved, B. The Yugoslav 1.5 m Trisonic Blowdown Wind Tunnel. In Proceedings of the A Collection of Technical Papers—14th AIAA Aerodynamic Testing Conference, West Palm Beach, FL, USA, 5–7 March 1986. [Google Scholar]
  43. Elfstrom, G.M.; Medved, B.; Rainbird, W.J. Optimum porosity for an inclined-hole transonic test section Wall Treated for Edgetone Noise Reduction. In Proceedings of the 15th Aerodynamic Testing Conference, San Diego, CA, USA, 18–20 May 1988. [Google Scholar]
  44. Ocokoljic, G.; Damljanovic, D.; Vukovic, D.J.; Rašuo, B. Contemporary Frame of Measurement and Assessment of Wind-Tunnel Flow Quality in a Low-Speed Facility. FME Trans. 2018, 46, 429–442. [Google Scholar] [CrossRef]
  45. Ilić, B.; Milosavljević, M. FPGA-based Embedded System for Wind Tunnel Variable-Geometry Nozzle Positioning. Sci. Tech. Rev. 2019, 69, 3–9. [Google Scholar] [CrossRef]
  46. Ilić, B.; Miloš, M.; Isaković, J. Cascade Nonlinear Feedforward-feedback Control of Stagnation Pressure in a Supersonic Blowdown Wind Tunnel. Measurement 2017, 95, 424–438. [Google Scholar] [CrossRef]
  47. Damljanović, D.; Vuković, D.J.; Isaković, J.; Milos, M. Supersonic Test Cases at High Angles of Attack. In Proceedings of the 35th Danubia-Adria Symposium on Advances in Experimental Mechanics, Sinaia, Romania, 25–28 September 2018. [Google Scholar]
  48. Damljanović, D.; Rašuo, B.; Mandić, S.; Vuković, D.J.; Isaković, J. Usability of Comparative Experimental–Numerical Supersonic Test Cases with the HB Reference Model. In Proceedings of the 29th Congress of the International Council of the Aeronautical Scences, St. Petersburg, Russia, 7–12 September 2014. [Google Scholar]
  49. Damljanovic, D.; Rašuo, B.; Vukovic, Ð.; Mandic, S.; Isakovic, J. Hypervelocity ballistic reference models as experimental supersonic test cases. Aerosp. Sci. Technol. 2016, 52, 189–197. [Google Scholar] [CrossRef]
  50. Vuković, D.J.; Damljanović, D. Evaluation of a Force Balance with Semiconductor Strain Gauges in Wind Tunnel Tests of the HB-2 Standard Model. Proc. Inst. Mech. Eng. Part G J. Aerosp. Eng. 2015, 229, 2272–2281. [Google Scholar] [CrossRef]
  51. Galway, R.D. A General Approach to the Application of Force Balance Tares in Wind Tunnel Testing; Aeronautical Report LTR-HA-36; National Research Council of Canada: Ottawa, ON, Canada, 1978. [Google Scholar]
  52. Anderson, C.F. An Investigation of the Aerodynamic Characteristics of the Agard Model B for Mach Numbers from 0.2 to 1.0; AEDC-TR-70-100; Arnold Engineering Development Center: Tullahoma, TN, USA, 1970. [Google Scholar]
  53. Ceresuela, R. Mesurés d’Efforts et de Pressions sur la Maquette Balistique Etalon HB-2 de Mach 2 a Mach 16,5. Note Technique 13/1879 A; ONERA: Palaiseau, France, 1964. [Google Scholar]
  54. Malcolm, G.N.; Chapman, G.T. A Computer Program for Systematically Analyzing Free-Flight Data to Determine the Aerodynamics of Axisymmetric Bodies; NASA TN D-4766; NASA Ames Research Center: Mountain View, CA, USA, 1968.
  55. Damljanović, D.; Vuković, D.J. Supersonic wind tunnel tests of a standard model at high angles of attack. In Proceedings of the 7th European Conference for Aeronautics and Space Sciences EUCASS, Milan, Italy, 3–7 July 2017. [Google Scholar] [CrossRef]
  56. Pope, A.; Goin, K.L. High Speed Wind Tunnel Testing; John Willey and Sons: London, UK, 1965. [Google Scholar]
  57. Vuković, D.J.; Ćurčić, D.; Marinkovski, D.; Damljanović, D.; Samardžić, M.; Vitić, A. Living with Supersonic Starting Loads in the T-38 Trisonic Wind Tunnel of VTI. In Proceedings of the 29th Congress of the International Council of the Aeronautical Scences, St. Petersburg, Russia, 7–12 September 2014. [Google Scholar]
Figure 1. Initially intended and VTI-used Mach number ranges for static tests of standard models.
Aerospace 08 00275 g001
Figure 2. The T-38 test facility in VTI, Belgrade.
Aerospace 08 00275 g002
Figure 3. The T-35 subsonic wind tunnel of VTI: (a) external view; (b) the variable-pitch fan blades of T-35 [44].
Aerospace 08 00275 g003
Figure 4. Theoretical geometry of ONERA-M standard model with dimensions given in terms of body diameter, based on [37].
Aerospace 08 00275 g004
Figure 5. ONERA-M model (M4 size) in the T-35 wind tunnel of VTI.
Aerospace 08 00275 g005
Figure 6. Theoretical geometry of AGARD-B standard model with dimensions given in terms of body diameter, based on [34,35,36].
Aerospace 08 00275 g006
Figure 7. The 115.8 mm diameter AGARD-B standard model: (a) the model in the test section of the T-35 wind tunnel [44]; (b) the model in the test section of the T-38 wind tunnel.
Aerospace 08 00275 g007
Figure 8. Theoretical geometry (a) of the HB-2 standard model, and (b) of the standard sting for the HB models [48] based on [40,41].
Aerospace 08 00275 g008
Figure 9. The 75 mm diameter HB-2 model in the test section of the T-38 wind tunnel [48].
Aerospace 08 00275 g009
Figure 10. Wind tunnel test data; ONERA−M model, Mach 0.25; (a) symmetry check in VTI; (b) inter-facility comparison in axial force coefficient; (c) inter-facility comparison in normal force coefficient; (b) inter-facility comparison in pitching moment coefficient [37].
Aerospace 08 00275 g010aAerospace 08 00275 g010b
Figure 11. (a) ONERA−M4 model in the T-35 wind tunnel; (b) high AoA test data of the ONERA-M4 model obtained in the T-35 wind tunnel [37].
Aerospace 08 00275 g011
Figure 12. Inter-facility correlation in the forebody drag force coefficient of the AGARD−B model [28,33,44].
Aerospace 08 00275 g012
Figure 13. (a) The 100 mm diameter HB−2 standard model in the T-38 wind tunnel; (b) results of the HB−2 model obtained in the T-38 wind tunnel correlated with those from AEDC, ONERA and NASA Ames [40,41,47,53,54,55]; the test has been extended to the transonic part of the T-38 operating envelope.
Aerospace 08 00275 g013
Figure 14. HB-2 models on the articulated 10° bent sting in the T-38 wind tunnel: (a) 75 mm diameter [55]; (b) 100 mm diameter [47].
Aerospace 08 00275 g014
Figure 15. (a) CAD rendering of the 100 mm diameter HB−2 model on the bent sting used in the tests at extreme AoA [47]; (b) Mach 3 results of HB−2 models obtained in the T-38 wind tunnel with the models on two stings and balances, correlated with available results from AEDC (up to +14°) and ONERA (up to +8°) [40,41,55].
Aerospace 08 00275 g015
Figure 16. Snapshots from schlieren-visualization video monitoring of tests of the 75 mm HB-2 model: (a) Mach 1.5, (b) Mach 2.5, (c) Mach 3.5, 20°angle of attack.
Aerospace 08 00275 g016
Figure 17. Schlieren visualizations of transient effects around the HB-2 standard model and a kinetic-energy projectile model in the T-38 wind tunnel: (a,b) establishment of supersonic flow on one side of the model only; (c) symmetric flow patterns with gradual increase of Mach number around the model; (df) normal shocks existing on one side of the model only; (gi) large changes in flow directions along model length; (h,jl) complex flow patterns created by several interacting shock waves.
Aerospace 08 00275 g017
Table 1. Example of measurement uncertainty of aerodynamic coefficients, HB-2 and AGARD-B.
Measurement Uncertainty2σCA2σCN2σCm
100 mm diameter HB-2 model, Mach 1.5, MkXVIII balance0.00400.0230.023
75 mm diameter HB-2 model, Mach 1.5, VTI40B balance0.00290.0090.013
115.8 mm diameter AGARD-B model, Mach 0.4, VTI40A balance0.00290.0200.004
Publisher’s Note: MDPI stays neutral with regard to jurisdictional claims in published maps and institutional affiliations.

