Review

Cost-Effectiveness of Structural Health Monitoring in Fuselage Maintenance of the Civil Aviation Industry

Department of Mechanical and Aerospace Engineering, University of Florida, P.O. Box 116250, Gainesville, FL 32611-6250, USA
*
Author to whom correspondence should be addressed.
A part of this paper has been published at AIAA/SciTech conference: Ting Dong and Nam H. Kim. Reviews of structural health monitoring technologies in airplane fuselage maintenance perspective. In Proceedings of the AIAA Nondeterministic Conference, Kissimmee, FL, USA, 8–12 January 2018.
Aerospace 2018, 5(3), 87; https://doi.org/10.3390/aerospace5030087
Submission received: 6 June 2018 / Revised: 21 July 2018 / Accepted: 7 August 2018 / Published: 13 August 2018
(This article belongs to the Special Issue Civil and Military Airworthiness: Recent Developments and Challenges)

Abstract

:
Although structural health monitoring (SHM) technologies using sensors have dramatically been developed recently, their capability should be evaluated from the perspective of the maintenance industry. As a first step toward utilizing sensors, the objective of the paper is to investigate the possibility of using sensors for inspecting the entire fuselage during C-check. First, we reviewed various sensors for their detection range, detectable damage size, and installed weight, which revealed that the piezoelectric wafer active sensor (PWAS) is the most promising sensor for aircraft SHM. Second, we performed a case study of inspecting the fuselage of Boeing-737NG using PWAS. To maintain the same detecting capability of manual inspection in C-check, we estimated the total number of sensors required. It turned out that utilizing sensors can reduce the maintenance downtime and thus, maintenance cost. However, even with a very conservative estimate, the lifetime cost was significantly increased due to the weight of sensor systems. The cost due to the weight increase was an order of magnitude higher than the cost saved by using SHM. We found that a large number of sensors were required to detect damage at unknown locations, which was the main cause of the weight increase. We concluded that to make SHM cost-effective, it would be necessary either to improve the current sensor technologies so that a less number of sensors are used or to modify the aircraft design concept for SHM.

1. Introduction

In the damage-tolerant design concept, aircraft are maintained for their safety and reliability using periodic maintenance. Structural maintenance of civil aviation aircraft is currently based on scheduled maintenance, where the maintenance interval is determined based on safety and reliability. However, the current practice of scheduled maintenance is expensive for airlines. The inspection and maintenance cost accounts for more than 27% of the total lifecycle cost of an aircraft [1]. There are ongoing research efforts to reduce the maintenance cost by utilizing condition-based maintenance (CBM) where the health status of the system is continuously monitored and maintenance is requested when the safety of the system is threatened [2]. The condition of the structure is monitored using structural health monitoring (SHM) techniques. In the literature [3], various sensor technologies have been employed for SHM. However, many technical and economic issues have to be overcome before CBM can be used for the civil aviation industry.
During scheduled maintenance, aircraft are inspected and repaired at prescribed intervals, such as flight hours or flight cycles. For example, the major maintenance (C-check) of the Boeing 737NG is conducted at every 2800 flight cycles. During major maintenance, inspectors perform a detailed visual inspection (DVI) to detect damage. Non-destructive testing (NDT) can also be performed whenever necessary. The major difficulty in the structural maintenance is to access internal structures for DVI, such as frames and stringers. Therefore, internal surrounding structures, such as walls, ceiling panels, and insulation blankets, need to be removed. This process is time-consuming and can cause unexpected damage to the structure.
Recently, condition-based maintenance (CBM) is proposed, aiming to replace the scheduled maintenance. The basic concept of CBM is to utilize sensors installed on the aircraft structure, called structural health monitoring (SHM) system. The SHM system is used to detect damage and to determine the size and location of damage. Since the SHM system use installed sensors, it is unnecessary to remove internal surrounding structures for inspection. In addition to detecting damage, the SHM can be used to predict the future behavior of detected damage based on damage data at past inspections, which is called prognostics. This makes it possible to predict when the existing damage threaten the safety of the system and repair them before that. Therefore, the scheduled maintenance is often referred to as preventive maintenance, while CBM as predictive maintenance. With prognostics information, it is possible that airlines and MRO (maintenance, repair and overhaul) can schedule and prepare for maintenance in advance. The usage of SHM in CBM can also reduce aircraft downtime by reducing the time of removing and reinstalling surrounding structures, which can increase the availability of aircraft and reduce revenue loss.
In the literature, the safety and lifetime cost-saving by CBM has been discussed. For example, Pattabhiraman et al. [4] showed that the main advantage of CBM is to skip several structural maintenances in early life when there is no severe damage detected. Gerdes et al. [5] showed that it is possible to reduce the maintenance time by 20% for an air-conditioning system using CBM. It has also been shown that CBM can reduce downtime and make aircraft more available by using the Aircraft Technology and Operation Benchmark System (AIRTOBS) [6]. In addition, Fioriti et al. [7] concluded that prognostics can improve airline profit by making aircraft more available. However, most previous studies assumed that the SHM systems can provide damage inspection data online without explaining details of how they can perform such continuous monitoring. In addition, it is crucially important to consider the effect of weight on the airline’s revenue.
The major challenges in applying SHM are the weight increase and continuous monitoring, another important challenge is the change itself. The change from the scheduled maintenance to CBM is too abrupt for the current civil aviation industry to take. In the aviation industry, even slight changes require in-depth safety review and certification, which often takes several months. The changes require approvals from various stakeholders, such as manufacturers, MRO, and the federal aviation administration (FAA). Therefore, it is more likely that a gradual change rather than a radical change might happen in the industry. In this paper, we expect that the first step would be to replace manual inspection with SHM systems while the maintenance interval is still the same as scheduled maintenance. This is also the most probable scenario because non-structural maintenance, such as engine and avionics, can also be performed at the same time. However, even such a simple change requires answering the following concerns: (a) Can the current sensor technologies inspect the entire aircraft structure in the same quality as the current manual inspection? (b) Can the SHM system provide any cost-benefits compared to the current manual inspection? We would like to answer these questions using the case study of fuselage maintenance of the Boeing 737NG, which is the most popular model currently used in civil aviation (based on the number of aircraft in use).
Even if there were prior publications that discussed the cost analysis for CBM [3], this is the first to consider sensor-based inspection of entire fuselage during the conventional C-check. This is a transition state of CBM and can be a near-term implementation of SHM in the civil aviation industry. The uniqueness and contributions of the current paper are as follows: (a) We reviewed and evaluated various sensor technologies from the perspective of aircraft scheduled maintenance, which includes the detection range, detectable damage size, installed weight, and capability to detect closed cracks. (b) Based on the best performing sensors, we estimated the total number of sensors for inspecting the entire fuselage of B737. The number and weights of sensor systems are determined such that the same inspection quality with manual inspection in the conventional C-check during the scheduled maintenance. Most previous applications use sensors locally for hotspot monitoring. (c) In the cost-benefit analysis, we incorporated the cost of the weight penalty, an important factor which is normally neglected in previous literature.
The paper is composed of five sections. Section 2 explains the details of scheduled maintenance and CBM. In Section 3, we reviewed three important sensors that are most likely to be used for SHM. We focused on the detection range, detectable damage size, and installed weight. Based on the selected sensor system, we estimated the total number of sensors required to inspect the entire fuselage in Section 4. Section 5 is a cost-benefit analysis when using SHM to replace manual inspection, followed by conclusions in Section 6.

2. Scheduled Maintenance versus Condition-Based Maintenance

2.1. Scheduled Maintenance

Scheduled maintenance is preventive maintenance that is performed based on predetermined intervals regardless of the health state of an aircraft. Different types of scheduled maintenance are performed throughout an aircraft’s lifecycle. The intensity of scheduled maintenance increases as the intervals increase. These intervals can be either flight hours or flight cycles. For different aircraft models, the maintenance intervals are also different. Scheduled maintenance can be categorized into a transit check—A/B/C/D checks. The transit check is performed after each flight, and only obvious damage is checked by “walking around” inspection, which can be done in half an hour. For B-737, A-check is performed every 100 flight-cycles, and it normally takes about one week. In A-check, only general visual inspection is performed. Since the internal surrounding structures are required to be removed starting from a C-check, only C-check is considered in this paper.
For the Boeing 737NG, the C-check is required at every 2800 flight cycles at a maintenance hangar. During the maintenance, it is required to remove all surrounding structures to make it possible to access internal structures. For accessing fuselage frames and stringers, we need to remove chairs, walls, ceiling and floor panels, and insulation blankets. In addition, the lavatory and galley are also removed. Although internal cables do not need to be removed, they need to be secured to the internal structures using tapes. This removing and preparation process takes about four days by 20 technicians (640 person-hours).
Once the surrounding structures are removed and technicians clean the internal structures, inspectors can easily access the skins, frames, and stringers of the fuselage. C-check utilizes detailed visual inspection (DVI), which is a comprehensive and intensive method of detecting various types of damage, such as dents, corrosions, and cracks. Whenever necessary, inspectors use magnifying lenses and flashlights to assist inspection.
It is known that the DVI can detect cracks in the size of around 0.5 in. It is important to measure the size accurately because different repair methods are employed based on the damage size. When the inspector cannot determine the damage size, NDT methods, such as ultrasonic or eddy current, are utilized to determine the accurate damage size. The DVI usually takes about one week by two inspectors. During the inspection, it is required that all detailed information about the damage should be recorded and sent to engineers.
Once the inspection is finished, engineers make detailed repair plans based on the inspector’s report. If it is regular damage covered in the repair manual, the damage is repaired according to the manual. If the damage is rare and not covered in the manual, engineers in aircraft manufacture need to make a repair plan for the specific damage.
Most structural repairs are based on the structural repair manual (SRM), which includes repair plans for most damage that can be found in aircraft. It is composed of seven chapters, following the same chapter numbering system as Air Transportation Association 100, which includes standard practices and structures-general, doors, fuselage, nacelles/pylons, stabilizers, windows, and wings. It has sections and subjects under each chapter for specific damage at a specific location. Based on the damage location and size in the inspector’s report, engineers choose the appropriate repair method from the manual and prepare a job card explaining the step-by-step procedure for repair. The job card also includes required materials and equipment.
Each subject in the SRM includes three contents: identification, allowable damage, and repair general. The first content, identification, includes basic information, such as material, thickness, and heat treatment state of the original material. The second content, allowable damage, categorizes damage into different levels based on its location and size and indicates which repair method should each level of damage refer to. The repair methods change according to the damage size. Also, the same damage size may have different repair methods depending on its locations. The last content, repair general, describes all available repair methods, detailed repair procedures, and required materials for the repair.
When the detected damage is not covered in the SRM—which means that the specific damage rarely happens—engineers in the maintenance company must report the damage to the aircraft manufacturing company because they do not have the authority to determine the repair method. Then, the engineers in the manufacturing company determine the required repair method based on engineering analysis. It is also possible that the maintenance engineers can propose a repair plan, but it needs to be approved by manufacturing engineers. For rare damage, this process takes about a week.
Using the repair plan, technicians can follow the plan for repair. For a small-sized crack in the fuselage skin, the flush repair is commonly used. A large-sized crack is often removed, and a doubler is attached in the removed area using fasteners. The job card should include the type and number of fasteners for the doubler installation. The job card should also include the usage of materials, size, and heat treatment method in details. It is required that technicians strictly follow the instruction on the job card. Once the repair work is done, the work is checked by inspectors to confirm that the repair meets the operation guidelines. The repair job is considered finished when the inspector signs the job card. Once the repair work is finished, all internal surrounding structures are reassembled, and the aircraft goes through a test run.
In the preventive maintenance concept, since the maintenance interval is 2800 flight cycles, it is necessary to repair very small damage so that a high reliability of the aircraft can be maintained until the next maintenance. However, this means that damage that may not threaten the safety of the aircraft also needs to be repaired. In addition, removing and reinstalling surrounding structures for inspection take a long time, which increases aircraft downtime and loses airline revenue. Therefore, it is understood that the cost-inefficient scheduled maintenance is one of the major costs of airlines. The inspection and maintenance cost accounts for more than 27% of the total lifecycle cost of an aircraft [1]. In addition to the cost, removing and re-installing internal surrounding structures can cause unnecessary damage.

2.2. Condition-Based Maintenance

Although condition-based maintenance (CBM) is a still in the research state, it shows a lot of possibilities in the aircraft maintenance industry. While the main purpose of CBM is to replace the manual inspection in the scheduled maintenance, the broader usage of CBM also includes prognostics, which predicts the future behavior of data.
From a diagnostics perspective, the CBM is different from the scheduled maintenance in the damage detection method but has the identical procedure for repair. In general, CBM uses onboard sensors and on-ground equipment for inspection. The ground equipment is connected to the connection ports, which allows access to onboard sensors. Then, the equipment actuates sensors, collects data, and analyzes data to identify the existence of damage (detection) and the size of damage (quantification). Since the raw data in the waveform include noise and bias, various filtering tools are often incorporated to enhance signals. The waveform data are translated into damage information using various tools and algorithms [8,9]. The types of damage that the CBM can detect are cracks, corrosions, dents in aluminum structures, and delamination and impact damage in composite structures. As mentioned before, the advantage of using SHM sensors is to skip the process of removing surrounding structures to access internal supporting structures.
SHM can also be used for the purpose of prognostics. Since CBM can be conducted more frequently than the scheduled maintenance, it is possible to collect a history of damage growth data and to use them to predict future behavior of the damage. When a physics model that can describe the degradation of damage is available, a physics-based algorithm can be utilized [10]. An et al. [11] used Bayesian inference to identify unknown model parameters of the crack growth model with damage growth data from SHM sensors, from which the future growth of cracks is predicted. Once the model parameters are identified, it is possible to predict when the damage becomes dangerous, and an appropriate maintenance time can be predicted. When the physics model that describes the damage behavior is not available, or when the measured data is indirectly related to damage growth, data-driven approaches can be incorporated. Gaussian process regression and neural network are normally used for that purpose [12].
Instead of the scheduled maintenance at pre-determined intervals, CBM can request maintenance based on prognostics results. Pattabhiraman et al. [4] showed that in its early life CBM can skip several scheduled maintenances because there is no considerable damage detected. In CBM, the maintenance time is determined by considering the detected damage size, the prognostics of damage growth, and the required level of reliability. Normally a damage threshold is determined for a given inspection interval in order to maintain structural reliability. Since the CBM inspection interval is much shorter than that of manual inspection, the threshold is much larger than that of manual inspection. That means that the CBM allows for much larger damage than the manual inspection. Because of this, the CBM can reduce the number of maintenances as well as the number of repairs.
Although the literature has discussed the cost-benefit of CBM [13,14], some fundamental assumptions on CBM may not be practical due to the current level of SHM technology. The first assumption is the real-time health monitoring in CBM, which is the fundamental assumption in most previous cost-benefit analysis research. It is continuous health monitoring using onboard wireless sensors, and damage assessment using the ground station. As will be shown in the following section, however, it is impractical to use wireless sensors to monitor the entire aircraft structure due to the weight penalty and the reliability of batteries. Even if the SHM is performed on the ground after each flight, it is still impractical because the current detection range of sensors requires a large number of sensors to monitor the entire aircraft. The data processing requires operators to actuate each sensor one-by-one, collect all data, and process data to identify damage sizes and location. As will be shown in Section 4, the complete detection procedure may take about three to four days. Considering the time for maintenance between each flight is only half an hour, it is impractical to inspect after each flight.
Even if a lightweight, wireless sensor technology is developed so that continuous monitoring is possible, it takes time to process all collected data. The raw data that are collected in SHM sensors need to be filtered to remove noise and bias, and an appropriate diagnostics algorithm must be used to transform the raw data into useful damage information. Then, prognostics algorithms are employed to predict the future damage growth. Considering we need thousands of sensors to monitor the entire aircraft, it takes a large amount of time to process all data. Therefore, signal processing and computation cost might be much higher than the cost-benefit gained by SHM [3,15].
Different from engine health monitoring, real-time health monitoring might be unnecessary for aircraft structures. For crack growth on fuselage, every flight is one fatigue cycle due to the cyclic pressure increase during the flight and the pressure release on the ground. For an aircraft with 50,000 lifetime flight cycles, crack growth is in its stable crack growth phase in most cases, and crack length increase is infinitesimal in each fatigue cycle. Therefore, inspection after each flight is unnecessary. This is also why the C-check DVI is conducted at every 2800 flight cycles in the scheduled maintenance. The current “damage-tolerant” design concept allows the presence of damage when its size is below the allowable threshold. Therefore, it would make more sense to inspect the damage at a certain interval, not real-time monitoring using CBM.

3. Review of Structural Health Monitoring Sensor Technologies

In general, the sensors used in SHM systems can be categorized as active or passive sensors. Passive sensors detect signals generated by damage due to the evolution of the damage, which does not require an external excitation. Acoustic emission belongs to this category. If damage is detected during flight, this can be a useful method. As we mentioned earlier, however, since the inspection is performed on the ground, it would be difficult to use passive sensors to detect damage. Therefore, we will not consider passive sensors in this paper. Active sensors detect damage by sending a signal to the damage. The most widely used active sensor is the piezoelectric wafer active sensor (PWAS), which uses ultrasonic waves. Also, fiber Bragg grating (FBG) sensors and comparative vacuum monitoring (CVM) sensors are popular. This section briefly explains how these sensors work for detecting damage. Since the purpose is to use them for SHM, we will focus on the smallest size of detectable damage, detection range, the weight of SHM systems, and the possibility of detecting closed cracks. It would be desirable that the SHM systems can detect at least the same damage size the NDT. The detection range will determine the total number of sensors required to inspect the entire fuselage panels. In order to reduce the payload loss, it is important to reduce the weight of the SHM system. Since the inspection is performed on the ground, it is required to detect closed cracks. We will compare all three sensors in these aspects. In addition, the certification challenges in using SHM system are discussed based on the current regulations. Although only three types of sensors are mainly compared, other emerging sensor technologies are also briefly introduced.

3.1. Piezoelectric Wafer Active Sensor

The mechanism of PWAS detecting damage in the material is based on the ultrasonic wave theory. The elastic wave generated by actuators propagates through the material and is reflected when it meets a discontinuity (i.e., damage). The characteristics of the reflected wave, such as time of flight, amplitude, or frequency, are used to identify the location and size of the damage. In the perspective of active sensors, PWAS can be used either as actuator or sensor. For actuation, the PWAS converts an electric voltage to an elastic wave, while an elastic wave induces an electric voltage for sensing.
The mechanism of detecting damage in SHM using PWAS is similar to conventional NDT ultrasonics. Both of them use ultrasonic waves propagating in the structure to detect damage. However, the way that the wave is transmitted from the sensor to structure is different. In SHM, the sensor is permanently attached to the structure by an adhesive layer, which facilitates a strong coupling between the PWAS and the structure. This strong coupling can provide an in-plane strain couple, enabling ultrasonic waves to propagate in the structure parallel to the surface. Therefore, in SHM, permanently installed sensors can detect damage at a certain distance. In conventional NDT, however, the detecting probe is coupled to the structure by gel, which means that the coupling effect is much weaker. The transducer and the structure are displacement coupled. The wave signal is propagated into structure perpendicular to the surface by impinging the structure surface or at some angle if a wedge is used and detects damage in the thickness direction. Thus, conventional NDT requires manually moving the probe on the surface to cover the complete surface area (C-scan).
The usage of sensors to detect damage can be categorized as pulse-echo and pitch-catch [16]. In the former, one PWAS plays for the role of both actuator and sensor. The same PWAS generates pulses and receives signals that are reflected from damage. In the latter, however, one PWAS plays the role of an actuator, while the other is used as a sensor. Phased array [16,17] is a new method based on pulse-echo. It arranges several sensors in a line with a certain space on the structure. Each sensor can work as transmitter and receiver simultaneously. Since the distance from each sensor to target place is different, the time for a wave propagating to that target place is different. By firing this line of sensors sequentially in a specific time delay, it can arrive at the target place at the same time and these signals are superposed. By gradually changing the time delay, a virtual beam can sweep from 0 to 180°. After transforming this data from the time domain to the 2D physical plane, damage can be located by plotting the intensity of signal reflection at each point. It is noted that one plot only represents the damage condition at a specific radius. Compared to regular pulse-echo, the phased array method enables the wave signal emitted from each sensor to focus on the damage with a specific time delay and generates larger amplitude reflection, leading to a higher signal-to-noise ratio and resolution. In addition, the whole interrogation can be done with sensors from a single location. This method is good when the radius is large, which means the target is far away from sensors. When the target is close to the sensor, however, the error is large because the assumption in simplified beamforming algorithms is not valid anymore. To solve this problem, a 2D sensor array was developed [18]. It can detect damage both in the near field and far field and achieve full 360° range detection as well.
Pulse-echo, pitch-catch, and phased array require undamaged structure as pristine information to detect damage. The time reversal method is a baseline-free detection approach [19]. A wave signal received at one point can be time reversed and reconstructed at the source point. If there is damage in between, the reconstructed wave signal will be different because of reflection, refraction, or scatter by the damage. By comparing the different signals, damage can be detected.
Lamb wave is the most common wave for ultrasonic detection on aircraft structures because of its long-distance detection range in thin-wall structures with little amplitude loss. There are two modes of Lamb waves: symmetric mode (S mode) and anti-symmetric mode (A mode). The wave velocity and mode can be calculated from the product of frequency and panel thickness. Only S0 and A0 modes exist when the product is small. As it increases, higher modes, Ak and Sk, k = 1, …, n, are generated [20]. When these multiple modes propagate at different speeds, it would be difficult to analyze the signals reflected from damage. Normally, we only use low-frequency modes as fewer number of lamb modes exist and lower speed modes can give us more time to separate signals generated and received as well. However, the detection is still complicated since at any given frequency, at least two lamb wave modes exist. Single mode wave is crucial for damage detection. Santoni et al. [21] compared the detection results from single mode wave and multimode wave for both phased array method and time reversal method. The results show that single mode wave damage detection has the best image quality. In addition, single mode wave detection can give us the flexibility to use a specific mode to detect a specific damage. For example, S0 mode is better at detecting a through-the-thickness crack, while A0 mode is used for detecting disbond and delamination. For tuning single mode wave, although we cannot completely separate one mode from the others, we can find a specific frequency that one mode dominates, and others are weak. Of course, this frequency is different for different plate thicknesses, materials, and PWAS dimensions. A detailed lamb wave tuning method can be found in Giurgiutiu [22].
Using PWAS to detect damage has been tested on both metallic and composite structures. Zhao et al. [23] used a wing section from E2 aircraft as a sample and put eight sensors in a circle with a diameter of one foot to test the simulated rivet crack and corrosion. The damage was detected and locations were identified using RAPID (reconstruction algorithm for probabilistic inspection of defects). Kessler et al. [24] simulated damage of holes, fiber fracture, and delamination on both laminates and sandwich composite material, and all damage was successfully detected using piezoelectric sensor patches. Grondel et al. [25] used piezoelectric sensors on an aircraft composite wingbox to detect impact damage and disbonding between skins and stiffeners. First, the impact damage was generated by a drop weight mobile impactor and two transducers, one as signal emitter and one as a signal receiver, were installed near the impact location. The impact damage was detected by the frequency change of signals. Then, disbond was introduced by fatigue bending load, which was detected by analyzing the amplitude change.
As the detection range of a single sensor is limited, for structures like an aircraft fuselage, a large number of sensors are required, thus inevitably leading to a complicated cable system. To reduce the number of cables, PWAS sensors are integrated into a thin dielectric film by printing a circuit on it (SMART Layer [26]). This thin film can provide a significant amount of flexibility as it can be attached on a curved surface or even embedded into the composite panel during the layup process. In combination with SMART Layer, a SMART Suitcase can be used for signal processing: generating, receiving, and analyzing signals. It is reported that the SMART Suitcase can connect up to 30 piezo-channels [26].
Ihn and Chang [27] used SMART Layer to detect damage on simulated lap joint of aluminum plates. While the joint is under fatigue loading, two edge cracks are induced near the fastener holes, which were detected using two SMART Layers with 18 piezoelectric sensors each. It was shown that the measured damage index was well correlated with the conventional NDT methods under different loading cycles. It was also proved that cracks in the size of 0.2 in. can be detected with the same level of uncertainty as for the conventional NDT.
SMART Layer is not a new type of sensor. It is an integration of PWAS into a network. Therefore, due to the detection capability of each PWAS, SMART Layer have advantages of reasonably high detection accuracy, large detection range. However, the weight penalty is the main problem when they are used on aircraft structures on a large scale, as it needs a metallic cable/circuit.

3.2. Fiber Bragg Grating Sensors

Fiber Bragg grating (FBG) sensors shown in Figure 1 has a series of parallel lines, called gratings, with different refractive indices printed on the core of optical fiber [28]. When the sensor is deformed due to damage, the spacing between gratings is changed. When a broadband light passes through the grating, a specific wavelength is reflected depending on the spacing of grating. When the structure experiences a local strain due to a crack, this spacing changes, and the reflected wavelength is shifted. FBG sensors detect damage by measuring the shift of reflected wavelength. Therefore, FBG sensors can measure damage when the damage causes strain.
The FBG sensors are relatively light and safe from electromagnetic interference. Because it is small in size, it can be embedded into composite structures without changing the mechanical performance. By implementing different reflective indices at different locations along the fiber, a single optical fiber can incorporate up to 2000 FGB sensors [29]. This significantly reduces cables and connecting ports. Based on its main usage of strain measurement, it can detect barely visible impact damage (BVID) in composite panels. BVID is often caused by low-velocity impacts and it is the main source of composite delamination. This BVID is very dangerous because it can deteriorate the mechanical strength of the internal structure of composite materials, but it cannot be seen from the surface and easy to be neglected. Takeda et al. [30] conducted fatigue tests for a composite panel, which was initially impacted by a drop-weight to induce BVID and VID. The FBG sensors attached to the backside of the panel detected BVID by comparing the spectrum shift between pristine and damaged states. In addition to detecting BVID and VID, there are also other applications of FBG sensors. Baker et al. [31] used FBG sensors to detect the disbond of composite patches on Australian military aircraft. Mieloszyk et al. [32] used FBG sensors to monitor the performance of the aircraft wing made from shape memory alloys by measuring longitudinal strain. Nicolar et al. [33] computed wing shape and measured in-flight loads on a composite aircraft wing using 778 FBG sensors. The dimension of this composite wing is 5.5 m semi-span and 0.74 m root chord. The sensors are installed at a spacing of approximately 12.5 mm. Yeager et al. [34] simulated a connection damage by removing a bolt from a composite test panel. They used a finite element model to find out the most effective locations first and place sensors at those locations. In this experiment, FBG sensors successfully extracted damage feature and detected the damage.
FBG sensor has been proved in the literature that it is good for detecting damage in composite materials such as impact damage and disbond as well as monitoring loading condition. For application in this paper, however, several problems might exist. First, we are using B-737 in the case study, and the structure is metallic. The FBG sensor is mainly used on composite structures rather than metallic structures. Even if we do not confine our application to the B-737, we have to admit that most of aircraft in civil aviation are made from metallic structures. Second, damage location (i.e., the impact location) of the experiment by Takeda et al. [30] is known, and the FBG sensors are placed at the same location. Therefore, BVID damage was successfully detected because FBG sensor is in the same location with the damage. Since FBG is based on strain measurement, the detection ability will diminish quickly as the distance increases. Therefore, FBG is appropriate for detecting damage at hotspots but is not appropriate for detecting damage at an unknown location. Third, since strain depends on damage orientation and location, it is necessary to have a fine grid of FBG sensors to detect damage at an unknown location, which can increase the weight of SHM systems as well as data processing time. Fourth, since FBG sensors identify damage by measuring strain change, it works when the airplane is operating, not on the ground, where all strains disappear. That is, FBG is not appropriate to detect closed cracks. Finally, since FBG measures the change in strains, it requires strains at the undamaged (pristine) state. If there is pre-existing damage, it can only measure the change from the previous damage.

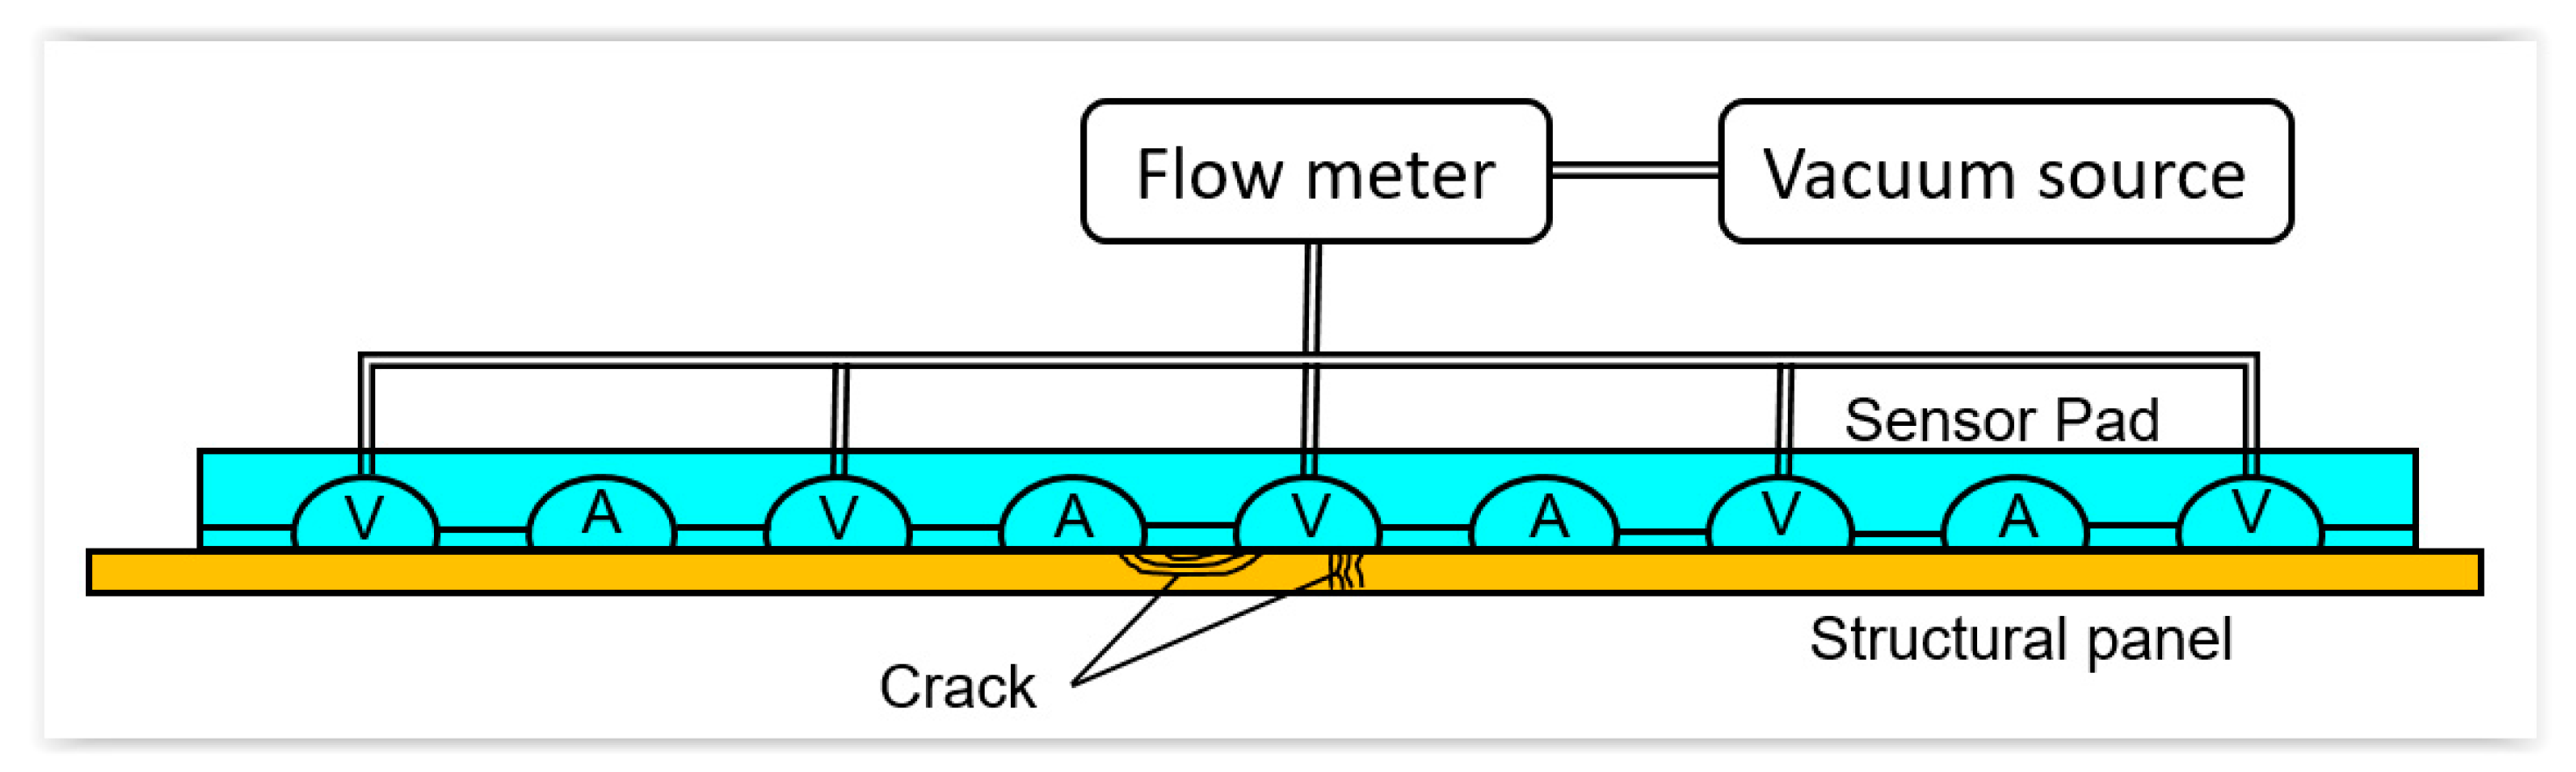
3.3. Comparative Vacuum Monitoring Sensors

Comparative Vacuum Monitoring (CVM) sensors create a pattern of alternating vacuum and atmospheric pressure galleries, as shown in Figure 2. The concept is that if there is no crack on the surface, the vacuum galleries retain their low pressure. However, if there is crack, it can make a channel between the vacuum and atmospheric galleries, and thus, the air in the atmospheric gallery leaks to the vacuum gallery [35]. Therefore, the low pressure in the vacuum gallery goes up. The level of pressure variation can also indicate the size of cracks [36].
The CVM system is composed of a sensor pad, a flowmeter to measure pressure, and a pump to maintain the low pressure in vacuum galleries. Normally the sensor pad is attached to the surface of a structure, while the flowmeter and pump is a part of a portable system with a data logger. When the pump is used to vacuum only the vacuum galleries, the baseline pressure is recorded to the data logger. When there is a crack underneath the sensor, the air can flow from the atmospheric gallery to vacuum gallery, which can raise the pressure in the vacuum gallery. Also, if the sensor pad is disbonded to the structure, the pressure cannot reach the baseline pressure, which means that the system is fail-safe for sensor malfunction. In practice, the sensor pad is permanently attached to the internal supporting structures, while the vacuum lines connect the sensor pad to the inspection port. During the inspection, the inspector connects 16 vacuum galleries with a portable equipment and lowers the pressure in the vacuum galleries.
Sandia National Laboratory tested the CVM on an aircraft panel of thickness 0.1 in. [37] under fatigue loading. They showed that the size of 0.02 in. cracks can be detected with the probability of 90% with the confidence level of 95%. Airbus also tested CVM on the lap and welded joints [38]. Delta airline tested CVM on seven Boeing 737 airplanes [39]. Five inspections were conducted every three months with 68 CVM sensors on the wingbox. The tests showed that cracks on the wingbox fittings can be detected successfully using the CVM sensors.
Since the CVM sensor pad is made of polymer, it is lightweight. Also, the gallery size can be manufactured to as small as 10 μm [35], which allows to detect very small cracks. The CVM sensors also do not require undamaged (pristine) state information or electrical power and can easily be attached to a curved surface. However, the major difficulty of CVM for SHM is that it can only detect damage underneath the sensor. That is, the detection range is zero. Therefore, this type of sensor is good for detecting damage at a hotspot where the damage location is already well-known. If this sensor is used for the entire fuselage, it requires a sensor layout with a very high density.

3.4. Comparison of Three Types of Sensors

As mentioned before, since one of the goals is to choose a sensor technology that is appropriate for detecting damage over the entire fuselage, we compare the three different sensor technologies in the previous section for this application. Also, we consider the situation where the inspection is conducted on the ground at the same time with C-check in the scheduled maintenance, not real-time monitoring as most CBM. Table 1 summarizes the comparison of the three sensor technologies in the above-mentioned scenario. Since the goal is to replace the manual inspection with SHM, the smallest detectable crack size is the most important criterion. Among the three, CVM is the best as it can detect about 0.02 in. cracks. PWAS is almost the same level as conventional NDT, which is around 0.2 in. The FBG is the worst in terms of detectable crack size as it is designed to measure crack indirectly via measuring strain.
The next important criterion is the weight of SHM systems, which includes not only the weight of the sensor itself but also the weight of cables and connection ports. Both CVM and FBG have advantages in weight as they are composed of polymers, while PWAS is heavier as it requires a metallic wire connection or metallic circuit in SMART Layer.
The detection capability of a closed crack is also an important criterion because the inspection will be performed on the ground, not during the flight. During the flight, the structure experiences tensile loading, which can open the crack and make the crack growth. However, on the ground, the load is removed, and most cracks are closed and do not grow on the ground. Since the inspection is performed on the ground, it is important to detect the cracks when they are closed and they do not grow. For CVM, even if the crack is closed, the air can still leak through the existing leakage path. Therefore, it can detect a closed crack. Also, since the closed crack can cause a discontinuity in the material, PWAS can also detect a closed crack. However, since the FBG sensor detects cracks based on strain-induced spectrum shift, it would be difficult to detect the crack on the ground.
Finally, the detection range of the SHM system is important as it determines how many sensors are required to cover the entire fuselage. If a sensor has a long range of detection, a less number of sensors are required, which can reduce the weight of SHM systems. Among the three groups of sensors, it turned out that PWAS shows the longest detection range as the Lamb wave can travel a long distance. On the contrary, CVM has almost zero detection range as it can only detect crack underneath of the sensor pad. FBG sensors can detect damage when the strain caused by the damage is detected by the sensor. However, the strain decays quickly proportional to the distance.
Based on the comparison results shown in Table 1, PWAS turned out to be the most appropriate SHM system for inspecting the entire fuselage of aircraft. This is mostly because of the long detection range of PWAS and the performance of PWAS is almost the same as that of NDT. The CVM sensors would be suitable for monitoring hotspots or pre-determined locations. FBG sensors have advantages for composite material [40] by embedding the fibers during the layup process, which can be used for detecting BVID.

3.5. Certification Challenges to Implementing SHM on Aircraft

For any equipment to be used on aircraft, it has to be certified. Federal Aviation Regulations AC-21-16D indicates environmental conditions and test procedures for airborne equipment. The procedures and criteria include testing in temperature variation, fluids susceptibility, combined loading, vibration, etc. [41]. To implement SHM on aircraft, tests have to be performed to prove the capability to endure such environmental conditions. Kessler [1] discussed how SHM system should be certified in detail. Many laboratory tests have been performed by exposing SHM in various environmental conditions.
To test sensor performance under various temperatures, Blackshire et al. [42] used a PWAS bonded to an aluminum panel as a sample. This sample was exposed to low-temperature cycling with 12 h at 5 °F and then was thawed to room temperature (75 °F). A total of 40 exposures were performed. Using displacement field images, the vibration level is reduced by approximately 1.8% after each exposure. Then, a high-temperature cycle with 1 h at 175 °F and room temperature was tested. A crack was found after 10 cycles.
Lin et al. [43] also tested the performance of PWAS under different temperatures. Different from the previous experiment, a free PWAS and bonded PWAS were tested at the same time, and the characterization method was electromechanical impedance. Free PWAS can survive up to 500 °F. For bonded PWAS, however, the amplitude of impedance peak dropped above 200 °F. The temperature cycling test was also performed between 100 °F and 175 °F. Free PWAS showed no obvious change of impedance spectrum up to 1700 cycles, but for bonded PWAS, it failed because of disbond after 1700 cycles. These two experiments suggest that the decreased performance may be caused by degradation of the adhesive layer under high temperatures and the thermal expansion difference between the sensor and the structure.
For a corrosion environment, different solution environments are simulated [43]. They include saline solution, different types of hydraulic fluid, lubricating oil, and kerosene. The result showed no meaningful change in the impedance spectrum except in the case of the saline solution. PWAS only survived in the saline solution around 85 days due to the detachment of soldered connection.
The durability of PWAS under strain as well as fatigue loading is also important. Lin et al. [43] used a PWAS bonded to a 2024-T3 aluminum plate under tensile loading. Significant impedance change was observed after 3000 microstrains and this change became stronger after 6000 microstrains and failed around 7200 microstrains. Under fatigue cyclic loading, PWAS survived before the aluminum plate broke. Moix-Bonet et al. [44] performed a quasi-static test on a composite structure with PWAS co-bonded on it. Under tensile stress, the PWAS broke when the strain level reaches 0.54%. While under fatigue loading, its performance decreased between 1000 and 10,000 cycles and failed at 10,000 cycles.
Reliability of PWAS under dynamic motion was tested using a dynamic shaker system [42], which produce a maximum strain of 2093 microstrains at the frequency of 70 Hz. Disbonding with a crack as well as a fracture of PWAS were found in displacement field images.
These experiments indicate that sensor durability to environment conditions still needs to be improved to meet the requirement of certification. In addition, one important aspect for certification is the probability of detection (POD). The POD is crucial for maintaining the required safety level. However, the POD assessment process is very complicated and challenging as it requires a large number of independent tests. It is noted that repeated tests on a few specimens cannot be considered as an independent test. Forsyth [45] explained this in detail and proved that it will lead to unconservative POD estimation. In addition, the real part geometry and loading condition, as well as different defects in morphology, are difficult to simulate in a laboratory environment. These all lead to the lack of SHM POD assessment. Janapati et al. [46] studied SHM sensitivity characterization under the condition that the damage location is known. The results show that sensor location and orientation of damage growth have a significant impact on detection reliability. In our application, the damage location and condition are unknown. This leads to even larger uncertainty in the POD of SHM. Lindgren [47] discussed that, for military aviation, because of the validation constraints, Technology Readiness Level (TRL) remains at 4 or less (out of 10) and this becomes a significant barrier for implementing SHM on USAF aircraft.

3.6. Emerging Sensor Technologies

Although only three types of sensors are discussed in this section, there are many new sensor technologies being developed. Although these sensors are developed to overcome the weakness of the conventional sensors, we did not discuss them in this paper because they are still in the developing stage and were not tested in a large scale. However, these sensors are briefly summarized in Appendix A.
Wireless sensors are also popular but are not discussed in this paper. In fact, they should not be considered as a type of sensor, but a sensor network or platform [48]. The main idea is to remove heavy cables and connection ports by replacing them with a wireless connection. Not having cable and connection ports can reduce structural weight significantly, but at the same time, this requires a separate source of power supply, which can penalize weight more. On top of that, adding batteries to the SHM system may require additional maintenance issues. Some researchers have proposed power harvesting [49] for sensors by capturing the required electricity from solar energy or structural vibration. Although it is a promising research area, it is still a challenging research topic to add this technology on the global level of the SHM systems without increasing weight significantly. Therefore, the technology maturity is still low, and it is not included here.

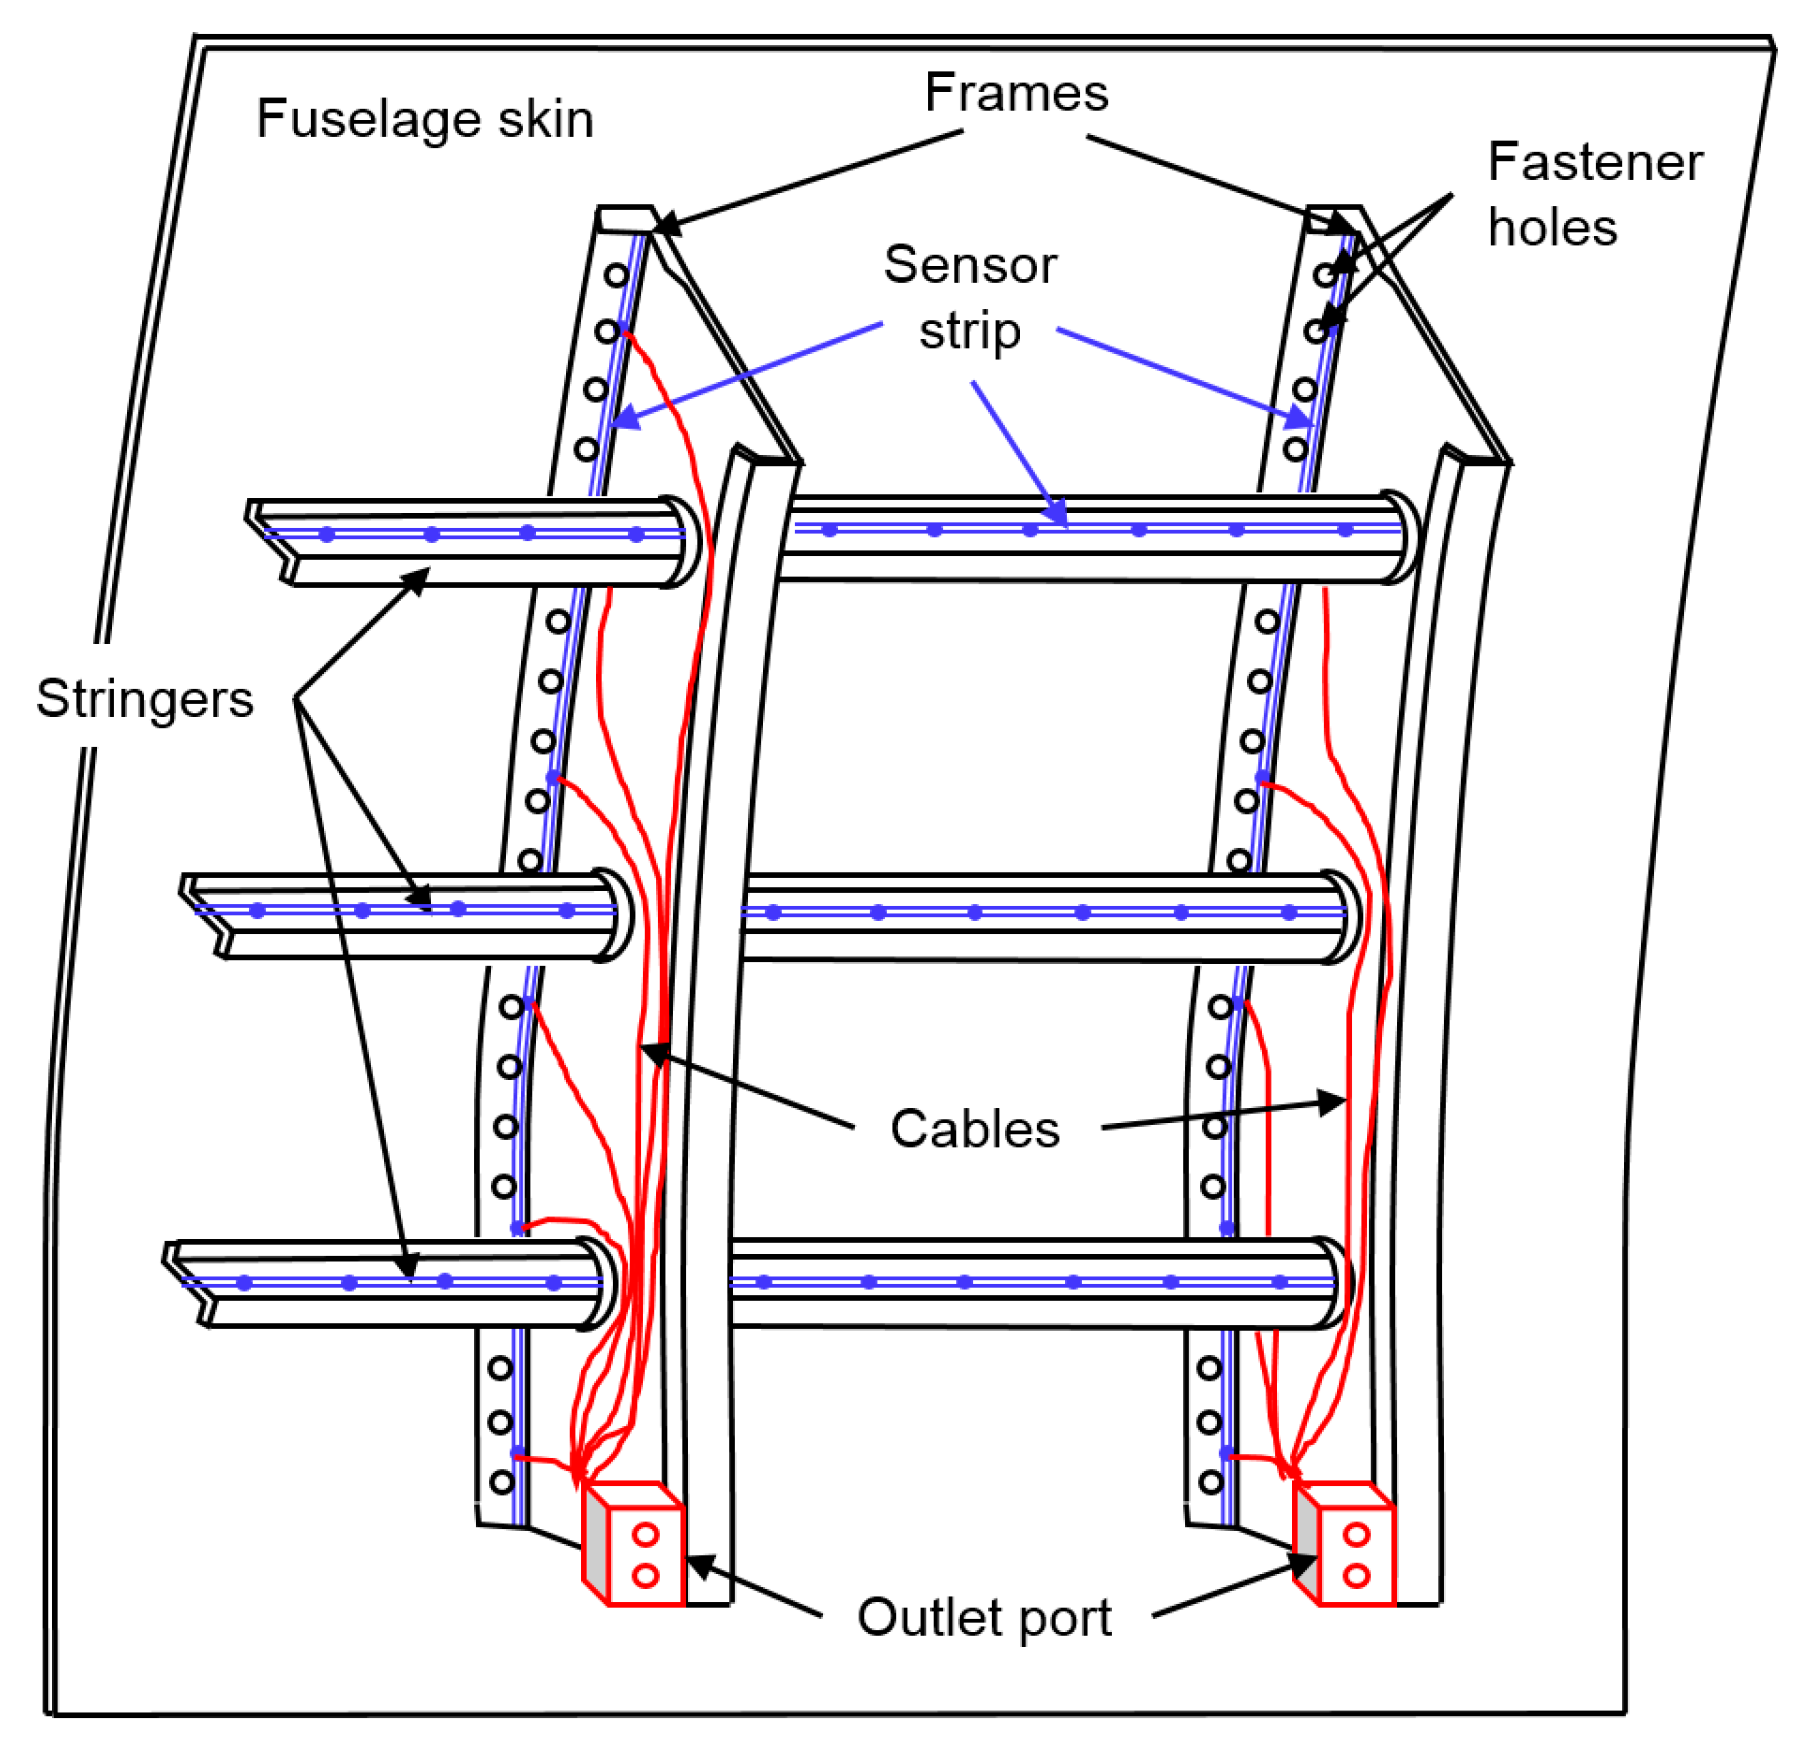
4. Proposed Inspection Schedule and Estimation of the Number of Sensors

Although it is impractical and unnecessary for real-time monitoring in CBM, it is obvious that SHM can effectively detect damage. We just need to find a practical way to integrate SHM into maintenance. The questions become what should be the inspection interval using SHM and how many sensors required to inspect entire aircraft fuselage.
Among different scheduled maintenances, the internal surrounding structures need to be removed from C-check, where DVI and conventional NDT are used. Since the performance of SHM sensors is on the same level as NDT, it would be a good choice to replace the manual inspection during the C-check with SHM sensors. That is, the aircraft goes through the same maintenance intervals as C-check, but only the damage detection is replaced by the SHM sensors. We consider this as a transition from the scheduled maintenance to CBM. As the sensor technology can be developed further, the inspection and maintenance may gradually move to the CBM. Since there is no real-time damage information, prognostics would not be applicable to this approach, and it will not be considered in this paper.
For the sensor layout, it is always a tradeoff between the number of sensors and detection capability. Many optimization approaches have been used to design an optimum sensor layout. Gao and Rose [50] used genetic and evolutionary algorithms to minimize missed-detection probability. Flynn and Todd [51] found out the optimum configuration of actuators and sensors that minimizes Bayes risk using a genetic algorithm with a time-varying mutation rate. Ewald et al. [52] used blob detection algorithm and differential images for a hotspot SHM system. Lee et al. [53] modeled Lamb wave propagation in a 2D plate interaction with artificial damage and found the sensor location when maximum amplitude change of damage occurs compared to the baseline signals. Thiene et al. [54] found the optimal sensor placement using genetic algorithm by achieving maximum area coverage. Janapati et al. [55] used a model-assisted sensor network optimization to find out the optimal location with the maximum POD. Almost all these studies are based on a sample plate with a known damage location. They are good for hotspot monitoring. For inspecting damage on a whole fuselage, however, it is impractical to do optimization or simulation. Especially in a real situation, the geometry is much more complicated, and the damage location is normally unknown. Since we only need to estimate the total number of sensors required rather than the specific location of each sensor, the optimization and simulation method is unnecessary. Almost all layout optimization processes ended up with either a square or hexagon configuration. Therefore, in this paper, we simply use the square as a basic sensor configuration for our estimation. Our goal is to inspect entire fuselage using a minimum number of sensors/minimum weight and achieving the same detection capability as manual inspection in scheduled maintenance.
In the fuselage area, there are many supporting structures inside the skin. The main structure in the hoop direction is called the frame, and the longitudinal direction is the stringer. The cracks on aircraft structures are mostly originated from fastener holes because of defects generated in manufacturing and maintenance process. Because of stress concentration, these cracks grow faster than other areas. Since most of these fastener holes exist in the stringer and frames, it would be a natural choice to install SHM sensors along the fastener holes. In this paper, SMART Layer is used for SHM system. It is assumed that the SMART Layer installed along the fastener hole can also detect cracks in the skin area between them [27].
Damage detection capability of sensors depends on various factors, such as damage size and orientation, material properties, structure geometry as well as environment condition. In this paper, we use a basic value 10 in. as damage detection distance [55]. That means, it is necessary to have one sensor at every 10 in. Based on this sensor resolution, Figure 3 shows a representative layout of SMART Layer along fuselage frames and stringers. For estimating the total number of sensors required it is necessary to calculate the total length of stringers and frames in the fuselage. Considering the fuselage is 100 feet long for Boeing 737NG, there are 60 frames since the distance between frames is 20 in. Also, considering the diameter of the fuselage is 148 in. from SRM and assuming that all frames have the same length, the total length of the frame would be 60 × 3.14 × 148 in. = 27,883 in. In the same way, there are 60 stringers with each of them having 100 feet length. Therefore, the total length of stringers is 60 × 1200 in. = 72,000 in. Therefore, if one sensor is required at every 10 in., we need a total of (27,883 + 72,000)/10 = 9988 sensors.
It should be mentioned that the above estimation is conservative. First, we only consider the main components of the fuselage area, including skin, stringer and frame. There are also many other small components we did not consider in this paper, such as webs, fittings, splices and angle plates. Second, damage detection capability decreases with a complicated geometry of each component. In the case of frames, the interval between fastener holes is less than an inch. That means, there are about 10 fastener holes in 10 in. interval of sensors. Since PWAS uses a Lamb wave to detect damage, it is difficult to detect cracks that are behind a hole. If sensors are located every 10 in., it is likely that some cracks may not be visible from the sensor. Because of this characteristic, Ihn et al. [27] used the same number of sensors with the number of fastener holes. In this paper, however, it is assumed that 10 in. interval of sensors can detect damage in the fastener holes as well as the skin between the frames and stringers, as shown in Figure 3. All these lead to a conservative estimation of the total number of sensors required.
Once sensors are placed on the structure, the next step is to perform inspection using them. Although there are almost 10,000 sensors installed, it is impractical to connect all of them simultaneously. For each SMART Suitcase, it can connect up to 30 sensors at one time [26]. Therefore, we assume that one connection port in the cabin wall is available for every 30 sensors, which means that with 9988 sensors, 333 connection ports need to be installed for the entire fuselage. Therefore, in this layout, the added weight consists of almost 10,000 sensors, 333 connection ports, and connecting cables between the sensors and connection ports. If more than 30 sensors are connected simultaneously, it is possible to reduce the number of connection ports, but at the same time, longer cables should be used to connect all sensors to the port. Therefore, usage of a larger capacity equipment may not provide any weight savings.
The inspection procedure would be that during the C-check the inspectors connect the portable SMART Suitcase to each port and actuate the sensors one-by-one, collect data from the sensors, and analyze the data to acquire damage information, such as the presence of damage, the location and size of the damage. We estimate that this process may take about 30 min for each port. Since there are 333 connection ports, it would require about 167 h. It is rather surprising results because it is expected that having SHM sensors can expedite the inspection process, but in practice, it may take almost the same time as manual inspection due to the considerable number of sensors and the time to process a large amount of raw data.
It may be possible to consider SHM as a part of Integrated Vehicle Health Management (IVHM) system, which is already present in most aircraft. The IVHM is used to collect fault signals from many aircraft components and send the information to the ground control station [56]. The collected information includes engine status, avionics, flight control, propulsion, and utilities. It seems promising to integrate the SHM system into IVHM so that data can be automatically collected and sent to the ground station. However, the current IVHM is designed for monitoring faults from operation, engines and avionics, which are targeting completely different systems rather than fuselage structure. This means that there are no pre-existing data buses or electronics blocks on the fuselage, with which SHM system can be shared, to interact with sensors and process. Currently, there is no IVHM system that can handle almost 10,000 sensors, and connecting all the SHM sensors to IVHM may penalize the weight significantly.

5. Cost-Benefit Analysis

Since the return of investment is an important consideration in the civil aviation industry, introducing a new technology always requires a detailed cost-benefit analysis. It is highly unlikely the industry will adopt a new technology if it failed to bring a significant benefit or safety. As shown in the previous section, since the quality of SHM-based inspection is comparable to manual inspection, it is assumed that SHM can maintain the same level of safety. Therefore, this section discusses the cost-benefit of SHM-based inspection over manual inspection throughout the lifecycle of an aircraft. As we mentioned before, in this paper the SHM system is used for replacing manual inspection. That is, during the C-check, on-board SHM sensors are connected to the ground equipment to detect damage in the entire fuselage skins, frames, and stringers. Therefore, the cost-benefits related to real-time SHM and prognostics are not discussed here.
Since the cost analysis of an aircraft over its lifecycle is really complicated, we limited our cost analysis to those that are affected by replacing SHM sensor-based inspection. In addition, in order to make the cost analysis simple, the following assumptions are made. These assumptions are made in the favor of SHM-based inspection. First, it is assumed that the sensors do not need to be replaced throughout the lifecycle of the aircraft, and all sensors are free of dysfunction. Although this is a significant assumption in cost calculation, it will not change our conclusions because it is a conservative toward the usage of sensors. Boller [15] discussed that in practice the reliability issue of the sensors may overwhelm all the benefits that the sensor technology may bring in.
The second assumption is about the inspection time. It is expected that sensor-based inspection is faster than manual inspection. However, as shown in the previous section, the sensor-based inspection also takes time because almost 10,000 sensors are actuated one-by-one and all raw data are collected and processed to obtain useful damage information. Although the manual inspection requires removing internal surrounding structures, once they are removed, the actual manual inspection time is assumed to be the same as SHM-based inspection.
The last assumption is that the SHM-based maintenance would not require removing surrounding structures to access the internal structures. This is only true when there is no damage detected. However, once the damage is detected, it still needs to remove surrounding structures to access the damage for repair. This process will increase the cost for SHM-based maintenance, but again this assumption will be conservative toward SHM-based maintenance.
In our cost calculation, we will not include those costs that are common for both methods.

5.1. Added Cost Due to SHM Systems

In general, the cost can be categorized by one-time cost and recurring cost. The former is related to manufacturing cost, such as installing sensors and connecting cables and making outlet ports, while the latter is related to recurring maintenance during every C-check. Since we limit our interest to the difference between the two inspection methods, we only consider those costs that are related to the inspection. It is noted that the main source of cost in the aviation industry is the weight. Since the take-off weight of an aircraft is fixed, if an extra weight is added to the aircraft, the payload has to be reduced, which was not clearly mentioned in the cost analysis literature [5,6,7,13,14] for SHM.
Sensor cost: The sensor cost is a one-time cost that occurs during the installation of sensors. Also, off-the-shelf sensors are used instead of research and development of a new sensor. The sensor cost also includes all peripherals to connect the sensor to the structure, cables and connection ports on the cabin wall. Based on Giurgiutiu [22], it is estimated that each sensor with peripherals is about $10. Therefore, using the total number of sensors N s = 9988 calculated in the previous section, the total cost of SHM sensors is
C SHM = N S × C sensor
where C SHM is the cost of the SHM system, and C sensor = $ 10 is the cost for each sensor with its peripherals.
Installation cost: In addition to the sensor cost, sensor installation is also a one-time cost. This includes not only attaching sensors to the structure, but also sophisticated cabling and installing outlet ports to the cabin wall. The installation cost is calculated based on the time to install all sensors with the labor rate per person-hour as:
C install = t install × C mh
where C install is the installation cost, t install is the total person-hours required for installing the SHM system, and C mh is the labor rate per person-hour.
Inspection cost: Different from sensor and installation cost, the inspection cost is a recurring cost. Since the inspection will be performed at every C-check, this is proportional to the total number of C-check N C - check throughout the lifetime of aircraft. The inspection cost can be calculated as
C inspec = t inspec _ SHM × C mh × N C - check
where C inspec is the inspection cost using SHM system, and t inspec _ SHM is the total person-hours required for inspection using SHM system in one C-check. As we mentioned in the assumption, however, since t inspec _ SHM is the same as the time for manual inspection, it is unnecessary to consider the inspection cost for the purpose of comparison.
Cost caused by extra weight: It turned out the weight increase by SHM system is the major issue for the cost. Unfortunately, this issue has been either ignored or inappropriately estimated. For example, the cost due to the extra weight of the SHM system was calculated based on extra fuel cost [57]. Indeed, weight change directly leads to the change in fuel consumption and many airlines benefit from it. To reduce fuel cost, Delta changed the seats five pounds lighter. Lufthansa reduced 506 pounds by removing auxiliary fuel tanks from their A340 aircraft. Northwest put 25% less water for toilets usage on international flights and they saved $440,000 a year for every 25 pounds water removed [58]. However, the calculation of fuel cost change due to weight change is only applicable when the weight is reduced. When weight is increased, we cannot simply calculate the extra fuel cost. To analyze the cost due to the weight increase, it is necessary to consider some aircraft weight conceptions and regulations first. Depending on how the weights are certified, they can be categorized as manufacturer certified weights and operator certified weights [58]. Maximum Zero Fuel Weight (MZFW) is a manufacturer certified weight; that is, the maximum allowable weight before usable fuel is loaded. Operational Empty Weight (OEW) is an operator certified weight; that is, the weight of aircraft equipped for service, including manufacturer’s empty weight, standard items, and operator items. Payload, by definition, is the load that can produce revenue, including passenger, baggage and cargo, which can be calculated from
Max . Payload = MZFW OEW
In the above equation, MZFW is basically a fixed value for a specific aircraft model, whereas OEW can vary in each aircraft depending on its configuration as required by the operator. A payload-range diagram shows the trade-off between flight range and payload an aircraft can carry. To simply put, within the diagram limitation, larger payloads can result in shorter flight range. Excessive weight can also reduce the safety margin in case of emergency and compromise aircraft performance, such as requiring longer takeoff run, higher takeoff speed, and reduced climb angle. In the Aircraft Flight Manual or Pilot Operating Handbook, there are charts indicating allowable flight performance corresponding to a different weight. The pilot needs to check it before the flight to determine whether it is safe to fulfill the proposed flight based on the OEM and how the aircraft is loaded.
According to FAA regulation, an operator should record any weight changes larger than 5 lbs for medium-cabin aircraft after situations such as structure alteration and modification [59]. If cumulative weight change is more than 0.5% of the maximum landing weight, the OEW should be reestablished. For the B737-700, the maximum landing weight is 128,000 lbs [60]. This means that when the weight exceeding 640 lbs, the OEM has to be reestablished. In our application, as discussed in the previous section, one connection port is installed on the cabin panel for every 30 sensors. The total weight can be calculated as
W SHM = W set × N S 30
where W set is the weight of each set including 30 sensors and their accessories. If we assume W set is 3 lbs, the total weight W SHM is 1000 lbs, which means that OEW should be redefined and the maximum payload is reduced by 1000 lbs. For maintaining aircraft performance and safety margin, the only way we can calculate the cost due to extra weight is estimating the revenue loss due to losing payload.
For commercial aircraft in civil aviation, reducing payload means reducing the number of passengers. It is assumed that the weight of one passenger including luggage is 200 pounds, and the ticket price for one passenger is $200 for one flight on average. Therefore, for every one pound of weight increase due to the SHM system, the airline lost $1 in each flight. Then the total life cycle revenue lost due to the weight of the SHM system is
C weight = W SHM × P × N fc
where P is the ticket price for each pound in each flight, and N fc is the total number of flights of B-737NG over its lifecycle.

5.2. Benefits of SHM Systems

There are several cost-benefits from using SHM-based inspection. In order to perform a manual inspection, it is required to remove internal surrounding structures so that inspectors can access the internal structures. This process takes person-hours for labor, and airlines lose revenue due to maintenance downtime. The SHM-based inspection can take this as a cost-benefit. In the following analysis, we will calculate the benefit of SHM-based inspection for a single C-check, and then, the total benefits can be calculated by multiplying with the total number of C-checks throughout the lifetime of the aircraft.
Benefit for not removing/reinstalling surrounding structures: As mentioned in Section 3, the process of removing surrounding structures takes about four days by 20 technicians and about the same time to reinstalling them after maintenance. On the other hand, SHM-based inspection does not require removing the surrounding structures. The first benefit can be calculated in terms of person-hours that can be saved using SHM-based inspection. In the case of the Boeing 737NG, a regular C-check takes about a month, among which eight days are used for removing and reinstalling the internal surrounding structures by about 20 technicians. Therefore, the benefit of saving this labor work via an SHM-based inspection can be estimated as
B labor = t manual × C mh × N C - check
where B labor is the benefit for saving the labor work of installation and removal internal surrounding structures for manual inspection, t manual is the total man-hours required for the removal and installation process, and N C - check is the total number of C-checks in the lifetime.
Benefit due to reduced maintenance downtime: For every single day the aircraft stays in the hangar for maintenance, it means one day’s revenue lost for the airline. The major benefit of the SHM-based inspection method is to reduce the aircraft downtime for the C-check, which can lead to recovered revenue for the airlines. As estimated in the labor calculation, the downtime can be reduced by eight days at every C-check. For airlines, net revenue due to downtime is about $27,428 per day [61]. Accordingly, the life cost saving can be calculated as
B avail = t downtime × R daily × N C - check
where B avail is the benefit of more availability due to reduced maintenance downtime, t downtime is the reduced downtime in one C-check, and R daily is the airline daily revenue.

5.3. Cost-Benefit Analysis Results

In order to calculate cost-benefit by using SHM-based inspection, Table 2 summarizes the best-estimate values of variables that are used. These parameters are based on the discussions in the previous sections as well as from the literature. As mentioned before, these parameters were selected in the favor of SHM-based inspection. Therefore, the actual cost-benefit might be significantly different from the one calculated in this paper. However, since we took a conservative estimate in the favor of SHM-based inspection, the conclusions remain unchanged.
Using these variables, Table 3 showed the cost-benefit analysis results. It showed that the cost due to payload loss is an order of magnitude higher than all other factors combined. This happened because the weight increase was significant due to a large number of sensors to cover the entire fuselage area. With a conservative estimate of Wset = 3 lbs for 30 sensors with all peripherals, the total weight of SHM system would be more than 1000 lbs, which is equivalent to losing about five passengers in each flight. Compared to other sensors in IVHM, such as accelerometers or temperature or pressure sensors, the current technology of SHM requires too many sensors, which is the bottleneck of the sensor-based SHM. Therefore, even with a conservative estimate in the favor of SHM-based inspection, it can be concluded that the cost is overwhelmingly higher than benefit by using SHM system, and it is impractical to replace manual inspection with SHM-based inspection for the current aircraft.

5.4. Discussions

Using cost-benefit study, the main factor to determine the cost-benefit is the payload loss due to the weight of SHM systems. This is because the current sensor technology requires too many sensors to replace the manual inspection. The weight of the SHM system is more than 0.5% of maximum landing weight, which requires reevaluating the Operational Empty Weight, OEW, and leads to losing the payload. The payload loss results in the revenue loss because it limits the maximum number of passengers. It would be necessary that the current SHM technology needs to be developed so that either each sensor assembly is lighter or each sensor can have a larger range of detection.
It is true that we did not fully utilize the capability of the SHM system by incorporating it only with C-check, not real-time monitoring and prognostics. That is, the SHM might be cost-efficient if the scheduled maintenance is completely removed, and the maintenance is conducted only when the damage actually threatens the safety of the aircraft. As presented in the previous section, for stable damage growth, it is unnecessary to have real-time monitoring as damage grows slowly. This is also related to the current concept of “damage-tolerant design”, which allows damage to exist on the structures as long as its size is below the threshold. That is, the current aircraft structures are strong enough to keep the aircraft safe even if small-sized cracks exist during scheduled maintenance intervals. However, if real-time monitoring and prognostics are available, it might be possible to reduce the structural weight significantly because the structure does not need to hold the cracks until the next C-check. Such a reduction in weight can compensate for the weight increase due to SHM systems. Our conclusion is that the structural design concept can be optimized with the maintenance approach. In order to achieve a full advantage from SHM-based CBM, a new design concept needs to be developed.
It is noted that we use the Boeing 737NG as an example in the case study because it is the most popular model currently in civil aviation. The conclusion from this case study is applicable for aircraft with metallic structures, such as the A320, A330, B747, B757, B767, and B777. These cover most of the aircraft in current commercial civil aviation. As the size of aircraft increases, the larger the number of sensors required. For new aircraft models with composite structures such as the B787 and A380, it will be a different story. In the case of the Boeing 787, for example, about 50% of the structure is manufactured using composite materials, while traditional aircraft are composed of 20%. In addition to their lightweight composite materials, they also significantly lower the number of fastener holes by up to 80%. Therefore, it is promising to design SHM systems for new aircraft model with composite materials, which have a lot of potential to reduce the maintenance cost.

6. Conclusions

In this paper, various sensor technologies are reviewed in terms of the smallest detectable damage size, detection range, and weight for the perspective of aircraft structural maintenance. It turned out that the Piezoelectric Wafer Active Sensor (PWAS) is the most promising system to replace the current manual inspection during C-check. However, replacing the current manual inspection with an SHM-based inspection anticipates several challenges. Due to the limited detection range of the PWAS, it would require about 10,000 sensors to assess the entire fuselage areas of a Boeing 737NG. The weight increase due to sensors, cables, and connection ports is more than 1000 lbs, which can lead to a significant loss of payload.
The cost saving due to reducing maintenance downtime and labor is about $5 M over the lifetime of the plane, while the revenue loss due to payload is about $50 M. This calculation is based on a conservative estimate in the favor of SHM. Therefore, the aviation industry cannot take advantage of this new technology. In order to make the SHM-based inspection cost-effective, it would be necessary to improve the sensor technology to reduce the weight of the sensor system and to detect damage in a long range. Also, the structural design concept also needs to be integrated/optimized with CBM.
In this study, we did not consider the reliability of sensors, which is an important aspect of a practical point of view. Maintaining about 10,000 sensors in good condition during the lifecycle of the airplane may add additional cost.

Author Contributions

The first author T.D. reviewed sensor technologies and compared their performances for fuselage inspection. The first author also performed cost-benefit analysis. The second author N.H.K. designed sensor layouts for fuselage inspection.

Funding

This research was supported by Air Force Office of Scientific Research (Contract No. 84796). This support is gratefully acknowledged.

Conflicts of Interest

The authors declare no conflicts of interest.

Appendix A. Summary of Emerging Sensor Technologies

Appendix A.1. Carbon Nanotube Sensors

The electrical properties of carbon nanotube vary as the atomic structure changes. When strain in carbon nanotube changes, the resistance changes accordingly. The linear change of resistance with respect to strain has been proved experimentally [62]. This property can be used as a sensor to measure the strain and detect cracks in structures. The idea is to use a grid of carbon nanotubes to cover a large area to detect damage. This sensor can either be sprayed on the surface of the structure or embedded into the composite material as a pre-cured layer with very little weight penalty. However, to put this into practice, problems such as resistance drift and high noise to signal ratio have to be improved.

Appendix A.2. Printed Sensors

Printed sensors have gain popularity recently because of their low cost. There are several different types of printed sensors. Inject printed sensor uses a moving nozzle to deposit ink on PET substrates. The ink is normally a nanoparticle-based material with electrical function. Using this piezoelectric property of the ink material, resistance change can be measured when the sensor is subjected to strain. Inject printed sensor is proved to have high strain sensitivity and strain tolerance level [63]. However, it has problems such as temperature-dependent resistance, high transverse strain sensitivities, and nozzle clogging as well. To solve the clogging problem, the aerosol printed sensor is developed. The main difference is that ink material is broken into macroscopic particles by ultrasonic vibration of the atomizer. It shows higher flexibility as well as better control on-line width [64]. However, the sensor reliability problem and temperature dependent resistance still exist.

Appendix A.3. Microelectromechanical System (MEMS) Sensors

Microelectromechanical system (MEMS) is a miniaturization and integration of sensors, actuators and integrated circuit for signal processing and control functions. It can either work in a passive way, by listening to signals generated by damage, or in an active way, by generating signals to interact with structures. In an active way, similar to PWAS, actuators in MEMS can send out wave signal to interrogate the material and the reflected signal is received by sensors. The difference is that MEMS has its own signal processor integrated on the chips. It also incorporates antennas to transmit signals. This powerful multifunctional chip can be manufactured to the submillimeter range [65]. Its small size enables MEMS to be lightweight and non-instructive. This technique is targeting for real-time monitoring application in the future and its whole function requires a power supply.

Appendix A.4. Acoustic Emission

Acoustic emission is not a specific type of sensor but a detection approach. It can use PWAS or FBGS as sensors to receive signals. However, instead of using wave signals generated by actuators, this approach receives acoustic emission waveform signals generated by the damage itself. For example, when a fatigue crack propagates in the material, it generates acoustic emission signals. By analyzing acoustic emission parameters such as the amplitude and arrival time, damage can be located, and damage size can be measured. An advantage of this technique is that a small number of sensors is required to monitor a large area. However, it cannot be used in our application. Acoustic emission is a typical passive detection approach and it can only be used for real-time monitoring during flight because the acoustic emission signals only generated when the damage propagates or is under loading condition [66].

References

  1. Kessler, S.S. Certifying a structural health monitoring system: Characterizing durability, reliability and longevity. In Proceedings of the 1st International Forum on Integrated Systems Health Engineering and Management in Aerospace, Napa, CA, USA, 7–10 November 2005; pp. 7–10. [Google Scholar]
  2. Jardine, A.K.; Lin, D.; Banjevic, D. A review on machinery diagnostics and prognostics implementing condition-based maintenance. Mech. Syst. Signal Process. 2006, 20, 1483–1510. [Google Scholar] [CrossRef]
  3. Boller, C.; Chang, F.; Fujino, Y. Encyclopedia of Structural Health Monitoring; John Wiley & Sons: Hoboken, NJ, USA, 2009. [Google Scholar]
  4. Pattabhiraman, S.; Gogu, C.; Kim, N.H.; Haftka, R.T.; Bes, C. Skipping unnecessary structural airframe maintenance using an on-board structural health monitoring system. Proc. Inst. Mech. Eng. Part O J. Risk Reliab. 2012, 226, 549–560. [Google Scholar] [CrossRef]
  5. Gerdes, M.; Scholz, D.; Galar, D. Effects of condition-based maintenance on costs caused by unscheduled maintenance of aircraft. J. Qual. Maint. Eng. 2016, 22, 394–417. [Google Scholar] [CrossRef]
  6. Hölzel, N.; Schilling, T.; Gollnick, V. An aircraft lifecycle approach for the cost-benefit analysis of prognostics and condition-based maintenance based on discrete event simulation. In Proceedings of the Annual Conference of the Prognostics and Health Management Society 2014, Fort Worth, TX, USA, 29 September–2 October 2014; pp. 442–457. [Google Scholar]
  7. Fioriti, M.; Pavan, G.; Corpino, S.; Fusaro, R. Impacts of a prognostics and health management system on aircraft fleet operating cost during conceptual design phase by using parametric estimation. In Proceedings of the 5th CEAS Air & Space Conference, Delft, The Netherlands, 7–11 September 2015. [Google Scholar]
  8. Taha, M.R.; Lucero, J. Damage identification for structural health monitoring using fuzzy pattern recognition. Eng. Struct. 2005, 27, 1774–1783. [Google Scholar] [CrossRef]
  9. Kim, H.; Melhem, H. Damage detection of structures by wavelet analysis. Eng. Struct. 2004, 26, 347–362. [Google Scholar] [CrossRef]
  10. Coppe, A.; Pais, M.J.; Haftka, R.T.; Kim, N.H. Using a simple crack growth model in predicting remaining useful life. J. Aircr. 2012, 49, 1965–1973. [Google Scholar] [CrossRef]
  11. An, D.; Choi, J.H.; Kim, N.H.; Pattabhiraman, S. Fatigue life prediction based on Bayesian approach to incorporate field data into probability model. Struct. Eng. Mech. 2011, 37, 427–442. [Google Scholar] [CrossRef]
  12. Kim, N.H.; An, D.; Choi, J.H. Prognostics and Health Management of Engineering Systems: An Introduction; Springer: Berlin/Heidelberg, Germany, 2016. [Google Scholar]
  13. Leao, B.P.; Fitzgibbon, K.T.; Puttini, L.C.; de Melo, G.P. Cost-benefit analysis methodology for PHM applied to legacy commercial aircraft. In Proceedings of the 2008 IEEE Aerospace Conference, Big Sky, MT, USA, 1–8 March 2008; pp. 1–13. [Google Scholar]
  14. Feldman, K.; Jazouli, T.; Sandborn, P.A. A methodology for determining the return on investment associated with prognostics and health management. IEEE Trans. Reliab. 2009, 58, 305–316. [Google Scholar] [CrossRef]
  15. Boller, C. Next generation structural health monitoring and its integration into aircraft design. Int. J. Syst. Sci. 2000, 31, 1333–1349. [Google Scholar] [CrossRef]
  16. Giurgiutiu, V.; Cuc, A. Embedded non-destructive evaluation for structural health monitoring, damage detection, and failure prevention. Shock Vib. Dig. 2005, 37, 83–105. [Google Scholar] [CrossRef]
  17. Giurgiutiu, V.; Bao, J. Embedded-ultrasonics structural radar for in situ structural health monitoring of thin-wall structures. Struct. Health Monit. 2004, 3, 121–140. [Google Scholar] [CrossRef]
  18. Yu, L.; Giurgiutiu, V. In situ 2-D piezoelectric wafer active sensors arrays for guided wave damage detection. Ultrasonics 2008, 48, 117–134. [Google Scholar] [CrossRef] [PubMed]
  19. Xu, B.; Giurgiutiu, V. Single mode tuning effects on Lamb wave time reversal with piezoelectric wafer active sensors for structural health monitoring. J. Nondestruct. Eval. 2007, 26, 123–134. [Google Scholar] [CrossRef]
  20. Worden, K. Rayleigh and Lamb Waves-Basic Principles. Strain 2001, 37, 167–172. [Google Scholar] [CrossRef]
  21. Santoni, G.B.; Yu, L.; Xu, B.; Giurgiutiu, V. Lamb wave-mode tuning of piezoelectric wafer active sensors for structural health monitoring. J. Vib. Acoust. 2007, 129, 752–762. [Google Scholar] [CrossRef]
  22. Giurgiutiu, V. Tuned Lamb wave excitation and detection with piezoelectric wafer active sensors for structural health monitoring. J. Intell. Mater. Syst. Struct. 2005, 16, 291–305. [Google Scholar] [CrossRef]
  23. Zhao, X.; Gao, H.; Zhang, G.; Ayhan, B.; Yan, F.; Kwan, C.; Rose, J.L. Active health monitoring of an aircraft wing with embedded piezoelectric sensor/actuator network: I. Defect detection, localization and growth monitoring. Smart Mater. Struct. 2007, 16, 1208. [Google Scholar] [CrossRef]
  24. Kessler, S.S.; Spearing, S.M.; Soutis, C. Damage detection in composite materials using Lamb wave methods. Smart Mater. Struct. 2002, 11, 269. [Google Scholar] [CrossRef]
  25. Grondel, S.; Assaad, J.; Delebarre, C.; Moulin, E. Health monitoring of a composite wingbox structure. Ultrasonics 2004, 42, 819–824. [Google Scholar] [CrossRef] [PubMed]
  26. Lin, M.; Qing, X.; Kumar, A.; Beard, S.J. Smart layer and smart suitcase for structural health monitoring applications. In Proceedings of the Smart Structures and Materials 2001: Industrial and Commercial Applications of Smart Structures Technologies, Newport Beach, CA, USA, 14 June 2001; International Society for Optics and Photonics: Bellingham, WA, USA, 2001; Volume 4332, pp. 98–107. [Google Scholar]
  27. Ihn, J.B.; Chang, F.K. Pitch-catch active sensing methods in structural health monitoring for aircraft structures. Struct. Health Monit. 2008, 7, 5–19. [Google Scholar] [CrossRef]
  28. Staszewski, W.; Boller, C.; Tomlinson, G.R. (Eds.) Health Monitoring of Aerospace Structures: Smart Sensor Technologies and Signal Processing; John Wiley & Sons: Hoboken, NJ, USA, 2004. [Google Scholar]
  29. Di Sante, R. Fibre optic sensors for structural health monitoring of aircraft composite structures: Recent advances and applications. Sensors 2015, 15, 18666–18713. [Google Scholar] [CrossRef] [PubMed]
  30. Takeda, S.; Aoki, Y.; Ishikawa, T.; Takeda, N.; Kikukawa, H. Structural health monitoring of composite wing structure during durability test. Compos. Struct. 2007, 79, 133–139. [Google Scholar] [CrossRef]
  31. Baker, W.; McKenzie, I.; Jones, R. Development of life extension strategies for Australian military aircraft, using structural health monitoring of composite repairs and joints. Compos. Struct. 2004, 66, 133–143. [Google Scholar] [CrossRef]
  32. Mieloszyk, M.; Krawczuk, M.; Zak, A.; Ostachowicz, W. An adaptive wing for a small-aircraft application with a configuration of fibre Bragg grating sensors. Smart Mater. Struct. 2010, 19, 085009. [Google Scholar] [CrossRef]
  33. Nicolas, M.J.; Sullivan, R.W.; Richards, W.L. Large scale applications using FBG sensors: Determination of in-flight loads and shape of a composite aircraft wing. Aerospace 2016, 3, 18. [Google Scholar] [CrossRef]
  34. Yeager, M.; Todd, M.; Gregory, W.; Key, C. Assessment of embedded fiber Bragg gratings for structural health monitoring of composites. Struct. Health Monit. 2017, 16, 262–275. [Google Scholar] [CrossRef]
  35. Wishaw, M.; Barton, D.P. Comparative vacuum monitoring: A new method of in-situ real-time crack detection and monitoring. In Proceedings of the 10th Asia-Pacific Conference on Nondestructive Testing, Brisbane, Australia, 18–21 September 2001. [Google Scholar]
  36. Choi, C.H. New Vacuum Sensor for Detecting Surface Cracks on Welds; Maritime Platform Division, DSTO: Canberra, Australia, 2002; pp. 1–11.
  37. Roach, D. Real time crack detection using mountable comparative vacuum monitoring sensors. Smart Struct. Syst. 2009, 5, 317–328. [Google Scholar] [CrossRef]
  38. Stehmeier, H.; Speckmann, H. Comparative Vacuum Monitoring (CVM). In Proceedings of the 2nd European Workshop on Structural Health Monitoring, Munich, Germany, 7–9 July 2004. [Google Scholar]
  39. Roach, D.P.; Rice, T.M.; Neidigk, S.; Piotrowski, D.; Linn, J. Establishing the Reliability of SHM Systems through the Extrapolation of NDI Probability of Detection Principles; No. SAND2015-4452C; Sandia National Laboratories (SNL-NM): Albuquerque, NM, USA, 2015.
  40. Kinet, D.; Mégret, P.; Goossen, K.W.; Qiu, L.; Heider, D.; Caucheteur, C. Fiber Bragg grating sensors toward structural health monitoring in composite materials: Challenges and solutions. Sensors 2014, 14, 7394–7419. [Google Scholar] [CrossRef] [PubMed]
  41. Radio Technical Commission for Aeronautics. Environmental Conditions and Test Procedures for Airborne Equipment; AC21-16G; Federal Aviation Administration: Washington, DC, USA, 1996.
  42. Blackshire, J.L.; Cooney, A.T. Characterization of bonded piezoelectric sensor performance and durability in simulated aircraft environments. AIP Conf. Proc. 2006, 820, 1694–1701. [Google Scholar]
  43. Lin, B.; Giurgiutiu, V.; Pollock, P.; Xu, B.; Doane, J. Durability and survivability of piezoelectric wafer active sensors on metallic structure. AIAA J. 2010, 48, 635–643. [Google Scholar] [CrossRef]
  44. Moix-Bonet, M.; Buethe, I.; Bach, M.; Fritzen, C.P.; Wierach, P. Durability of co-bonded piezoelectric transducers. Procedia Technol. 2014, 15, 638–647. [Google Scholar] [CrossRef]
  45. Forsyth, D.S. Structural health monitoring and probability of detection estimation. AIP Conf. Proc. 2016, 1706, 200004. [Google Scholar] [Green Version]
  46. Janapati, V.; Kopsaftopoulos, F.; Li, F.; Lee, S.J.; Chang, F.K. Damage detection sensitivity characterization of acousto-ultrasound-based structural health monitoring techniques. Struct. Health Monit. 2016, 15, 143–161. [Google Scholar] [CrossRef]
  47. Lindgren, E.A. SHM reliability and implementation–A personal military aviation perspective. AIP Conf. Proc. 2016, 1706, 200001. [Google Scholar]
  48. Lynch, J.P.; Loh, K.J. A summary review of wireless sensors and sensor networks for structural health monitoring. Shock Vib. Dig. 2006, 38, 91–130. [Google Scholar] [CrossRef]
  49. Becker, T.; Kluge, M.; Schalk, J.; Tiplady, K.; Paget, C.; Hilleringmann, U.; Otterpohl, T. Autonomous sensor nodes for aircraft structural health monitoring. IEEE Sens. J. 2009, 9, 1589–1595. [Google Scholar] [CrossRef]
  50. Gao, H.; Rose, J.L. Ultrasonic sensor placement optimization in structural health monitoring using evolutionary strategy. AIP Conf. Proc. 2006, 820, 1687–1693. [Google Scholar]
  51. Flynn, E.B.; Todd, M.D. Optimal placement of piezoelectric actuators and sensors for detecting damage in plate structures. J. Intell. Mater. Syst. Struct. 2010, 21, 265–274. [Google Scholar] [CrossRef]
  52. Ewald, V.; Groves, R.M.; Benedictus, R. Transducer Placement Option of Lamb Wave SHM System for Hotspot Damage Monitoring. Aerospace 2018, 5, 39. [Google Scholar] [CrossRef]
  53. Lee, B.C.; Staszewski, W.J. Sensor location studies for damage detection with Lamb waves. Smart Mater. Struct. 2007, 16, 399. [Google Scholar] [CrossRef]
  54. Thiene, M.; Khodaei, Z.S.; Aliabadi, M.H. Optimal sensor placement for maximum area coverage (MAC) for damage localization in composite structures. Smart Mater. Struct. 2016, 25, 095037. [Google Scholar] [CrossRef]
  55. Janapati, V.; Lonkar, K.; Chang, F.K. Design of Optimal Layout of Active Sensing Diagnostic Network for Achieving Highest Damage Detection Capability in Structures. In Proceedings of the 6th European Workshop on Structural Health Monitoring, Dresden, Germany, 3–6 July 2012. [Google Scholar]
  56. Chang, F.K. Design of integrated SHM system for commercial aircraft applications. In Proceedings of the 5th International Workshop on Structural Health Monitoring, Stanford, CA, USA, 12–14 September 2005; Stanford University Press: Stanford, CA, USA, 2005. [Google Scholar]
  57. Pattabhiraman, S.; Haftka, R.T.; Kim, N.H. Effect of inspection strategies on the weight and lifecycle cost of airplanes. In Proceedings of the 52nd Conference “AIAA/ASME/ASCE/ANS/ASC Structures, Structural Dynamics and Materials”, Denver, CO, USA, 4–7 April 2011; Volume 2, pp. 900–913. [Google Scholar]
  58. Ackert, S. Aircraft Payload-Range Analysis for Financiers; Aircraft Monitor: San Francisco, CA, USA, 2013. [Google Scholar]
  59. Flight Standards Service. Aircraft Weight and Balance Control; AC 120-27E; Federal Aviation Administration: Washington, DC, USA, 2005.
  60. Boeing. 737 Airplane Characteristics for Airport Planning; D6-58325-6; Boeing: Chicago, IL, USA, 2014. [Google Scholar]
  61. Mcelroy, P. Maintaining a Winner. Available online: https://www.boeing.com/news/frontiers/archive/2006/may/i_ca1.html (accessed on 31 May 2006).
  62. Kang, I.; Schulz, M.J.; Kim, J.H.; Shanov, V.; Shi, D. A carbon nanotube strain sensor for structural health monitoring. Smart Mater. Struct. 2006, 15, 737. [Google Scholar] [CrossRef]
  63. Zhang, Y.; Anderson, N.; Bland, S.; Nutt, S.; Jursich, G.; Joshi, S. All-printed strain sensors: Building blocks of the aircraft structural health monitoring system. Sens. Actuators A Phys. 2017, 253, 165–172. [Google Scholar] [CrossRef]
  64. Thompson, B.; Yoon, H.S. Aerosol-printed strain sensor using PEDOT: PSS. IEEE Sens. J. 2013, 13, 4256–4263. [Google Scholar] [CrossRef]
  65. Varadan, V.K.; Varadan, V.V. Microsensors, microelectromechanical systems (MEMS), and electronics for smart structures and systems. Smart Mater. Struct. 2000, 9, 953. [Google Scholar] [CrossRef]
  66. Bhuiyan, M.Y.; Bao, J.; Poddar, B.; Giurgiutiu, V. Toward identifying crack-length-related resonances in acoustic emission waveforms for structural health monitoring applications. Struct. Health Monit. 2018, 17, 577–585. [Google Scholar] [CrossRef]
Figure 1. Fiber Bragg grating (FBG) sensor to detect the change in wavelength due to strain.
Aerospace 05 00087 g001
Figure 2. Comparative vacuum monitoring sensor to detect the air leakage due to cracks.
Aerospace 05 00087 g002
Figure 3. Layout of sensors and cables in fuselage frames and stringers. Blue lines are the sensor strips, while red lines are connection cables.
Aerospace 05 00087 g003
Table 1. Comparison of the three types of sensors for structural health monitoring.
PerformanceCVM SensorFBG SensorPWAS
Smallest detectable damage size0.02 in.N/A0.2 in.
WeightLightLightMedium
Capability of detecting closed crackYesNoYes
Detection rangeLowMediumHigh
Table 2. Parameter values used for maintenance cost-benefits analysis.
ParameterValue
NS9988
Csensor$10
tinstall2000
Cmh$60/man-hour
Wset3 lbs
P$1/flight
Nfc50,000
tmanual1280 man-hour
NC-check18
tdowntime8 days
Rdaily$27,428/day
Table 3. Cost-benefit analysis final results.
CostBenefit
CSHM$99,880Blabor$1,384,400
Cinstall$120,000Bavail$3,949,632
Cweight$50,000,000
CTotal$50,219,880BTotal$5,334,032

