
A Multilayered and Multifactorial Health Assessment Method for Launch Vehicle Engine under Vibration Conditions


1
School of Integrated Circuits and Electronics, Beijing Institute of Technology, Beijing 100081, China
2
Beijing Aerospace Wanyuan Science & Technology Co., Ltd., Beijing 100176, China
*
Author to whom correspondence should be addressed.
Aerospace 2023, 10(6), 505; https://doi.org/10.3390/aerospace10060505
Submission received: 29 March 2023
/
Revised: 19 May 2023
/
Accepted: 22 May 2023
/
Published: 27 May 2023
(This article belongs to the Topic Perspectives in Fault Diagnosis and Fault Tolerant Control)
Abstract
:Sixty percent of the failures of launch vehicles in the ascending phase occur in the propulsion system. Among them, the vibration generated by the engine is an important factor in the occurrence of failure. At present, health assessment methods in the aerospace field are mostly for specific equipment, and scholars mostly assess the real-time health status of launch vehicle engines which can only reflect the current health status of the launch vehicle. Existing methods cannot be applied to different equipment, and there is a lack of research on health assessments of fuzzy and complex mechanical systems. In this article, we propose a multi-layer and multi-factor predictive evaluation method for a fuzzy and complex system and conduct experiments on real vibration data of rockets. First, we divide the health assessment level according to the vibration data that affect the normal operation of the rocket. Secondly, we obtain the future trend of vibration signals based on five data prediction methods and calculate the health status interval of the rocket engine’s working conditions based on the boxplot method. At the same time, we calculate the single health evaluation set of every vibration signal. We obtain the weights of each level and factor for the health value based on an analytic hierarchy process (AHP). The optimization of this step avoids an over-reliance on expert experience. Finally, we complete a fuzzy comprehensive evaluation of the engine system from the bottom up to obtain the final health value. The minimum evaluation error is 0.0193% on the test data of the Long March series launch vehicle engine, which shows that the proposed method can successfully predict and evaluate the launch vehicle engine.
1. Introduction
Launch vehicles can cause several types of vibrations due to intense thrust pulses and aerodynamic mutations during launch and flight. The vibration signal covers low, medium and high frequencies, which seriously affects the equipment structure and electrical system of multiple systems in the rocket, while the low-frequency vibration causes astronauts to have difficulty in physical movement and chaotic decision making, which can easily lead to the failure of rocket launch missions and casualties [1]. Therefore, suppressing the occurrence of vibration from the material and structure and reducing the harm caused by vibration from the perspective of information science have become important research directions in the field of aerospace engineering.
The launch vehicle engine is a typical fuzzy environment [2], and relying solely on AI and computational science cannot explore its internal mechanism. For industry and military equipment, PHM (Prognosis and Health Management) studies for a system are much more difficult than the fault detection of a single component. Leng et al. [3], GE et al. [4] and Subramanian et al. [5] proposed self-organizing and self-evolving fuzzy neural networks for different fuzzy systems. However, this approach is very susceptible to anomalous data that can lead to erroneous results. For launch vehicle fuzzy systems, each launch may be a different rocket model, and the same rocket model may also have different types of components. It is difficult to obtain practical verification for the results of the above methods. Rocket engine testing can summarize a large number of failure modes and human experience, which can fit accurately with the actual situation. It also reduces the impact of anomalous data on results.
Researchers have developed various methods for rocket engine PHM, and the current ones can be categorized into three types as follows [6]:
- (1)
- Model-based methods;
- (2)
- Expert-experience-based methods;
- (3)
- Data-driven methods.
Researchers have conducted extensive research on the identification and evaluation of rocket engine faults. The basic principle of the mathematical model for engine PHM is to treat the output of the engine mathematical model as a standard state and determine the deviation degree of the actual working state of the engine from the standard state through various indicators; if the deviation degree is too large, the engine working conditions in this state are regarded as abnormal. Model-based methods can be divided into two main types: analytical models and system identification models. Based on an analytical model, Davidson et al. [7] designed a linear engine model for the Advanced Health Management System (AHMS), using the threshold to achieve online engine anomaly detection. Breedveld [8] compares the effects of a continuous state estimation and discrete state estimation for SSME fault diagnoses and shows that the discrete state estimation performs best when measurement noise is negligible, and the continuous state estimation is used when measurement noise is present. Based on a system identification model, Srivastava et al. [9] established the correspondence between the spectral intensity of SSME plume characteristics and engine performance parameters through neural network training, and based on this relationship, the condition monitoring of the SSME was carried out. In the 1990s, the United Technologies Research Center (UTRC) used the ARMA algorithm to monitor the steady-state process of the SSME in real time when designing the SSME’s HMS (health management system) [10]. Model-based approaches focus on how well they fit fuzzy systems, and one model cannot be adapted to different engines. So, model-based approaches lack versatility.
The conventional method is based on expert systems for the problem of the vibration failure of launch vehicle engines, but with the development of technology and artificial intelligence, big data mining has been proven to be an important and effective method [11]. Engle et al. [12] developed the expert-system-based inference mechanism PLES (Prelaunch Expert System) for the preparation stage of the SSME during ignition, which facilitated an analysis of the overall health of the system by ground personnel. Kurien et al. [13] experimented with health management techniques on the Deep Space One project from 1998 to 2001. Perry et al. [14] developed an expert system for turbopump fault diagnosis. The system contains both shallow knowledge and deep knowledge, which refers to the experience and processes summarized by domain experts in analyzing and processing test data, and deep knowledge refers to any analytical model that can characterize the operating characteristics of engine turbopumps. However, relying heavily on the expert system leads to subjective experience domination [15]. At the same time, there are three main problems with the use of manual analyses:
- (1)
- Personal cognitive limitations, that is, the knowledge that each person has is limited;
- (2)
- Diagnoses are inefficient and require a lot of time and human resources;
- (3)
- The manual system can only be used for offline diagnoses and cannot meet the needs of online fault diagnoses [6].
Data-driven methods can be further subdivided into two types: statistical analysis and pattern recognition. Aiswarya et al. [16] manually extracted the time and frequency domain features of an LRE (liquid rocket engine)’s running signal, used support-vector machines to classify these features and achieved 100% classification accuracy. Y. Wu et al. [17] proposed a fault detection method with particle swarm optimization and a least-squares support-vector machine to improve the performance of an LRE. B. Wang et al. [18] proposed a deep separable CNN to predict the remaining useful life of aeroengines with the monitoring data from different sensors. H. Miao et al. [19] proposed dual-task deep LSTM networks to unify the task of degradation evaluation and the remaining useful life prediction of aeroengines. L. Xu et al. [15] used the quantum genetic algorithm (QGA) to optimize the BP neural network, trained the BP neural network, which generated two outputs, and performed a fault diagnosis on the liquid rocket engine. A PHM approach based on digital twins is a deep combination of traditional PHM technology and digital twin technology. Mapping physical devices and virtual devices leverages the technology of data simulation and model simulation, which can realize the early prediction and accurate location of faults [20]. Among data-driven approaches, deep learning methods exhibit excellent adaptability and accuracy. A launch vehicle has a limited number of launches with few failure samples and a relative lack of historical experience. The limited fault data are not enough to support the training of a neural network, so an accurate fault model cannot be obtained, and it is difficult to achieve fault location. Basing a model on real data is susceptible to data scarcity, and basing it on simulation data is also susceptible to simulation model inaccuracy.
Our paper is based on the real-time data of a launch vehicle and realizes the multi-layer weight generation of the overall system according to expert scoring. At the same time, a deep neural network is used to predict the future trend of the vibration signal, and the deviation between the actual data, the prediction data and the ideal state is calculated to obtain the actual and predicted health evaluation matrix. The evaluation set and the weight set are used as inputs, and the health value of the top-level target is obtained through a comprehensive fuzzy assessment. It has important guiding significance for the risk prevention of the ascending section of the rocket engine. Introducing expert experience to data-driven methods can solve the problems of the lack of data and low model accuracy. Using a modular approach, the health assessment of different objects can be achieved by replacing the prediction data and weight relationship. While improving the accuracy of the evaluation, the use of automated artificial intelligence technology reduces economic expenses.
2. Launch Vehicle Engine Health Evaluation System Architecture
2.1. Abstract the Evaluation Hierarchy from the Data Structure
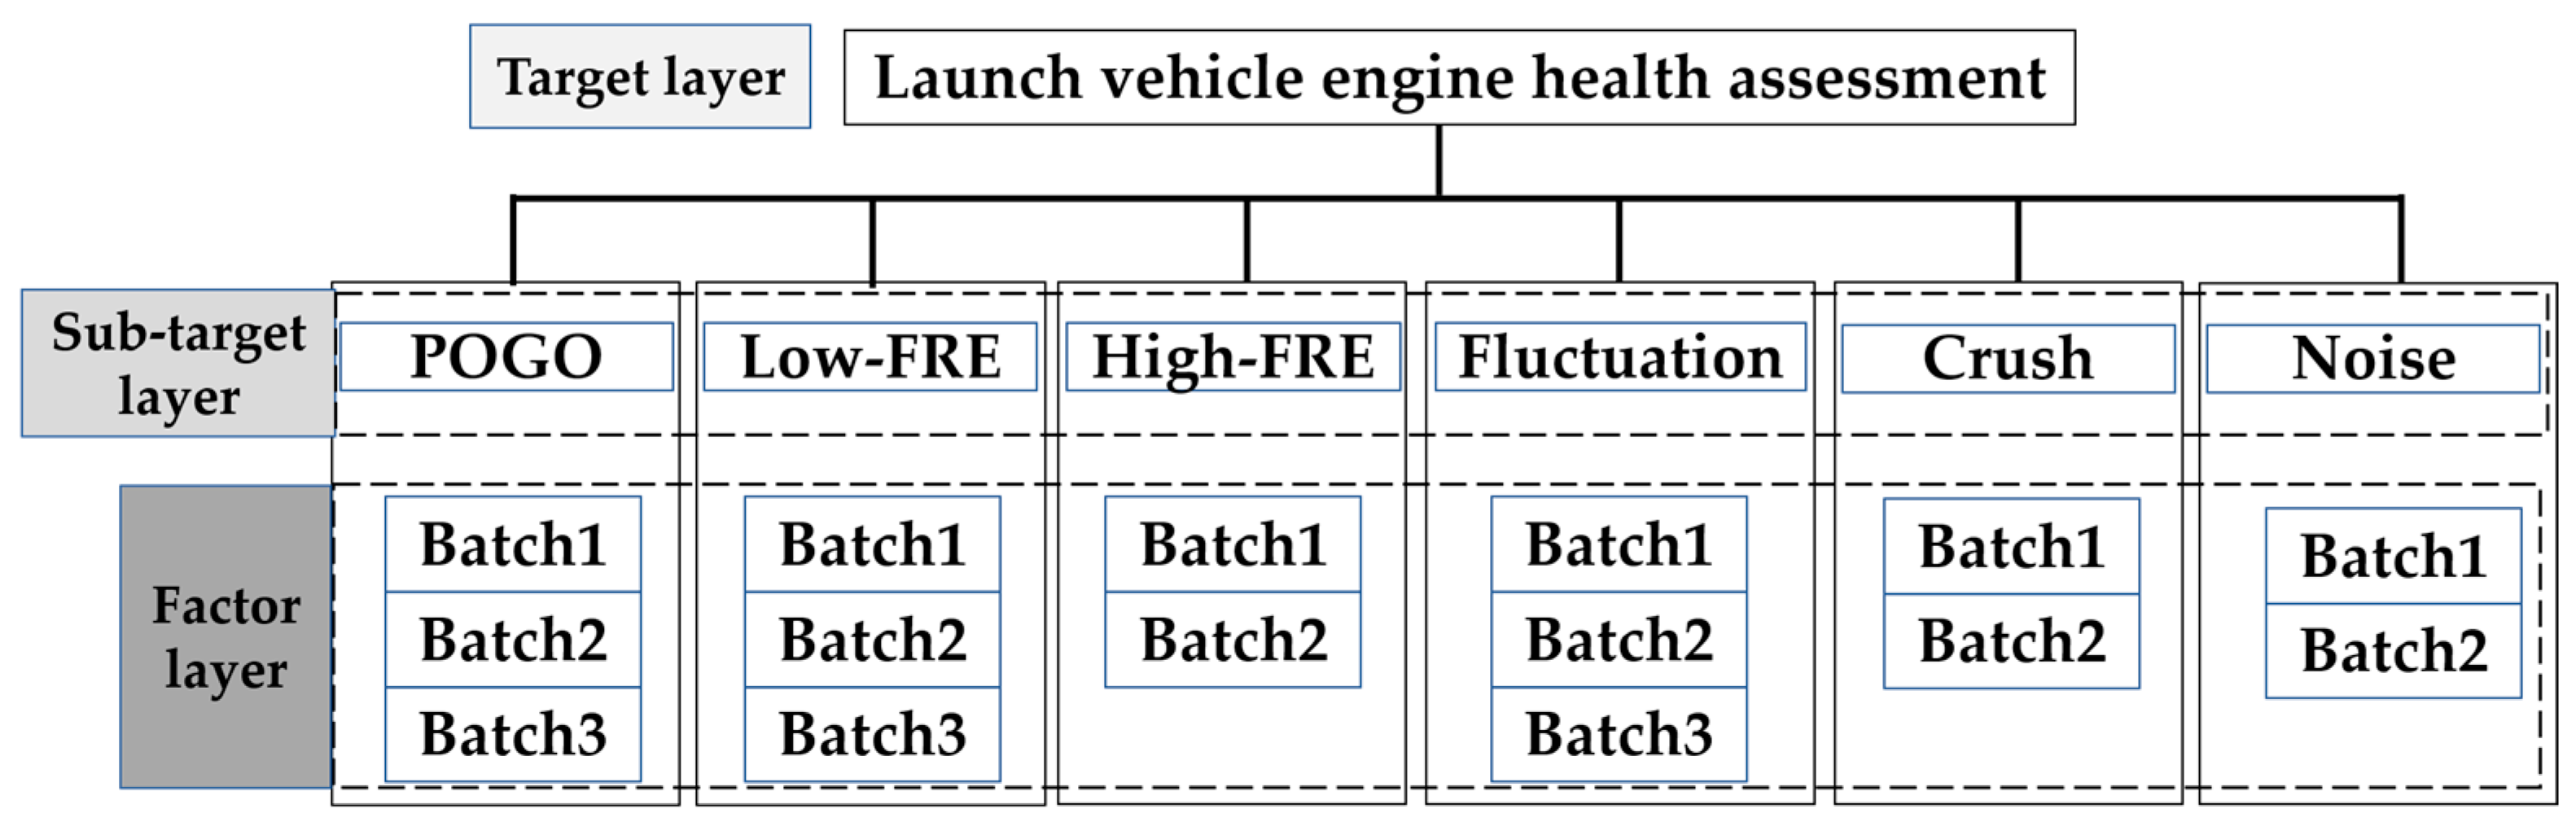
The vibration data used in this paper are derived from the measured data of the Long March series of carrier rocket engines, as shown in Figure 1.
The data include six types of vibration signals, including POGO vibration, low-frequency vibration, high-frequency vibration, fluctuation, crush and noise. POGO vibration is the pressure generated by multiple engines of the rocket during flight and the periodic vibration generated by the external structure of the rocket, which can easily lead to pressure loss of control in the internal pipeline and instrument damage [21]. When the rocket is flying at a high Mach speed, due to the strong collision between the rocket structure boundary and the external gas environment, it will produce a strong pulsating pressure, which will easily cause further equipment vibrations [22]. In the process of firing multiple engines of the rocket and the sharp increase in the acceleration of the rocket, there will be low- and high-frequency signals and shock signals in the thrust system, and there is a widespread noise when a large number of pieces of mechanical equipment are working. Each kind of signal is divided into multiple groups of signal sensor batches, the data of the same batch are collected in the same acquisition sequence and the test conditions are consistent. The dataset in this paper is sampled from the original data, totaling 525 KB, in .CSV format.
Most traditional aerospace equipment evaluation systems are layered from the perspective of hardware, and the evaluation objects are divided according to the level of components. However, it is difficult to inspect all parts in fuzzy systems; thus, engineers often focus on evaluating some parts and completely ignore others. Such evaluation methods do not provide a comprehensive health assessment of internal systems, and there is a possibility of missing alarms. The method researched in this paper divides the vibration signal of the engine system as a whole into three layers from the perspective of data. For fuzzy systems, the precise location of fault sources is difficult to achieve, so the study of overall health is very important.
The system researched in this paper is divided into three layers: the target layer, the sub-target layer and the factor layer, which is convenient for the unified quantification of the health value of multiple influencing factors between the same level, and it is also easy to import weights. According to historical experience, the impact of the six types of vibrations is different for the health state of the launch vehicle engine, and the degree of influence of the data collected by different types of sensors of the same type is also slightly different. The effect size relationship between the factors can be considered to simulate the data and obtain the health value of the multi-level and multi-factor system more accurately.
2.2. Evaluate the Process Architecture
In order to cope with the comprehensive evaluation of multi-data categories and multi-hierarchical systems, this paper proposes a comprehensive evaluation architecture for the vibration signals of launch vehicle engines as shown in Figure 2.
The main structure of the overall process includes five main modules: spatial division of health states, data prediction, evaluation set generation, weight analysis and fuzzy comprehensive evaluation. Modular structure makes sense for the subsequent addition of evaluation levels and factors. The data preprocessing part completes the outlier cleaning and data format correction of the original data, which is the pre-step of vibration signal trend prediction. Based on machine learning methods and deep neural networks, we extract the continuous local dependencies in the timing signal by virtue of powerful feature-learning ability and complete the prediction of long sequences. As an evaluation index for health assessment, the evaluation set is combined with subjective experience and objective data analysis. The evaluation set of 15 sequences, including six types of vibration signals, was obtained by threshold statistical methods. Weight analysis was based on analytic hierarchy process (AHP). The system of analysis and decision making was decomposed into target layer, sub-layers and evaluation criteria. The weight set generation is based on the weight analysis module, which generates the weight matrix required in the fuzzy comprehensive evaluation. Launch vehicle engine systems are typically fuzzy environments, in which details inside the system are difficult to fit mathematically. Combining the historical experience of the experts and accurate prediction results makes the assessment process more comprehensive.
The health evaluation system for vibration signals of launch vehicle engines constructed in this article has the characteristics of objectivity, multi-layer and multiple factors, and strong technology transfer ability. Based on artificial experience, combined with the vibration signal depth prediction results, the historical experience of rocket testing is considered and the mathematical features that are difficult to summarize are excavated through new technologies. At the same time, the multi-factor and multi-level characteristics also make the evaluation process more comprehensive.
3. Multi-Layer Weight Generation
For the different types and sources of launch vehicle engine vibration signals, it can be difficult to find the specific component where the fault occurred, and the impact of different vibration types on the normal flight of the launch vehicle is different. Data reliability and effectiveness of different sensors cannot be equal. Converting the degree of impact into percentage weights under a uniform measure is necessary for assessing the vehicle’s state of health.
3.1. Analytic Hierarchy Method
For the health value assessment of the launch vehicle engine system, we used a quantitative analysis of multiple conditions and factors. The electrical environment inside the launch vehicle engine is a typical giant system and a fuzzy environment. Therefore, it is impossible to try to grasp the weight of each factor in the system relying on human experience under the same weight standard. Based on historical data and a summary of past failure modes, experts can obtain the weight relationship between two factors. The impact of factor A on the entire system is quantified relative to factor B, but when there are many factors involved, experts cannot directly obtain the multi-level and the multi-factor influence weight relationship.
Considering the hierarchical complexity of system equipment, a multi-layer, multi-factor weight matrix is generated based on analytic hierarchy (AHP) method. The ana-lytic hierarchy method was first proposed by American scientist T.L. Saaty in the 1970s [23] and has been applied to network system theory and multi-objective comprehensive evaluations. It mainly solves the decision-making problems of interrelated and mutually restricting complex systems and is widely used in aerospace engineering, electrical engineering, operations research and other fields.
The process using AHP to construct a rocket engine vibration signal model and obtain the weights of each type of factor can be roughly divided into the following steps:
- (1)
- Establish a hierarchical model according to the type and batch of launch vehicle engine vibration signals;
- (2)
- Based on historical statistics and expert experience, construct a judgment matrix according to the weight relationship between factors in the same level, also known as reciprocal matrices:
- (3)
- Calculate the maximum eigen root and eigenvector of the reciprocal matrix according to the criteria: to facilitate subsequent calculation;
- (4)
- Normalize the feature vectors and calculate the weight values of all elements contained in each layer separately. The weight calculation formula is as follows:
- (5)
- Carry out a consistency test on the matrix. The credibility of the manually judged matrix is tested; if there is a contradiction between the two weights of the elements, the consistency test is not passed, and the credibility of the result of introducing the artificially weighted positive and negative matrix is increased, with the consistency index as follows:The consistency ratio is as follows:When < 0.1, it is considered to have passed the test, and is the established system-level order;
- (6)
- Generate subjective weight vectors.
3.2. Weight Generation
The corresponding table of consistency indicators is shown in Table 1.
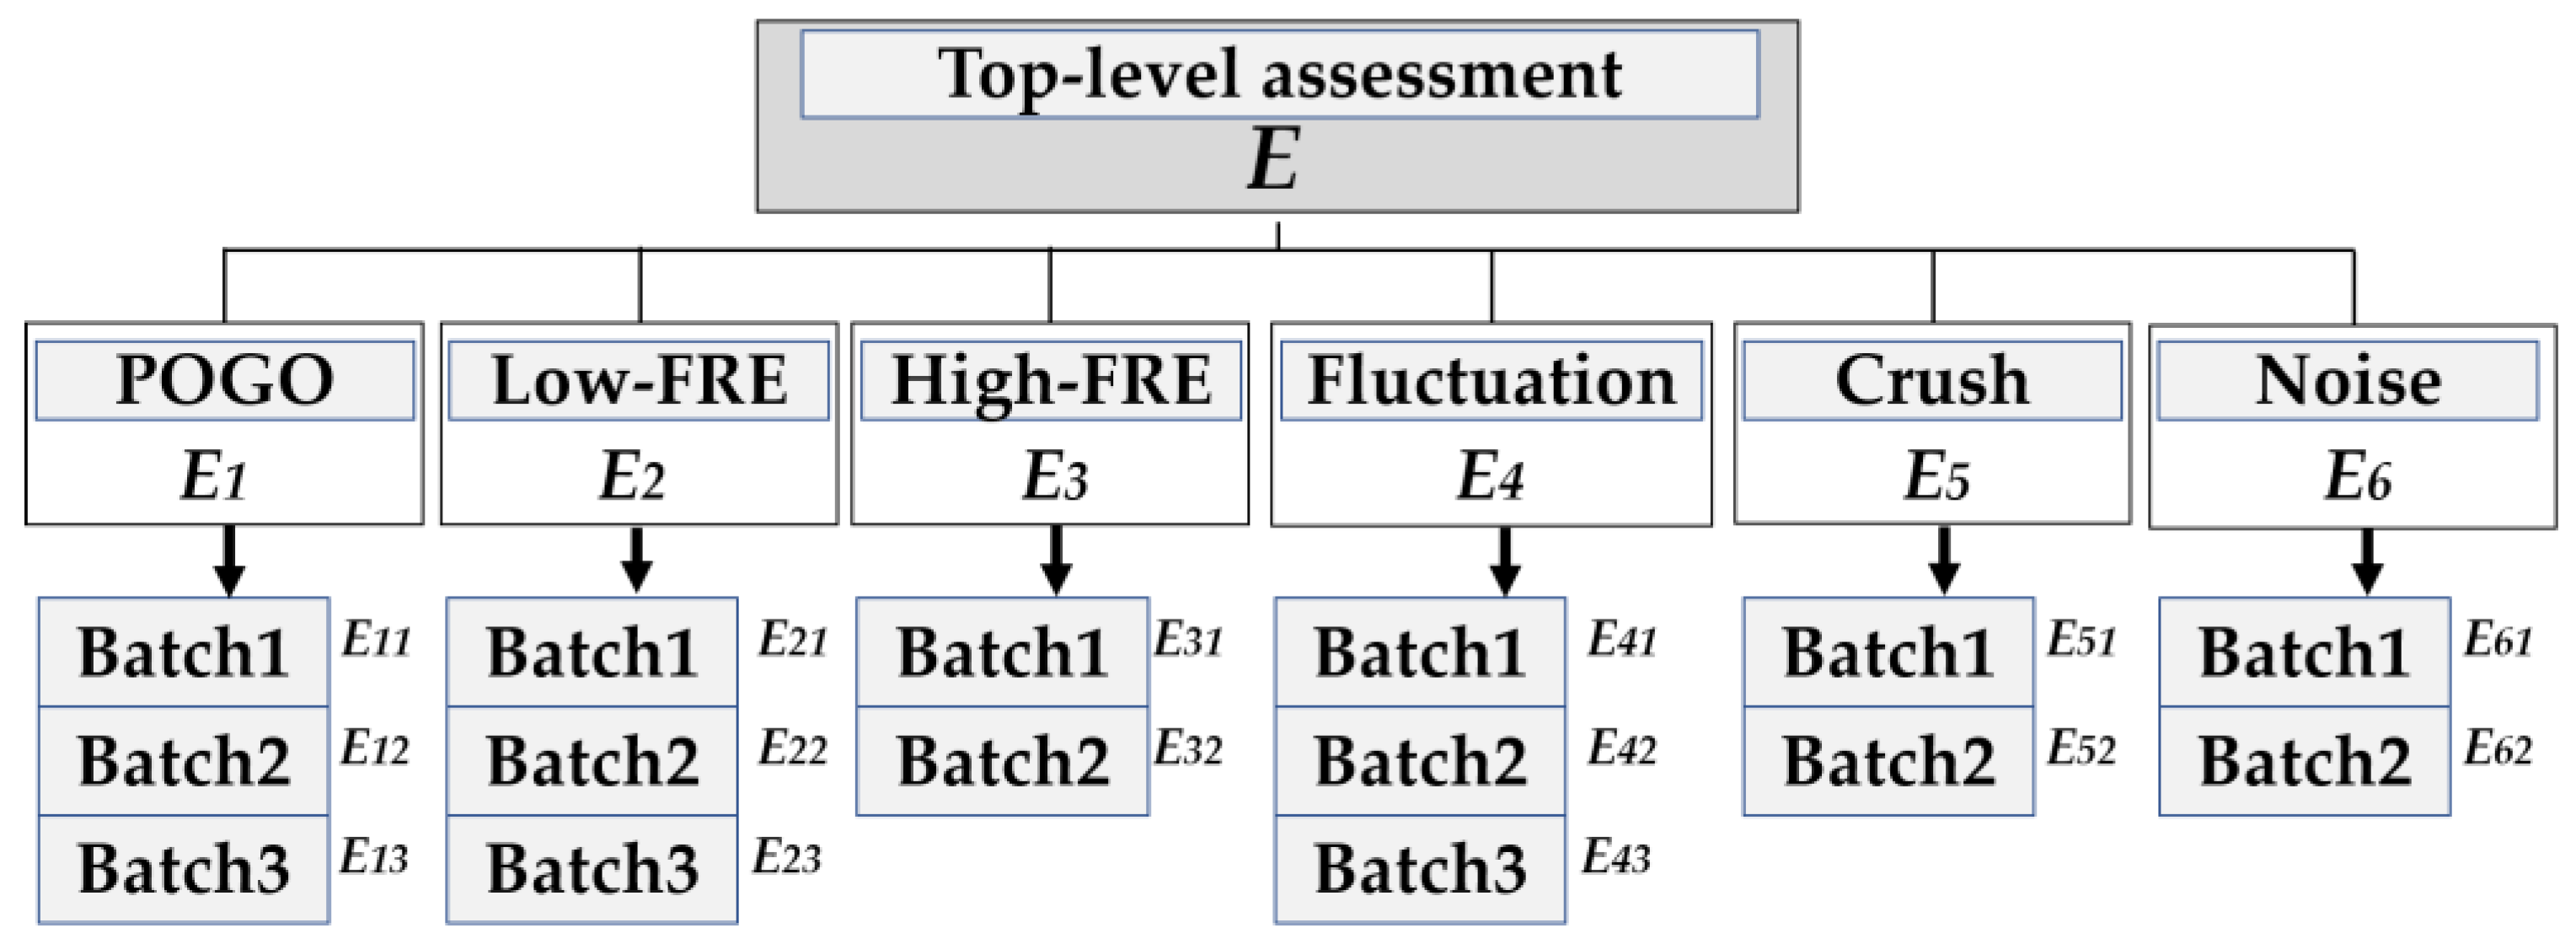
The system weight allocation architecture in this paper is shown in Figure 3. Overall system is summarized as follows: , represent POGO vibration, low-frequency vibration, high-frequency vibration, fluctuation, shock and noise, respectively. We can see in the figure that the overall system is divided into three levels, so is 3. The corresponding immediate mean agreement metric = 0.52. The overall hierarchy of the vibration signal of the ascent launch vehicle engine is divided into three stages, in which the sub-target layer contains a weight vector: . The factor layer consists of the following six weight vectors: , , , , and .
The multi-level reciprocal matrix provided by the China Academy of Launch Vehicle Technology is shown as Table 2. Due to space limitations, this paper only shows the reciprocal matrix of the sub-target layer and a set of factor layers.
The reciprocal matrix, such as low-frequency vibration, is given in the same way, as shown in Table 3. According to the AHP method, the sub-target layer weight is and the maximum eigenvalue is 6.003449, so , and the consistency test is passed. The weight vectors of each factor under the six types of sub-goals are: , , , , and .
After testing, the results of six groups of consistency tests passed. The weight experiment results show that POGO vibration, fluctuation and low-frequency vibration have the greatest influence on the health state of the ascent section of the launch vehicle engine in the sub-target layer. At the same time, according to the expert experience, the data after the sensor batch can better reflect the authenticity and real time of the state, so the weight is also higher, and the results are in line with the experts’ expectations.
4. Vibration Signal Trend Prediction
At present, most of the research on the health state of spacecraft such as launch vehicles is concentrated on their real-time state. Data pre-processing, data measurement, anomaly detection and other steps are used to complete real-time status assessments. Real-time status assessments have a large delay and are of limited reference value to ground-monitoring personnel. The rapid development of artificial intelligence technology has greatly improved the efficiency and accuracy of data mining. Compared with the real-time status assessment as mentioned above, the evaluation of the status of a launch vehicle engine based on prediction data is of more guiding significance for risk prevention and early warning.
4.1. Predict Generic Steps
The general forecasting process is divided into the following three steps:
- (1)
- Data preprocessing: complete data cleaning of the original vibration data of the launch vehicle;
- (2)
- Model training: use algorithm models to train data;
- (3)
- Model prediction and error calculation: predict the data waveform, save the data and calculate the error value of the prediction, including RMSE, R2, and MAPE.
The RMSE formula is as follows:
The MAPE formula is as follows:
the R2 formula is as follows:
represents each acquisition value in the test data, represents each collection point of the prediction data, represents the total number of collection points, and represents the average of real data.
R2 is the degree of model fitting, MAPE is the mean absolute percentage error and RMSE is the root mean square error, reflecting the prediction accuracy of the algorithm from multiple angles.
4.2. Predictive Models
We chose five types of algorithms, including LSTM (long short-term memory) [24], GRU (gated recurrent unit) [25], LightGBM (light gradient-boosting machine) [26], WMA (weighted moving average method) [27] and ARIMA (autoregressive integrated moving average) [28] algorithms for experimentation. These five types of algorithms have been widely used in industrial PHM. Among them, LSTM and GRU algorithms are typical neural network algorithms, and LightGBM, WMA and ARIMA algorithms are classic machine learning prediction algorithms. In this paper, a variety of algorithms are used to verify the accuracy and versatility of the method on the vibration data of the launch vehicle.
Since the launch vehicle is tested under a variety of vibration conditions, the collected data are dynamically changing, and the correlation information between sampling points is the key to data trend prediction. Compared with the RNN method, the LSTM method improves the prediction ability of long-term data and solves the problem of gradient explosion and gradient disappearance in the data-training process of RNN method. The GRU method is a very effective variant of the LSTM network, which is simpler than the structure of the LSTM network. LightGBM, WMA and ARIMA are typical machine learning algorithms, which have been widely used in the industry and have been proven to have good effect.
The prediction algorithm relies on TensorFlow and Keras frameworks, as well as basic machine learning libraries to be completed. We used a Intel Core I7-11700k CPU and NVIDIA GeForce Rtx3070 GPU. The software platform was Visual Studio Code 1.77.3. The version of the algorithm dependency library is shown in Table 4.
Table 5 shows the network structure and parameter settings of LSTM algorithm and GRU algorithm.
Table 6 shows the network parameters of WMA and ARIMA algorithms.
Table 7 shows the algorithm parameter settings for the LightGBM algorithm.
4.3. Predictive Results
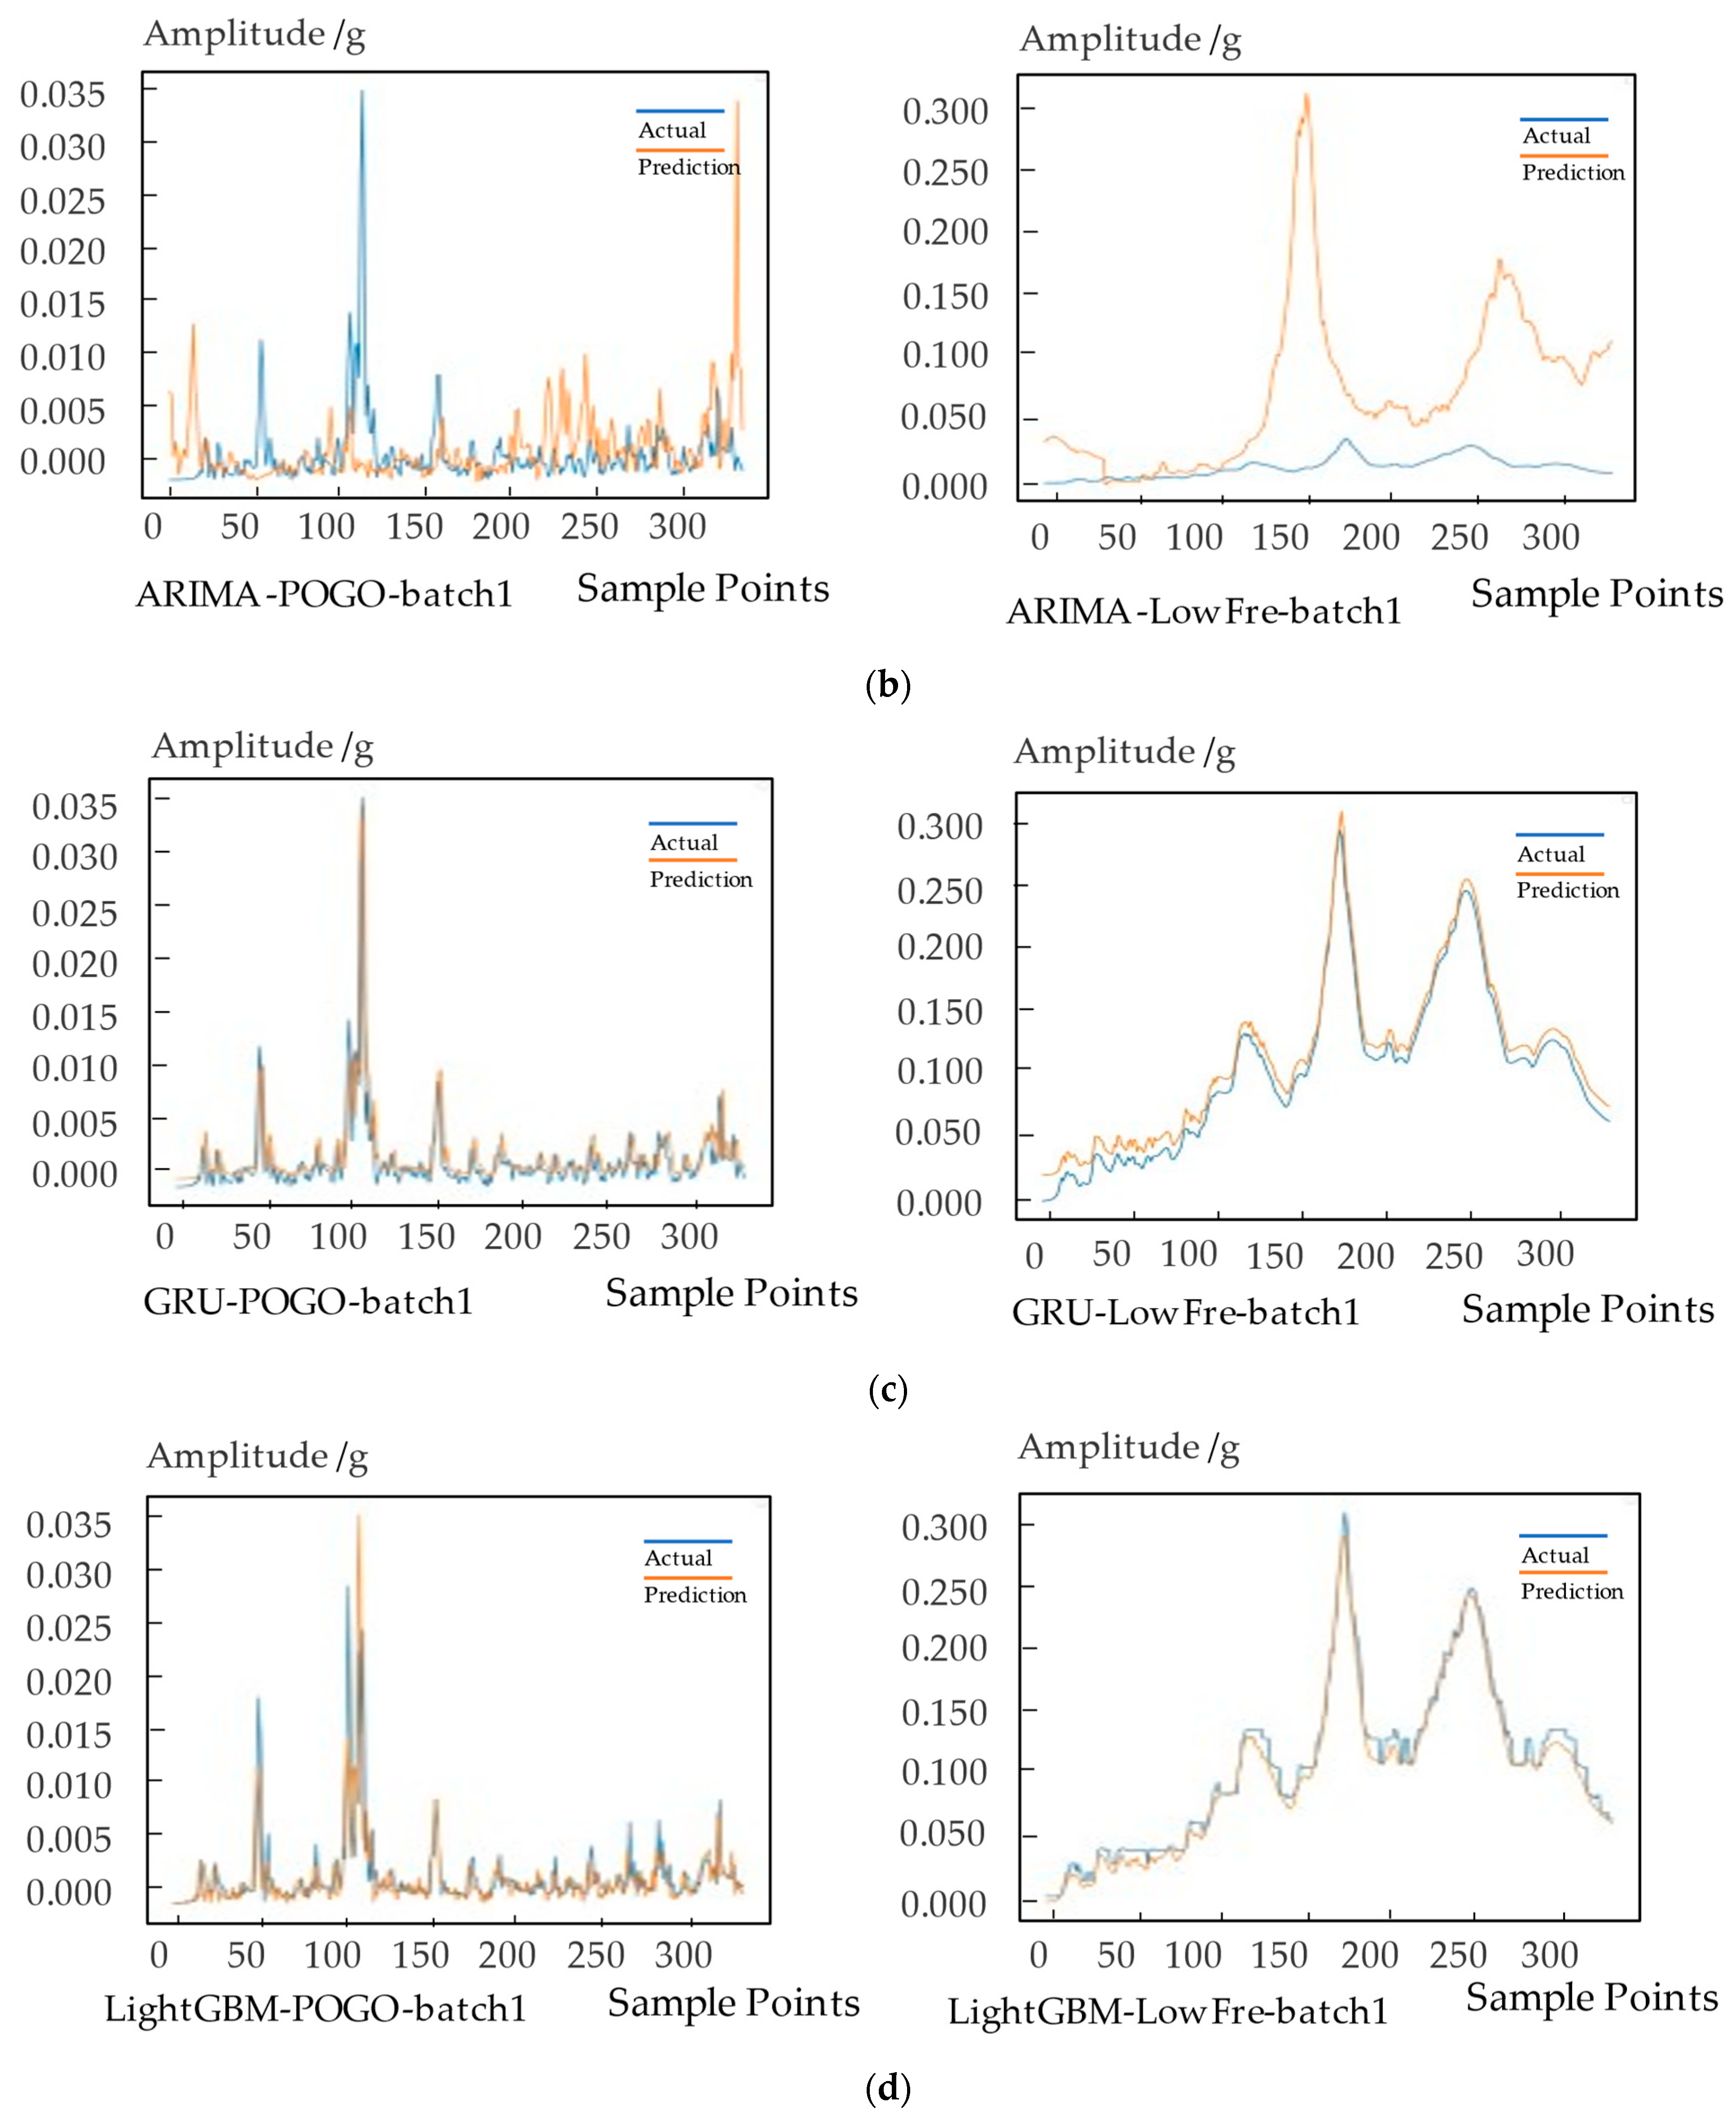
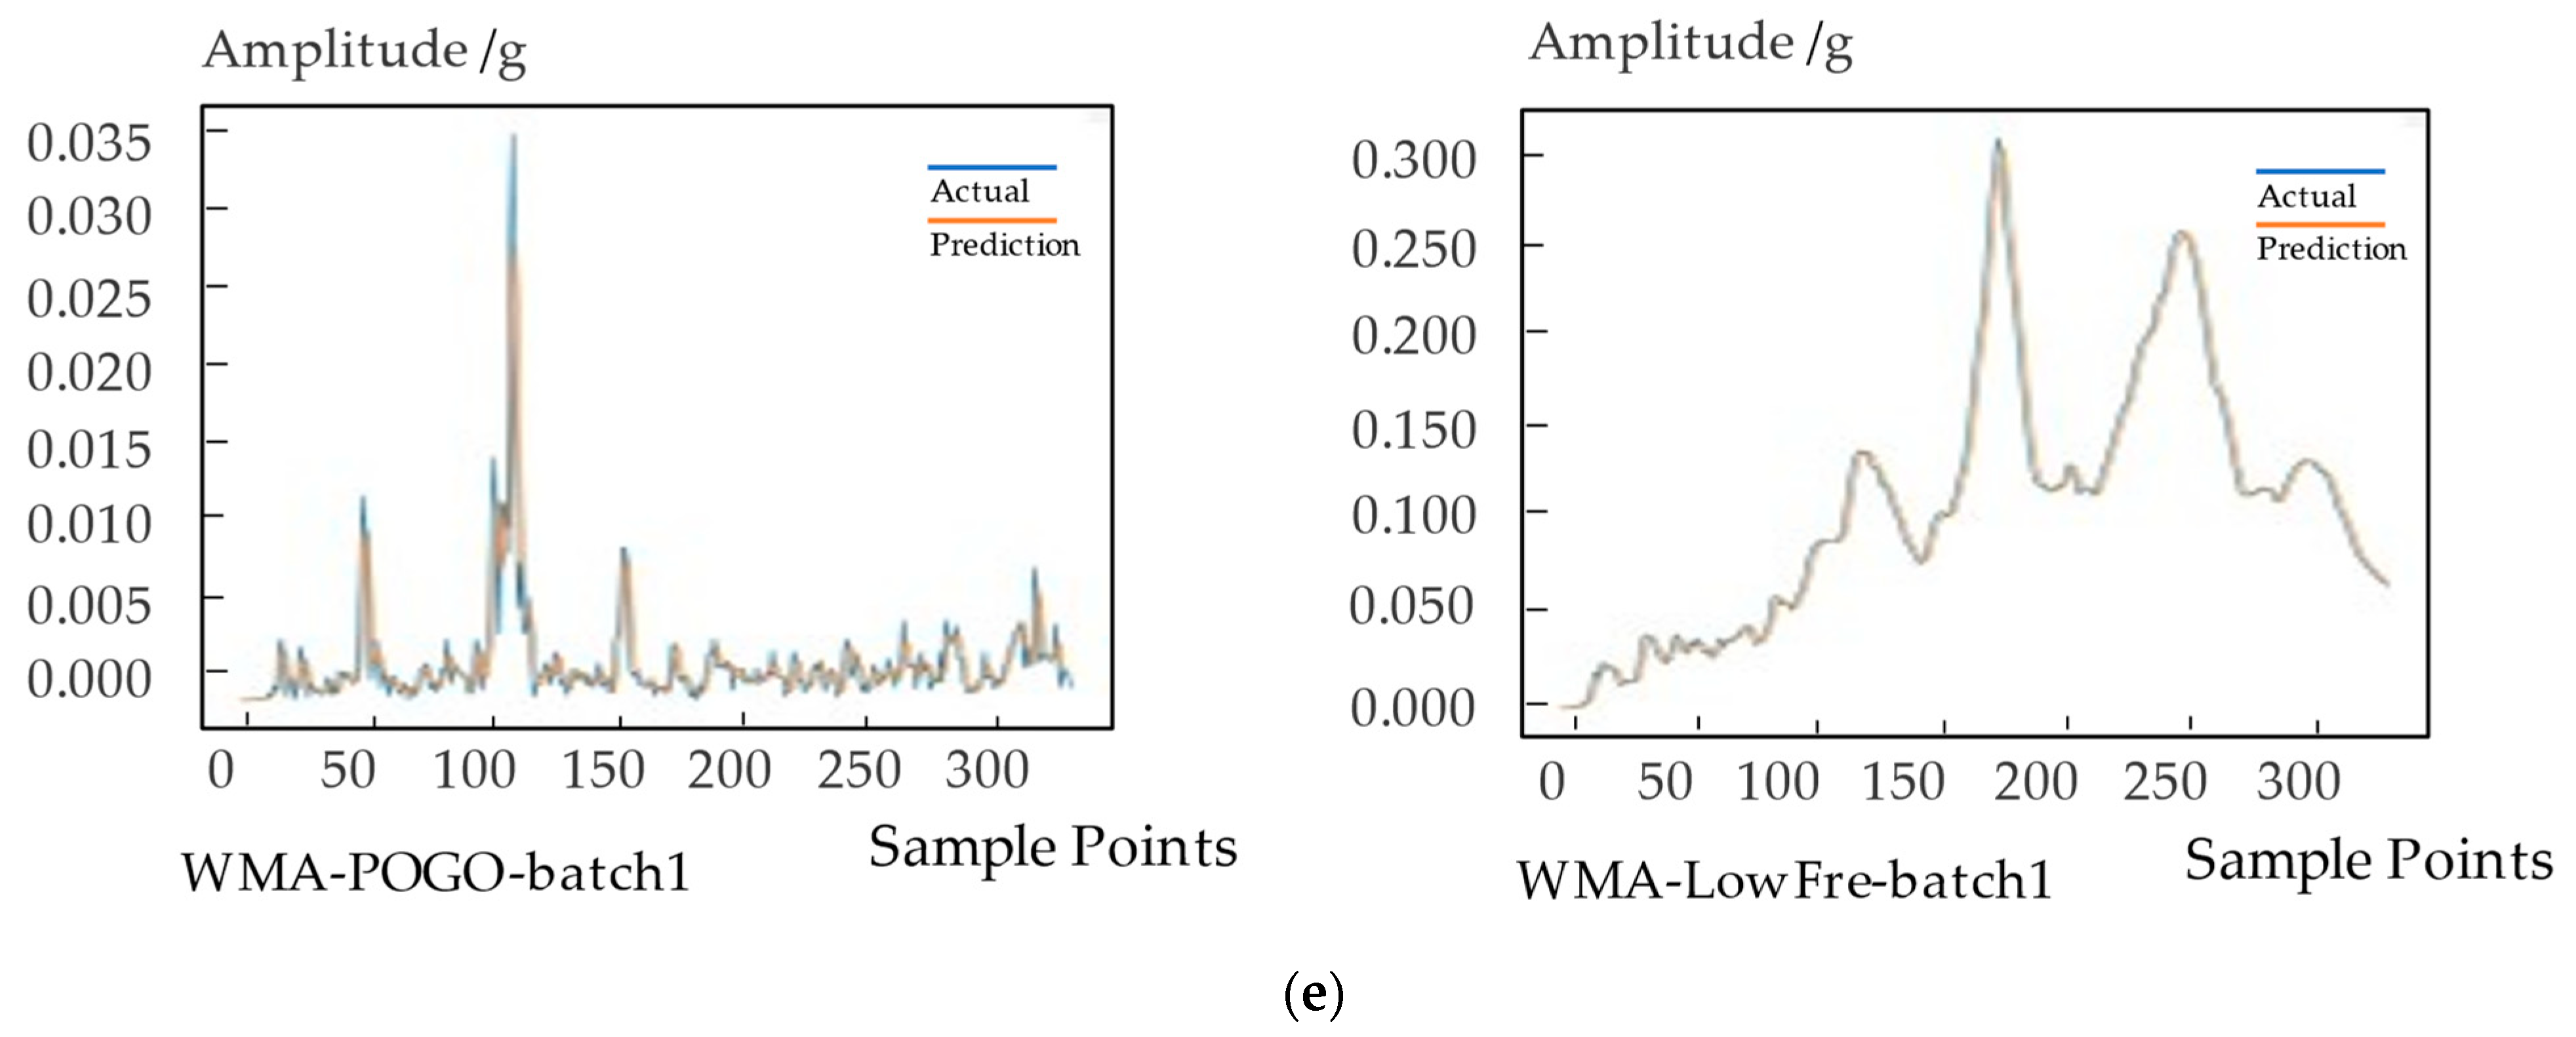
Six types of signals are predicted based on five methods, and the error of the prediction results is shown in Table 8. The prediction effect is shown in Figure 4.
According to Table 8 and Figure 4, the GRU algorithm has the best prediction effect for longer sequences among the five types of algorithms experimented in this paper. The LightGBM algorithm has the most balanced prediction effect for long and short sequences. The prediction effects of weighted moving average algorithm and LSTM on long and short series are also relatively balanced. Due to the short sequence length, the ARIMA algorithm has the worst fit and the lowest prediction accuracy in this experiment.
5. Calculate Health State Space Based on Boxplot Method
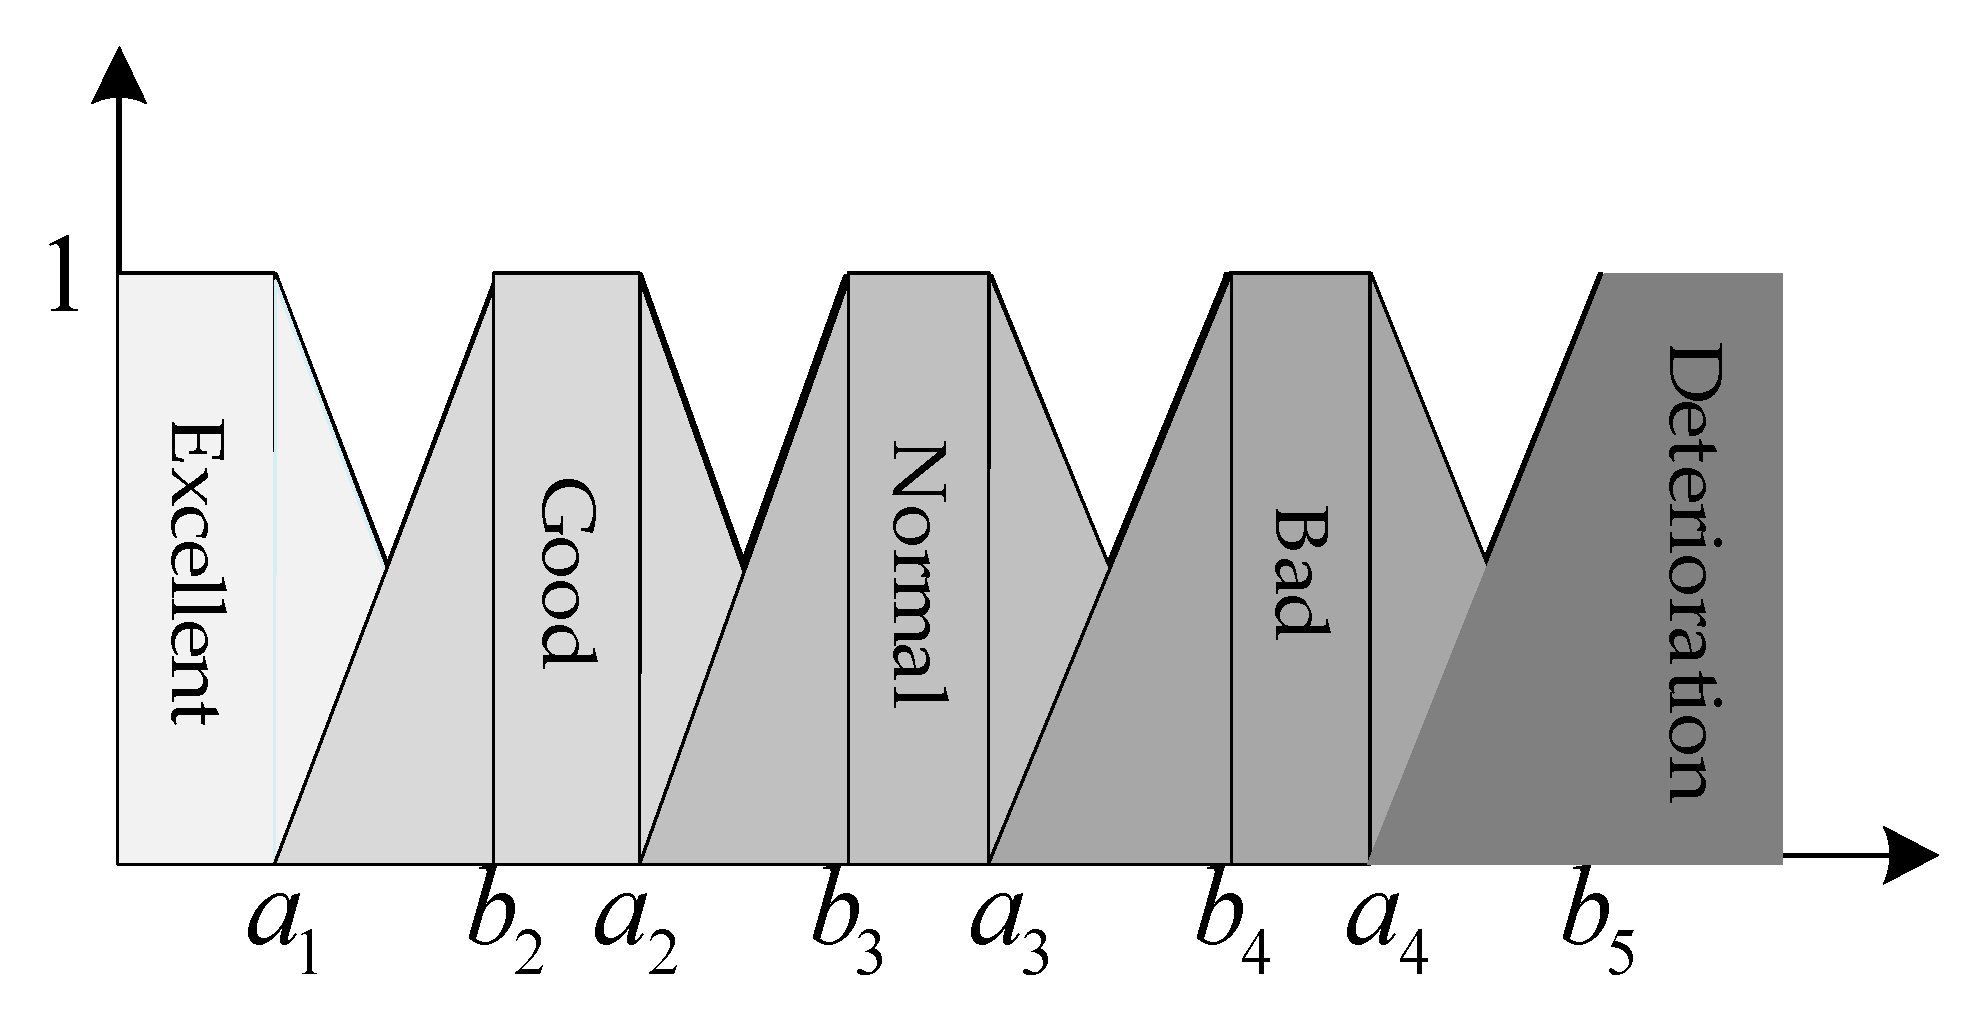
The evaluation set generation is mainly based on the predicted data waveform, not the prediction error. The common method is based on the root mean square error (RMSE) of the prediction result, combined with the membership function to the final result of the prediction RMSE fuzzing and defusing. As shown in Figure 5, it is the commonly used trapezoidal membership degree function.
We define the abscissa threshold corresponding to multiple types of evaluation indicators according to expert experience: , , , , , , , . However, this conventional approach is suitable for situations in which the output is difficult to analyze and the evaluation value is difficult to determine. It is a method of approaching the final evaluation indicator as closely as possible when dealing with ambiguity. The actual data used in this article is no longer ideal. The data structure that should be used as a criterion for evaluating the membership function is still vague. At the same time, the threshold of the membership function is more difficult to grasp, and there is no unified evaluation benchmark with the prediction data.
5.1. Boxplot Principle and Design Steps
The boxplot method was invented by the famous American statistician John Tukey and describes the distribution standard of data through five numbers: upper whisker, first quantile (Q1), median (Median), third quantile (Q3) and lower whisker. This method can clearly show the overall distribution of data and outlier information. The interquartile range (IQR: Q3-Q1) is the key computational datum, defined as the difference between the third quartile and the first quartile, and the overall data can be divided autonomously by setting the quarterback spacing and IQR coefficient. Through the boxplot method, we can easily analyze the distribution of vibration signal data. The upper and lower limits of data under normal working conditions are obtained and used as the basis for the division of engine state space.
The healthy state space calculation process is as follows:
- (1)
- Read data;
- (2)
- Perform data sorting, calculating the first quantile (Q1), median (Median) and third quantile (Q3);
- (3)
- Calculate the IQR of the quartile difference;
- (4)
- Calculate the upper whisker: (Q3 + 1.5 × IQR) and lower whisker: (Q1 − 1.5 × IQR);
- (5)
- Set the coefficient and divide the healthy state interval.
The normal working condition data without setting vibration conditions were experimented according to the boxplot calculation steps, and the quartiles of multiple batches of six types of vibration signals were measured. As the same time, we calculate the upper and lower limit values to obtain the preliminary health range of the evaluation, using this range as a reference limit.
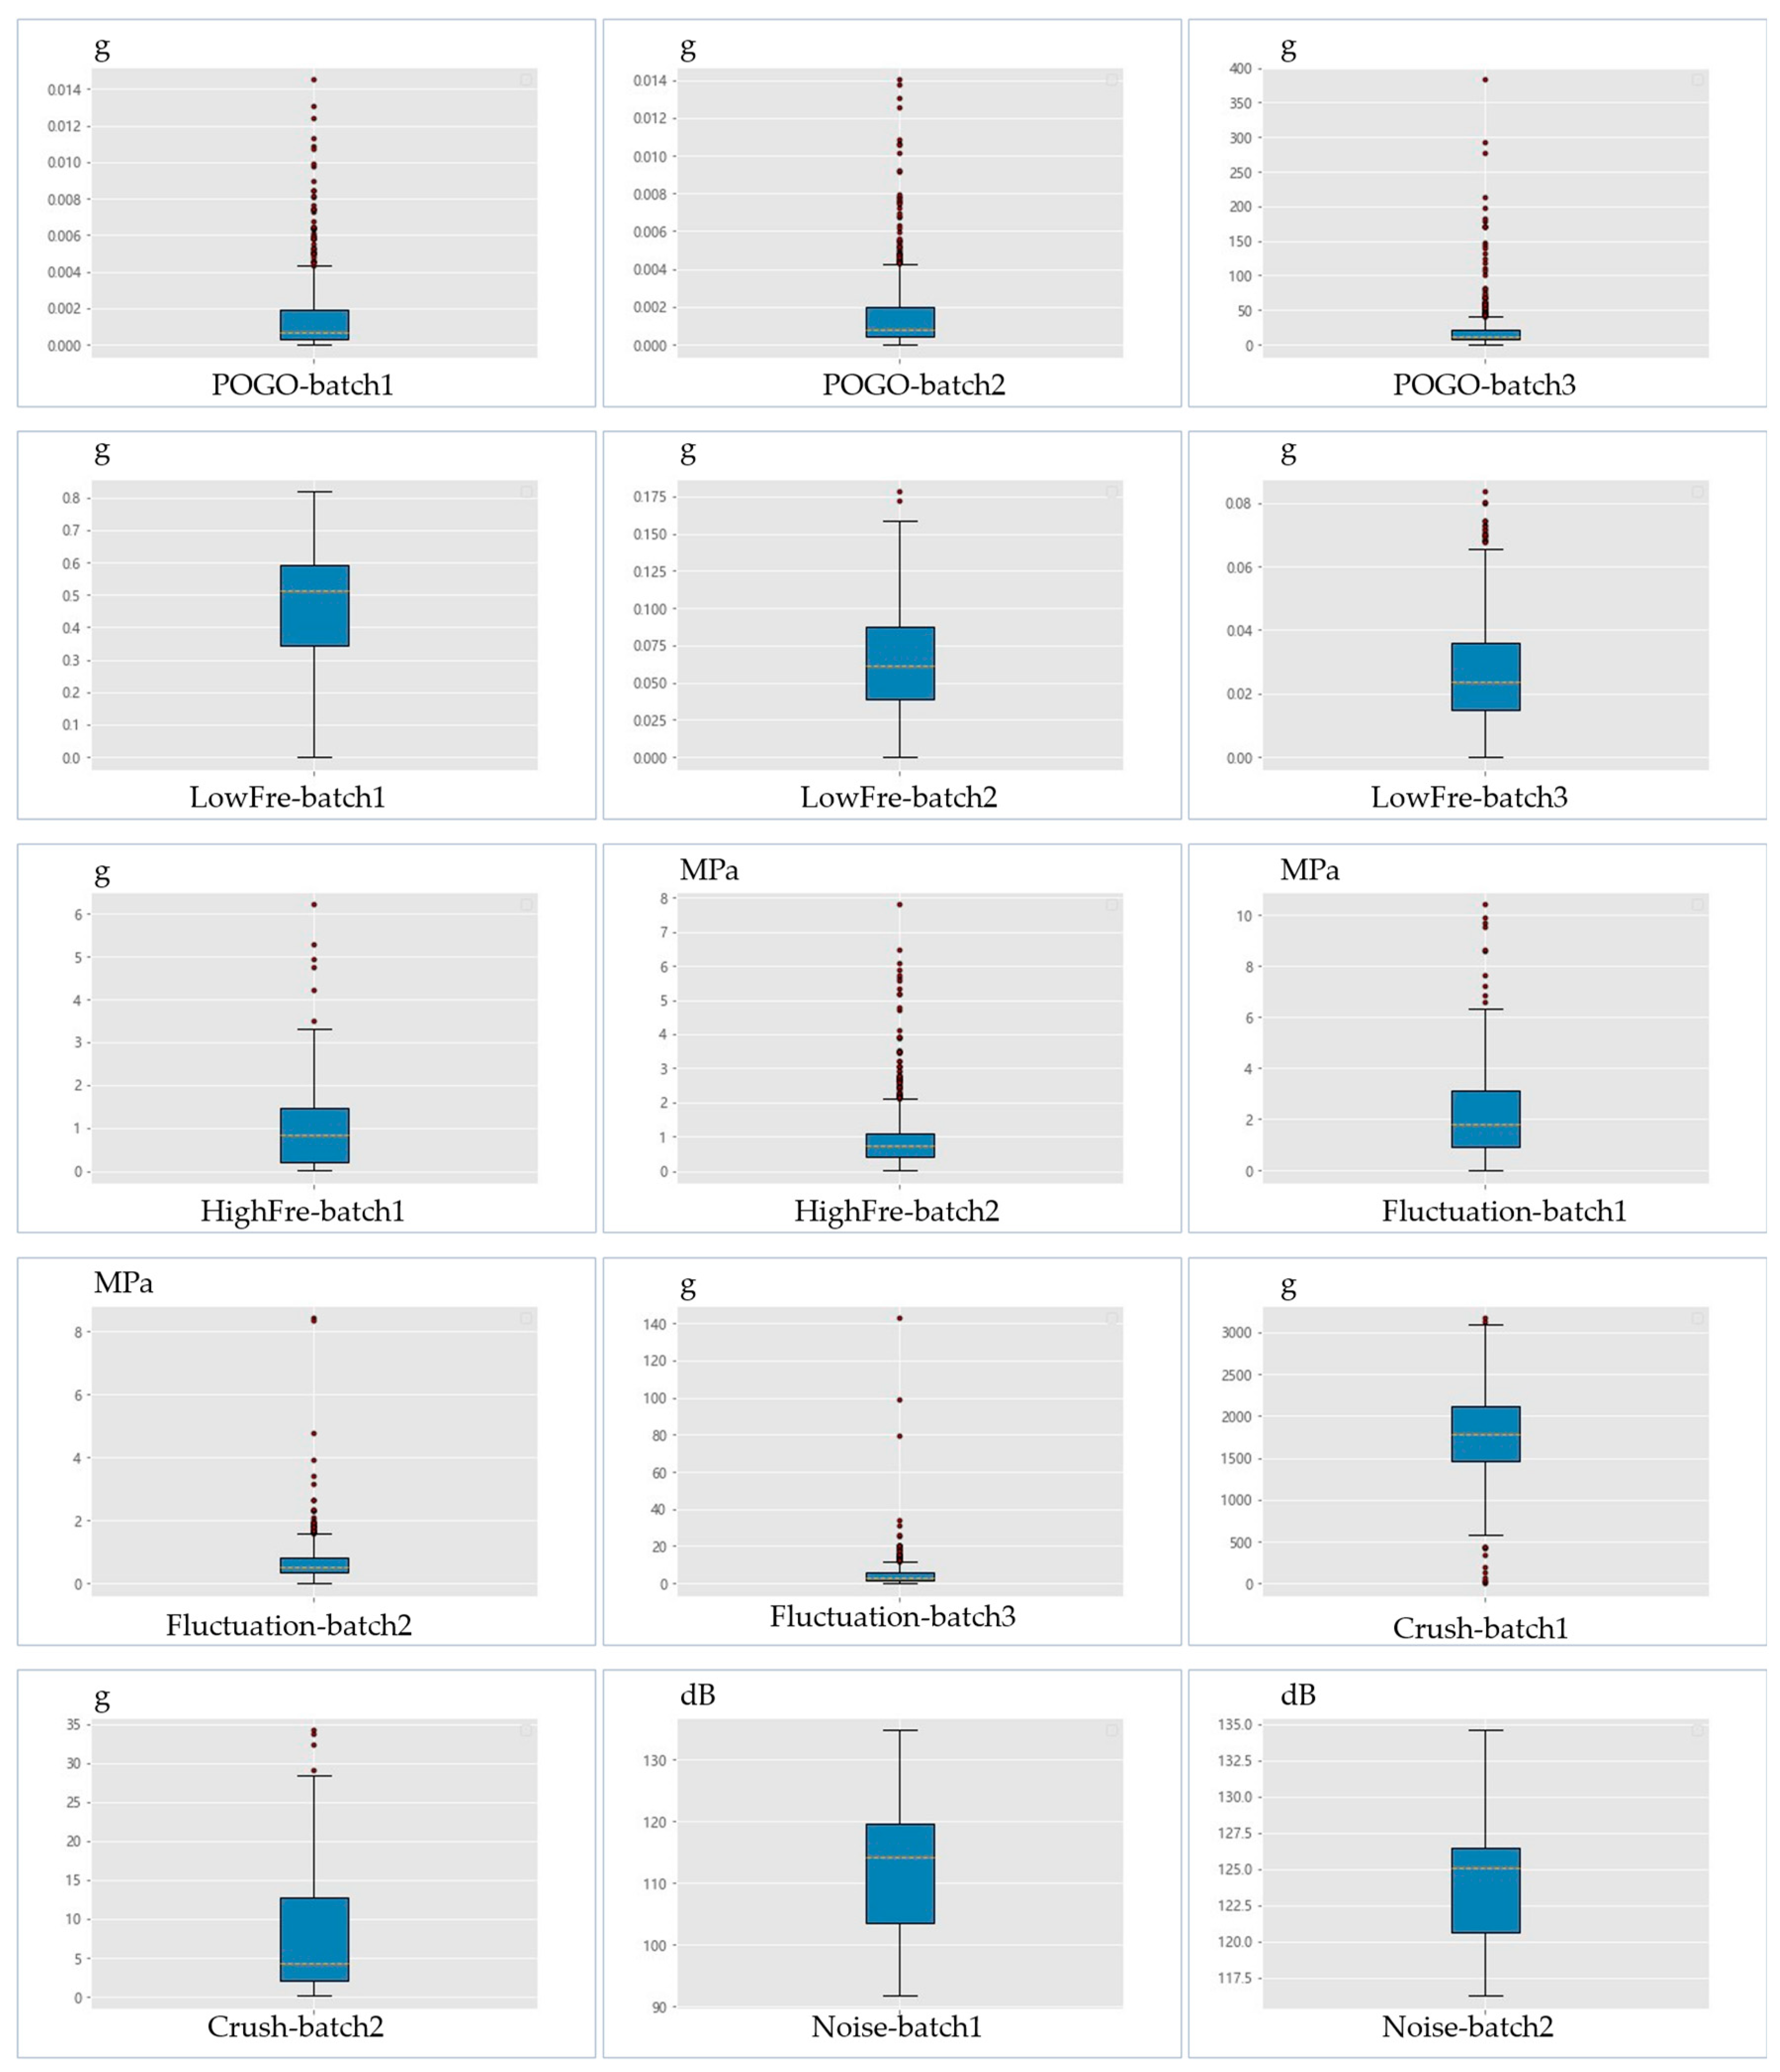
The boxplot analysis of six types of vibration signals under normal working conditions is carried out as shown in Figure 6:
The upper and lower limits of the data obtained by the analysis are shown in Table 9.
5.2. State Space Division Based on Boxplots
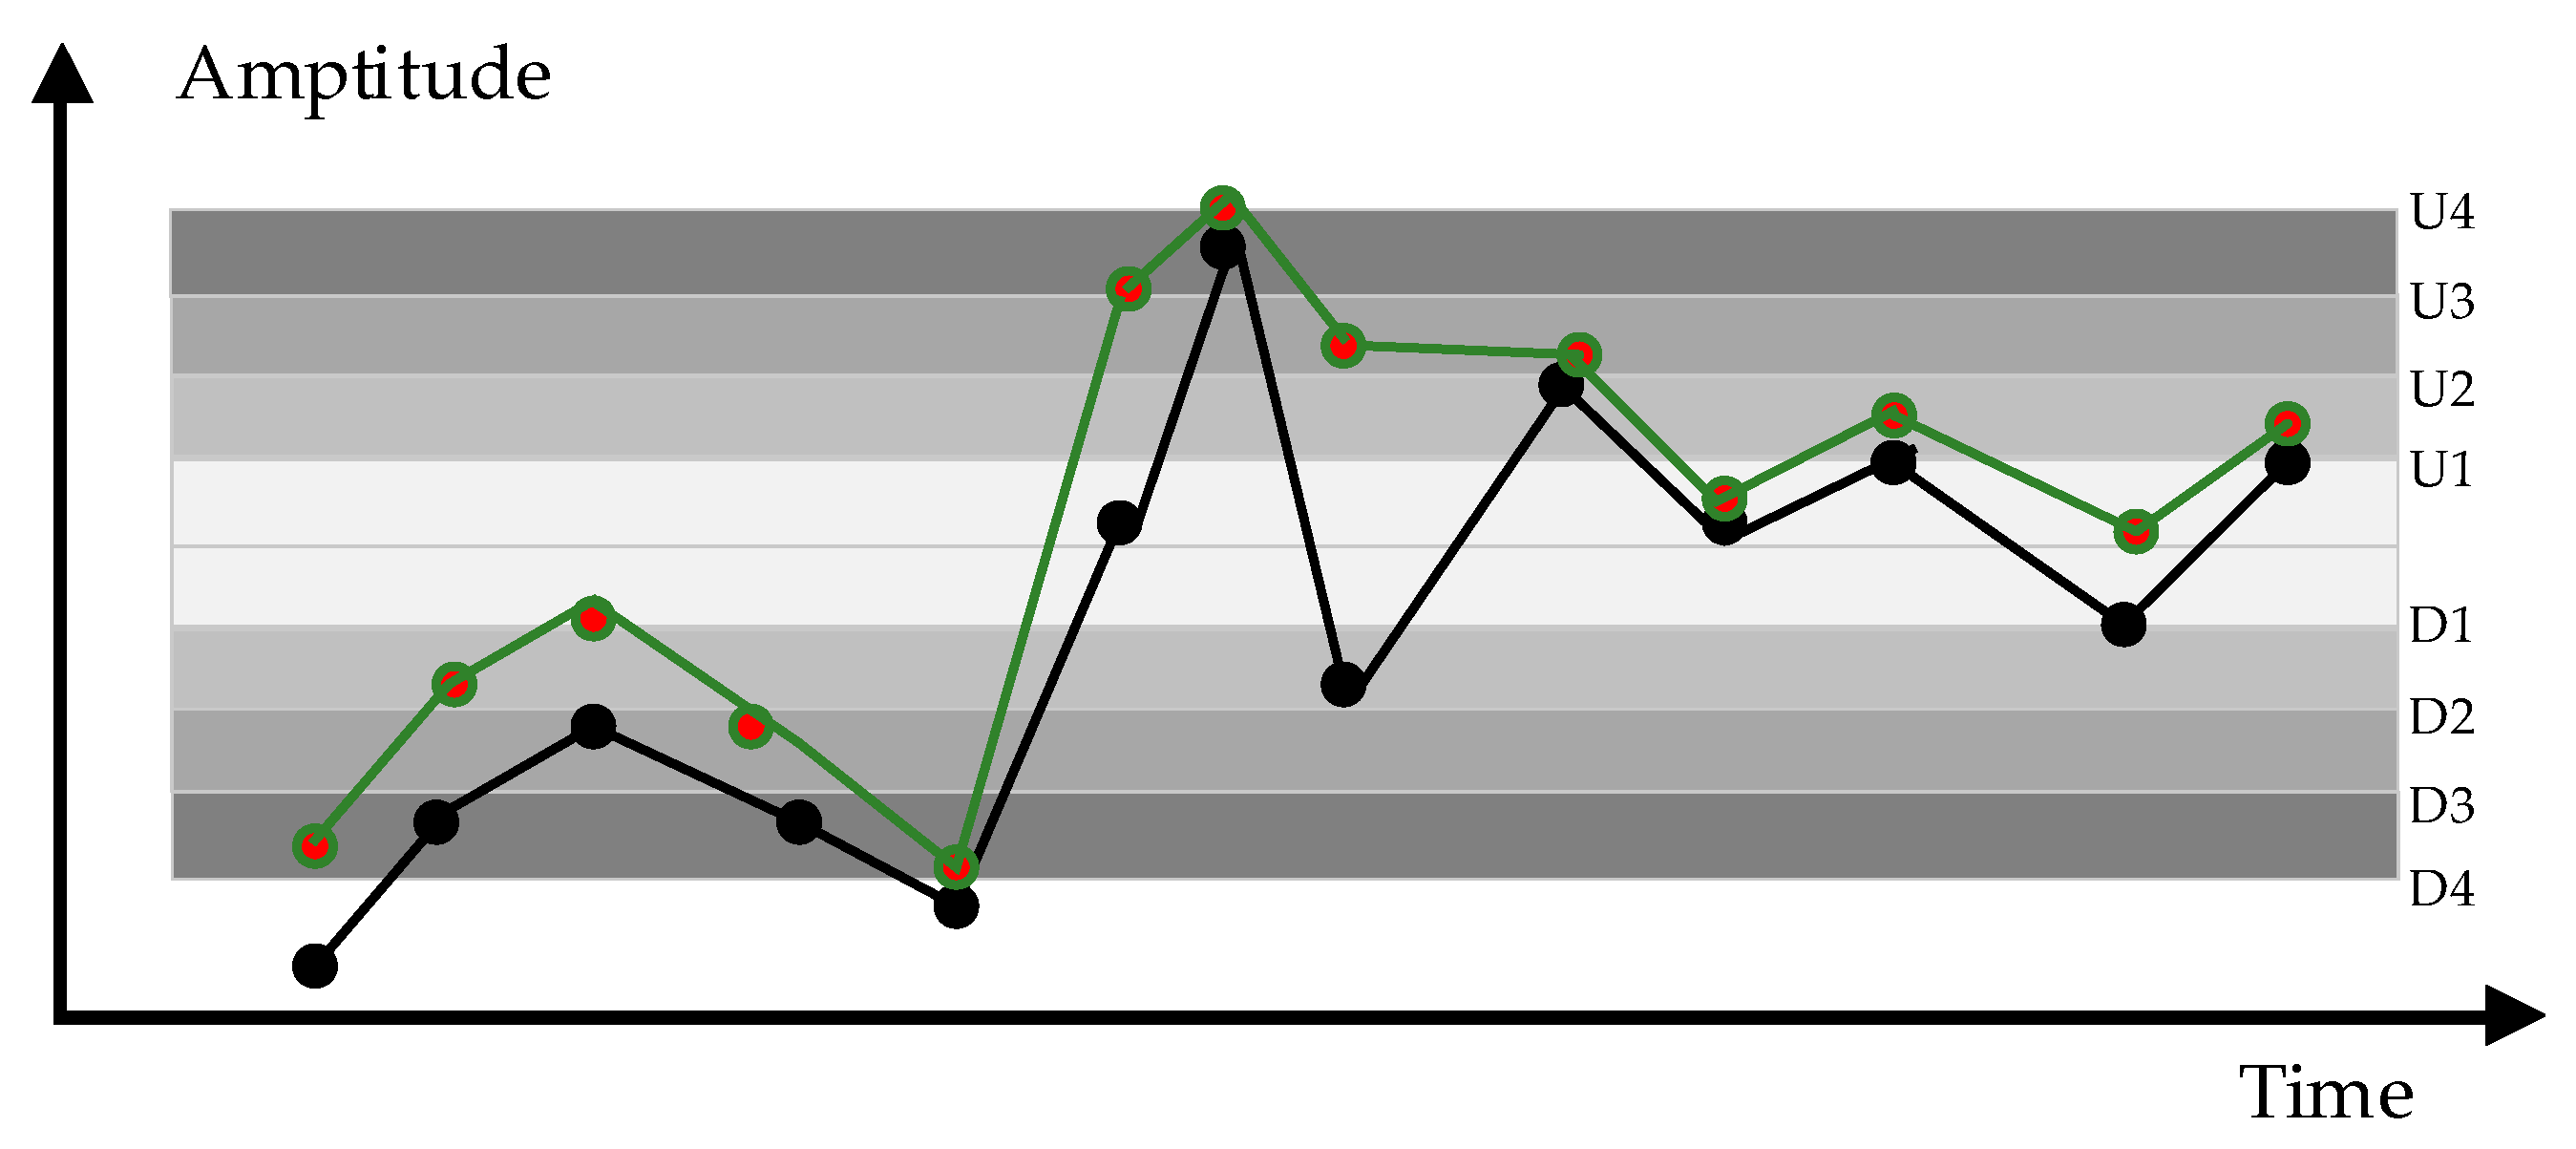
According to the expert experience, the set of healthy comments is {Excellent, Good, Normal, Bad, Deterioration}, corresponding to each color block, as shown in Figure 7. The green line represents the predicted data of the vibration signal, and the black line represents the actual vibration data.
The boundary waveform amplitudes of the signal before the vibration condition occurs are the upper whisker and lower whisker, the total number of sampling points of the test data is , the upper and lower thresholds of the reference waveform are set to , , respectively, and the number of points in each threshold interval is .
The state space threshold set by expert experience is as follows:
The status range is set to: , where stands for excellent status, stands for good condition, and so on. Each health state space corresponds to a score.
Each individual evaluation in the evaluation set matrix is counted by the state interval of each sampling point of the prediction data, and the percentage is scored according to the interval probability:
We followed the steps above to complete the evaluation set generation experiment. Due to space limitations, only the evaluation set of LSTM and GRU algorithms is displayed. Table 10 is the evaluation set of LSTM, and Table 11 is the evaluation set of GRU. Table 12 is the evaluation set of real test data.
6. Fuzzy Comprehensive Assessment
6.1. Principles and Steps of Fuzzy Comprehensive Assessment
The fuzzy comprehensive evaluation method has the advantages of clear results and strong systematization, which is suitable for a more comprehensive and in-depth evaluation of multi-level and multi-factor objects in a fuzzy environment. A large number of expert systems used in spacecraft health management use historical experience to build a knowledge base and make system evaluations more intelligent through extrapolation, mapping and other methods. However, in fact, the unstable working conditions of the launch vehicle engine have a strong relationship with the launch environment and flight trajectory. At the same time, the frequent iteration of launch vehicle engine technology and technology has not led to the rapid replenishment of the expert system knowledge base, so the evaluation method based on expert systems is not universal, accurate or comprehensive.
The weight set and evaluation set calculated from the above chapters are two parallel inputs for the fuzzy comprehensive evaluation method. The evaluation steps of the fuzzy integrated assessment method are as follows:
- (1)
- Establish the overall structure of the research objectives and create a multi-level structure to facilitate subsequent bottom-up evaluation;
- (2)
- Create a set of healthy comments: based on the actual object. In Section 5.2, we have set ;
- (3)
- Obtain the weight matrix for the factors in each level and the evaluation matrix of the underlying signal;
- (4)
- Perform fuzzy evaluation operations to obtain the fuzzy evaluation vector of the target layer as follows:
- (5)
- According to the needs of the project, assign the scores that can be obtained for each type of evaluation and generate a score vector ;
- (6)
- Calculate statistical health score, which is the health of the system.
6.2. Scoring Rocket Engine Health Based on Fuzzy Comprehensive Assessment
From above experiment, we can obtain the evaluation matrix: and the weight matrix: . represents the single evaluation vector of the underlying factor layer, represents the sub-target layer weight vector and represents the weight vector for each type of vibration signal.
The score set is set to . Therefore, the health evaluation vector of the target layer launch vehicle engine system under the multi-accumulation vibration signal is shown below:
- ,
- ,
- ,
- ,
- ,
- .
The health score calculation formula is: , the real data health score is 95.6946, the prediction evaluation result is shown in Table 13 and the minimum error is 0.0193%. The status is in line with expert experience.
7. Conclusions
This paper proposes a predictive evaluation method for a launch vehicle engine. This method has the advantages of being objective as well as having a high amount of precision and strong versatility. Compared with the membership function method commonly used in the traditional method, the method based on the boxplot principle is adopted to obtain a higher evaluation accuracy. Combined with the AHP method, the weight factors of various vibration signals are obtained, and the evaluation process is not overly dependent on expert experience. Finally, the fuzzy comprehensive evaluation method is used to obtain the health value of the launch vehicle engine from the bottom up, which is suitable for complex fuzzy systems. The experiment with actual data verified that the method has a high level of accuracy.
The method proposed in the paper has important guiding significance for the healthy evaluation and management of launch vehicles and can effectively reduce the state monitoring pressure of ground survey personnel. At the same time, the preprocessing method of data sampling makes the algorithm lightweight, and, combined with a high-precision data prediction effect, it is suitable for synchronous operations during the launch period. We obtained a health score through the five steps of the spatial division of health states, data prediction, evaluation set generation, a weight analysis and fuzzy comprehensive evaluation, which is a convenient method for ground-monitoring personnel to accurately grasp the flight status of a rocket after launch and can be used in the formulation of flight strategies.
Author Contributions
Conceptualization, R.L., Z.Z. and L.H.; methodology, L.H.; software, L.H.; validation, L.H. and R.L.; formal analysis, L.H. and X.Z.; investigation, L.H., R.L. and Z.L.; resources, L.H.; data curation, R.L.; writing—original draft preparation, L.H. and R.L.; writing—review and editing, R.L., L.H., Z.L., X.Z. and Z.Z.; visualization, L.H.; supervision, Z.L., X.Z. and Z.Z.; project administration, L.H.; funding acquisition, Z.Z. and R.L. All authors have read and agreed to the published version of the manuscript.
Funding
This research received no external funding.
Institutional Review Board Statement
Not applicable.
Informed Consent Statement
Not applicable.
Data Availability Statement
Not applicable.
Conflicts of Interest
The authors declare no conflict of interest.
References
- Zhang, C.; Rui, X.T.; Rong, B.; Wang, G.P. Vibration characteristics of airborne multiple launch rocket systems. J. Vib. Eng. 2013, 26, 15–19. [Google Scholar]
- Cha, J.; Ko, S.; Park, S.-Y.; Jeong, E. Fault detection and diagnosis algorithms for transient state of an open-cycle liquid rocket engine using nonlinear Kalman filter methods. Acta Astronaut. 2019, 163, 147–156. [Google Scholar] [CrossRef]
- Leng, G.; McGinnity, T.M.; Prasad, G. An approach for on-line extraction of fuzzy rules using a self-organising fuzzy neural network. Fuzzy Sets Syst. 2005, 150, 211–243. [Google Scholar] [CrossRef]
- Ge, D.; Zeng, X.J. A self-evolving fuzzy system which learns dynamic threshold parameter by itself. IEEE Trans. Fuzzy Syst. 2019, 27, 1625–1637. [Google Scholar] [CrossRef]
- Subramanian, K.; Suresh, S.; Sundararajan, N. A metacognitive neuro-fuzzy inference system (McFIS) for sequential classification problems. IEEE Trans. Fuzzy Syst. 2013, 21, 1080–1095. [Google Scholar] [CrossRef]
- Zhang, Z.Z.; Chen, H.; Gao, Y.S.; Zhang, H. Review on Fault Diagnosis Technology of Liquid Rocket Engine. J. Propuls. Technol. 2022, 43, 15–33. [Google Scholar]
- Davidson, M.; Stephens, J. Advanced Health Management System for the Space Shuttle Main Engine. In Proceedings of the 40th AIAA/ASME/SAE/ASEE Joint Propulsion Conference and Exhibit, Fort Lauderdale, FL, USA, 11–14 July 2004. [Google Scholar]
- Breedveld, L.A. A Comparative Evaluation of Models and Algorithms in Model-Based Fault Diagnosis. Master’s Thesis, Delft University of Technology, Delft, The Netherlands, 2004. [Google Scholar]
- Srivastava, A.N.; Buntine, W. Predicting Engine Parameters Using the Optic Spectrum of the Space Shuttle Main Engine Exhaust Plume. In Proceedings of the 10th Computing in Aerospace Conference, San Antonio, TX, USA, 28–30 March 1995. [Google Scholar]
- Hawman, M.W.; Galinaitis, W.S.; Tulpule, S.; Mattedi, A.K.; Kamener, J. Framework for a Space Shuttle Main Engine Health Monitoring System; NASA-CR-185224; NASA: Washington, DC, USA, 1990.
- Yairi, T.; Takeishi, N.; Oda, T.; Nakajima, Y.; Nishimura, N.; Takata, N. A data-driven health monitoring method for satellite housekeeping data based on probabilistic clustering and dimensionality reduction. IEEE Trans. Aerosp. Electron. Syst. 2017, 53, 1384–1401. [Google Scholar] [CrossRef]
- Engle, J.; Don, B.; John, M. Prelaunch Expert System for Space Shuttle propulsion system health monitoring. In Proceedings of the 26th Joint Propulsion Conference, Orlando, FL, USA, 16–18 July 1990. [Google Scholar]
- Kurien, J.; Nayak, P.P. Back to the future for consistency-based trajectory tracking. In Proceedings of the AAAI/IAAI, Austin, TX, USA, 30 July–3 August 2000; pp. 370–371. [Google Scholar]
- Perry, J.; Riechel, J.; Norman, A.; Madszar, G. An Expert System Approach to Turbopump Health Monitoring. In Proceedings of the 24th Joint Propulsion Conference, Boston, MA, USA, 11–13 July 1988. [Google Scholar]
- Xu, L.; Zhao, S.; Li, N.; Gao, Q.; Wang, T.; Xue, W. Application of QGA-BP for fault detection of liquid rocket engines. IEEE Trans. Aerosp. Electron. Syst. 2019, 55, 2464–2472. [Google Scholar] [CrossRef]
- Aiswarya, N.; Priyadharsini, S.S.; Moni, K.S. An efficient approach for the diagnosis of faults in turbo pump of liquid rocket engine by employing FFT and time-domain features. Aust. J. Mech. Eng. 2018, 16, 163–172. [Google Scholar] [CrossRef]
- Wu, Y.Y.; Li, N.G.; Xue, W.; Xu, L. Fault diagnosis of liquid-propellant rocket engines base on improved PSO to optimize LSSV. Comput. Simul. 2020, 37, 49–54. [Google Scholar]
- Wang, B.; Lei, Y.; Li, N.; Yan, T. Deep separable convolutional network for remaining useful life prediction of machinery. Mech. Syst. Signal Process. 2019, 134, 106330. [Google Scholar] [CrossRef]
- Miao, H.; Li, B.; Sun, C.; Liu, J. Joint learning of degradation assessment and RUL prediction for aeroengines via dual-task deep LSTM networks. IEEE Trans. Ind. Inform. 2019, 15, 5023–5032. [Google Scholar] [CrossRef]
- Tao, F.; Zhang, M.; Liu, Y.; Nee, A.Y.C. Digital twin driven prognostics and health management for complex equipment. Cirp Annals 2018, 67, 169–172. [Google Scholar] [CrossRef]
- Zhou, X.G.; Sun, B. Stability Analysis of POGO Vibration Considering Multiple Parameter Variations. Manned Spacefl. 2019, 25, 367–371. [Google Scholar]
- Yang, Y.; Yu, T.; Guo, Y.N.; Jia, Z.J.; Wang, Y.P. Application of Fluctuating Pressure Measurement Technology in Rocket Engine Test. J. Astronaut. 2021, 42, 917–926. [Google Scholar]
- Saaty, T.L. A scaling method for priorities in hierarchical structures. J. Math. Psychol. 1977, 15, 234–281. [Google Scholar] [CrossRef]
- Guo, H.; Lin, X.; Zhu, K. Pyramid LSTM Network for Tool Condition Monitoring. IEEE Trans. Instrum. Meas. 2022, 71, 2509511. [Google Scholar] [CrossRef]
- Li, Y.; Yang, Y.; Zhu, K.; Zhang, J. Clothing Sale Forecasting by a Composite GRU-Prophet Model with an Attention Mechanism. IEEE Trans. Ind. Inform. 2021, 17, 8335–8344. [Google Scholar] [CrossRef]
- Zhao, Y.; He, X.; Zhou, D.; Pecht, M.G. Detection and isolation of wheelset intermittent over-creeps for electric multiple units based on a weighted moving average technique. IEEE Trans. Intell. Transp. Syst. 2020, 23, 3392–3405. [Google Scholar] [CrossRef]
- Box, G.; Jenkins, G.M. Time Series Analysis, Forecasting and Control. J. R. Stat. Soc. Ser. A 1976, 134, 3. [Google Scholar]
- Mao, Z.; Xia, M.; Jiang, B.; Xu, D.; Shi, P. Incipient fault diagnosis for high-speed train traction systems via stacked generalization. IEEE Trans. Cybern. 2022, 52, 7624–7633. [Google Scholar] [CrossRef] [PubMed]
Figure 1.
The structure of the three layers of the dataset.

Figure 2.
Predictive evaluation process.

Figure 3.
A symbolic representation of each factor in the weight set generation method.

Figure 4.
Prediction examples of five algorithms: (a) Prediction examples of LSTM; (b) Prediction examples of ARIMA; (c) Prediction examples of GRU; (d) Prediction examples of LightGBM; (e) Prediction examples of WMA. On the left of the picture is the first batch of POGO vibrations. On the right of the picture is the first batch of low-frequency vibrations.


Figure 5.
Schematic diagram of the traditional membership function method.

Figure 6.
Boxplot analysis of six types of vibration signals under normal working conditions.

Figure 7.
Evaluation set generation method, dividing threshold schematic diagram.


Table 1.
Consistency inspection RI indicators.
| Number of Levels | 1 | 2 | 3 | 4 | 5 | 6 | 7 | 8 | 9 | 10 | 11 | … |
| RI | 0 | 0 | 0.52 | 0.89 | 1.12 | 1.24 | 1.36 | 1.41 | 1.46 | 1.49 | 1.52 | … |
Table 2.
Reciprocal matrix of sub-target layer.
| POGO | Low-FRE | High-FRE | Fluctuation | Crush | Noise | |
|---|---|---|---|---|---|---|
| POGO | 1 | 3/2 | 5 | 4/3 | 3 | 9 |
| Low-FRE | 2/3 | 1 | 3 | 3/4 | 2 | 6 |
| High-FRE | 1/5 | 1/3 | 1 | 1/4 | 2/3 | 2 |
| Fluctuation | 3/4 | 3/4 | 4 | 1 | 8/3 | 8 |
| Crush | 1/3 | 1/2 | 3/2 | 3/8 | 1 | 3 |
| Noise | 1/9 | 1/6 | 1/2 | 1/8 | 1/3 | 1 |
Table 3.
Reciprocal matrix of low-frequency signal.
| Sensor Batch | 1 | 2 | 3 |
|---|---|---|---|
| 1 | 1 | 1/2 | 1/4 |
| 2 | 2 | 1 | 1/2 |
| 3 | 4 | 2 | 1 |
Table 4.
Library version for five algorithms.
| LSTM, GRU | Version | ARIMA, WMA, LightGBM | Version |
|---|---|---|---|
| TensorFlow2 | 2.4.0 | Base | - |
| Python | 3.7.11 | Python | 3.6.5 |
| Keras | 2.8.0 | statsmodels | 0.12.2 |
| NumPy | 1.19.2 | NumPy | 1.19.5 |
| Matplotlib | 3.2.1 | Matplotlib | 3.3.4 |
| Pandas | 0.25.3 | Pandas | 1.1.5 |
| - | - | Lightgbm | 3.3.2 |
Table 5.
Model parameters of LSTM and GRU algorithms.
| LSTM Layer | Shape | GRU Layer | Shape |
|---|---|---|---|
| InputLayer | (None, 5, 1) | InputLayer | (None, 5, 1) |
| Keras.LSTM | (None, 20) | Keras.GRU | (None, 20) |
| Dense_1 | (None, 40) | Dense_1 | (None, 40) |
| Dense_2 | (None, 1) | Dense_2 | (None, 1) |
| batch_size | 8 | batch_size | 8 |
| epochs | 20 | epochs | 20 |
Table 6.
Model parameters of WMA and ARIMA algorithms.
| WMA Index | Shape | ARIMA Index | Value |
|---|---|---|---|
| Window_Size | (int (Data_length/5), 5) | Order (p, d, q) | (2, 1, 2) |
Table 7.
Model parameters of LightGBM algorithms.
| LightGBM Index | Value |
|---|---|
| n_splits | 10 |
| learning_rate | 0.1 |
| max_depth | 15 |
| num_leaves | 20 |
| num_boost_round | 300 |
| early_stopping_rounds | 30 |
Table 8.
Prediction results using RMSE, MAPE and R2 as error indicators.
| Method | LSTM | ARIMA | GRU | LightGBM | WMA | ||||||||||
|---|---|---|---|---|---|---|---|---|---|---|---|---|---|---|---|
| Index | RMSE | MAPE | R2 | RMSE | MAPE | R2 | RMSE | MAPE | R2 | RMSE | MAPE | R2 | RMSE | MAPE | R2 |
| POGO | 0.002 | 0.623 | 0.535 | 0.005 | 0.002 | −0.975 | 0.002 | 0.001 | 0.477 | 0.003 | 0.001 | 0.366 | 0.002 | 0.0016 | 0.436 |
| 0.003 | 0.794 | 0.425 | 0.205 | 0.003 | −0.830 | 0.002 | 0.740 | 0.645 | 0.003 | 0.001 | 0.427 | 0.002 | 0.001 | 0.460 | |
| 12.061 | 351.247 | 0.522 | 58.204 | 4.385 | 10.146 | 11.034 | 0.668 | 0.600 | 13.422 | 0.668 | 0.408 | 11.444 | 0.617 | 0.570 | |
| Low-FRE | 0.005 | 19.168 | 0.992 | 0.632 | 0.404 | −111.457 | 0.010 | 0.006 | 0.969 | 0.008 | 0.006 | 0.980 | 0.030 | 0.009 | 0.985 |
| 0.0827 | 14.453 | 0.199 | 0.098 | 0.0433 | −0.151 | 0.056 | 0.020 | 0.632 | 0.082 | 0.020 | 0.208 | 0.070 | 0.026 | 0.384 | |
| 0.007 | 3.366 | 0.397 | 0.025 | 0.016 | −6.086 | 0.007 | 0.005 | 0.378 | 0.007 | 0.005 | 0.458 | 0.008 | 0.006 | 0.235 | |
| High-FRE | 0.125 | 38.464 | 0.633 | 0.349 | 0.168 | −1.882 | 0.125 | 0.049 | 0.634 | 0.120 | 0.049 | 0.665 | 0.142 | 0.053 | 0.527 |
| 0.593 | 131.832 | 0.564 | 1.160 | 0.386 | −0.680 | 0.586 | 0.168 | 0.575 | 0.641 | 0.168 | 0.492 | 0.590 | 0.167 | 0.569 | |
| Fluctuation | 3.362 | 214.379 | 0.431 | 5.337 | 0.472 | −0.129 | 3.327 | 0.293 | 0.567 | 3.717 | 0.293 | 0.459 | 4.425 | 0.331 | 0.230 |
| 2.669 | 179.791 | 0.506 | 4.020 | 0.714 | −0.138 | 2.464 | 0.199 | 0.579 | 2.924 | 0.199 | 0.407 | 3.024 | 0.177 | 0.362 | |
| 1.722 | 324.107 | 0.709 | 14.1562 | 2.800 | −18.932 | 1.671 | 0.280 | 0.726 | 1.824 | 0.280 | 0.674 | 1.865 | 0.245 | 0.657 | |
| Shock | 514.729 | 28.136 | 0.847 | 5942.834 | 0.883 | −18.372 | 779.443 | 0.078 | 0.649 | 536.688 | 0.078 | 0.834 | 146.726 | 0.017 | 0.988 |
| 5.730 | 119.204 | 0.644 | 13.460 | 0.643 | −0.688 | 5.672 | 0.397 | 0.65 | 5.137 | 0.397 | 0.714 | 5.138 | 0.410 | 0.732 | |
| Noise | 18.948 | 8.218 | −16.553 | 14.555 | 0.107 | −9.414 | 3.529 | 0.007 | 0.391 | 1.197 | 0.007 | 0.9305 | 1.923 | 0.011 | 0.820 |
| 6.347 | 2.733 | −0.008 | 10.866 | 0.075 | −0.803 | 10.047 | 0.026 | −1.526 | 5.131 | 0.026 | 0.341 | 5.317 | 0.031 | 0.463 | |
Table 9.
Boxplot analysis results.
| Evaluation Index | Q1 | Q3 | IQR | Upper Whisker | Lower Whisker |
|---|---|---|---|---|---|
| POGO | 0.00033 | 0.00192 | 0.00159 | 0.004311 | −0.002059 |
| 0.00043 | 0.00197 | 0.00155 | 0.004293 | −0.001894 | |
| 7.23250 | 20.64000 | 13.40750 | 40.75125 | −12.878750 | |
| Low-FRE | 0.34259 | 0.51403 | 0.24975 | 0.888657 | −0.032034 |
| 0.03875 | 0.08733 | 0.04858 | 0.160188 | −0.034113 | |
| 0.01493 | 0.03593 | 0.02100 | 0.06743 | −0.016573 | |
| High-FRE | 0.19508 | 1.46291 | 1.26783 | 3.364663 | −1.706674 |
| 0.41815 | 1.09954 | 0.68138 | 2.121609 | −0.603918 | |
| fluctuation | 0.89775 | 3.10775 | 2.21000 | 6.42275 | −2.417250 |
| 0.32800 | 0.83250 | 0.50450 | 1.58925 | −0.428750 | |
| 1.65750 | 5.71250 | 4.05500 | 11.795 | −4.425000 | |
| Shock | 1458.52925 | 2113.22075 | 654.69150 | 3095.258 | 476.492000 |
| 2.08061 | 12.68086 | 10.60025 | 28.58124 | −13.819764 | |
| Noise | 103.58910 | 119.63305 | 16.04395 | 143.699 | 79.523175 |
| 120.62943 | 126.47000 | 5.84058 | 135.2309 | 111.868563 |
Table 10.
The valuation probability of waveform predicted by LSTM method.
| Evaluation Index | Batch | Excellent | Good | Normal | Bad | Deterioration |
|---|---|---|---|---|---|---|
| POGO | 1 | 0.937 | 0.012 | 0.003 | 0.013 | 0.035 |
| 2 | 0.849 | 0.05 | 0.038 | 0.028 | 0.035 | |
| 3 | 0.972 | 0.013 | 0.015 | 0 | 0 | |
| Low-FRE | 1 | 1 | 0 | 0 | 0 | 0 |
| 2 | 0.975 | 0.003 | 0.003 | 0.006 | 0.013 | |
| 3 | 1 | 0 | 0 | 0 | 0 | |
| High-FRE | 1 | 1 | 0 | 0 | 0 | 0 |
| 2 | 0.936 | 0.028 | 0.019 | 0.013 | 0.004 | |
| fluctuation | 1 | 0.965 | 0.003 | 0.013 | 0.013 | 0.006 |
| 2 | 0.934 | 0.009 | 0.009 | 0.006 | 0.042 | |
| 3 | 0.991 | 0.003 | 0.006 | 0 | 0 | |
| Shock | 1 | 0 | 0 | 0 | 0.464 | 0.536 |
| 2 | 0.95 | 0.05 | 0 | 0 | 0 | |
| Noise | 1 | 1 | 0 | 0 | 0 | 0 |
| 2 | 0.982 | 0.018 | 0 | 0 | 0 |
Table 11.
The valuation probability of waveform predicted by GRU method.
| Evaluation Index | Batch | Excellent | Good | Normal | Bad | Deterioration |
|---|---|---|---|---|---|---|
| POGO | 1 | 0.937 | 0.009 | 0.013 | 0.025 | 0.016 |
| 2 | 0.896 | 0.006 | 0.019 | 0.01 | 0.069 | |
| 3 | 0.965 | 0.01 | 0.016 | 0.009 | 0 | |
| Low-FRE | 1 | 1 | 0 | 0 | 0 | 0 |
| 2 | 0.978 | 0.009 | 0.003 | 0.003 | 0.007 | |
| 3 | 1 | 0 | 0 | 0 | 0 | |
| High-FRE | 1 | 1 | 0 | 0 | 0 | 0 |
| 2 | 0.943 | 0.025 | 0.013 | 0.016 | 0.003 | |
| fluctuation | 1 | 0.968 | 0 | 0.013 | 0.006 | 0.013 |
| 2 | 0.921 | 0.013 | 0.013 | 0.009 | 0.044 | |
| 3 | 0.991 | 0.003 | 0.006 | 0 | 0 | |
| Shock | 1 | 0 | 0 | 0 | 0.568 | 0.432 |
| 2 | 0.942 | 0.041 | 0.017 | 0 | 0 | |
| Noise | 1 | 1 | 0 | 0 | 0 | 0 |
| 2 | 0.582 | 0.418 | 0 | 0 | 0 |
Table 12.
The evaluation probability of the test data waveform.
| Evaluation Index | Batch | Excellent | Good | Normal | Bad | Deterioration |
|---|---|---|---|---|---|---|
| POGO | 1 | 0.916 | 0.022 | 0.009 | 0.013 | 0.04 |
| 2 | 0.866 | 0.031 | 0.025 | 0.031 | 0.047 | |
| 3 | 0.919 | 0.034 | 0.016 | 0.025 | 0.006 | |
| Low-FRE | 1 | 1 | 0 | 0 | 0 | 0 |
| 2 | 0.972 | 0.003 | 0 | 0.009 | 0.016 | |
| 3 | 1 | 0 | 0 | 0 | 0 | |
| High-FRE | 1 | 1 | 0 | 0 | 0 | 0 |
| 2 | 0.944 | 0.009 | 0.025 | 0.018 | 0.004 | |
| fluctuation | 1 | 0.972 | 0 | 0.016 | 0.003 | 0.009 |
| 2 | 0.937 | 0.003 | 0.012 | 0.009 | 0.039 | |
| 3 | 0.982 | 0.006 | 0.006 | 0.006 | 0 | |
| Shock | 1 | 0 | 0 | 0.454 | 0.315 | 0.231 |
| 2 | 0.896 | 0.056 | 0.048 | 0 | 0 | |
| Noise | 1 | 0.967 | 0.033 | 0 | 0 | 0 |
| 2 | 1 | 0 | 0 | 0 | 0 |
Table 13.
Health evaluation value and evaluation error of five kinds of algorithms.
| LSTM | ARIMA | GRU | LightGBM | WMA | TRUE | |
|---|---|---|---|---|---|---|
| Evaluation Value | 95.9239 | 95.3951 | 95.7139 | 94.8756 | 95.0935 | 95.6946 |
| Percentage of error (%) | 0.2243 | 0.2995 | 0.0193 | 0.8190 | 0.0611 | 0 |
Disclaimer/Publisher’s Note: The statements, opinions and data contained in all publications are solely those of the individual author(s) and contributor(s) and not of MDPI and/or the editor(s). MDPI and/or the editor(s) disclaim responsibility for any injury to people or property resulting from any ideas, methods, instructions or products referred to in the content. |
© 2023 by the authors. Licensee MDPI, Basel, Switzerland. This article is an open access article distributed under the terms and conditions of the Creative Commons Attribution (CC BY) license (https://creativecommons.org/licenses/by/4.0/).
Share and Cite
MDPI and ACS Style
Lin, R.; Huang, L.; Liu, Z.; Zhou, X.; Zhou, Z. A Multilayered and Multifactorial Health Assessment Method for Launch Vehicle Engine under Vibration Conditions. Aerospace 2023, 10, 505. https://doi.org/10.3390/aerospace10060505
AMA Style
Lin R, Huang L, Liu Z, Zhou X, Zhou Z. A Multilayered and Multifactorial Health Assessment Method for Launch Vehicle Engine under Vibration Conditions. Aerospace. 2023; 10(6):505. https://doi.org/10.3390/aerospace10060505
Chicago/Turabian StyleLin, Ruliang, Lijing Huang, Zhiwen Liu, Xuehua Zhou, and Zhiguo Zhou. 2023. "A Multilayered and Multifactorial Health Assessment Method for Launch Vehicle Engine under Vibration Conditions" Aerospace 10, no. 6: 505. https://doi.org/10.3390/aerospace10060505
Note that from the first issue of 2016, this journal uses article numbers instead of page numbers. See further details here.