Article

Fast Sizing Methodology and Assessment of Energy Storage Configuration on the Flight Time of a Multirotor Aerial Vehicle †

1
Pole Systèmes et Energies Embarqués pour les Transports S2ET, ESTACA Laval, 53000 Laval, France
2
GeePs Group of Electrical Engineering-Paris, UMR CNRS 8507, CentraleSupélec, Université Paris-Saclay, 91192 Gif Sur Yvette, France
*
Author to whom correspondence should be addressed.
This paper is an extended version of our paper published in 12th EASN Conference on “Innovation in Aviation & Space for opening New Horizons”.
These authors contributed equally to this work.
Aerospace 2023, 10(5), 425; https://doi.org/10.3390/aerospace10050425
Submission received: 28 February 2023 / Revised: 27 April 2023 / Accepted: 28 April 2023 / Published: 30 April 2023

Abstract

:
Urban air mobility (UAM), defined as safe and efficient air traffic operations in a metropolitan area for manned aircraft and unmanned aircraft systems, is being researched and developed by industry, academia, and government. This kind of mobility offers an opportunity to construct a green and sustainable sub-sector, building upon the lessons learned over decades by aviation. Thanks to their non-polluting operation and simple air traffic management, electric vertical take-off and landing (eVTOL) aircraft technologies are currently being developed and experimented with for this purpose. However, to successfully complete the certification and commercialization stage, several challenges need to be overcome, particularly in terms of performance, such as flight time and endurance, and reliability. In this paper, a fast methodology for sizing and selecting the propulsion chain components of an eVTOL multirotor aerial vehicle was developed and validated on a reduced-scale prototype of an electric multirotor vehicle with a G T O W of 15 kg. This methodology is associated with a comparative study of energy storage system configurations, in order to assess their effect on the flight time of the aerial vehicle. First, the optimal pair motor/propeller was selected using a global nonlinear optimization in order to maximize the specific efficiency of these components. Second, five energy storage technologies were sized in order to evaluate their influence on the aerial vehicle flight time. Finally, based on this sizing process, the optimized propulsion chain gross take-off weight (GTOW) was evaluated for each energy storage configuration using regression-based methods based on propulsion chain supplier data.

1. Introduction

The eVTOL concept represents one of the potential solutions to remedy the traffic congestion problem in big cities across the world. In the case of French metropolitan cities, such as Paris and Marseille, an average commuter loses over 80 h every year in traffic, resulting in increased stress and anxiety (R1). Such congestion also leads to 1.85 megatons per year of CO2 emissions into the atmosphere. In addition to having a detrimental impact on the health of commuters and the environment, it also contributes to economic loss. Therefore, it is imperative to explore new modes of transportation to facilitate faster daily commutes for passengers in urban areas and reduce traffic congestion. Several aircraft manufacturers, such as Airbus, Boeing, Lilium, and Volocopter, have actively embarked on the development of this drone taxi technology in recent years [1,2,3,4,5]. In addition to Uber, which estimates the launch of its air taxis (called Uber Elevate) in 2023, other companies, such as Zephyr Airworks and Airbus, are also currently taking measures to conduct tests with their electric aviation taxis. Zephyr Airworks has developed Cora, while Airbus has developed Airbus Vahana. These companies are conducting tests in various countries across the world, including the USA, Japan, Singapore, New Zealand, France, and India.
eVTOL aircraft fit into four main categories: lift plus cruise, tilt rotor, ducted vector thrust, and multicopter (Figure 1). The first three categories fall under the powered lift aircraft classification, which includes winged aircraft that are capable of both VTOL and aerodynamic lifts during forward flights. The fourth category belongs to wingless aircraft, specifically multirotor aircraft with two or more lift/thrust units that have limited or no capability for wingborne forward flights. Powered lift eVTOLs can be further categorized based on whether they use a common power plant (tilt-rotor and ducted vector thrust) or an independent power plant (lift plus cruise) for both lifting and forward flights [6,7,8].
These categories are defined and characterized as follows [9,10]:
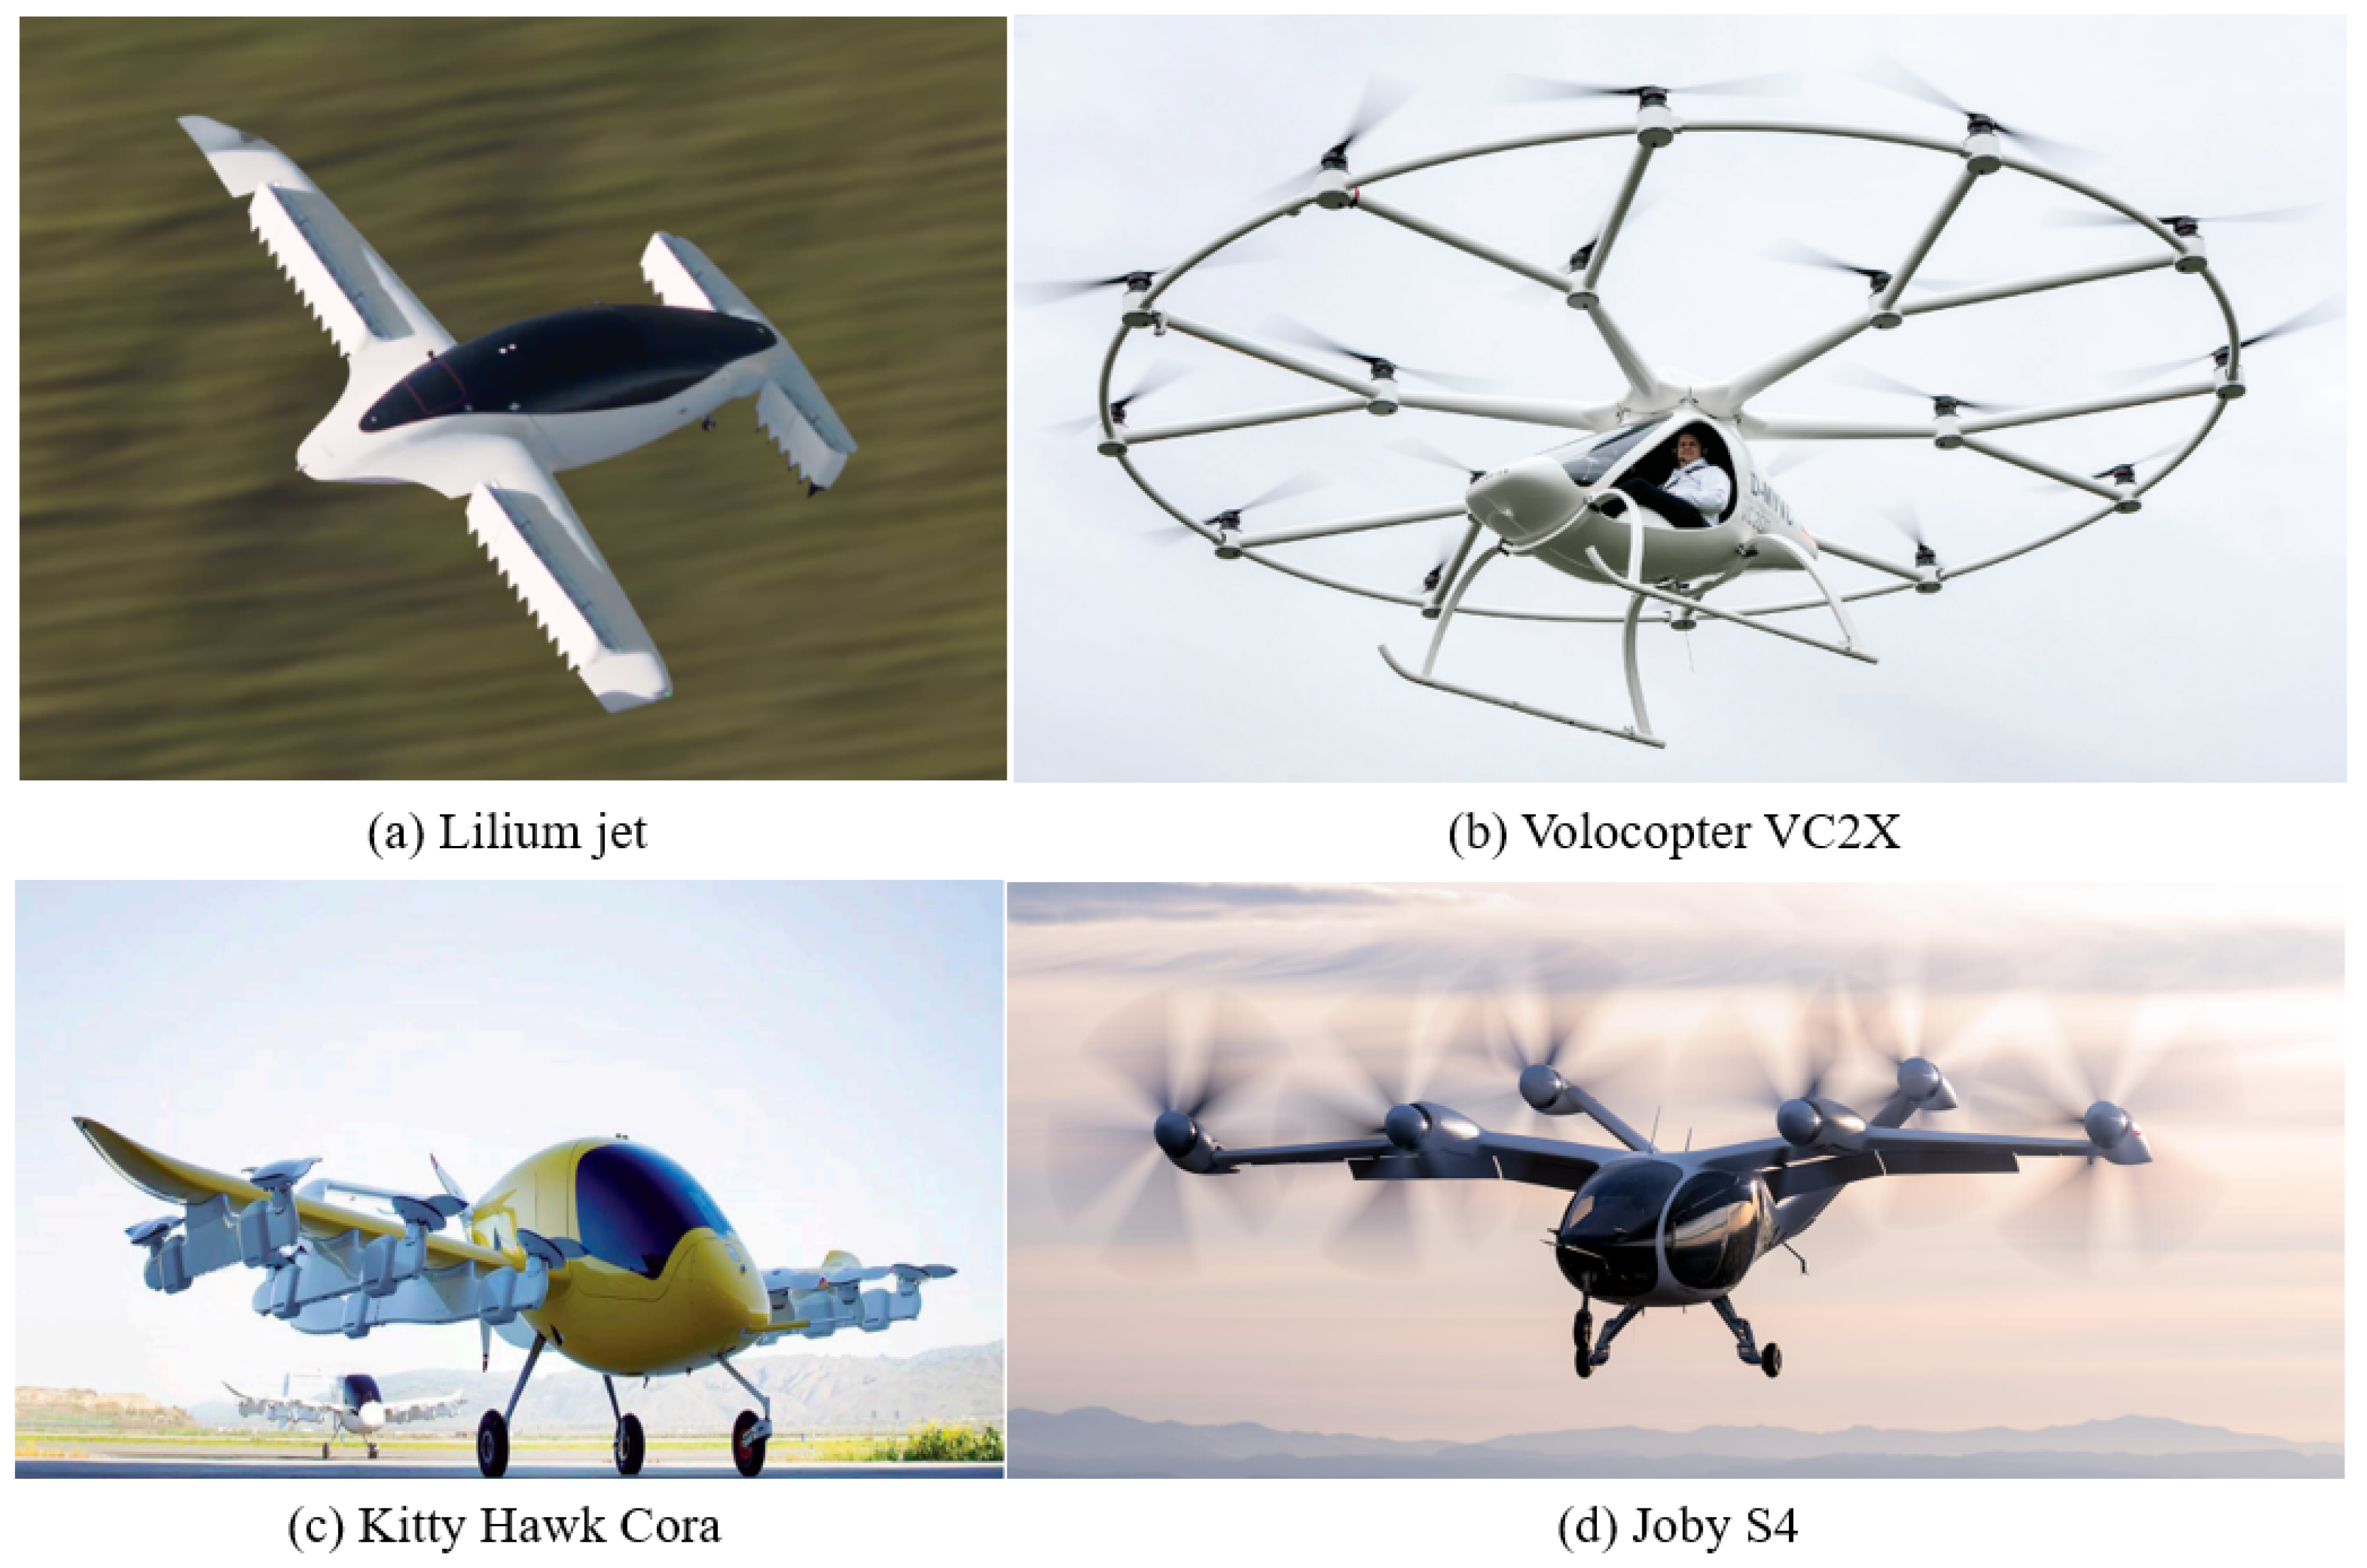
  • Vectored thrust: These are powered lift eVTOL aircraft that utilize all of their lift/thrust units for both vertical lift and cruise. This is achieved by rotating (vectoring) the resultant thrust points against the direction of motion. The thrust vectoring can be accomplished in several ways: by rotating the entire wing-propulsion assembly (tilt wing), by rotating the lift/thrust unit itself (tilt fan for ducted fans and tilt prop for propellers), or by rotating the entire aircraft frame pivoted about the fuselage (tilt body or tilt frame). An example of this configuration is the Lilium jet, shown in Figure 2a, which utilizes ducted and vectored thrust. The implementation of ducted fans in the form of distributed electric propulsion (DEP) is employed [4].
  • Wingless: This configuration is relatively simple and can be very efficient during vertical take-off, landing, and hovering, due to low disc-loading. However, without wings, multicopters lack cruise efficiency, which limits their application to urban air mobility (UAM) markets only. An example of this category is given in Figure 2b, named Volocopter VC2X [5]. The latter runs on nine independent batteries, powering 18 electric motor-driven variable-speed/fixed-pitch propellers. The redundancy ensures stability in the event of component failures.
  • Lift plus cruise: These aircraft combine the capabilities of a multicopter for vertical take-off and landing with those of a standard aircraft for the cruise flight. This integration enables the aircraft to achieve both efficient vertical take-off and landing as well as efficient cruise performance. To optimize the range of these concepts, the propellers required for VTOL are designed with fewer blades and shorter chords to minimize drag during the cruise flight. However, the small size of the propellers used for VTOL operations presents a notable challenge in terms of noise emissions, mainly due to increased blade tip speeds. Figure 2c provides an example of this configuration, named Kitty Hawk Cora [11].
  • Tilt rotor: This configuration involves either the wing and propellers or the propellers alone (tilting). This enables the propeller axis to rotate by 90 degrees as the aircraft transitions from hover to forward flight. This architecture generally allows for the design of a more optimized propeller compared to a lift and cruise aircraft configuration. However, it comes with the trade-off of higher technical complexity and larger overall size and weight due to the inclusion of tilt and variable pitch mechanisms. Joby S4 is an example of this category; it is developed by Joby Aviation (Figure 2d) and is supposed to be commercialized by 2024 [12,13].
As reported in [10], one of the main drawbacks of the multirotor configurations is the lack of wings, which limits their performances in long cruise flight missions. However, in the UAM mode, where the cruise phase durations are limited in comparison with extra-urban mobility, the multirotor configuration remains the best efficient solution to this transport market [10]. In this context, the Volocopter VC2X configuration, which is a non-coaxial, direct-lift one, presented in Figure 2b, will be tested in Paris, France, in 2024 [14]. Thus, the rest of the paper will focus on the multirotor wingless configuration.
One of the main steps in the eVTOL design process is to size and select the components of the propulsion system to meet the required specifications. To facilitate the assessment of proposed solutions, the development of precise and efficient sizing methodologies for the electric propulsion chain is necessary. The propulsion chain typically consists of a propeller for generating lift, a BLDC electric motor for energy conversion, an electronic speed controller (ESC) that supplies the required current to the load from the energy source, and a battery for energy storage. Multirotor design methods have been developed by Barshefsky et al. [15], Dai et al. [16], et Gur et al. [17]. In [15], the authors present a methodology that involves parameterizing the components of the propulsion chain to establish relationships between them. These relationships are then optimized to meet the specific requirements of the flight mission. In reference [16], an analytical method is proposed to estimate the optimal parameters of the propulsion system components. The approach involves modeling each component mathematically and then simplifying and decoupling the problem into smaller subproblems. By solving these subproblems, the optimal parameters for each component can be obtained. Moreover, selection algorithms are proposed based on these obtained parameters to determine the optimal combination of the propeller, motor, ESC, and battery products from their respective databases. Methodologies based on statistical data available from manufacturers for preliminary design are reported in references in [17,18,19]. For example, reference [17] presents a multi-disciplinary optimization (MDO) approach for designing a propulsion system based on goals such as rate of climb and loiter time. It also provides a useful modeling analysis of motors and batteries. Moreover, a sensitivity analysis is conducted on certain propeller design elements.
In this study, on the one hand, a methodology for sizing and selecting the propulsion chain components was developed. This approach combines statistical methods based on data and analytical optimization techniques, allowing to maintain an acceptable level of precision and avoid increasing the calculation algorithm complexity. The technique of optimization is used for the optimal selection of the pair motor/propeller, based on the maximization of the specific efficiency. This optimization makes it possible to select the remaining components, namely the ESC and the energy storage system. The statistical methods are considered for the multirotor aerial vehicle G T O W evaluation, using the regression model for each component, based on supplier data. On the other hand, five energy storage configurations are considered, in order to evaluate their effect on the multirotor aerial vehicle performance, in particular on the flight time. These configurations are the lithium polymer battery (battery), hydrogen fuel cell (HFC), battery/hydrogen fuel cell (Bat/HFC), battery/supercapacitor (Bat/SC), and battery/supercapacitor/hydrogen fuel cell (Bat/SC/HFC). The five energy sources were sized to maximize the flight time and keep the gross take-off weight ( G T O W ) as low as possible.
This article is organized as follows. Section 2 presents the sizing methodology flowchart, including the optimization technique used to select the optimal motor/propeller pair and the remaining components of the propulsion chain. Section 3 presents the modeling of the propulsion chain components to formulate the optimization problem and maximize the efficiency of the motor/propeller pair. Section 4 is devoted to the formulation of the motor/propeller pair optimization problem. Section 5 presents the case study for the sizing approach validation, using a reduced-scale multirotor drone with a G T O W of 15 kg available in our laboratory. Section 6 presents the comparative study of the energy source configuration effect on the flight time, including the G T O W evaluation based on the regression model of each component. In Section 7, the conclusion is presented.

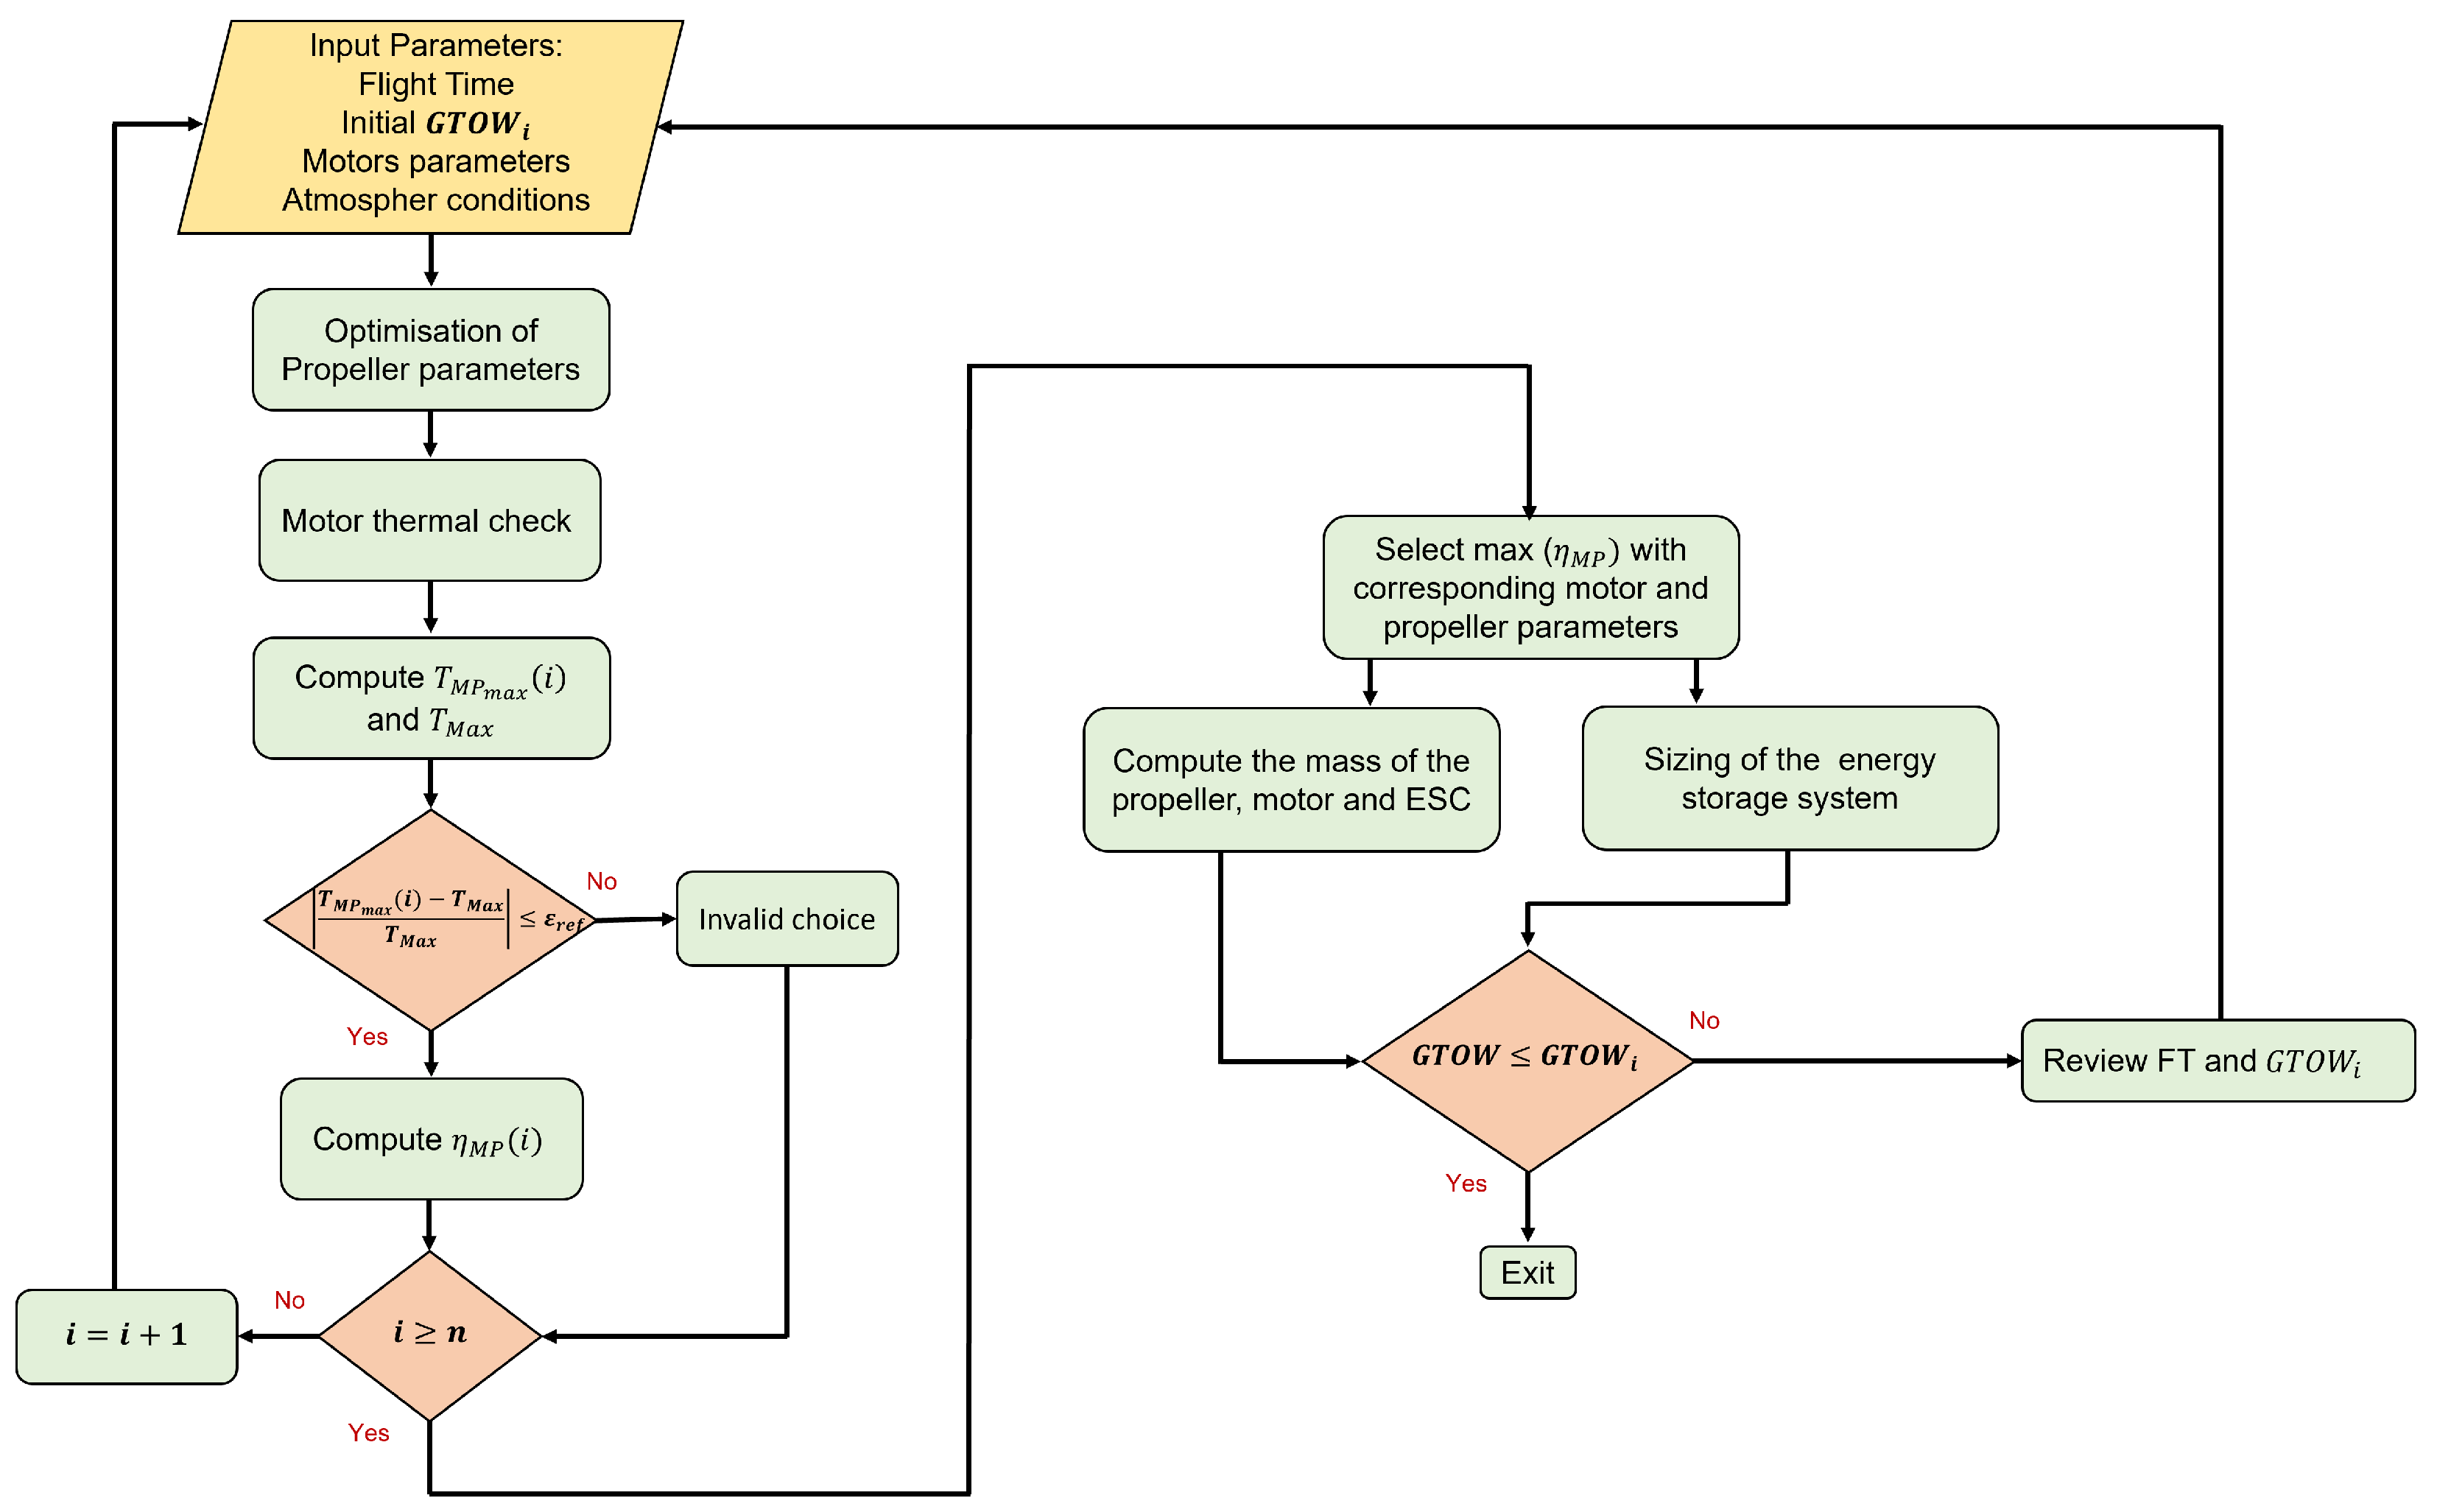
2. Sizing Methodology

The sizing methodology is based on a combination of analytical optimization techniques and data-based techniques. It takes the following input data: the required flight time, a database of electric motor parameters, including the voltage ( U m ), load current ( I m ), internal resistance ( R m ), and speed constant ( K v ) for n examples (at this stage, the optimal motor is not known), atmospheric conditions defining the altitude, temperature, and air density, and the initial gross take-off weight ( G T O W ). Subsequently, a global non-linear optimization is performed for each motor/propeller pair using the simulated annealing algorithm (SAA). The objective of this optimization is to maximize the pair motor/propeller efficiency, also known as specific efficiency η M P ( N / W ) . This efficiency index is widely used by industrial manufacturers, such as T-motor and Mejzlik [20,21] to measure the efficiency between the motor and the propeller. Constraints are applied to the propeller geometry, specifically the diameter ( D p ) and the pitch angle φ p . The optimized motor/propeller pair obtained from the optimization allows for checking the condition to avoid motor overheating, as stated in Equation (32). Subsequently, the maximum thrust T M P m a x generated by the optimized motor/propeller pair was computed using Equation (34). By utilizing the maximum thrust T m a x imposed by G T O W as indicated in Equation (35), a filtering condition was established based on the relative error between T M P m a x and T m a x , as shown in Equation (36). This filtering condition allows for an initial selection of the motor/propeller pairs. Subsequently, the selection of the optimal motor/propeller pair was determined based on the maximum specific efficiency achieved. The sizing of the energy sources was then performed to maximize the flight time. Finally, the last step of this sizing methodology involved verifying whether the total take-off mass, obtained using statistical mass models for each component of the propulsion chain based on supplier data, was within acceptable limits. A detailed flowchart of this sizing methodology is provided in Figure 3. The specific efficiency maximization allows making a rapid and precise choice for each component in the propulsion chain. Figure 4 presents an overview of the different steps, based on which, the electric propulsion chain sizing is performed. The fact that the validation step was based on a reduced-scale multirotor drone with a G T O W of 15 kg explains the choice of the data scale used for the optimization of input data motors and regression models.
It is remarkable that in the developed sizing methodology, we do not consider a flight power mission in order to size the propulsion chain. However, in order to obtain a pair motor/propeller that can satisfy the take-off and cruise segment mission, the sizing methodology takes into consideration two constraints. The first one is related to the speed of rotation and the torque of the propeller reported in Equation (32). Through this constraint, the obtained motor/propeller pair is able to satisfy the cruise phase while avoiding motor overheating. The second constraint is the filter condition given in Equation (37). Through this constraint, the motor/propeller pair is able to succeed in the take-off phase.

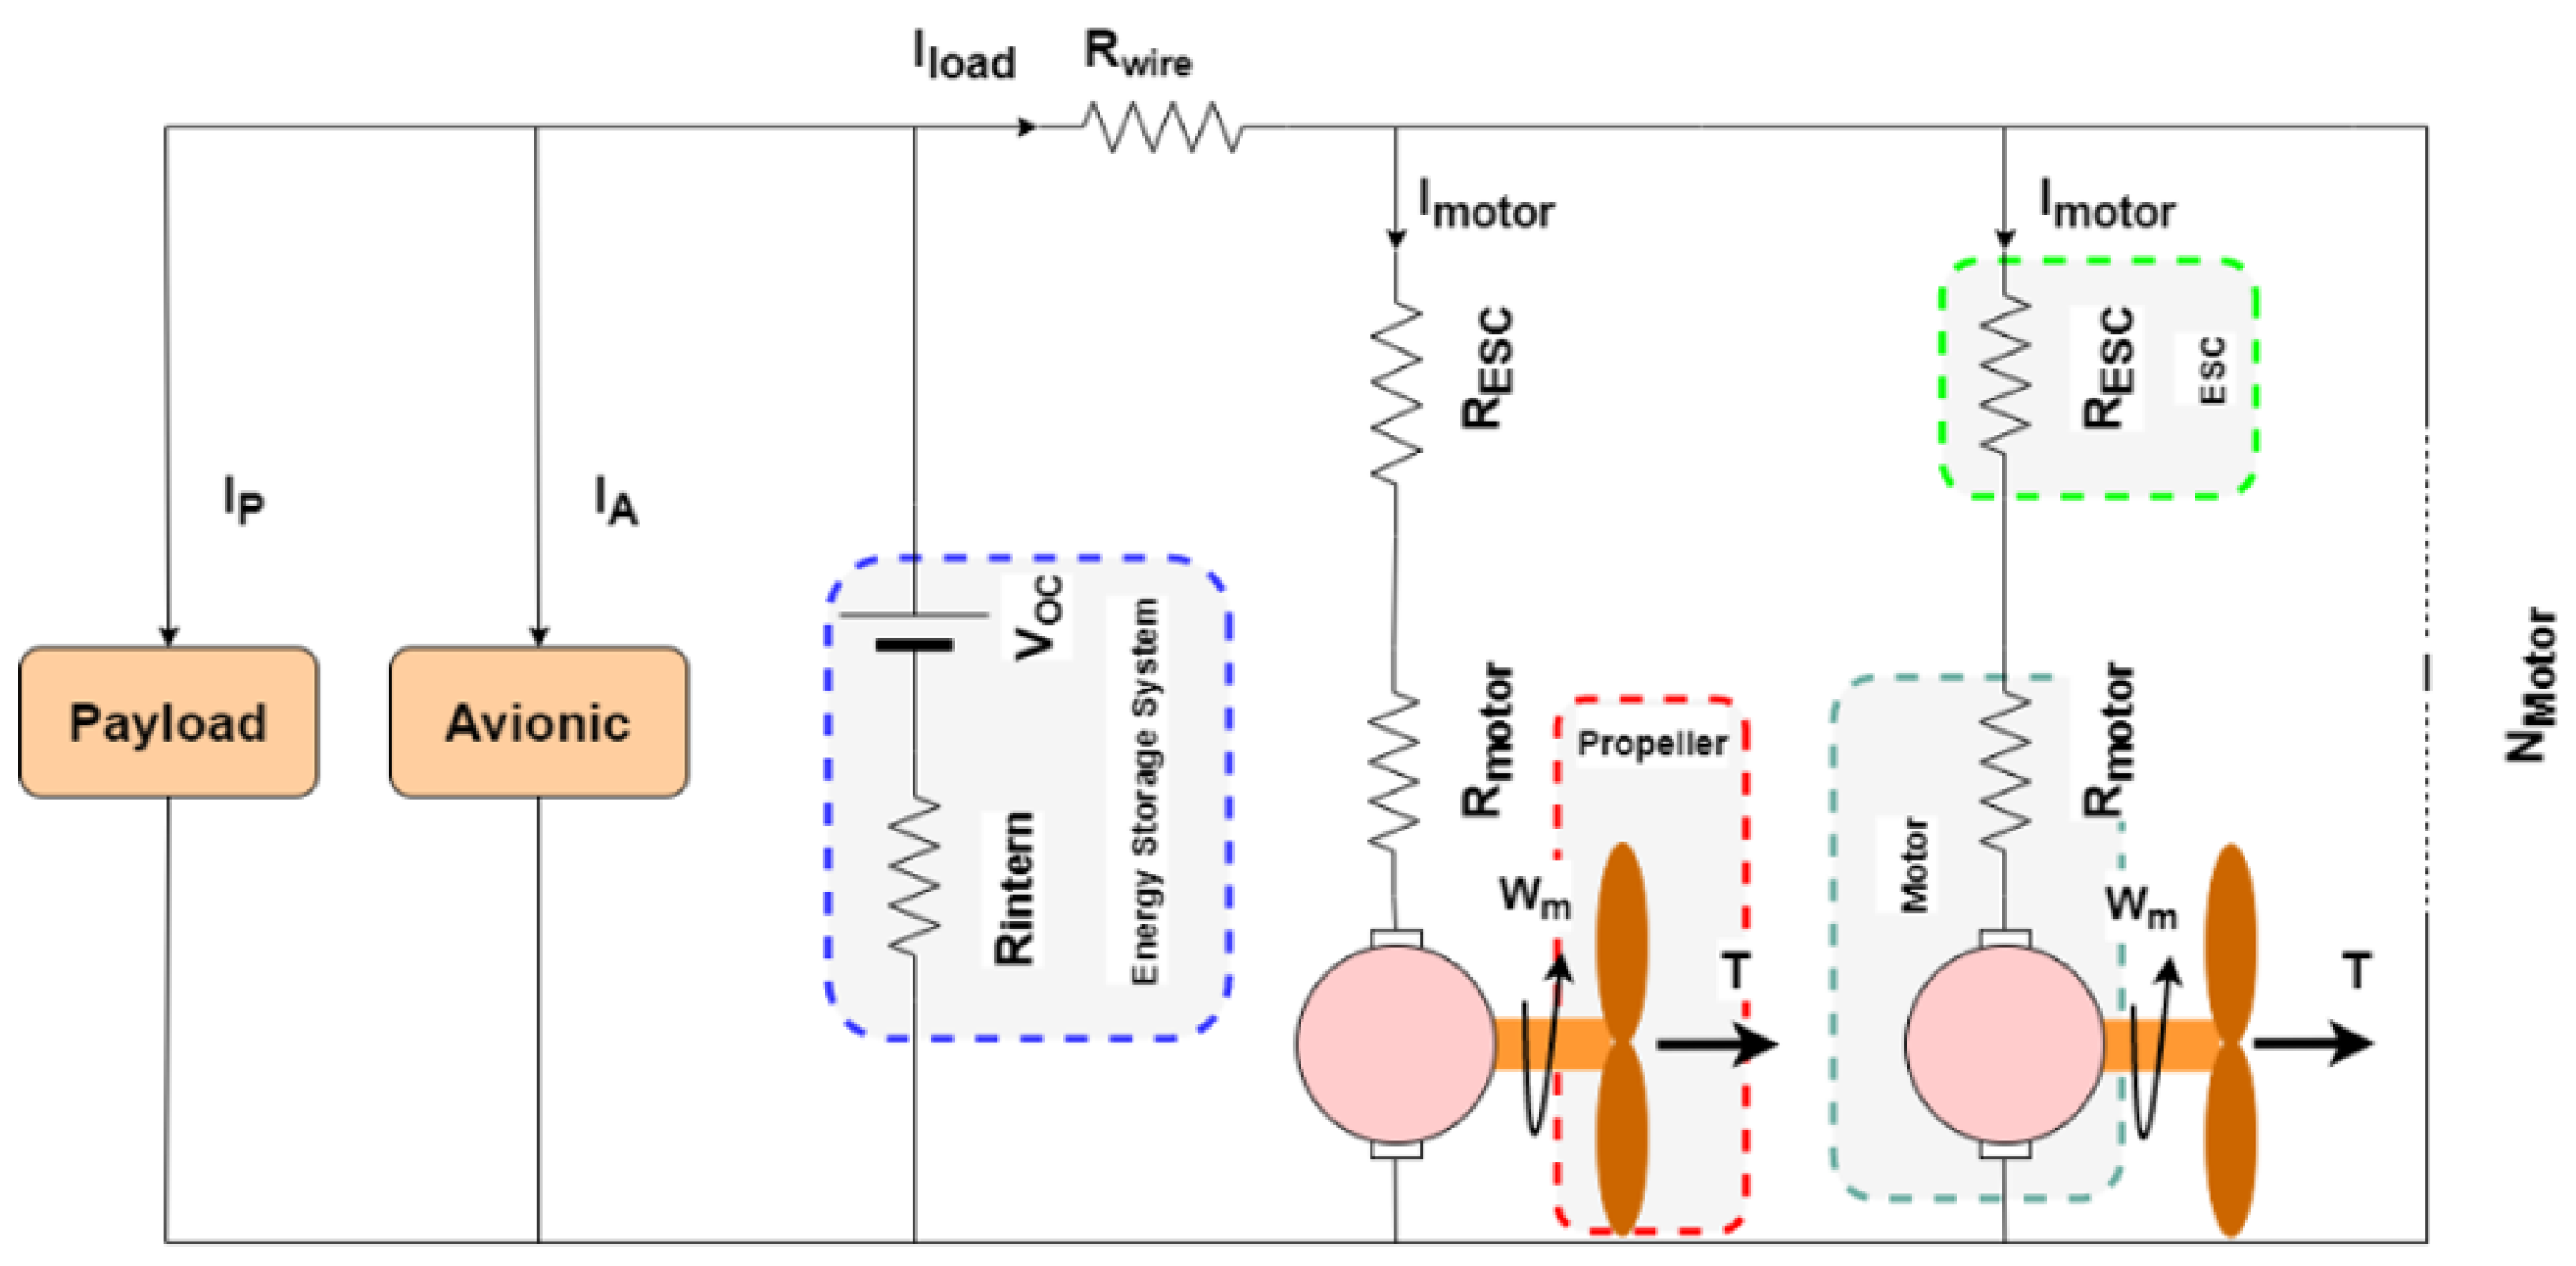
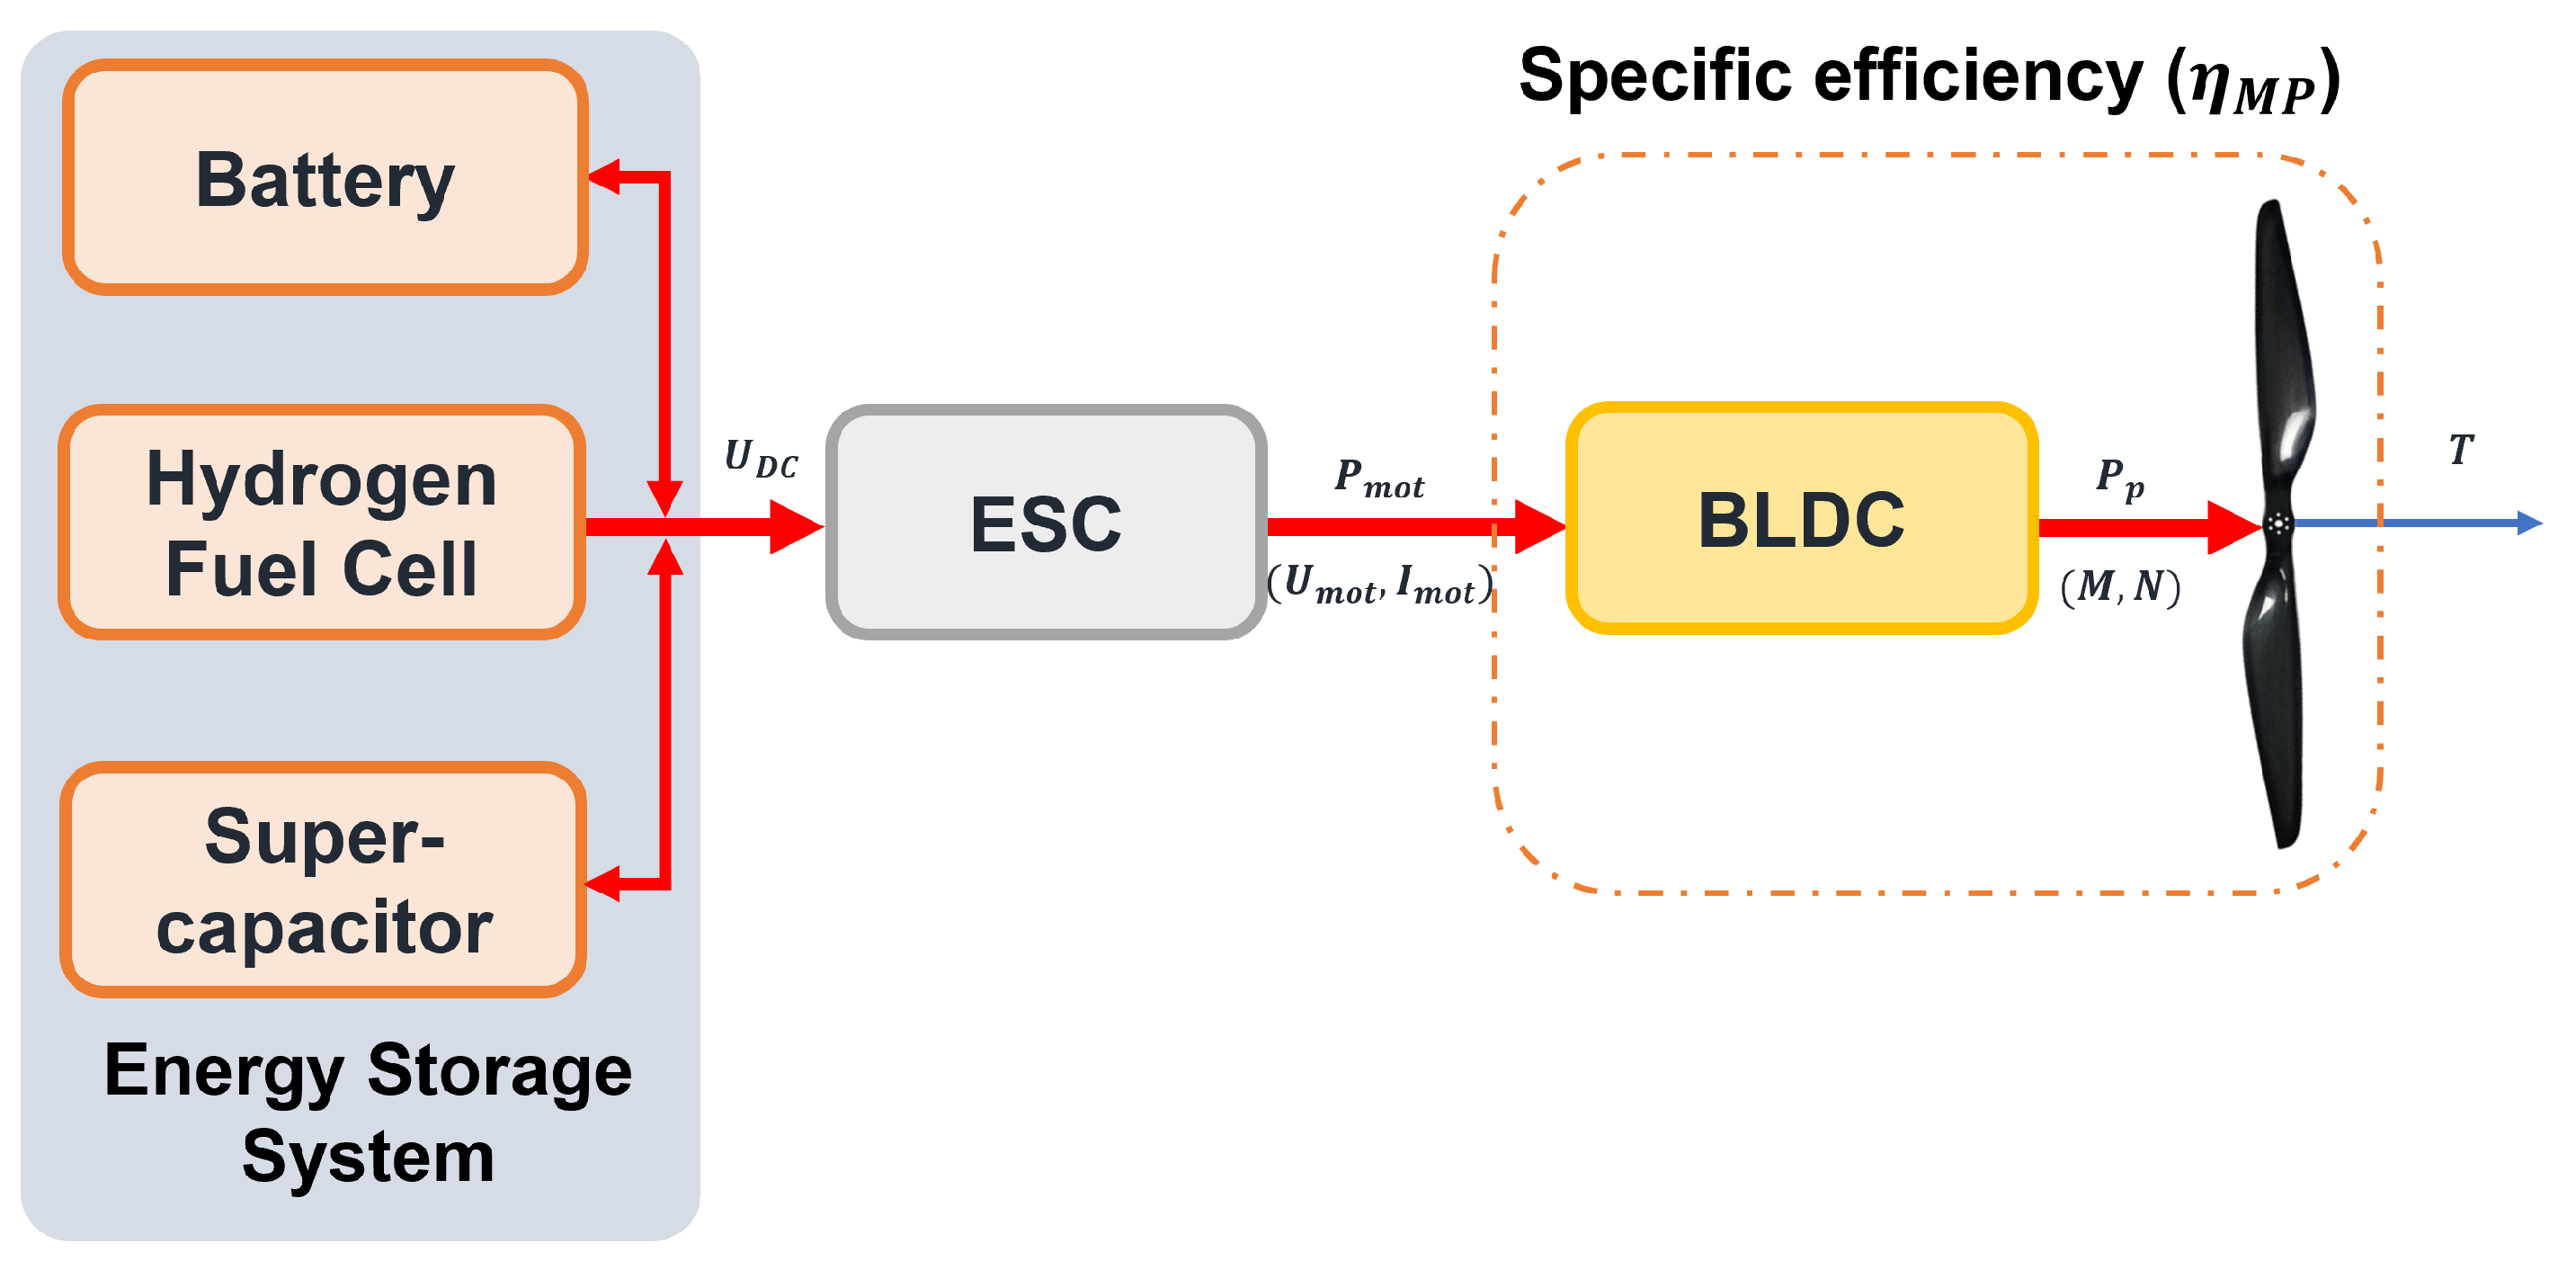
3. Propulsion Chain Modeling

The physical model of the propulsion chain, of an eVTOL multirotor aerial vehicle (with n arms) is presented in Figure 5. Each propulsion chain is composed of a propeller, a motor with its equivalent internal resistance, an ESC represented as a simple resistor, and an energy storage system modeled as an open circuit voltage with a series resistor. In this configuration (Figure 5), the energy storage system supplies the n propulsion chains. The modeling process will aim to establish a relationship between the propulsion chain components, especially between the propeller and the motor, in order to formulate the optimization problem. In this case, each component will be modeled in a steady state.

3.1. Propeller

The propeller includes many parameters to consider, such as the material of the propeller, the diameter, the shape of the blades, the pitch, and the number of blades. Currently, a variety of materials are used for propeller manufacturing, including carbon fiber (CF), nylon, plastic, and wood. The material of the propeller greatly influences its aerodynamic performance. As the rotor blades spin, the angle of attack at each spanwise region can change with reference to the original blade design [22]. Carbon fiber propellers are known for their stiffness and for being lightweight, but their downside is their high cost. Increasing the pitch and the number of blades results in higher thrust production, but it leads to a decrease in propeller efficiency, necessitating increased electrical and mechanical power. Increasing the diameter will increase the efficiency, but the ability to handle the load of the motor must also increase. When the blades are larger, with other parameters constant, they will rotate at lower velocities to produce the same lift. At this point, the induced velocity will decrease. Thereby, the efficiency of the system will increase [22]. The propeller model is described by its thrust T ( N ) and its torque M ( N m ) as given by
T = C T · ρ · N 60 2 · D p 4 M = C M · ρ · N 60 2 · D p 5 ,
where ρ (kg/m3), C T , C M , N (rpm), and D p (m) are respectively, the air density, the thrust coefficient, the torque coefficient, the propeller velocity, and the propeller diameter. The air density, ρ , is determined by both the local temperature T t (unit: °C) and the air pressure p, which is further determined by altitude h h o v e r (m). According to the international standard atmosphere model [23], we have the following expressions:
ρ = 273 · p p 0 ( 273 + T t ) · ρ 0 p = p 0 · 1 0.0065 · h 273 + T T 5.2561 ,
where ρ 0 is the standard air density, ρ 0 = 1.293 (kg/m3), at a temperature of 25 °C. The thrust and the torque coefficients are modeled using the blade element theory as presented in [22]:
C T = 0.27 π 3 λ ζ 2 K 0 ϵ π A + K 0 B p α t φ p C M = 1 4 A π 2 λ ζ 2 B p C f d + π A K 0 2 ϵ 2 e ( π A + K 0 ) 2 φ p 2 ,
where B p and φ p ( r a d ) are, respectively, the propeller blade number and the pitch angle. They are defined using:
φ p = arctan H p π D p ,
A, ϵ , λ , ζ ,e, C f d ,et K 0 are the blade parameters, which are directly related to the propeller blade airfoil shape. Their approximate values are presented in Table A1 in the Appendix A. Since the blade airfoil shapes are similar for certain series of propellers, especially those supplied by T-motor, the blade parameters are typically fixed. Figure 7a presents the regression model of the propeller’s mass M p r o p (g), which is based on data supplied by T-motor [20] and Mejzlik [21]. The input of this model is the propeller diameter D p optimized through the optimization methodology. Equation (5) presents the regression model of the propeller mass:
M p r o p = 0.303 · D p 2 9.729 · D p + 105.786 .

3.2. Electric Motor

Electric motors used in eVTOL applications are primarily of two types: brushed DC motors (BDC) and brushless DC motors (BLDC). BLDC motors, known for their low resistance and high efficiency, are commonly used in heavyweight multicopters. They can be further categorized into two types: outrunner (OR) and inrunner (IR), based on the rotating part of the motor. Presently, OR BLDC motors are considered a preferable choice over IR motors. OR motors have lower Kv (rpm/V) values compared to other types of BLDC motors. This means they operate at lower rotational speeds but generate higher torque, which allows for direct propeller coupling (no gearbox) [24]. K v (rpm/V) is the speed constant, which will determine the rotation speed of the electric motor when no-load and stable voltage is supplied. This is an important element for choosing a motor that is compatible with the power supply and propellers to achieve the required speed. In Figure 6, U m (V) is the supply voltage, I m (A) is the current absorbed by the motor coils, R m ( Ω ) is the motor equivalent resistance, T e (Nm) is the electromotive torque produced by the motor, and N (rpm) is the shaft angular velocity. The equations describing the motor electric model are [19,24]:
U m = e a + R m · I m , T e = K T · I m , E a = K E · N N K v ,
where K E (Vs/rad) represents the motor back EMF constant, K T (Nm/A) is the motor torque constant, and N is the motor rpm. K T and K E are related to K v by
K E = 1 K v = π 30 · K T .
The motor output torque and the propeller torque are related by
M = T e T 0 = K T · ( I m I m 0 ) .
If the no-load current I m 0 is neglected, the propeller torque in this case is controlled uniquely by the motor load current. From Equations (1) to (4), the supply voltage U m and the motor current I m are given as follows:
I m = π 30 · K v · M + I m 0 , U m = I m · R m + N K v .
The mass regression model of the electric motor is given in Figure 7b. The motor data used in this model were collected from T-motor and KDEDirect [25]. The model input is the motor speed constant K v , which is defined in the motor parameters database Equation (10) presents the regression model of the motor mass:
M m o t = 0.00048 K v 2 1.461 K v + 840.617 .

3.3. Electronic Speed Controller

The electronic speed controller (ESC) is an external device responsible for regulating the motor speed within a specific range based on the load and battery voltage. It converts the DC voltage from the battery pack into a three-phase alternating signal that is synchronized with the rotation of the rotor and applied to the armature windings. In the developed sizing methodology, the electric model of the ESC is not directly involved. However, it is essential to fix the maximum continuous current I e m a x of the ESC, particularly during the selection and mass estimation steps [24,26]. Figure 7c presents the mass regression model of the ESC base on supplier data (collected from T-motor and KDEDirect). Equation (11) presents the regression model of the ESC mass:
M E S C = 0.016 I e m a x 2 0.638 I e m a x + 42.414 .

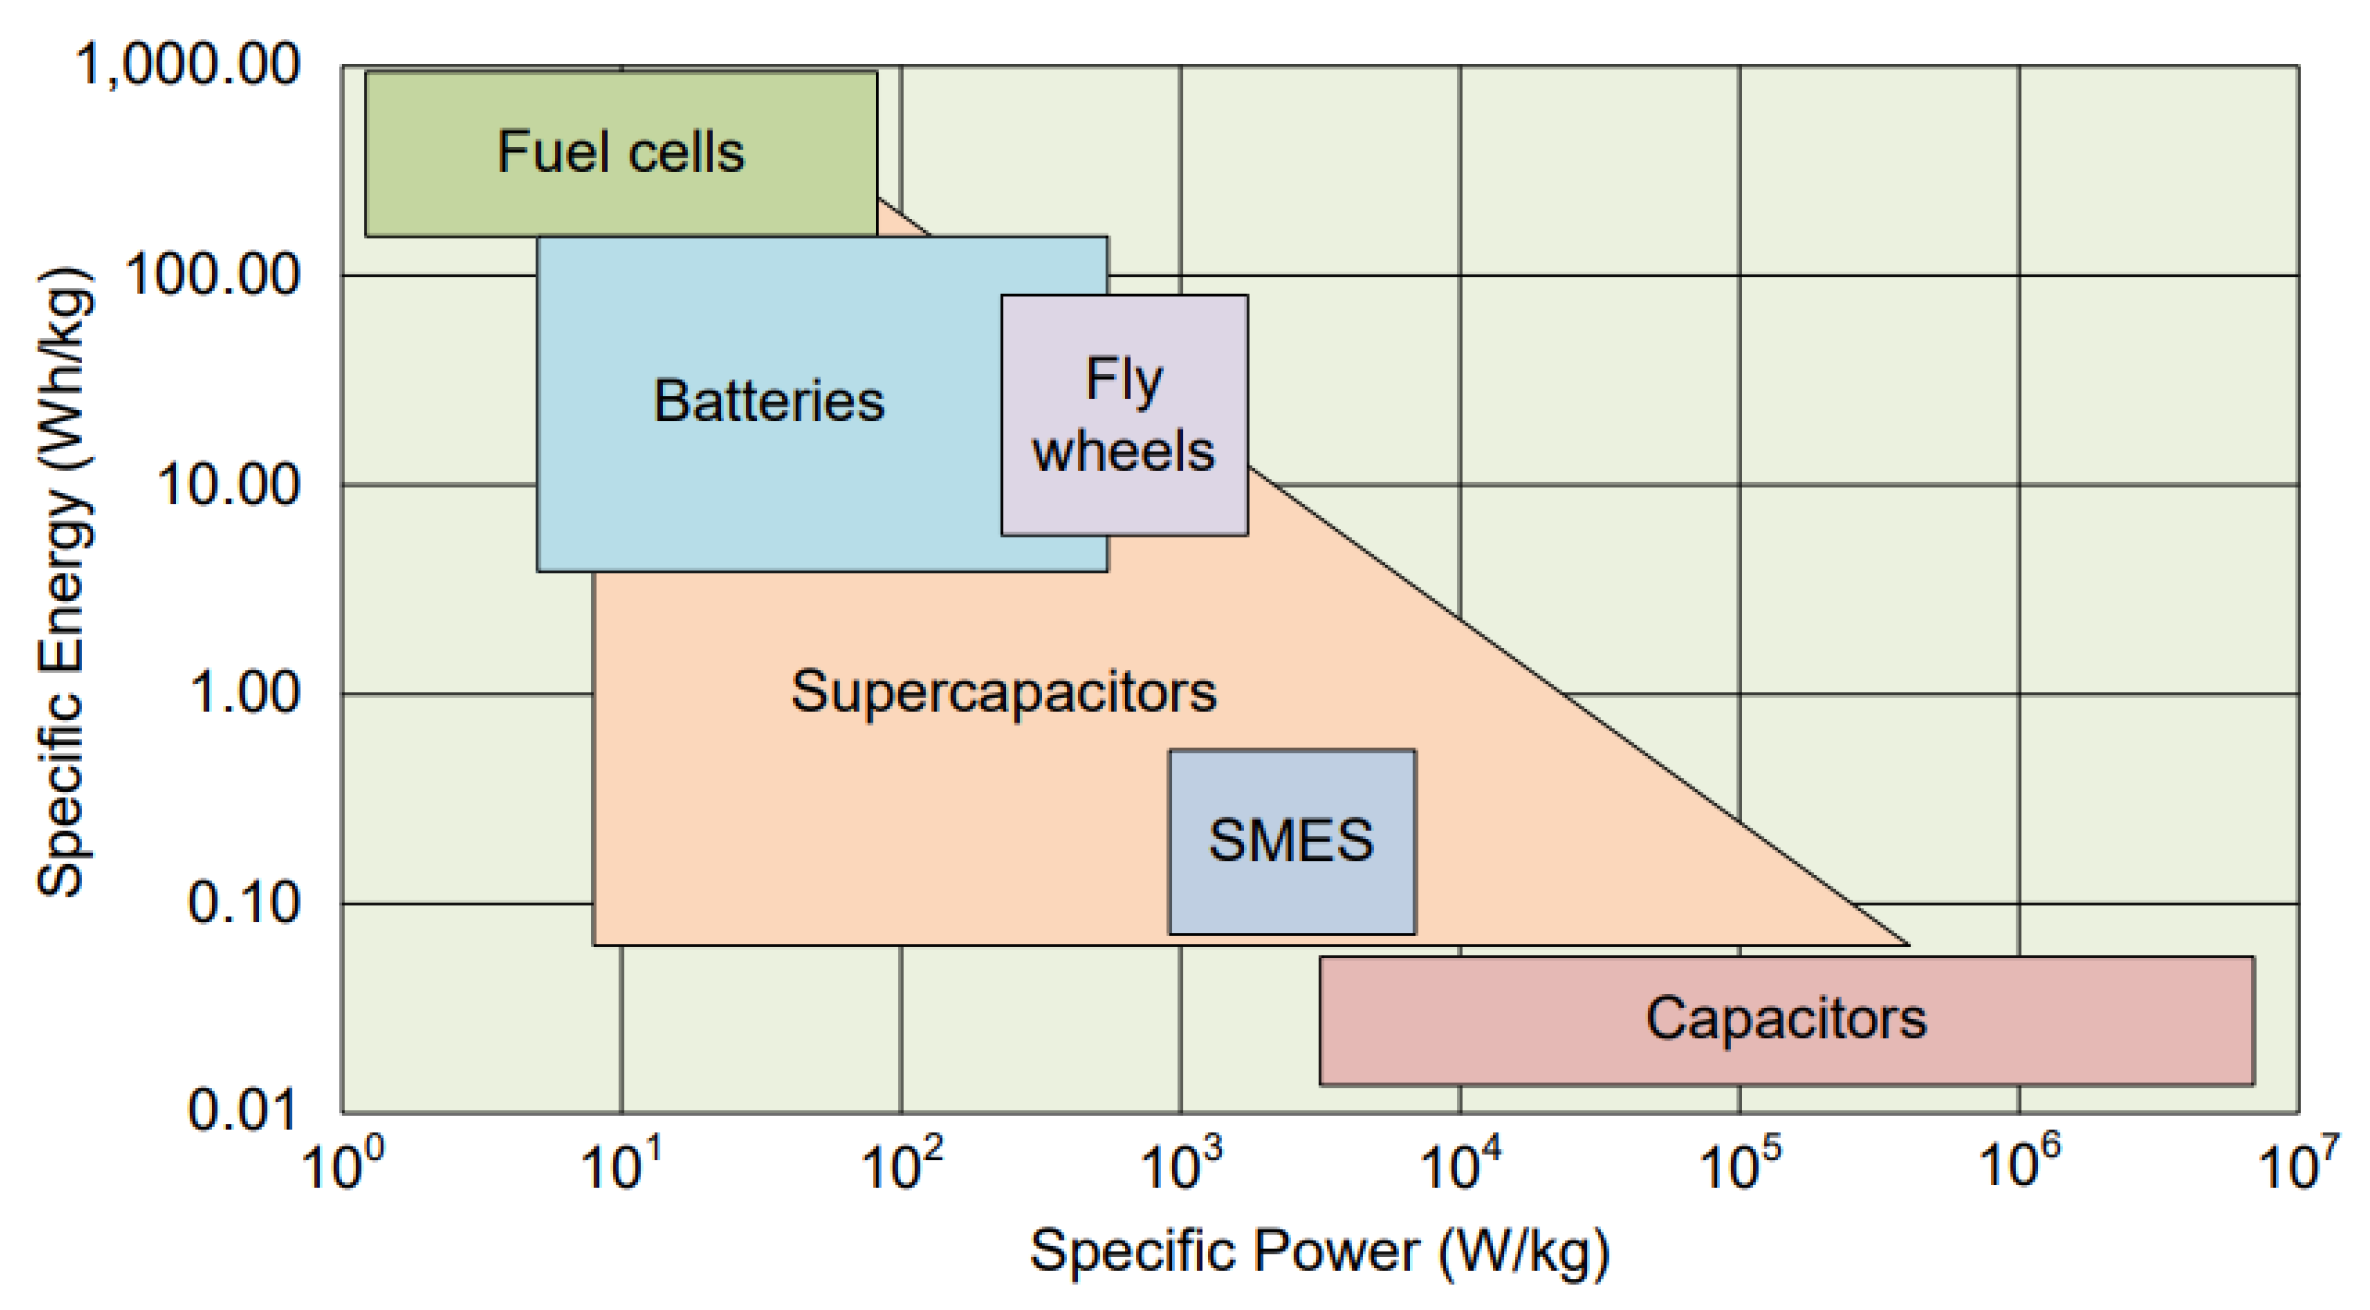
3.4. Energy Storage System

In this part, three energy storage systems are considered, namely a lithium polymer (LiPo) battery, a proton membrane exchange hydrogen fuel cell (PME), and a supercapacitor.

3.4.1. Battery

Due to the high energy density and discharge rate, eVTOL aerial vehicles use lithium polymer (LiPo) batteries. A LiPo pack consists of identical LiPo cells, each with a nominal voltage of 3.7 V and power density of ρ b = 140 (Wh/kg) [24,27]. The parallel connection of battery packs raises the battery’s total capacity while keeping the nominal total voltage the same. The nominal voltage of a LiPo battery is:
U b = 3.7 n c ,
where n c is the number of cells connected in series in the battery pack. Each cell has a capacity C c s . The total battery capacity is
C b = n p · C c s ,
where n p is the number of battery packs connected in parallel. As we can see from Figure 5, the motor power P m is converted by the ESC and supplied by the battery. The battery output power P b can be estimated by
P b = N m · P m η e · η b ,
where N m , η e , and η b are, respectively, the propulsion chain number, the conversion efficiency of ESC, and the battery efficiency. An oversizing of the battery is taken into account the drop in battery capacity with the discharge time, utilizing the battery efficiency. A value of η b = 0.75 is considered suitable for battery sizing, as reported in [24].
The flight time t f l i g h t (min) of the eVTOL aerial vehicle, which is equivalent to the battery discharge time, is given by
t f l i g h t = 60 · ρ b · m b N m · P m · η e · η b ,
where ρ b and m b are, respectively, the battery power density (Wh/kg) and the battery mass (kg). Thus, for a given embedded LiPo battery mass m b , and a load, an equivalent flight time is determined. Once the battery mass m b (kg) is located with an objective to maximize the flight time with the G T O W constraint, the battery capacity C b (mAh) is computed using the following equation:
C b = ρ b · m b U b .

3.4.2. Hydrogen Fuel Cell

Proton exchange membrane (PEM) fuel cells offer a higher energy density than batteries, around 500 Wh/kg [28,29], in a unit that is still clean and hydrocarbon-free, mechanically simple, operates near ambient temperature, and produces no harmful emissions. In terms of fuel cell power density, there are several works estimating its improvement for a value of 800 W/kg [30]. The problems with hydrogen storage and the boil-off are also less significant in aviation compared to cars, and even lesser even for eVTOL aerial vehicles, because of the shorter duration missions, typically a few hours compared to weeks. Thus, the significant progress made in the past decade toward lighter gaseous hydrogen storage can be exploited to full advantage. A PEM pack consists of identical cells, each with a voltage E c e l l (V) given by [30,31]:
E c e l l = E 0 + R · T 2 F · ln ( P H 2 · P O 2 0.5 ) ,
where E 0 , R, T, F, P H 2 , and P O 2 are, respectively, the thermodynamic reversible voltage based on the higher heating value (HHV) of hydrogen ( 1.23 V), the universal gas constant (8.314 J/molK), the operating temperature, the Faraday constant (96,485 C/mol), the partial pressure of hydrogen (Pa), and the partial pressure of oxygen (Pa). The nominal voltage of the PEM hydrogen fuel cell stack V s t a c k (V) is given by
V s t a c k = N c e l l · E c e l l .
The fuel cell area is defined as:
A c e l l = P F C ( p c e l l · N c e l l ) ,
where P F C and p c e l l are, respectively, the required electrical power and the power density of a single cell. For the battery case, the fuel cell output power required for the flight mission P F C and the corresponding hydrogen consumption H C ( k g / h ) can be estimated by
P F C = N m · P m η e · η F C , H C = P F C L H V · η F C ,
where η F C and L H V are, respectively, the fuel cell stack efficiency and the low heating value of hydrogen (33.3 Wh/g). At the current technology level, the efficiency of the PEMFC is approximately 40∼50%, and if there is no information about the polarization curve of a single cell, this value can be used for sizing. Thus, the hydrogen fuel cell mass m F C is given by [30]:
m F C = N c e l l · k A · ρ c e l l · A c e l l 1 η o w · ( 1 + f B O P ) ,
where k A , ρ c e l l , f B O P , and η o w are, respectively, the ratio of the cross-sectional area to the electrode area of a single cell (fixed at a value of five), the area density of a single cell (fixed at 1.57 kg/m), the ratio of the BOP weight to the HFC weight (with a value that varies depending on the HFC configuration; in this paper, a value of 0.2 is considered), and the overhead fraction to account for gaskets, seals, connectors, and endplates (fixed at 0.3). The flight time in the case of a fuel cell is given by the following expression:
t f l i g h t = 60 · L H V P F C .
For the hydrogen tank, a type 4 tank was selected among the gaseous hydrogen tanks. Liquid hydrogen is 800 times less in volume and has a higher energy density than gaseous hydrogen, but it must be kept at a low temperature, which limits its use in HFC UAVs [31,32]. A regression model that estimates the hydrogen tank mass M t a n k (kg), based on the amount of hydrogen m H 2 (g) required for the flight mission, is established as shown in Figure 7d. The data are based on the tank type, e.g., such as types 3 or 4 [33], and this model can be expressed as:
M t a n k = 0.000047 m H 2 2 + 0.0367 m H 2 0.126 .

3.4.3. Supercapacitor

Supercapacitors can produce much higher specific powers (multiple kW/kg) but have lower specific energy capacities (currently only a few Wh/kg) than batteries and HFC. That is, SCs cannot be used alone or in combination with an HFC. For this component, unlike the batteries, the power limitations are less constraining, since the limitations are much higher than what the load requires. The limitations are mainly related to energy. In addition, they indirectly protect the fuel cell, batteries, and DC bus. Indeed, they absorb the DC bus voltage fluctuations and can extend the battery’s lifetime [34,35]. Maxwell 350F/2.7V supercapacitor technology was considered in this paper [36]. The cell characteristics are presented in Table A2. The useful energy E S C available in a pack of N S S C elements in series and N P S C branches is calculated as follows:
E S C = 3 8 · N P S C N S S C · C c e l l · U S C 2 ,
where C c e l l and U S C are, respectively, the nominal capacity and the maximum voltage of a supercapacitor element. The flight time t f l i g h t (min) of the eVTOL aerial vehicle (supercapacitor discharging) is given by
t f l i g h t = 60 · ρ S C · m S C P S C ,
where ρ S C , m S C , and P S C are, respectively, the energy density, and the mass and the power of a supercapacitor element. The mass of this component is directly estimated using data from Table A2.

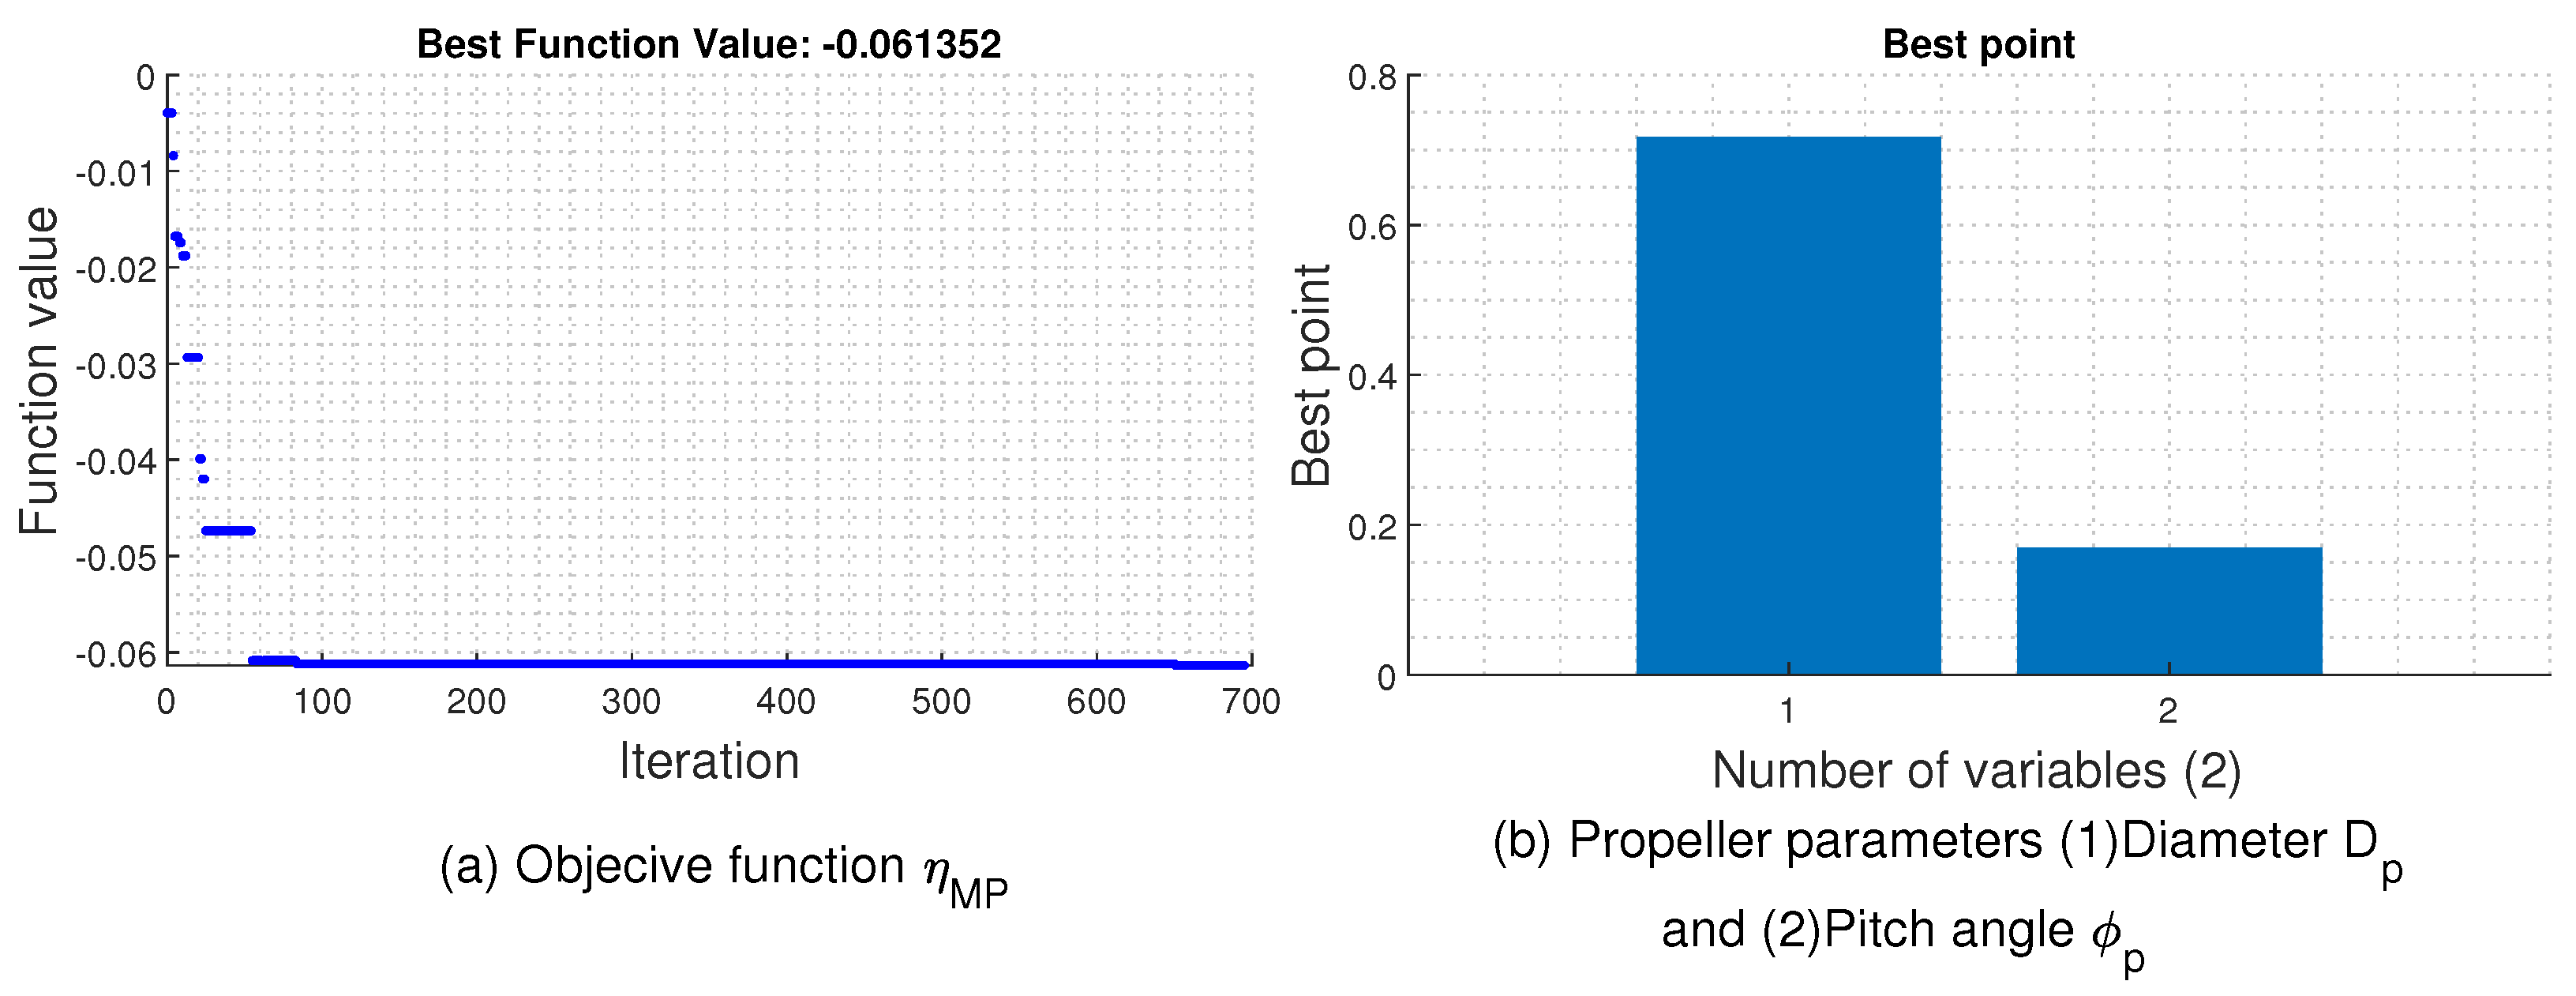
4. Motor/Propeller Optimization Problem

The optimization technique is based on the simulated annealing algorithm S A A , which was introduced by inspiring the annealing procedure of the metalworking. In a general manner, the SA algorithm adopts an iterative movement according to the variable temperature parameter, which imitates the annealing transaction of the metals [37]. This algorithm is directly explored using the MATLAB global optimization toolbox. The efficiency of the pair motor/propeller η M P is used as an objective function in this case. It is given by
η M P = T f l i g h t P m f l i g h t ,
where T f l i g h t and P m f l i g h t are, respectively, the propeller thrust and the motor power during the flight operation. The motor power is given by
P m f l i g h t = U m f l i g h t · I m f l i g h t ,
from the propeller model presented in Equation (1), the propeller velocity and the propeller torque during the flight are given by
N f l i g h t = 60 D p 2 · T f l i g h t ρ · C T , M f l i g h t = C M · D p C T · T f l i g h t ,
and from the motor model presented in Equation (9), the motor current and the motor voltage are given by
I m 0 0 , I m f l i g h t = π · C M · D p 30 · C T · K E · T f l i g h t , U m f l i g h t = π · C M · D p 30 · C T · K E · R m · T f l i g h t + 60 · K E D p 2 · T f l i g h t ρ · C T .
Thus, the optimization objective function expression is given by
η M P = 1 π · C M · D p 30 · C T · K E 2 · T f l i g h t · R m + 2 π · C M D p · T f l i g h t ρ · C T 3 .
For a fixed thrust imposed by the G T O W , the motor/propeller efficiency evolution in terms of propeller parameters is given in Figure 8. Through this figure, it is noticeable that the motor/propeller efficiency presents a single attraction basin, enabling the rapid identification of the point that maximizes the objective function.
In order to avoid the motor overheating during the flight, which could influence the propulsion chain efficiency, the motor current and voltage must remain below their maximum values, U m M a x and I m M a x , imposed by the motor design:
U m U m M a x & I m I m M a x ,
which leads to establishing the following constraint on the propeller velocity and torque:
N m a x = U m M a x R m M a x · I m M a x K E , M m a x = 30 · ( I m M a x I m 0 ) · K E π ,
thus, the propeller diameter must remain below its maximum value D P m a x imposed by the motor overheating avoidance condition:
D p D P m a x = M m a x 4 · 60 N m a x 2 · 1 C M · ρ 1 5 .
Thus, the optimization problem of the motor/propeller is given as follows:
max ( η M P ) = min ( η M P ) , 0 < D p D p M a x E l e c , 0 < φ p π .

5. Case Study

5.1. Use Case Multirotor Drone

The validation of the proposed sizing approach is conducted using data from a reduced-scale multirotor drone with a GTOW of 15 kg. An overview of the drone, composed of eight propulsion chains with U7-V2 420 KV motors and P18 × 6.1 propellers, is presented in Figure 9. Each set of four propulsion chains is powered by an 6S1P LiPo battery. Detailed specifications of the drone can be found in Table A3 in the Appendix A. It is worth noting that the sizing methodology does not consider the coupling effect of the coaxial configuration. This effect is disregarded for the drone used in the validation step of the sizing methodology. According to [38], at the scale level of the validation drone, the coupling effect of the coaxial configuration on propulsion efficiency does not exceed 6%. This demonstrates the effectiveness of the proposed sizing methodology. To demonstrate the efficacy of the sizing methodology, a simulation of the propulsion chain sizing approach is carried out using MATLAB code. A database comprising parameters of 45 randomly selected electric motor examples, including the motor used in the drone shown in Figure 9, is created based on data provided by T-motor. Flight mission data specific to this drone is also incorporated.

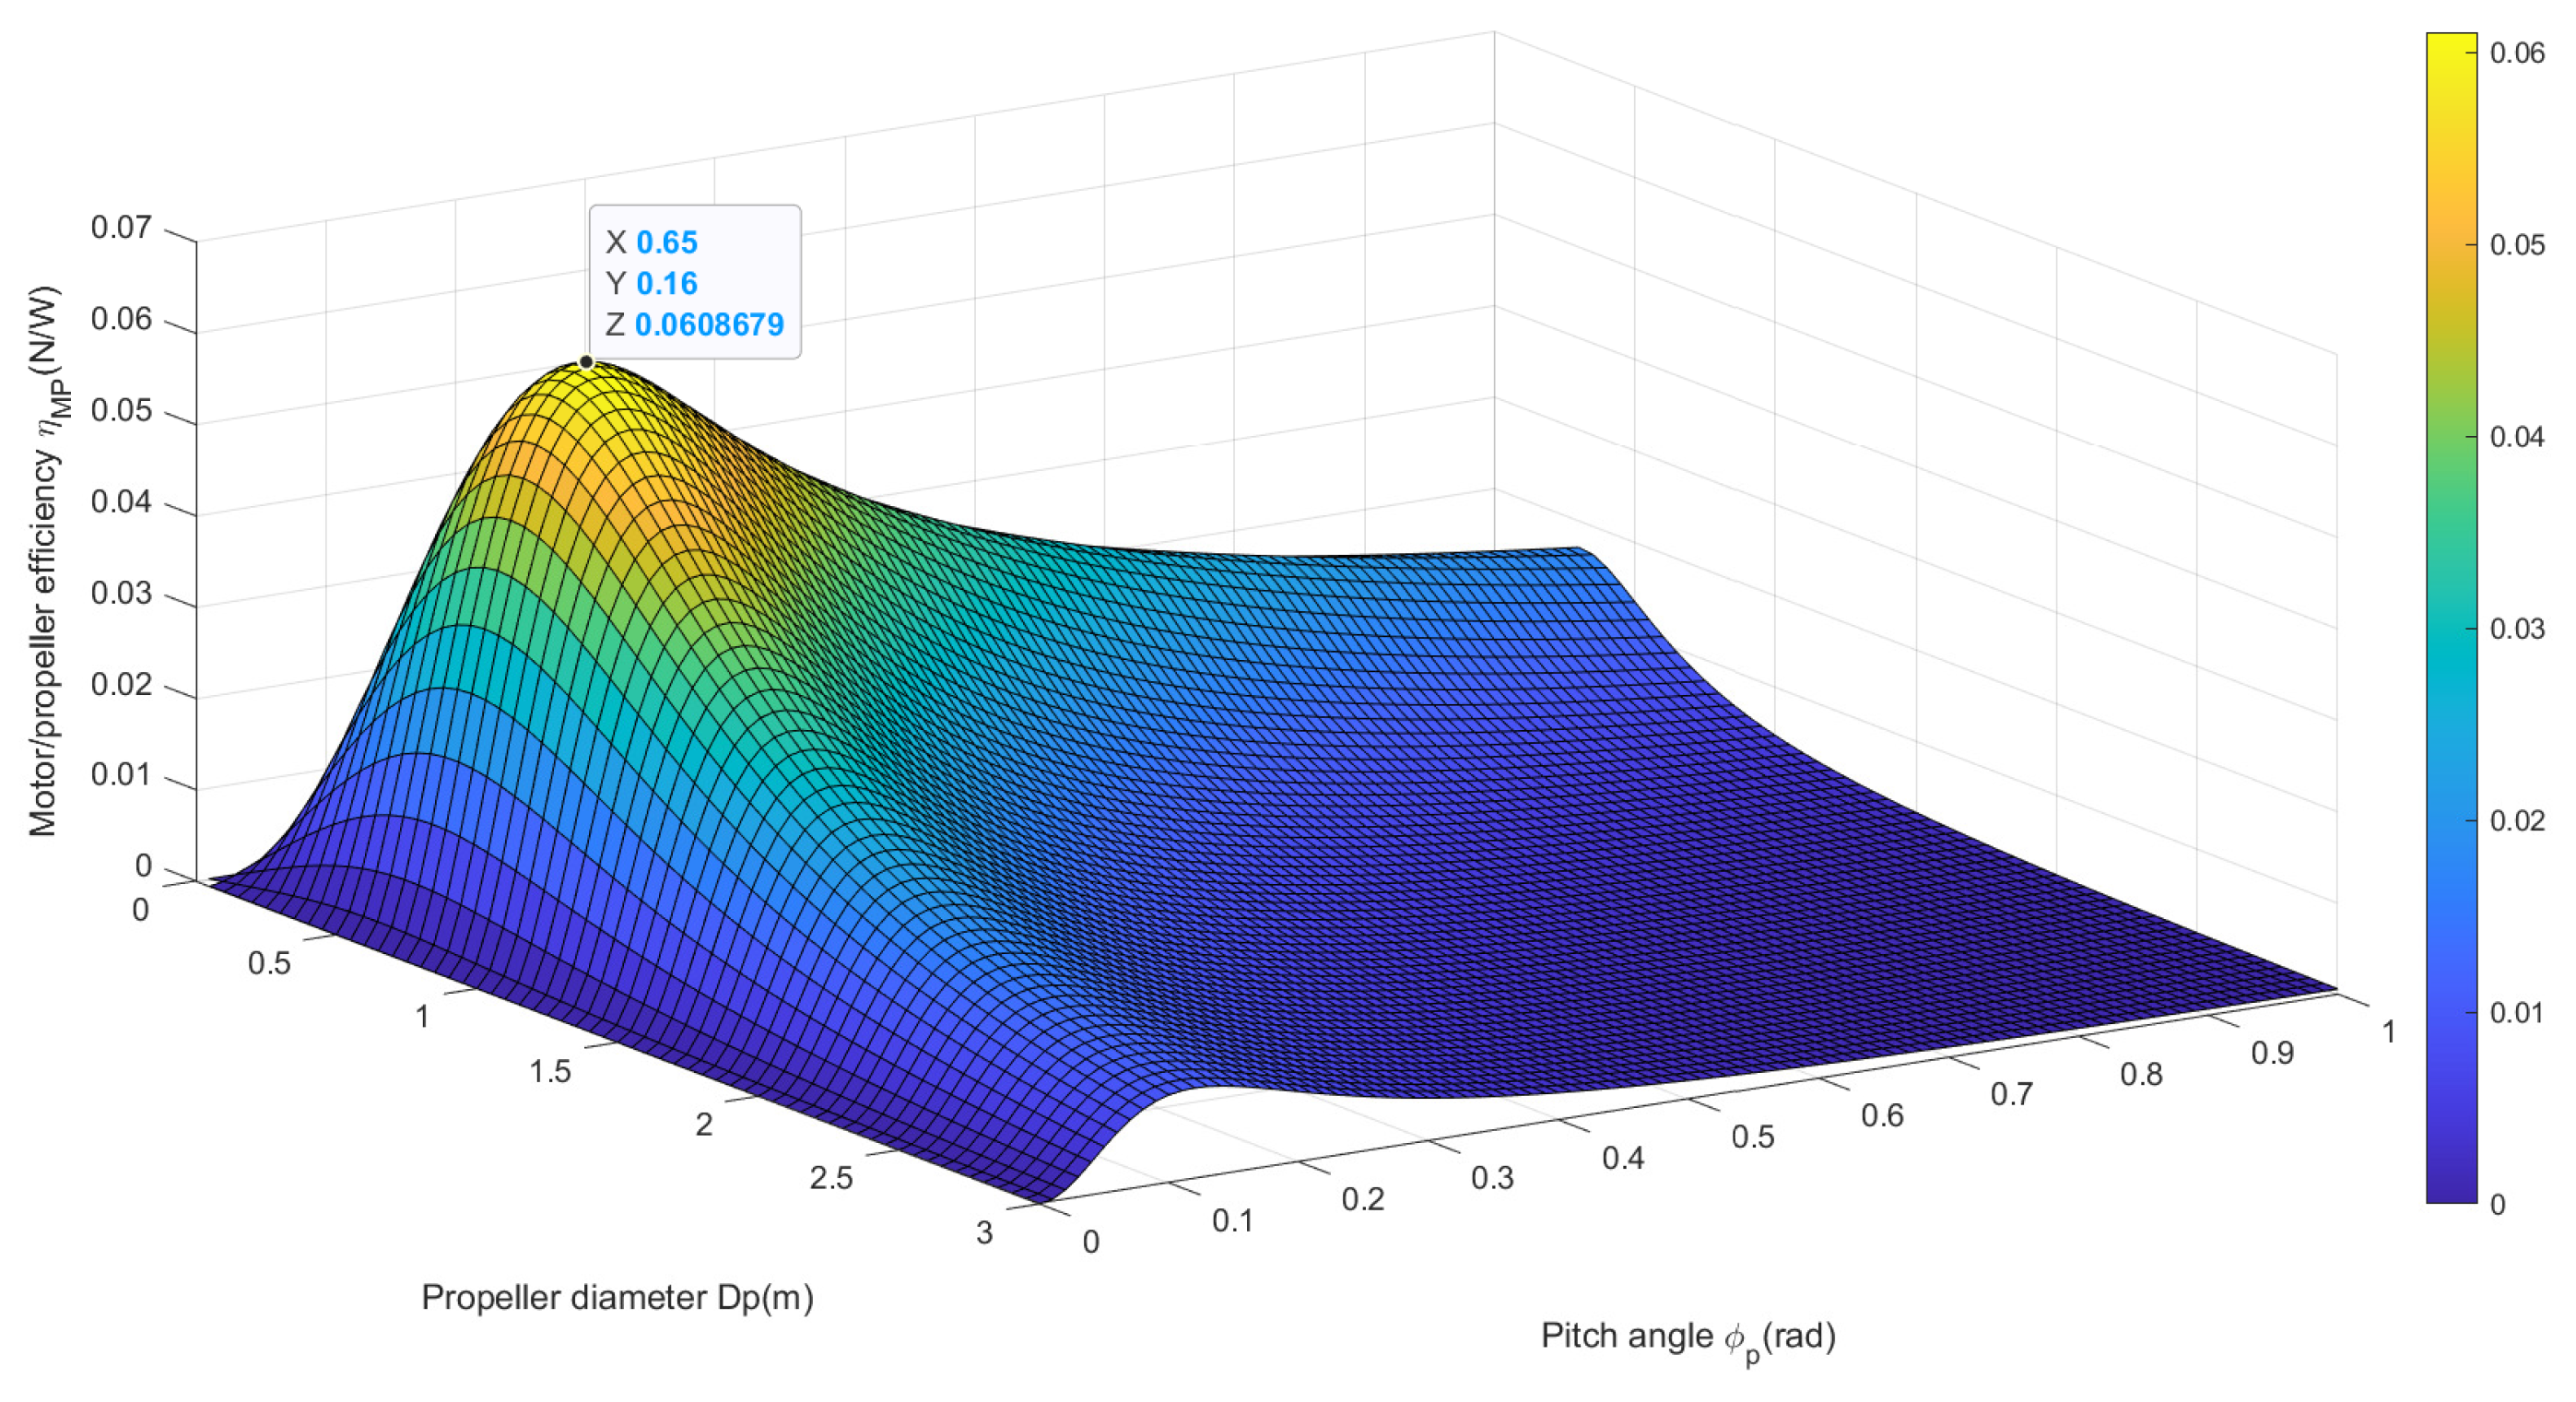
5.2. Pair Motor/Propeller Optimization

The optimization method is applied to the database used for validation. For each example, the optimal propeller parameters allowing the motor/propeller efficiency maximization are located using the SA algorithm. Figure 10 gives an example of an optimized pair motor/propeller, in which the motor/propeller efficiency with the corresponding propeller parameters is presented. However, a filtering condition is required in order to select the appropriate combinations that satisfy constraints, such as the GTOW, imposed by the drone. This condition is based on the computing of the relative error ε r between the maximum thrust T M P m a x ( N ) generated by the optimized pair motor/propeller and the thrust imposed by the drone weight (GTOW) T M a x ( N ) . The maximum thrust generated by the optimized pair motor/propeller is deduced from the constraints imposed on the propeller velocity and output torque given in Equation (32):
T M P m a x = M m a x 4 · C T 5 C M 4 · N m a x 60 2 1 5 .
The thrust imposed by the drone weight G T O W is deduced from the acceleration a c required during the flight by
T M a x = G T O W · ( g + a c ) N p ,
where g and N p are, respectively, the gravity acceleration and propulsion chain number. Thus, the relative error is given by
ε r = T M P m a x T M a x T m a x .
An error reference value ε r e f = 5 % is fixed as the threshold value in order to make the filtering process.
The motor/propeller combinations, which are able to generate the thrust imposed by the specifications, are given in Table 1:
It is remarkable that the two combinations, in terms of the specific efficiency η M P , remain equivalent, which makes the choice between them very similar. Combination 1 is used in the multirotor drone considered for validation.

6. Energy Storage Sizing and Flight Time Comparison

The sizing of the energy storage system is focused on maximizing the flight time while minimizing the GTOW. This paper considers five different energy storage configurations. The first two configurations utilize either a battery or an HFC as the primary energy source. The remaining three configurations are hybrid setups, including combinations of Bat/SC, Bat/HFC, or Bat/SC/HFC. By exploring various energy storage structures, the impact on the autonomy of the multirotor aerial vehicle can be assessed. Figure 11 provides a general configuration of the propulsion chain based on the Bat/SC/HFC hybrid setup. In the hybrid cases, it is possible to consider, during the cruise phase, the recharging of the battery, by the energy surplus of the HFC in the Bat/HFC or Bat/SC/HFC configurations, or the supercapacitor, by the energy surplus of the battery in the Bat/SC configuration; or by the HFC in the Bat/HFC/SC configuration. In both cases, oversizing of the battery or HFC is required.
After the optimal pair motor/propeller has been selected by the optimization algorithm, the sizing of the ESC part will be conditioned by the maximum current imposed by the motor. The fuselage sizing part is not considered in this paper, it is assumed to be ready. The sizing of the energy storage system makes it possible to maximize the flight time of the drone while keeping a minimum mass. For this, it is assumed that:
m c o p t e r = m S t o r a g e E n e r g y + m o t h e r s .

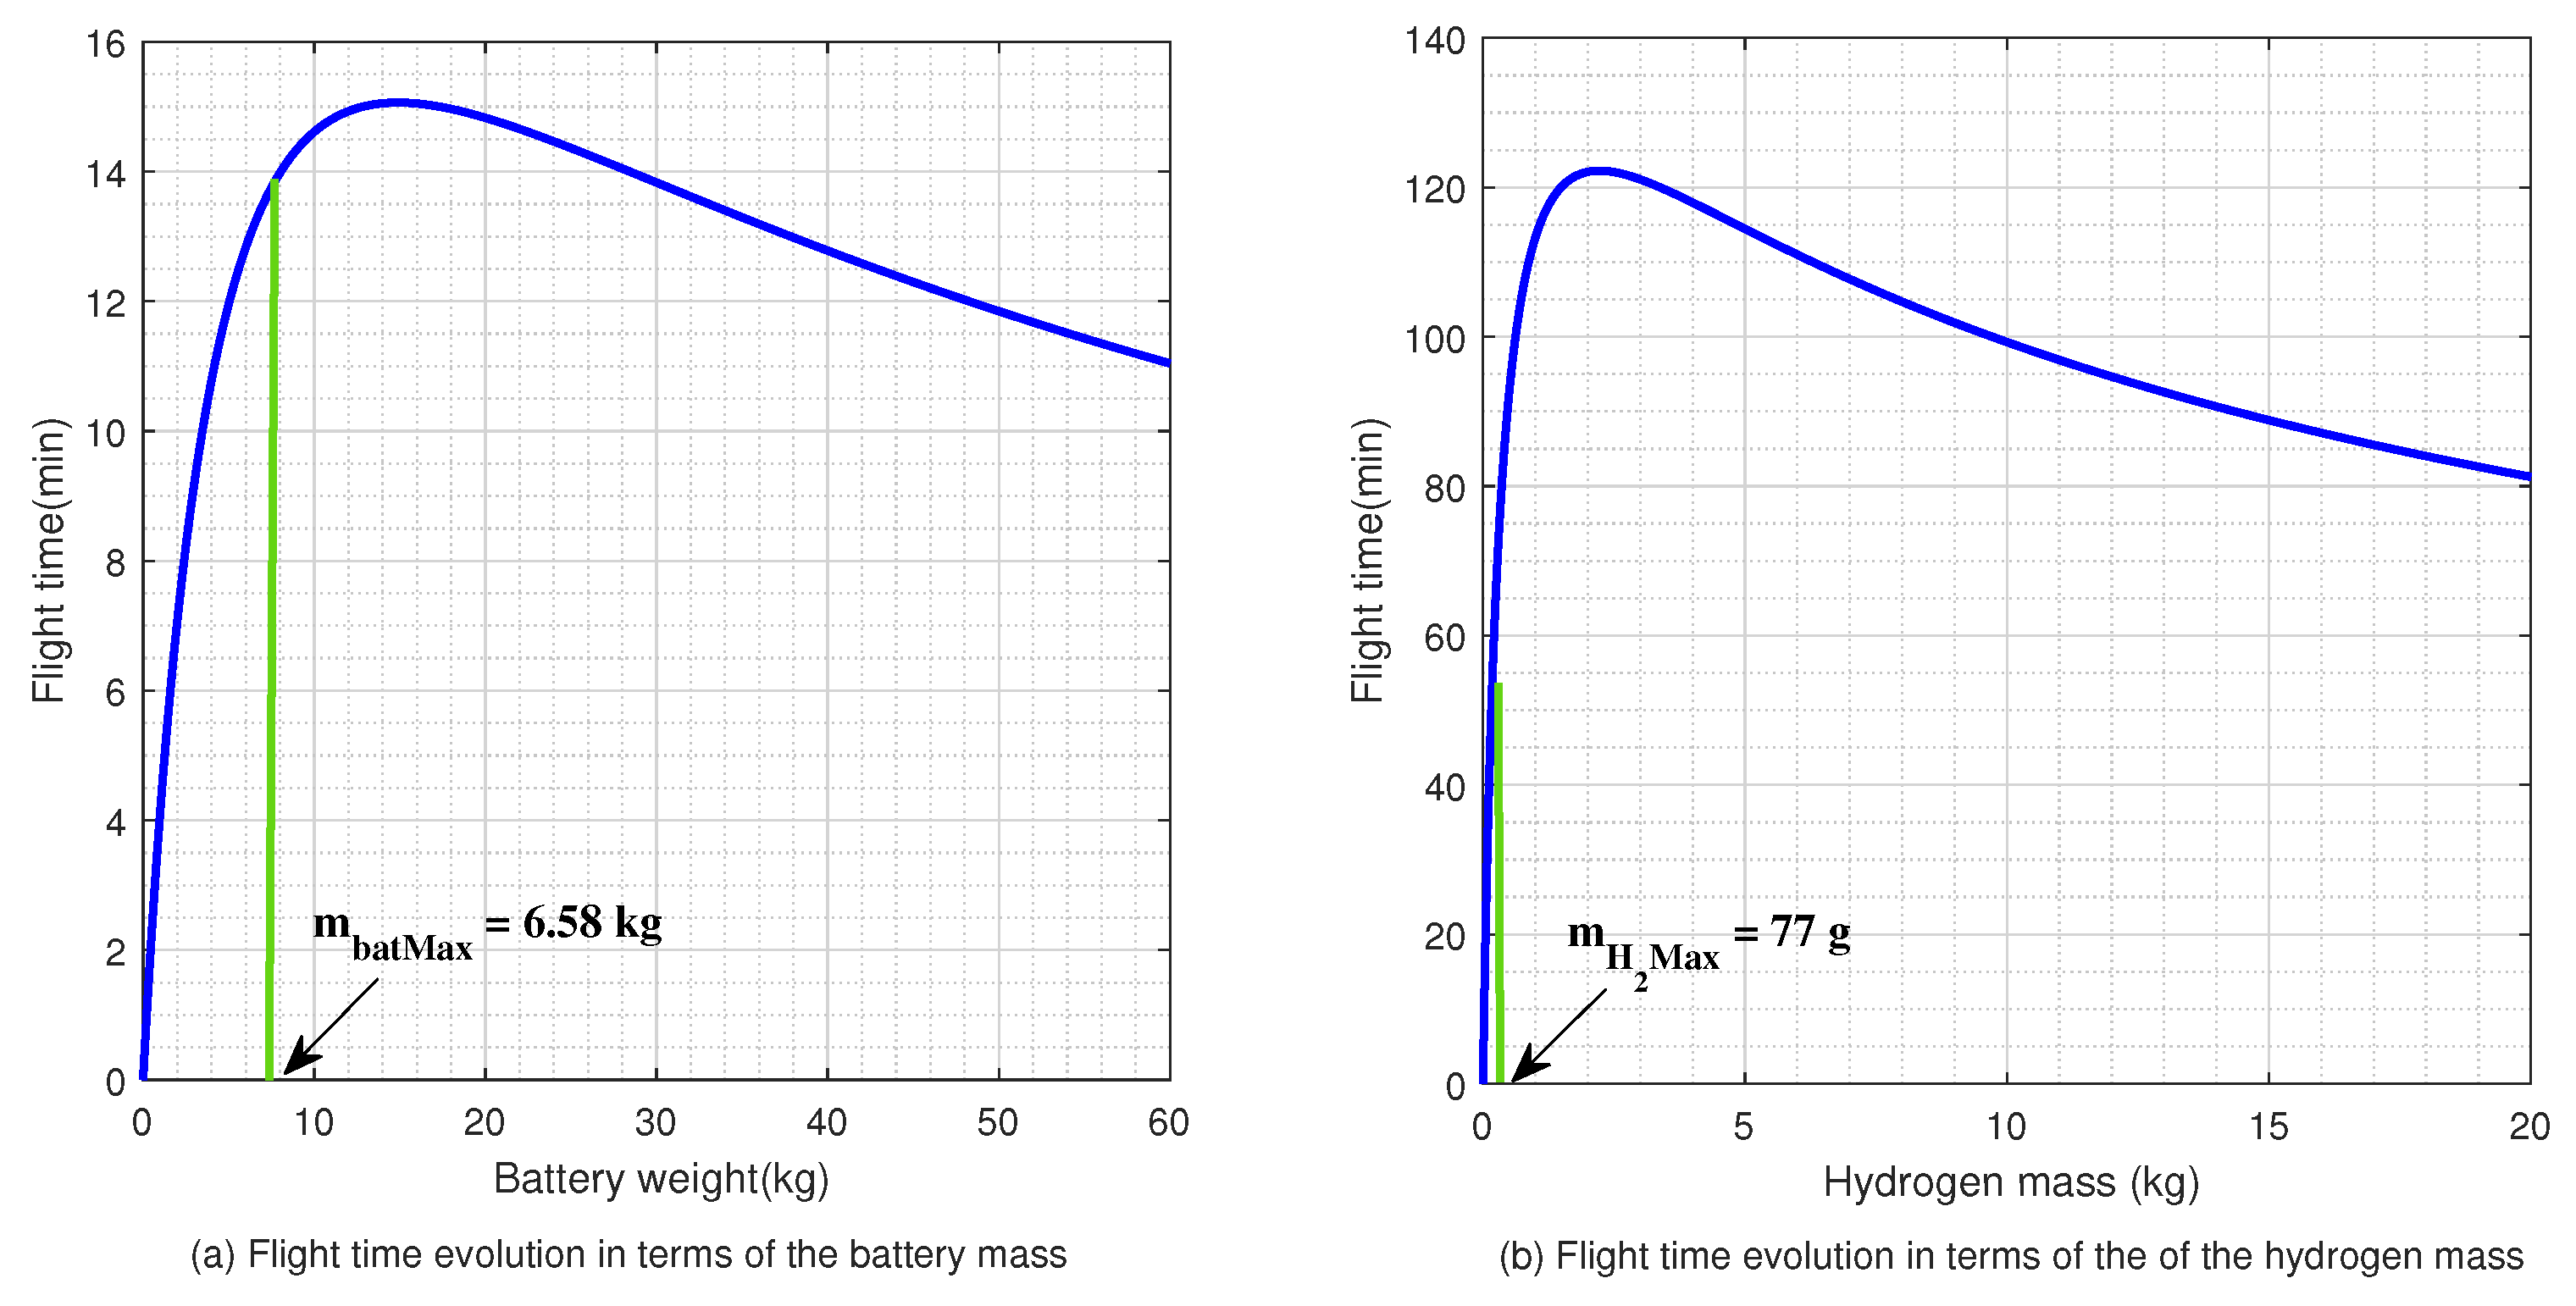
6.1. Sizing of the Battery and the Hydrogen Fuel Cell

When using a simple energy storage system, the sizing of the latter is performed in a way that the flight time is maximized by respecting the constraint of the G T O W .

6.1.1. Battery Sizing

The LiPo battery and the motor power are related by
P m o t = P b a t · η e · η b ,
From the discharging time given in Equation (15), the multirotor aerial vehicle flight time is related to the motor/propeller-specific efficiency by
t f l i g h t = η e · η b · ρ b · m b a t ( m b a t + m o t h e r s ) · g · η M P .

6.1.2. HFC Sizing

The hydrogen consumption during the flight and the motor power are related by
P m o t = η e · η F C · L H V · H C ,
From the discharging time given in Equation (21) in the case of an HFC, the multirotor aerial vehicle flight time is related to the motor/propeller-specific efficiency by
t f l i g h t = η e · η F C · L H V · m H 2 ( m S T A C K + m o t h e r s ) · g · η M P .
where m S T A C K is the stack fuel cell mass, which is given by m S T A C K = m F C + m H 2 + m t a n k . The evolution of the flight time in terms of the battery mass or hydrogen mass is given in Figure 12a,b. For both cases, it is observable that the flight time increases at first, and then decreases as the battery mass or the hydrogen mass increases from 0 to . The decrease in the flight time is caused by the decrease in the motor/propeller efficiency when the drone weight is too heavy. Usually, the flight time maximum is not reached, because the energy storage system mass is limited by the G T O W . Thus, the optimum weight of the battery must be sought in the permitted region given in Figure 12a,b. The optimized parameters of the battery and the hydrogen fuel cell are presented in Table A4.

6.2. Sizing of the Energy Storage System in the Hybrid Cases

The hybridization of energy storage systems enables the enhancement of autonomy and reliability in multirotor aerial vehicles. By combining batteries, hydrogen fuel cells, and supercapacitors, the specific energy to specific power ratio of the energy storage system is significantly improved compared to the case of a single energy source. This, coupled with in-flight energy management algorithms, extends the flight time of the aerial vehicle [29,39]. Figure 13 illustrates the Ragone plot, which depicts the distribution of different energy storage systems based on their specific energy to specific power ratios [40]. From this figure, it is evident that the combinations of Bat/HFC, Bat/SC, or Bat/SC/HFC allow for an improvement in specific energy while maintaining an adequate level of specific power. In this case, the energy storage sizing process remains similar to the single-source case, where the objective is to maximize the flight time while considering the GTOW constraint. However, there are additional variables to consider, particularly the hybridization coefficient of the energy sources.

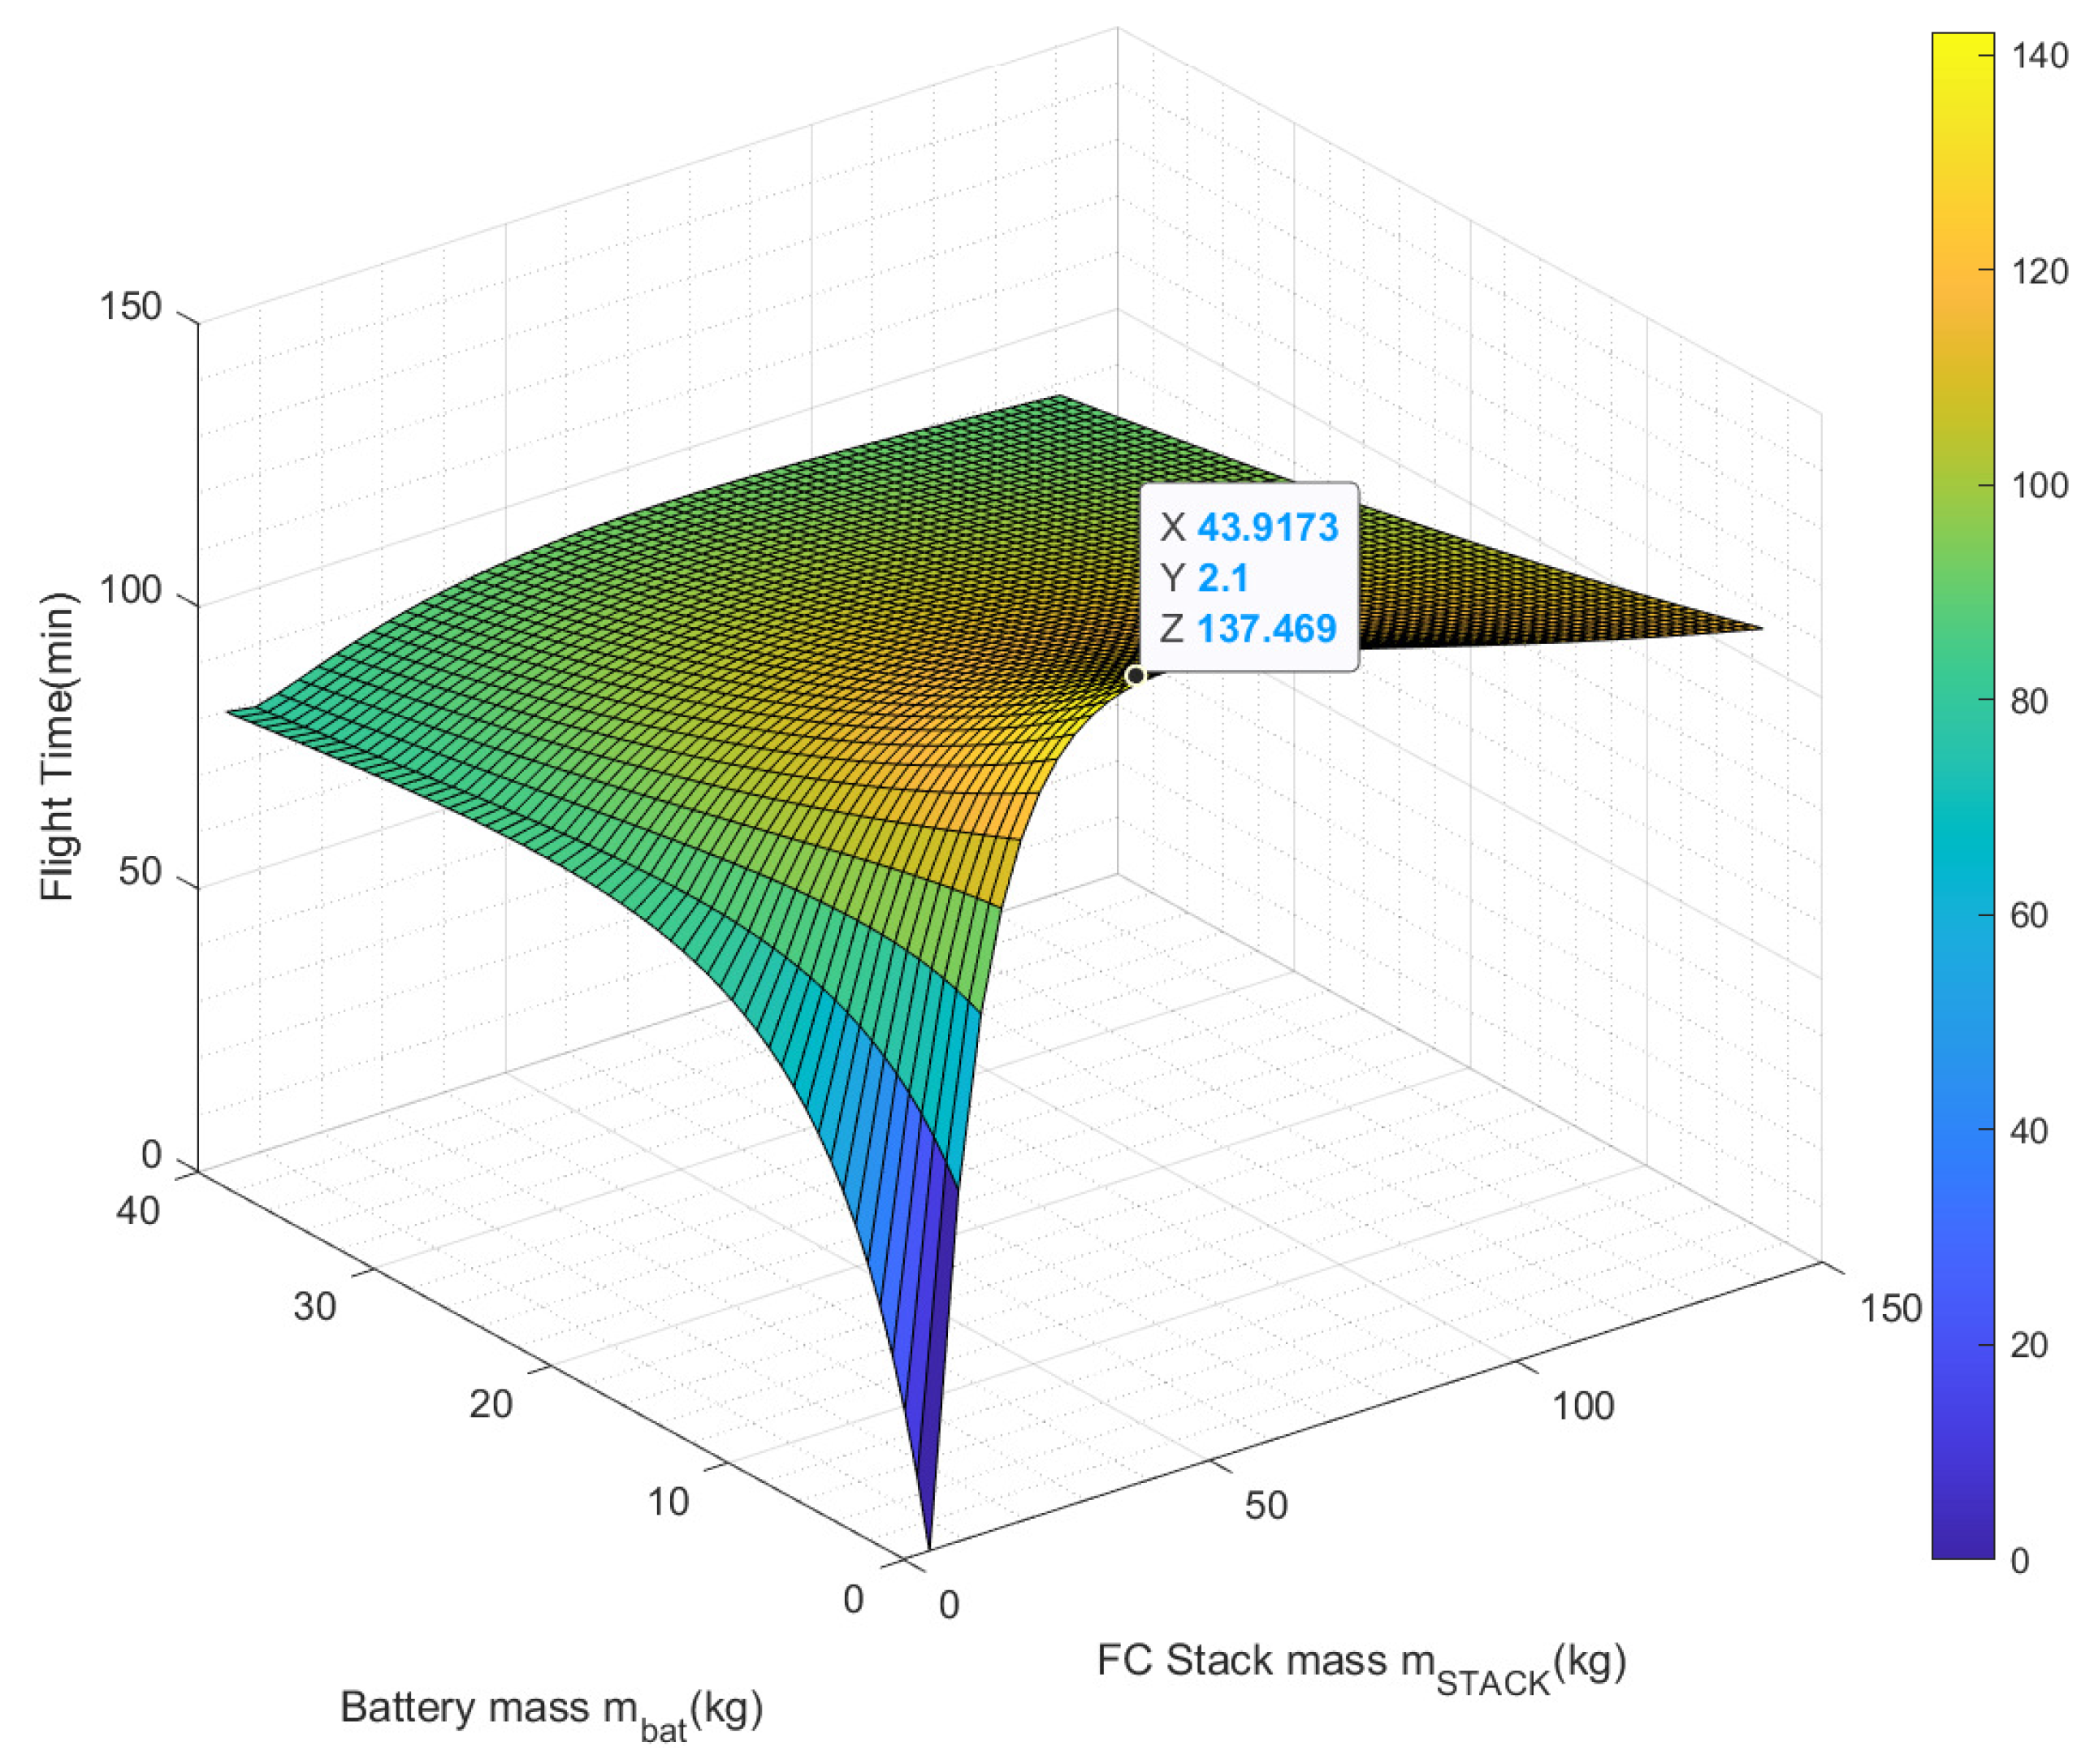
6.2.1. Bat/HFC Sizing

Depending on the flight mission segment, the motor power (load) is supplied by the hydrogen fuel cell or the battery. In both cases, the battery and the hydrogen fuel cell power are related to the motor power by
P b a t = x · P m o t , P H F C = ( 1 x ) · P m o t ,
where x is the hybridization coefficient of the battery power to the motor power. The global flight time of the aerial vehicle t f l i g h t is obtained by the contribution of the battery t f l i g h t B a t and the hydrogen fuel cell t f l i g h t H F C . It is given by
t f l i g h t = t f l i g h t B a t + t f l i g h t H F C .
From Equations (15) and (21), the flight time is given by
t f l i g h t = m b a t · ρ b · η e · η b x + m H 2 · L H V · η e · η F C 1 x · η M P ( m S T A C K + m b a t + m o t h e r s ) · g .
From this equation, it is evident that the flight of the multirotor aerial vehicle is influenced by the mass of hydrogen m H 2 , the mass of the battery m b a t , and the hybridization coefficient x. The choice of this coefficient depends on the duration of the flight mission segments during which the maximum power is required. These segments typically represent less than 14 % [41,42] of the total flight duration. The flight time variation with respect to the hydrogen mass, HFC stack mass, and battery mass is illustrated in Figure 14.
It is remarkable that maximizing the flight time is more favored by increasing the hydrogen mass than increasing the battery mass. This is due to the fact that as the hydrogen mass increases, the specific energy of the system also increases, resulting in an extended flight time.
It is also noticeable that the flight time evolution—as a function of hydrogen mass and the battery mass for the fixed hybridization coefficient x—presents a single basin of attraction. The maximum in this case is not attainable because the mass of the energy sources is limited by the constraint of the G T O W .
In order to locate the energy sources’ optimal masses, which allow for maximizing the flight time with the constraint of the G T O W for different values of the hybridization coefficient x, a nonlinear global optimization was carried out. The algorithm considered in this part is the same one that was used in the motor/propeller pair optimization part. The optimization problem in this case is given in
m a x ( t f l i g h t ) = m i n ( t f l i g h t ) , 0 < m b a t + m S T A C K G T O W m o t h e r .
Figure 15 gives an example of this optimization for a hybridization coefficient of x = 14 % . In this configuration, the obtained battery mass makes it possible to compute the battery capacity using the equation reported in (16). Based on the required capacity, the number of battery-parallel branches is computed. Regarding the sizing of the HFC in this case, there is the tank sizing, which is defined by hydrogen mass obtained by the optimization part, using the regression model presented in Equation (23). The stack sizing, or the fuel cell area sizing, depends on the hybridization coefficient x, by using the following equation:
P F C = ( 1 x ) · N m · P m η e · η F C . A c e l l = P F C ρ c e l l · N c e l l
Thus, the stack mass is deduced using Equation (22).
Through this optimization, a flight time of t f l i g h t = 56.18 min is obtained. The optimized parameters of the battery and the HFC are reported in Table A5.

6.2.2. Bat/SC Sizing

The sizing process of this source configuration is similar to the previous one. The supercapacitor feeds the motor in high-power segments, especially during take-off and landing. During the cruising segment, there is the possibility of charging the supercapacitor with the excess energy supplied by the battery. The power of the supercapacitor and the battery is related to the power of the motor by
P S C = x · P m o t , P b a t = ( 1 x ) · P m o t ,
where x is the coefficient of the supercapacitor power to the motor power. The global flight time of the aerial vehicular t f l i g h t is obtained by the contribution of the supercapacitor t f l i g h t S C and the battery t f l i g h t B a t . It is given by
t f l i g h t = t f l i g h t S C + t f l i g h t B a t .
From Equations (15) and (23), the flight time is given by
t f l i g h t = m S C · ρ S C · η e · η S C x + m b a t · ρ b · η e · η b 1 x · η M P ( m S C + m b a t + m o t h e r s ) · g .
The flight time evolution in terms of the battery mass and the supercapacitor mass is given by Figure 16. This evolution is obtained for a hybridization coefficient of x = 5 % .
In the case of the Bat/SC configuration, maximizing flight time is more influenced by increasing the battery mass rather than increasing the supercapacitor mass. This is because the supercapacitor has a lower specific energy compared to the battery. As a result, when the battery mass increases, the overall autonomy of the energy storage system improves. It is also remarkable that the flight time evolution as a function of the battery mass and the supercapacitor mass, for a fixed hybridization coefficient x, presents a single basin of attraction. The maximum in this case should be reached in the permitted region imposed by the G T O W . The energy storage optimal masses and the hybridization coefficient, allowing the maximization of the multirotor aerial vehicle flight time, are located using a global non-linear optimization. The optimization problem in this case is given by
m a x ( t f l i g h t ) = m i n ( t f l i g h t ) , 0 < m b a t + m S C G T O W m o t h e r .
Figure 17 gives an example of this optimization for a hybridization coefficient of x = 5 % . Through this optimization, a flight time of t f l i g h t = 14.27 min is obtained. The sizing of the battery remains similar to the previous case. The optimized supercapacitor mass allows obtaining the required energy based on the Maxwell cell energy density reported in Table A2 in the Appendix A. Thus, the SC capacity must satisfy the following condition:
C S C 16 3 E S C U S C ,
The optimized parameters of the battery and the SC are reported in Table A6.

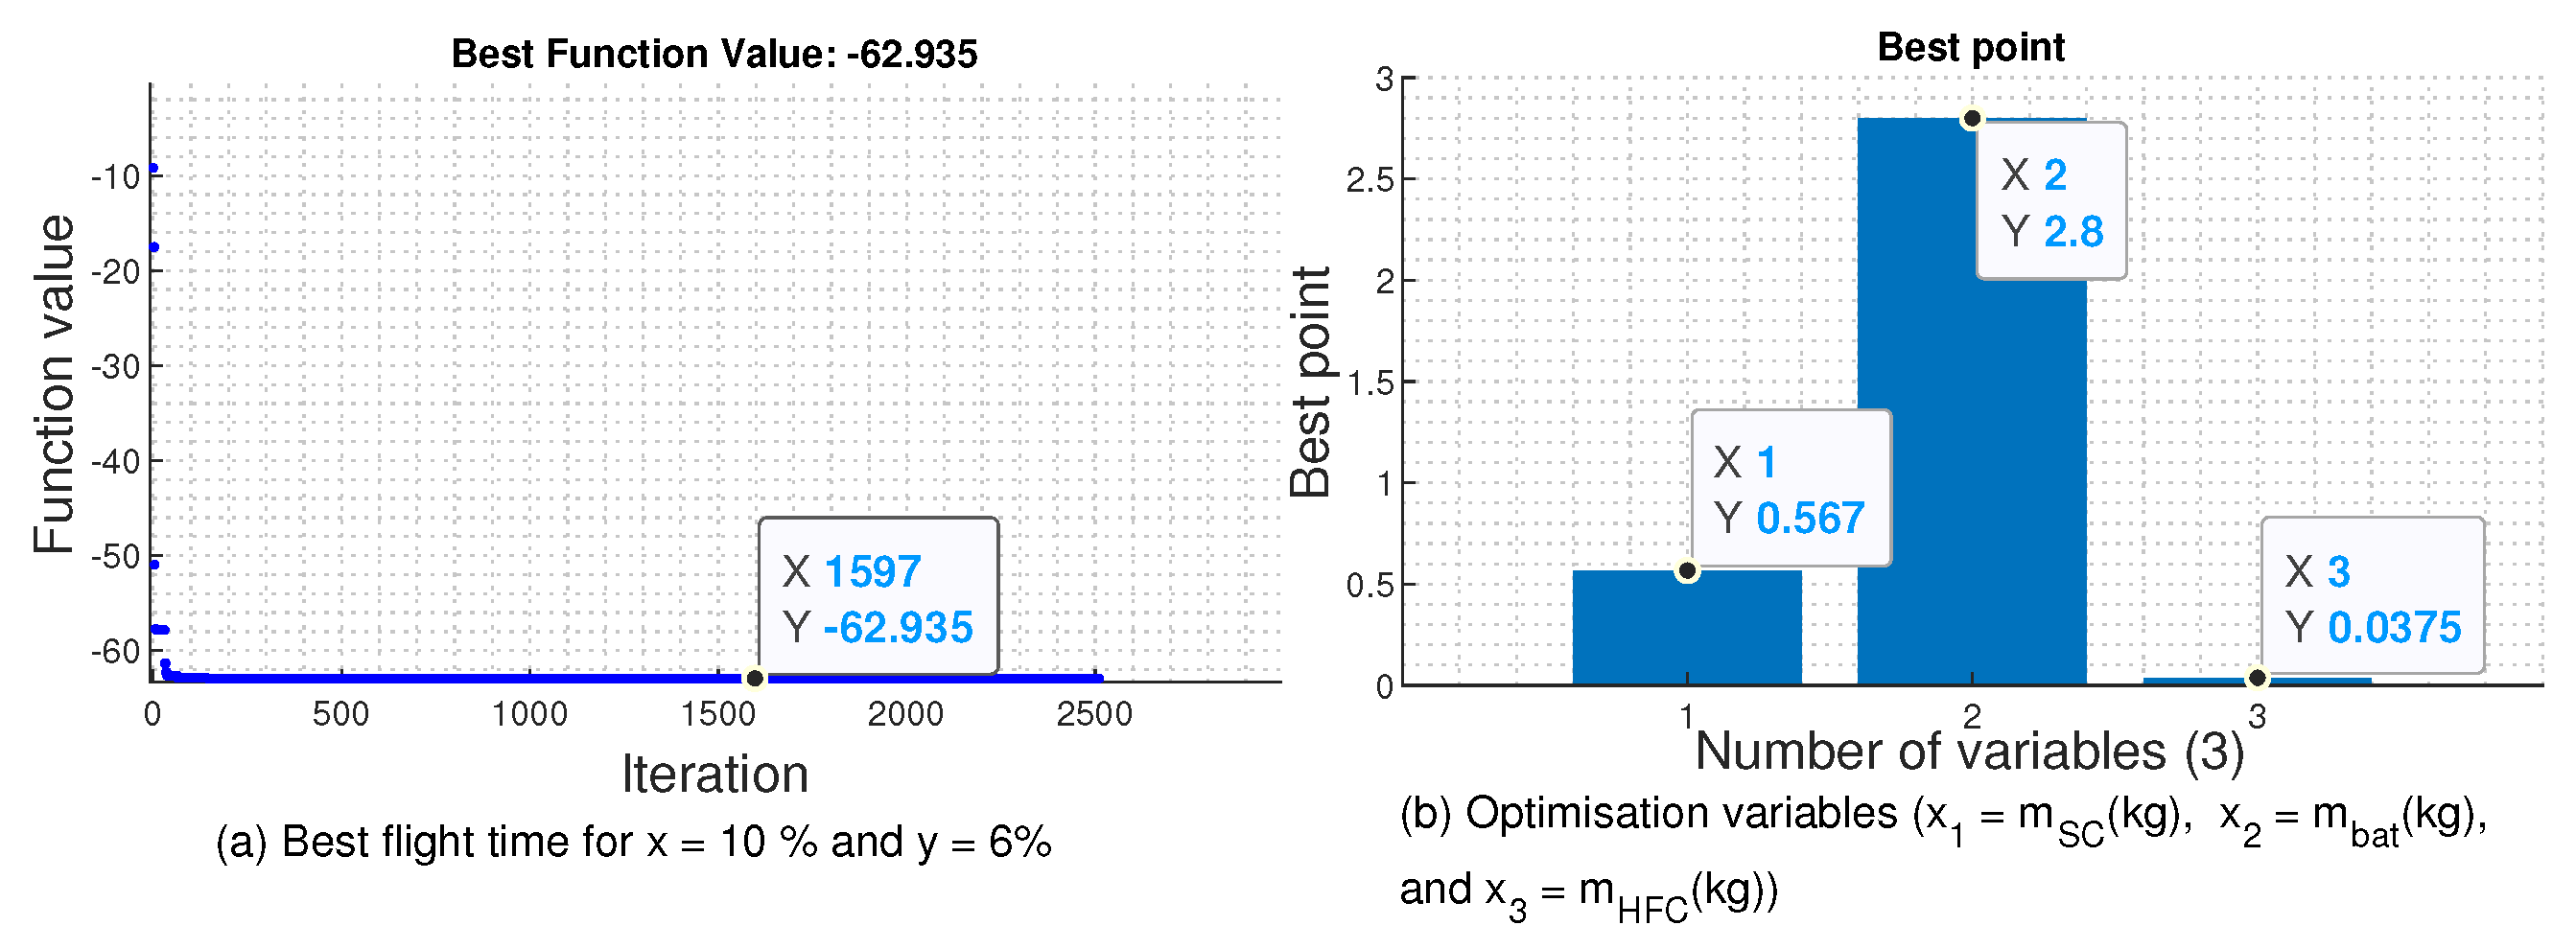
6.2.3. Bat/HFC/SC Sizing

The Bat/SC/HFC hybrid configuration allows for the integration of three energy sources, each utilized in different flight mission segments. During the take-off and landing segments, where the power demand is highest, the supercapacitor is employed. The battery is utilized during hovering segments, while the hydrogen fuel cell is utilized during the cruise segment. The battery power, the supercapacitor power, and the hydrogen fuel cell power are related to the motor power by
P b a t = x · P m o t , P S C = y · P m o t , P H F C = ( 1 x y ) · P m o t .
where x and y are, respectively, the hybridization coefficient of the battery power to the motor power and the supercapacitor power to the motor power. From Equations (15), (23) and (25), the flight time is given by
t f l i g h t = m S C · ρ S C · η e · η S C x + m b a t · ρ b · η e · η b y + m H 2 · L H V · η e · η F C 1 x y · η M P ( m S C + m b a t + m H F C + m o t h e r s ) · g .
In this case, the flight time depends on five parameters, namely supercapacitor mass m S C , battery mass m b a t , hydrogen fuel cell mass m H F C , and hybridization coefficients x and y. Figure 18a–c presents the flight time evolution for the three cases.
As the hydrogen fuel cell (HFC) mass increases (Figure 18a), the flight time shows a tendency to increase when considering the battery and supercapacitor masses. This can be attributed to the improved energy density of the energy storage system resulting from the increased hydrogen mass. Furthermore, the cruise phase typically constitutes the longest segment in a flight mission.
Regarding the effect of the SC mass on the evolution of the flight time in terms of the HFC and battery masses, as seen in Figure 18b, it is remarkable that the flight time has a tendency to decrease. This can be explained by the lower value of the SC energy density in comparison to FCs and batteries. In addition, the take-off and landing segments, where the SC is utilized, have a relatively short duration in the overall flight mission.
The effect of the battery mass on the evolution of the flight time, as a function of the mass of the hydrogen fuel cell and the mass of the supercapacitor, as seen in Figure 18c, remains similar to the case in Figure 18b. The flight time in this case tends to decrease as the battery mass increases. This can be attributed to the battery’s low energy density and the relatively short duration of the hovering segment during which the battery is used.
In this case, the optimization process involves finding an optimal solution in terms of the three masses, with the objective of maximizing the flight time for a given level of hybridization. The optimization problem is given by
m a x ( t f l i g h t ) = m i n ( t f l i g h t ) , 0 < m b a t + m S C + m H F C G T O W m o t h e r .
Figure 19 presents an optimization example for hybridization coefficients x = 10 % , and y = 6 % . In this case a, the multirotor aerial vehicle achieved a flight time of t f l i g h t = 62.93 min. The sizing process for each component, in this case, follows a similar approach as in the previous cases. The optimized parameters for each component are presented in Table A7.

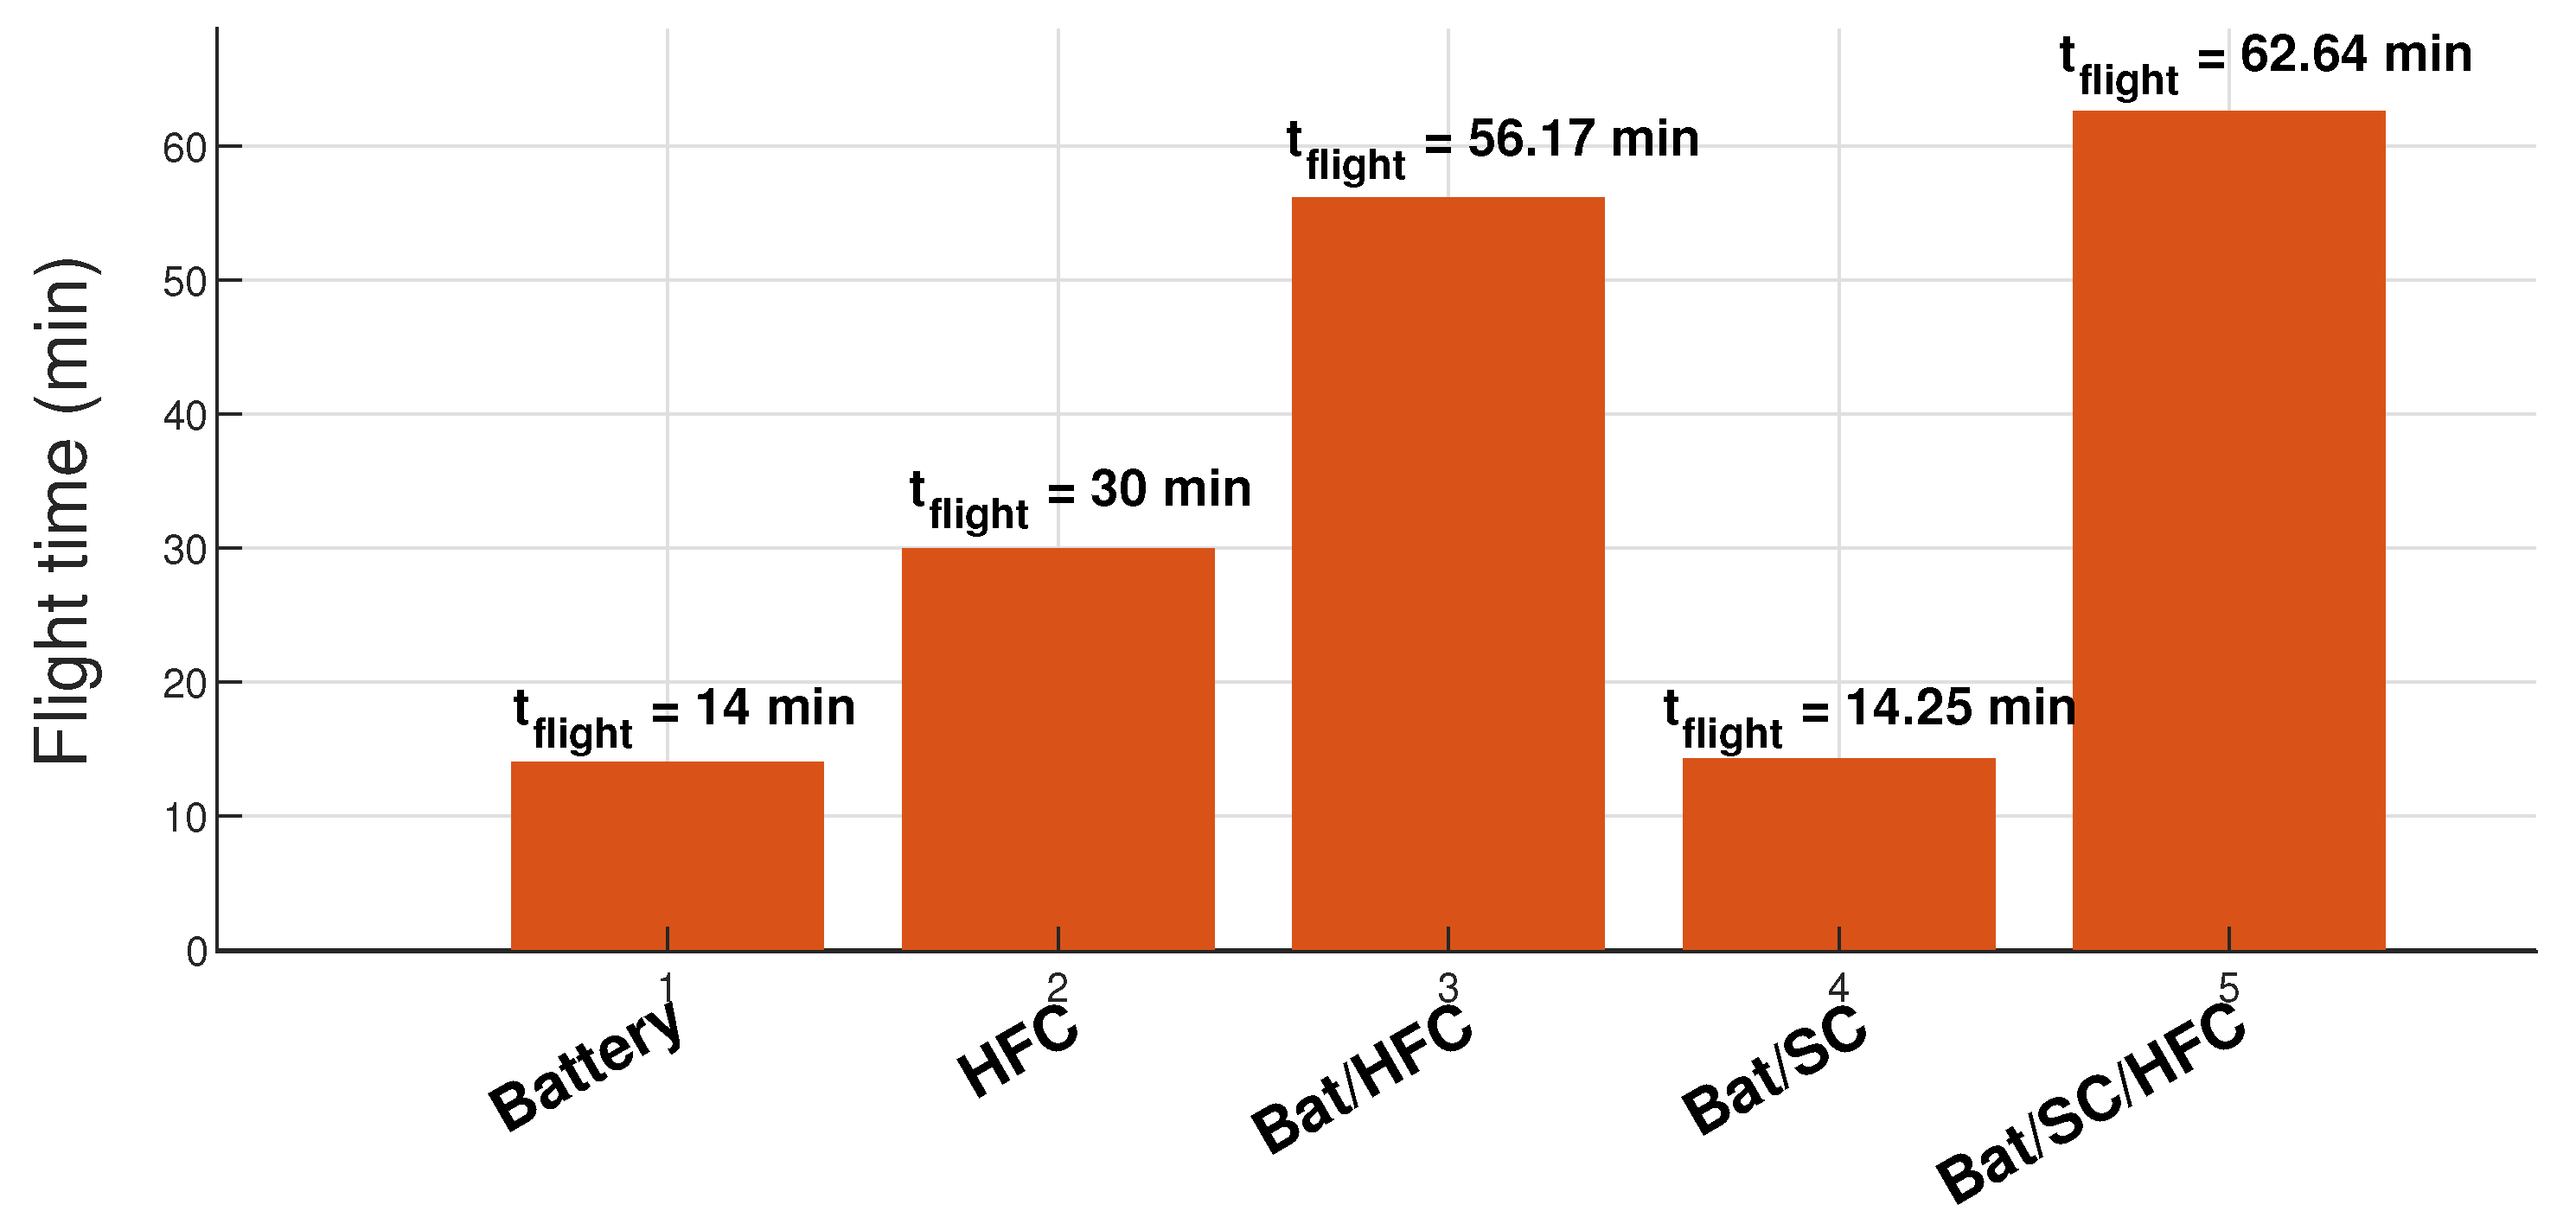
6.2.4. Flight Time Comparison
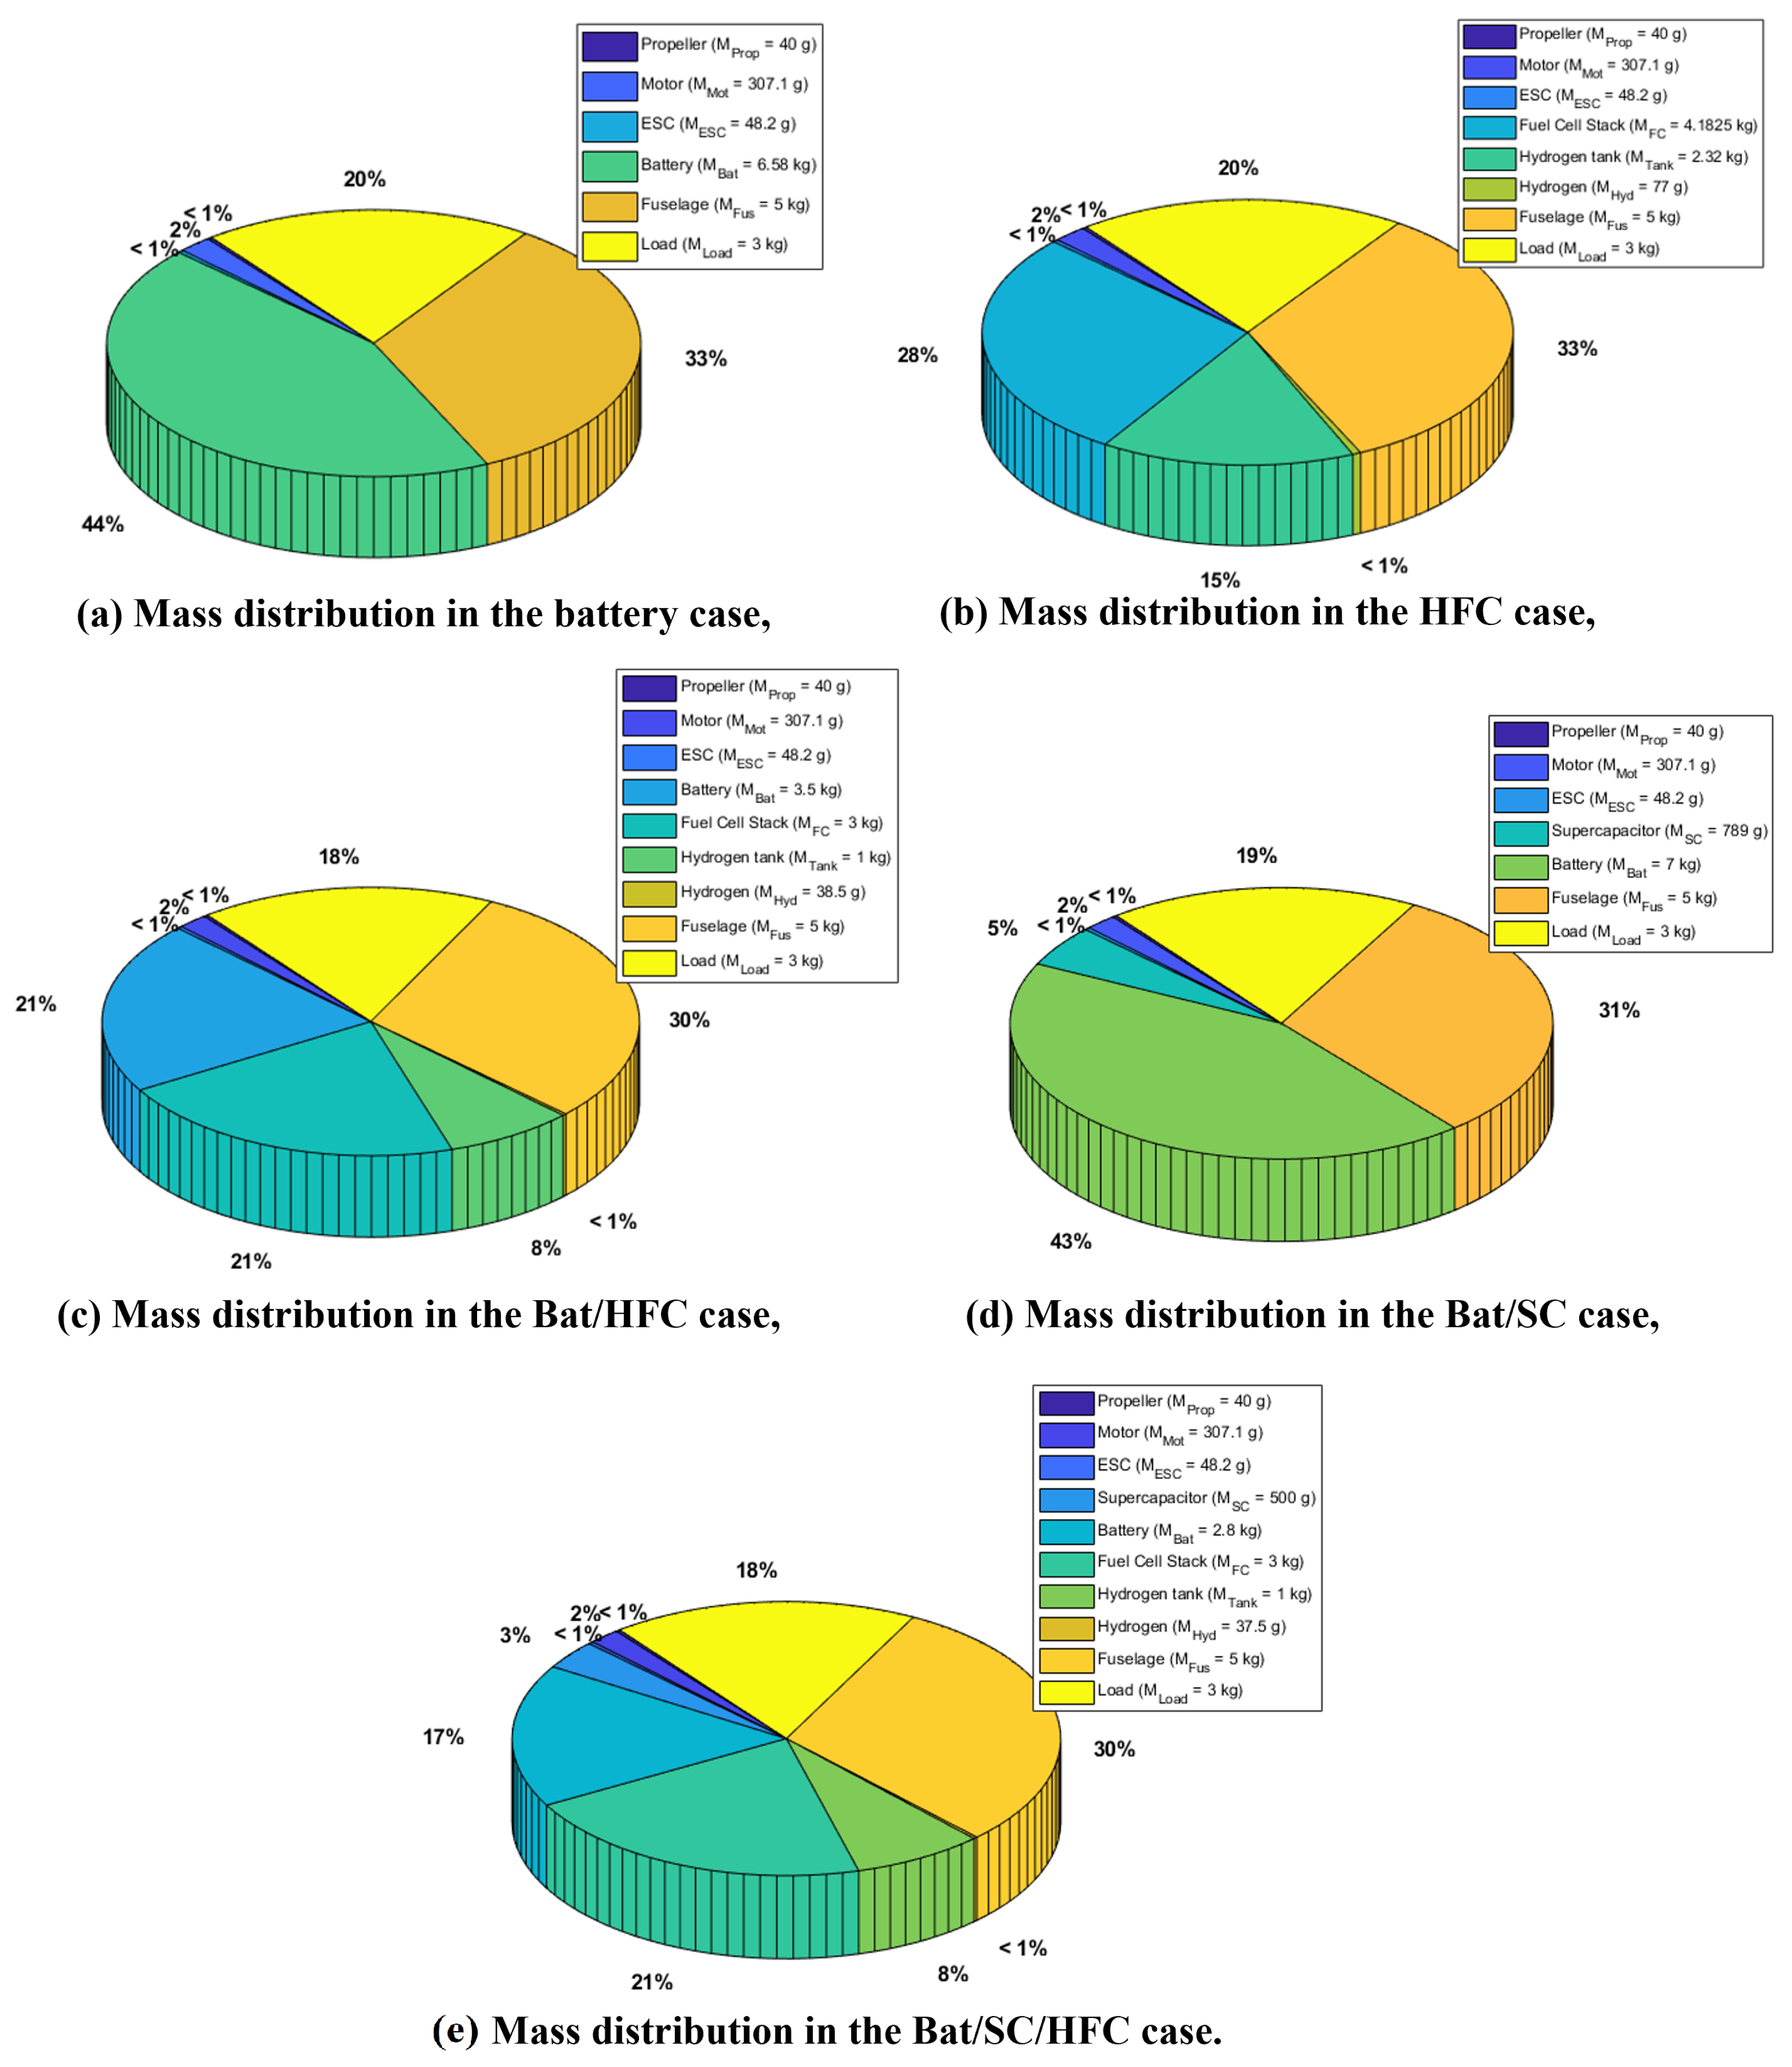
The flight times obtained for each energy storage system configuration in the multirotor aerial vehicle are shown in Figure 20. It is remarkable that the energy storage system configuration based on Bat/SC/HFC achieved the best flight time with a value of more than t f l i g h t = 62 min, followed by the Bat/HFC configuration with a flight time of more than t f l i g h t = 56 min. Both the battery-based and Bat/SC configurations achieved similar flight times on the order of t f l i g h t = 14 min. The supercapacitor in this configuration does not have a significant influence on the flight time due to the shorter duration of the segments in which it is used. The HFC-based configuration allowed for a flight time of t f l i g h t = 30 min. Despite the increase in the complexity of control and energy management in the Bat/SC and Bat/SC/HFC configurations, they remain the best solution for maximizing flight time.

6.2.5. Multirotor Aerial Vehicle G T O W Estimation

In this section, the multirotor aerial vehicle G T O W estimation is described. Regression models presented in Section 3 are utilized to estimate the masses of the propeller, motor, and ESC components. The masses of the payload and fuselage, on the other hand, are fixed. The mass of the energy storage part is computed for each configuration:
  • Battery mass: The optimal battery mass is directly defined by the sizing methodology.
  • HFC mass: HFC is composed of the fuel cell stack, where its mass is conditioned by the hybridization coefficient as given in Equations (21) and (47), the hydrogen tank, defined using the regression model presented in Equation (23), and the hydrogen mass, which is defined by the sizing methodology.
  • SC mass: The minimum number of series cells required to achieve an output voltage of 22.2 V for the supercapacitor is 9. This corresponds to a minimum mass of 567 g. In the hybrid configurations (Bat/SC or Bat/SC/HFC), the mass of the supercapacitor is determined through optimization to maximize the flight time while adhering to the GTOW constraint. It is remarkable that the SC mass in the hybrid configurations, either in Bat/SC or in Bat/SC/HFC, is realizable as the minimum mass of the SC is well respected.
Figure 21 presents the distribution of G T O W for each energy storage configuration. The optimized gross take-of weight is given by GTOW = 14.9747 kg.

7. Conclusions

This paper presents a rapid and robust sizing methodology, along with a comparative study on the impact of energy source configurations, on the autonomy of a multirotor aerial vehicle. The methodology focuses on selecting the optimal components for the propulsion chain of an eVTOL multirotor aerial vehicle based on a specific flight mission. The objective is to locate the optimal parameters for the propeller and motor pair, aiming to maximize the specific efficiency η M P ( N / w ) of the propulsion chain. To achieve this, a global nonlinear optimization using the simulated annealing algorithm (SAA) is employed, with constraints placed on the propeller’s diameter and pitch angle.
The optimized parameters of the propeller/motor pair allow for the sizing of the ESC and the energy storage system, ensuring that they meet the requirements of the drone’s overall mission. This methodology enables the estimation of the resulting gross take-off weight G T O W of the propulsion chain, using mass regression models based on supplier data. The comparative study of different energy storage source configurations highlighted the potential of hybrid sources such as Bat/HFC or Bat/SC/HFC, in terms of autonomy and reliability, through the combination of multiple energy sources. As part of future work, some perspectives will be considered. On the one hand, a full-scale model of a multi-rotor aerial vehicle will be considered, in order to take into account the aerodynamic effect of the structure on the specific efficiency. In this case, the sizing methodology validation step will be carried out on a full scale. On the other hand, the energy management part for each energy source configuration will be considered, in order to have a more global comparison in terms of the flight time, controllability, and implementation complexity of each configuration.

Author Contributions

Conceptualization, S.C.; methodology, S.C.; software, S.C.; formal analysis, S.C.; resources, S.C., R.S., C.M., G.K. and A.A.; writing—original draft preparation, S.C.; writing—review and editing, S.C., R.S., C.M., G.K. and A.A. All authors have read and agreed to the published version of the manuscript.

Funding

This research received no external funding.

Data Availability Statement

The data are available upon request to the corresponding author, Saad Chahba: saad.chahba@estaca.fr.

Conflicts of Interest

The authors declare no conflict of interest.

Appendix A

Table A1. Carbon fiber blade parameters.
ParameterValue
A5
ε 0.85
λ 0.75
ζ 0.5
e0.83
C f d 0.015
α t 0.9
Table A2. Supercapacitor supplier data.
ComponentParameters
Nominal voltage (V) 2.7
Maximum charge/discharge current (A) 840 / 840
Internet resistance ( Ω ) 0.0032
Nominal capacity (Ah) 0.2625
Specific energy (Wh/kg) 5.62
Mass (kg) 0.063
Volume (L) 13.5
Table A3. Multirotor drone specifications.
ComponentParameters
Propeller D p = 18 in ; H p = 6 ; φ p = 1.336 rad
Motor K V = 420 ; U m = 22.2   V ; I m = 35 A ; R m = 0.071 Ω
ESC I E S C M a x = 35 A
Battery U b = 22.2 V ; C b = 12 Ah V ; C - r a t e 30 C
Fuselage M F = 5 kg
Payload M L = 3 kg
Table A4. Battery and HFC parameters in the simple case.
ComponentParameters
Battery N p = 1 ; N s = 6 ; U b = 22.2 V ; C b = 12 Ah ; C - r a t e 30 C
HFC N c e l l = 32 ; A c e l l = 0.0486 m 2 ; V F C = 22.2 V
Table A5. Bat/HFC parameters.
ComponentParameters
Battery N p = 1 ; N s = 6 ; U b = 22.2 V ; C b t h = 6 Ah ; C - r a t e 30 C
HFC N c e l l = 32 ; A c e l l = 0.0418 m 2 ; V F C = 22.2 V
Table A6. Bat/SC parameters.
ComponentParameters
Battery N p = 1 ; N s = 6 ; U b = 22.2 V ; C b t h = 12 Ah ; C - r a t e 30 C
SC N P S C = 1 ; N S S C = 13 ; U S C r e f = 22.2 V ; C S C = 3.42 Ah
Table A7. Bat/SC/HFC parameters.
ComponentParameters
Battery N p = 1 ; N s = 6 ; U b = 22.2 V ; C b t h = 5 Ah ; C - r a t e 30 C
SC N P S C = 1 ; N S S C = 9 ; U S C r e f = 22.2 V ; C S C = 2.36 Ah
HFC N c e l l = 32 ; A c e l l = 0.0408 m 2 ; V F C = 22.2 V

References

  1. TomTom Traffic Index. Available online: https://www.tomtom.com/en-gb/traffic-index/ranking/ (accessed on 18 April 2023).
  2. Airbus City Project. Available online: https://www.airbus.com/en/innovation/zero-emission/urban-air-mobility/cityairbus-nextgen (accessed on 18 April 2023).
  3. Boeing Passenger Air Vehicle. Available online: https://www.boeing.com/features/frontiers/2019/autonomous-flying-vehicles/index.page (accessed on 18 April 2023).
  4. Lilium Jet. Available online: https://lilium.com/jet (accessed on 18 April 2023).
  5. Volocopter UAM. Available online: https://www.volocopter.com/urban-air-mobility/ (accessed on 18 April 2023).
  6. Nathen, P.; Strohmayer, A.; Miller, R.; Grimshaw, S.; Taylor, J. Architectural Performance Assessment of An Electric Vertical Take-Off and Landing (eVTOL) Aircraft Based on a Ducted Vectored Thrust Concept. 2021. Available online: https://lilium.com/files/redaktion/refresh_feb2021/investors/Lilium_7-Seater_Paper.pdf (accessed on 18 April 2023).
  7. Doo, J.T.; Pavel, M.D.; Didey, A.; Hange, C.; Diller, N.P.; Tsairides, M.A.; Smith, M.; Bennet, E.; Bromfield, M.; Mooberry, J. NASA Electric Vertical Takeoff and Landing (eVTOL) Aircraft Technology for Public Services—A White Paper; NASA Transformative Vertical Flight Working Group 4 (TVF4); National Aeronautics and Space Administration (NASA): Washington, DC, USA, 2021. [Google Scholar]
  8. Osita, U.; Horri, T.; Innocente, N.; Bromfield, M.; Bromfield, M. Investigation of a Mission-based Sizing Method for Electric VTOL Aircraft Preliminary Design. In Proceedings of the AIAA SCITECH 2022 Forum 2022, San Diego, CA, USA, 3–7 January 2022. [Google Scholar] [CrossRef]
  9. Pradeep, P.; Wei, P. Energy-efficient arrival with rta constraint for multirotor evtol in urban air mobility. J. Aerosp. Inf. Syst. 2019, 16, 263–277. [Google Scholar] [CrossRef]
  10. Bacchini, A.; Cestino, E. Electric VTOL Configurations Comparison. Aerospace 2019, 6, 26. [Google Scholar] [CrossRef] [Green Version]
  11. Kitty Cora. Available online: https://www.kittyhawk.aero/history (accessed on 18 April 2023).
  12. Chauhan, S.; Martins, J.R.R.A. Tilt-wing evtol takeoff trajectory Optimisation. J. Aircr. 2020, 57, 93–112. [Google Scholar] [CrossRef]
  13. Jobby Aviation S4. Available online: https://www.jobyaviation.com/ (accessed on 18 April 2023).
  14. Volocopter VC2X Flight Test in Paris. Available online: https://www.volocopter.com/newsroom/volocopter-flies-at-paris-air-forum/ (accessed on 18 April 2023).
  15. Bershadsky, D.; Haviland, S.; Johnson, E.N. Electric Multirotor UAV Propulsion System Sizing for Performance Prediction and Design Optimisation. In Proceedings of the 57th AIAA/ASCE/AHS/ASC Structures, Structural Dynamics, and Materials Conference, San Diego, CA, USA, 4–8 January 2016. [Google Scholar]
  16. Dai, X.; Quan, Q.; Ren, J.; Cai, K.Y. An Analytical Design-Optimisation Method for Electric Propulsion Systems of Multicopter UAVs With Desired Hovering Endurance. IEEE/ASME Trans. Mechatronics 2019, 24, 228–239. [Google Scholar] [CrossRef] [Green Version]
  17. Gur, O.; Rosen, A. Optimizing electric propulsion systems for UAVs. In Proceedings of the 12th AIAA/ISSMO Multidisciplinary Analysis and Optimization Conference, Victoria, BC, Canada, 10–12 September 2008; p. 5916. [Google Scholar]
  18. Biczyski, M.; Sehab, R.; Whidborne, J.F.; Krebs, G.; Luk, P. Multirotor Sizing Methodology with Flight Time Estimation. J. Adv. Transp. 2020, 2020, 9689604. [Google Scholar] [CrossRef] [Green Version]
  19. Ampatis, C.; Papadopoulos, E. Parametric design and Optimisation of multi-rotor aerial vehicles. In Proceedings of the 2014 IEEE International Conference on Robotics and Automation (ICRA), Hong Kong, China, 31 May–7 June 2014; pp. 6266–6271. [Google Scholar] [CrossRef]
  20. T-Motor. Available online: https://store.tmotor.com/goods.php?id=384 (accessed on 18 April 2023).
  21. Mejzlik. Available online: https://www.mejzlik.eu/technical-data/propeller-data (accessed on 18 April 2023).
  22. Brandt, J.; Selig, M. Propeller Performance Data at Low Reynolds Numbers. In Proceedings of the 49th AIAA Aerospace Sciences Meeting, AIAA 2011–1255, Orlando, FL, USA, 4–7 January 2011. [Google Scholar]
  23. Cavcar, M. The International Standard Atmosphere (ISA); Anadolu Univ.: Eskişehir, Turkey, 2000; Volume 30. [Google Scholar]
  24. Vu, N.A.; Dang, D.K.; Dinh, T.L. Electric propulsion system sizing methodology for an agriculture multicopter. Aerosp. Sci. Technol. 2019, 90, 314–326. [Google Scholar] [CrossRef]
  25. KDEDirect. Available online: https://www.kdedirect.com/collections/uas-multi-rotor-brushless-motors (accessed on 18 April 2023).
  26. Harrington, A.M.; Kroninger, C. Characterization of Small DC Brushed and Brushless Motors; Aberdeen Proving Ground: Aberdeen, MD, USA, 2013. [Google Scholar]
  27. Aurbach, D.; Gofer, Y.; Lu, Z.; Schechter, A.; Chusid, O.; Gizbar, H.; Levi, E. A short review on the comparison between Li battery systems and rechargeable magnesium battery technology. J. Power Sources 2001, 97, 28–32. [Google Scholar] [CrossRef]
  28. Evangelisti, S.; Tagliaferri, C.; Brett, D.J.; Lettieri, P. Life cycle assessment of a polymer electrolyte membrane fuel cell system for passenger vehicles. J. Clean. Prod. 2017, 142, 4339–4355. [Google Scholar] [CrossRef]
  29. Zhang, B.; Song, Z.; Zhao, F.; Liu, C. Overview of Propulsion Systems for Unmanned Aerial Vehicles. Energies 2022, 15, 455. [Google Scholar] [CrossRef]
  30. Ng, W.; Datta, A. Hydrogen Fuel Cells and Batteries for Electric-Vertical Takeoff and Landing Aircraft. J. Aircr. 2019, 56, 1765–1782. [Google Scholar] [CrossRef]
  31. An, J.-H.; Kwon, D.-Y.; Jeon, K.-S.; Tyan, M.; Lee, J.-W. Advanced Sizing Methodology for a Multi-Mode eVTOL UAV Powered by a Hydrogen Fuel Cell and Battery. Aerospace 2022, 9, 71. [Google Scholar] [CrossRef]
  32. Thirkell, A.; Chen, R.; Harrington, I. A Fuel Cell System Sizing Tool Based on Current Production Aircraft; SAE Technical Paper; SAE International: Warrendale, PA, USA, 2017. [Google Scholar] [CrossRef] [Green Version]
  33. Intelligent Energy. Available online: https://www.intelligent-energy.com/ (accessed on 18 April 2023).
  34. Marzougui, T.; Neuhaus, K.; Labracherie, L.; Scalabrin, G. Optimal sizing of hybrid electric propulsion system for eVTOL. In Proceedings of the IOP Conference Series: Materials Science and Engineering, Online, 11–14 September 2022. [Google Scholar]
  35. Boukoberine, M.; Zhou, Z.; Benbouzid, M. A critical review on unmanned aerial vehicles power supply and energy management: Solutions, strategies, and prospects. Appl. Energy 2019, 255, 113823. [Google Scholar] [CrossRef]
  36. Maxwell. Available online: https://maxwell.com/products/ (accessed on 18 April 2023).
  37. Eren, Y.; Küçükdemiral, İ.; Üstoğlu, İ. Chapter 2—Introduction to Optimisation, Optimisation in Renewable Energy Systems; Butterworth-Heinemann: Oxford, UK, 2017; pp. 27–74. [Google Scholar]
  38. Theys, B.; Dimitriadis, G.; Hendrick, P.; De Schutter, J. Influence of propeller configuration on propulsion system efficiency of multi-rotor Unmanned Aerial Vehicles. In Proceedings of the 2016 International Conference on Unmanned Aircraft Systems (ICUAS), Arlington, VA, USA, 7–10 June 2016; pp. 195–201. [Google Scholar]
  39. Bolam, R.C.; Vagapov, Y.; Anuchin, A. Review of Electrically Powered Propulsion for Aircraft. In Proceedings of the 2018 53rd International Universities Power Engineering Conference (UPEC), Glasgow, UK, 4–7 September 2018; pp. 1–6. [Google Scholar]
  40. Rufer, A. The dream of efficient energy storage–From BESS KERS & Co to the hybrid power plant. In Proceedings of the19th European Conf. on Power Electronics and Applications (EPE’17 ECCE Europe), Warsaw, Poland, 11–14 September 2017; pp. 1–9. [Google Scholar]
  41. Uber Elevate. Uber Elevate Mission and Vehicle Requirements. 2018. Volume 2018. Available online: https://s3.amazonaws.com/uber-static/elevate/Summary+Mission+and+Requirements.pdf (accessed on 18 April 2023).
  42. Brown, A.; Harris, W. A Vehicle Design and Optimisation Model for On-Demand Aviation. In Proceedings of the 2018 AIAA/ASCE/AHS/ASC Structures, Structural Dynamics, and Materials Conference, Kissimmee, FL, USA, 8–12 January 2018. [Google Scholar]
Figure 1. eVTOL propulsion configuration.
Aerospace 10 00425 g001
Figure 2. eVTOL categories.
Aerospace 10 00425 g002
Figure 3. Sizing approach for the eVTOL multirotor flowchart.
Aerospace 10 00425 g003
Figure 4. Overview of the sizing methodology steps.
Aerospace 10 00425 g004
Figure 5. eVTOL multirotor physical model.
Aerospace 10 00425 g005
Figure 6. BLDC motor electric model.
Aerospace 10 00425 g006
Figure 7. Regression model for each component.
Aerospace 10 00425 g007
Figure 8. Motor/propeller efficiency evolution in terms of propeller parameters.
Aerospace 10 00425 g008
Figure 9. multirotor eVTOL drone.
Aerospace 10 00425 g009
Figure 10. Motor/propeller optimization example with the objective function η M P and propeller parameters D p , φ p .
Aerospace 10 00425 g010
Figure 11. Multirotor propulsion chain based on a hybrid energy storage system, Bat/SC/HFC.
Aerospace 10 00425 g011
Figure 12. Flight time evolution.
Aerospace 10 00425 g012
Figure 13. The Ragone chart.
Aerospace 10 00425 g013
Figure 14. Flight time evolution in terms of the HFC stack mass m S T A C K and the battery mass m b a t .
Aerospace 10 00425 g014
Figure 15. Example of a flight time optimization in the Bat/HFC configuration case.
Aerospace 10 00425 g015
Figure 16. Flight time evolution in terms of the supercapacitor mass m S C and the battery mass m b a t .
Aerospace 10 00425 g016
Figure 17. Example of a flight time optimization in Bat/SC configuration case.
Aerospace 10 00425 g017
Figure 18. Flight time evolution in terms of the battery mass m b a t t , the supercapacitor mass m S C , and the hydrogen fuel cell mass m H F C .
Aerospace 10 00425 g018
Figure 19. Example of a flight time optimization in the Bat/SC/HFC configuration case.
Aerospace 10 00425 g019
Figure 20. Flight time comparison for each energy source configuration.
Aerospace 10 00425 g020
Figure 21. Multirotor aerial vehicle mass distribution.
Aerospace 10 00425 g021
Table 1. Sizing process methodology outcome.
Combination NumberMotor SpecificationPropeller ParametersThrust Efficiency
1U7-V2.0 KV420P18 × 6.00.0528
2U7-V2.0 KV490P20 × 6.70.0533
Disclaimer/Publisher’s Note: The statements, opinions and data contained in all publications are solely those of the individual author(s) and contributor(s) and not of MDPI and/or the editor(s). MDPI and/or the editor(s) disclaim responsibility for any injury to people or property resulting from any ideas, methods, instructions or products referred to in the content.

