
The Impact of Temperature on the Surface Colour of Gas Turbine Blades Heated in the Presence of Kerosene


Air Force Institute of Technology, 6 Księcia Bolesława Street, 01-494 Warszawa, Poland
*
Authors to whom correspondence should be addressed.
Aerospace 2023, 10(4), 375; https://doi.org/10.3390/aerospace10040375
Submission received: 30 January 2023
/
Revised: 3 April 2023
/
Accepted: 6 April 2023
/
Published: 16 April 2023
Abstract
:The reliability and operational safety of an aircraft engine gas turbine are extremely important in terms of its operation. In the course of operation, these turbines undergo complex thermal, mechanical, aerodynamic, and chemical exhaust gas loads. Due to such a load, particularly acting upon the rotor blades, they undergo various damages. Therefore, the maintenance processes continuously strive for enhancing diagnostic methods in order to improve the sensitivity and reliability of damage identification. The basic diagnostic method is a visual one, supported by an optoelectronic device. It only enables determining the fact of a damage, e.g., mechanical, thermal, or chemical. The turbine blade material degradation degree is very difficult to assess in a nondestructive manner in the course of engine operation. No objective, and yet nondestructive, diagnostic method enabling the assessment of blade alloy structural changes has been developed so far. Therefore, a thesis was put forward that it was possible to apply the visual method and correlate its results with the results of gas turbine blade microstructural change tests, which would enable detecting early damage phases and assessing their fitnesses. The tests were conducted with the laboratory method. The authors received new blades of the SO-3 aircraft gas turbine engine made of the EI-867 WD alloy and then subjected them to heating in a laboratory furnace, over a temperature range of T = 1123–1523 K, in increments of 100 K. Cooling took place in the furnace. Prior to and after heating, the blades were subjected to visual testing. Blade surface colour is a diagnostic symptom which indicates a change in the blades’ technical condition. The images were analysed using software developed for the MATLAB environment. The extracted surface image features are presented in the form of brightness distribution histograms for individual colour components RGB(red, green, and blue) and grayscale Sz. Histogram parameters — average value, standard deviation, maximum value and its position — were calculated. In consequence of conducted studies, it was concluded that an increase in blade heating temperature entailed changes in individual RGB colours and the grayscale (Sz) of their surface images, which indicate the overheating intensity.
1. Introduction
Gas turbines in aircraft engines are acted upon by high thermal, mechanical, and aerodynamic loads in the presence of chemical exhaust gas impact. This forces the application of increasingly advanced materials and technological processing, aimed at achieving an ever-greater efficiency, while reducing fuel consumption. Gas turbine power determines engine performance, and increasing its efficiency entails increased thrust (power) and decreased unit fuel consumption of an engine. However, increasing the operating temperature of critical turbine components, such as blades made of nickel superalloys, is limited. The superalloy creep resistance and heat resistance decrease at high exhaust gas temperatures.
Most turbine damages are operational [1,2,3,4,5]. The causes behind aircraft turbine engine damages are shown in Figure 1.
- Creeping
- Overheating and melting
- Corrosion and fatigue cracking
- Intercristalline and thermal corrosion
- Low- and high-cycle fatigue: thermal and thermal-mechanical
- Erosion
- Burn-through.
In the course of turbine engine operation within its nominal range, the turbine blades are exposed to the highest value of exhaust gas temperature, over an area of 40% of their vane length. The leading edges are particularly impacted by thermal load. They experience exhaust gas stagnation (total) temperature, which depends on a flow rate value and the exhaust gas stream static temperature with specific thermodynamic properties. This leads to an intensively deteriorating superalloy microstructure in this area, which often causes its overheating.
Turbine blades are made of nickel or nickel-cobalt alloys. These alloys can operate up to a certain average temperature value, after which their properties deteriorate. Various design solution and treatments are applied in order to enable blade operation under a simultaneous, significant thermal and mechanical load and within an aggressive working stream. These include internal cooling systems or applications of coating thermal barriers with good high-temperature corrosion resistance, low thermal conductivity, and high structural stability.
It should be mentioned that aircraft engine fuel properties also significantly impact the technical condition of turbine blades [7,9]. The quality of fuel and its properties associated with the chemical composition, including the presences of sulphur and water, influence correct fuel atomization and its complete combustion, and thus, temperature stability upstream of the turbine.
The interaction of the chemical compounds in the exhaust gases and operation environment, e.g., water dispersed in fuel, leads to dangerous blade failures in the form of high-temperature corrosion on their surfaces, which results in the formation of surface pits and, consequently, blade cracking [4,8,10,11].
Excessive increase in the exhaust gas temperature, especially when prolonged, results in blade superalloy overheating. Overheating may cause severe microstructural degradation of the superalloy. This contributes to the formation of degraded microstructural zones with locally deteriorated mechanical properties—reduced alloy heat and creep resistance. Excessively high temperature, relative to the nominal operating temperature, and the presence of tensile stress when rotating leads to the phenomenon of superalloy creep. This process causes blade elongation, which contributes to reduced clearance between blade face and turbine casing. Neutralizing this clearance, in extreme cases, leads to the blade faces rubbing against the casing [3].
The external forms of damage to the gas turbine blades may be detected with a reliable and effective non-destructive visual method with the support of an optoelectronic device (video scope, borescope) without the need to dismantle the engine [1,5,7,11,12,13,14,15,16,17,18].
The novelty of the proposed method consists of the simultaneous study of the heating temperature effect on the change in the colour of the blade surface and the microstructure of the coating and the alloy of the blade.
In this article we assume that it is possible to apply the visual method and correlate its results with the results of gas turbine blade microstructural tests, which would enable detecting early damage phases and assessing their fitness.
The research conducted with the laboratory method on new blades of the SO-3 aircraft gas turbine engine made of the EI-867 WD alloy consists of four stages:
- the visual testing of all blades;
- heating blades, in a laboratory furnace, over a temperature range of T = 1123–1523 K, in increments of 100 K;
- the visual testing of all blades after heating-cooling;
- the microstructural analysis of blades’ coating and alloy.
The color of the blade surface is the main diagnostic symptom indicating a change in the technical condition of the blade as a function of the heating temperature. This symptom can be determined using a single optoelectronic device for multiple turbine engines.
For comparison, the use of the Blade Tip Timing (BTT) method [19,20,21] requires equipping each engine with a set of measuring probes, either permanently or for the duration of the tests. In the first case, it is associated with high costs. In the second case, the labour intensity of research increases.
2. Characteristics of the Research Object
Laboratory tests were covered new gas turbine rotor blades (Figure 2 [2,8]). They were made of a conventional nickel and cobalt superalloy called EI-867WD (HN62MWKJu). Due to lower chromium content, it is less resistant to degrading environmental action, particularly in the presence of sulphur and sodium, and it often undergoes catastrophic corrosion (so-called hot corrosion) under operating conditions, which is why protective coatings are used—an aluminide coating [22,23,24].
To increase blade heat resistance, apart from the aluminide heat-resistant protective coating, no other treatments were used in the construction of the blade itself and the engine.
Gas turbine blades are manufactured in series, from a single melt, through a complex process. In the initial phase of the process, the material in the form of EI-867WD alloy rods is tested using ultrasonic method.
Then, they are cut to a specific dimension. Another stage is preforging and finish-forging to a specific dimension, as per the forging drawing. Next, the forgings are placed in a muffle to be supersaturated. Heating is executed at a constant temperature of approx. 1473 K, at an argon atmosphere, for 4–6 h, whereas air-cooling is conducted in a muffle, in an argon stream down to 1073 K, and in open air below this temperature. Forgings undergo a full ageing process, i.e., heating for 60 min, to a temperature of 1123 K and this temperature is usually maintained for 120–135 min. After these treatments, the forging is subjected to thermal and chemical processing, which involves diffusive saturation of its aluminium (protective coating application). A mixture in the form of annealed powder (98–99% wt.) with ammonium chloride (1–2% wt.) is applied on the blade for this purpose. The blade is placed in the muffle and put into a furnace at a temperature of 623 K. Next, it is heated up to 1123 K and heated for 2–2.5 h, cooling down to a temperature of 373 K in open air. The thickness of the applied protective coat is from 0.03 mm to 0.06 mm. After this operation, the blade surface should be bright-grey with a pink tint (places with a green temper are unacceptable, since this proves coating oxidation) [23].
The structure of the EI–867 WD alloy is typical for nickel superalloys and consist of the γ phase and γ’ reinforcing phase, as well as carbides and borides. The γ’ phase is a solid solution of chromium, cobalt, aluminium, molybdenum, and tungsten in nickel. Particles of the γ’ phase (Ni3Al) are cubical. The relative volume of phase γ’ after standard alloy heat treatment is 31–34%. Heat treatment includes supersaturation and ageing. Air cooling during supersaturation already leads to the precipitates of fine particles of the γ’ phase, with their relative volume being ca. 20%. Ageing causes further precipitation of particles in the γ’ phase and expansion of previously precipitated ones. The relative volume of carbides in the alloy does not exceed 2%, with carbide M23C6 dominating. It is formed during heat treatment or is precipitated during operation, usually at grain boundaries, within a temperature range of 933 K–1253 K. The M6C carbide appears inside the grains [23].
3. Blade Heating in the Presence of Aviation Kerosene Exhaust Gases
3.1. Blade Heating Time Determination
Six turbine blades from a single manufacturing batch, made of a single EI-867WD melt, were tested in a laboratory. One of the blades was intended for preliminary studies to determine the heating time of the other five. The blades were then subjected to elevated temperature—heating in a chamber furnace in the presence of aviation kerosene exhaust gases. Aviation kerosene was combusted in a closed furnace with a blade submerged in it. Prior to and after heating, the blades were cleaned for 15 min using n-heptane in ultrasound washers to remove surface contaminations, deposits, and scale.
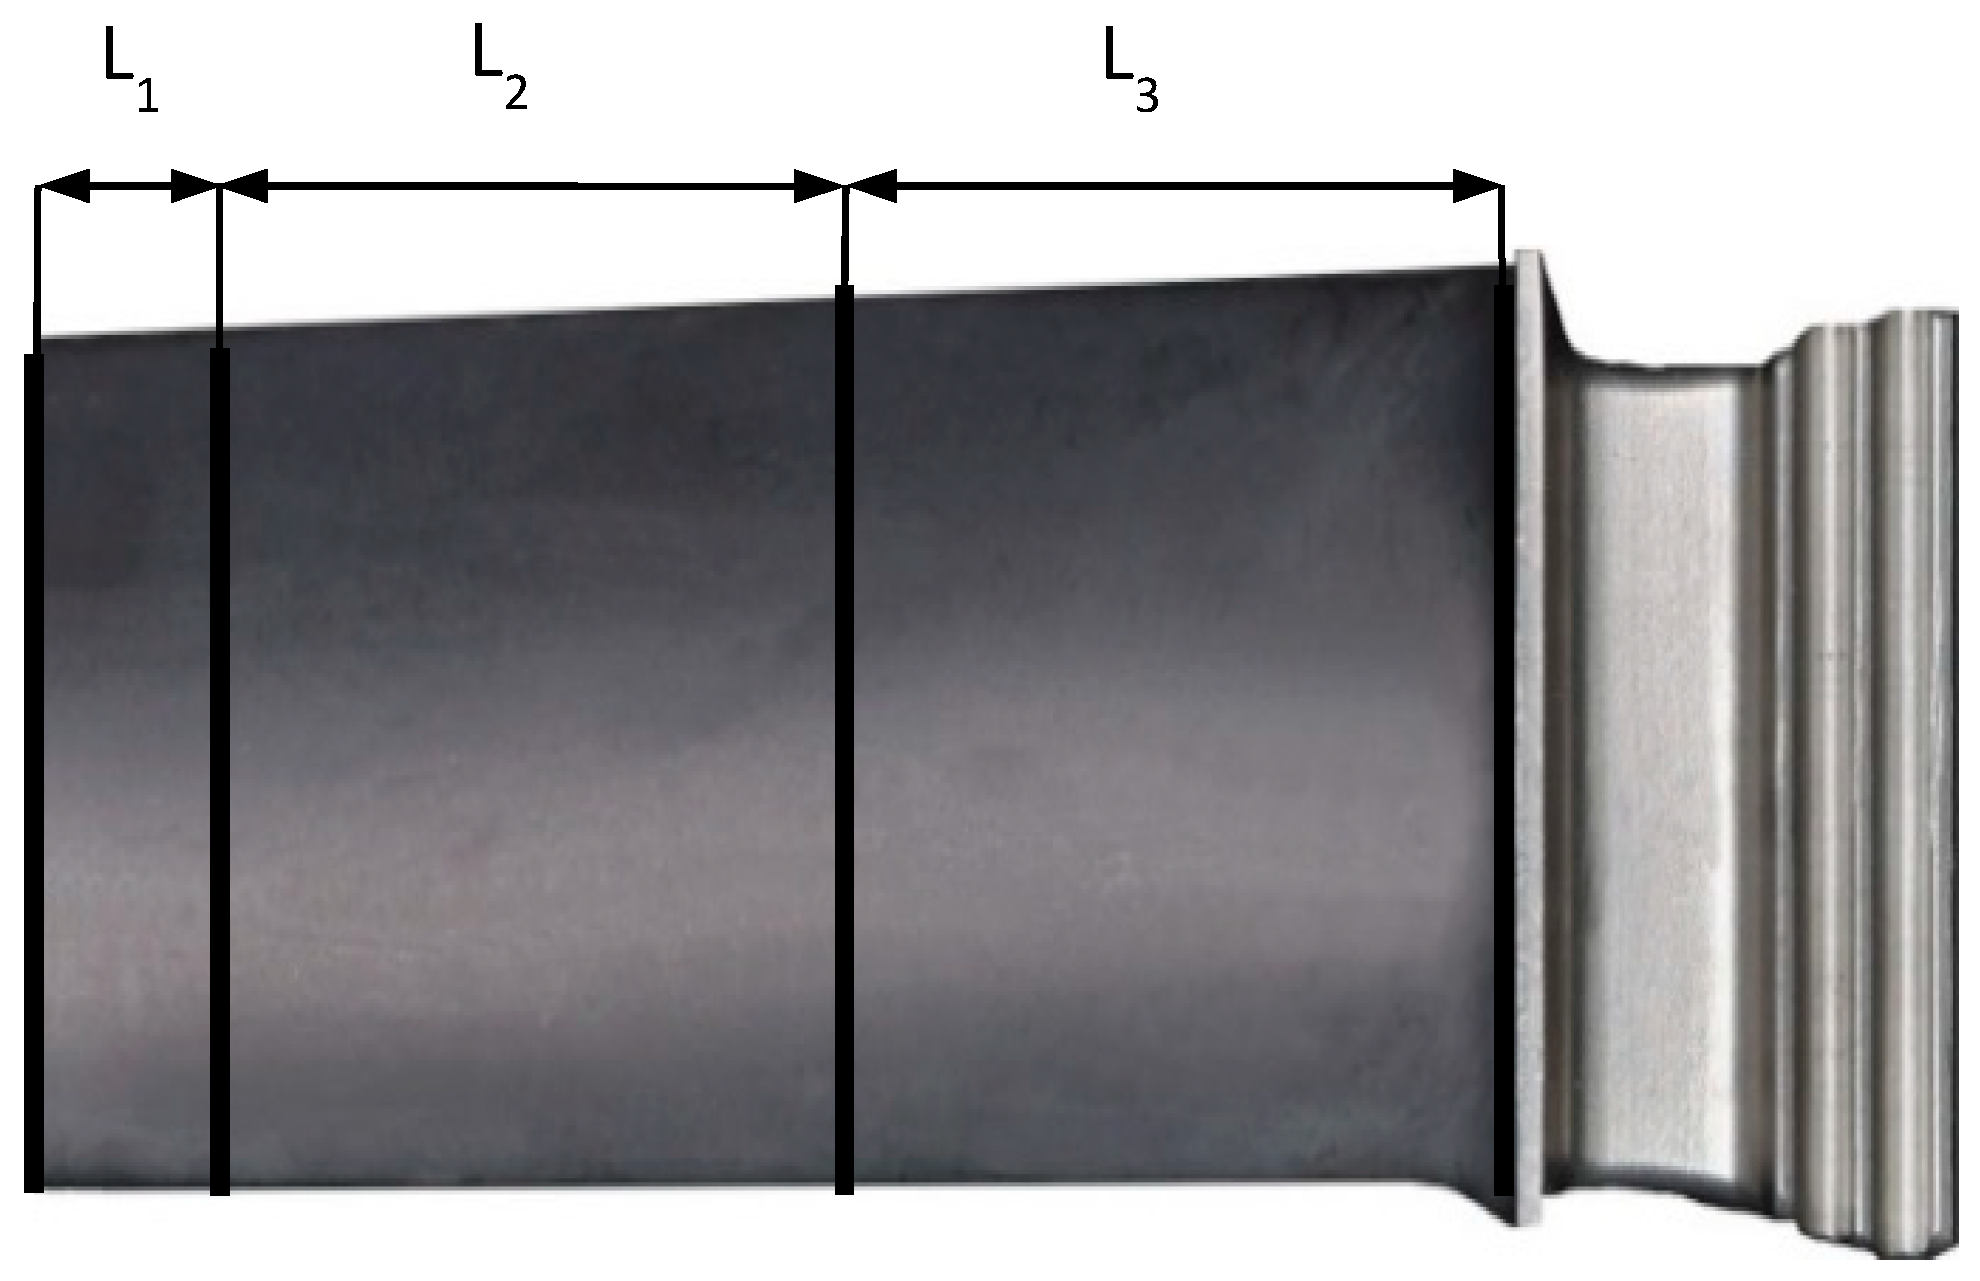
The first testing stage was determining the blade heating period. This parameter, together with temperature, impacts the γ’ phase particle coagulation and growth kinetics, as well as a change in the thickness of the blade’s protective coating thickness [24]. To this end, the authors conducted an experiment that involved heating blades at a temperature above T4max (maximum temperature downstream of the turbine), i.e., 1323 K for 2 h and 3 h. Such a heating time was determined pursuant to the results of analysing records of an S2-3ai recorder onboard a Ts-11 Iskra aircraft with an installed SO-3W engine, taking into account the profile of executed flights associated with its training purpose and the engine service life between repairs of 400 h. The interval between the second and third heating hours was considered as the total time of elevated temperature impact associated with engine operating range changes and its user adjustments. The samples were prepared using one of the blades, out of which three vane fragments were cut (Figure 3). The blade fragment designated as L1 = 7 mm was used to determine the primary blade structure, relative to which the structural changes of the L2 blade fragment (heated for 2 h) and the L3 blade fragment heated for 3 h at 1323 K were assessed. Samples were cut using a wire EDM machine. Heating was executed in an FCF 60 chamber furnace filled with continuously generated aviation kerosene exhaust gases. Blades were cooled in the furnace. General surface images of blade samples after heating at 1323 K for 2 h and 3 h are shown in Figure 4 [2,8].
Metallographic testing of blade material was conducted to determine the microstructure state after heating and determining the heating time. The samples were prepared using standard (cutting, mounting, grinding, polishing, surface etching) methods.
The microstructure was observed under a Nikon MA-200 optical microscope, Quanta 3D FEG and XL30 LaB6 scanning microscopes (SEM) made by Philips.
The average size of the γ′ phase precipitation was expressed as the diameter of a circle equivalent to the area of the measured irregular shape:
Averaged sample coating thicknesses for a new (nonheated) blade and after heating at T = 1323 K are:
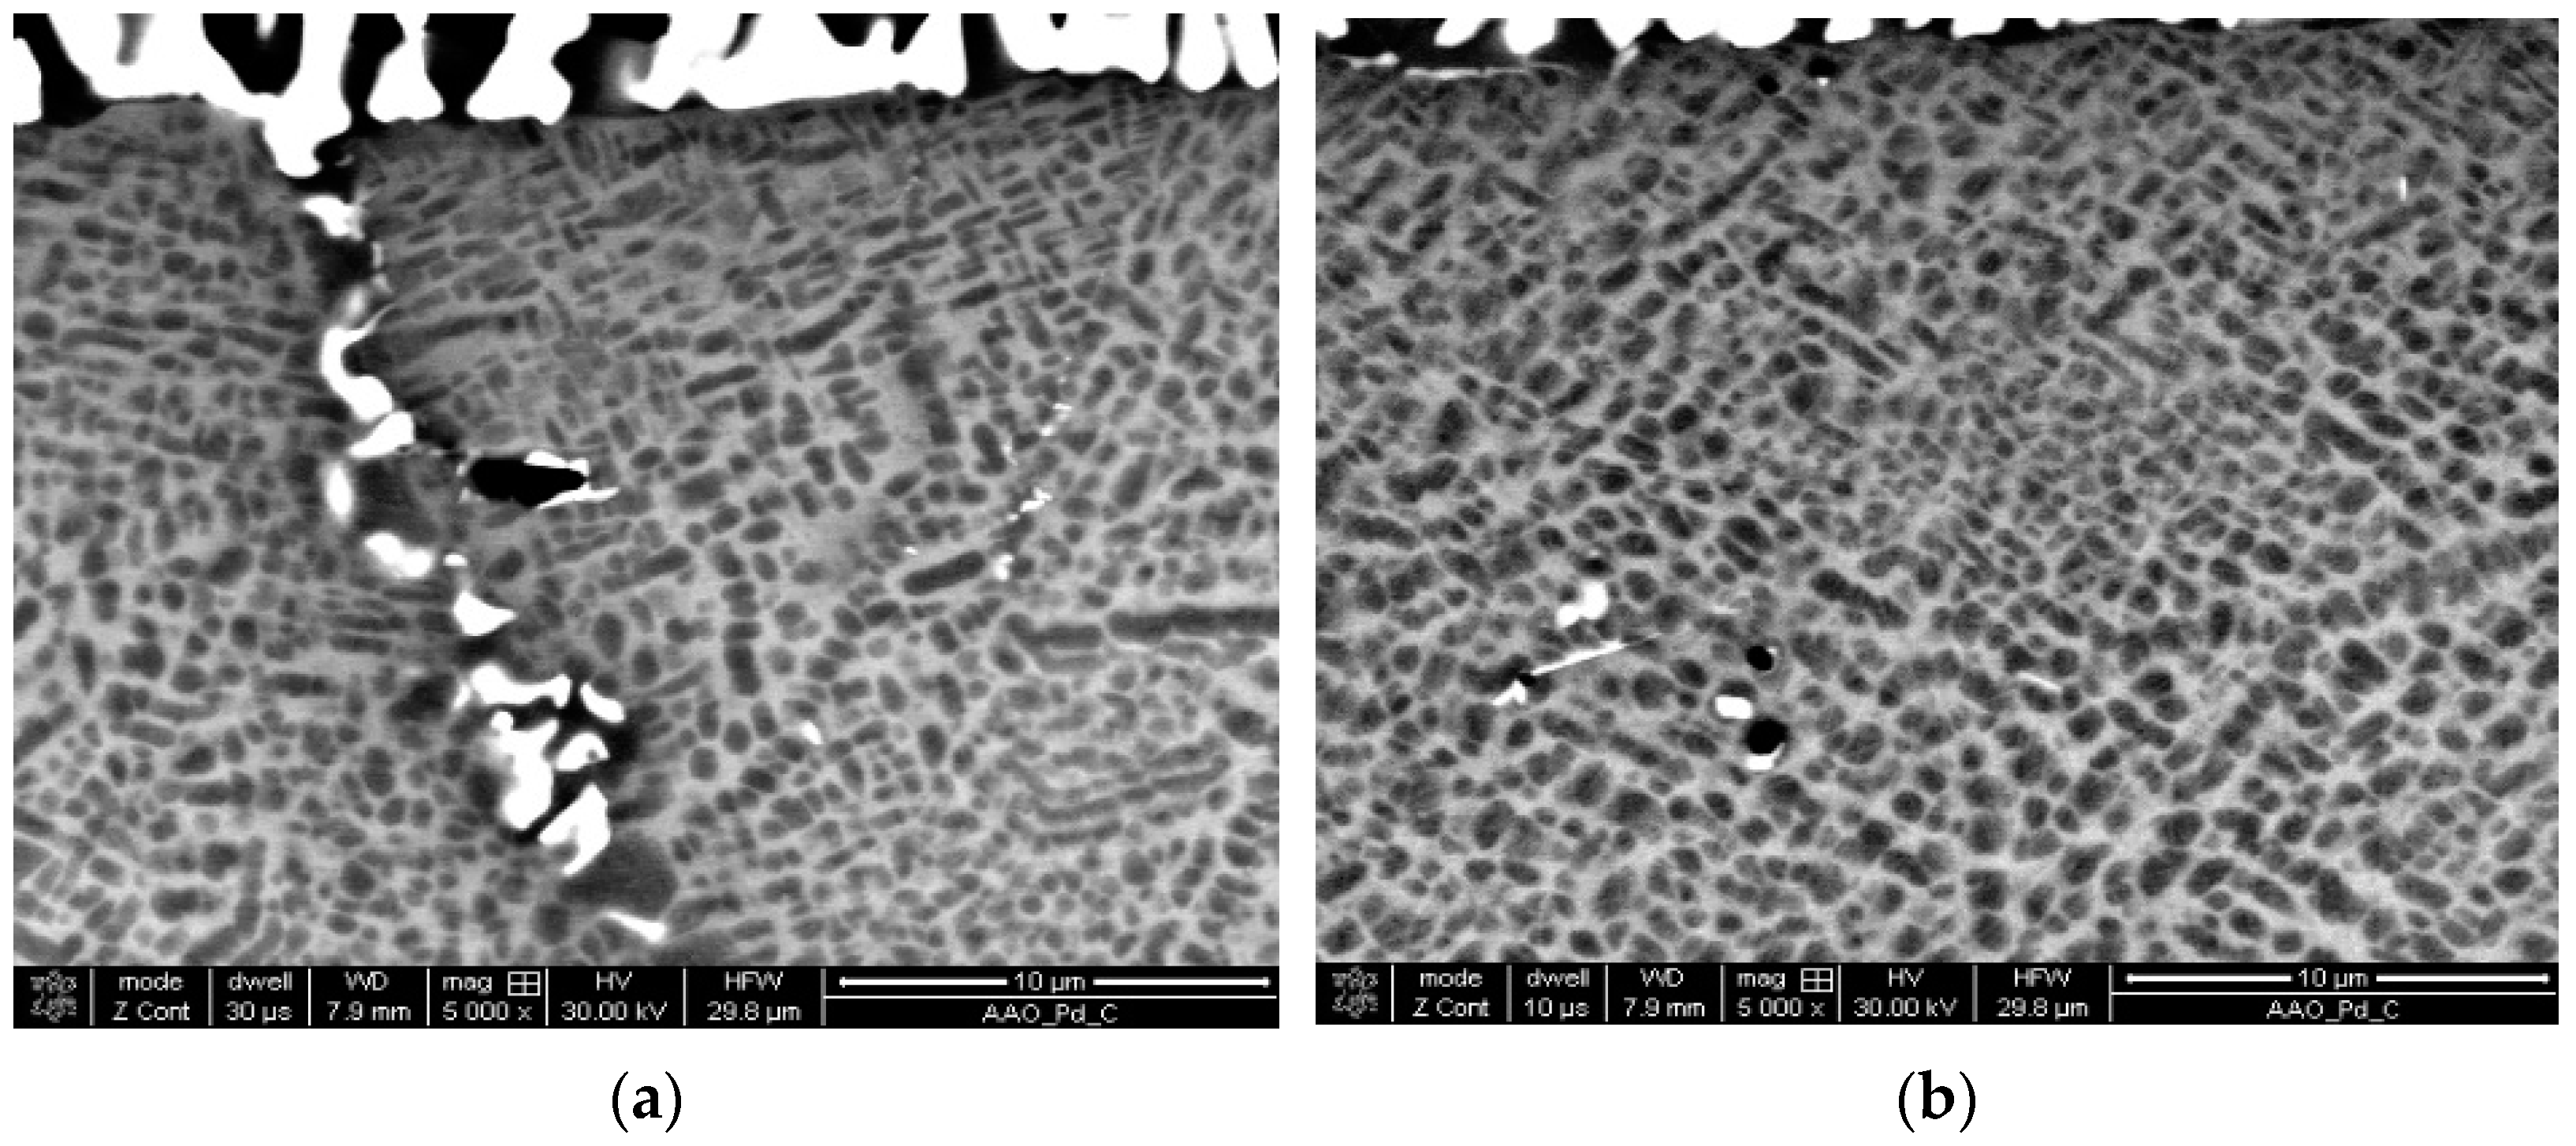
Phase γ’ precipitation morphology test results—heating at 1323 K for: (a) 2 h and (b) 3 h—are shown in Figure 5 [2,8]. It was concluded that the test duration did not significantly impact a change in the γ’ reinforcing phase morphology and essentially did not also lead to the increased thickness of the aluminide protective coating— see Figure 6 [2,8].
A sufficient heating time was experimentally determined at 2 h, with cooling in a furnace cooling down.
3.2. Blade Heating
Due to the experimentally determined heating time of 2 h, the following heating temperature parameters were adopted for individual blades:
- No. 5, T = 1123 K;
- No. 1, T = 1223 K;
- No. 2, T = 1323 K;
- No. 3, T = 1423 K;
- No. 4, T = 1523 K.
Individual samples numbered 5, 1, 2, 3, and 4 were heated in the FCF 60 chamber furnace, in an aviation kerosene exhaust gas atmosphere. The blades were placed in a holder made of a fragment cut out of the turbine disc to prevent sample contact with furnace lining material. Blades were heated successively for 2 h at specified temperatures. They were cooled down in the furnace until reaching ambient temperature. Due to the risk of damaging the furnace heating elements, it was impossible to simulate cooling of greater intensity, as is the case after shutting down a turbine engine, when the combustion process ceases and the compressor is still pumping air to the engine. The generated conditions made the samples cool down slightly longer than in a turbine engine.
4. Model for Assessing Gas Turbine Blade Condition Based on the Digital Processing of Their Surface Images
4.1. Image Acquisition and Parameters Describing Colour Changes of Tested Blade Surfaces Using an Optoelectronic System
Tested turbine blade surfaces, illuminated by a light source, are recognized by photosensitive detectors (CCD sensors with an optical system), owing to a secondary light source reflected from their surfaces. This enables the indirect diagnosis of a tested object, through the processing and analysis of data obtained in the form of digital images.
The CCD sensor counts incident photons (energy of incident light beams into individual pixels); it does not, however, distinguish colours. A colour filter consisting of three basic colours, namely, red, green and blue (RGB model), is located upstream of the very sensor. This model is based on a trichromatic vision theory, which assumes that any colour can be achieved by mixing only three selected light beams of appropriately selected spectrum width and in adequate proportions. The RGB model is an additive one, in which each colour is obtained through combining three primary colours (adding light with primary colours), and the colour is identified through three components.
Digital images processing involves analysing their histograms, which are graphs of successive pixel value occurrence. A histogram shows information on the range of brightness levels lk, as well as how numerous these levels are. It is assumed that the first histogram element is numbered 0 and the last one is equal to the number of image brightness levels:
The histogram is represented as a vector with a length corresponding to the number of image brightness levels, which can be expressed as follows:
where: —number of points with a grey or colour level and
To make the values contained in the histogram independent of the image size, a standardized histogram relative to the total number of pixels in the image is used:
where: M, N—image dimensions.
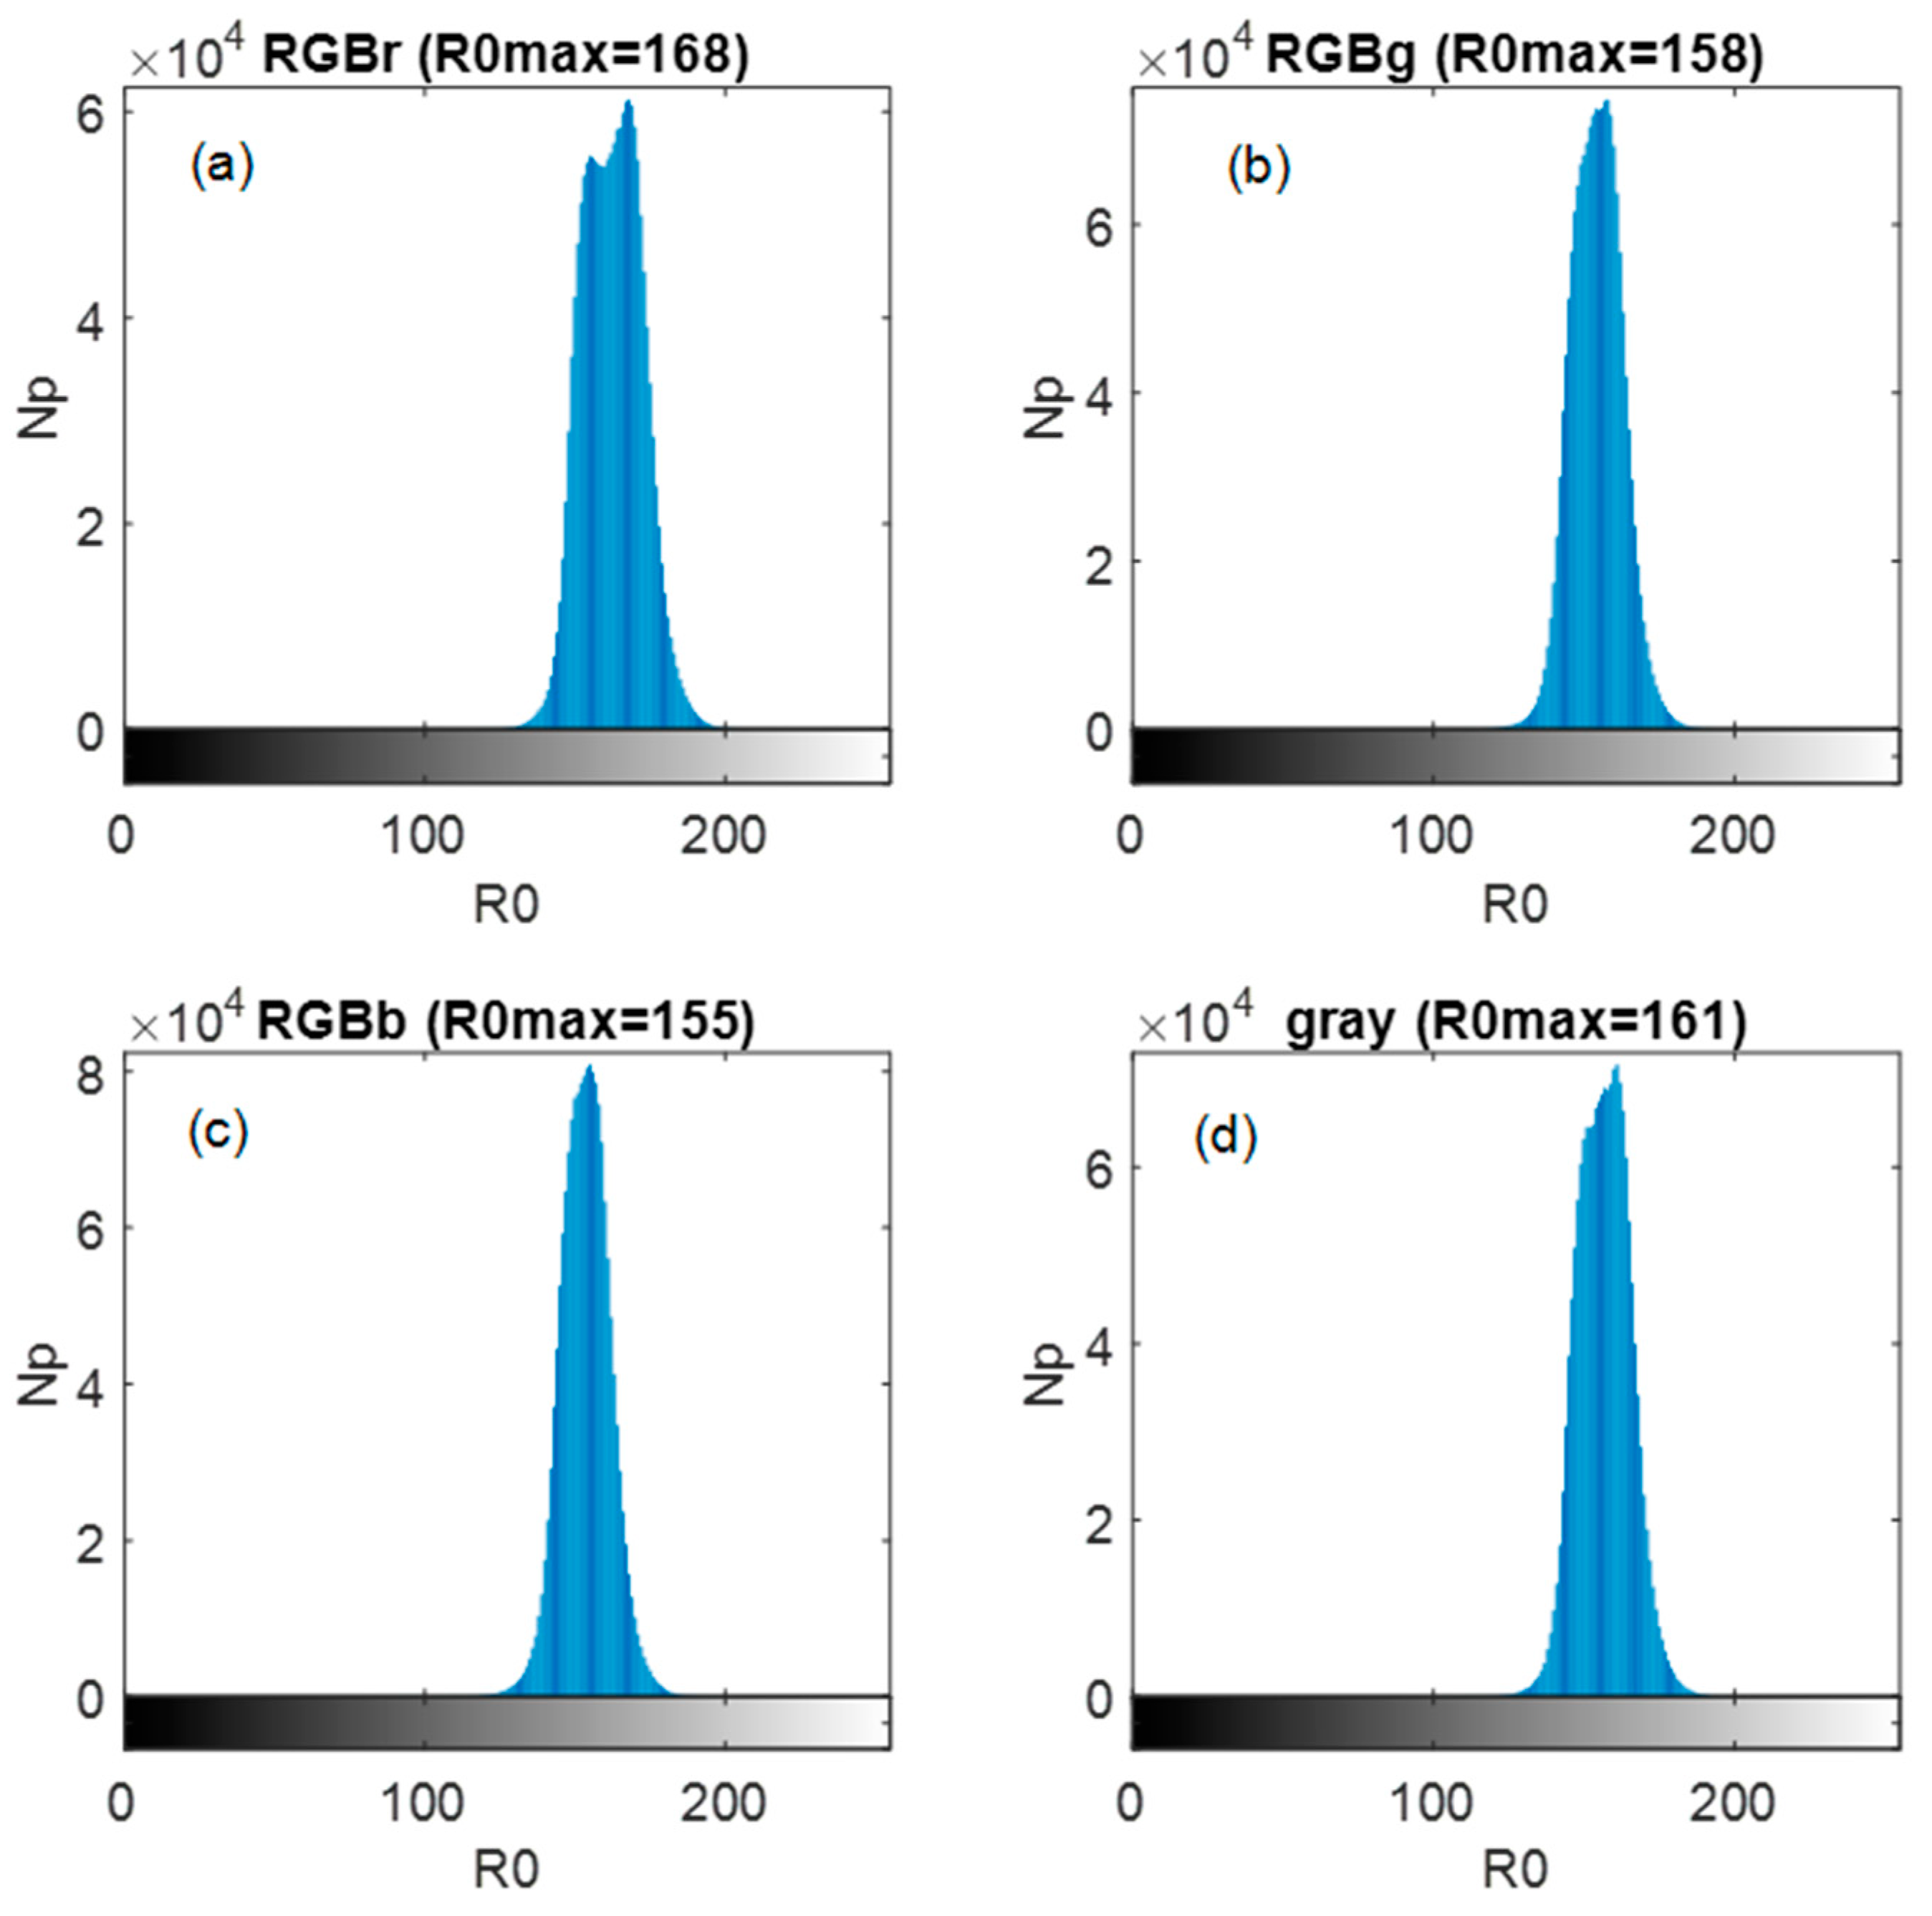
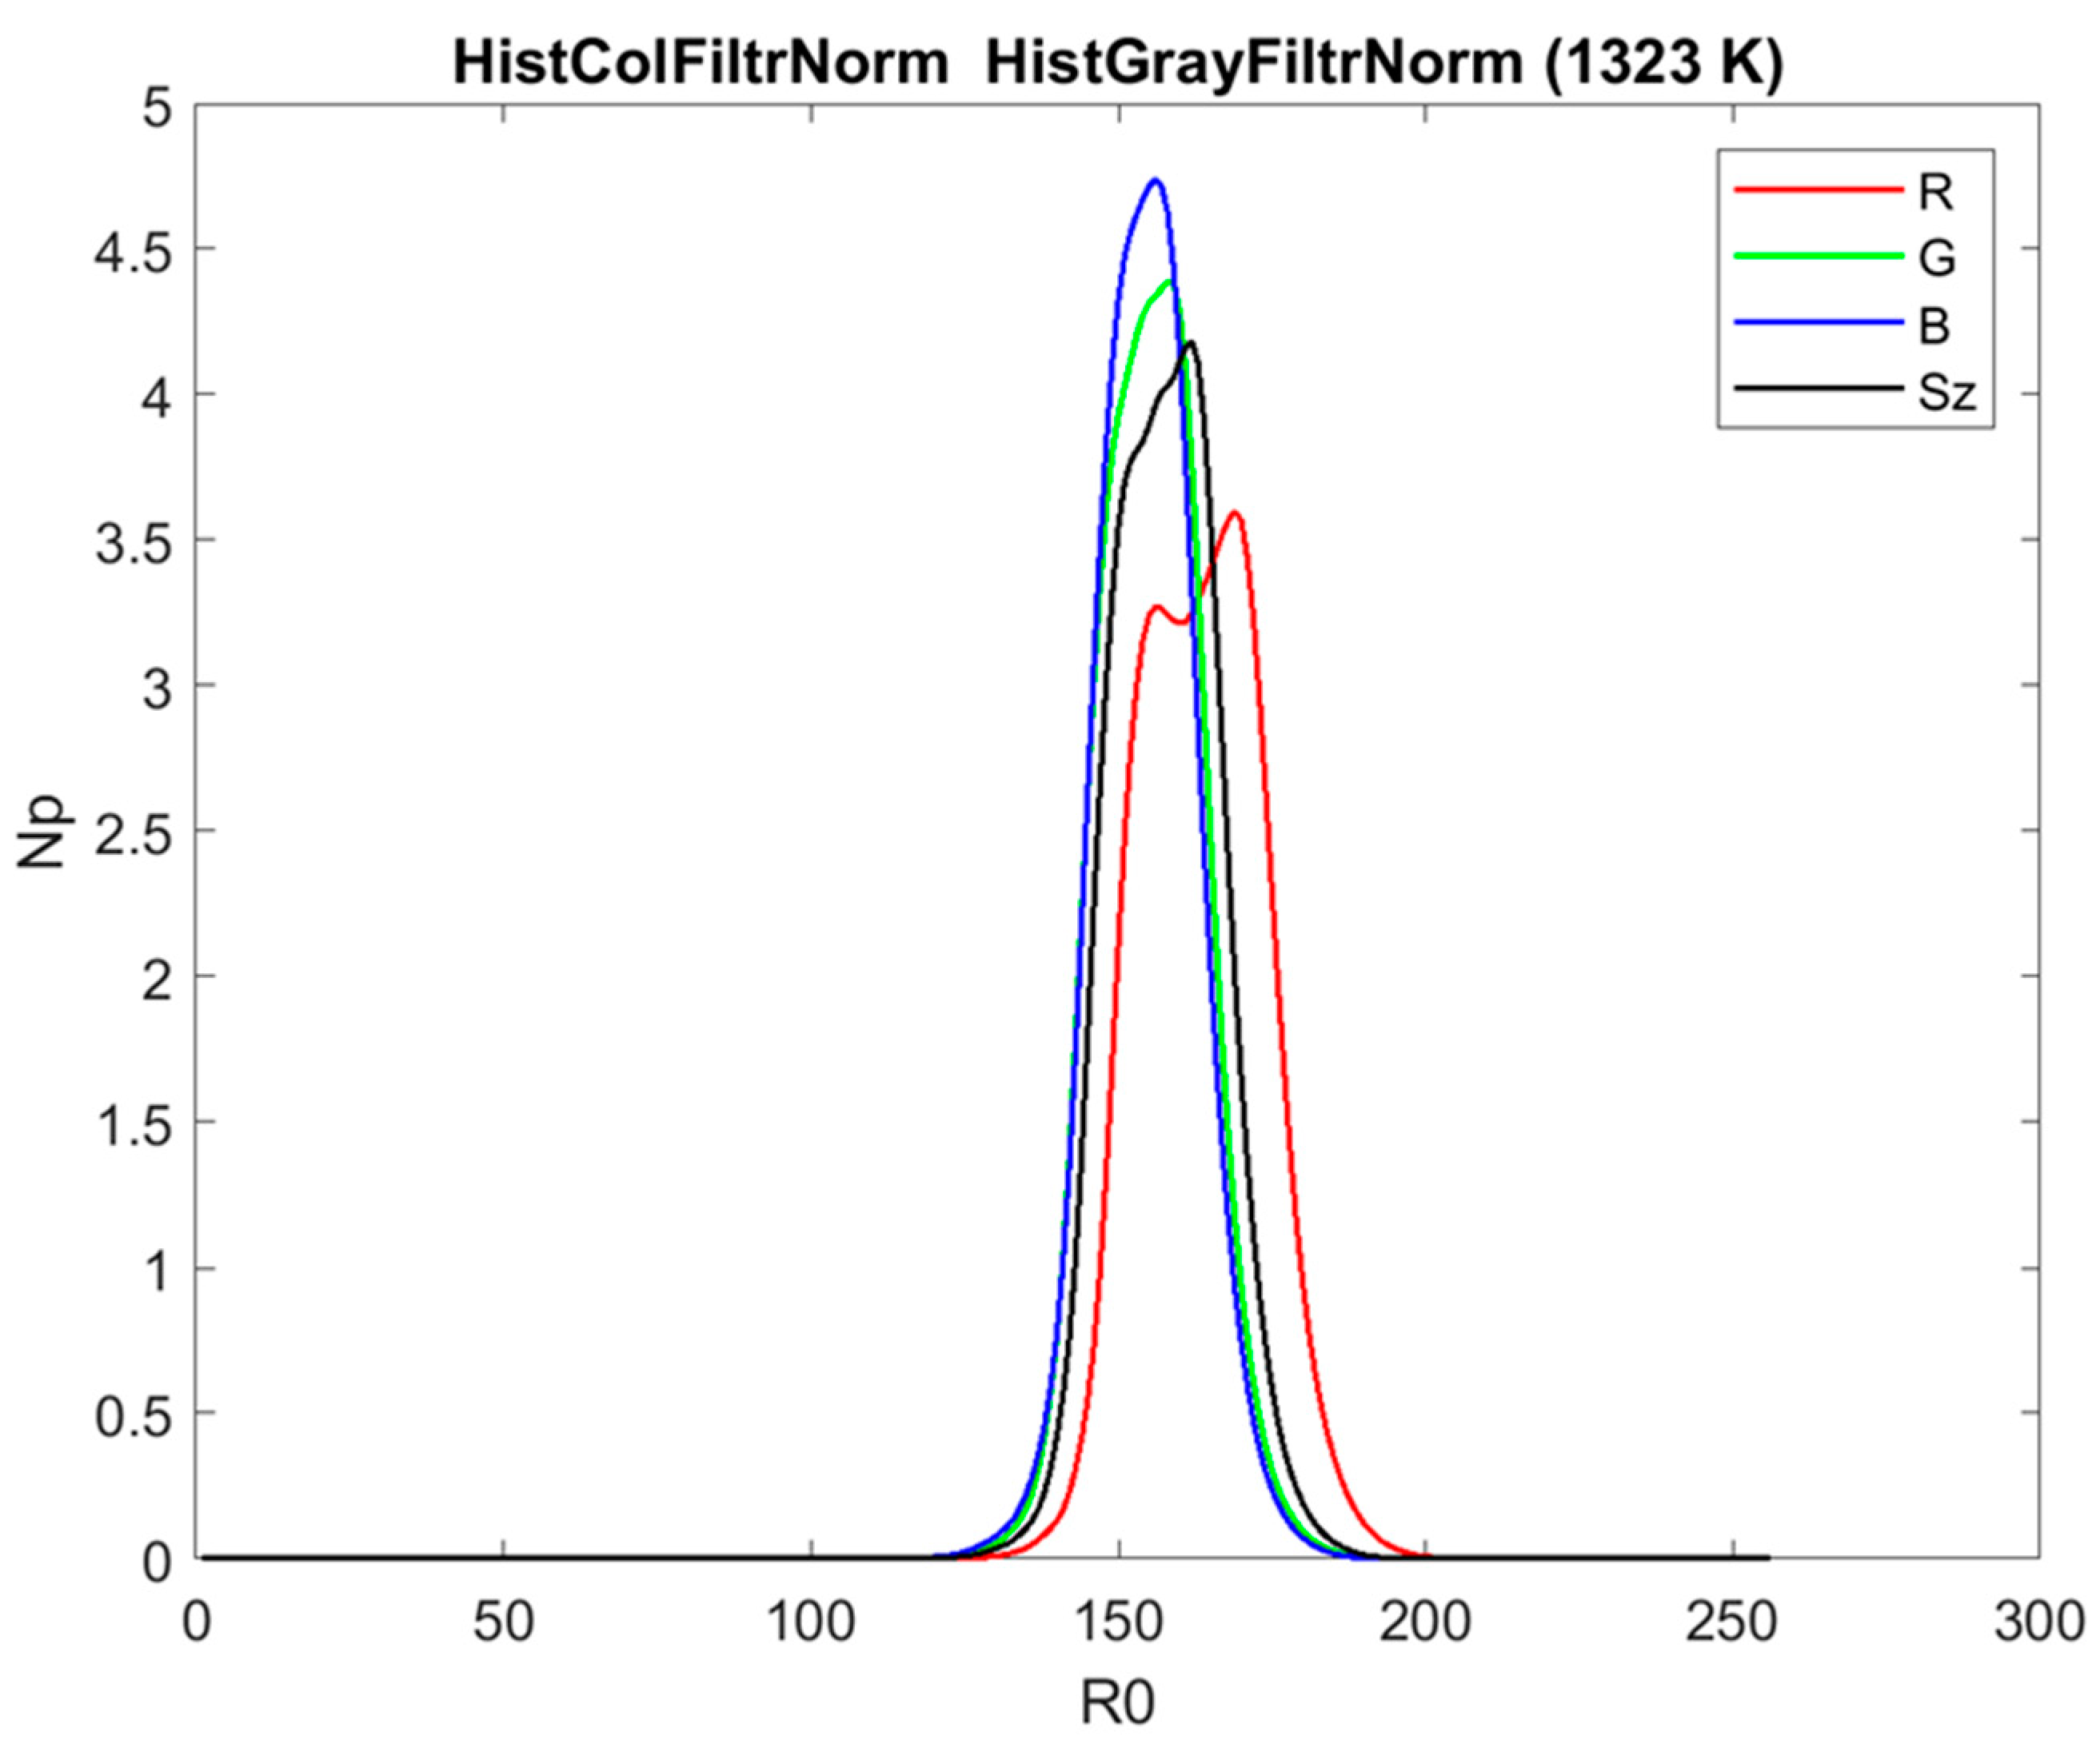
Figure 8 presents the histograms of all image components—colour (R, G, B) and greyscale (Sz).
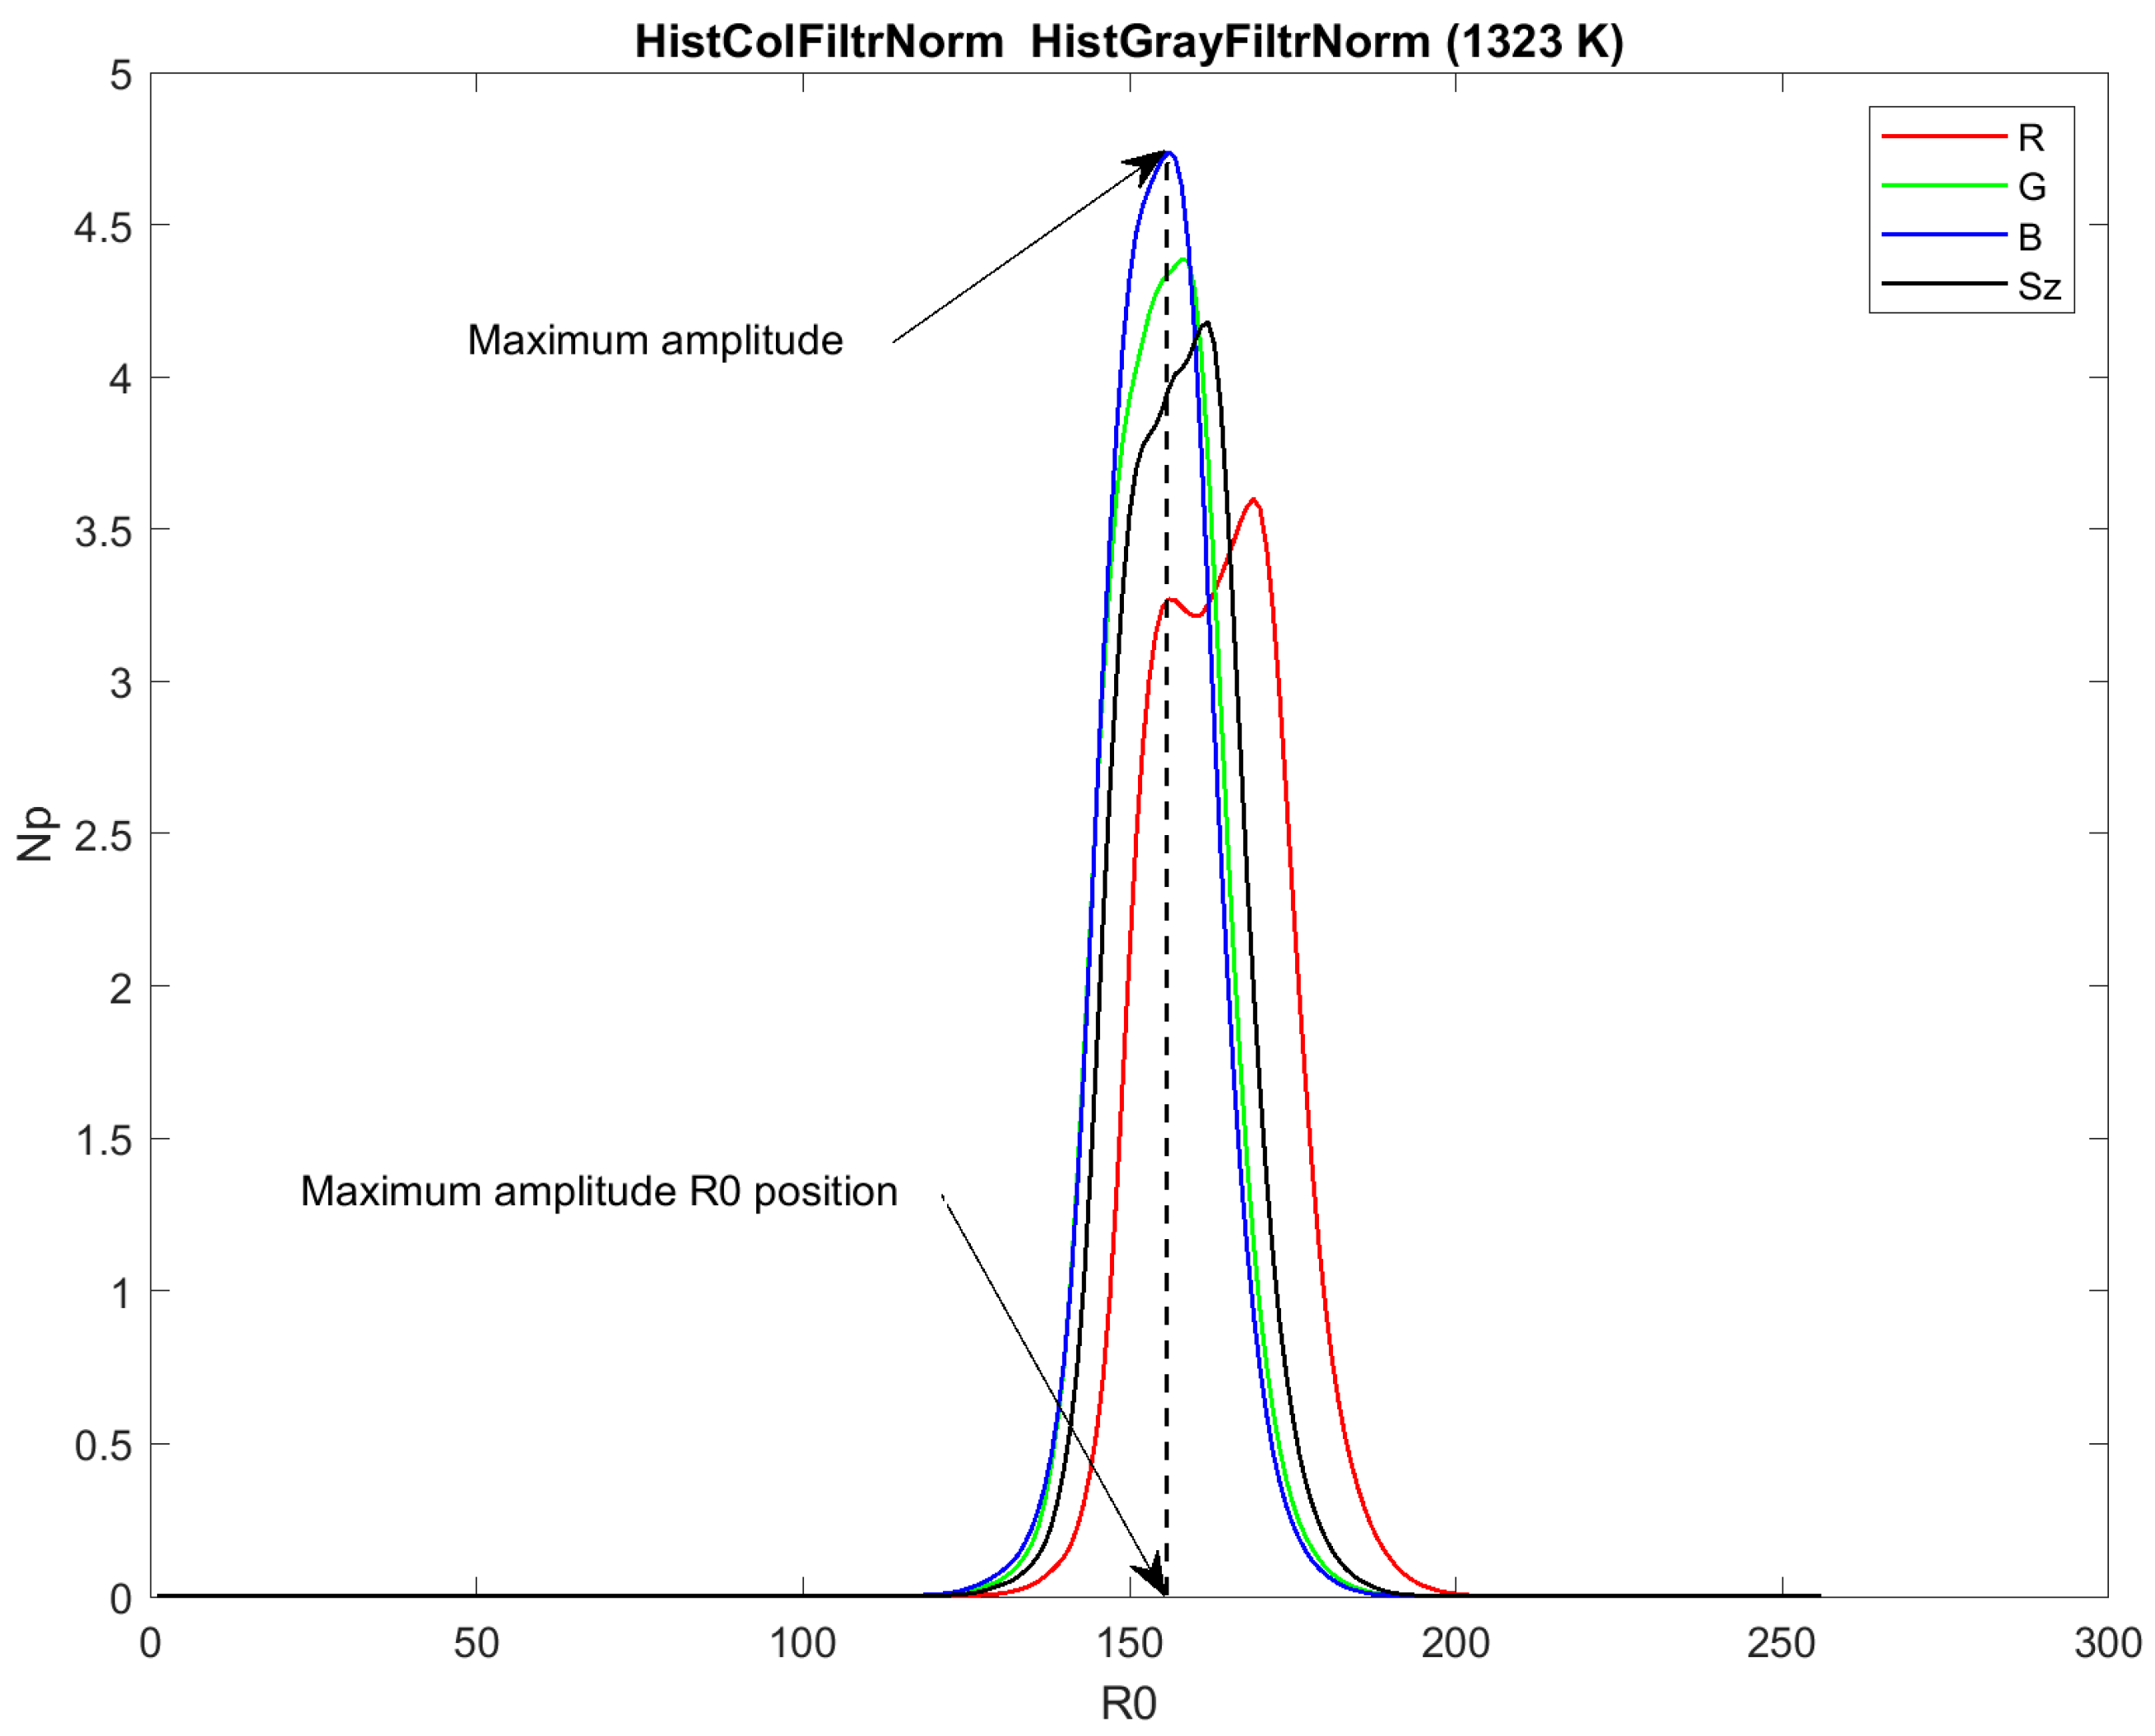
The parametric histogram description involves determining the position R0max of the maximum amplitude of each colour and greyscale component and each heating temperature.
The change of R0max as a function of heating temperature approximated by polynomials carries diagnostic information. It is a base to calculate the temperature point derivative providing monotonous waveforms, clearly describing colour changes of the tested surfaces.
4.2. Heated Blade Surface Image Analysis
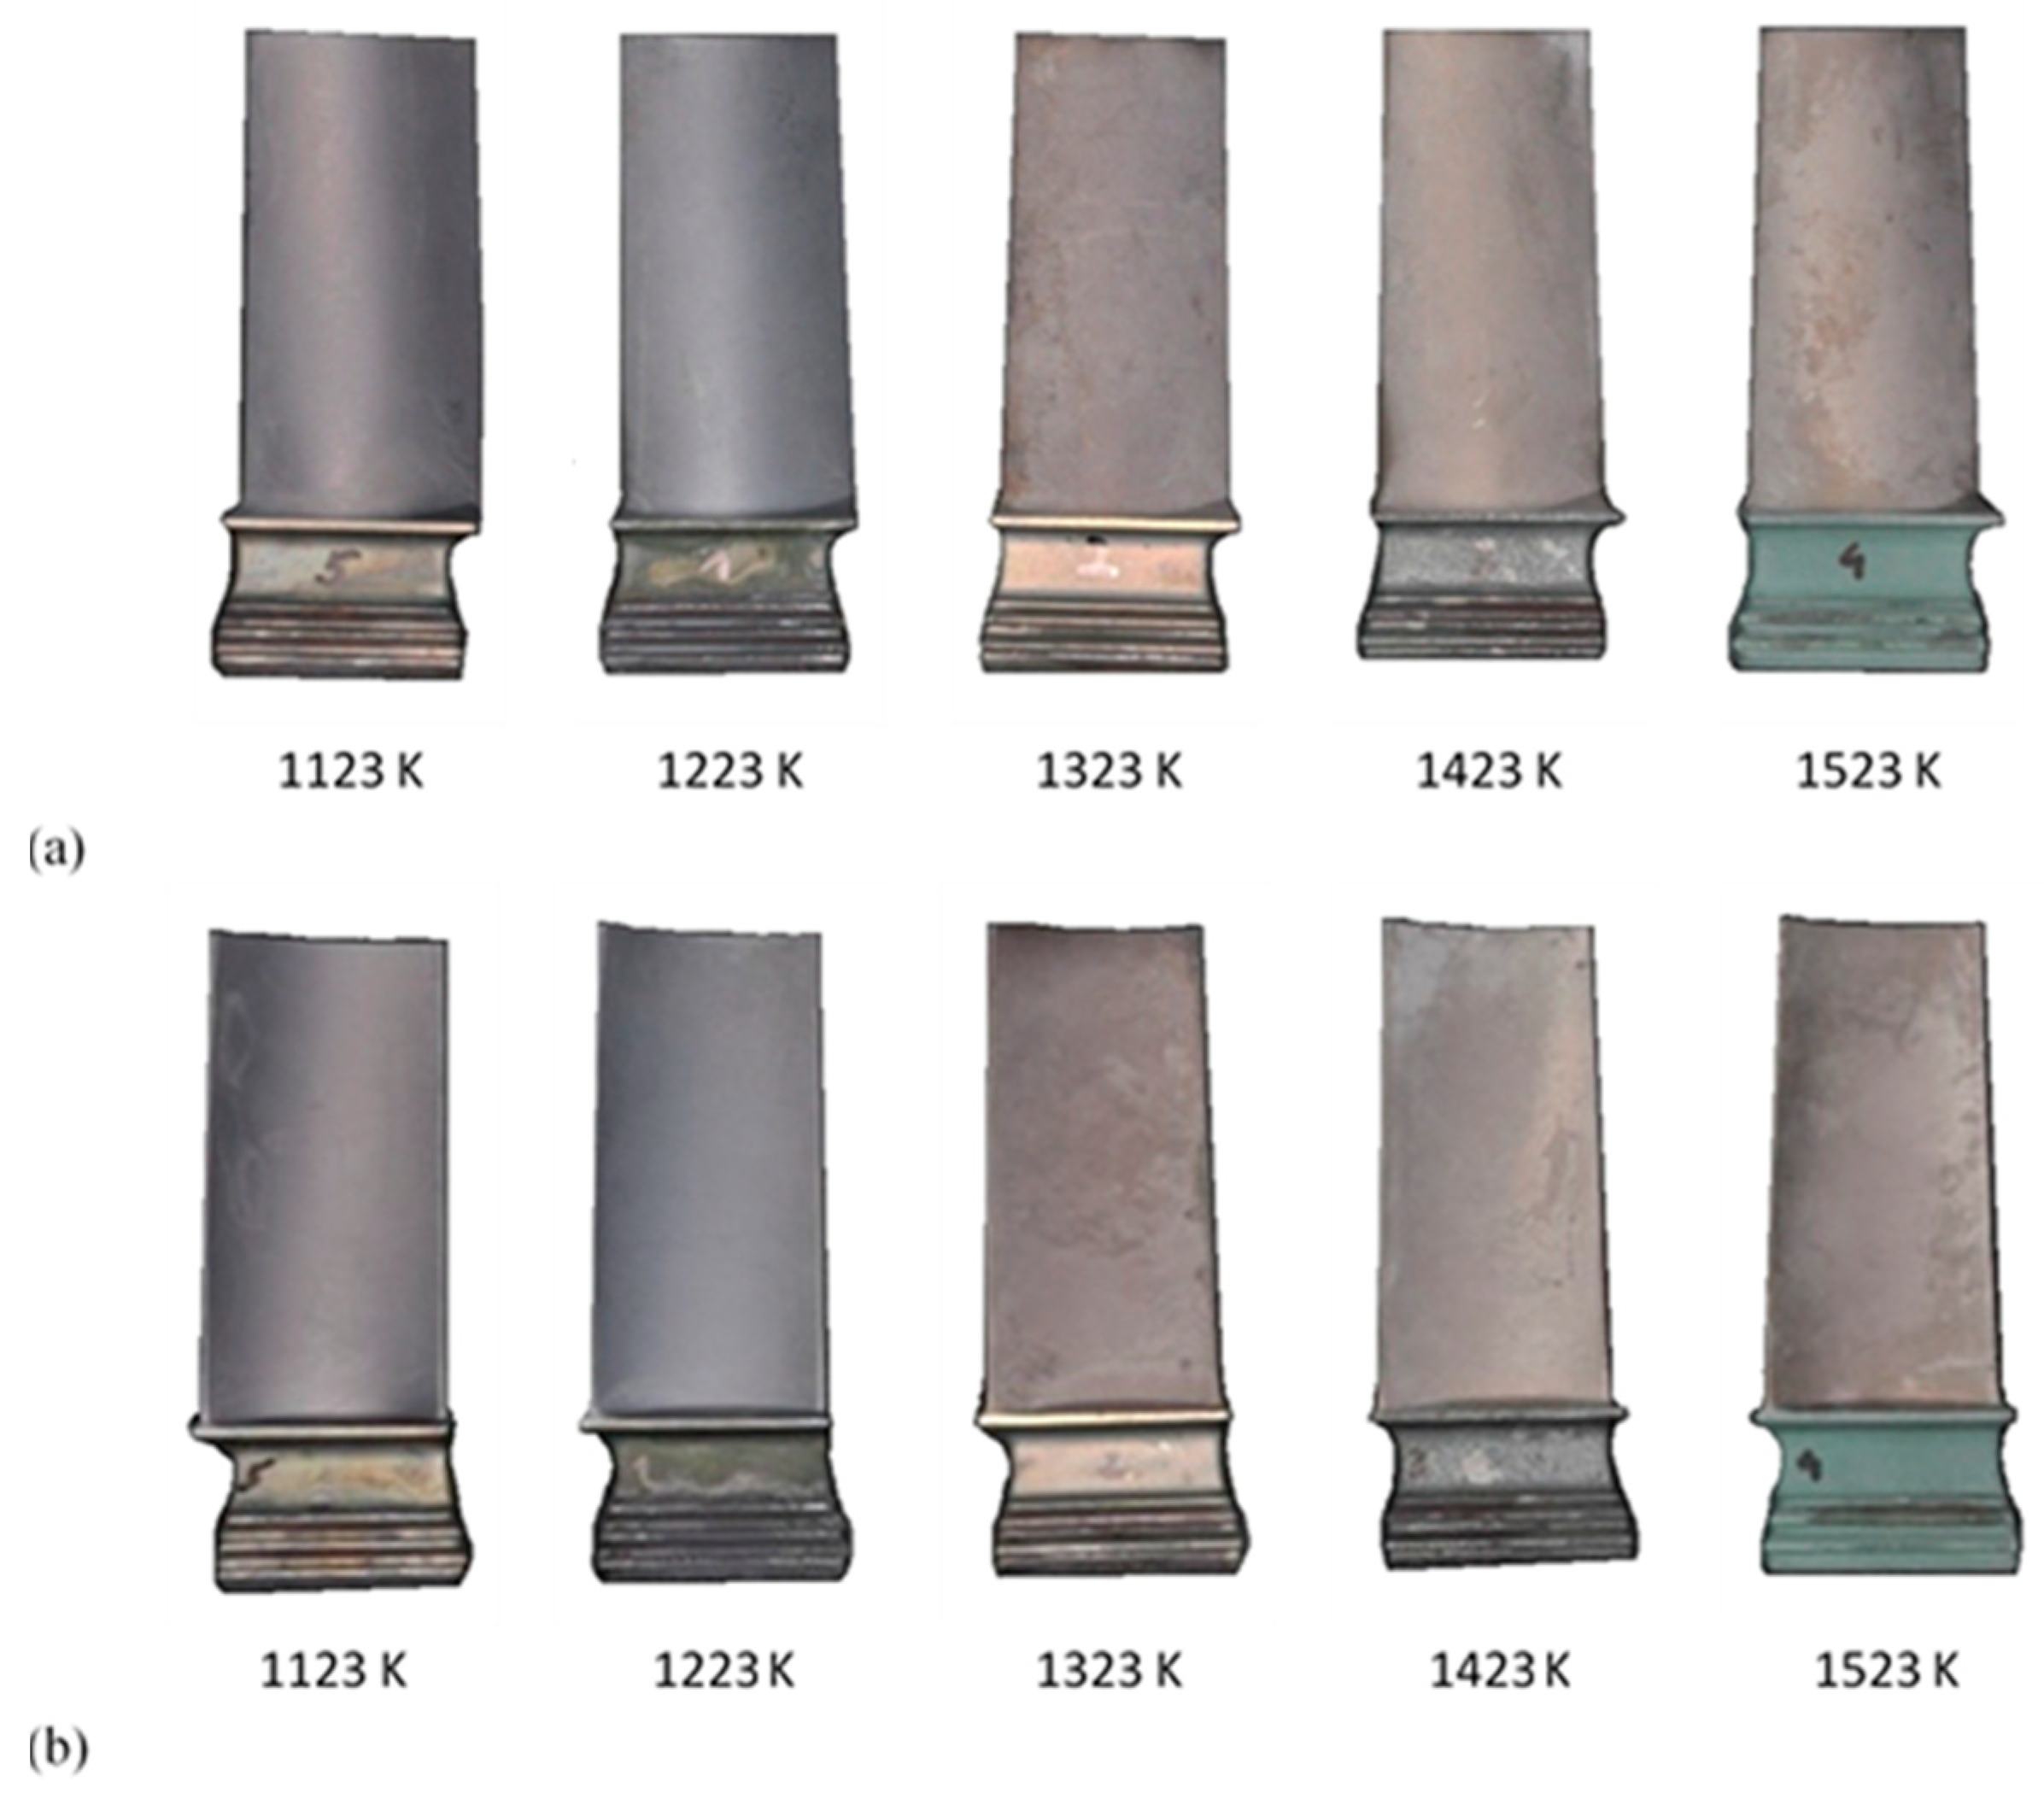
A Nikon D900 digital camera was used to record surface images of heated turbine blades. Result repeatability was ensured through taking digital photos under identical laboratory conditions. A significant change in the surface colour was observed due to heating new blades in a furnace at different temperatures (Figure 7).
The blade image analysis presented in the form of pseudocode using MATLAB and Image Processing Toolbox functions [25,26] consists of the following stages:
1. Loading the ‘image.jpg’ image into the RGB variable xx
RGB = imread(‘image.jpg’);
2. An RGB image to grayscale RGBgray convertion
RGBgray = rgb2gray(RGB);
% Grayscale image analysis
3. Determination of RGBgray image statistics
Mean: miGray = mean(RGBgray)
Standard deviation: stdGray = std(RGBgray)
4. RGBgray image histograms
HistGray = imhist(RGBgray)
[maxR0Gray, ind] = max(HistGray);
NasR0Gray = ind−1;
Histogram normalization
HistGrayNorm = HistGray/(M*N)*100;
[maxR0GrayNorm, ind] = max(HistGrayNorm);
NasR0GrayNorm = ind−1;
Histogram smoothing
HistGrayNormFiltr = smooth(HistGrayNorm, spanWygl,’sgolay’, degreeWygl);
[maxR0GrayNormFiltr, v] = max(HistGrayNormFiltr);
NasR0GrayNormFiltr = v−1;
% Color image analysis in RGB space
5. Decomposition of the RGB image into color components (RGBr, RGBg, RGBb)
[RGBr, RGBg, RGBb] = imsplit(RGB);
6. Determination of RGB image component statistics
Mean:
miRGBr =mean(RGBr), miRGBg =mean(RGBg), miRGBrb = mean(RGBb),
Standard deviation:
stdRGBr =std(RGBr), stdRGBg =std(RGBg), stdRGBrb = std(RGBb),
7. Histograms of RGB image components
RGBr component
HistRGBr =imhist(RGBr)
[maxR0RGBr, ind] = max(HistRGBr);
NasR0RGBr = ind−1;
% Histogram normalization
HistRGBrNorm= HistRGBr /(M*N)*100;
[maxR0RGBrNorm, ind] = max(HistRGBrNorm);
NasR0RGBrNorm = ind−1;
% Histogram smoothing
HistRGBrNormFiltr = smooth(HistRGBr Norm,spanWygl,’sgolay’, degreeWygl);
[maxR0RGBrNormFiltr, v] = max(HistRGBrNormFiltr);
NasR0RGBrNormFiltr = v−1;
RGBg component
… as RGBr
RGBb component
… as RGBr
% Multidimensional RGB colour image histogram:
HistCol = [HistRGBr, HistRGBg, HistRGBb]
HistColNorm = [HistRGBrNorm, HistRGBgNorm, HistRGBbNorm]
HistColNormFiltr = [HistRGBrNormFiltr, HistRGBgNormFiltr, HistRGBbNormFiltr]
Proprietary computer software developed in the MATLAB environment [25,26] were employed for analysis purposes. Diagnostic features of recorded surface images are presented in the form of brightness distribution histograms for individual colour components (R, G, B) and grayscale Sz.
Histogram parameters: the position of the maximum amplitude (saturation values for RGB colour), averaged image values, and maximum amplitude value were calculated for the tested image fragment.
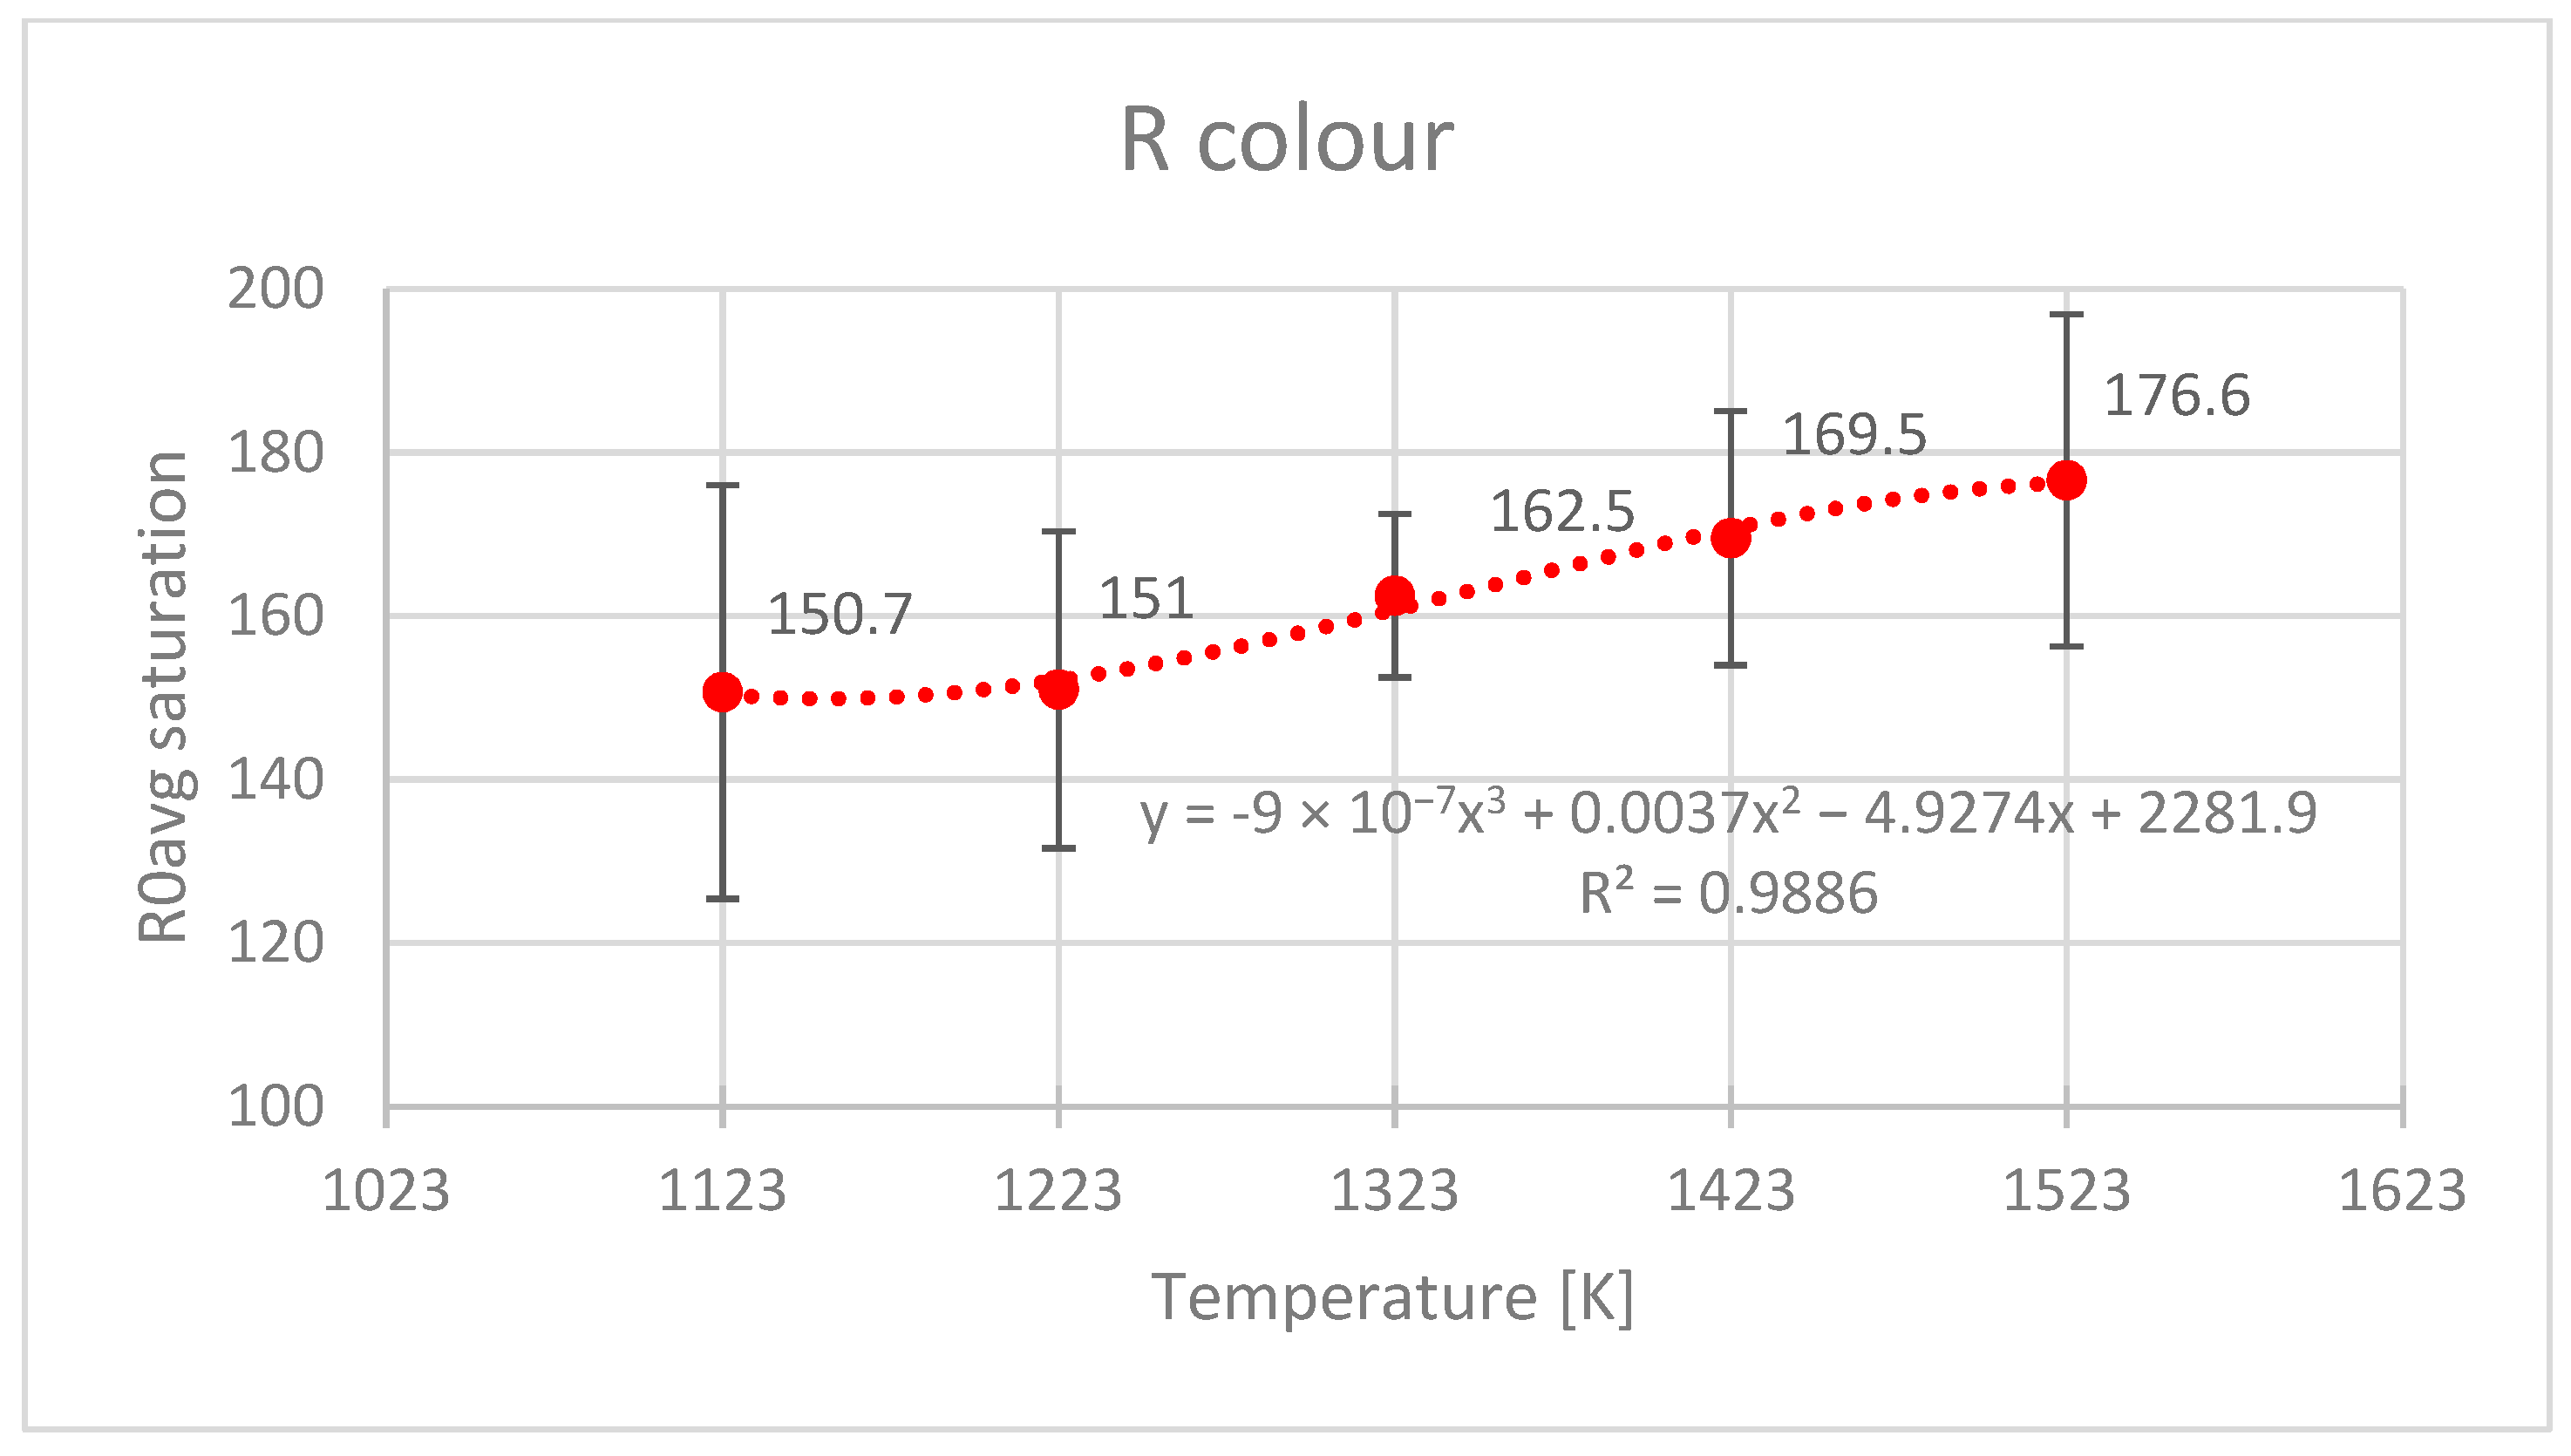
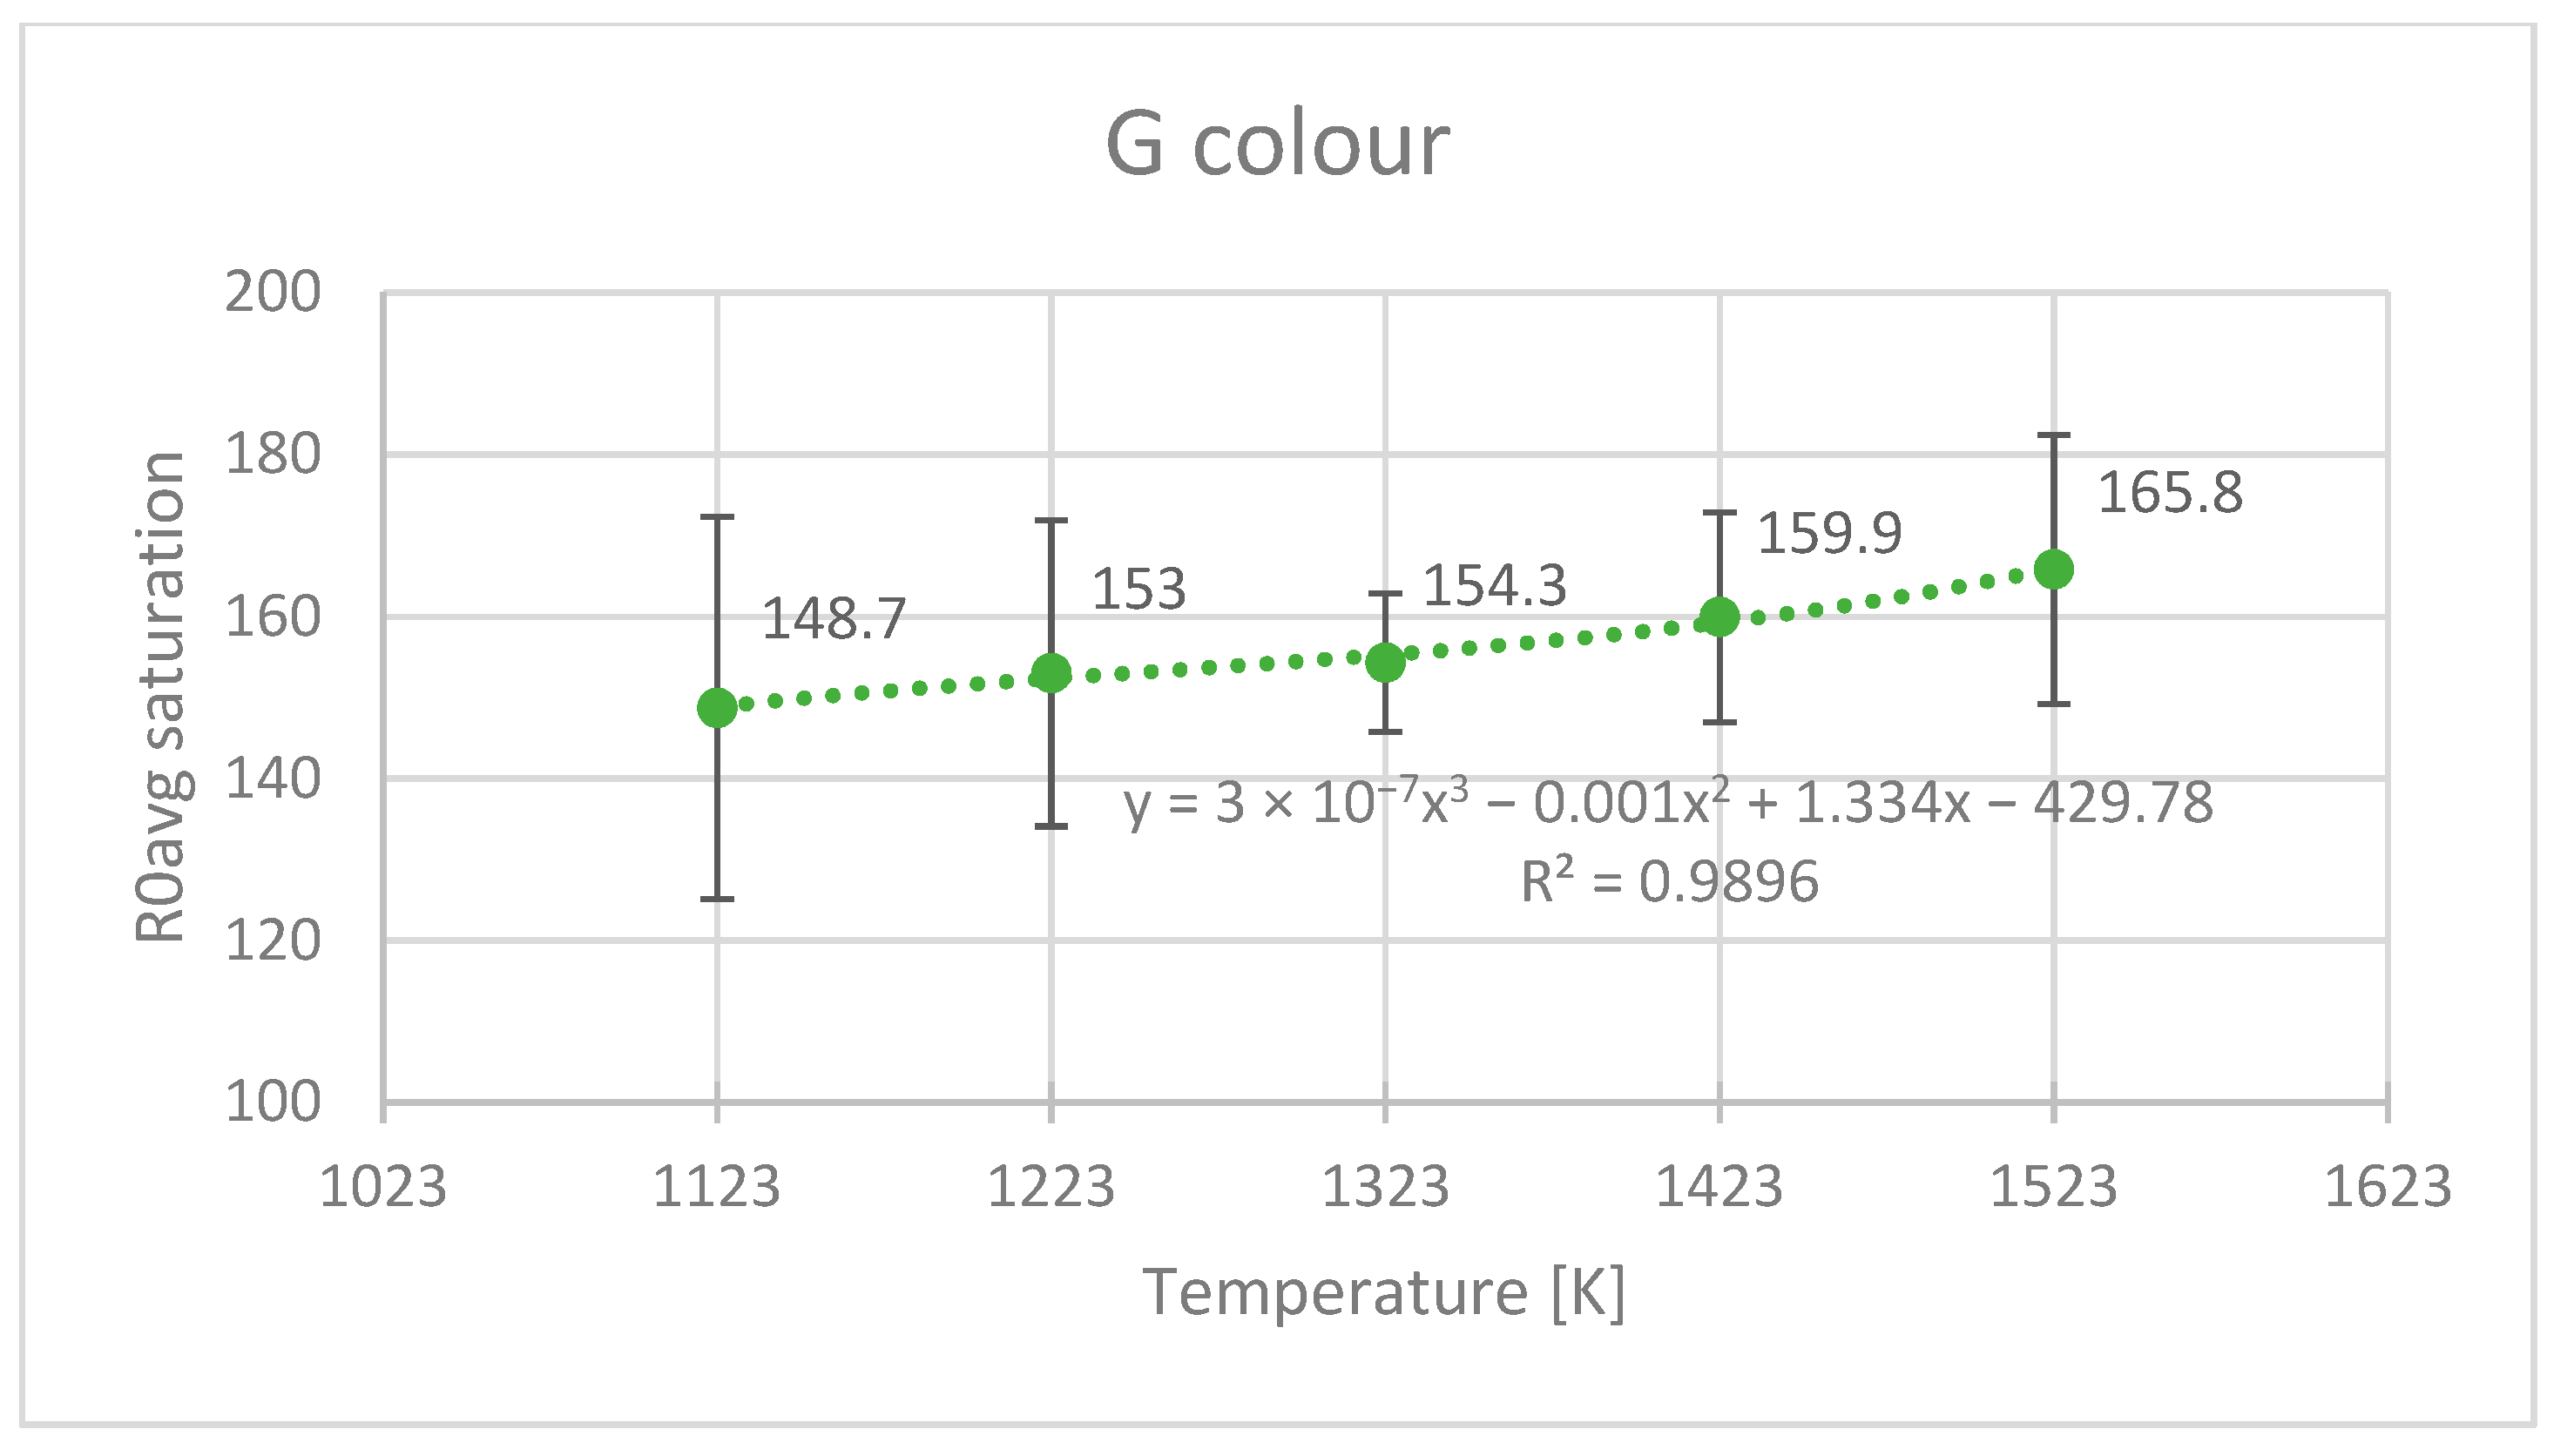
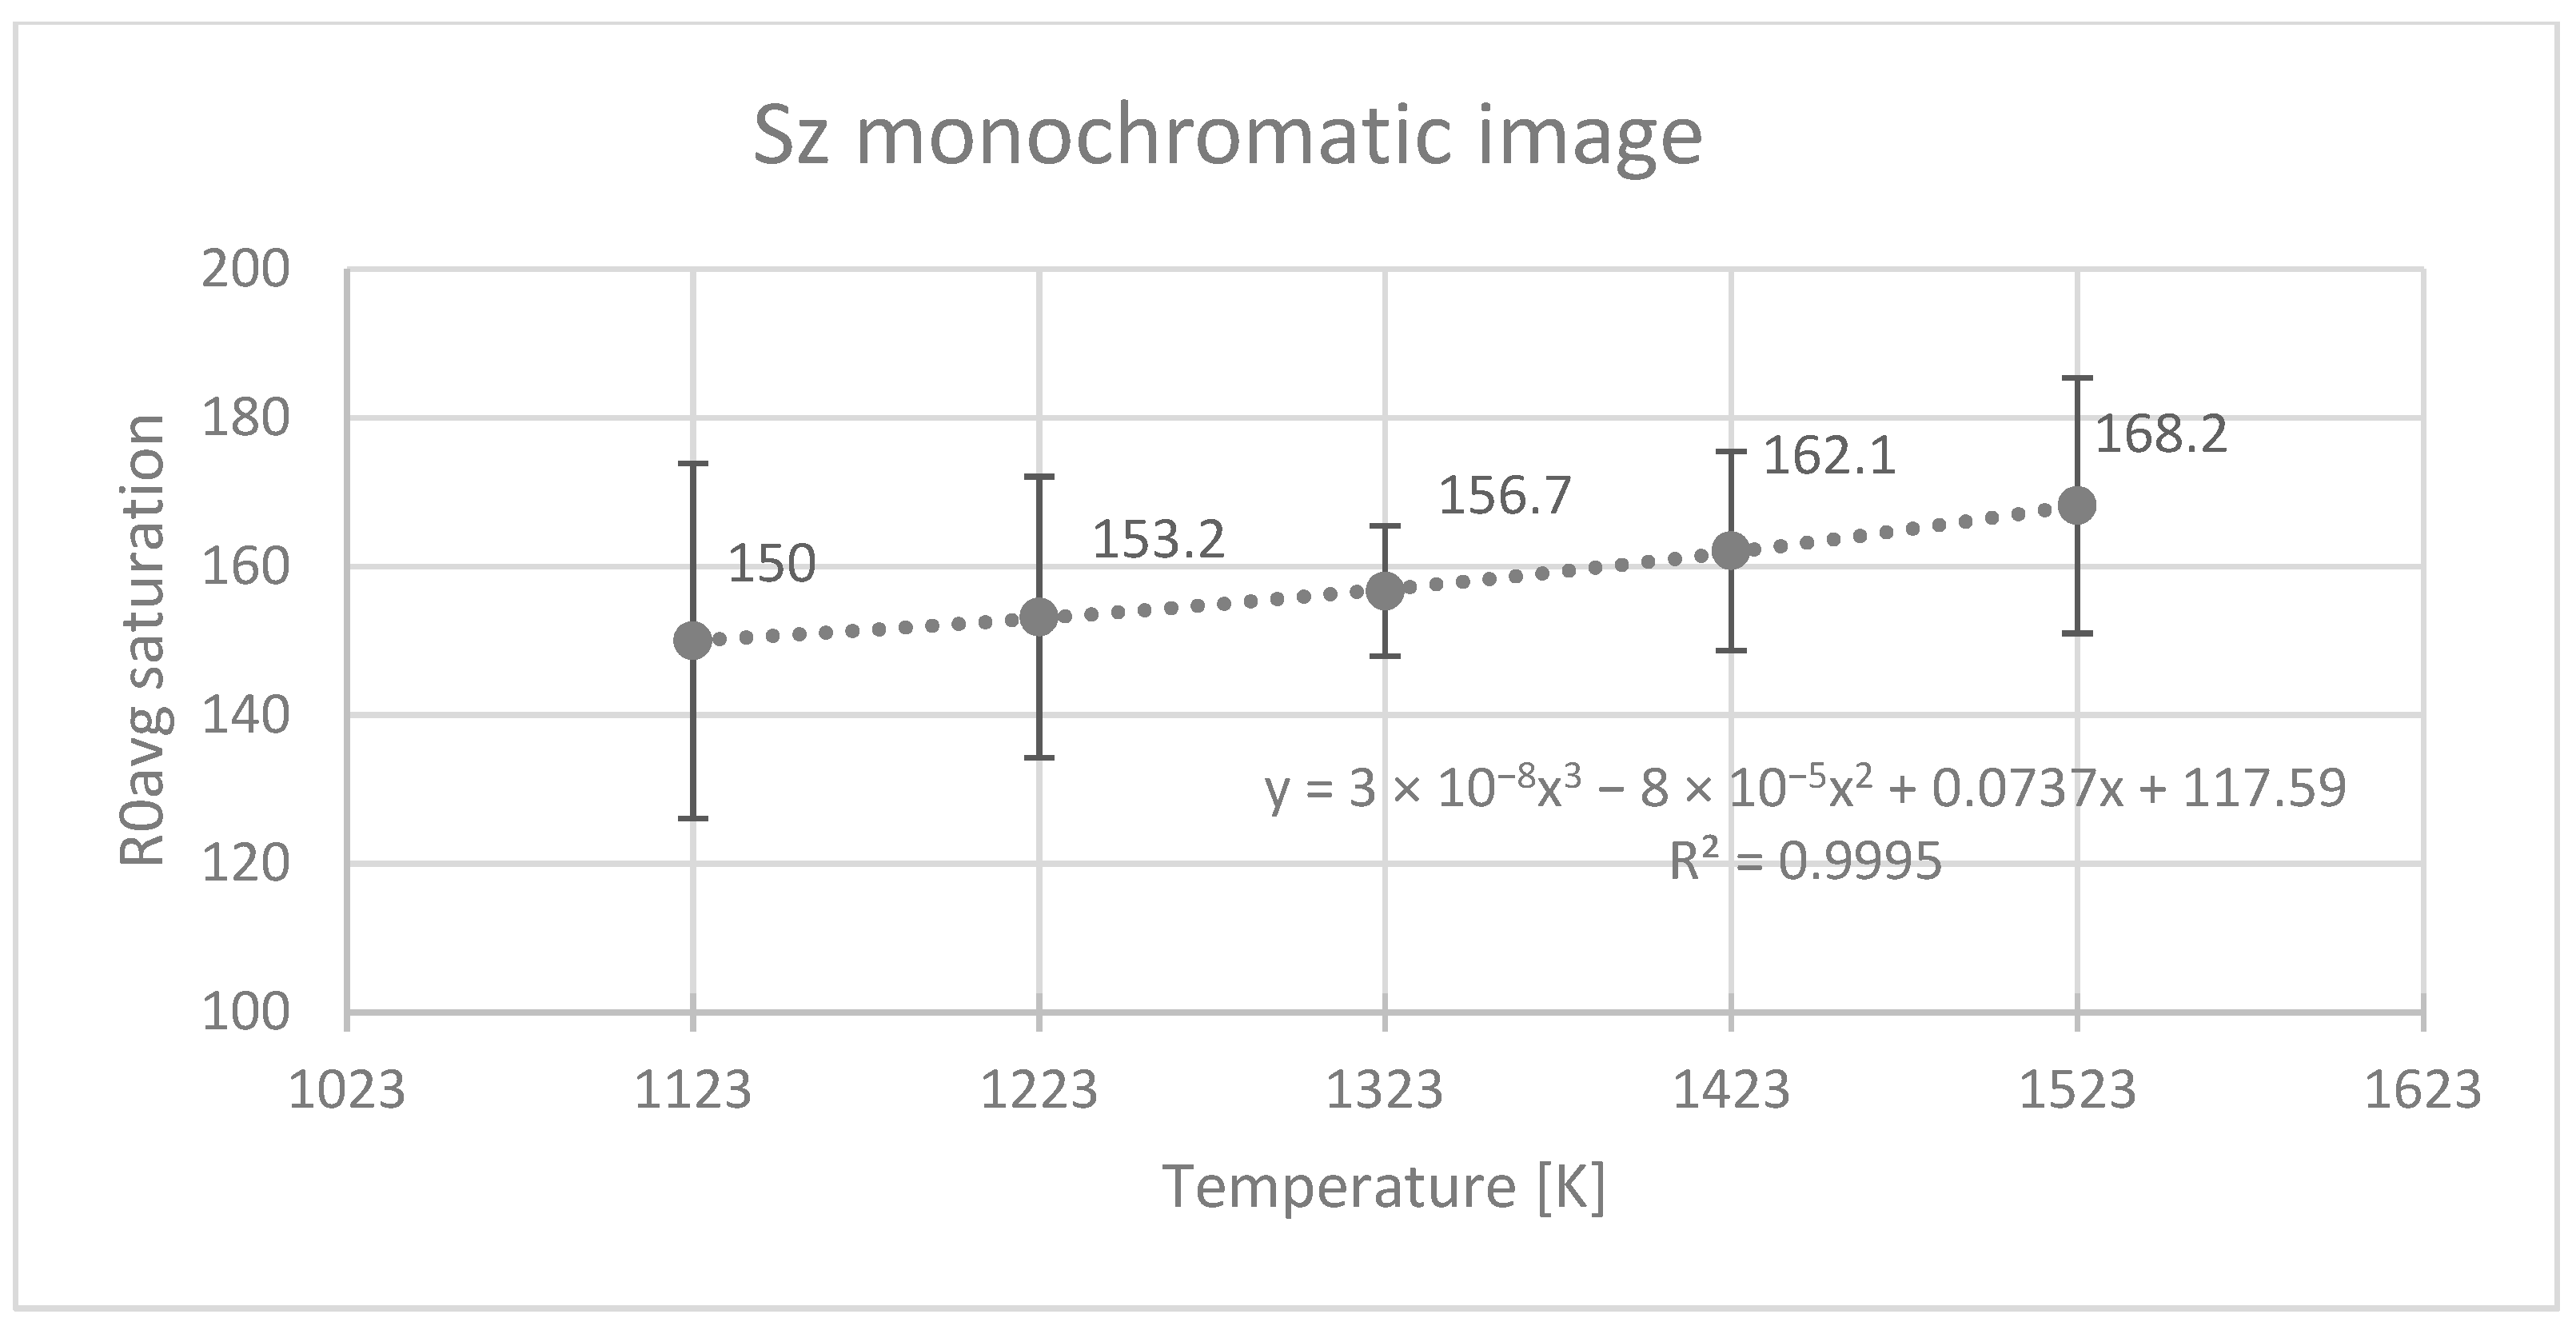
The R0 saturation values (average and maximum amplitude position) are sufficient to describe colour changes in the acquired images. Such an approach is justified both by the recording method and obtained results. Figure 9, Figure 10 and Figure 11 show examples of blade surface images and their histograms [8].
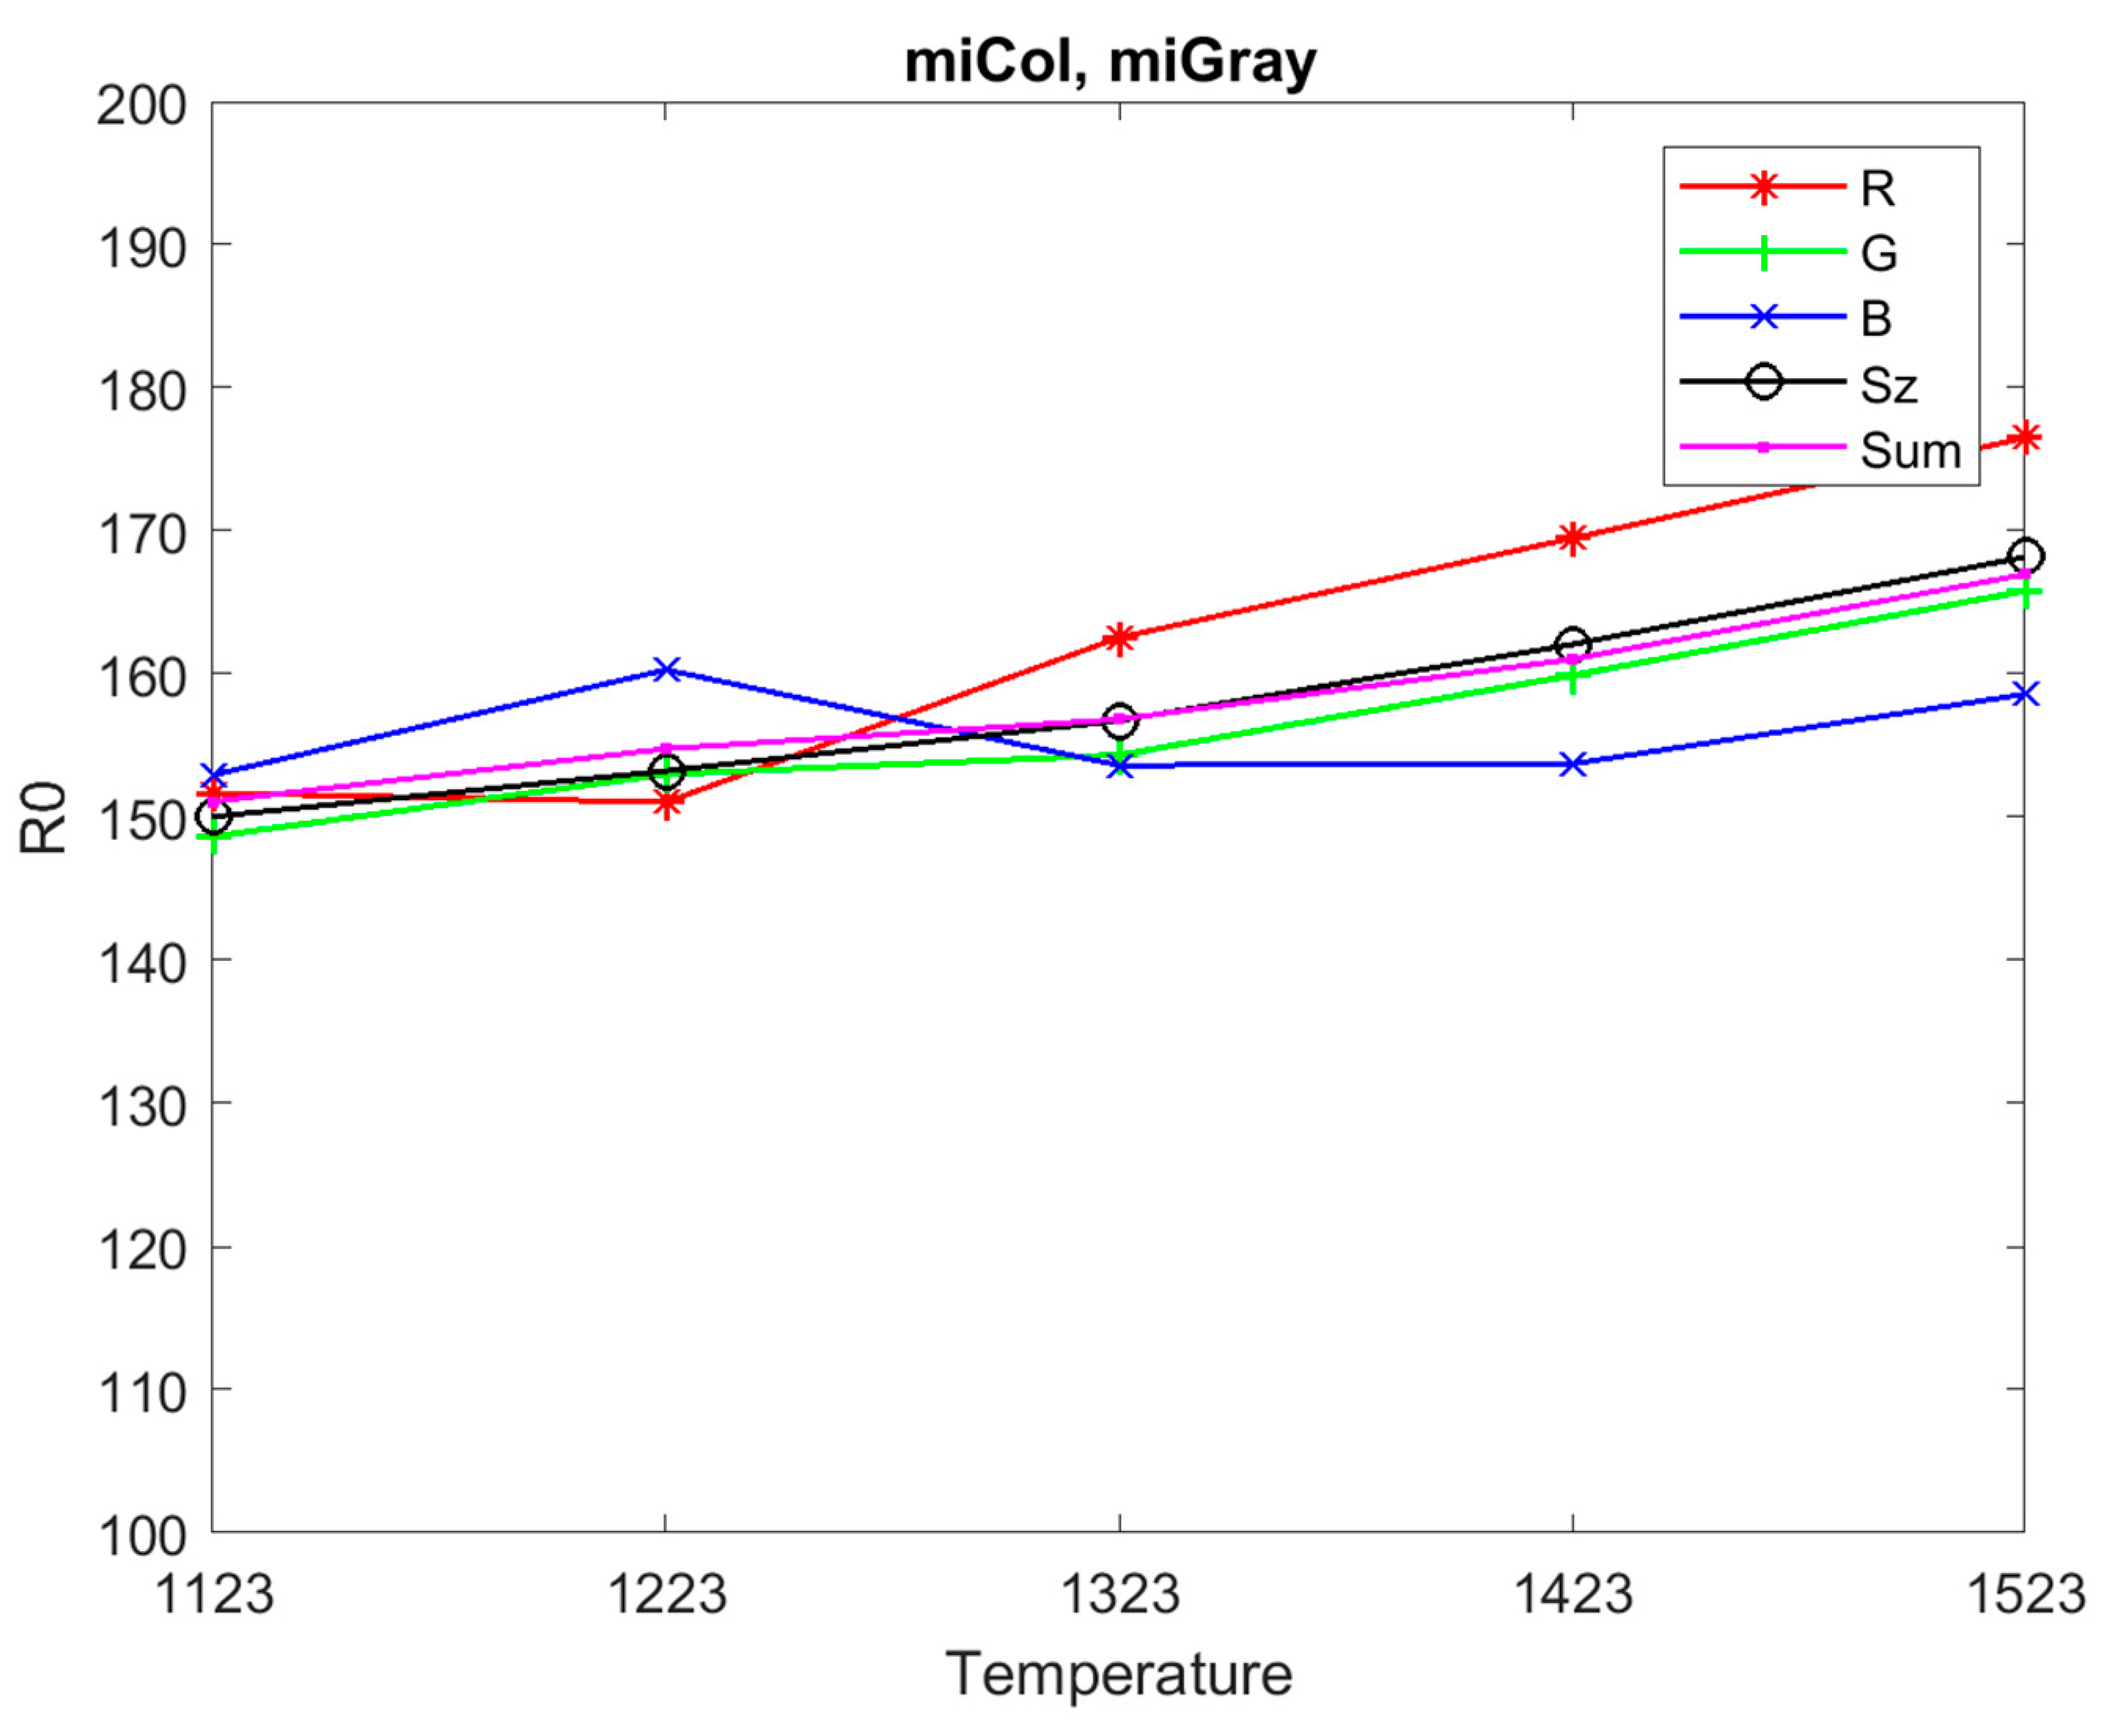
The average values of histograms of RGB components (R, G, B), grayscale Sz and Sum = (R + G + B)/3 as a function of blade heating temperature are presented in Figure 12.
Figure 13, Figure 14, Figure 15 and Figure 16 show a comparison of R0 average saturation results for the entire blade surface histograms [8].
Third-degree polynomials approximate the change of R0 average saturation as a function of the heating temperature of the tested turbine blades.
5. Discussion of Research Results
The gas turbine operation process involves various damages in the form of overheating, deformation, creep, burnout, and thermal fatigue of their material. A symptom that signalizes a failure to a diagnostician conducting visual tests is a change of their surface colour. The authors of this paper, based on a laboratory experiment, presented the possibility of applying a visual method to assess the overheating of turbine blade surface. They described the laboratory experiment procedure that involves surface image acquisition and extracting its features using new turbine rotor blades, made of the EI-867WD alloy and after heating at five temperature values. Image acquisition was conducted under identical conditions, using a Nikon D90 camera for this purpose. They were then analysed using software developed in the MATLAB environment. The extracted features of recorded surface images are presented in the form of brightness distribution histograms for grayscale image and individual colour components, RGB. Such histogram parameters as the position of the maximum amplitude (saturation values for RGB colour) and maximum amplitude value were calculated. In consequence of conducted studies, it was concluded that an increase in blade heating temperature entailed significant changes in individual RGB colours and the grayscale (Sz) of their surface images. Due to the fact that the surface colour of heated blades changed at each heating temperature, it can be used as a diagnostic signal evidencing microstructural change.
Limitations of the method:
The method can be applied to the turbine blades with the engine switched off. It bases on the current images of the blades processed by specialized computer software in conjunction with the knowledge of the relationship between the images’ parameters and that of the microstructure.
The method should adapt to the specific type of diagnosed blades. It requires preliminary tests of new and heated blades (at assumed temperatures) in the scope of:
- surface images
- microstructures
- correlation of surface image parameters and blade microstructure
The results of the preliminary tests create a knowledge base that develops during the implementation of diagnostic tests of blades in the maintenance of turbine engines.
6. Research Conclusions
- Individual RGB colours and greyscale levels (Sz) in blade surface images change due to heating.
- Image features determined based on histograms constitute a source of information on the impact of temperature on blade surface colour change.
- Blade surface colour differences at each heating temperature result from the microstructural changes in the material of these blades.
- In light of the above, the surface colour of heated blades is a diagnostic signal regarding their microstructural changes.
Author Contributions
Conceptualization, A.K., J.B. and H.B.; investigation, A.K. and J.B.; methodology, A.K. and J.B.; software, A.K. and H.B.; supervision, J.B. and H.B.; writing—original draft, A.K. and J.B.; writing—review & editing, J.B. and H.B. All authors have read and agreed to the published version of the manuscript.
Funding
This research received no external funding.
Data Availability Statement
Not applicable.
Conflicts of Interest
The authors declare no conflict of interest.
References
- Błachnio, J.; Bogdan, M.; Kułaszka, A. New Non-Destructive Methods of Diagnosing Health of Gas Turbine Blades. In Advances in Gas Turbine Technology; Ernesto, B., Ed.; IntechOpen: Rijeka, Croatia, 2011; p. 36. [Google Scholar] [CrossRef]
- Database of the Air Force Institute of Technology 2000–2022 (Unpublished); Air Force Institute of Technology: Warsaw, Poland, 2022.
- Błachnio, J.; Spychała, J.; Zasada, D. Analysis of structural changes in a gas turbine blade as a result of high temperature and stress. Eng. Fail. Anal. 2021, 127, 1–19. [Google Scholar] [CrossRef]
- Aust, J.; Pons, D. Taxonomy of Gas Turbine Blade Defects. Aerospace 2019, 6, 58. [Google Scholar] [CrossRef]
- Mevissen, F.; Meo, M. A Review of NDT/Structural Health Monitoring Techniques for Hot Gas Components in Gas Turbines. Sensors 2019, 19, 711. [Google Scholar] [CrossRef] [PubMed]
- Błachnio, J. Technical Analysis of Inefficiency and Failures of Aircrafts. In Fundamentals of Aircraft Operation; Lewitowicz, J., Ed.; Publishing House of the Air Force Institute of Technology: Warsaw, Poland, 2007; Volume 4. [Google Scholar]
- Błachnio, J.; Spychała, J.; Pawlak, W.; Kułaszka, A. Assessment of Technical Condition Demonstrated by Gas Turbine Blades by Processing of Images for Their Surfaces. J. KONBiN 2013, 21, 41–50. [Google Scholar] [CrossRef]
- Kułaszka, A. Detection of Early Stages of Damage to Gas Turbine Blades. Ph.D. Thesis, Air Force Institute of Technology, Warsaw, Poland, 2022. [Google Scholar]
- Dzięgielewski, W.; Gawron, B. The Problem of Thermal Stability of Present Aviation Turbine Fuels—Preliminary Study. J. KONBiN 2013, 21, 121–130. [Google Scholar] [CrossRef]
- Błachnio, J.; Pawlak, W.I. Damageability of Gas Turbine Blades—Evaluation of Exhaust Gas Temperature in Front of the Turbine Using a Non-Linear Observer. In Advances in Gas Turbine Technology; Ernesto, B., Ed.; IntechOpen: Rijeka, Croatia, 2011; p. 31. [Google Scholar] [CrossRef]
- Szczepankowski, A.; Przysowa, R.; Perczyński, J.; Kułaszka, A. Health and Durability of Protective and Thermal Barrier Coatings Monitored in Service by Visual Inspection. Coatings 2022, 12, 624. [Google Scholar] [CrossRef]
- Bogdan, M.; Błachnio, J.; Kułaszka, A.; Derlatka, M. Assessing the Condition of Gas Turbine Rotor Blades with the Optoelectronic and Thermographic Methods. Metals 2019, 9, 31. [Google Scholar] [CrossRef]
- Błachnio, J.; Bogdan, M. A non-destructive method to assess condition of gas turbine blades, based on the analysis of blade-surface image. Russ. J. Nondestruct. Testing 2010, 46, 7. [Google Scholar] [CrossRef]
- Aust, J.; Pons, D. Comparative Analysis of Human Operators and Advanced Technologies in the Visual Inspection of Aero Engine Blades. Appl. Sci. 2022, 12, 2250. [Google Scholar] [CrossRef]
- Aust, J.; Shankland, S.; Pons, D.; Mukundan, R.; Mitrovic, A. Automated Defect Detection and Decision-Support in Gas Turbine Blade Inspection. Aerospace 2021, 8, 30. [Google Scholar] [CrossRef]
- Aust, J.; Pons, D.; Mitrovic, A. Evaluation of Influence Factors on the Visual Inspection Performance of Aircraft Engine Blades. Aerospace 2022, 9, 18. [Google Scholar] [CrossRef]
- Czimmermann, T.; Ciuti, G.; Milazzo, M.; Chiurazzi, M.; Roccella, S.; Oddo, C.M.; Dario, P. Visual-Based Defect Detection and Classification Approaches for Industrial Applications—A SURVEY. Sensors 2020, 20, 1459. [Google Scholar] [CrossRef]
- Bogdan, M.; Błachnio, J.; Kułaszka, A.; Zasada, D. Investigation of the Relationship between Degradation of the Coating of Gas Turbine Blades and Its Surface Color. Materials 2021, 14, 7843. [Google Scholar] [CrossRef] [PubMed]
- Mohamed, M.; Bonello, P.; Russhard, P. A novel method for the determination of the change in blade tip timing probe sensing position due to steady movements. Mech. Syst. Signal Process. 2019, 126, 686–710. [Google Scholar] [CrossRef]
- Ao, C.; Qiao, B.; Liu, M.; Zhu, W.; Zhu, Y.; Wang, Y.; Chen, X. Non-contact full-field dynamic strain reconstruction of rotating blades under multi-mode vibration. Mech. Syst. Signal Process. 2023, 186, 109840. [Google Scholar] [CrossRef]
- Zhu, Y.; Wang, Y.; Qiao, B.; Fu, S.; Liu, M.; Luo, X.; Chen, X. Full-field dynamic strain reconstruction of rotor blades under multi-mode vibration. Measurement 2022, 201, 111670. [Google Scholar] [CrossRef]
- Swadźba, L. Shaping the Structure and Properties of Protective Coatings on Selected Alloys Used in Aircraft Turbine Engines; Silesian University of Technology: Katowice, Poland, 2007. [Google Scholar]
- Poznańska, A. Lifetime of Aircraft Engine Blades Made of EI-867 Alloy in Terms of Heterogeneous Deformation and Structural Changes; Rzeszów University of Technology: Rzeszów, Poland, 2000. [Google Scholar]
- Majka, H.; Sieniawski, J. Investigation of the coarsening and gamma’-phase coagulation kinetics in the nickel-base superalloy EI-867. Archiwum Nauki o Materiałach 1998, 4, 18. [Google Scholar]
- Image Processing Toolbox™ User’s Guide; The MathWorks, Inc.: Natick, MA, USA, 2016.
- MATLAB R2016b Update 7; The MathWorks, Inc.: Natick, MA, USA, 2018.
Figure 1.
Causes behind aircraft turbine engine damages in the course of operation (Adapted with permission from Ref. [6]. 2007, AFIT.).
Figure 1.
Causes behind aircraft turbine engine damages in the course of operation (Adapted with permission from Ref. [6]. 2007, AFIT.).

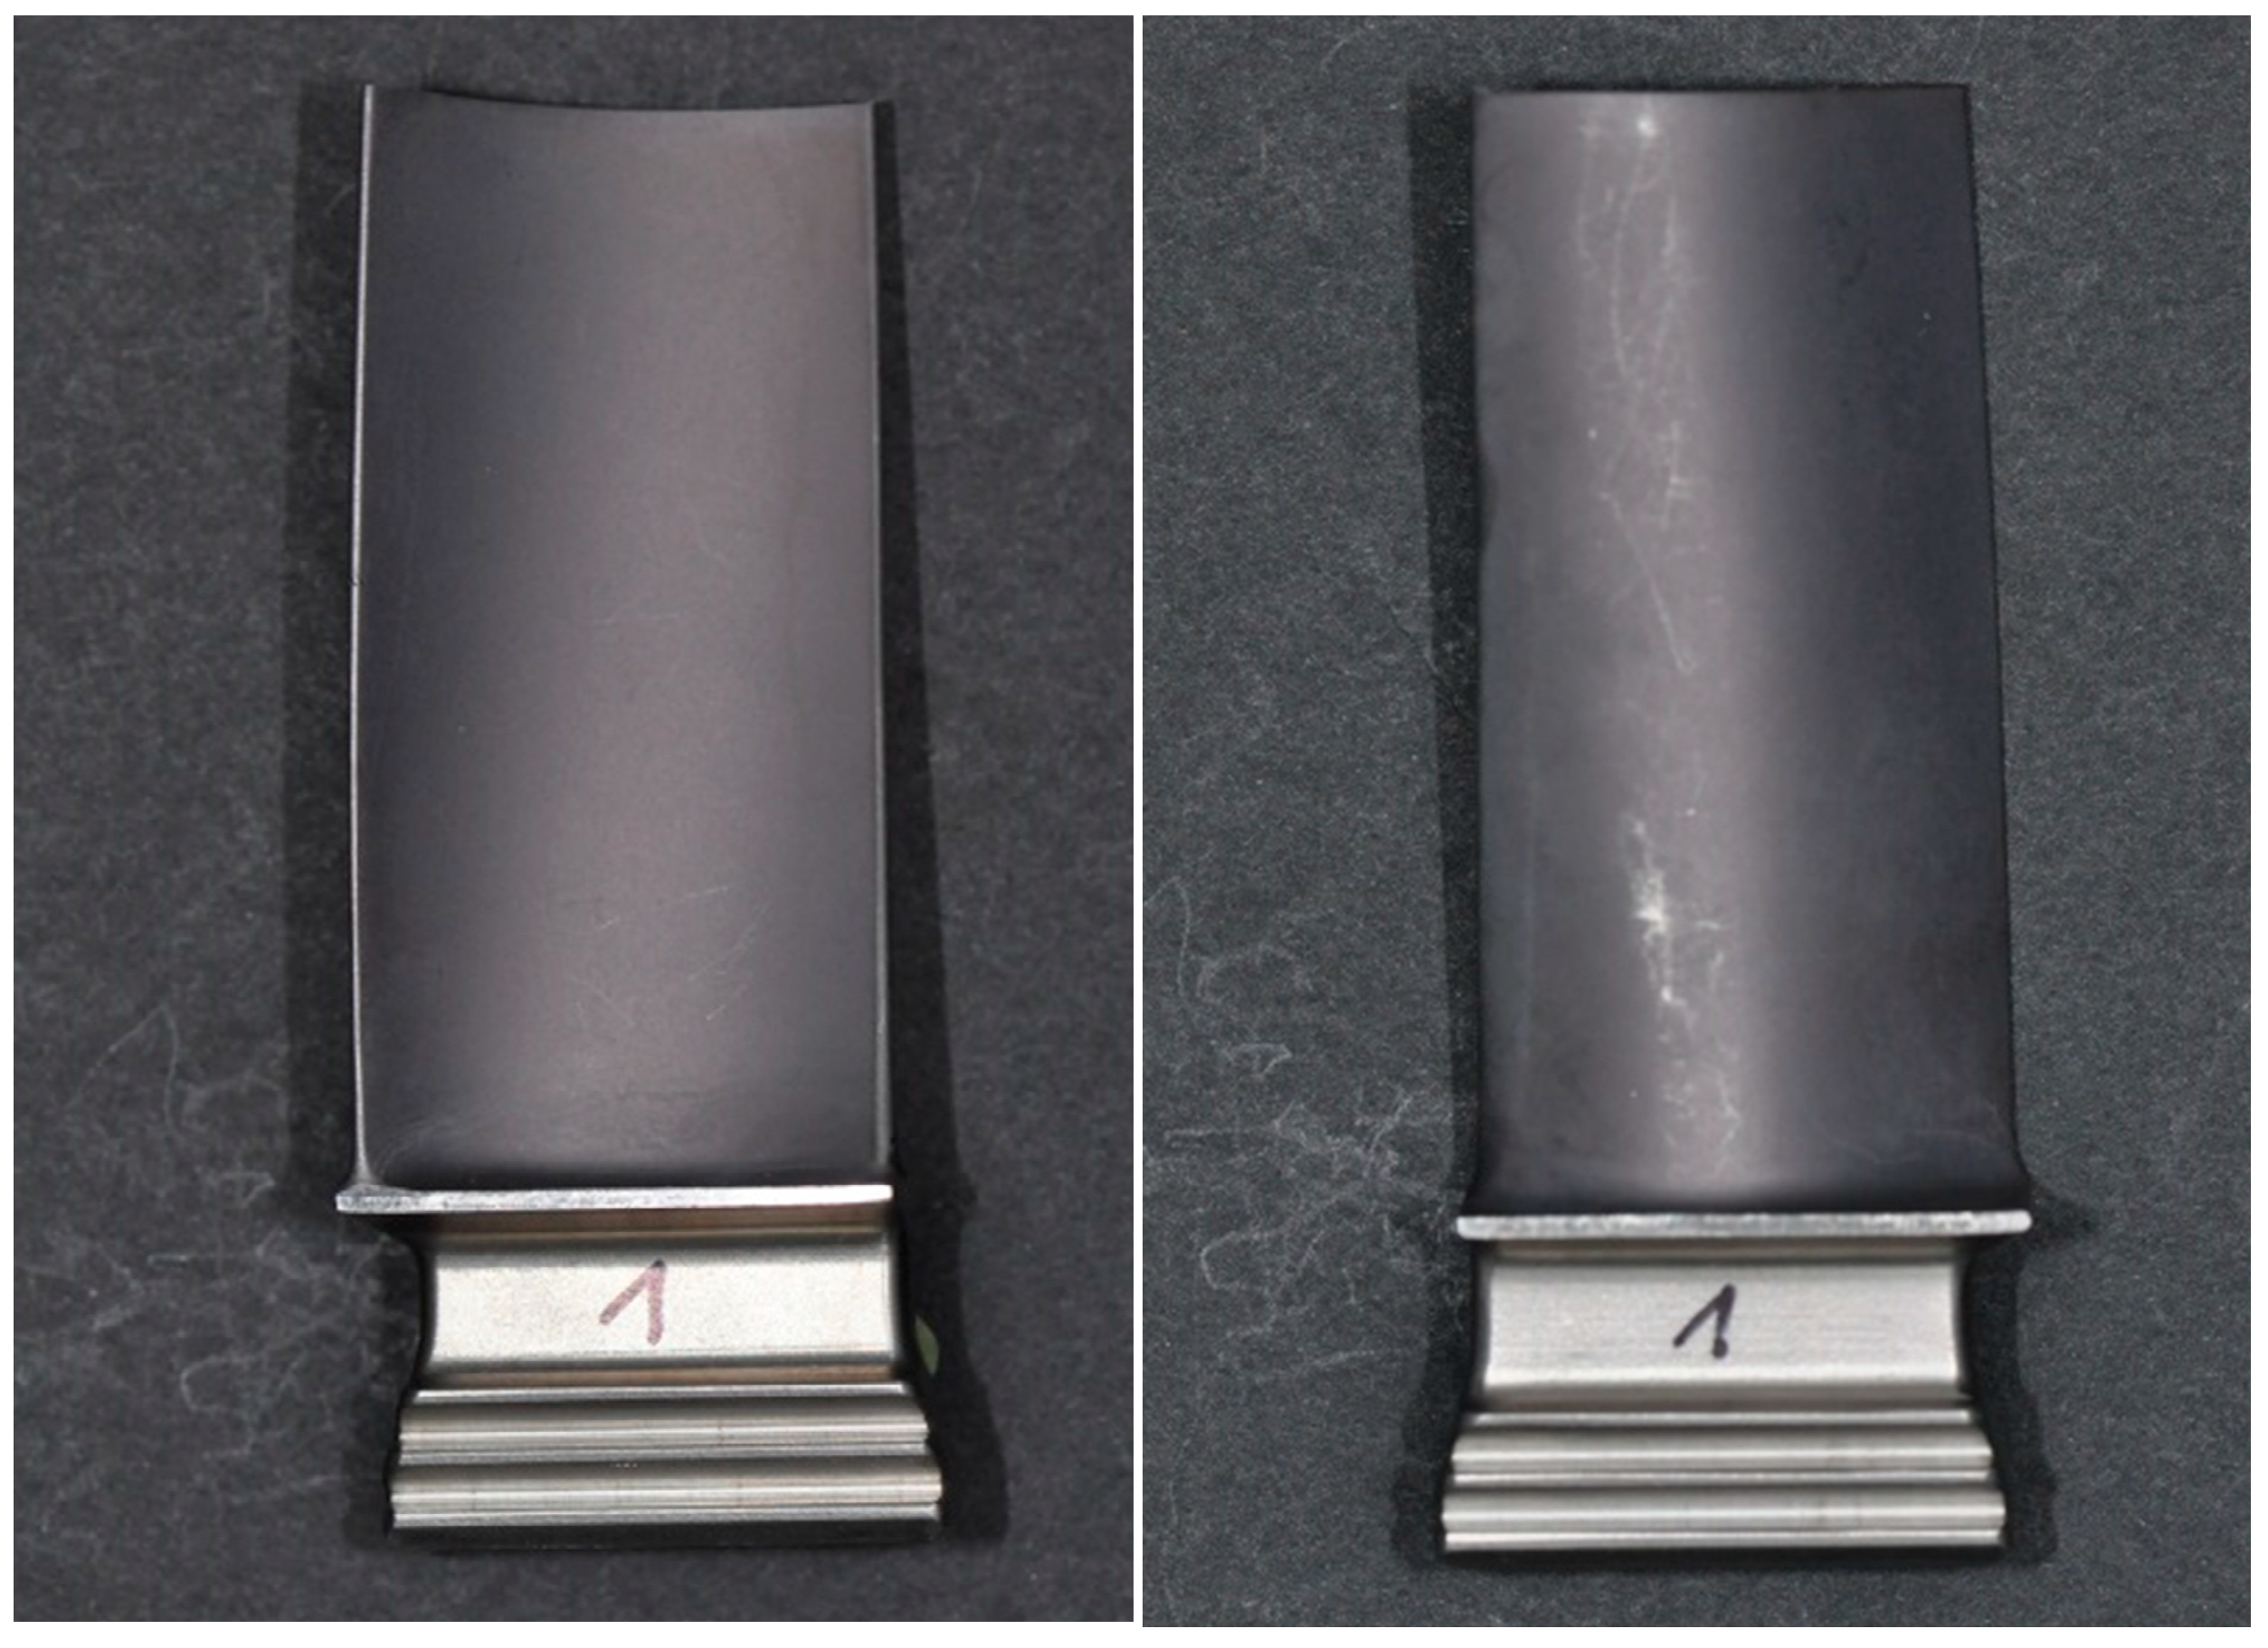
Figure 2.
The blade No. 1 concave and convex surfaces (Reprinted with permission from Ref. [2]. 2011, AFIT.).
Figure 2.
The blade No. 1 concave and convex surfaces (Reprinted with permission from Ref. [2]. 2011, AFIT.).

Figure 3.
General pattern of gas turbine blade division into samples (Reprinted with permission from Ref. [8]. 2022, AFIT.).
Figure 3.
General pattern of gas turbine blade division into samples (Reprinted with permission from Ref. [8]. 2022, AFIT.).

Figure 4.
General surface images of blade samples after heating at a temperature of 1323 K in the presence of kerosene exhaust gases for: (a) 2 h and (b) 3 h (Reprinted with permission from Ref. [2]. 2011, AFIT.).
Figure 4.
General surface images of blade samples after heating at a temperature of 1323 K in the presence of kerosene exhaust gases for: (a) 2 h and (b) 3 h (Reprinted with permission from Ref. [2]. 2011, AFIT.).

Figure 5.
Phase γ’ precipitation morphology—temperature of 1323 K for: (a) 2 h, (b) 3 h (Reprinted with permission from Ref. [2]. 2012, AFIT.).
Figure 5.
Phase γ’ precipitation morphology—temperature of 1323 K for: (a) 2 h, (b) 3 h (Reprinted with permission from Ref. [2]. 2012, AFIT.).

Figure 6.
Aluminide layer structure—temperature of 1323 K for: (a) 2 h, (b) 3 h (Reprinted with permission from Ref. [2]. 2012, AFIT.).
Figure 6.
Aluminide layer structure—temperature of 1323 K for: (a) 2 h, (b) 3 h (Reprinted with permission from Ref. [2]. 2012, AFIT.).

Figure 7.
General view of blade surfaces after heating in the presence of aviation kerosene exhaust gases: (a) convex surfaces; (b) concave surfaces. (Reprinted with permission from Ref. [2]. 2012, AFIT.).
Figure 7.
General view of blade surfaces after heating in the presence of aviation kerosene exhaust gases: (a) convex surfaces; (b) concave surfaces. (Reprinted with permission from Ref. [2]. 2012, AFIT.).

Figure 8.
RGB and greyscale histograms.

Figure 9.
Surface image of blade No. 2 (1323 K). Adapted with permission from Ref. [8]. 2022, AFIT.)
Figure 9.
Surface image of blade No. 2 (1323 K). Adapted with permission from Ref. [8]. 2022, AFIT.)

Figure 10.
Histograms for blade No. 2 image (1323 K). (Reprinted with permission from Ref. [8]. 2022, AFIT.)
Figure 10.
Histograms for blade No. 2 image (1323 K). (Reprinted with permission from Ref. [8]. 2022, AFIT.)

Figure 11.
Normalized and smoothed R, G, B and Sz histograms for the blade No. 2 image (1323 K).

Figure 12.
Change of average values of histograms as a function of blade heating temperature, where: Sum = (R + G + B)/3.
Figure 12.
Change of average values of histograms as a function of blade heating temperature, where: Sum = (R + G + B)/3.

Figure 13.
Mean R0 saturation of the R colour. (Reprinted with permission from Ref. [8]. 2022, AFIT).
Figure 13.
Mean R0 saturation of the R colour. (Reprinted with permission from Ref. [8]. 2022, AFIT).

Figure 14.
Mean R0 saturation of the G colour. (Reprinted with permission from Ref. [8]. 2022, AFIT).
Figure 14.
Mean R0 saturation of the G colour. (Reprinted with permission from Ref. [8]. 2022, AFIT).

Figure 15.
Mean R0 saturation of the B colour. (Reprinted with permission from Ref. [8]. 2022, AFIT).
Figure 15.
Mean R0 saturation of the B colour. (Reprinted with permission from Ref. [8]. 2022, AFIT).

Figure 16.
Mean R0 value of Sz greyscale levels. (Reprinted with permission from Ref. [8]. 2022, AFIT).
Figure 16.
Mean R0 value of Sz greyscale levels. (Reprinted with permission from Ref. [8]. 2022, AFIT).

Disclaimer/Publisher’s Note: The statements, opinions and data contained in all publications are solely those of the individual author(s) and contributor(s) and not of MDPI and/or the editor(s). MDPI and/or the editor(s) disclaim responsibility for any injury to people or property resulting from any ideas, methods, instructions or products referred to in the content. |
© 2023 by the authors. Licensee MDPI, Basel, Switzerland. This article is an open access article distributed under the terms and conditions of the Creative Commons Attribution (CC BY) license (https://creativecommons.org/licenses/by/4.0/).
Share and Cite
MDPI and ACS Style
Kułaszka, A.; Błachnio, J.; Borowczyk, H. The Impact of Temperature on the Surface Colour of Gas Turbine Blades Heated in the Presence of Kerosene. Aerospace 2023, 10, 375. https://doi.org/10.3390/aerospace10040375
AMA Style
Kułaszka A, Błachnio J, Borowczyk H. The Impact of Temperature on the Surface Colour of Gas Turbine Blades Heated in the Presence of Kerosene. Aerospace. 2023; 10(4):375. https://doi.org/10.3390/aerospace10040375
Chicago/Turabian StyleKułaszka, Artur, Józef Błachnio, and Henryk Borowczyk. 2023. "The Impact of Temperature on the Surface Colour of Gas Turbine Blades Heated in the Presence of Kerosene" Aerospace 10, no. 4: 375. https://doi.org/10.3390/aerospace10040375
Note that from the first issue of 2016, this journal uses article numbers instead of page numbers. See further details here.