
Numerical Analysis of the Effects of Grooved Stator Vanes in a Radial Turbine Operating at High Pressure Ratios Reaching Choked Flow

 , , , and
Abstract
:1. Introduction
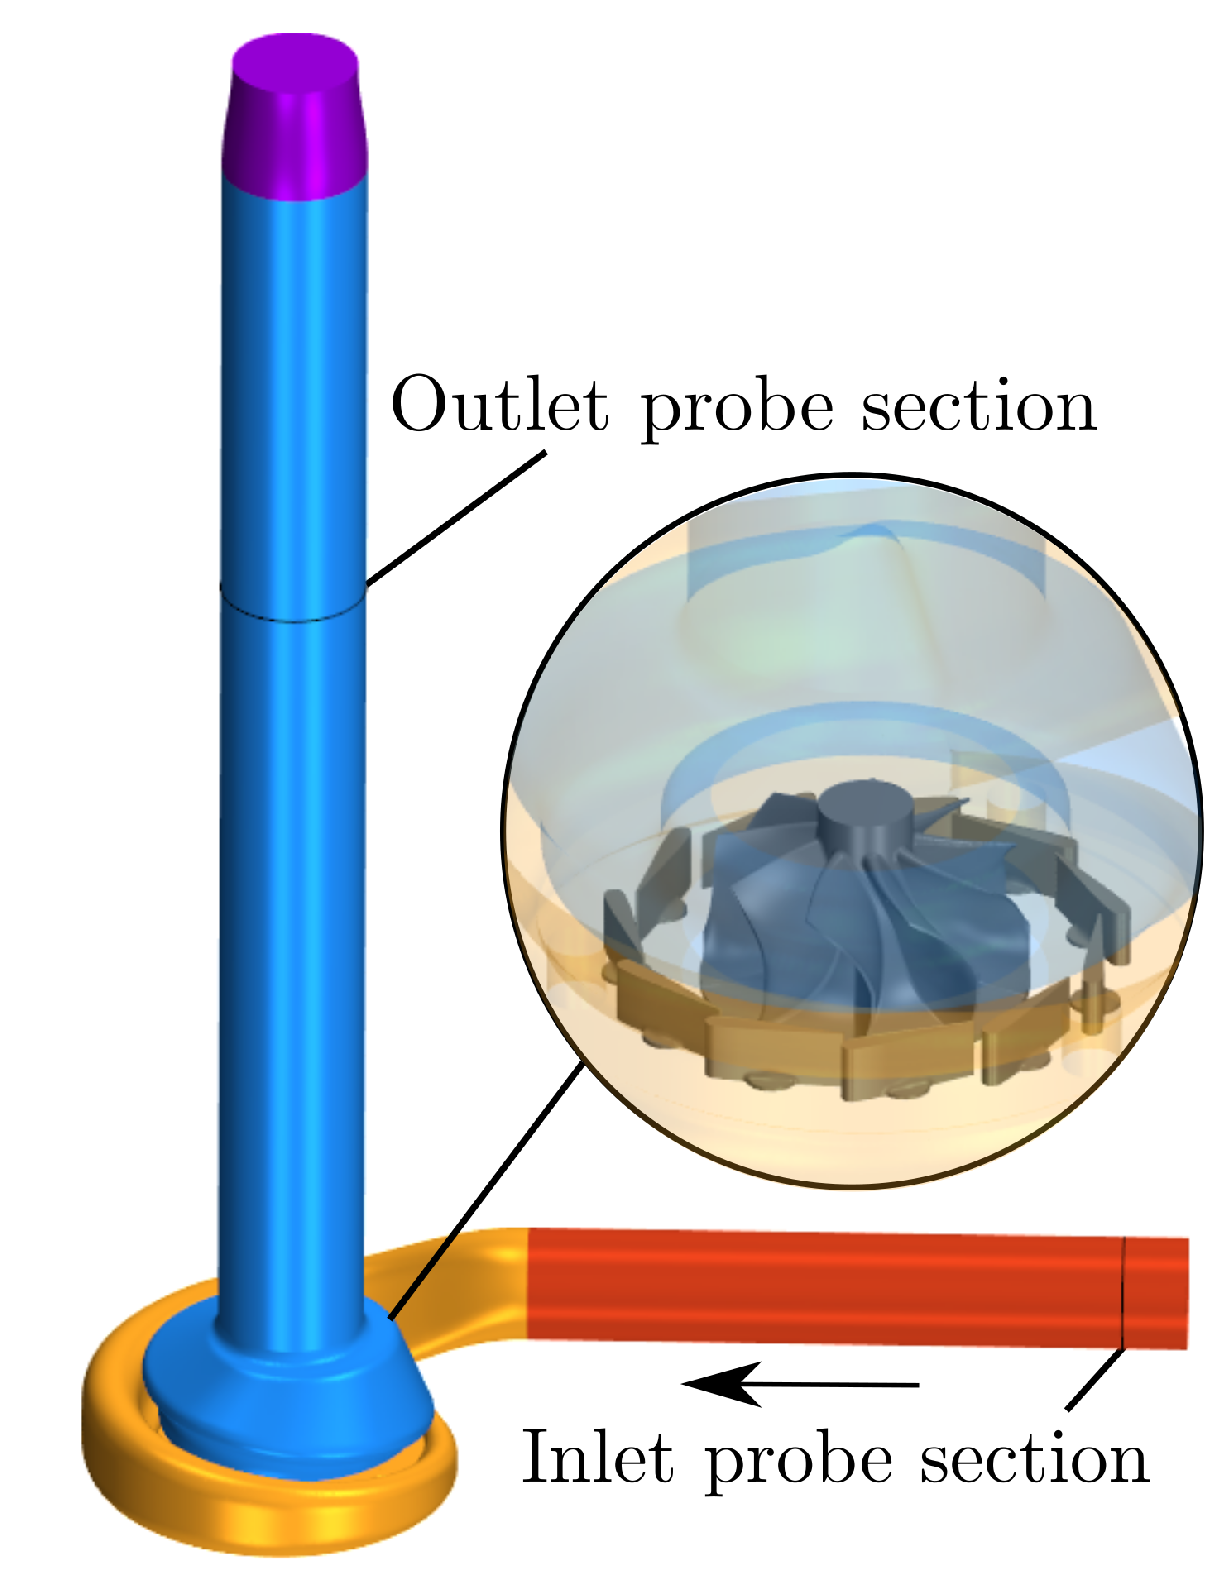
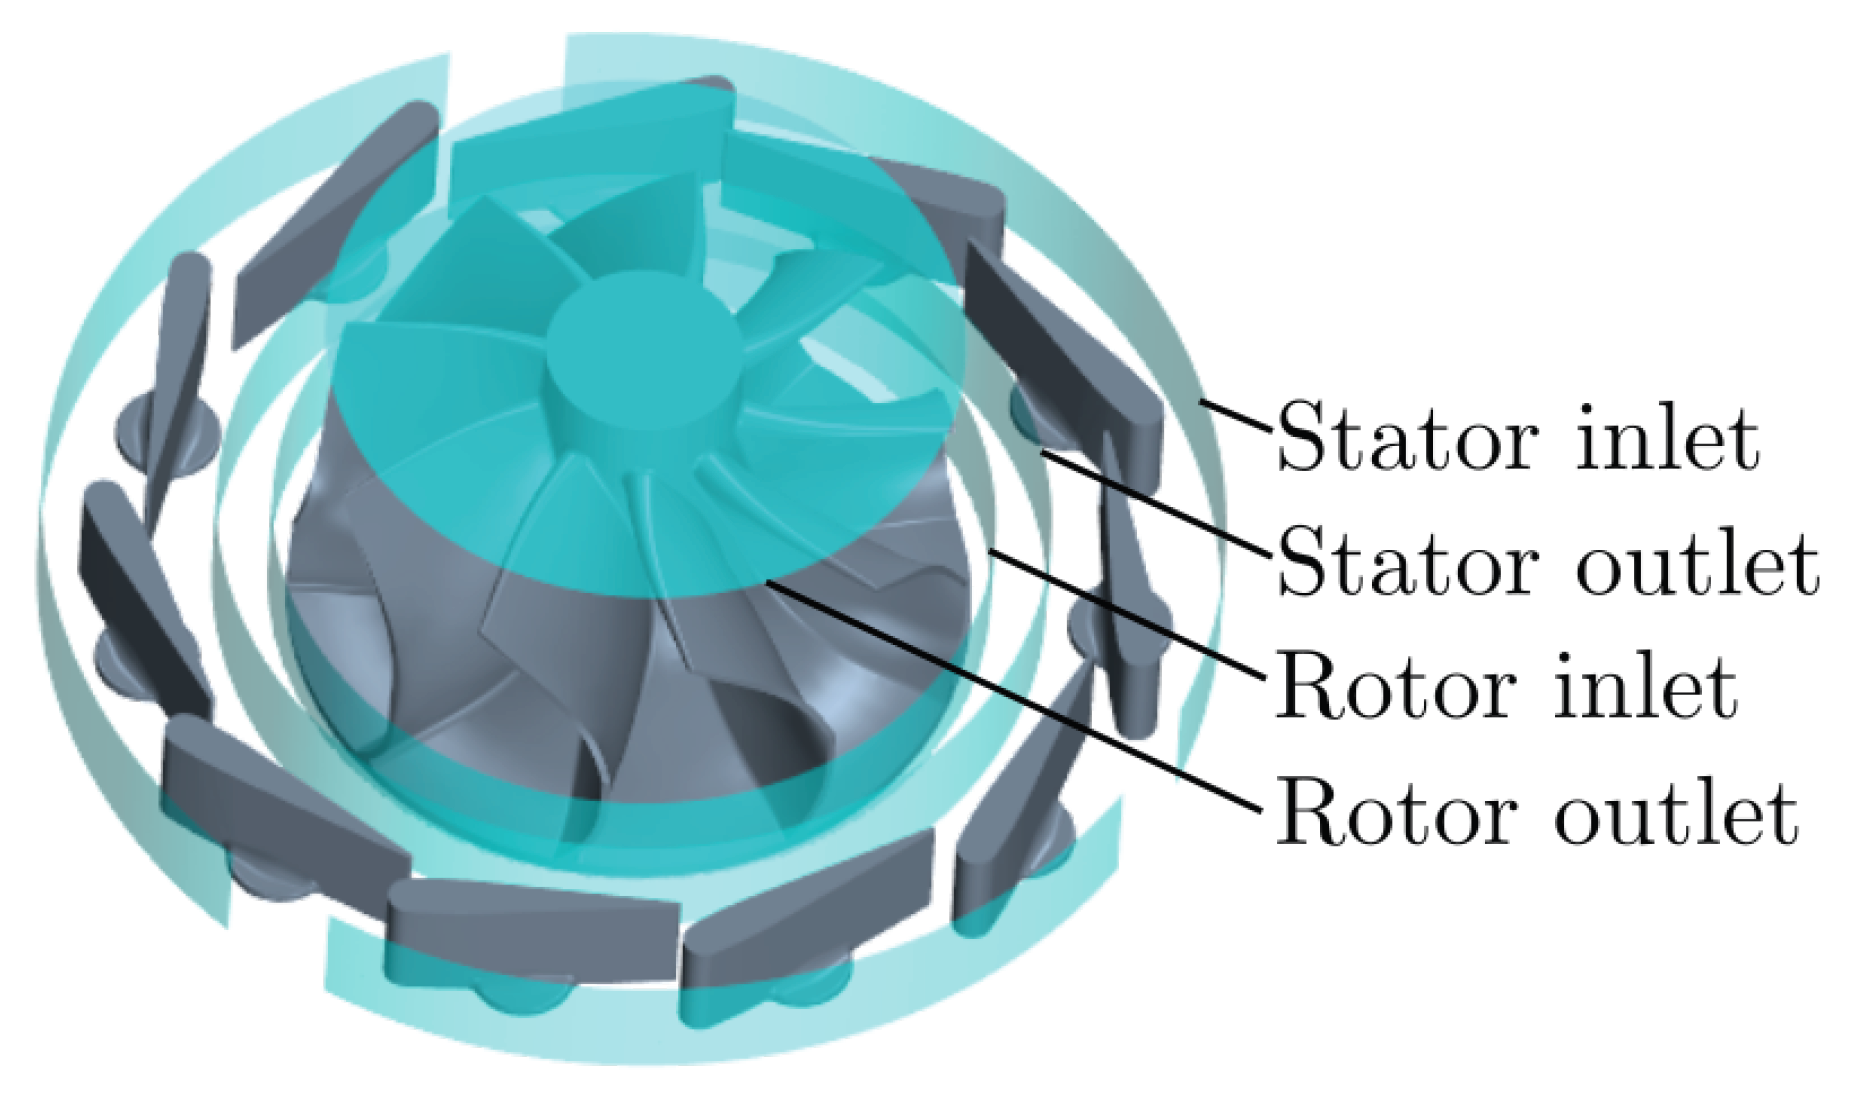
2. Geometry Description
3. Numerical Method
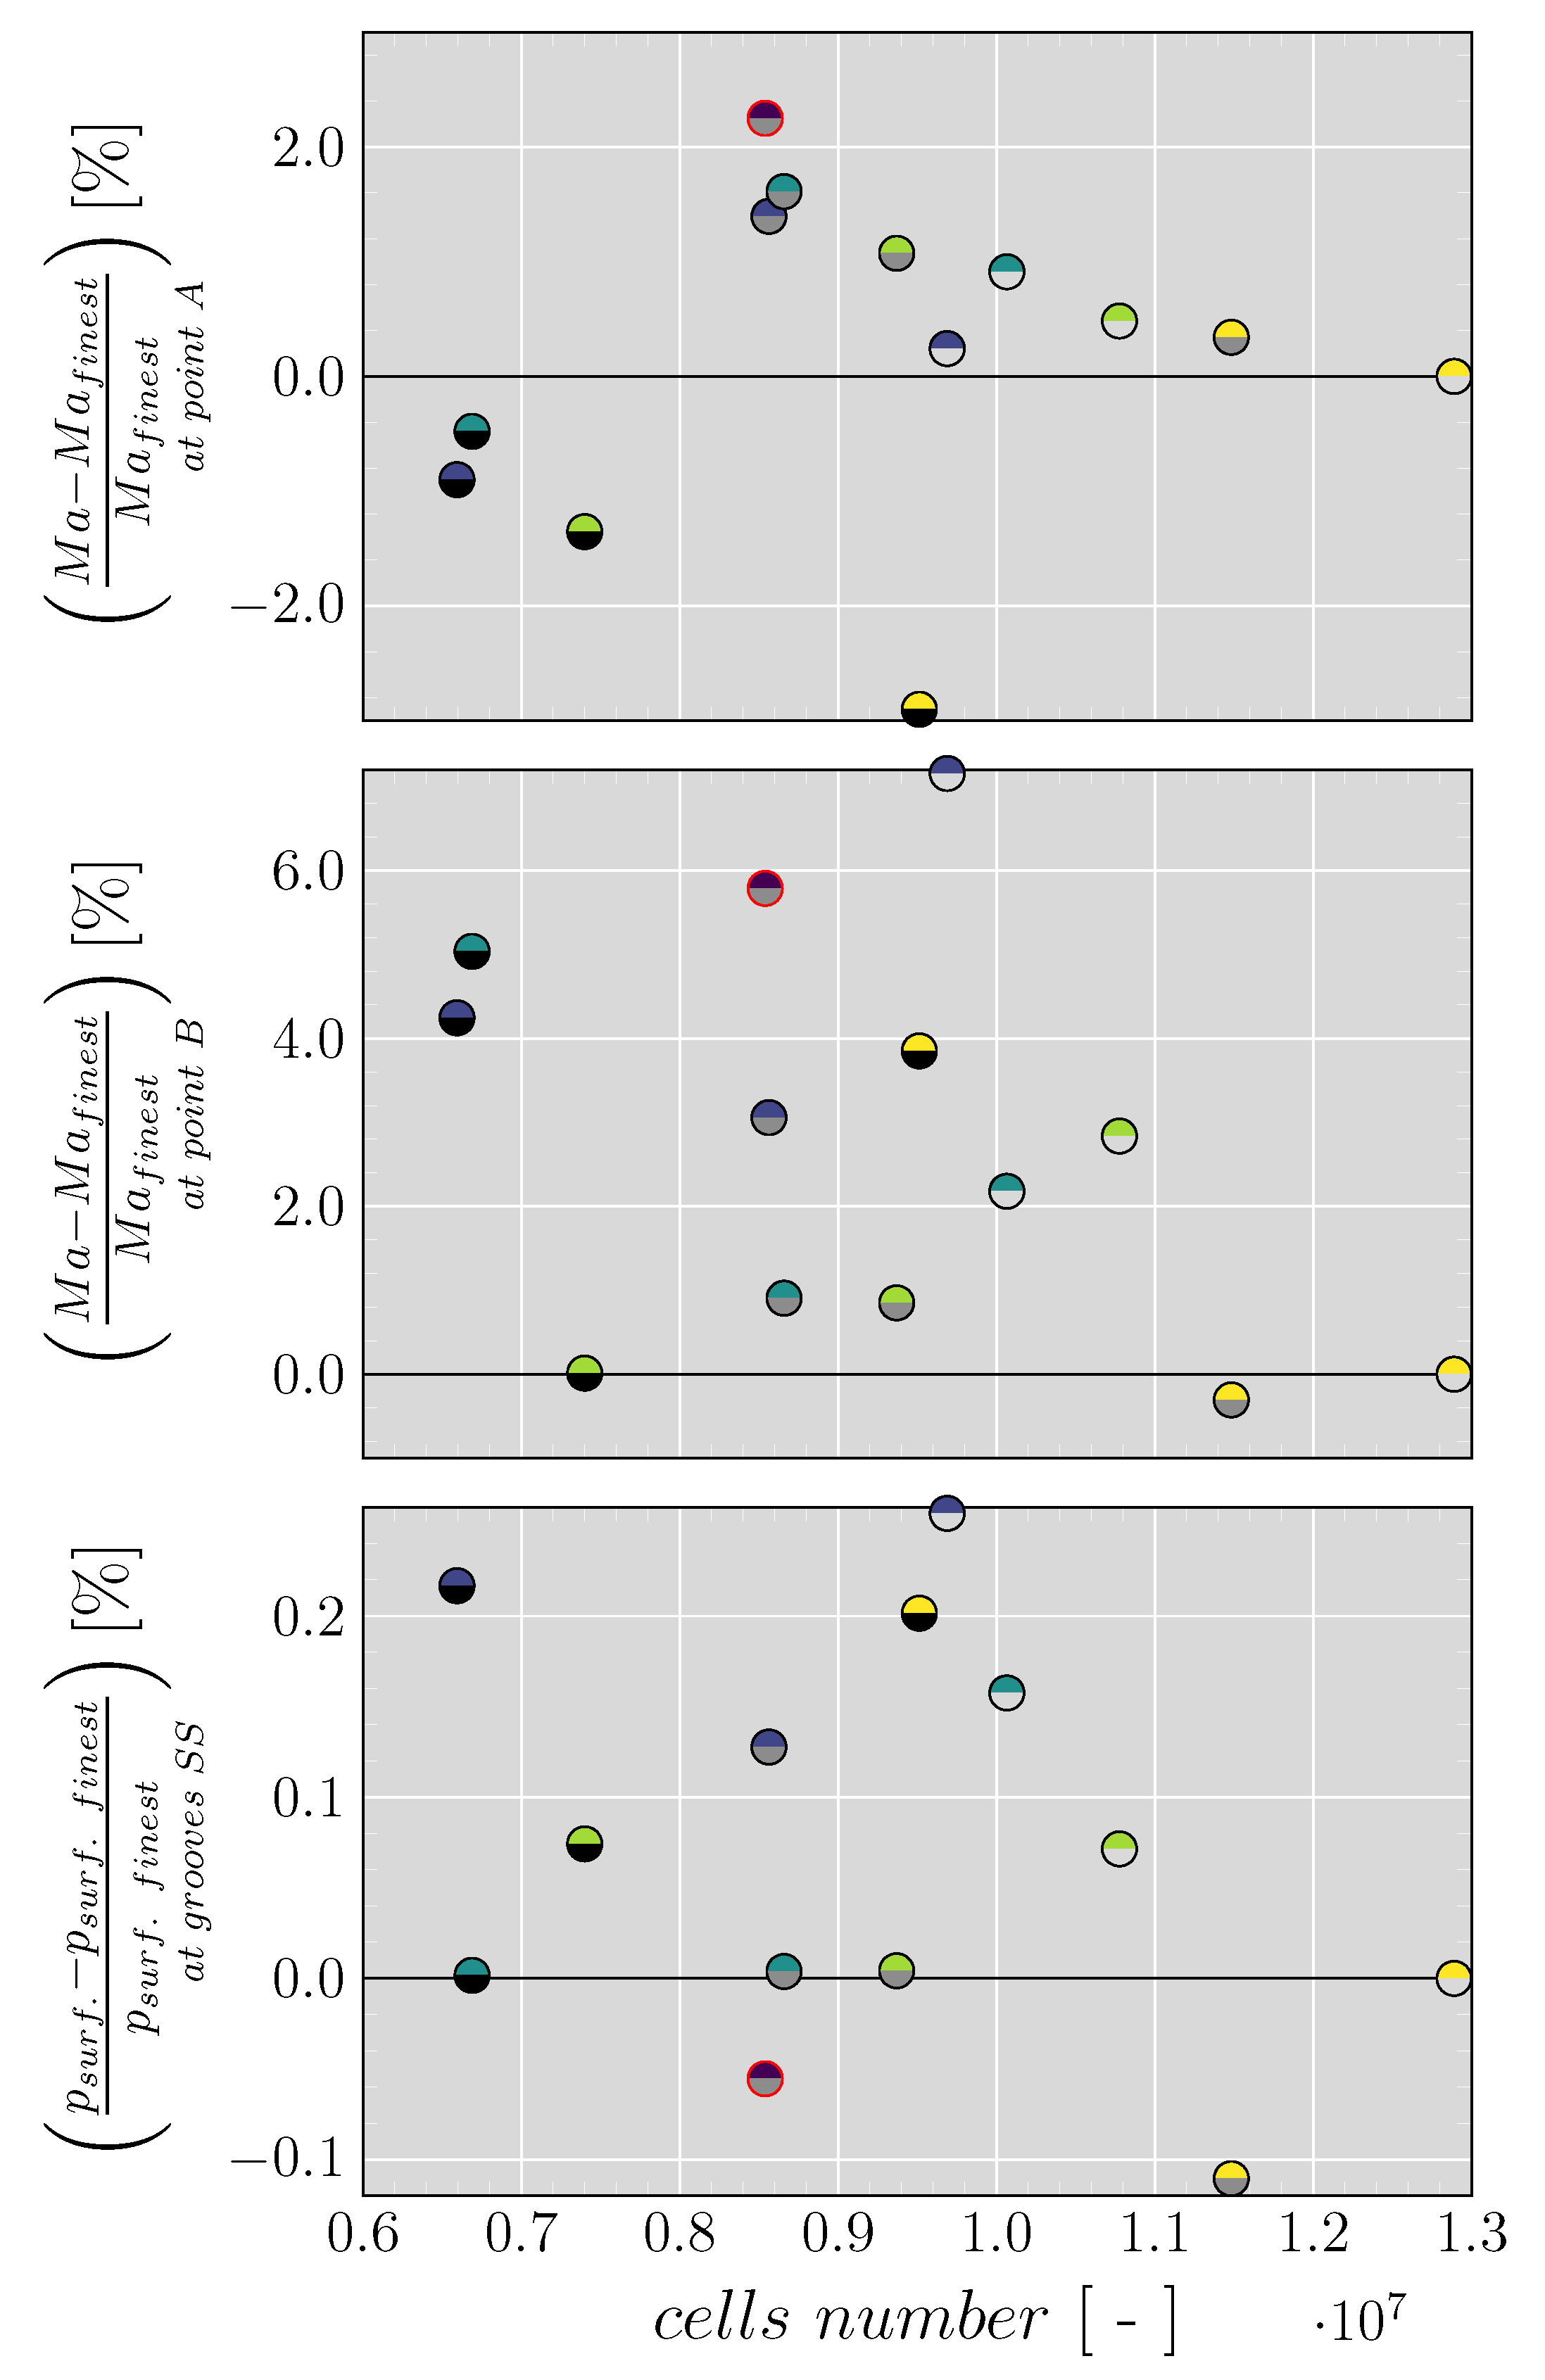
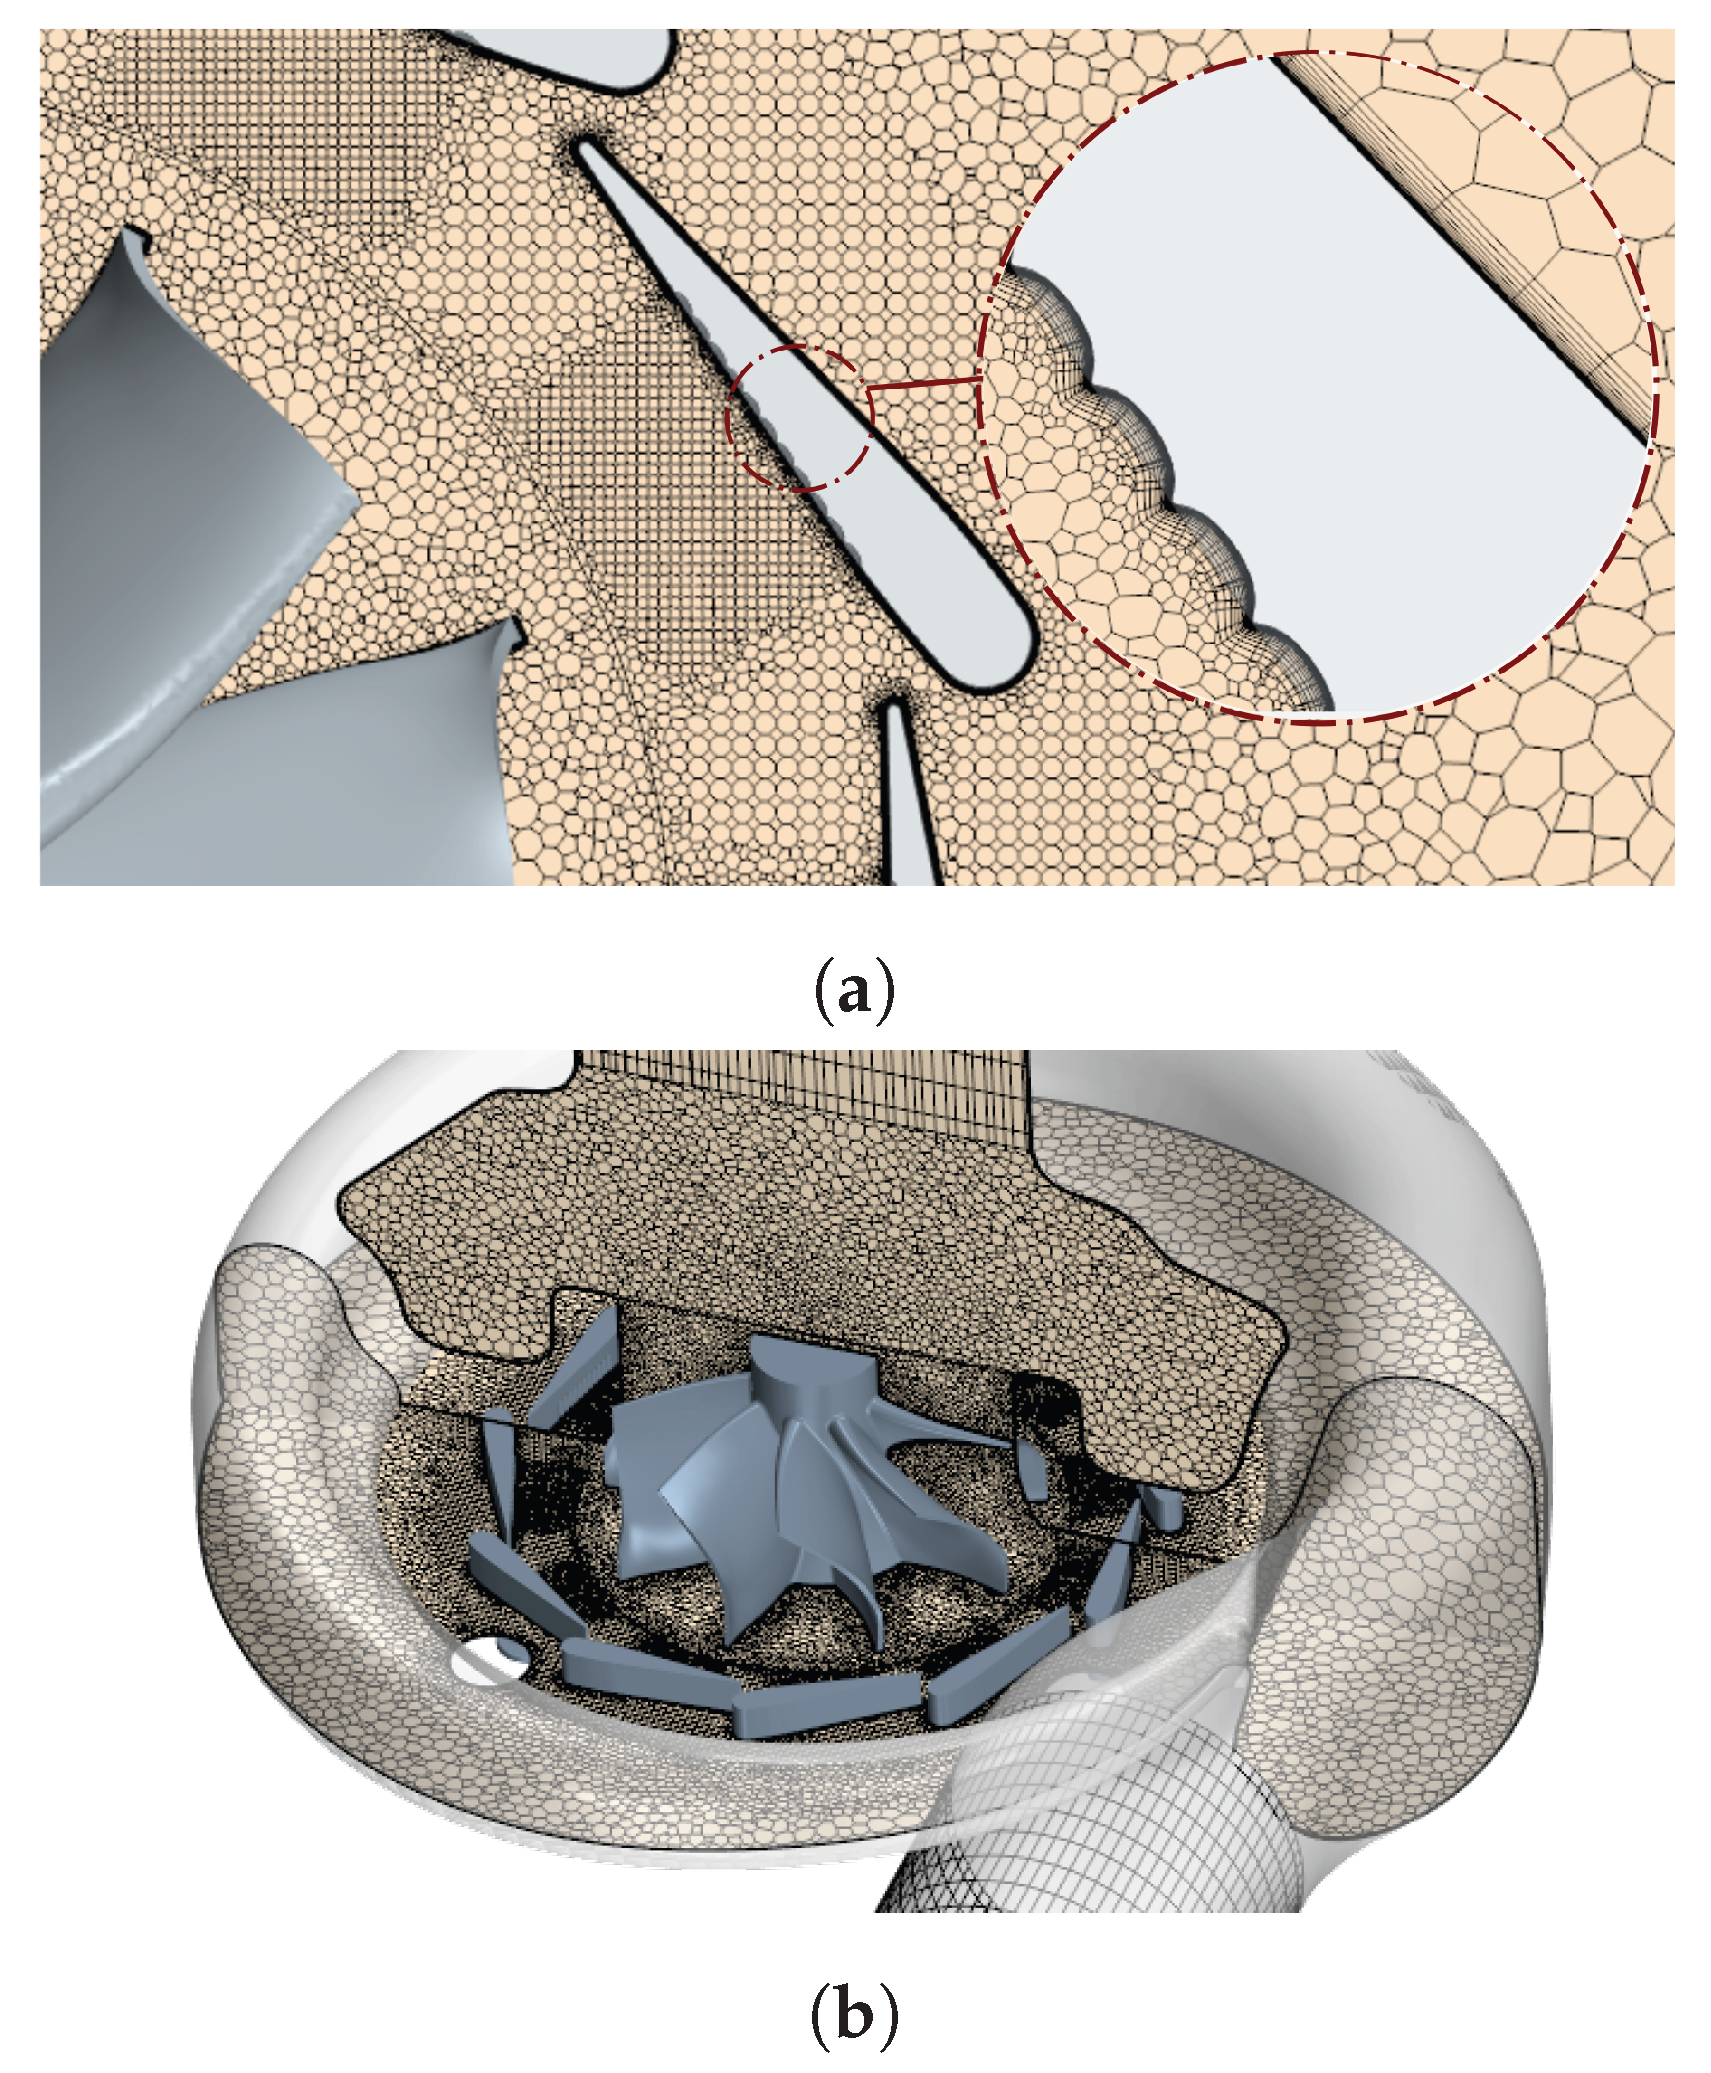
4. Mesh Analysis
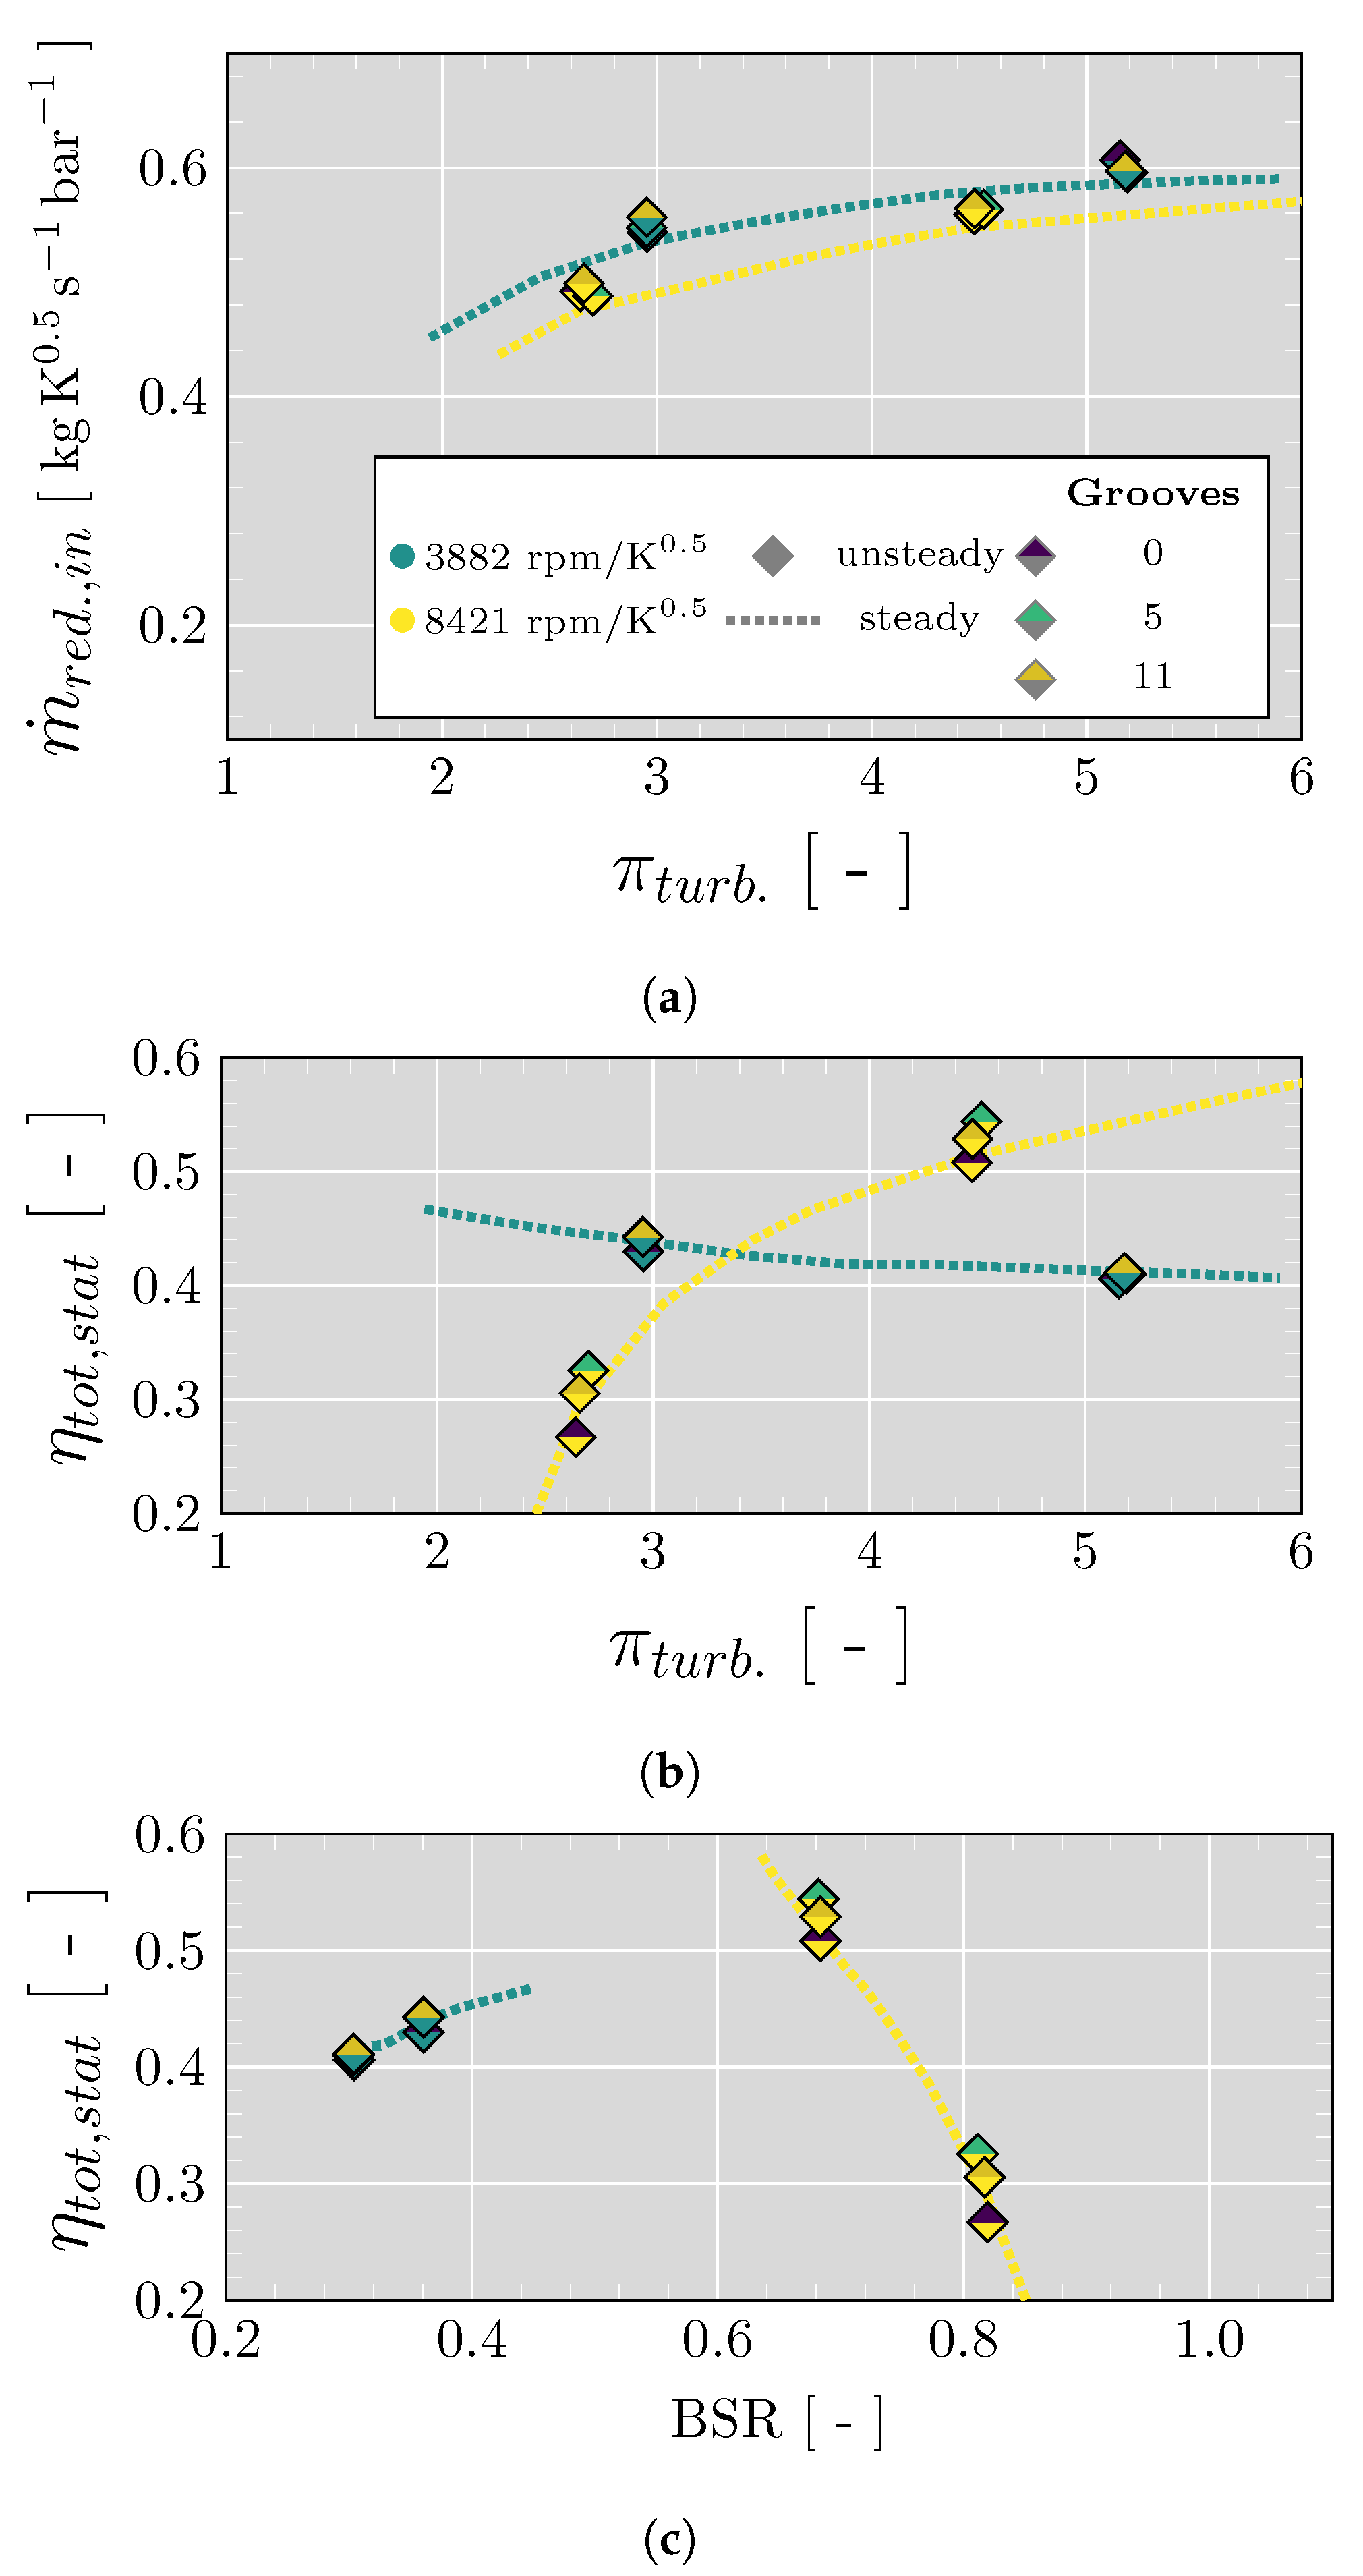
5. Performance Characteristics
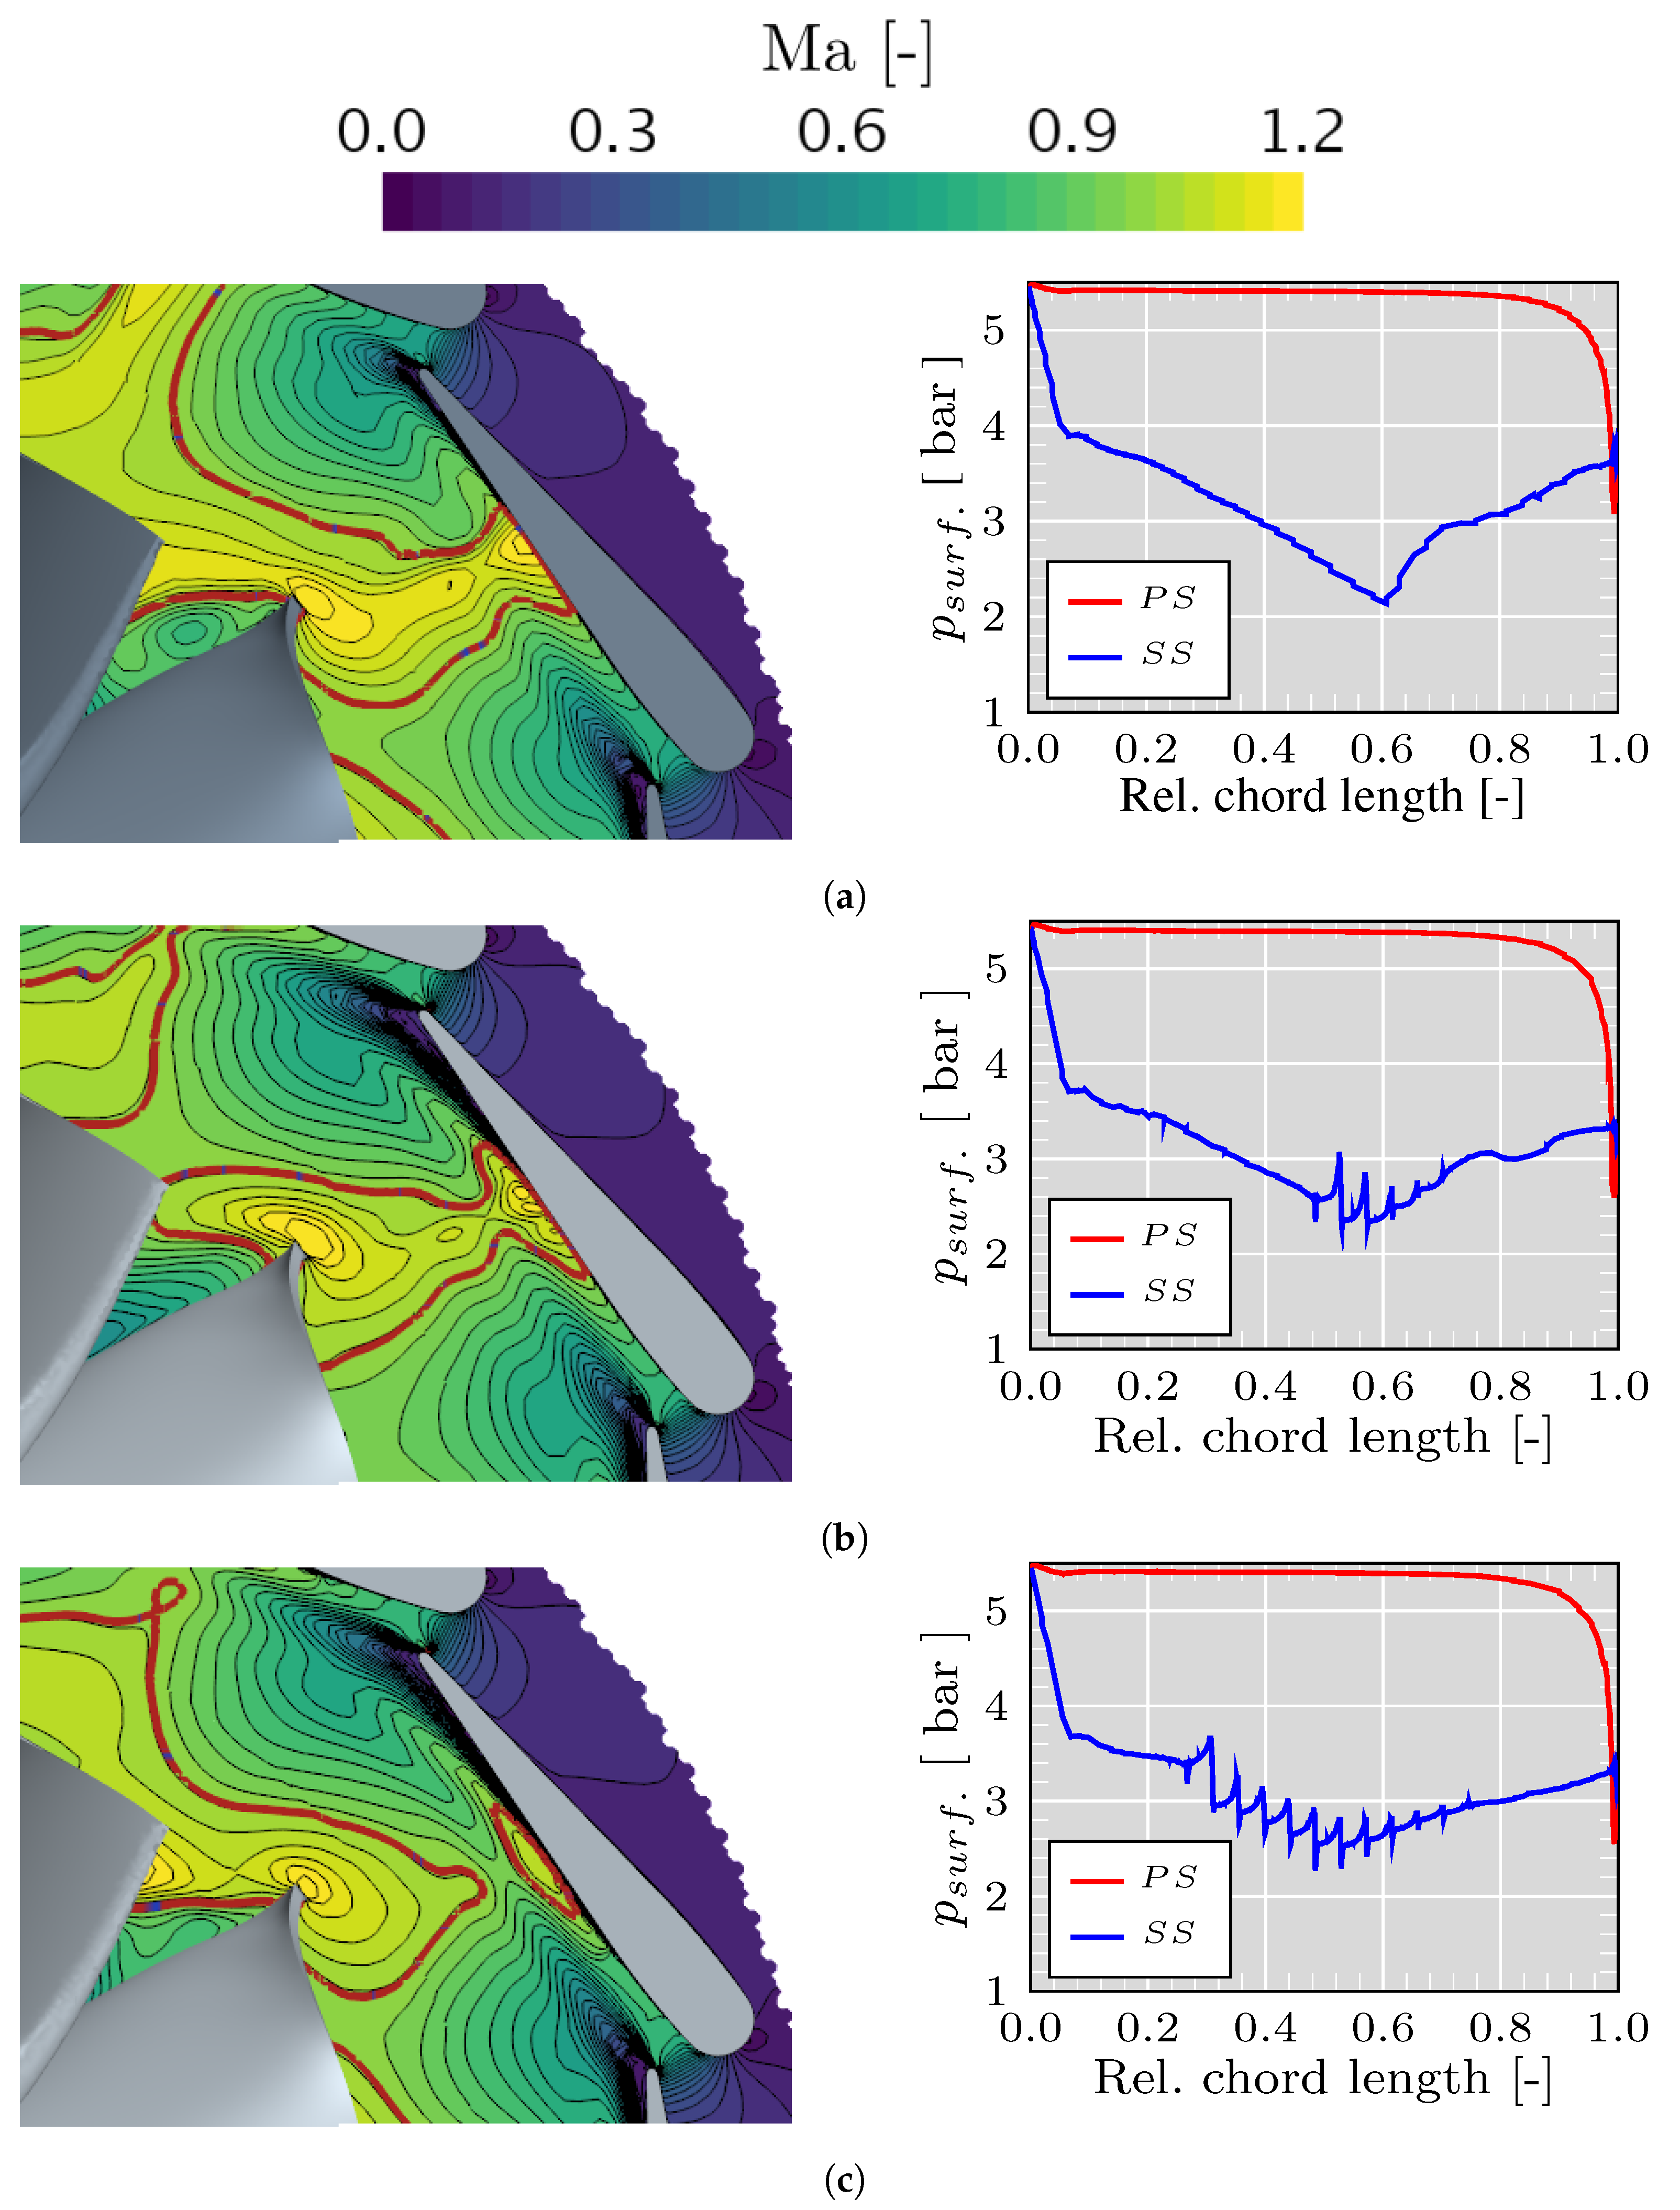
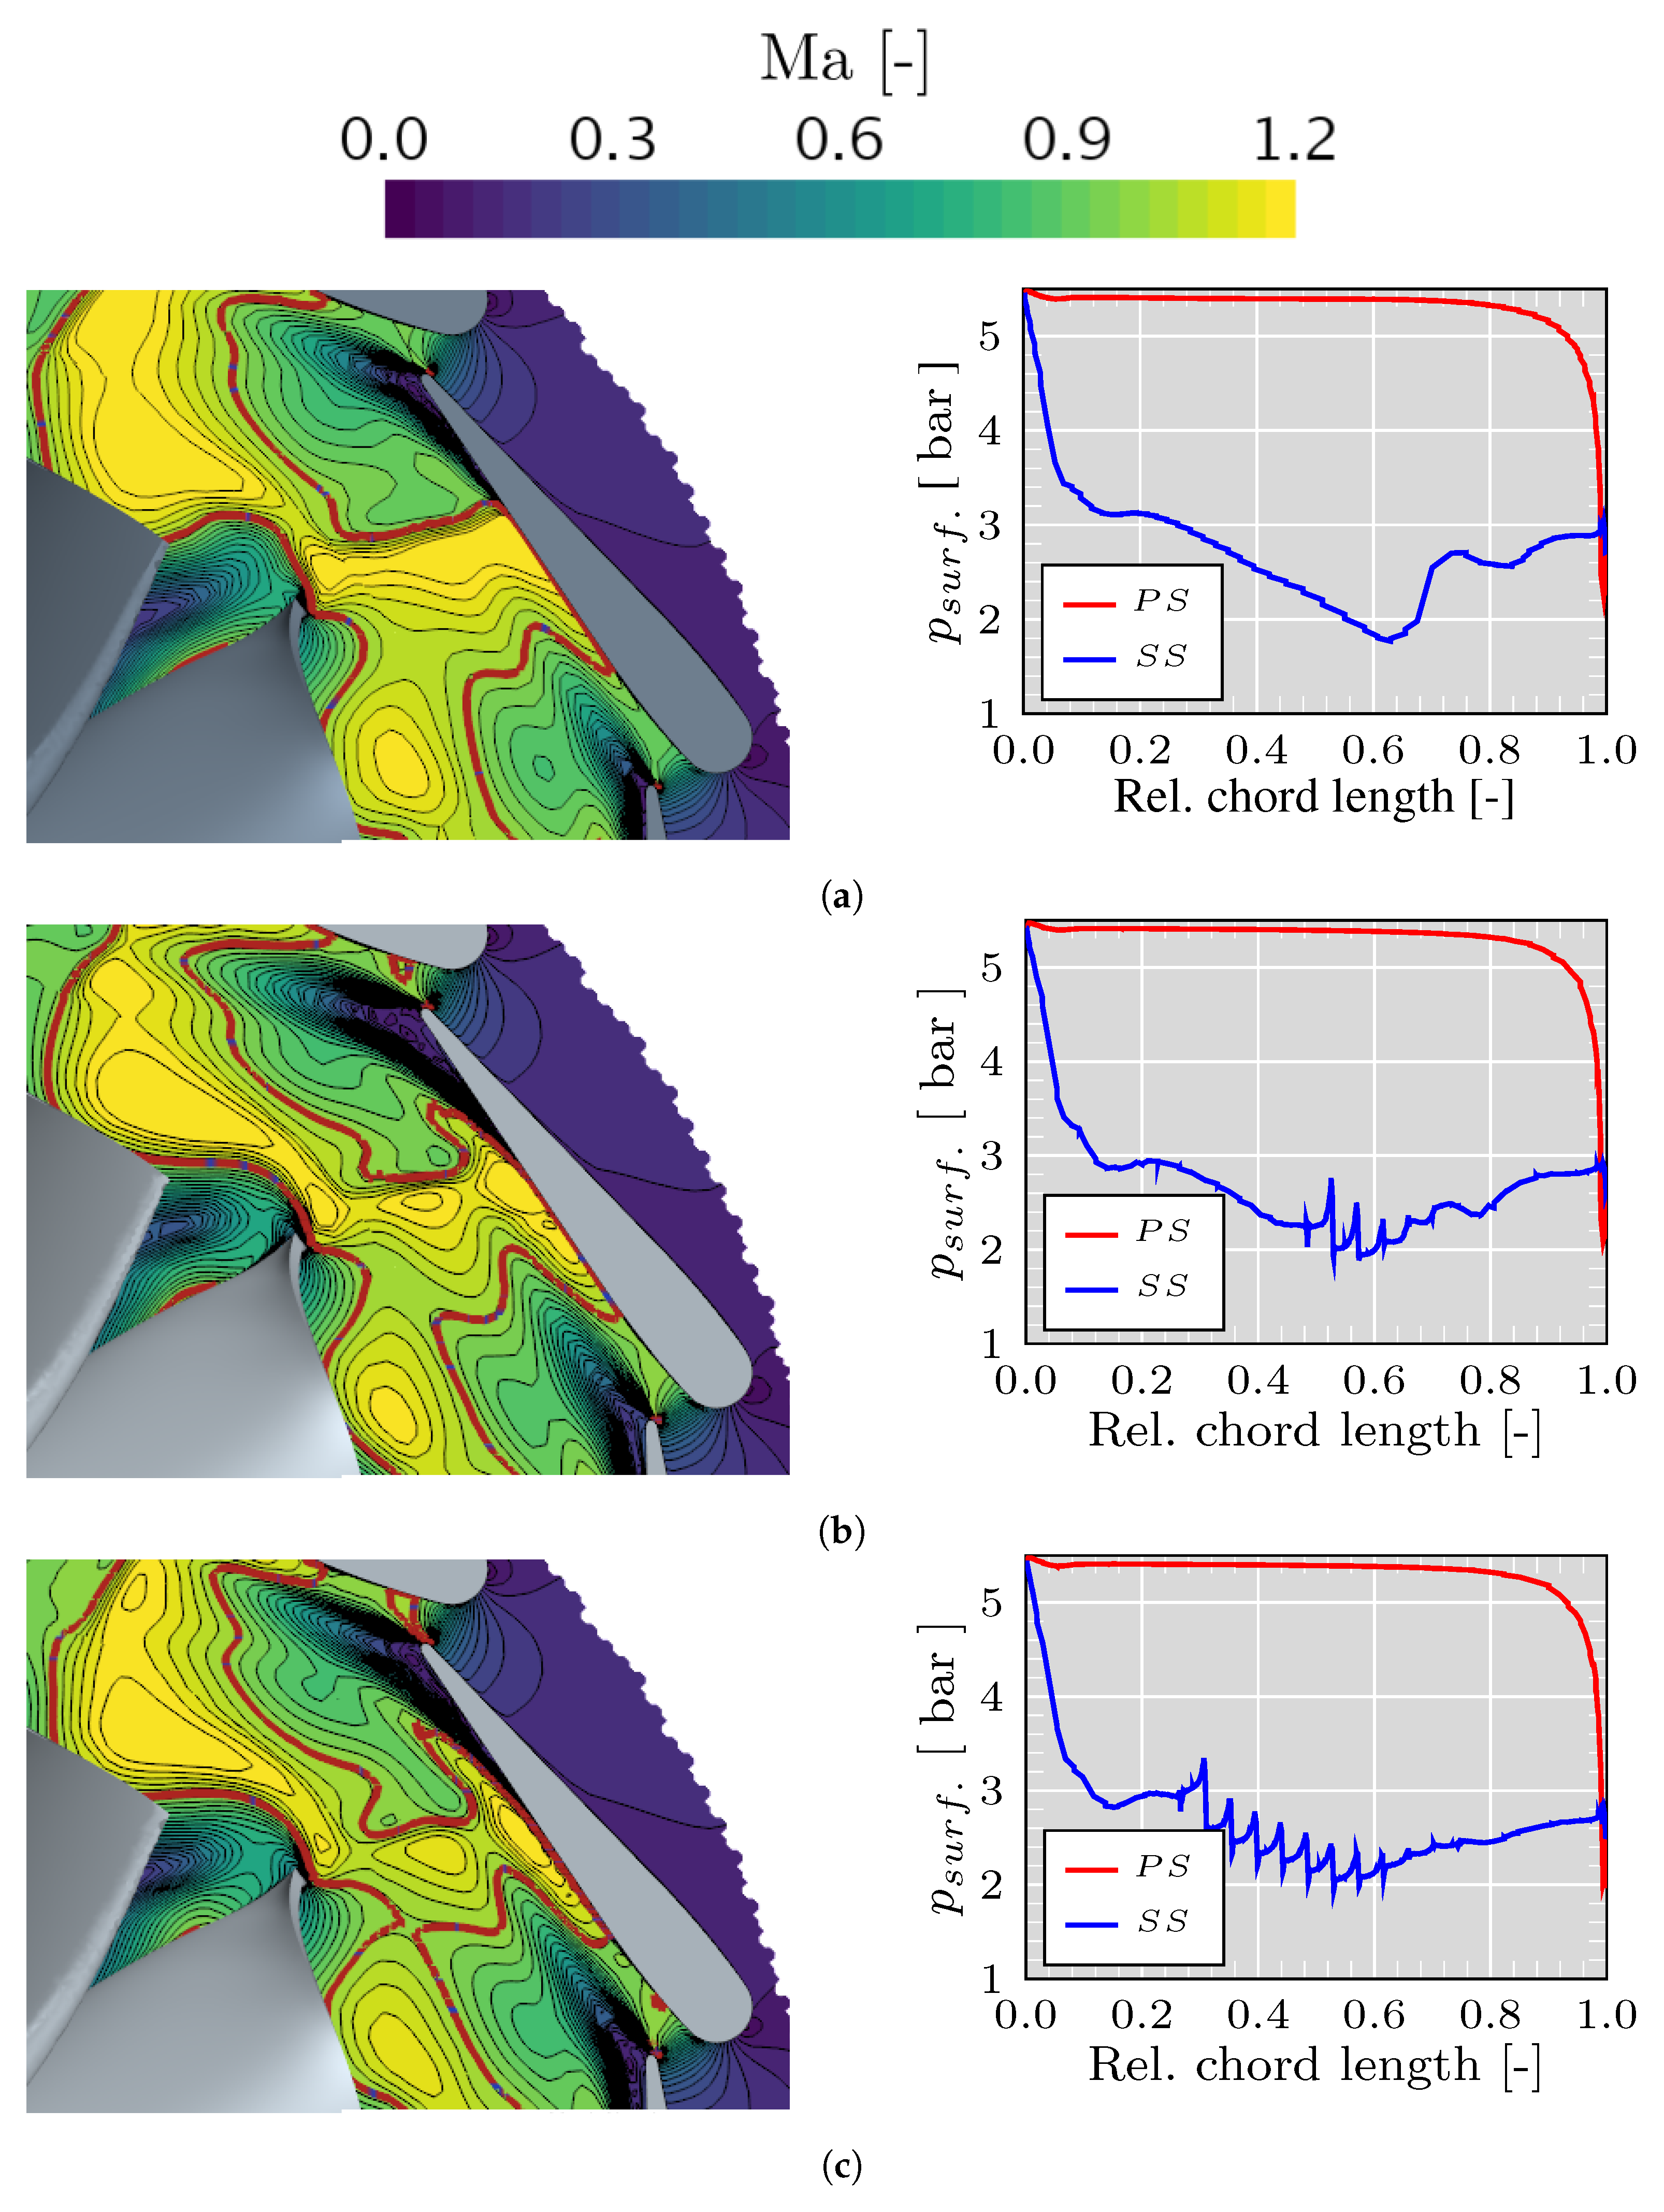
6. Analysis of the Stator Flow features
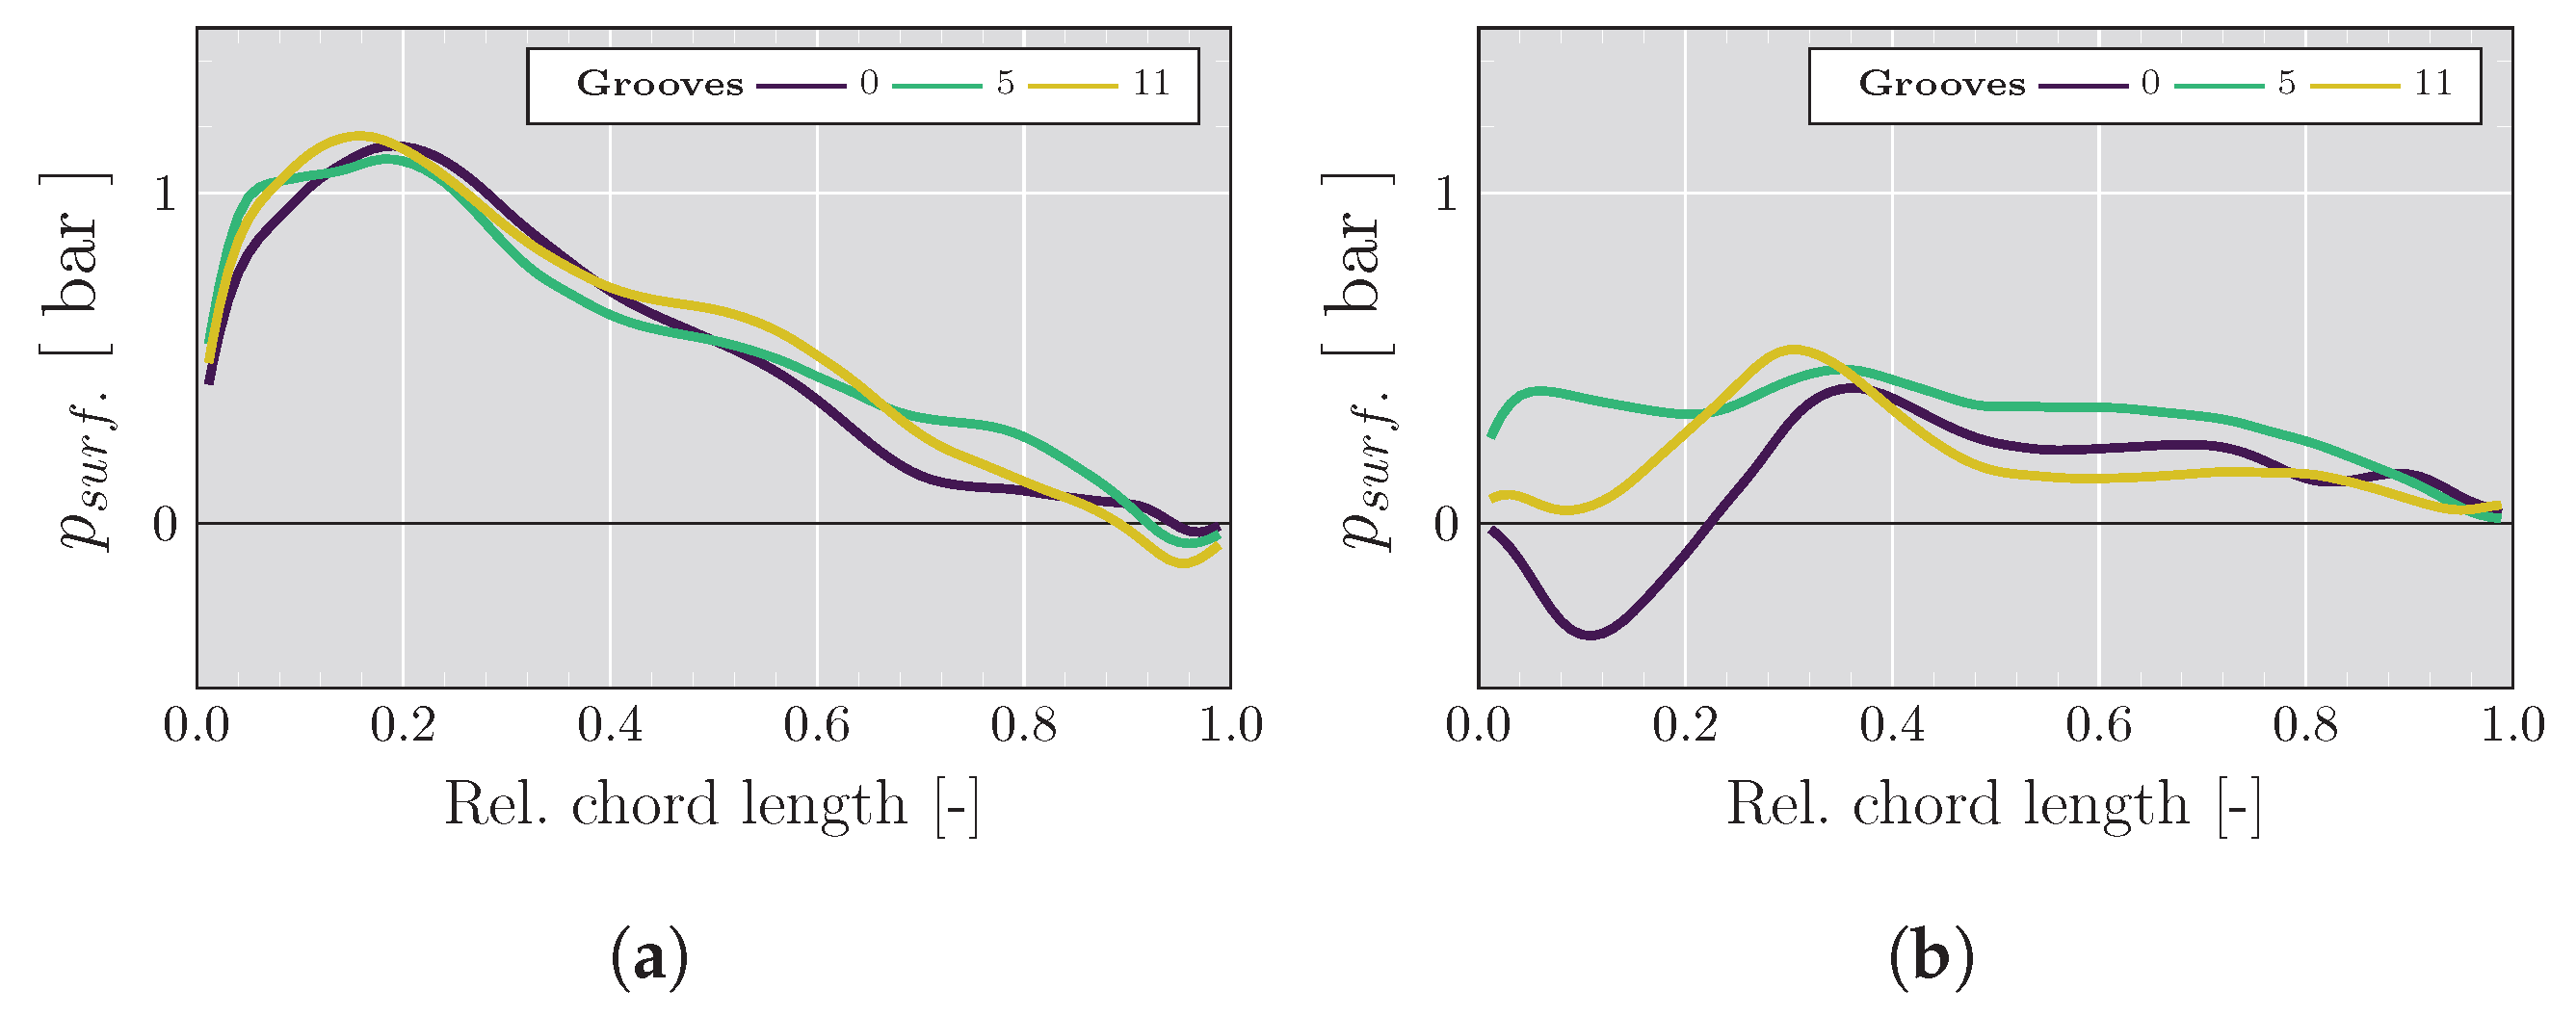
6.1. Influence of Grooved Vanes on the Flow Profile
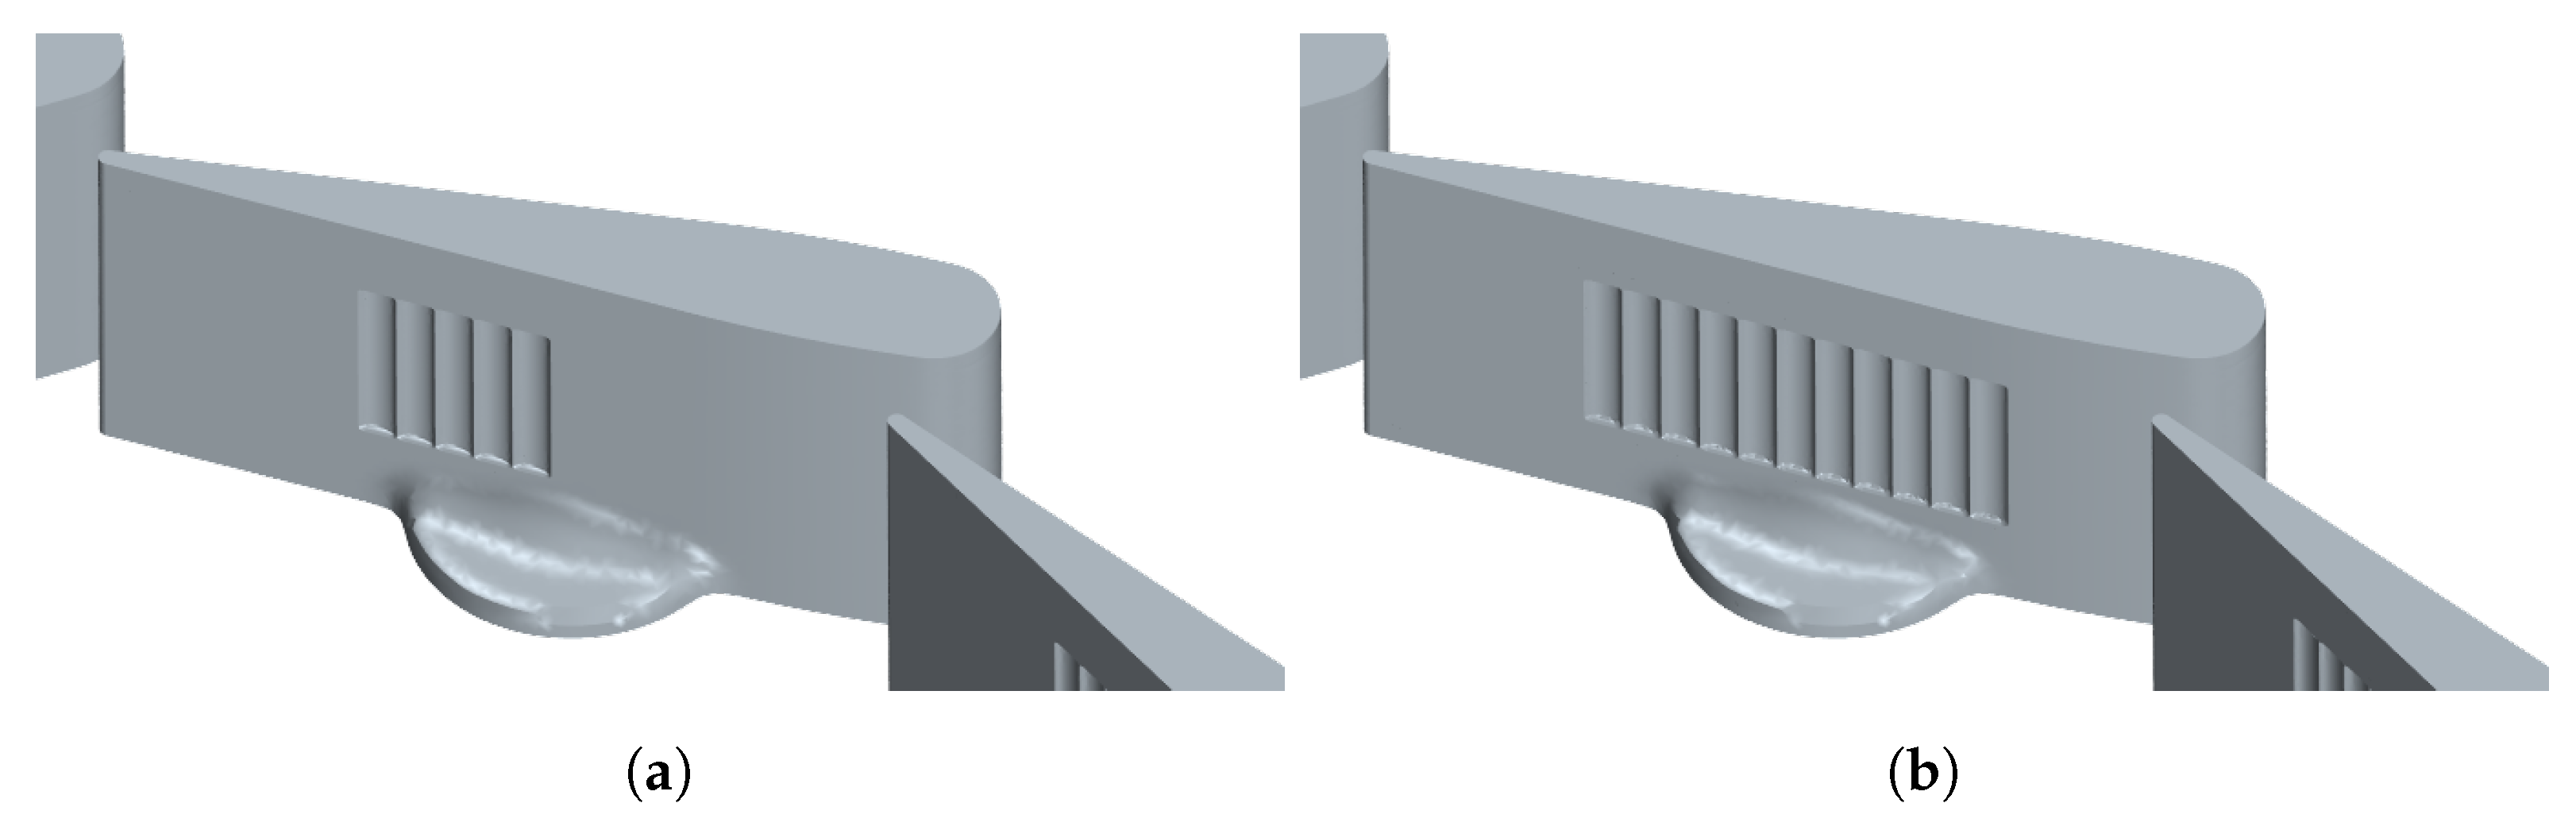
6.2. Shock Wave Structure in Grooved Surface Vanes
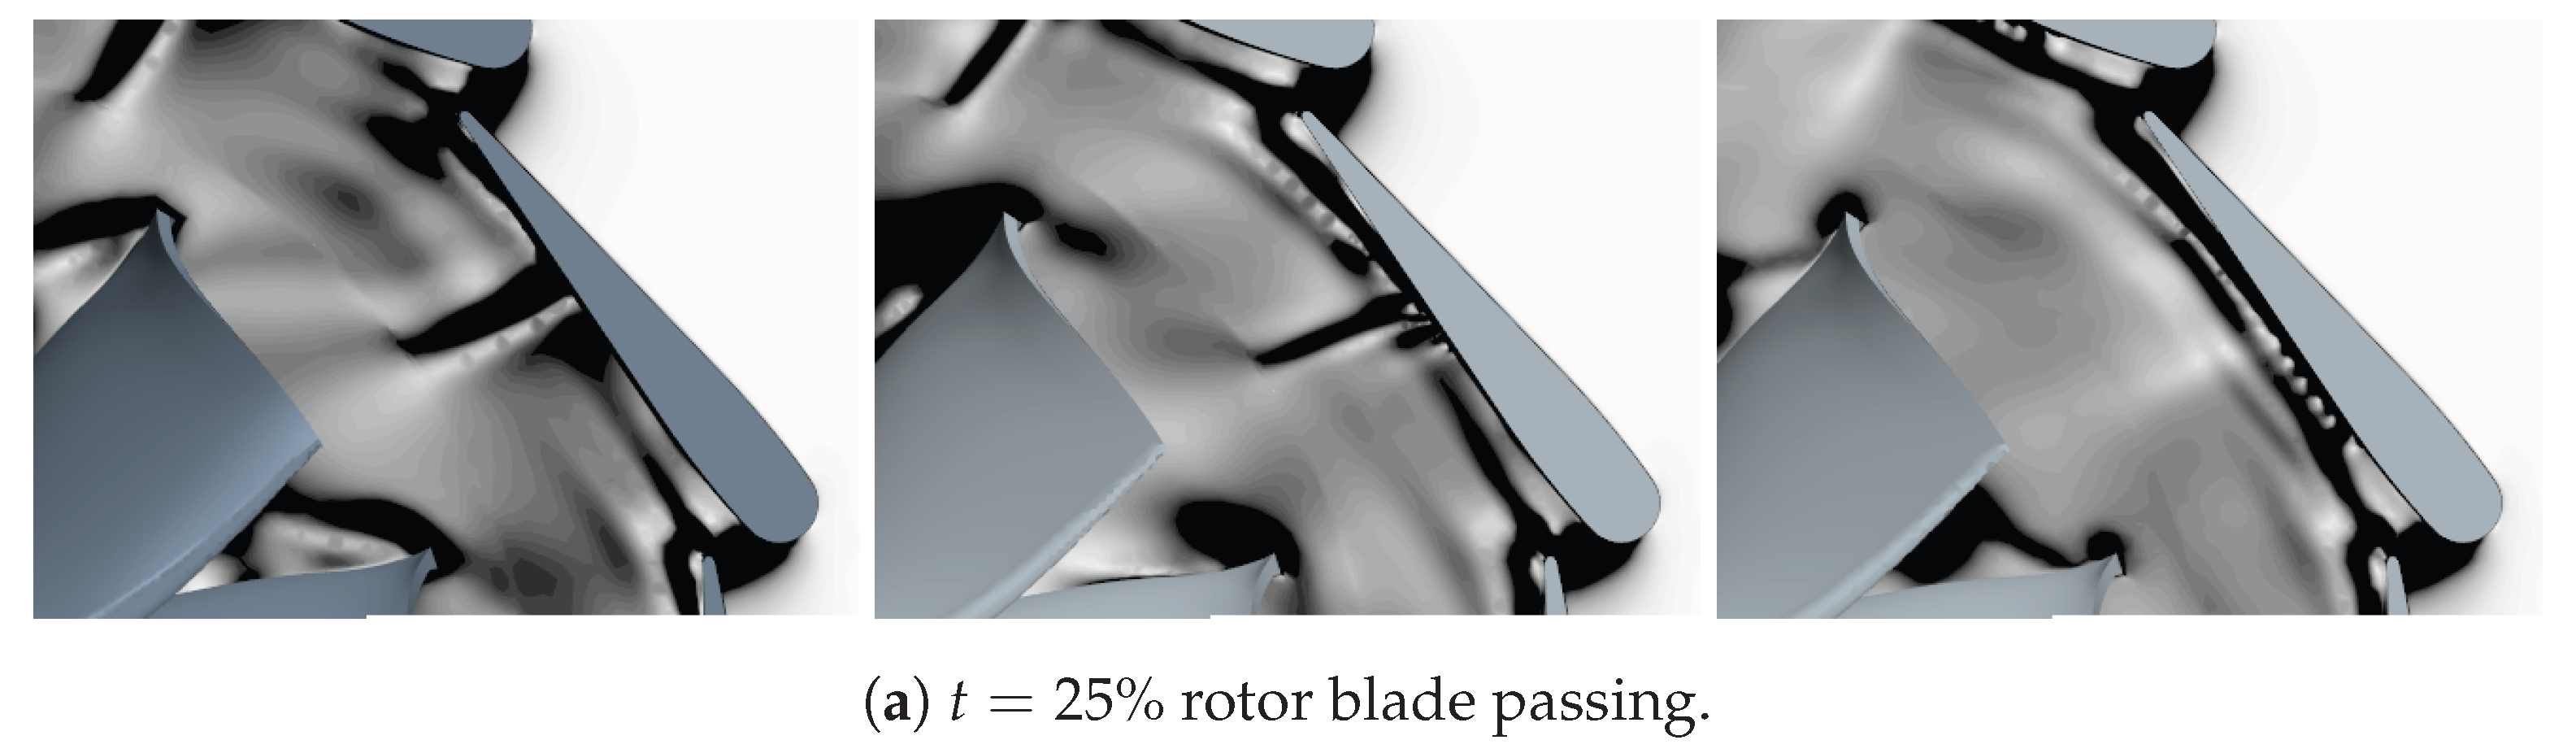
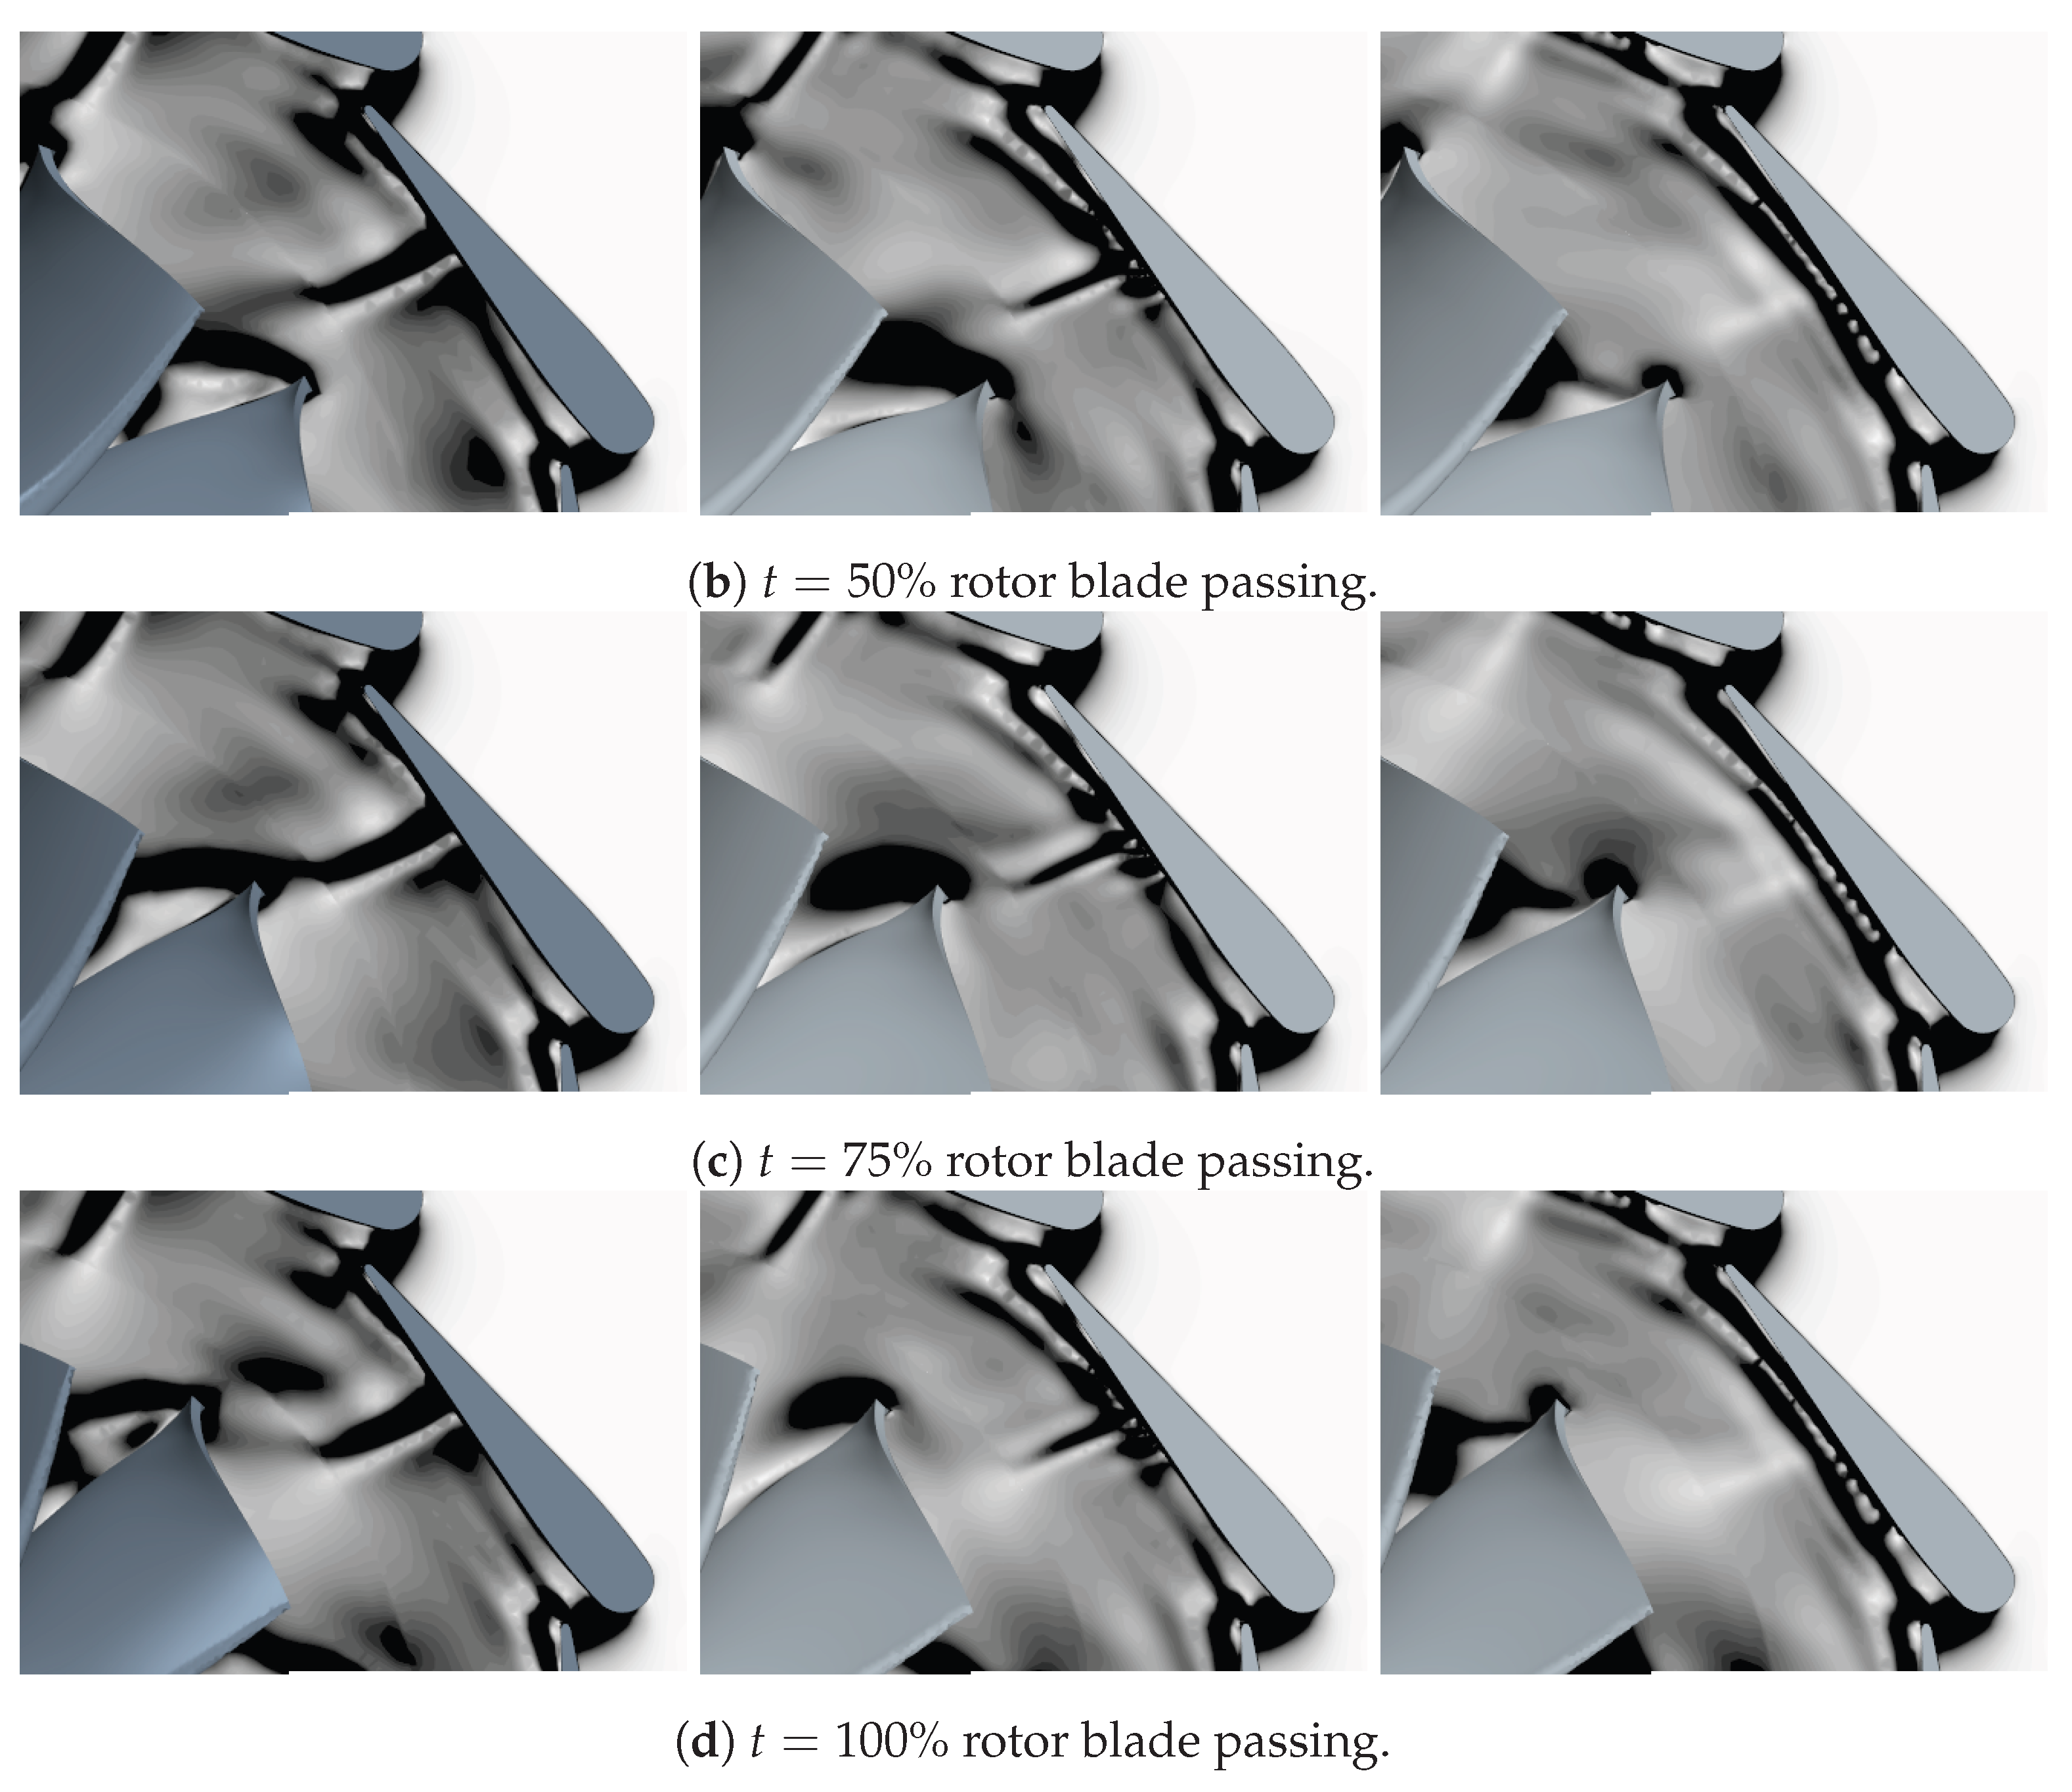
6.3. Effects on the Rotor Blade
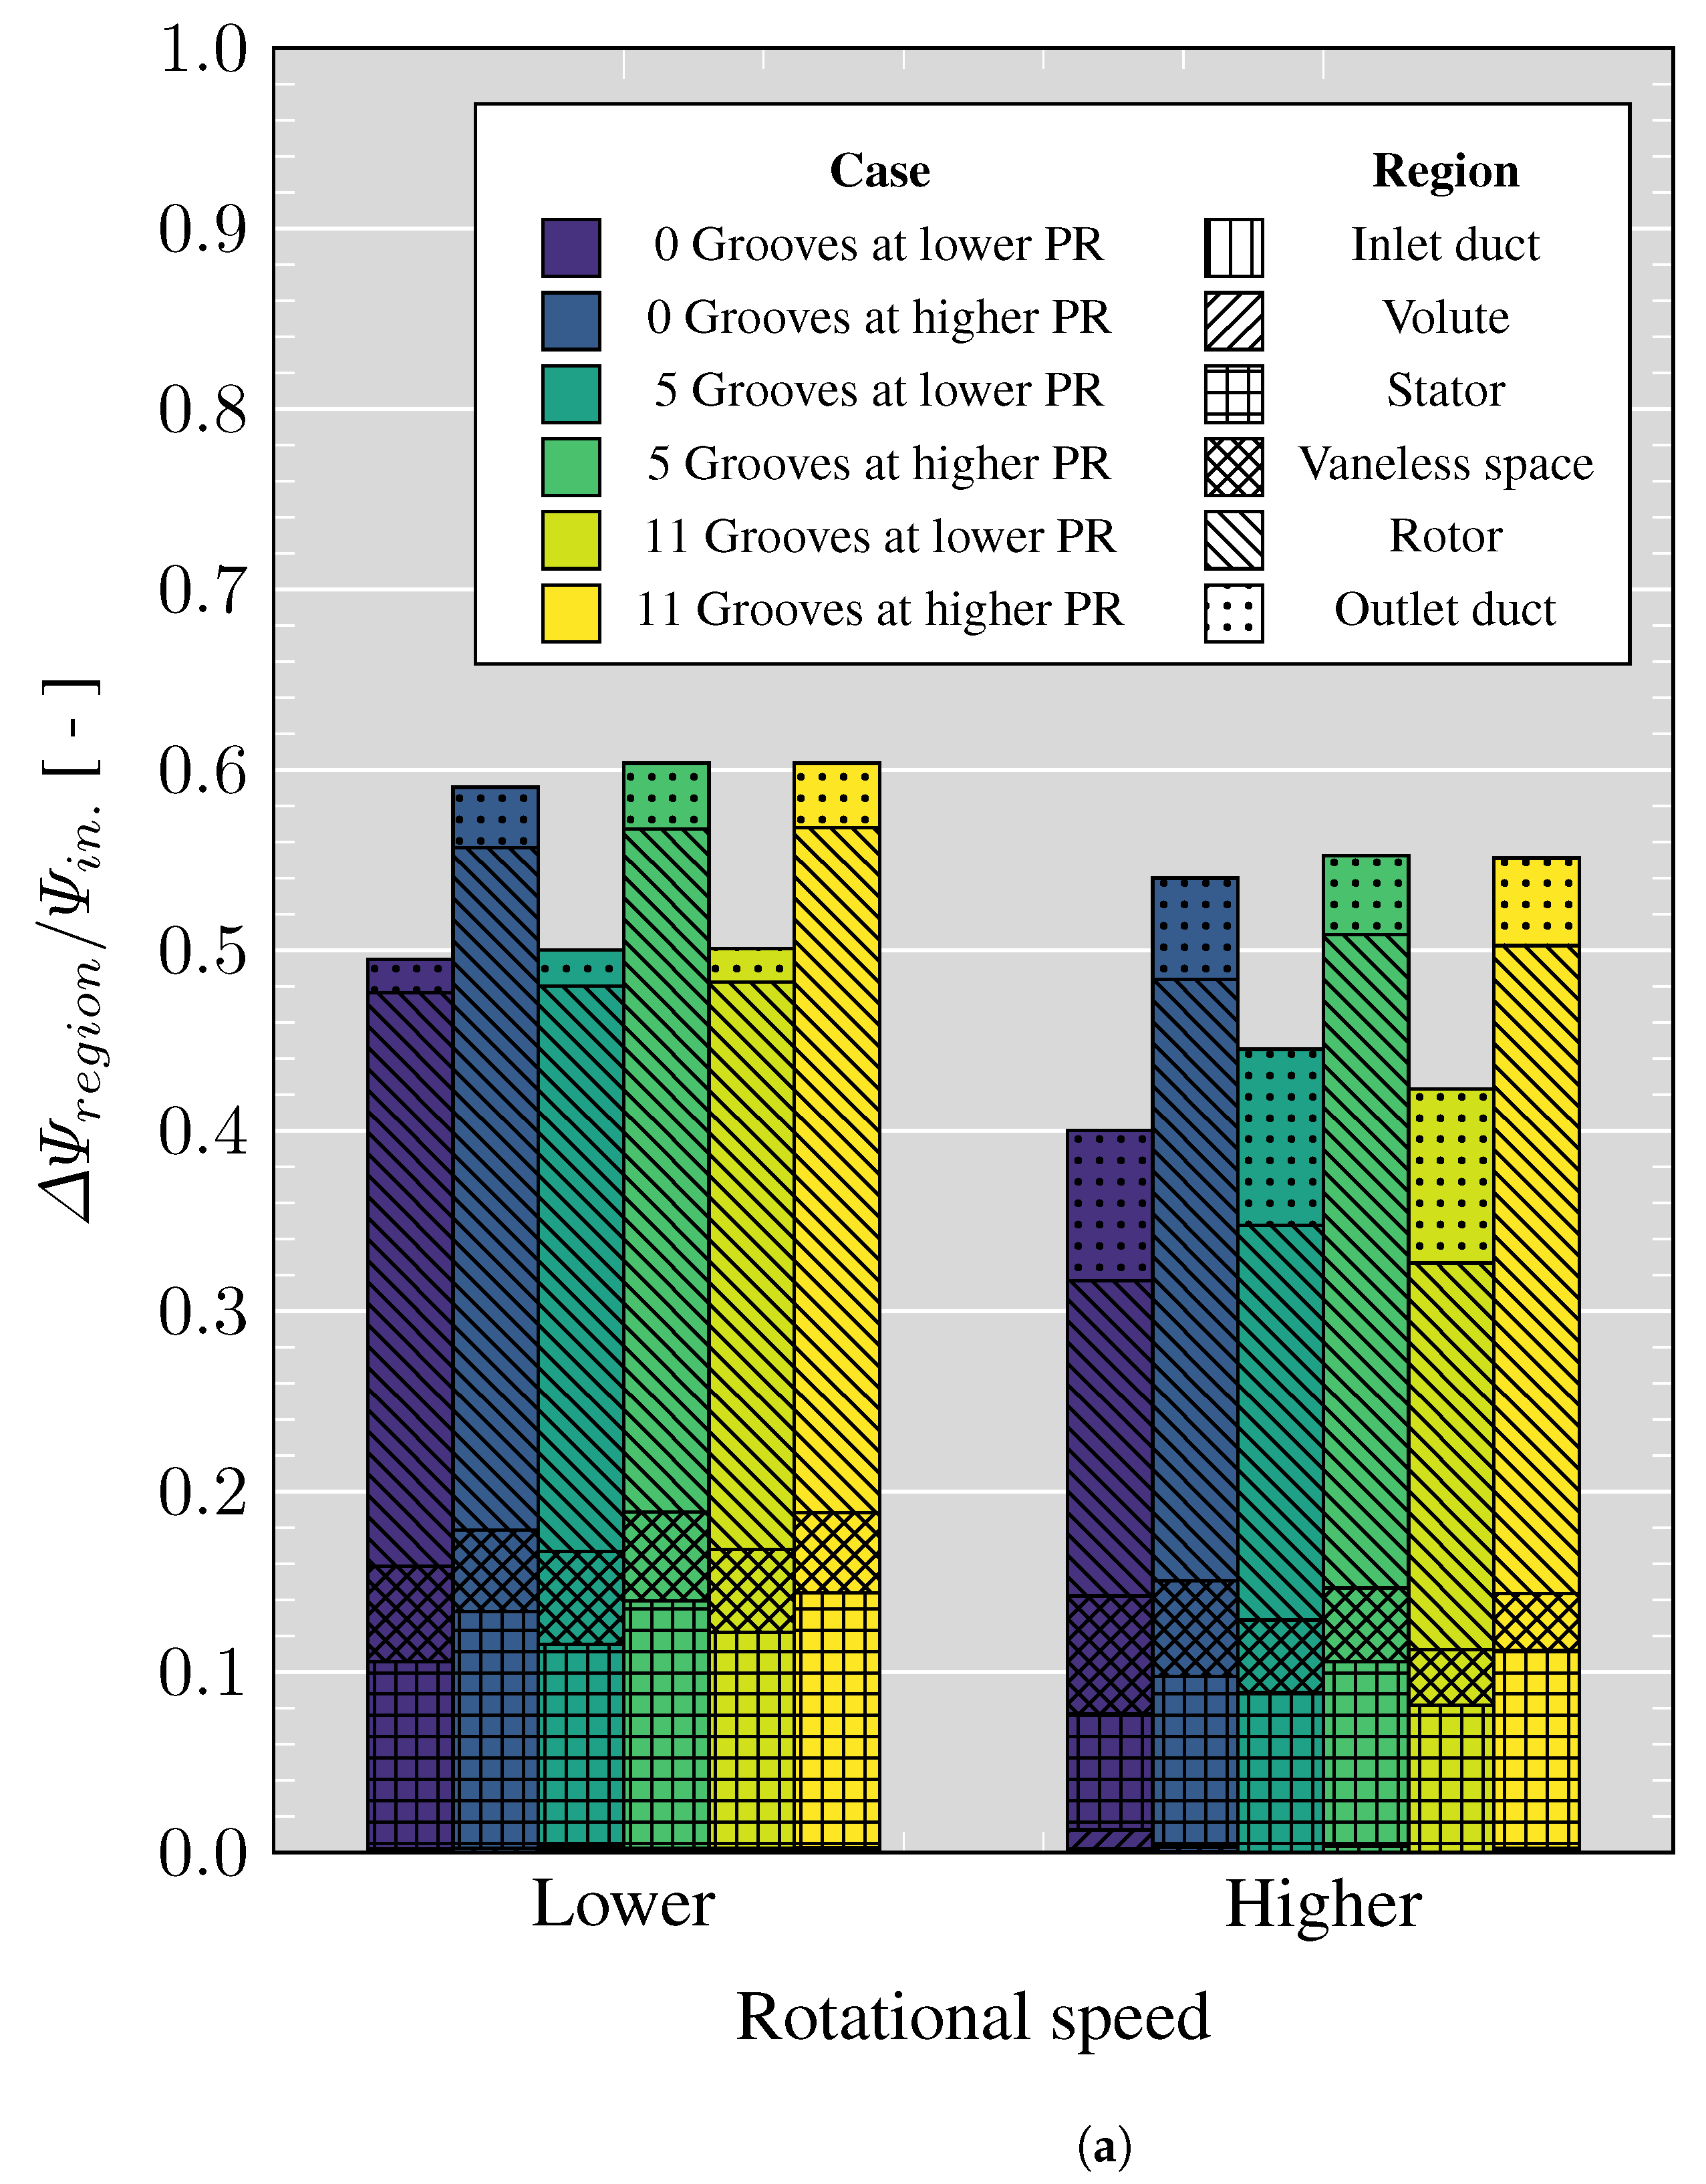
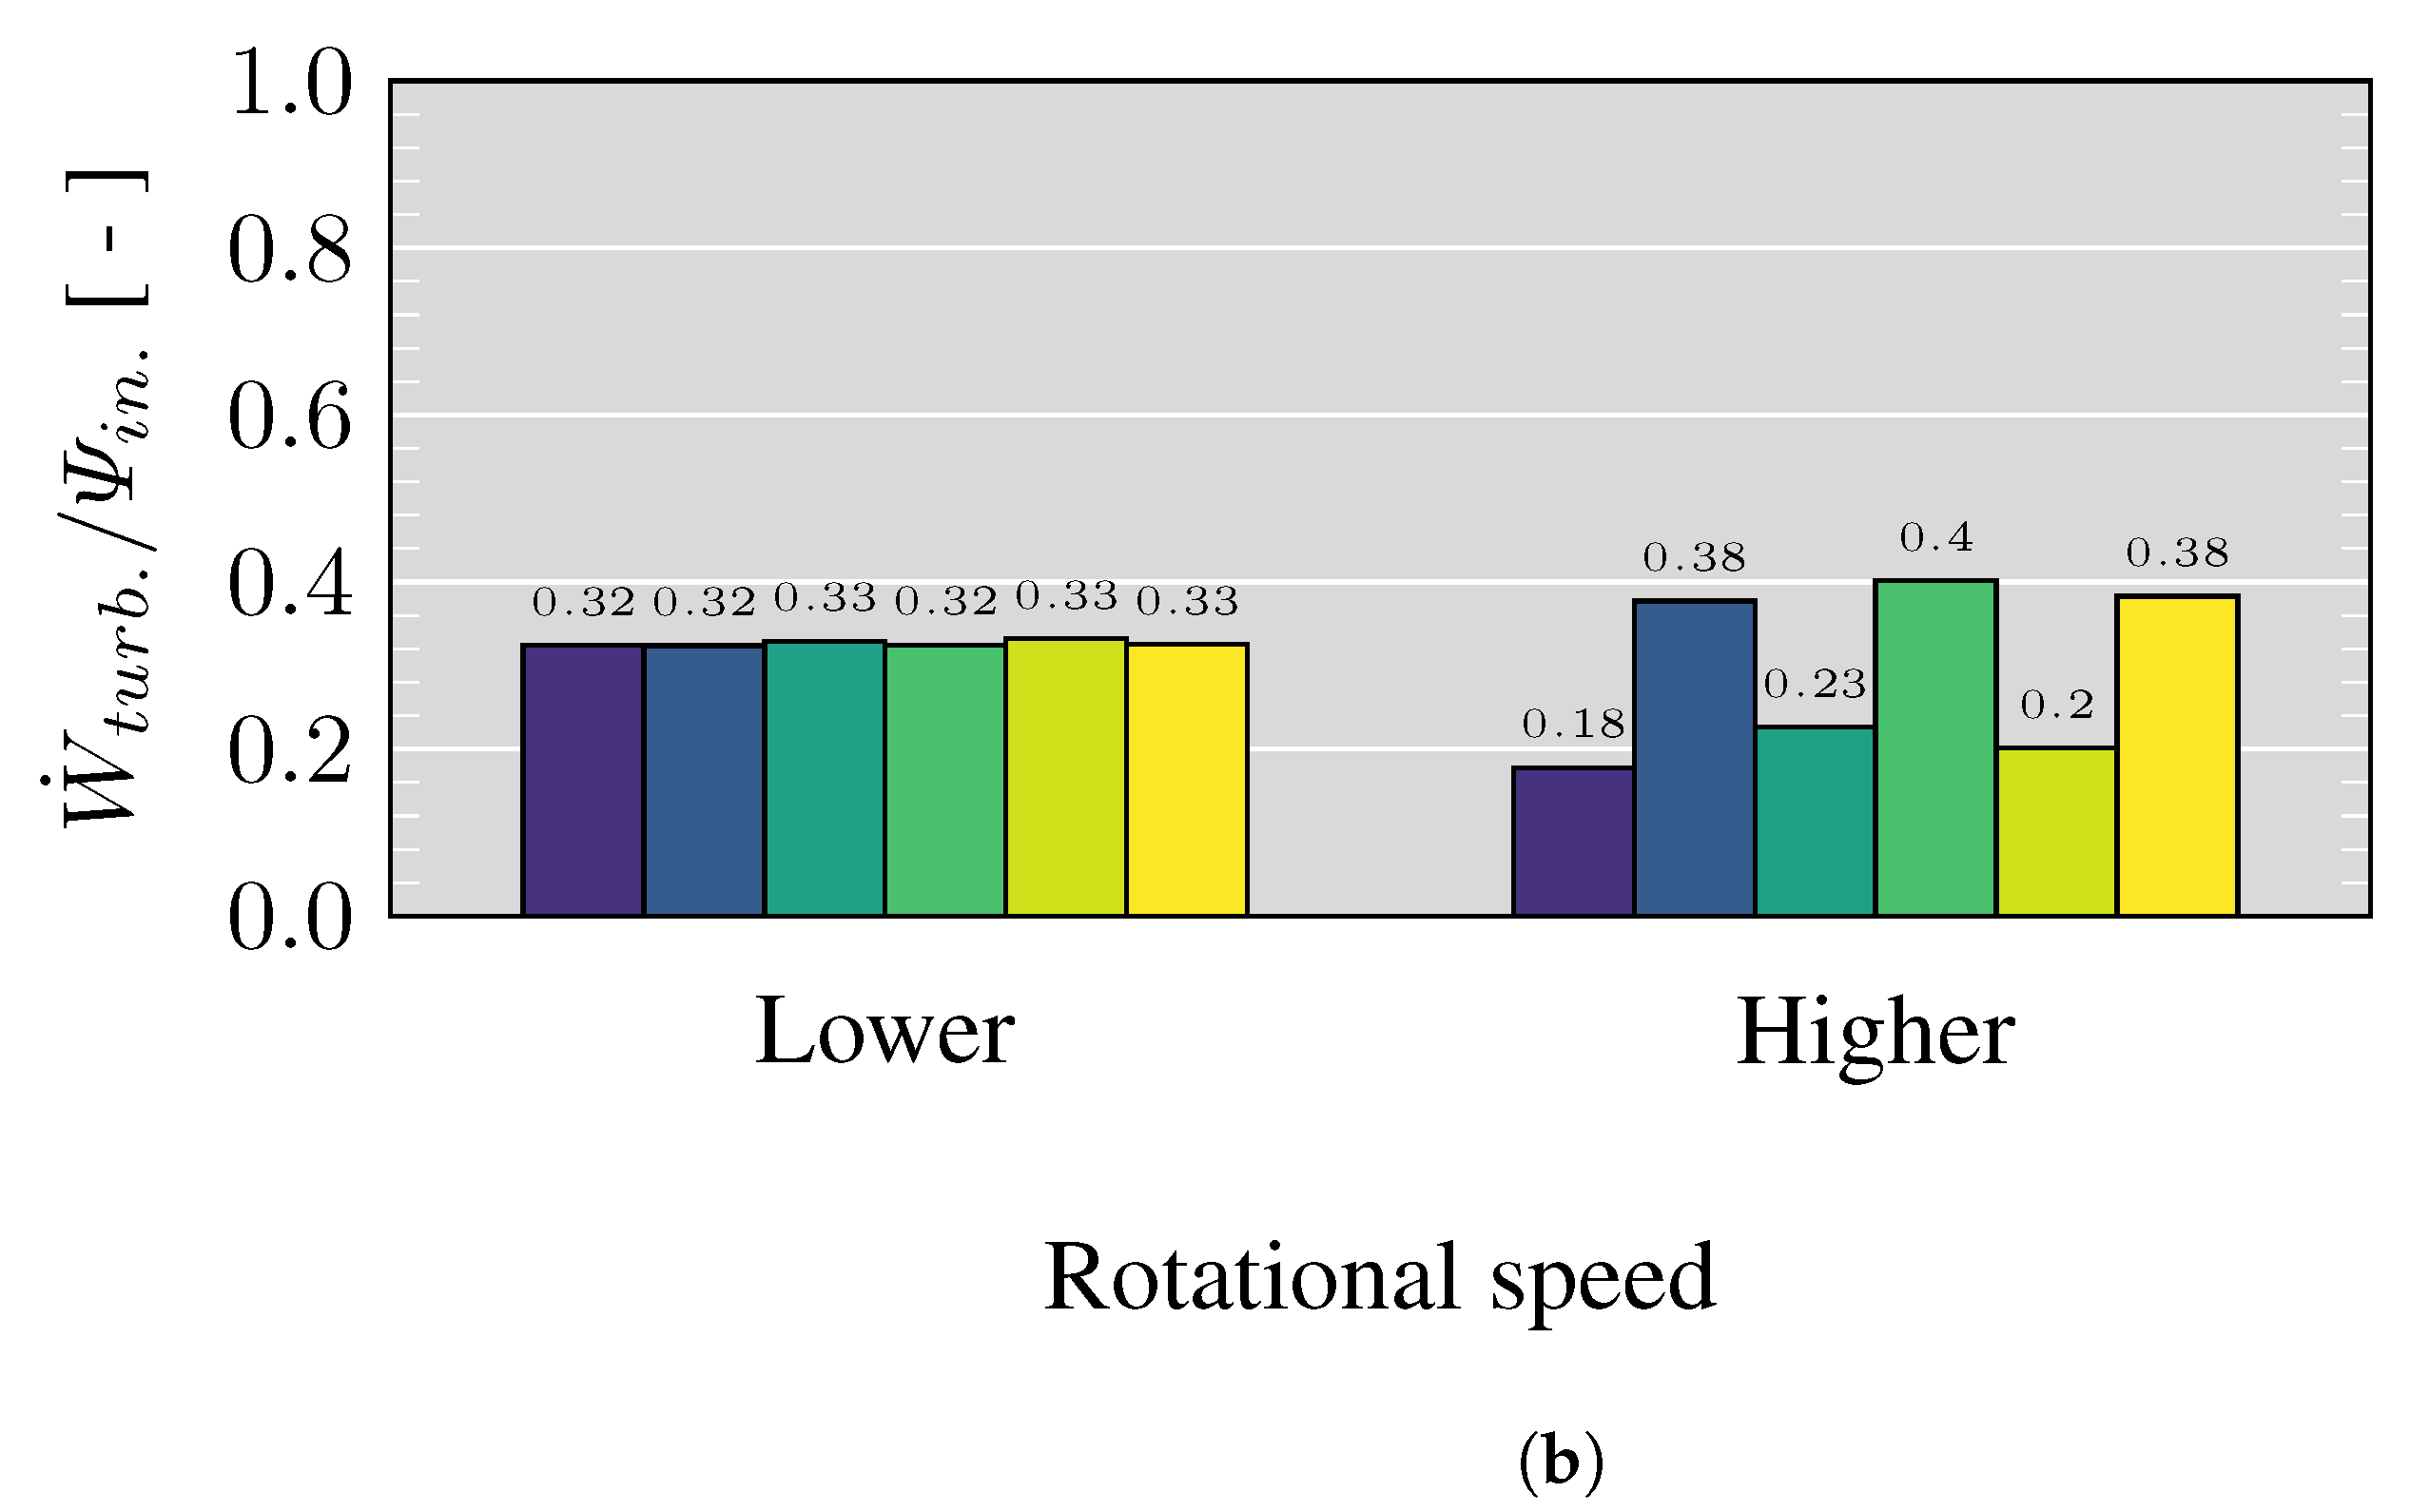
6.4. Exergy Analysis
7. Conclusions and Findings
Author Contributions
Funding
Institutional Review Board Statement
Informed Consent Statement
Data Availability Statement
Acknowledgments
Conflicts of Interest
Abbreviations
| Notations | |
| D | Rotor diameter |
| Mach Number | |
| Mass Flow | |
| Reduced Mass Flow | |
| N | Rotational speed |
| p | Pressure or order of accuracy |
| r | radial coordinate or refinement factor ratio |
| Entropy generation rate per unit volume | |
| T | Temperature |
| t | Time |
| Non-dimensional wall distance | |
| Power | |
| Abbreviations | |
| BSR | Blade speed ratio |
| CFD | Computational Fluid Dynamics |
| GCI | Global Convergence Index |
| LE | Leading Edge |
| PR | Pressure Ratio |
| PS | Pressure Side |
| RANS | Reynolds Average Navier Stokes |
| SS | Suction Side |
| TE | Trailing Edge |
| URANS | Unsteady Reynolds Average Navier Stokes |
| VGT | Variable Geometry Turbine |
| Greek symbols | |
| Stator Blade Angle | |
| Difference | |
| Relative error | |
| Efficiency | |
| Corresponding Pressure Ratio | |
| Density | |
| Subscripts | |
| Turbine Inlet Section | |
| Reduced Numbers | |
| Relative Value | |
| Stator or Rotor Blade Surface | |
| Total or Stagnation Conditions | |
| Total-To-Static Value | |
References
- Kerviel, A.; Pesyridis, A.; Mohammed, A.; Chalet, D. An evaluation of turbocharging and supercharging options for high-efficiency Fuel Cell Electric Vehicles. Appl. Sci. 2018, 8, 2474. [Google Scholar] [CrossRef] [Green Version]
- Bruensicke, W.; Cholvin, R. The turbocharger function in the light aircraft field. In Proceedings of the General Aviation Aircraft Design and Operations Meeting, Wichita, KS, USA, 25–27 May 1964; pp. 1–9. [Google Scholar] [CrossRef]
- Jiménez-Espadafor Aguilar, F.J.; Vélez Godiño, J.A. Innovative power train configurations for aircraft auxiliary power units focused on reducing carbon footprint. Aerosp. Sci. Technol. 2020, 106, 106109. [Google Scholar] [CrossRef]
- Cheng, K.; Qin, J.; Sun, H.; Dang, C.; Zhang, S.; Liu, X.; Bao, W. Performance assessment of an integrated power generation and refrigeration system on hypersonic vehicles. Aerosp. Sci. Technol. 2019, 89, 192–203. [Google Scholar] [CrossRef]
- Abu Kasim, A.F.B.; Chan, M.S.C.; Marek, E.J. Performance and failure analysis of a retrofitted Cessna aircraft with a Fuel Cell Power System fuelled with liquid hydrogen. J. Power Sources 2022, 521, 230987. [Google Scholar] [CrossRef]
- Lück, S.; Wittmann, T.; Göing, J.; Bode, C.; Friedrichs, J. Impact of Condensation on the System Performance of a Fuel Cell Turbocharger. Machines 2022, 10, 59. [Google Scholar] [CrossRef]
- Desantes, J.M.; Novella, R.; Pla, B.; Lopez-Juarez, M. Effect of dynamic and operational restrictions in the energy management strategy on fuel cell range extender electric vehicle performance and durability in driving conditions. Energy Convers. Manag. 2022, 266, 115821. [Google Scholar] [CrossRef]
- Huayin, T. Application of Variable Geometry Turbine on Gasoline Engines and the Optimisation of Transient Behaviours. Ph.D. Thesis, University of Bath, Bath, UK, 2016. [Google Scholar]
- Zhao, B.; Sun, H.; Shi, X.; Qi, M.; Guo, S. Investigation of using multi-shockwave system instead of single normal shock for improving radial inflow turbine reliability. Int. J. Heat Fluid Flow 2018, 71, 170–178. [Google Scholar] [CrossRef] [Green Version]
- Lei, X.; Qi, M.; Sun, H.; Shi, X.; Hu, L. Study on the Interaction of Clearance Flow and Shock Wave in a Turbine Nozzle; SAE Technical Paper 2017-01-10; SAE: Warrendale, PA, USA, 2017; pp. 1–7. [Google Scholar] [CrossRef]
- Liu, Y.; Yang, C.; Qi, M.; Zhang, H.; Zhao, B. Shock, Leakage Flow and Wake Interactions in a Radial Turbine With Variable Guide Vanes. In Proceedings of the ASME Turbo Expo 2014: Turbine Technical Conference and Exposition, Düsseldorf, Germany, 16–20 June 2014. [Google Scholar] [CrossRef]
- Kawakubo, T. Unsteady Rotor-Stator Interaction of a Radial-Inflow Turbine With Variable Nozzle Vanes. In Proceedings of the ASME Turbo Expo 2010: Power for Land, Sea and Air, Glasgow, UK, 14–18 June 2010; pp. 2075–2084. [Google Scholar] [CrossRef]
- Sato, W.; Yamagata, A.; Hattori, H. A Study of Aerodynamic Excitation Forces on a Radial Turbine Blade Due to Rotor-Stator Interaction. In Proceedings of the Institution of Mechanical Engineers—11th International Conference on Turbochargers and Turbocharging, London, UK, 13–14 May 2014; Woodhead Publishing: Oxford, UK, 2014; pp. 389–398. [Google Scholar]
- Yang, D.; Lao, D.; Yang, C.; Hu, L.; Sun, H. Investigations on the Generation and Weakening of Shock Wave in a Radial Turbine With Variable Guide Vanes. In Turbomachinery, Proceedings of the ASME Turbo Expo 2016: Turbomachinery Technical Conference and Exposition, Seoul, Republic of Korea, 13–17 June 2016; ASME: New York, NY, USA; Volume 2D, pp. 1–9. [CrossRef]
- Hu, L.; Yang, C.; Sun, H.; Zhang, J.; Lai, M. Numerical Analysis of Nozzle Clearance’s Effect on Turbine Performance. Chin. J. Mech. Eng. 2011, 24, 618–625. [Google Scholar] [CrossRef]
- Zhao, B.; Yang, C.; Hu, L.; Sun, H.; Yi, J.; Eric, C.; Shi, X.; Engeda, A. Understanding of the Interaction between Clearance Leakage Flow and Main Passage Flow in a VGT Turbine. Adv. Mech. Eng. 2015, 7, 652769. [Google Scholar] [CrossRef]
- Liu, Y.; Lao, D.; Liu, Y.; Yang, C.; Qi, M. Investigation on the effects of nozzle openings for a radial turbine with variable nozzle. In Proceedings of the SAE 2014 World Congress & Exhibition, Detroit, MI, USA, 8–10 April 2014; Volume 1, pp. 1–8. [Google Scholar] [CrossRef]
- Hu, L.; Sun, H.; Yi, J.; Curtis, E.; Morelli, A.; Zhang, J.; Zhao, B.; Yang, C.; Shi, X.; Liu, S. Investigation of nozzle clearance effects on a radial turbine: Aerodynamic performance and forced response. In Proceedings of the SAE 2013 World Congress & Exhibition, Detroit, MI, USA, 16–18 April 2013; Volume 1, pp. 1–11. [Google Scholar] [CrossRef]
- Paniagua, G.; Yasa, T.; De La Loma, A.; Castillon, L.; Coton, T. Unsteady strong shock interactions in a transonic turbine: Experimental and numerical analysis. J. Propuls. Power 2008, 24, 722–731. [Google Scholar] [CrossRef]
- Chen, H. Turbine wheel design for Garrett advanced variable geometry turbines for commercial vehicle applications. In 8th International Conference on Turbochargers and Turbocharging; Woodhead Publishing: Sawston, UK, 2006; pp. 317–327. [Google Scholar] [CrossRef]
- Rubechini, F.; Marconcini, M.; Arnone, A.; Del Greco, A.S.; Biagi, R. Special Challenges in the CFD Modeling of Transonic Turbo-Expanders. In Proceedings of the ASME Turbo Expo 2013: Turbine Technical Conference and Exposition; ASME: San Antonio, TX, USA, 2013; pp. 1–10. [Google Scholar] [CrossRef]
- Sonoda, T.; Arima, T.; Olhofer, M.; Sendhoff, B.; Kost, F.; Giess, P.A. A Study of Advanced High-Loaded Transonic Turbine Airfoils. J. Turbomach. 2004, 128, 650–657. [Google Scholar] [CrossRef]
- Yang, D.; Wang, K.; Wang, H.; Zhang, Q.; Lei, X.; Hu, L. An Investigation of the Performance and Internal Flow of Variable Nozzle Turbines with Split Sliding Guide Vanes. Machines 2022, 10, 1084. [Google Scholar] [CrossRef]
- Chaudhuri, A.; Hadjadj, A.; Sadot, O.; Glazer, E. Computational study of shock-wave interaction with solid obstacles using immersed boundary methods. Int. J. Numer. Methods Eng. 2012, 89, 975–990. [Google Scholar] [CrossRef]
- Wan, Q.; Eliasson, V. Numerical Study of Shock Wave Attenuation in Two-Dimensional Ducts Using Solid Obstacles: How to Utilize Shock Focusing Techniques to Attenuate Shock Waves. Aerospace 2015, 2, 203–221. [Google Scholar] [CrossRef] [Green Version]
- Lei, X.; Qi, M.; Sun, H.; Hu, L. Investigation on the Shock Control Using Grooved Surface in a Linear Turbine Nozzle. J. Turbomach. 2017, 139, 121008. [Google Scholar] [CrossRef]
- Zhao, B.; Qi, M.; Sun, H.; Shi, X.; Ma, C. Experimental and Numerical Investigation on the Shock Wave Structure Alterations and Available Energy Loss Variations With a Grooved Nozzle Vane. J. Turbomach. 2019, 141, 051001. [Google Scholar] [CrossRef]
- Zhao, B.; Hu, L.; Sun, H.; Yang, C.; Shi, X.; Yi, J.; Curtis, E.; Engeda, A. Numerical Investigation of a Novel Approach for Mitigation of Forced Response of a Variable Geometry Turbine During Exhaust Braking Mode. In Microturbines, Turbochargers and Small Turbomachines, Proceedings of the ASME Turbo Expo 2016: Turbomachinery Technical Conference and Exposition, Seoul, Republic of Korea, 13–17 June 2016; ASME: New York, NY, USA, 2016; Volume 8. [Google Scholar] [CrossRef]
- Zhang, S.; Ding, S.; Liu, P.; Qiu, T. Effect of Hot Streak on Aerothermal Performance of High Pressure Turbine Guide Vane under Different Swirl Intensities. Aerospace 2022, 9, 579. [Google Scholar] [CrossRef]
- Bhide, K.; Siddappaji, K.; Abdallah, S.; Roberts, K. Improved Supersonic Turbulent Flow Characteristics Using Non-Linear Eddy Viscosity Relation in RANS and HPC-Enabled LES. Aerospace 2021, 8, 352. [Google Scholar] [CrossRef]
- Serrano, J.R.; Gil, A.; Navarro, R.; Inhestern, L.B. Extremely low mass flow at high blade to jet speed ratio in variable geometry radial turbines and its influence on the flow pattern a CFD analysis. In Proceedings of the ASME Turbo Expo 2017: Turbomachinery Technical Conference and Exposition, Charlotte, NC, USA, 26–30 June 2017; 2017; pp. 1–13. [Google Scholar] [CrossRef]
- Tiseira, A.; García-Cuevas, L.M.; Inhestern, L.B.; Echavarría, J.D. Development of Choked Flow in Variable Nozzle Radial Turbines. Int. J. Engine Res. 2021, 23, 1388–1405. [Google Scholar] [CrossRef]
- Tiseira, A.; Dolz, V.; Inhestern, L.B.; Echavarría, J.D. Choking dynamic of highly swirled flow in variable nozzle radial turbines. Aerosp. Sci. Technol. 2022, 122, 107396. [Google Scholar] [CrossRef]
- Serrano, J.R.; Garcia-Cuevas, L.M.; Inhestern, L.B.; Mai, H.; Rinaldi, A.; Sanchez, A.M. Methodology to Evaluate Turbocharger Turbine Performance at High Blade to Jet Speed Ratio Under Quasi Adiabatic Conditions. In Proceedings of the ASME Turbo Expo 2017: Turbomachinery Technical Conference and Exposition, Charlotte, NC, USA, 26–30 June 2017; pp. 1–14. [Google Scholar] [CrossRef]
- SAE Engine Power Test Code Committee. Turbocharger Gas Stand Test Code; Ground Vehicle Standard; SAE International: Warrendale, PA, USA, 1995; pp. 1–12. [Google Scholar] [CrossRef]
- Siemens Digital Industries Software. STAR-CCM + 2019.1 User Guide Release version 14.02.010-R8. pp. 26–7402. Available online: https://www.plm.automation.siemens.com/global/es/products/simcenter/STAR-CCM.html (accessed on 27 March 2023).
- Wheeler, A.P.S.; Korakianitis, T.; Banneheke, S. Tip-Leakage Losses in Subsonic and Transonic Blade Rows. J. Turbomach. 2012, 135, 011029. [Google Scholar] [CrossRef]
- Menter, F.R. Two-equation eddy-viscosity turbulence models for engineering applications. AIAA J. 1994, 32, 1598–1605. [Google Scholar] [CrossRef] [Green Version]
- Menter, F.R.; Langtry, R.; Hansen, T. CFD simulation of turbomachinery flows—Verfication, validation and modelling. In Proceedings of the ECCOMAS 2004—European Congress on Computational Methods in Applied Sciences and Engineering, Jyväskylä, Finland, 24–28 July 2004; pp. 1–14. [Google Scholar]
- Simpson, A.T.; Spence, S.W.T.; Watterson, J.K. A Comparison of the Flow Structures and Losses Within Vaned and Vaneless Stators for Radial Turbines. J. Turbomach. 2009, 131, 1–15. [Google Scholar] [CrossRef]
- Galindo, J.; Fajardo, P.; Navarro, R.; García-Cuevas, L.M. Characterization of a radial turbocharger turbine in pulsating flow by means of CFD and its application to engine modeling. Appl. Energy 2013, 103, 116–127. [Google Scholar] [CrossRef]
- Xue, Y.; Yang, M.; Pan, L.; Deng, K.; Wu, X.; Wang, C. Gasdynamic behaviours of a radial turbine with pulsating incoming flow. Energy 2021, 218, 119523. [Google Scholar] [CrossRef]
- Galindo, J.; Serrano, J.R.; García-Cuevas, L.M.; Medina, N. Twin-entry turbine losses: An analysis using CFD data. Int. J. Engine Res. 2021, 23, 1180–1200. [Google Scholar] [CrossRef]
- Zhao, B.; Qi, M.; Sun, H.; Shi, X.; Ma, C. A comprehensive analysis on the structure of groove-induced shock waves in a linear turbine. Aerosp. Sci. Technol. 2019, 87, 331–339. [Google Scholar] [CrossRef]
- Ananthakrishnan, K.; Govardhan, M. Influence of fillet shapes on secondary flow field in a transonic axial flow turbine stage. Aerosp. Sci. Technol. 2018, 82–83, 425–437. [Google Scholar] [CrossRef]
- Galindo, J.; Hoyas, S.; Fajardo, P.; Navarro, R. Set-Up Analysis and Optimization of CFD Simulations for Radial Turbines. Eng. Appl. Comput. Fluid Mech. 2013, 7, 441–460. [Google Scholar] [CrossRef] [Green Version]
- Galindo, J.; Serrano, J.R.; García-Cuevas, L.M.; Medina, N. Using a CFD analysis of the flow capacity in a twin-entry turbine to develop a simplified physics-based model. Aerosp. Sci. Technol. 2021, 112, 106623. [Google Scholar] [CrossRef]
- Serrano, J.R.; Arnau, F.J.; De la Morena, J.; Gómez-vilanova, A.; Guilain, S.; Batard, S. A methodology to calibrate gas-dynamic models of turbocharged petrol engines with variable geometry turbines and with focus on dynamics prediction during tip-in load transient tests. In Proceedings of the ASME Turbo Expo 2020: Turbomachinery Technical Conference and Exposition, Virtual, 21–25 September 2020; pp. 1–14. [Google Scholar] [CrossRef]
- Serrano, J.R.; Tiseira, A.; García-Cuevas, L.M.; Inhestern, L.B.; Tartoussi, H. Radial turbine performance measurement under extreme off-design conditions. Energy 2017, 125, 72–84. [Google Scholar] [CrossRef] [Green Version]
- Mendonça, F.; Clement, J.; Palfreyman, D.; Peck, A. Validation of unstructured CFD modelling applied to the conjugate heat transfer in turbine blade cooling. In Proceedings of the ETC_8-198, European Turbomachinery Conference, Graz, Austria, 24–28 April 2008. [Google Scholar]
- Roache, P.J. Perspective: A Method for Uniform Reporting of Grid Refinement Studies. J. Fluids Eng. 1994, 116, 405–413. [Google Scholar] [CrossRef]
- Asghar, M.A.; Liu, Y.; Cui, J.; Lu, L. Investigation of Unsteady Flow Interactions in a Transonic High Pressure Turbine Using Nonlinear Harmonic Method. Energies 2018, 11, 342. [Google Scholar] [CrossRef] [Green Version]
- Li, L.; Tan, W.; Zhang, J.; Han, G.; Zhang, Y. Unsteady Effects of Wake on Downstream Rotor at Low Reynolds Numbers. Energies 2022, 15, 6692. [Google Scholar] [CrossRef]
- Zhao, B.; Qi, M.; Zhang, H.; Shi, X. Investigation on effects of shock wave on vortical wake flow in a turbine nozzle cascade. Aerosp. Sci. Technol. 2020, 98, 105690. [Google Scholar] [CrossRef]
- Bian, X.; Wang, Q.; Su, X.; Yuan, X. Interaction mechanisms of shock waves with the boundary layer and wakes in a highly-loaded NGV using hybrid RANS/LES. Chin. J. Aeronaut. 2020, 33, 149–160. [Google Scholar] [CrossRef]
- Léonard, T.; Gicquel, L.Y.M.; Gourdain, N.; Duchaine, F. Steady/Unsteady Reynolds-Averaged Navier–Stokes and Large Eddy Simulations of a Turbine Blade at High Subsonic Outlet Mach Number. J. Turbomach. 2014, 137, 041001. [Google Scholar] [CrossRef]
- Hancock, B.J.; Clark, J.P. Reducing Shock Interactions in Transonic Turbine via Three-Dimensional Aerodynamic Shaping. J. Propuls. Power 2014, 30, 1248–1256. [Google Scholar] [CrossRef] [Green Version]
- Zhao, B.; Shi, X.; Sun, H.; Qi, M.; Song, P. Effects of grooved vanes on shock wave and forced response in a turbocharger turbine. Int. J. Engine Res. 2021, 22, 805–814. [Google Scholar] [CrossRef]


| Stator | |
|---|---|
| Stator vane number | 11 |
| Tip clearance | 0.2 mm |
| Nozzle vane height | 8 mm |
| Chord length | 18.95 mm |
| Vane angle | 78.34 |
| (VGT opening) | (10%) |
| Vane throat area | 11.88 mm2 |
| Vless space throat area | 60.48 mm2 |
| Rotor | |
| Inlet diameter | 41 mm |
| Outlet diameter | 38 mm |
| Blade number | 9 |
| Outlet blade angle | 59 |
| Tip clearance | 0.36 mm to 0.4 mm |
| Grooves [-] | Dev. [%] | Dev. [%] | [% points] | |
|---|---|---|---|---|
| 0 | −0.05 | 0.006 | −0.13 | |
| 5 | 3882 | 0.48 | 0.06 | 5.34 |
| 11 | 0.49 | −0.13 | 1.90 | |
| 0 | −0.56 | 0.35 | 1.17 | |
| 5 | 8421 | 0.66 | 0.61 | 1.13 |
| 11 | −0.41 | 0.55 | 2.80 |
| Core Mesh | Bounday Layer | Cells Number | ||||||
|---|---|---|---|---|---|---|---|---|
| [] | [] | [] | [-] | [-] | [] | [] | ||
| medium | 15 | 8.65 | 0.17693 | 1.5001 | 1.0243 | 0.9952 | 2.41912 | 240.3590 |
| medium | 20 | 10.07 | 0.17641 | 1.4909 | 1.0173 | 1.0077 | 2.42284 | 240.1054 |
| finer | 20 | 12.89 | 0.17648 | 1.4917 | 1.0081 | 0.9862 | 2.41902 | 239.5689 |
| GCI (for medium 15 boundary layer)[%] | 0.62 | 1.39 | 3.97 | 2.23 | 0.01 | 0.81 | ||
| GCI (for medium 20 boundary layer)[%] | 0.10 | 0.13 | 2.25 | 5.38 | 0.39 | 0.55 | ||
| Region | Cell Skewness Angle [] | Volume Change [-] | Cell Quality [-] |
| Inlet | 5.03 | 0.66 | 0.91 |
| Volute and stator | 22.35 | 0.60 | 0.58 |
| Rotor | 16.89 | 0.60 | 0.57 |
| Outlet | 12.78 | 0.64 | 0.67 |
| Turbine | Stator | ||||||
|---|---|---|---|---|---|---|---|
| Grooves | |||||||
| [-] | [-] | [-] | [-] | [-] | |||
| 0 | 3882 | lower | 2.95 | 0.43 | 278.82 | 1.21 | 0.69 |
| higher | 5.16 | 0.41 | 307.88 | 1.34 | 0.83 | ||
| 8421 | lower | 2.64 | 0.27 | 238.00 | 1.12 | 0.73 | |
| higher | 4.48 | 0.51 | 285.09 | 1.22 | 0.71 | ||
| 5 | 3882 | lower | 2.95 | 0.44 | 272.22 | 1.23 | 0.67 |
| higher | 5.19 | 0.41 | 308.98 | 1.37 | 0.84 | ||
| 8421 | lower | 2.70 | 0.32 | 231.37 | 1.16 | 0.67 | |
| higher | 4.52 | 0.54 | 282.57 | 1.26 | 0.70 | ||
| 11 | 3882 | lower | 2.95 | 0.44 | 269.90 | 1.25 | 0.65 |
| higher | 5.18 | 0.41 | 306.83 | 1.39 | 0.83 | ||
| 8421 | lower | 2.66 | 0.30 | 225.56 | 1.17 | 0.65 | |
| higher | 4.48 | 0.53 | 277.98 | 1.28 | 0.68 | ||
Disclaimer/Publisher’s Note: The statements, opinions and data contained in all publications are solely those of the individual author(s) and contributor(s) and not of MDPI and/or the editor(s). MDPI and/or the editor(s) disclaim responsibility for any injury to people or property resulting from any ideas, methods, instructions or products referred to in the content. |
© 2023 by the authors. Licensee MDPI, Basel, Switzerland. This article is an open access article distributed under the terms and conditions of the Creative Commons Attribution (CC BY) license (https://creativecommons.org/licenses/by/4.0/).
Share and Cite
Galindo, J.; Tiseira, A.; Navarro, R.; Inhestern, L.B.; Echavarría, J.D. Numerical Analysis of the Effects of Grooved Stator Vanes in a Radial Turbine Operating at High Pressure Ratios Reaching Choked Flow. Aerospace 2023, 10, 359. https://doi.org/10.3390/aerospace10040359
Galindo J, Tiseira A, Navarro R, Inhestern LB, Echavarría JD. Numerical Analysis of the Effects of Grooved Stator Vanes in a Radial Turbine Operating at High Pressure Ratios Reaching Choked Flow. Aerospace. 2023; 10(4):359. https://doi.org/10.3390/aerospace10040359
Chicago/Turabian StyleGalindo, José, Andrés Tiseira, Roberto Navarro, Lukas Benjamin Inhestern, and Juan David Echavarría. 2023. "Numerical Analysis of the Effects of Grooved Stator Vanes in a Radial Turbine Operating at High Pressure Ratios Reaching Choked Flow" Aerospace 10, no. 4: 359. https://doi.org/10.3390/aerospace10040359