
Numerical Investigation of Bio-Aviation Fuel: Dubai’s Future Perspective

School of Engineering, Emirates Aviation University, Dubai International Academic City, Dubai P.O. Box 53044, United Arab Emirates
*
Author to whom correspondence should be addressed.
Aerospace 2023, 10(4), 338; https://doi.org/10.3390/aerospace10040338
Submission received: 31 December 2022
/
Revised: 15 February 2023
/
Accepted: 16 February 2023
/
Published: 28 March 2023
(This article belongs to the Special Issue Selected Papers from the 4th International Aviation Management Conference)
Abstract
:As part of the United Arab Emirates’ and the world’s aviation goal of reaching net-zero greenhouse gas emissions by 2050, this paper studied the potential of successfully implementing both biofuel “drop-in” alternatives and aerodynamically efficient configurations to decarbonize the aviation industry. By investigating various proposed designs through a PUGH analysis, it was concluded that the optimum design has a Transonic Truss-Braced Wing configuration and runs on 60% biofuel. Although the design stipulates a 1.3% increase in weight, this does not negate the reduction in emissions and fuel consumption. This study also explored the various types of biofuels and found camelina seeds to be the best choice. The effects of biofuels in comparison with Jet-A fuel were further deliberated in a fuel combustion simulation performed on the Ansys-Fluent software. The results of the simulation showed a reduction of 50% in carbon monoxide (CO) and 24% in carbon dioxide (CO2) emissions when burning camelina biofuel rather than Jet-A, making it an ideal alternative to those conventional jet fuels. A primary cost analysis of biofuel applications showed an increase of 453 USD (1653.18 AED) per passenger flying on board 100%-biofuel-powered aircrafts. Yet, considering the trend of the cost increase with the biofuel blend ratio, a solution may exist to the increased cost of biofuel-powered aircrafts.
1. Introduction
Global warming and climate change are some of the hottest topics in recent times, and have been discussed by scientists for decades. The annual temperature increase of the globe has continued since the beginning of the industrial revolution and the accompanying technological developments. The rate of the global temperature increase has been dreadful during the last four decades and has doubled compared with that of the twentieth century [1,2]. Emissions of greenhouse gasses and carbon dioxide (CO2) from different resources constitute the primary reason for climate change and global warming, ranging from everyday household tasks to industrial activities, which are mainly due to the burning of fossil fuels [3,4]. Among all industries, the aviation industry has been selected to look into the details. According to the International Civil Aviation Organization (ICAO), the aviation industry contributes approximately 2.5% of the world’s annual global CO2 emissions from fossil fuel combustion [5,6]. At the first glance, a reader may consider this as a low contribution that can be ignored; however, there are two facts related to this relatively low CO2 emission contribution. Firstly, the aviation industry is expected to grow annually by an average of 3.6–3.8% over the next two decades [7,8] and, as a result, the aviation industry’s contribution to global fossil fuel CO2 emissions could grow rapidly in the future. Secondly, most aircrafts emit CO2 into the upper troposphere, which causes the upper layers of the atmosphere to cool faster, opposite of its effect on the lower atmosphere. Cooled atmosphere will decrease the mass density and affect the drag force experienced by space debris [9]. Researchers found that reducing the upper-layer atmospheric mass density will increase the amount of satellite and space debris and the risk of their collisions [10,11].
Focusing on the aviation industry and air transport to reduce CO2 emissions, companies and airlines worldwide have contributed through multiple solutions, such as supporting new aircraft technologies, improving the operational efficiency and infrastructure, zero-emission energy expansion, and producing and implementing sustainable aviation fuel.
New technologies, i.e., those using renewable materials, adapting to new designs to reduce aircraft fuel consumption, and applying circular economy approaches can help to reduce CO2 emissions. Bio-composite materials that are made from renewable materials are one of the best replacements for existing aircraft materials to reduce their emissions. Natural fibers have been a topic of interest to structural researchers and aircraft-manufacturing companies. It was revealed that these fibers can be used and recycled for interior components; however, due to serious limitations such as moisture absorption and flammability, they need more research in order to be used in aircraft exterior structural components [12,13,14]. Kokorikou et al. showed that a new design of the seats in economy class which uses recycled biomaterials can reduce 36% of the seat weight [15]. Despite the importance of using biomaterials, the performance of all recycled aircraft materials, biomaterials, and the circular economy concept should be considered for the sustainability of the aviation industry. Circular economy focuses on reusing and reproducing materials from waste materials. The optimal selection of aircraft materials has a strong beneficial impact on the re-use of components at the end of their lifecycles and dismantling phase. Not only managing aircraft waste, but also airport waste can help to reduce the industry’s environmental footprint [16,17,18].
Since 2006, Boeing and the National Aeronautics and Space Administration (NASA) have been collaborating to introduce a green, sustainable aviation vision to the aviation industry. Hence, they have started to work on a multiphase research project titled Subsonic Ultra Green Aircraft Research (SUGAR) [19] to reduce the aviation industry’s impact on the environment to achieve NASA’s 2030–2050 goals [20] for cleaner and greener flying [21].
TTBW, shown in Figure 1, is designed to provide aircrafts with a higher aspect ratio (higher wingspan, less induced drag). The conventional cantilever wing suffers from a high wing-bending moment at the wing root, while the TTBW design is equipped with two struts at approximately the mid-span to reduce the bending moment. The TTBW’s innovative design focuses on reducing noise and CO2 emissions while enhancing the aircraft’s performance when flying at higher altitudes.
Transonic Truss-Braced Wings are currently being employed in future aircraft designs. It has been concluded that this wing configuration is lightweight, ultra-thin, and aerodynamically efficient [19,21,22]. TTBWs are considered to result in less fuel consumption than those with cantilevered configurations. Wind tunnel tests combined with analytical studies on the truss-braced wing configuration have proved that this configuration is lightweight due to the influence of adding a supporting truss to the wing structure [21,22]. Adding truss can reduce the spanwise bending moment compared with conventional wing configurations, which allows the design of a longer wing and higher aspect ratio (AR) for a given loading. The increased AR of the TTBW configuration reduces the induced drag and subsequently increases the lift-to-drag ratio, L/D [23]. A blended wing body (BWB) aircraft idea is being studied by NASA and its industry partners for future use as an air transport for both civilian and military applications [24]. The BWB is a hybrid shape with elements of traditional transport aircrafts and flying wings. Compared with traditional tube-and-wing airframes, this combination has a number of benefits. The BWB airframe combines effective high-lift wings with a broad airfoil-shaped body to maximize lift and reduce drag over the whole aircraft. The center body section of the airplane has larger payload (cargo or passenger) areas, which also improve the fuel economy [25,26].
Unique interior designs are possible with the BWB form. From either the front or back of the aircraft, cargo can be loaded, or passengers can board. A sizable usable volume is provided by the distribution of the cargo or passenger space across the broad fuselage. Real-time video at every seat would replace window seats for passengers inside the aircraft. The BWB would use about 27% less fuel than a comparable conventional aircraft flying at high-subsonic cruise speeds over a 7000 nautical mile range because of its effective layout [24]. The wingspan of the BWB airplane could be larger than conventional airplanes, as BWB occupies a huge space, but an equally sophisticated conventional transport aircraft would cost more to operate because of using more fuel and produce more noise and emissions than the BWB [26].
The Box-Wing aircraft is designed to reduce fuel consumption and improve aerodynamic performance, meaning that the configuration provides the opportunity to increase the lift-to-drag ratio [27]. The configuration geometry consists of the two main lifting surfaces connecting at the tips by the vertical lifting surface. The closed, non-planar wing design can reduce the induced drag and the weight of the wing, which forms a statically indeterminate structure throughout [27]. Finally, the lower induced drag makes the Box-Wing aircraft an option to minimize emission, leading to the reduction of the environmental impact [28].
Another alternative solution in CO2 emission reduction is implementing clean energy sources in the design of the propulsion system, such as electric-, hydrogen-, and biofuel-powered aircrafts. It has been documented that renewable hydrogen by itself or when combined with other renewable sources such as electric motors would be capable of reducing up to 50% of the aviation industry’s CO2 emissions by 2050 [29]. However, aircrafts need major adaptations in their engine and fuel systems to be compatible with hydrogen fuel. It has been shown that CO2 emissions can be reduced significantly by using electric–hydrogen engines [30].
Despite all of the abovementioned advantages of different energies, the focus of this research was on using biofuel as, firstly, it can be mixed with aircraft jet fuel with almost no change to engine and fuel systems. Secondly, the research focus of the United Arab Emirates (UAE) is on the potential to reach the net-zero emission goal, and biofuel is the best solution to develop for this purpose within the UAE.
The UAE, in parallel with the global air transport industry, has set the goal of reaching net-zero greenhouse gas emissions by 2050, an initiative that aligns with the Paris Agreement, which calls on countries to prepare strategies to reduce greenhouse gas emissions and limit the increase in global temperature to 1.5 °C. Based on IATA’s annual review in 2022 [31], the most significant potential contribution to achieve net-zero emissions belongs to sustainable aviation fuel (SAF) (by approximately 60%) followed by a contribution of about 10% by applying new technologies. The least contribution is from operational efficiency and infrastructure, namely, less than 5%. The remaining belongs to offsetting/carbon capture technology. The percentages reported here are rough estimations and depend on the research source, for example, the Circular Bio-based Europe Organization [32] reported lesser contributions. The term ‘biofuel’ refers to any sustainable fuel derived from a biological source such as plants, crops, wood, or animal waste. The use of ‘bio’ is to portray its organic essence, as it is not a product of a geological process. Biofuels can exist as solids, liquids, or gasses, and come in various types depending on the extraction material. Today, the most used biofuels are ethanol, biodiesel, and hydro-processed renewable jet (HRJ) fuel [31,33,34]. The bio-jet fuels focused on in this research are manufactured from animal fats and plant oils such as algae, camelina, and Jatropha. These biofuels are produced through hydro-processing and are commonly known as HRJ or hydro-processed esters and fatty acid (HEFA) fuels. These fuels are described as one of the “drop-in” biofuels, which indicates that they are functionally equivalent to petroleum-based fuels [35]. Due to sharing the same properties as conventional jet fuels, these high-quality biofuels have been approved to meet ASTM’s international standards to be used in up to 50% blends [34,36].
The present work reviewed the UAE’s perspective on biofuel production and integrating new technology in the design of aircrafts in terms of GHG emission trends. The research aimed to develop an aircraft design that combines both sustainable aviation fuels and aerodynamically efficient configurations in the hope of decarbonizing the aviation industry.
The performance of aircraft’s turbine powered engine while using biofuels has been studied previously. In terms of engine design, there are no required changes in order to run internal combustion engines using biofuels, as the changes in the thermodynamic parameters when using biofuels for existing aircraft engines are very minor. This is the main reason that biofuels are categorized as “drop-in” fuels. However, engine performance is slightly affected when using biofuels. Boomadevi et al. [37] experimentally showed that when microalgae biofuel was blended with Jet-A fuel, CO, CO2, and NOx were reduced. At a lower proportion level of addition of biofuel (≈20%) thrust and engine speed were slightly affected. The constant speed thrust decreased from 50.8 N to 50.1 N when adding 20% of biofuel. However, when the percentage of biofuel was increased, due to the low energy property of the biofuel, the thrust and speed decreased dramatically. The thrust reduction reached 39.5 N at 100% biofuel. Oliveira and Brojo [38] presented a numerical simulation of a CFM56-3 combustor using biofuels (Jatropha seeds, algae and sunflower) blended with Jet-A fuel. They also concluded that the biofuels are capable of reducing emissions in addition to engine thrust, and more biofuel had to be burned to produce the same amount of thrust as Jet-A. Biofuels can also be used in diesel engines in their pure form or blended with petroleum diesel in a certain ratio to improve their ignition quality, fuel flow qualities at cold temperatures, and fuel stability (oxidation) in addition to reducing GHG [39,40].
Zhou et al. [41] performed a numerical study to investigate the influence of biofuels on the combustion characteristics and performance of aircraft engine systems. By simulating ethanol and methanol in the FLUENT software and comparing the results with conventional kerosene, it was established that the key factors affecting the combustion of biofuels are the viscosity and calorific value. The results concluded that fuels with a low calorific value had a reduced combustion temperature and a smaller high-temperature zone in the combustion chamber. In addition, the temperature before the inlet of the turbine was lower and the NO concentration dropped. Biofuels with low viscosity led to better atomization effectiveness in an aircraft engine system under lower ejection temperatures. The results also showed that the same thrust magnitude could be obtained by adopting biofuels with an increased mass flow rate. The performance and emission characteristics using Jet-A-1/HEFA blends were investigated for a miniature turbojet engine by Gawron et al. [42]. The analysis showed differences in the operation of the miniature jet engine when running on pure Jet-A-1 or HEFA blends, especially in the fuel consumption and CO emissions. When running on HEFA blends, both the fuel consumption and CO emissions were lower. The HEFA blends tested had a higher calorific value and lower density compared with neat jet fuel. The results displayed no significant variations in the turbine temperature and CO2 emissions; however, an increase was noted in NOx emissions for fuels with HEFA components. Azami et al. [43] analyzed the aircraft engine performance in terms of thrust, fuel flow, and specific fuel consumption for alternative biofuel (algae, camelina, and Jatropha) blends at different mixing ratios. This was achieved by utilizing PYTHIA and TURBOMATCH to analyze and model a three-shaft high-bypass ratio engine. The results denoted that the lower heating value had a significant impact on the studied parameters at every flight condition and all mixing ratio percentages. The Kerosene–biofuel blends showed an improvement in the thrust and net thrust and a reduction in fuel flow and specific fuel consumption. The results also concluded that the pure alternatives of some biofuels (camelina and Jatropha) provided much better engine performance.
From the abovementioned investigations, it is noted that closer consideration of biofuel combustion and its effects on engine performance is fundamental. Hence, to confirm the positive environmental effects of biofuels, the current study analyzed the effects of biofuels on jet engines through numerical simulation using the ANSYS software. The combustor’s exit temperature and CO and CO2 emission indexes were obtained for an engine’s combustor when burning fuel with and without biofuels. The selection criteria to choose the biofuels in this study were based on the compatibility of the fuels to be implemented and produced in the UAE.
The present work reviewed the UAE’s perspective on biofuel production for the first time. Not only has the UAE’s plan to reach the 2050 net zero emission goal been studied through producing biofuel, but new technology in the design of aircrafts has also been integrated into biofuel implementation in terms of reducing GHG emissions. As mentioned previously, the thrust that can be achieved by biofuel is lower that of Jet-A fuel. Increasing the amount of fuel and subsequently increasing the weight of the aircraft is not a very promising solution for this issue. This research aimed to put forward an aircraft design that combines both sustainable aviation fuels and aerodynamically efficient configuration to compensate for biofuel’s disadvantage in producing the required thrust force in the hope of decarbonizing the aviation industry.
2. Methods
This section outlines the scheme adopted in this study to assess the effects of adding biofuel and TTBW elements into the design of the targeted sustainable aircraft. The initial step was to set a standard reference aircraft design that could set the figure of merits to evaluate the effects of each added component into the design. The final designs were selected based on the PUGH matrix [44] and highest decision ratings to be further examined and analyzed. However, prior to the evaluation, a biofuel selection process was involved to elect an appropriate biofuel to be incorporated into the design; hence, the selected biofuel was finalized from the available fuels. Afterwards, to evaluate and study each of the finalized designs, aircraft weight estimation and sizing were implemented. Lastly, a Computational Fluid Dynamics (CFD) simulation was established on a jet engine’s combustion system to verify the emission reduction as a consequence of the biofuel’s employment.
2.1. Reference Design
Many factors should be considered backing up the base preference that will later on aid in selecting one final design. A reference aircraft was designed to scrutinize the different layouts suggested back to the basic reference design. Thus, the reference aircraft was chosen to be a traditional small-sized business jet carrying 4–6 passengers, with a T-tail and aft engine placemat formation. The increased ticket price when implementing SAF into the design could lure a very limited number of customers. Therefore, using the small business jet design was the best option for throughout this study since few people would be willing to pay more for the ticket price. A survey was conducted on a certain number of the participants, which asked about whether future passengers would fly on airplanes using 100% biofuel to understand the willingness of passengers to board biofuel-based flights. The results showed that 24% of the participants were not comfortable boarding biofuel-based flights due to the discomfort and lack of knowledge about biofuels. To carry on a deeper analysis, the participants were questioned regarding their inclination towards blended biofuels in different percentages, in which most of the participants preferred to have 60% biofuel. Therefore, the gradual application of 60% biofuel usage within the industry on-board a commercial flight was another reason to choose a small business jet. This conventional business jet acquired a baseline rating that yielded a perfect 100% score for the PUGH matrix, which in return will serve as a source to compare and weigh the proposed solutions. The PUGH matrix is a basic, general method to evaluate the available design options and choose the best out of them in a design approach. The criteria for a design are listed and weighted in a matrix format and the total scores for the available design options are compared to select the best design option [44]. The option yielding the highest score, according to the PUGH evaluation, and grounded from the reference blueprint, was considered as an optimal design requirement and suitable for this study.
2.2. PUGH Matrix
The optimum aircraft’s design was intended to be formulated to emit as the least possible amount of discharge into the atmosphere without interfering with its performance. To achieve the objective, five different options were proposed and are summarized in Table 1; each option was thoroughly studied and analyzed using the PUGH analysis method. The PUGH weighting method considered not only the environment and performance, but also other aspects including tail arrangement, engine placement, and wing configuration. All the criteria were closely and thoroughly studied and were compared with the traditional business jet design in order to observe how the new features, such as TTBW or biofuels, would affect each of the aspects in the design. Moreover, the scorings were merely based on the data collected from numerous authenticated digital resources that concern each of the criteria. It should also be noted that BWB with 60% biofuel can also be considered as one of the options; yet, as taking the time span and the design procedures into account for such an aircraft would be very time consuming, it was rejected. Despite this, BWB with 60% biofuel can be contemplated in future research with additional resources and time.
2.2.1. Wing Configuration
With regard to the wing configuration, structural and aerodynamic benefits were the two most important parameters, and were hence given the highest weighting compared with the other factors of the wings. It should be noted that two categories of wing layouts were adopted in the proposed designs: TTBW_1T (the standard one-truss wing described earlier) and TTBW_2T (an additional configuration consisting of an extra strut to hold the wing) as depicted in Figure 2. The aerodynamic performance and structural benefit were highest for the truss-braced wings design, as it is designed to perform at Mach number 0.8, which is consistent with the current speed of jetliners in the market, as surpassing this safety threshold, it would start losing its aerodynamic benefit. The stability was slightly higher for TTBW_2T due to the presence of an additional strut in terms of wing solidity. Yet, this should not always be taken as a positive aspect due to the stability’s dependence on the aircraft’s center of gravity as well as the relative position of each aircraft component from it. The passenger comfort was somewhat similar for all the designs except for the BWB, which received less points for passenger comfort since, during an emergency, evacuating a BWB aircraft can be challenging due to its complex shape that would cause the seating to be theater-style instead of tubular. Hence, there would be fewer exit doors because of this reason [45]. The TTBW_2T operating with jet fuel was assigned the highest points due to the reduction in the specific fuel consumption (SFC) and operating cost of the aircraft [46].
2.2.2. Tail Configuration
The BWB aircraft, from its current design, has no empennage due to its effective aerodynamic body. Moreover, the placement of distinct control surfaces on the aft side justifies the need of a tail on a BWB [47]. As for the other designs, a combination of T-tail, V-tail, and cruciform were selected. The aerodynamic benefit of the T-tail was the highest compared with the others because of the reduced downwash caused by the position of vertical stabilizer compared with the conventional one [48]. The conventional tail’s aerodynamic performance was affected due to the bad spin characteristics caused by the vertical stabilizer blanketing and huge downwash produced by the horizontal tail [48]. Although the lighter-weight V-tail also costs less compared with all other designs, it has the lowest adaptability because of the complicated control system and horizontal stabilizer placement, which obstructs the engine’s exhaust [49]. In the case of the cruciform configuration, it was discovered that the weighting with respect to all the criteria was in between the T-tail and the conventional design; however, its end plate effect, like the T-tail, gives it an additional advantage [48]. Therefore, due to having an end plate effect, the vertical tailplane can be designed smaller; similarly, the horizontal tailplane can also be designed smaller due to its position being out of the airflow and it being subjected to less downwash and less tail buffeting [48], creating an overall lighter and more aerodynamic tail without being large as conventional tails [50]. Conclusively, by the means of the total rating values, it was revealed that a design with a T-tail was the optimal selection with the most efficient performance potential.
2.2.3. Engine and Engine Number
The number of engines to be placed on the aircraft depends on the aircraft type; thus, all designs comprise of two engines except for the BWB which has numerous engine configuration arrangements ranging from 2~8 aft and underwing engine placements. Nevertheless, since the type of the selected aircraft is a light business jet with six passengers and two crew members, the two-engine configuration was optimum to accommodate the small, lightweight jet. First, the maintenance cost for the BWB design was the highest due to the high engine placement toward the trailing edge of the fuselage that obstructs its accessibility and increases the maintenance difficulty. As for the engine location for the TTBW configurations (with/without biofuel), there are two engines located under the wing, in contrast to the reference design that has two engines placed on the rear fuselage. Yet, with TTBW_1T, the engine under the wing is located closer to the fuselage, which provides better static aircraft stability than TTBW_2T because engines closer to the fuselage will reduce the risks of yaw-induced roll during scenarios in which one engine becomes inoperative [51]. Locating the engine closer in the TTBW_1T configuration is because of the singular truss present; however, in case of the TTBW_2T design, the additional truss causes inconsistency in the weight distribution, therefore placing the engine farther than in the case of TTBW_1T. Furthermore, the most fuel efficient and considerable thrust production was affirmed to be TTBW_1T with 60% biofuel. This is because one of the structural benefits when exploiting a TTBW is that the fuel consumption experiences a reduction due to the wing shape and structure. According to Mazlan et al. [52], an engine running with a 60% mix of biofuel proved to be highly fuel efficient due to the SFC decreasing to almost 1.50% and the thrust increasing to almost 0.05%. Finally, the engine criteria weighting demonstrated that the optimum design according to the highest value was revealed to be a design that includes the TTBW_1T configuration.
2.2.4. Environmental Impact and Fuel
Seven distinct criteria were selected to analyze the individual designs. Since reducing the emissions is one of the main purposes of this study, it was the major contributor to the weighting. The TTBW and BWB designs reduced greenhouse gas emissions by providing a reduction in fuel burn as a result of their highly efficient and aerodynamic designs; the more aerodynamic the design, the higher the reduction in emissions and environmental impact. According to Orban [53], the TTBW and BWB designs can save up to 10% and 20% of fuel consumption, respectively, resulting in emission reductions. On the other hand, the use of biofuel alone in place of fossil fuels reduces the lifecycle of carbon emissions to almost 80% when compared with fossil fuels [54]. The proposed designs that include a TTBW and BWB configuration consume less fuel than conventional aircrafts, which saves fuel. Biofuels’ SFC reduction depends on the biofuel type used and blending percentage and can range from anywhere between 0.5% and 3% [55]. When considering the biofuel-powered designs, biofuels prove to be better in terms of their availability than fossil fuels due to the ability to produce them from a variety of feedstocks, enabling their production to be spread globally [56]. The production process of converting biomass to biofuel is multistep and requires a substantial amount of energy, failing to give it a significant advantage [57]. However, biofuels are infamous for being more expensive than fossil fuels [58]. In addition, the energy density of biofuels is around 38 MJ/kg, which is very close to that of fossil fuels, giving it only a minimal disadvantage when it comes to fuel weight [59]. Nevertheless, biofuels have the potential to lower aviation emissions, reduce waste, and improve aircraft performance, besides the ability to implement them with no changes in configuration or infrastructure [54]. The result of this weighting found that the combination of biofuel and TTBW_1T design was environmentally the best.
2.2.5. Aerodynamic Performance
One of the major selection merits of an aircraft design is its aerodynamic performance. For this part only three criteria were focused on due to the inclusion of the various aerodynamic aspects within the previous sections. The aspect ratio is the foremost contributor to the aerodynamic efficiency of an aircraft due to its direct association with drag reduction. The aspect ratios of the TTBW designs reach up to 14 for a single truss and even 20 for a double truss; although this increases parasite drag due to the surface friction, there is a significant reduction in the induced drag. Adding that to the decrease in transonic wave drag as a result of the thinner wing, it can be guaranteed that such designs are aerodynamically effective and more economic [23]. BWB design is not characterized by a high aspect ratio and its merged wing enables a decrease in parasite drag and the lift generated from the entire aircraft, consequently providing it with a significant aerodynamic benefit over the other designs [47]. Based on the analysis in NASA’s ultra-green aircraft research by Bradley et al. [60], its approximated that the TTBW_1T and TTBW_2T designs are likely to provide an L/D increase of around 17% and 24% compared with the cantilever design, respectively. On the other hand, the analysis established by Ikeda [61] along with NASA’s SUGAR reports anticipated the L/D increase of the BWB design to reach more than 20%. Although flying at a high Mach number and faster flight is not the aim of this research, it is still a significant virtue in analyzing a design. While current cantilever airliners can fly at up to Mach 0.9, unusual new configuration speeds are consistent but fail to reach such a limit. The TTBW_1T and BWB configurations have been studied to reach a maximum Mach number of 0.8 and 0.86, respectively, beyond which they surpass the safety threshold and start losing their aerodynamic benefit [62].
2.3. Final Design
The highest score was established for the business jet with TTBW running on a 60% biofuel blend with a T-tail empennage configuration. The proposed design would mark an effective sustainable jet with exceptional environmental and aerodynamic performance. Due to the originality of TTBW in the aviation industry, it would require extensive verification. Therefore, to compare and showcase the design’s potential, three designs were formulated prior to the integration of both TTBW and biofuel in one aircraft. Accordingly, four designs were selected as shown in Table 2 to explore using the method mentioned in Section 2.5 and Section 2.6.
2.4. Aircraft Design Methodology—Weight Estimation
This study began with relevant market research for a medium-sized light business jet where the primary constraints included a range of 2550 nm, altitude of 43,000 ft, and a cruise Mach number of 0.8. For the payload weight estimation, the module assumed an average passenger and crew weight of 195 lb and baggage weights of 40 and 30 lbs for the light business aircraft, respectively. The take-off weight equals the sum of fuel weight, payload weight, empty weight, trapped fuel oil weight, and, lastly, crew weight [63]. Afterwards, the final take-off weight was calculated using an iterative process. An iterative process is an approach used in a design methodology to apply steady and continuous modifications and configuration tradeoff to achieve optimum design. The aircraft concept gradually converges to the best lightweight and economical design using the iterative process.
2.5. Aircraft Design Methodology—Constraint Sizing
Following the aircraft weight estimation, design parameters such as wing loading (W/S), take-off thrust-to-weight ratio (T/W), and maximum lift coefficients were selected based on the performance analysis [63]. The estimations yielded a range of wing loading, thrust loading, and maximum lift coefficient values within which specific performance requirements can be met. The highest possible wing loading and the lowest possible thrust-to-weight ratio that met the requirements for to an aircraft with the lowest possible weight were selected.
2.6. ICAO Landing and Take-Off (LTO) Cycle
ICAO has established a set of standards through a reference cycle recognized as the LTO Cycle to condense the hazardous emissions effused by the aviation industry and aid in protecting the environment [64]. The LTO cycle is represented by thrust settings segmented into four stages which determine the jet engine’s emissions over airport zones; hence, the LTO cycle acted as guidance for the simulation conducted in this study. The ICAO LTO cycle proceeds as follows:
- Take-off: the first stage of the LTO cycle that matches the thrust setting from the aircraft’s take-off until the main throttle back segment;
- Climb: the thrust setting corresponds to the throttle back instant until the maximum altitude of 3000 ft is reached in the LTO cycle;
- Approach: occupies the thrust setting from the maximum altitude up until the touchdown along with the roll-out at the end of the runway;
- Taxi: corresponds to the thrust setting for two divisions; one from the engine warming period until the take-off brake release point for taxi out, and two from the end of the landing and parking phase until the engine shutdown for taxi out.
2.7. CFD Analysis of Fuel Combustion
To confirm the capabilities and environmental benefits of camelina biofuel, a CFD analysis of its combustion was performed through the means of ANSYS-Fluent software. The work of Olivera and Brojo [38] was used to confirm the implemented setup and compare the results of various fuels. The performed simulation replicates the combustion in the CFM56-3 combustor using three different fuels: Jet-A, Jatropha, and Camelina. The emissions and exit temperatures of these fuels were investigated at different power settings based on the CFM56-3 Landing Take-off (LTO) cycle. The simulation was performed on a reproduced 2D model of the combustor based on the basic combustor considerations. The model is composed of two fuel inlets, two primary air inlets, and four secondary air inlets as illustrated in Figure 3. The full geometry was then realized using the axisymmetric solver selection in the setup.
Various edge sizings were created at the inlets and edges to achieve a refined mesh. The mesh was made denser in the critical parts of the combustor specifically the outlet since it is the main location of evaluation. The element size was kept at the default of 0.015 m, and quadrilateral face meshing was applied to the surface. The final mesh was selected by examining the changes in the results as the mesh became finer. This was achieved by focusing on the average CO mass flow rate at the outlet as the number of divisions increased. Accordingly, the mesh grid and number of divisions were only finalized when the results started to stabilize and show minimum divergence. After generating the mesh, the solver was set as pressure-based with absolute velocity formulation in steady time and axisymmetric 2D space. According to the type of the simulation, the following models were selected:
- Energy: this model was selected to account for the energy change due to the temperature change and heat transfer in the process;
- Radiation: to produce a more accurate solution, the discrete ordinates (DO) model was selected;
- Viscous: the selected model was SST k-omega with the default constant values;
- Species: this model was the most significant since it sets the combustion characteristics. The model was set as non-premixed, and inlet diffusion, and eddy dissipation were selected. Chemical equilibrium was chosen for the state relation, besides the non-adiabatic energy treatment.
The operating pressure along with the oxidizer temperatures varied according to the gas turbine engine (GTE)’s power and were constant for all fuels. These values are summarized in Table 3 according to the values used by Olivera and Brojo [38]. The values were calculated through linear regression based on Ribeiro’s work [65]. For the flammability limit, a value 10% higher than the stoichiometric fuel-to-air ratio was selected. Furthermore, the fuel temperature was inputted as the flash-point temperature of each fuel. The required properties of the fuels are summarized in Table 4. In order to set the fuel species in the boundary tap, the required species must be available in the chemical database. Thus, for the identification of the biofuel species, Burcat’s third millennium thermodynamic database was accessed and the thermodynamic properties of the species were input therein [66]. The oxidizer was set to the nitrogen and oxygen constants of 0.78992 and 0.21008, respectively. The fatty acid composition and concentrations of the biofuels are provided in Table 5.
The determination of the boundary conditions relies mainly on finding the air mass flow rate and the fuel mass flow rate . For the Jet-A and Jatropha, the mass flow rate values of fuel and air according to Olivera and Brojo [38] were used; however, the values for camelina were calculated by finding the power at each power setting by assuming 40 KW as the value at 100%. Later, the values of the primary air mass flow rate and secondary flow rate were chosen as 33.7% and 66.3% of the total , respectively; the percentages were selected after analyzing the effect of their variations on the resulting accuracy through a trial-and-error approach. Table 6 displays the final values.
In the methods, the scheme used was coupled with a distance-based flux type. The gradient was set as least squares cell-based and for all the other options second-order was selected except for discrete ordinates, which used first-order upwind. After all the required settings were identified, the calculation was performed using hybrid initialization with a tolerance of 1−6.
3. Results
This section discusses the main results and findings. Firstly, the results of the CFD simulation are contemplated. The main findings are then applied to the second part deliberating the aircraft design. The weight estimation and sizing of the proposed designs powered by the biofuel blends are analyzed.
3.1. Numerical Simulation Results
Countless simulations were performed to justify and validate the environmental benefits of camelina biofuel and its advantages in combustion. Only when the obtained results were close to those presented by ICAO and Olivera and Brojo [38] were the geometry and setup finalized and selected. The results presented in this section are all products of the mesh-independent solution achieved through non-premixed combustion in the Ansys-Fluent software. The results were examined for changes as the mesh became finer by focusing on the average CO mass flow rate at the outlet. It was noted that as the number of divisions increased, the parameter experienced a minimal to no change in value; this allows us to conclude that the solution is mesh-independent.
The simulations were performed using three different fuels. Firstly, Jet-A and Jatropha were used to confirm the setup, once the setup was validated and declared acceptable camelina biofuel was applied. The three fuels were simulated at 4 power settings each, giving a total of 12 completed simulations in the final results.
3.1.1. Power Output
To be able to compare the energy extracted from each fuel at full power, the fuel mass flow rate had to be set as a constant value. The value used was that of Jet-A at full power for the entire combustor . Subsequently, the power output (KW) was calculated using Equation (1). The obtained results were then plotted as provided in Figure 4.
As expected, both biofuels had a lower power output compared with Jet-A due to having a lower combustion enthalpy. This is a significant finding which confirms the need for greater fuel mass flow to reach the same power output provided by Jet-A. Both had have almost the same power output of ≈37 KW, giving them a slight power decrease averaging (≈8.6%). However, it is significant to remark that the lower heating value (LHV) of the fuel hugely depends on the fuel quality, which is highly affected by the fuel’s production conditions [38]. This indicates that if carefully produced in a good environment, both camelina and Jatropha biofuels may provide a higher power output and lower decrease. This also explains the various LHV values available for both biofuels, as it would depend on the quality of the fuel tested. The important takeaway from this is that the camelina biofuel provides an 8.9% decrease in the power output when compared with the conventional Jet-A fuel. It was hence calculated that to achieve the same power output as Jet-A, approximately 10% more fuel mass flow rate is required. This represents a major finding and must be applied to the fuel weight considerations when designing aircrafts running on biofuels.
To validate that the methodology of both Jet-A fuel and the species method applied to introduce the biofuels were correct, the exit temperatures of the combustion chamber were compared with those presented by Olivera and Brojo [38]. As presented in Figure 5, it can be noted that both simulated fuels showed increasing exit temperatures with the increase in power setting. Jatropha biofuel exit temperatures were lower than those obtained by burning Jet-A in the current research and that by Olivera and Brojo [38], with an approximately 7% decrease in exit temperatures when burning Jatropha biofuel.
However, it is clear in Figure 6 that an error was present, as the values obtained for both fuels did not exactly match with those of Olivera and Brojo [38]. For both fuels, the error had its maximum value at full power at an average of 29%. Nonetheless, the error was at its minimum at the power setting of 30%, reaching 4% for Jet-A and 7% for Jatropha. The existing error is expected and justifiable as the simulations were not identical. The error is caused by several variations between both simulations; this is essentially because the performed simulation was in 2D space while the reference used a scanned 3D model of the combustor. Moreover, the set boundary conditions ignore the cooling holes and focus on three air jet streams only, which in turn affects the set up and flow and creating differences between both simulations.
3.1.2. Combustor Exit Temperatures
The combustor exit temperatures while burning Jet-A, Jatropha, and camelina throughout the LTO cycle are illustrated in Figure 7. As displayed, it is noted that both Jatropha and camelina biofuels had almost identical values; this overlapping trend is very similar to that attained by Olivera and Brojo [38] when burning biofuel. Accordingly, both biofuels provided lower exit temperatures compared with Jet-A, with a maximum reduction of 26%. The provided exit temperature reduction when burning biofuels is highly beneficial and advantageous. This indicates that while consuming more fuel, biofuels are capable of producing the same energy as Jet-A, but with less temperature and a lower effect on the combustor. This may also lead to an increase in the lifetime of the combustor and high-pressure turbine (HPT) blades. Figure 7a illustrates the temperature profile while burning camelina biofuel at a 100% power setting. It can be seen that the regions of high temperature expanded as the combustion progressed in the chamber. The exit temperature profile did not have a uniform pattern which, as explained by Olivera and Brojo [38], created undesired hot spots as the flow reached the turbine. However, as these spots were present for all fuel simulations, it is highly important to mention that the hot spot size was smaller for camelina biofuel in comparison with Jet-A. This showcases the positive effects of burning camelina biofuel as it reduces the degradation of the turbines’ guide vanes and blades.
3.1.3. Emissions
The emission analysis was carried out by assessing the emission index (EI) for each of the pollutants that was liberated during the combustion process simulated in the fluent solver. The emission index is a rating factor for the fuel quality, denoting whether or not it is hazardous to the environment [71]. EI is represented through the ratio of the emissions produced per unit of fuel burned in the combustion chamber. Equation (2) was used to calculate the EI for the CO and CO2 for each of the Jet-A, Jatropha, and camelina fuels simulated in this work.
The emission flow rate was obtained from numerical simulations, and the inlet mass flow of the fuel was the constant value was input in the boundary condition. Despite the various pollutants which are released by a jet engine, the majority of the exhaust is occupied by the CO2 compound released into the atmosphere, which gives reason to prioritizing the issue of CO2 emissions in the aviation industry. Furthermore, all of the efforts are being assembled to reduce the CO2 emissions of aviated flights through regulations and innovations, such as the 2050 net-zero CO2 emissions goal. Thus, the emission analysis was carried out merely on CO2 and CO to be compatible with the 2050 goal and to testify for the potential of biofuel to decrease emissions.
- Emission Index CO:
The CO emission mass fraction contour for camelina fuel is illustrated in Figure 8a with the red region indicating the CO-rich zones due to the incomplete combustion of CO2 and the deficit of oxygen molecules in the fuel and air mixture. The emitted CO was associated with an inadequate efficiency of the burner which existed in all practical combustors as in the simulated one, and the mass fraction contour depicts the formation of CO with a lower concentration. Figure 8b presents the maximum CO’s EI captured from numerical simulation and calculated by Equation (2) over the entire LTO cycle for all the fuels.
Though the EI range showed some inconsistency with the ICAO-published values mentioned in Oliveira’s study [38], the comparison between fuels can be carried out regardless, since the values still lie within scope increments of ten. The simulations of all fuels were carried out under identical models and operating settings, along with the validation explored in Section 2.7 allowing the comparison to be merely carried out between the fuels of this simulation. The lines in Figure 8b show the overall behavior of CO increased as the power percentage increased for the combustion of camelina and jet fuel. Throughout the entire cycle, the jet fuel emitted the highest amount of CO compounds compared with the other two biofuels. Camelina emitted the lowest amount of CO, retaining Jatropha in between the two and implying its chemical similarities with jet fuel. At 7% to around 90% of power settings, the emission of CO when utilizing the camelina biofuel was found to be the lowest among the three fuels. This signifies that around the airport zones and during the taxi-in and taxi-out segments, 100%-camelina-powered aircrafts will minimize CO circulation in the air. Moreover, at the camelina with the greatest power setting released about 50% less and 6% more CO than jet fuel and Jatropha, respectively, demonstrating the power it has in reducing CO compounds secretion into the air. Overall, the biofuel with respect to the jet fuels shows a great decrease in CO emission with increasing power signifying its eco-friendliness nature. It should be noted that the materialization of CO signifies that the fuel atomization would require small fuel droplets to easily combust with air and produce less CO. Usually, high temperature and accelerated combustion process would result in a CO reduction, however this was not the case neither in this simulation nor in Oliveira’s study as depicted in Figure 8a. Discovered by Oliveira and Brojo [38], after extensive investigation, that The European Commission’s project revealed the reason behind this discrepancy [72]. Due to the numerical models set for the simulations, the software failed to capture the trade analysis that should have been determined among NOx and CO production with increasing power [72]. Finally, it can be said that camelina biofuel’s potential in reducing CO emissions is the highest among the other biofuel and Jet-A fuel.
- Emission Index CO2:
Portrayed in Figure 9a is the CO2 liberated during the combustion of camelina biofuel. The contour clearly demonstrates that the CO2 is extended toward the inlet of the turbine and exhausted by the nozzle into the atmosphere with a higher concentration. Even though no reference values were available for the CO2, the variance of its emissions compared with other fuels is depicted in Figure 9b. Moreover, previous works carried out on camelina biofuel suggest that a 1% reduction in CO2 emissions by weight was captured when compared with jet fuel [73]. Compared to CO, the EI of CO2 showed a huge discharge, which is to be expected since the combustion reaction of fuel and any oxidizer, air in this situation, will produce vapor (H2O) and CO2.
Figure 9b demonstrates that the jet fuel was an intermediate emitter of CO2 with regards to Jatropha biofuel that released the highest CO2 but only during an approximate power setting of 17–50%. However, during the lower and higher power settings with the percentage range being around 7–17% and 50–100%, respectively, both biofuels caused a reduction in CO2 emissions. As mentioned previously, the mass flow of biofuels is higher than that of jet fuel due to its chemical composition that corresponds to more fuel being burned; still, the emissions at lower and higher power settings were lesser. This validates the potential of biofuel to reduce CO2, one of the most major concerns in the aviation industry, and confirms its effectiveness in fueling aircrafts. Withal, a completed LTO cycle for camelina biofuel, showed the least production of CO2, highlighting its potential in reducing CO2 emissions compared with Jatropha and jet fuel. At full power, both Jatropha and camelina released 24% less CO2 than jet fuel, which, according to the theory, suggests that biofuel emits 85% less CO2 than jet fuel, and in this case this target was not reached. The erroneous value of 24%, considering all the factors affecting the simulation result mentioned previously, is acceptable since it still demonstrates a reduction of CO2 to some extent. On the other hand, the full cycle of camelina biofuel combustion with respect to jet fuel showed a 14% difference. This shows that, even with discrete modeling and simulation, camelina biofuel burns efficiently and harmonizes with the current state of CO2 outflow in aviation commerce. We can conclude that camelina shows the best performance in excreting trivial CO2 compounds, in accordance with the aim of this paper to utilize a biofuel in an aircraft that can meet the net-zero CO2 emissions goal.
3.2. Final Designs’ Analysis
The design exploration as shown in Table 7 started by determining the weight and optimum wing loading and thrust-to-weight ratio for a conventional light business jet. The baseline business jet developed a 15,000 lb take-off weight with values of 75 psf W/S and 0.48 T/W. Gradually and separately, each feature was added to the baseline design in order to analyze the individual effect of biofuel or TTBW. Throughout the analysis, it was verified that powering the conventional jet with a 60% biofuel blend caused a 20% increase in the total take-off weight due to the increased mass flow rate required for biofuel to achieve a similarly adequate performance to that of the jet fuel. The same values of W/S and T/W were used for the biofuel design as the constraint studies the aircraft performance regardless of the fuel burnt. On the other hand, TTBW_1T with jet fuel had a lower weight, portraying the effect of TTBW’s nature on the jet by having a high aspect ratio and a thin wing. As for the constraint sizing, the values of W/S and T/W were selected after several attempts to obtain the values matching the TTBW’s theory of having higher W/S and T/W compared with the “baseline conventional business jet”. Ultimately, approaching one final option, both the biofuel and TTBW were united to view their effects together, and that resulted in a total take-off weight of 15,200 lb. Though this is an increase of 200 lb, it cannot outweigh the immense positive effect it will have on the emissions due to the biofuel usage. This is not to mention the combination of decreased fuel consumption from the TTBW, and the reduced discharge by the biofuel contributes to creating an eco-friendly, sustainable, optimum aircraft design. The wing loading and thrust-to-weight ratio for combined TTBW_1T and 60% Camelina biofuel were the same as those of TTBW_1T with jet fuel because of the only change being in the wing configuration.
3.3. UAE and Biofuel
The concept of biofuels is not new to the UAE; development has been in progress since 2011, as displayed in Figure 10. In 2014, the first test flight powered by UAE-produced biokerosene was conducted; soon after that, the BIOjet Abu Dhabi initiative was announced, which aims to develop a comprehensive framework for a biofuel supply chain in the UAE. In 2019, the first commercial flight running on UAE plant-produced biofuel was conducted [74].
To select the best plant for oil extraction and biofuel production in the UAE to power the chosen optimum design extensive research was performed and comparisons were conducted. Jatropha and camelina proved to be the best seeds for biofuel production and were accordingly focused on and compared with the Jet-A fuel, as shown in Table 8. The results concluded that camelina biofuel is the best choice due to its high yield point, low viscosity, standard density, and most importantly its ability to survive harsh environments. To provide camelina with its specific growth requirements and ensure high yield, vertical farming is further suggested as a suitable solution.
3.4. Ticket Cost Analysis
The current cost breakdown of biofuel-powered aircrafts was also prepared to determine its potential in the marketplace among its consumers and competitors. Using distinguished equations [63] alongside the extensive research on biofuel costs and ticket pricing distribution, Table 9 was established.
Table 9 depicts five scenarios of biofuel-powered aircrafts traveling merely from Dubai to Hamburg, with the only difference being in the blend ratios and considering only 15% of the ticket price to be charged for the fuel cost used on the aircraft [81]. Moreover, the main assumption was that the industrial ticket price for the light business jet at the time of writing this paper was averaged to be 2000 USD per hour [82]. Acknowledging the aforementioned assumptions from authenticated resources, the main conclusion found was that the price of biofuel flight is more expensive than conventional jet fuel. Moreover, increasing the biofuel blend tends to increase the ticket prices per passenger. According to the International Renewable Energy Agency (IRENA) 2021 and IATA 2021, the biofuel and jet fuel costs are 2.84 and 1.83 USD/gal (0.77 and 0.50 AED/gal), respectively, designating the biofuel as more expensive by nature, and hence increasing the ticket cost [83,84]. Therefore, a passenger traveling from Dubai to Hamburg onboard an eco-friendly flight with 100% biofuel would have to pay an extra 453 USD (AED 1653.18) for the ticket. Although the price is high, it can be justified that by using biofuel, concerns regarding the greenhouse effect will diminish due to the reduced carbon footprint it entails. However, authors are suggested to use a lower-biofuel blend, such as the 40% biofuel with 60% jet fuel blend, to avoid the sudden increase in the ticket pricing that might drive demand away and negatively impact the aviation industry. In due course and once the consumers and demand settle, the higher blend of biofuels can be gradually introduced to suit and satisfy the market and the law of demand and supply as well.
4. Discussion
To examine the effect of using biofuel and truss-braced wings on the proposed design, aircraft take-off weight, fuel consumption, and emissions were calculated for four different designs. Figure 11 visualizes the effects of biofuel and truss wing combinations on the take-off weight, CO2 emissions, and fuel consumption. The emission and fuel consumption were separated into two bars to show the effect of biofuels on the emissions. The reduction in fuel consumption does have its positive effect on emissions, however separate bars in Figure 11 help to distinguish the benefits of the two solutions. The impact of both biofuel and truss-braced wings is indicated, which turn is affect the aircraft’s performance to some extent. Powering the jet using 60% camelina biofuel caused higher take-off weight; however, it reduced emissions to the atmosphere by about 30%. The engine fuel consumption rate was slightly reduced by using camelina biofuel. The TTBW configuration assists in both lower take-off weight and fuel consumption. Lastly, the TTBW configuration with 60% biofuel is the most optimum design option for the consideration of emission reduction and aerodynamic enhancement because of the unique wing design, and this design option has the capability to decrease CO emissions by 50% and CO2 emissions by 24%. By increasing the take-off weight by 1.34%, the emission and fuel consumption decreased by 30% and 10%, respectively. Decisively, the outcomes of using the option of TTBW_1T with camelina biofuel along with the results of the overall study show that the application of biofuel, especially camelina-derived, is strongly advised to be utilized in the aviation industry. Employing this framework or a related outline would serve the 2050 net-zero carbon emission goal endorsed by many countries, including the UAE.
5. Conclusions
In line with the United Arab Emirates and the worldwide aviation industry’s net-zero carbon emissions target, this research studied the potential of maximizing the reductions in emissions by combining aerodynamically efficient configurations and biofuel into one design. The findings of this paper include the following:
- Through a PUGH analysis, it was concluded that the optimum aircraft design had a transonic truss-braced wing configuration and was powered by a 60% biofuel blend.
- By researching and comparing different biofuels, camelina was selected to power the optimum design as it was found to be the best plant for oil extraction and biofuel production in the UAE.
- A numerical simulation was conducted to confirm and study the effects of camelina biofuel on emissions. The results showed a decrease of 50% and 24% in CO and CO2 emissions, respectively, owing to its chemical composition that yielded fewer particulates than jet fuel when burned, in return emitting less greenhouse gases.
- It was also found from the simulation that while a higher mass flow rate is needed for biofuels, they are capable of producing the same energy as Jet-A with a reduction in the combustor’s exit temperature.
- From the design analysis it was concluded that an aircraft design with a TTBW configuration running on a 60% camelina biofuel blend is expected to increase the take-off weight by 1.34% and reduce the emission and fuel consumption by 30% and 10%, respectively, compared with the conventional aircraft design.
- Lastly, through a cost investigation, it was established that flying on board a 100%-biofuel-powered aircraft would increase the ticket cost by 453 USD (1653.18 AED) per passenger.
The results of this research focused on the case of a small business jet aircraft, which comprise a very small slice of the aviation market. Further studies on regional and short-medium range categories should be carried out to assess the actual benefits of sustainable aviation fuel transportation aircrafts. All in all, it is concluded that implementing biofuels and combining them with more aerodynamic configurations, such as the TTBW, would maximize reductions in emissions and serve the 2050 net-zero carbon emission goal endorsed by many countries, including the UAE.
Author Contributions
Conceptualization, methodology, formal analysis, investigation, resources, data curation, writing—original draft preparation, writing—review and editing, visualization, validation, H.A., D.A., B.K. and H.X.; software, H.A. and D.A.; supervision, E.T. All authors have read and agreed to the published version of the manuscript.
Funding
This research received no external funding.
Institutional Review Board Statement
Not applicable.
Informed Consent Statement
Not applicable.
Data Availability Statement
Not applicable.
Acknowledgments
This research was done at Emirates Aviation University-Dubai, we thank the university for providing the necessary software and means which made this research possible. We would also like to thank our colleague Ghaleya Adel from Emirates Aviation University for her helps.
Conflicts of Interest
The authors declare no conflict of interest.
Nomenclature
| AR | Aspect Ratio |
| CFD | Computational Fluid Dynamics |
| Maximum required Take-off Lift coefficient with flaps up | |
| Maximum required Lift coefficient for Take-off | |
| Maximum required Take-off Lift coefficient for landing | |
| CO | Carbon monoxide |
| CO2 | Carbon dioxide |
| EI | Emission Index |
| GHG | Greenhouse Gases |
| HEFA | Hydro process asters and fatty acids |
| IATA | International Air Transport Association |
| ICAO | International Civil Aviation Organization |
| LHV | Lower heating value |
| LTO | Landing and Take-off |
| L/D | Lift to drag ratio |
| Air Mass flow rate | |
| Fuel Mass flow rate | |
| Mass flow rate of water | |
| NOx | Nitrogen Oxides |
| SUGAR | Subsonic Ultra-Green Aircraft Research |
| S/W | Wing loading |
| TTBW | Transonic Truss-braced Wing |
| T/W | Thrust-to-weight ratio |
| Wcrew | Crew weight |
| WE | Empty weight |
| WF | Fuel weight |
| WPL | Payload weight |
| Wtfo | Trapped fuel oil weight |
| WTO | Take-off weight |
| Actual heat release | |
| Theoretical heat release | |
| Burner efficiency |
References
- Masson-Delmotte, V.; Zhai, P.; Pörtner, H.O.; Roberts, D.; Skea, J.; Shukla, P.R.; Pirani, A.; Moufouma-Okia, W.; Pöan, C.; Pidcock, R.; et al. Global Warming of 1.5 °C. In An IPCC Special Report on the Impacts of Global Warming of 1.5 °C; IPCC: Geneva Switzerland, 2018; Volume 1. [Google Scholar]
- Change, P.C. Global warming of 1.5 °C; World Meteorological Organization: Geneva, Switzerland, 2018. [Google Scholar]
- Yoro, K.O.; Daramola, M.O. CO2 emission sources, greenhouse gases, and the global warming effect. In Advances in Carbon Capture; Woodhead Publishing: Sawston, UK, 2020; pp. 3–28. [Google Scholar]
- Mikhaylov, A.; Moiseev, N.; Aleshin, K.; Burkhardt, T. Global climate change and greenhouse effect. Entrep. Sustain. Issues 2020, 7, 2897–2913. [Google Scholar] [CrossRef] [PubMed]
- International Civil Aviation Organization: CO2 Emission from Commercial Aviation. 2018. Available online: https://www.icao.int/Meetings/a40/Documents/WP/wp_560_rev1_en.pdf (accessed on 29 December 2022).
- Lee, D.S.; Fahey, D.W.; Forster, P.M.; Newton, P.J.; Wit, R.C.N.; Lim, L.L.; Owen, B.; Sausen, R. Aviation and global climate change in the 21st century. Atmos. Environ. 2009, 43, 3520–3537. [Google Scholar] [CrossRef] [Green Version]
- Airbus: Global Market Forecast. Available online: https://www.airbus.com/en/products-services/commercial-aircraft/market/global-market-forecast (accessed on 14 December 2022).
- Boeing: Commercial Market Outlook. Available online: https://www.boeing.com/commercial/market/commercial-market-outlook/index.page (accessed on 14 December 2022).
- Solomon, S.C. Effects of Carbon Dioxide on the Upper Atmosphere. In McGraw-Hill Yearbook of Science and Technology; McGraw-Hill: New York, NY, USA, 2008. [Google Scholar]
- Emmert, J.T.; Picone, J.M.; Lean, J.L.; Knowles, S.H. Global change in the thermosphere: Compelling evidence of a secular decrease in density. J. Geophys. Res. 2004, 109, A02301. [Google Scholar] [CrossRef]
- Lewis, H.G.; Swinerd, G.G.; Ellis, C.S.; Martin, C.E. Response of the space debris environment to greenhouse cooling. In Proceedings of the Fourth European Conference on Space Debris, Darmstadt, Germany, 18–20 April 2005; pp. 243–248. [Google Scholar]
- Arockiam, N.J.; Jawaid, M.; Saba, N. Sustainable bio composites for aircraft components. In Sustainable Composites for Aerospace Applications; Woodhead Publishing: Sawston, UK, 2018; pp. 109–123. [Google Scholar]
- Sharma, G.; Isanaka, B.R.; Kushvaha, V. Engineering applications of biofibers. In The Textile Institute Book Series: Advances in Bio-Based Fiber; Woodhead Publishing: Sawston, UK, 2022; pp. 619–643. [Google Scholar]
- Vinod, A.; Sanjay, M.R.; Suchart, S.; Jyotishkumar, P. Renewable and sustainable biobased materials: An assessment on biofibers, biofilms, biopolymers and biocomposites. J. Clean. Prod. 2020, 258, 120978. [Google Scholar] [CrossRef]
- Kokorikou, A.; Vink, P.; De Pauw, I.C.; Braca, A. Exploring the design of a lightweight, sustainable and comfortable aircraft seat. Work 2016, 54, 941–954. [Google Scholar] [CrossRef]
- Markatos, D.N.; Pantelakis, S.G. Assessment of the Impact of Material Selection on Aviation Sustainability, from a Circular Economy Perspective. Aerospace 2022, 9, 52. [Google Scholar] [CrossRef]
- Bachmann, J.; Yi, X.; Tserpes, K.; Sguazzo, C.; Barbu, L.G.; Tse, B.; Soutis, S.; Ramón, E.; Linuesa, H.; Bechtel, S. Towards a circular economy in the aviation sector using eco-composites for interior and secondary structures. Results and recommendations from the EU/China project ECO-COMPASS. Aerospace 2021, 8, 131. [Google Scholar] [CrossRef]
- Sebastian, R.M.; Louis, J. Understanding waste management at airports: A study on current practices and challenges based on literature review. Renew. Sustain. Energy Rev. 2021, 147, 111229. [Google Scholar] [CrossRef]
- Maldonado, D.; Viken, S.A.; Housman, J.A.; Hunter, C.A.; Duensing, J.C.; Frink, N.T.; Jensen, J.C.; McMillin, S.N.; Kiris, C.C. Computational Simulations of a Mach 0.745 Transonic Truss-Braced Wing Design. In Proceedings of the AIAA Scitech 2020 Forum, Orlando, FL, USA, 6–10 January 2020. [Google Scholar]
- NASA Aims for Climate-Friendly Aviation. Available online: https://www.nasa.gov/aeroresearch/nasa-aims-for-climate-friendly-aviation (accessed on 15 September 2022).
- How Sweet the Future of Aviation—Boeing Multimedia by Bradley, M. Available online: https://www.boeing.com/features/innovation-quarterly/aug2017/feature-technical-sugar.page (accessed on 12 August 2022).
- Droney, C.; Harrison, N.; Gatlin, G. Subsonic Ultra-Green Aircraft Research: Transonic Truss-Braced Wing Technical Maturation. In Proceedings of the 31st Congress of the International Council of the Aeronautical Sciences, Belo Horizon, Brazil, 9–14 September 2018. [Google Scholar]
- Gur, O.; Bhatia, M.; Schetz, J.; Mason, W. Design Optimization of a Truss-Braced-Wing Transonic Transport Aircraft. J. Aircr. 2010, 46, 1907–1917. [Google Scholar] [CrossRef]
- Patel, N. Design of Medium Size Blended Wing Body Subsonic Transport Aircraft; San José State University: San Jose, CA, USA, 2018. [Google Scholar]
- Leifsson, L.; Ko, A.; Mason, W.H.; Schetz, J.A.; Grossman, B.; Haftka, R.T. Multidisciplinary design optimization of blended-wing-body transport aircraft with distributed propulsion. Aerosp. Sci. Technol. 2013, 25, 16–28. [Google Scholar] [CrossRef] [Green Version]
- Chen, Z.; Zhang, M.; Chen, Y.; Sang, W.; Tan, Z.; Li, D.; Zhang, B. Assessment on critical technologies for conceptual design of blended-wing-body civil aircraft. Chin. J. Aeronaut. 2019, 32, 1797–1827. [Google Scholar] [CrossRef]
- Jemitola, P.O.; Fielding, J.P. Box Wing Aircraft Conceptual Design. Available online: https://www.icas.org/ICAS_ARCHIVE/ICAS2012/PAPERS/213.PDF (accessed on 1 October 2021).
- Jemitola, P.O.; Okonkwo, P.P. An Analysis of Aerodynamic Design Issues of Box Wing Aircraft. Available online: https://globaljournals.org/GJRE_Volume22/4-An-Analysis-of-Aerodynamic-Design.pdf (accessed on 27 January 2022).
- International Air Transport Association (IATA): Annual Review. 2022. Available online: https://www.iata.org/contentassets/c81222d96c9a4e0bb4ff6ced0126f0bb/annual-review-2022.pdf (accessed on 14 December 2022).
- Panbudi, N.; Itaoka, K.; Kurosawa, A.; Yamakawa, N. Impact of hydrogen fuel for CO2 emission reduction in power generation sector in Japan. In Proceedings of the 8th International Conference on Applied Energy—ICAE, Beijing, China, 8–11 October 2016. [Google Scholar]
- International Air Transport Association (IATA): Developing Sustainable Aviation Fuel (SAF). Available online: https://www.iata.org/en/programs/environment/sustainable-aviation-fuels/ (accessed on 26 September 2022).
- Strategic Research and Innovation Agenda (SRIA), Clean Aviation. Available online: https://www.clean-aviation.eu/strategic-research-and-innovation-agenda-sria (accessed on 7 February 2023).
- Office of Energy Efficiency & Renewable Energy: Biofuel Basics. Available online: https://www.energy.gov/eere/bioenergy/biofuel-basics (accessed on 24 December 2022).
- Cabrera, E.; de Sousa, J.M.M. Use of Sustainable Fuels in Aviation—A Review. Energies 2022, 15, 2440. [Google Scholar] [CrossRef]
- IEA Bioenergy: Drop-In Biofuels: The Key Role That Co-Processing Will Likely Play in Its Production. Available online: https://www.ieabioenergy.com/wpcontent/uploads/2019/09/Task-39-Drop-in-Biofuels-Full-Report-January-2019.pdf (accessed on 24 November 2021).
- European Technology and Innovation Platform: Aviation Biofuels. Available online: https://www.etipbioenergy.eu/images/ETIP_Bioenergy_Factsheet_Aviation_Biofuels.pdf (accessed on 24 December 2022).
- Boomadevi, P.; Paulson, V.; Samlal, S.; Varatharajan, M.; Sekar, M.; Alsehli, M.; Elfasakhany, A.; Tola, S. Impact of microalgae biofuel on microgas turbine aviation engine: A combustion and emission study. Fuel 2021, 302, 121155. [Google Scholar] [CrossRef]
- Olivera, J.; Brojo, F. Simulation of the combustion of bio-derived fuels in a CFM56-3 combustor. In Proceedings of the 2017 2nd International Conference Sustainable and Renewable Energy Engineering (ICSREE), Hiroshema, Japan, 10–12 May 2017. [Google Scholar]
- Kilic, G.; Sungur, B.; Topaloglu, B.; Ozcan, H. Experimental analysis on the performance and emissions of diesel/butanol/biodiesel blended fuels in a flame tube boiler. Appl. Therm. Eng. 2018, 130, 195–202. [Google Scholar] [CrossRef]
- Sharma, P.; Le, M.P.; Chhillar, A.; Said, Z.; Deepanraj, B.; Cao, D.N.; Bandh, S.A.; Hoang, A.T. Using response surface methodology approach for optimizing performance and emission parameters of diesel engine powered with ternary blend of Solketal-biodiesel-diesel. Sustain. Energy Technol. Assess. 2022, 52, 102343. [Google Scholar] [CrossRef]
- Zhou, L.; Liu, Z.; Wang, Z. Numerical study of influence of biofuels on the combustion characteristics and performance of aircraft engine system. Appl. Therm. Eng. 2015, 91, 399–407. [Google Scholar] [CrossRef]
- Gawron, B.; Białecki, T.; Janicka, A.; Suchocki, T. Combustion and Emissions Characteristics of the Turbine Engine Fueled with HEFA Blends from Different Feedstocks. Energies 2020, 13, 1277. [Google Scholar] [CrossRef] [Green Version]
- Azami, M.; Savill, M. Comparative study of alternative biofuels on aircraft engine performance. J. Aerosp. Eng. 2017, 231, 1509–1521. [Google Scholar] [CrossRef] [Green Version]
- Burge Hughes Walsh. Pugh Decision Matrix. Available online: https://www.burgehugheswalsh.co.uk/uploaded/1/documents/pugh-matrix-v1.1.pdf (accessed on 20 December 2022).
- Ghatak, A. Blended Wing Body (BWB)—Future of Aviation. 2021, Online Slides (Submitted). Available online: https://www.slideshare.net/AsimGhatak/blended-wing-body-bwb-future-of-aviation (accessed on 12 December 2021).
- Boeing: Spreading Our Wings: Boeing Unveils New Transonic Truss-Braced Wing. Available online: https://www.boeing.com/features/2019/01/spreading-our-wings-01-19.page (accessed on 10 September 2021).
- Allen, B. Blended Wing Body—A Potential New Aircraft Design; NASA: Washington, DC, USA, 2008. Available online: https://www.nasa.gov/centers/langley/news/factsheets/FS-2003-11-81-LaRC.html (accessed on 12 November 2021).
- Sadraey, M. Chapter 6. Tail Design. In Lecture Notes from Daniel Webster College. Available online: http://aero.us.es/adesign/Slides/Extra/Stability/Design_Tail/Chapter%206.%20Tail%20Design.pdf (accessed on 25 January 2023).
- Texas Space Grant Consortium. Available online: https://www.tsgc.utexas.edu/archive/general/ethics/vtail.html (accessed on 15 November 2021).
- The Vertical Stabilizer. Available online: https://www.aeroclass.org/vertical-stabilizer/#:~:text=Cruciform%20tails%20have%20disadvantages%3A%20They,the%20same%20amount%20of%20stability (accessed on 25 January 2023).
- Engine Failure after TakeOff—Light Twin Engine Aircraft. Available online: https://skybrary.aero/articles/engine-failure-after-takeoff-light-twin-engine-aircraft (accessed on 25 January 2023).
- Mazlan, N.M.; Savill, M.; Kipouros, T. Effects of biofuels properties on aircraft engine performance. Aircr. Eng. Aerosp. Technol. 2015, 87, 437–442. [Google Scholar] [CrossRef] [Green Version]
- Orban, A. Airbus Blended Wing Prototype Prioritizes Fuel Efficiency; Aviation24: Zemst, Belgium, 2020; Available online: https://www.aviation24.be/manufacturers/airbus/analysis-airbus-blended-wing-prototype-prioritises-fuel-efficiency/ (accessed on 17 November 2021).
- Air bp: What Is Sustainable Aviation Fuel (SAF)? Available online: https://www.bp.com/en/global/air-bp/news-and-744views/views/what-is-sustainable-aviation-fuel-saf-and-why-is-it-important.html (accessed on 14 November 2021).
- Marino, M.; Siddique, O.; Sabatini, R. Benefits of the Blended Wing Body Aircraft Compared to Current Airliners. In Proceedings of the First International Symposium on Sustainable Aviation, Istanbul, Turkey; 2015. [Google Scholar]
- Aviation Benefits Beyond Borders. Available online: https://aviationbenefits.org/media/166152/beginners-guide-to-saf_web.pdf (accessed on 23 November 2021).
- Baisden, T. Climate Explained: Could Biofuels Replace All Fossil Fuels in New Zealand? The Conversation 2021. Available online: https://theconversation.com/climate-explained-could-biofuels-replace-all-fossil-fuels-in-new-zealand-162502 (accessed on 20 November 2021).
- Carbon Brief. Available online: https://www.carbonbrief.org/thinktank-biofuels-are-too-expensive-and-they-dont-always-reduce-emissions/ (accessed on 20 November 2021).
- Energy Education. Available online: https://energyeducation.ca/encyclopedia/Energy_density (accessed on 20 November 2021).
- Bradley, M.K.; Droney, C.K. Subsonic Ultra Green Aircraft Research: Phase I Final Report; NASA: Washington, DC, USA, 2011; 207p. Available online: https://ntrs.nasa.gov/api/citations/20110011321/downloads/20110011321.pdf (accessed on 19 October 2021).
- Ikeda, T. Aerodynamic Analysis of a Blended-Wing-Body Aircraft Configuration. In A Thesis Submitted in Fulfilment of the Requirement for the Degree of Master of Engineering by Research; RMIT University: Melbourne, Australia, 2006; Available online: https://core.ac.uk/download/pdf/15615098.pdf (accessed on 20 October 2021).
- NASA: Blended-Wing-Body Transonic Aerodynamics: Summary of Ground Tests and Sample Results (Invited). Available online: https://ntrs.nasa.gov/api/citations/20090007702/downloads/20090007702.pdf (accessed on 21 October 2021).
- Roskam, J. Airplane Design Part I-VIII; DARcorporation: Lawrence, KS, USA, 1985. [Google Scholar]
- International Civil Aviation Organization: ICAO and Environmental Protection. Available online: https://www.icao.int/environmental-protection/Pages/LAQ_TechnologyStandards.aspx (accessed on 31 May 2022).
- Ribeiro, P. Análise de Performance da Família de Motores de Avião CFM56. Master’s Thesis, Instituto Superior de Engenharia de Lisboa, Lisboa, Portugal, 2012. [Google Scholar]
- Burcat, A.; Ruscic, C. Third Millennium Ideal Gas and Condensed Phase Thermochemical Database for Combustion with Updates from Active Thermochemical Tables. Available online: https://publications.anl.gov/anlpubs/2005/07/53802.pdf (accessed on 9 June 2022).
- Llamas, A.; Al-Lal, A.M.; Hernandez, M.; Lapuerta, M.; Canoira, L. Biokerosene from Babassu and Camelina Oils: Production and Properties of Their Blends with Fossil Kerosene. Energy Fuels 2012, 26, 5968–5976. [Google Scholar] [CrossRef]
- Stamenković, O.S.; Gautam, K.; Singla-Pareek, S.L.; Dhankher, O.P.; Djalović, I.G.; Kostić, M.D.; Mitrović, P.M.; Pareek, A.; Veljković, V.B. Biodiesel production from camelina oil: Present status and future perspectives. Food Energy Secur. 2023, 12, e340. [Google Scholar] [CrossRef]
- Bamerni, F. Plant-Based (Camelina sativa) Biodiesel Manufacturing Using the Technology of Instant Controlled Pressure Drop (DIC): Process Performance and Biofuel Quality. Ph.D. Thesis, University of La Rochelle, La Rochelle, France, 2018. [Google Scholar]
- Moser, B. Camelina (Camelina sativa L.) oil as a biofuel’s feedstock: Golden opportunity or false hope? Lipid Technol. 2010, 22, 270–273. [Google Scholar] [CrossRef]
- Frank, J.H.; Barlow, R.S. Non-Premixed Turbulent Combustion. Available online: https://www.osti.gov/biblio/1714512 (accessed on 1 June 2022).
- The European Commission. Available online: https://cordis.europa.eu/project/id/251798/reporting (accessed on 9 June 2022).
- Wang, Z.; Feser, J.S.; Lei, T.; Gupta, A.K. Performance and emissions of camelina oil derived jet fuel blends under distributed combustion condition. Fuel 2020, 271, 117685. [Google Scholar] [CrossRef]
- Etihad Airways News: Etihad Airways Flies the World’s First Flight Using Fuel Made in the UAE from Plants Grown in Saltwater by Khalifa Uni. Available online: https://www.etihad.com/en-ae/news/Etihad-airways-flies-the-worlds-first-flight-using-fuel-made-in-t (accessed on 22 December 2022).
- Hemighaus, G.; Boval, T.; Bacha, J.; Barnes, F.; Franklin, M.; Gibbs, L.; Hogue, N.; Jones, J.; Lesnini, D.; Lind, J.; et al. Aviation Fuels Technical Review; Chevron Products Company: San Ramon, CA, USA, 2007; pp. 1–94. [Google Scholar]
- Helsel, Z.R. Camelina for Biofuel Production. Farm Energy. 2019. Available online: https://farm-energy.extension.org/camelina-for-biofuel-production/ (accessed on 21 October 2021).
- Aslam, M.M.; Khan, A.A.; Cheema, H.M.N.; Hanif, M.A.; Azeem, M.W.; Azmat, M.A. Novel mutant camelina and jatropha as valuable feedstocks for biodiesel production. Sci. Rep. 2020, 10, 21868. Available online: https://www.nature.com/articles/s41598-020-78680-w#citeas (accessed on 26 October 2021). [CrossRef]
- Ghilvacs, M.; Carlanescu, R.; Paraschiv, M.; Prisecaru, M. Analysis of energy potential of biofuels obtained from camelina sativa. Renew. Energy 2020, 180, 02005. [Google Scholar] [CrossRef]
- Sankpal, S.T.; Naikwade, P.V. Important Bio-fuel Crops: Advantages and Disadvantages. Int. J. Sci. Eng. Res. 2013, 4, 1–5. [Google Scholar]
- Green, L. Jatropha as Biofuel: An Analysis of the Possible Implications for Food Security in Mali. Bachelor’s Thesis, Dalhousie University, Halifax, NS, Canada, 2009. [Google Scholar]
- Travel and Leisure: This Is Where Every Dollar of Your Airfare Goes Do You Know Where Your Airfare Dollars Go? By Garcia, M. Travel and Leisure. Available online: https://www.travelandleisure.com/airlines-airports/airfare-dollars-breakdown (accessed on 22 December 2022).
- Bankrate: How Much Does a Private Jet Cost? By Rivelli, E. Available online: https://www.bankrate.com/loans/personal-loans/how-much-does-a-private-jet-cost/ (accessed on 22 December 2022).
- IATA: Jet Fuel Price Monitor. Available online: https://www.iata.org/en/publications/economics/fuel-monitor/ (accessed on 22 December 2022).
- IRENA. Reaching Zero with Renewables: Biojet fuels; International Renewable Energy Agency: Abu Dhabi, United Arab Emirates, 2021. [Google Scholar]
Figure 1.
Perspective views of Transonic Truss-Braced Wing (TTBW) 3D printed model.

Figure 2.
Schematic of TTBW_1T (top figure) and TTBW_2T (bottom figure).

Figure 3.
2D Combustor geometry.

Figure 4.
Power output comparison of the simulated fuels.

Figure 5.
Exit temperature of the combustion chamber using Jet-A fuel and Jatropha biofuel. Solid lines show the current research and dash lines show the work done by Olivera and Brojo [38].
Figure 5.
Exit temperature of the combustion chamber using Jet-A fuel and Jatropha biofuel. Solid lines show the current research and dash lines show the work done by Olivera and Brojo [38].

Figure 6.
Error percentage with respect to the reference results of Olivera and Brojo [38].
Figure 6.
Error percentage with respect to the reference results of Olivera and Brojo [38].

Figure 7.
Exit temperature of the combustion chamber simulation results: (a) camelina temperature contour at 100% power; (b) exit temperature versus power setting for the simulated fuels.
Figure 7.
Exit temperature of the combustion chamber simulation results: (a) camelina temperature contour at 100% power; (b) exit temperature versus power setting for the simulated fuels.

Figure 8.
CO emission’s simulation results from camelina biofuel combustion: (a) the contour of the CO compound mass fraction released while burning camelina at 100% power; (b) the emission index of CO versus the power setting for the simulated fuels.
Figure 8.
CO emission’s simulation results from camelina biofuel combustion: (a) the contour of the CO compound mass fraction released while burning camelina at 100% power; (b) the emission index of CO versus the power setting for the simulated fuels.

Figure 9.
CO2 emissions’ simulation results from camelina biofuel combustion: (a) the mass fraction of CO2 while burning camelina at 100% power; (b) the emission index of CO2 versus the power setting for the simulated fuels.
Figure 9.
CO2 emissions’ simulation results from camelina biofuel combustion: (a) the mass fraction of CO2 while burning camelina at 100% power; (b) the emission index of CO2 versus the power setting for the simulated fuels.

Figure 10.
UAE biofuel production timeline.

Figure 11.
Comparison chart between the four proposed designs with respect to net weight and emissions.
Figure 11.
Comparison chart between the four proposed designs with respect to net weight and emissions.


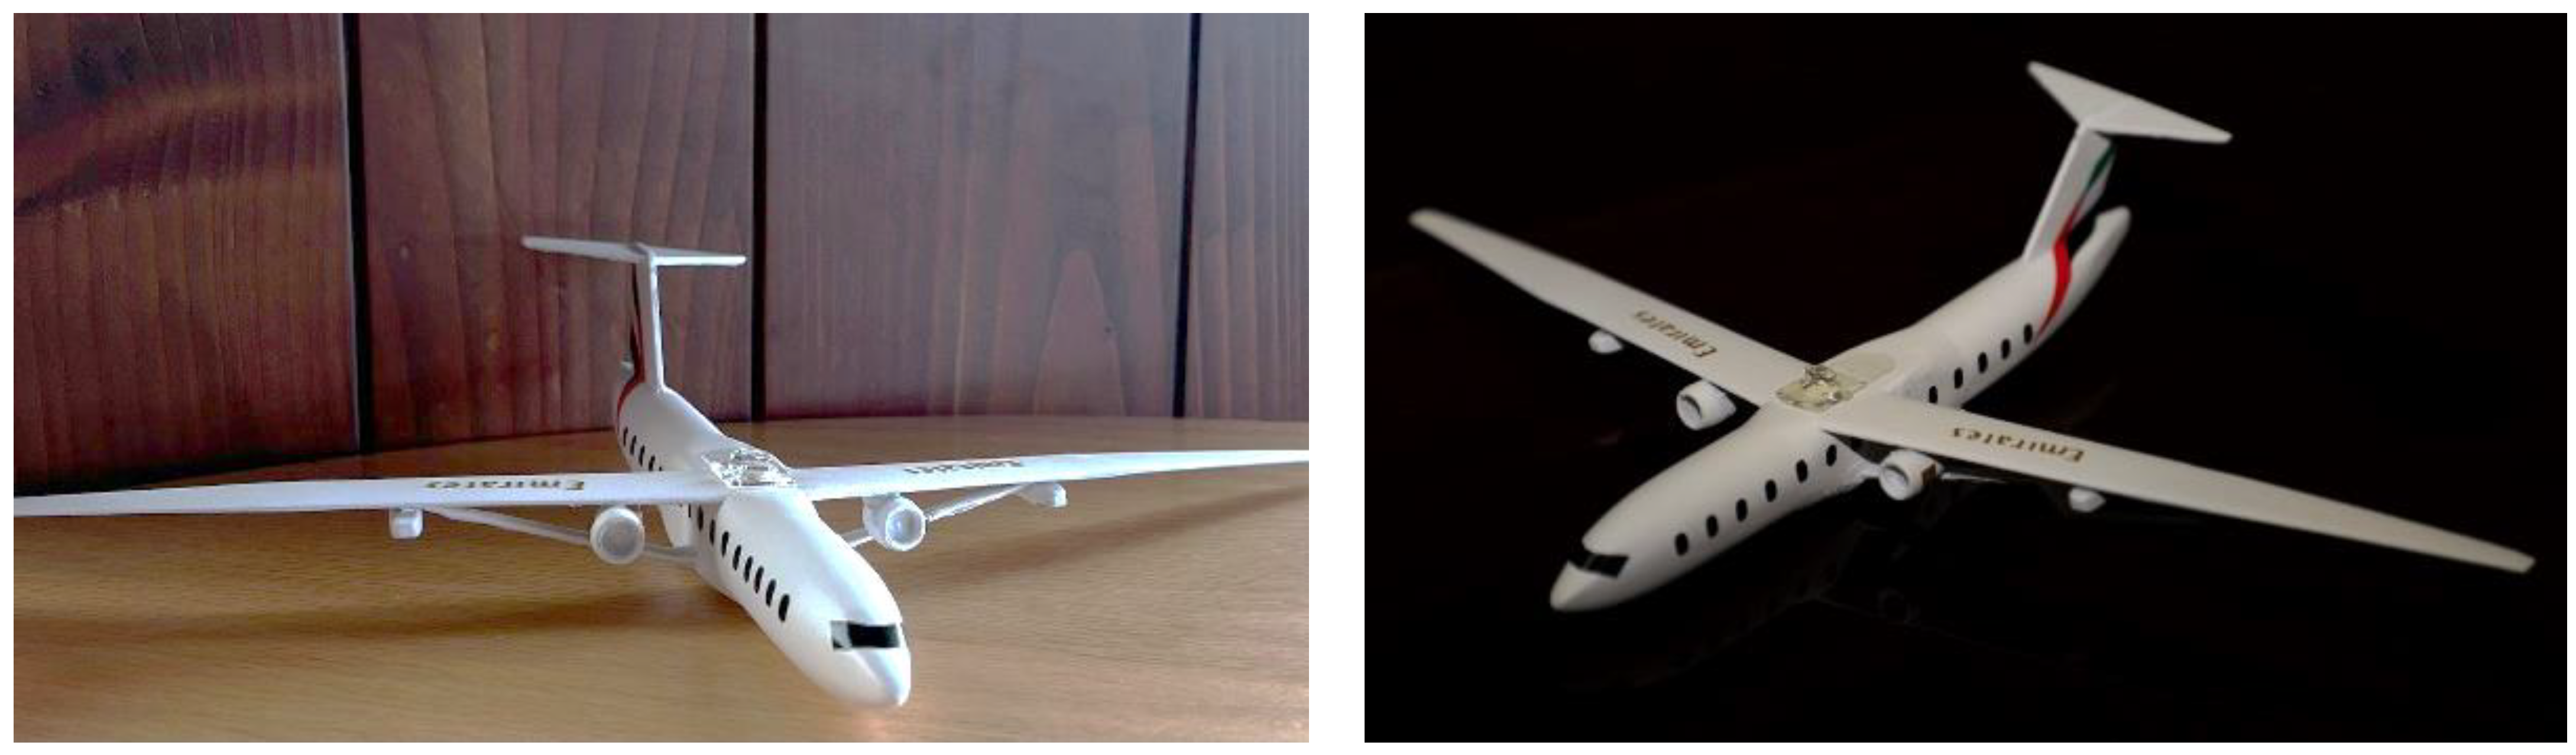
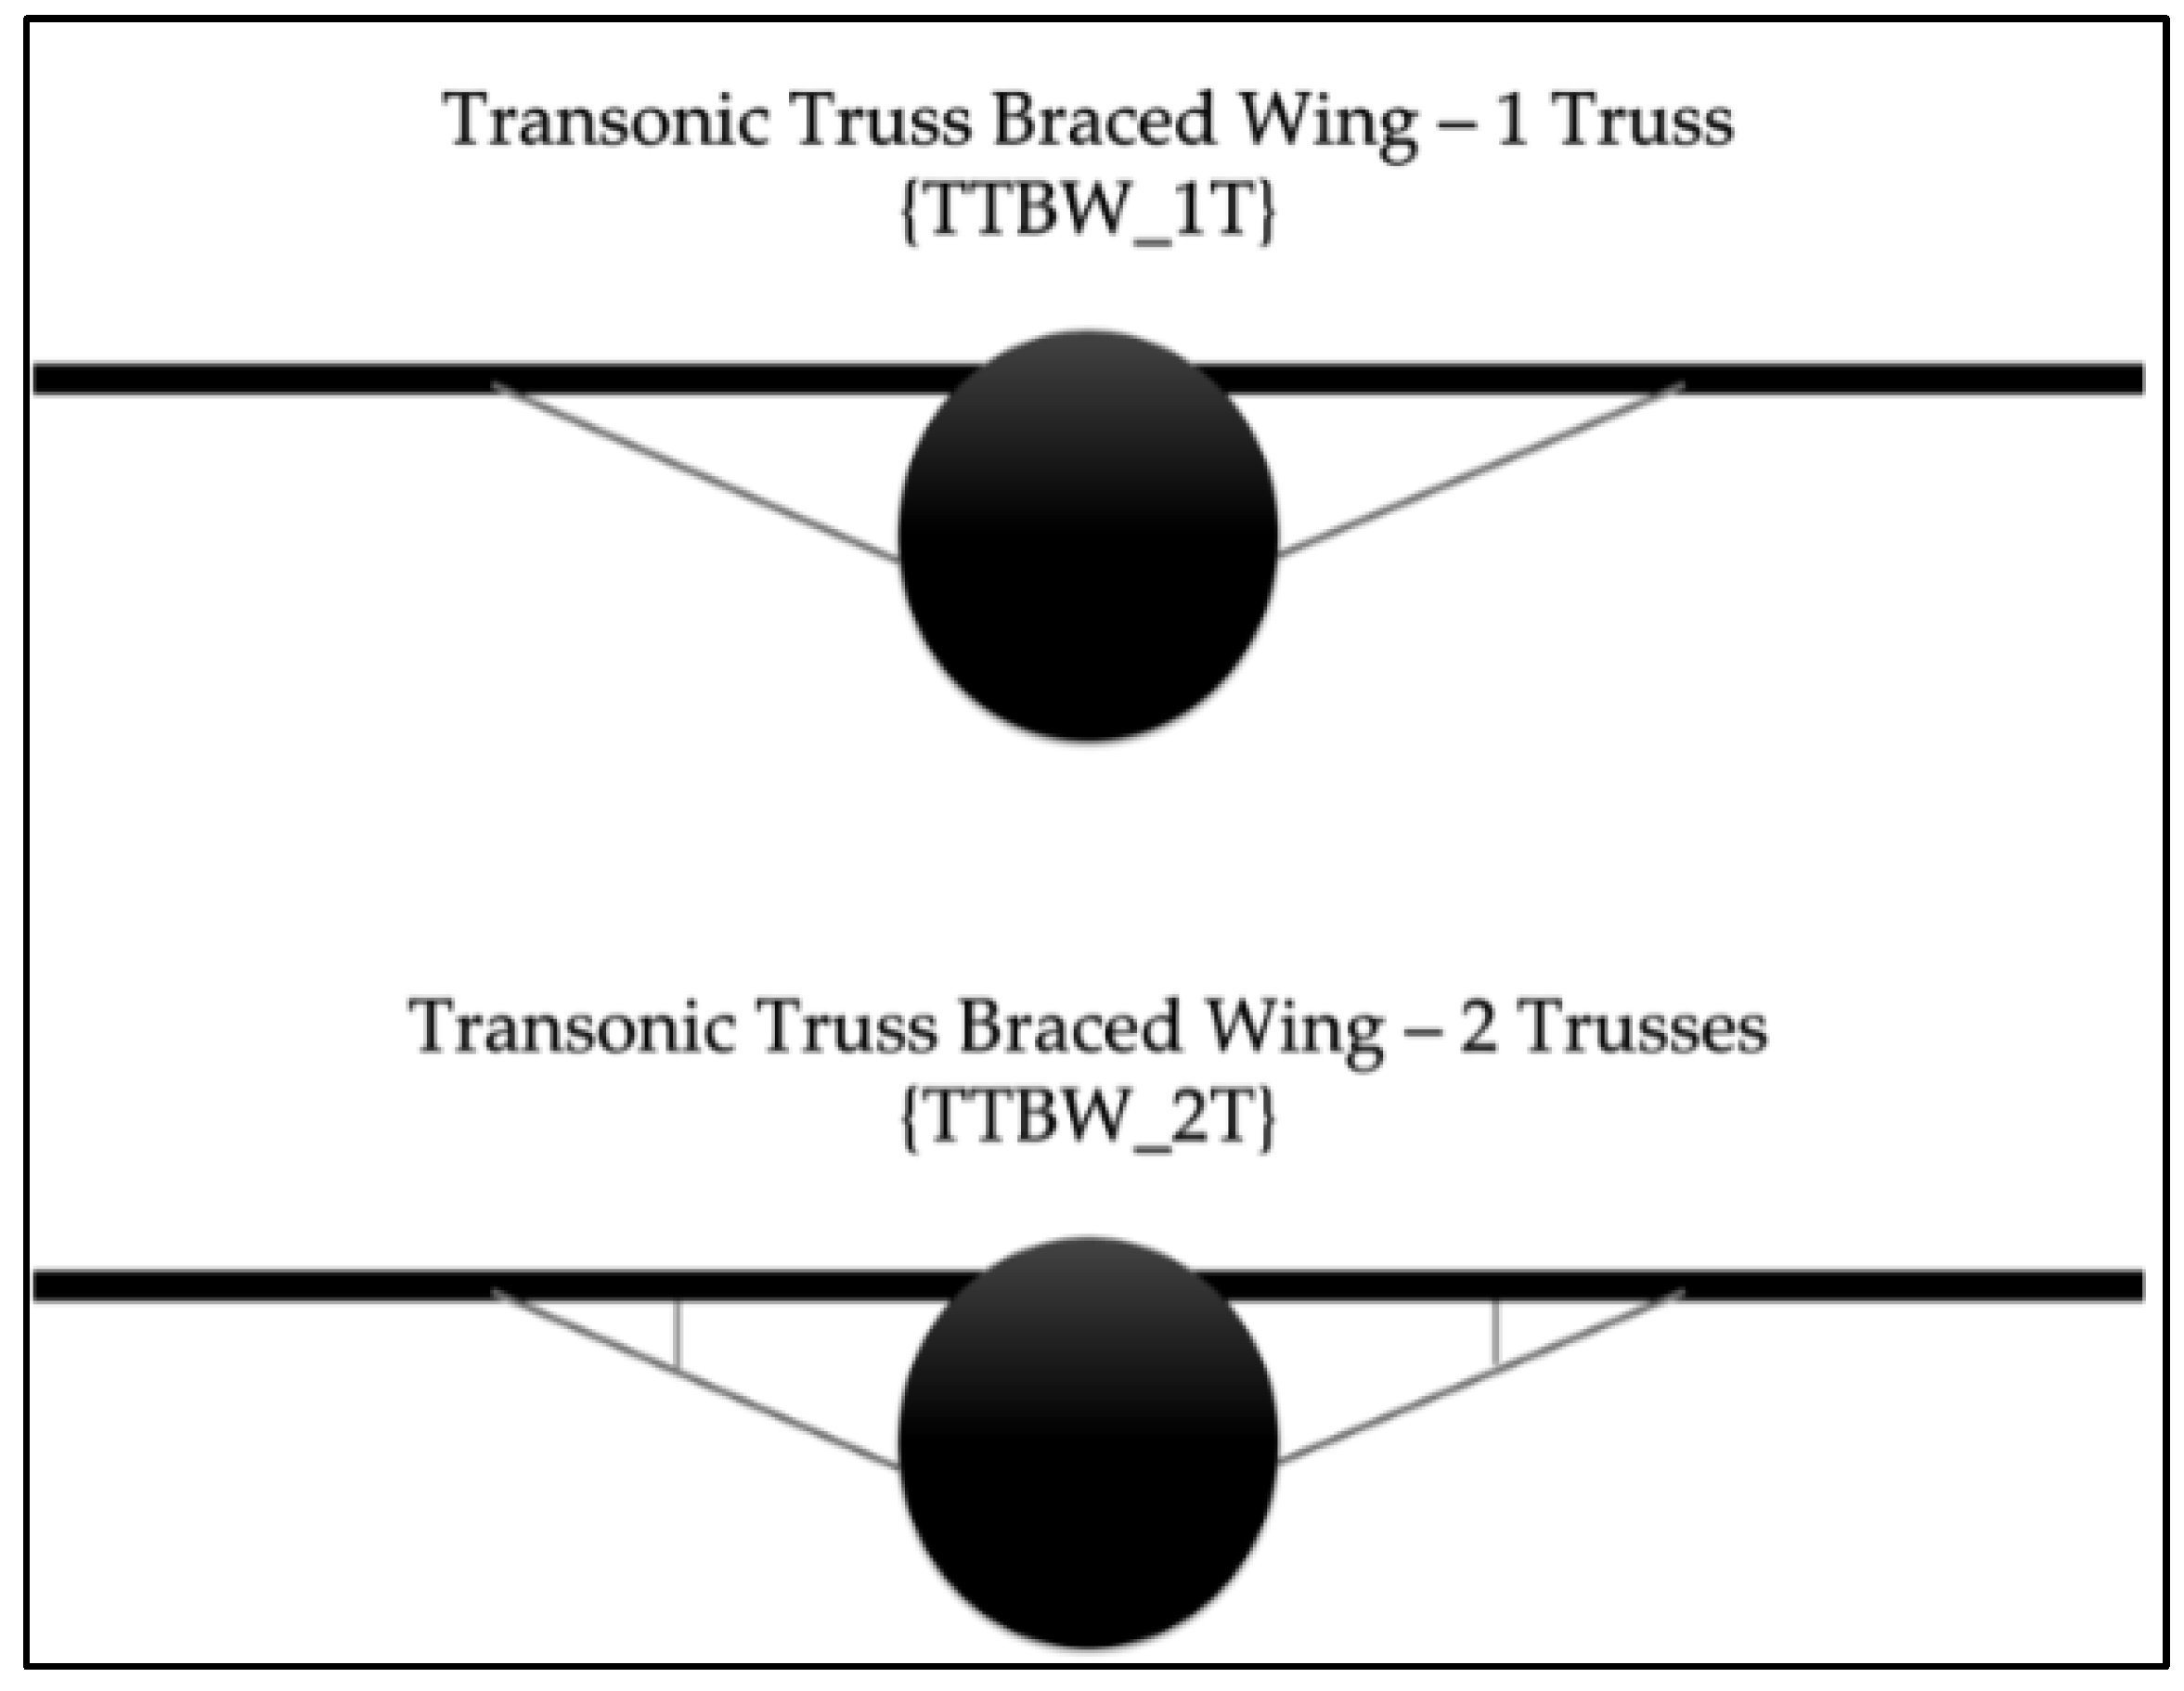
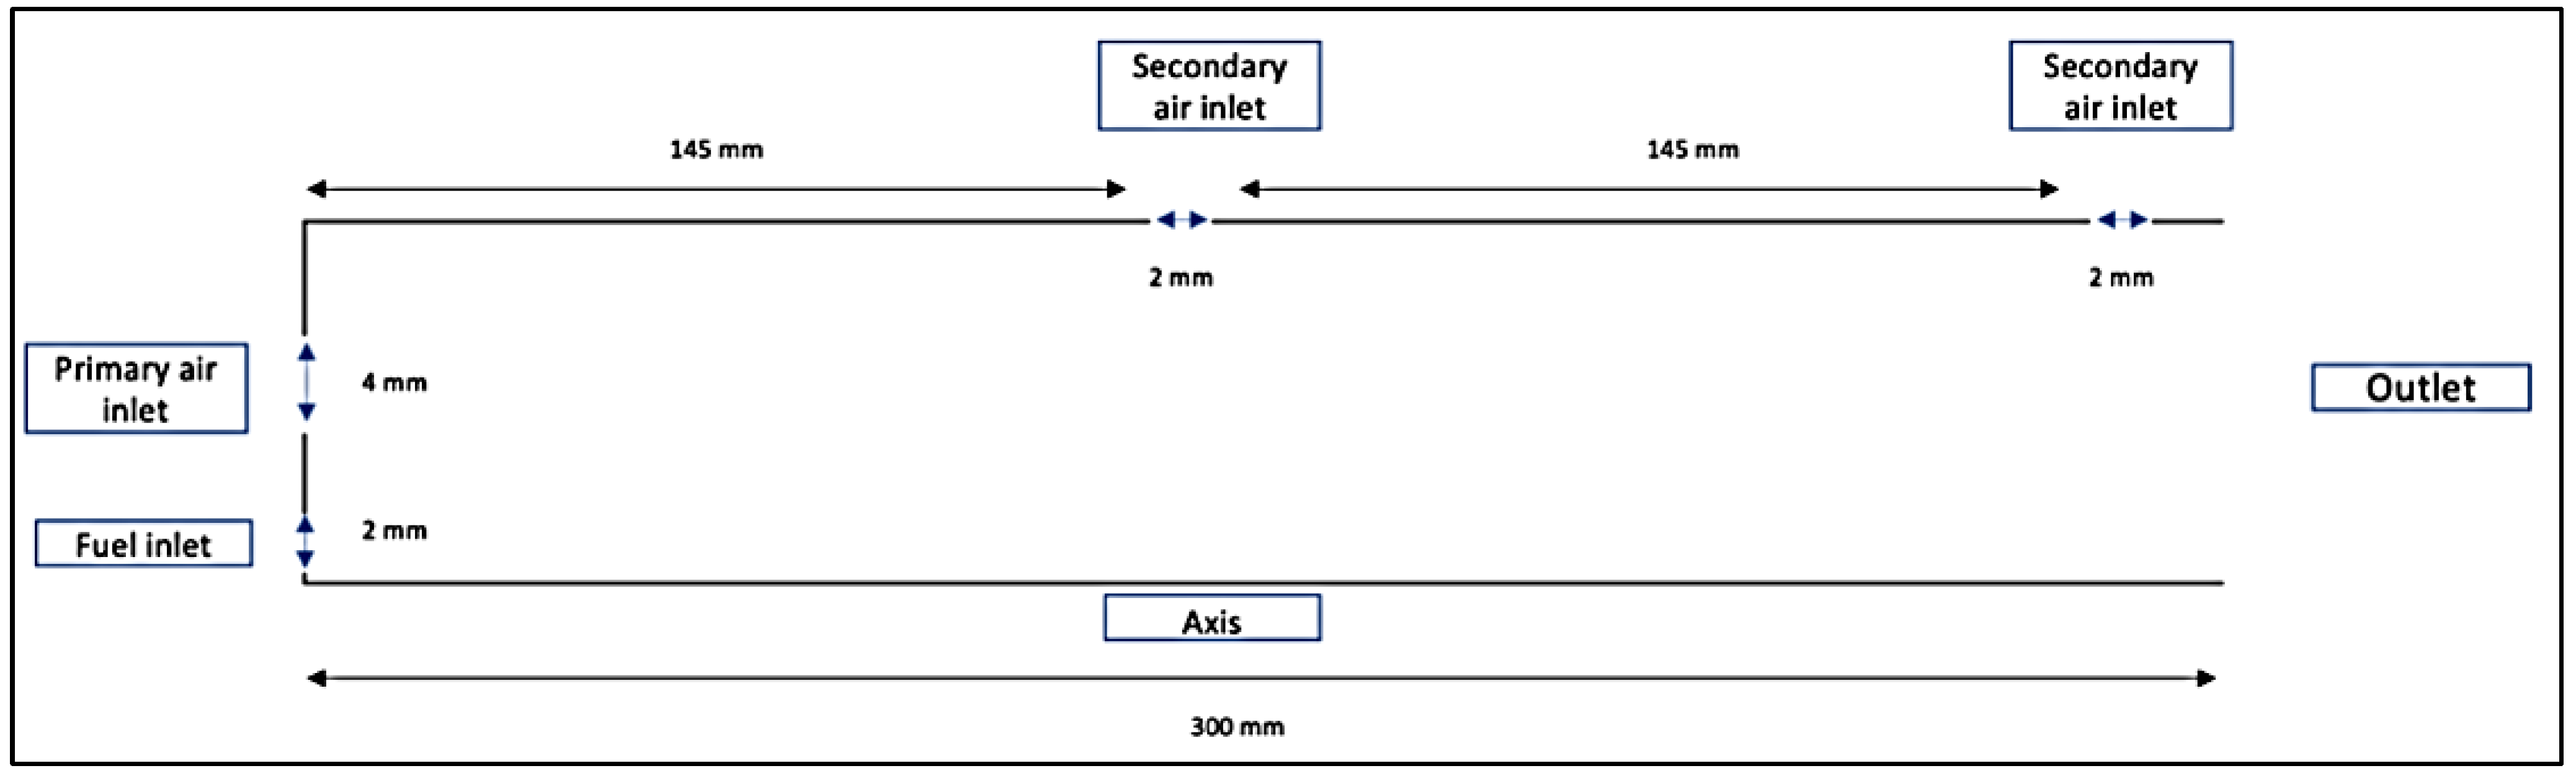
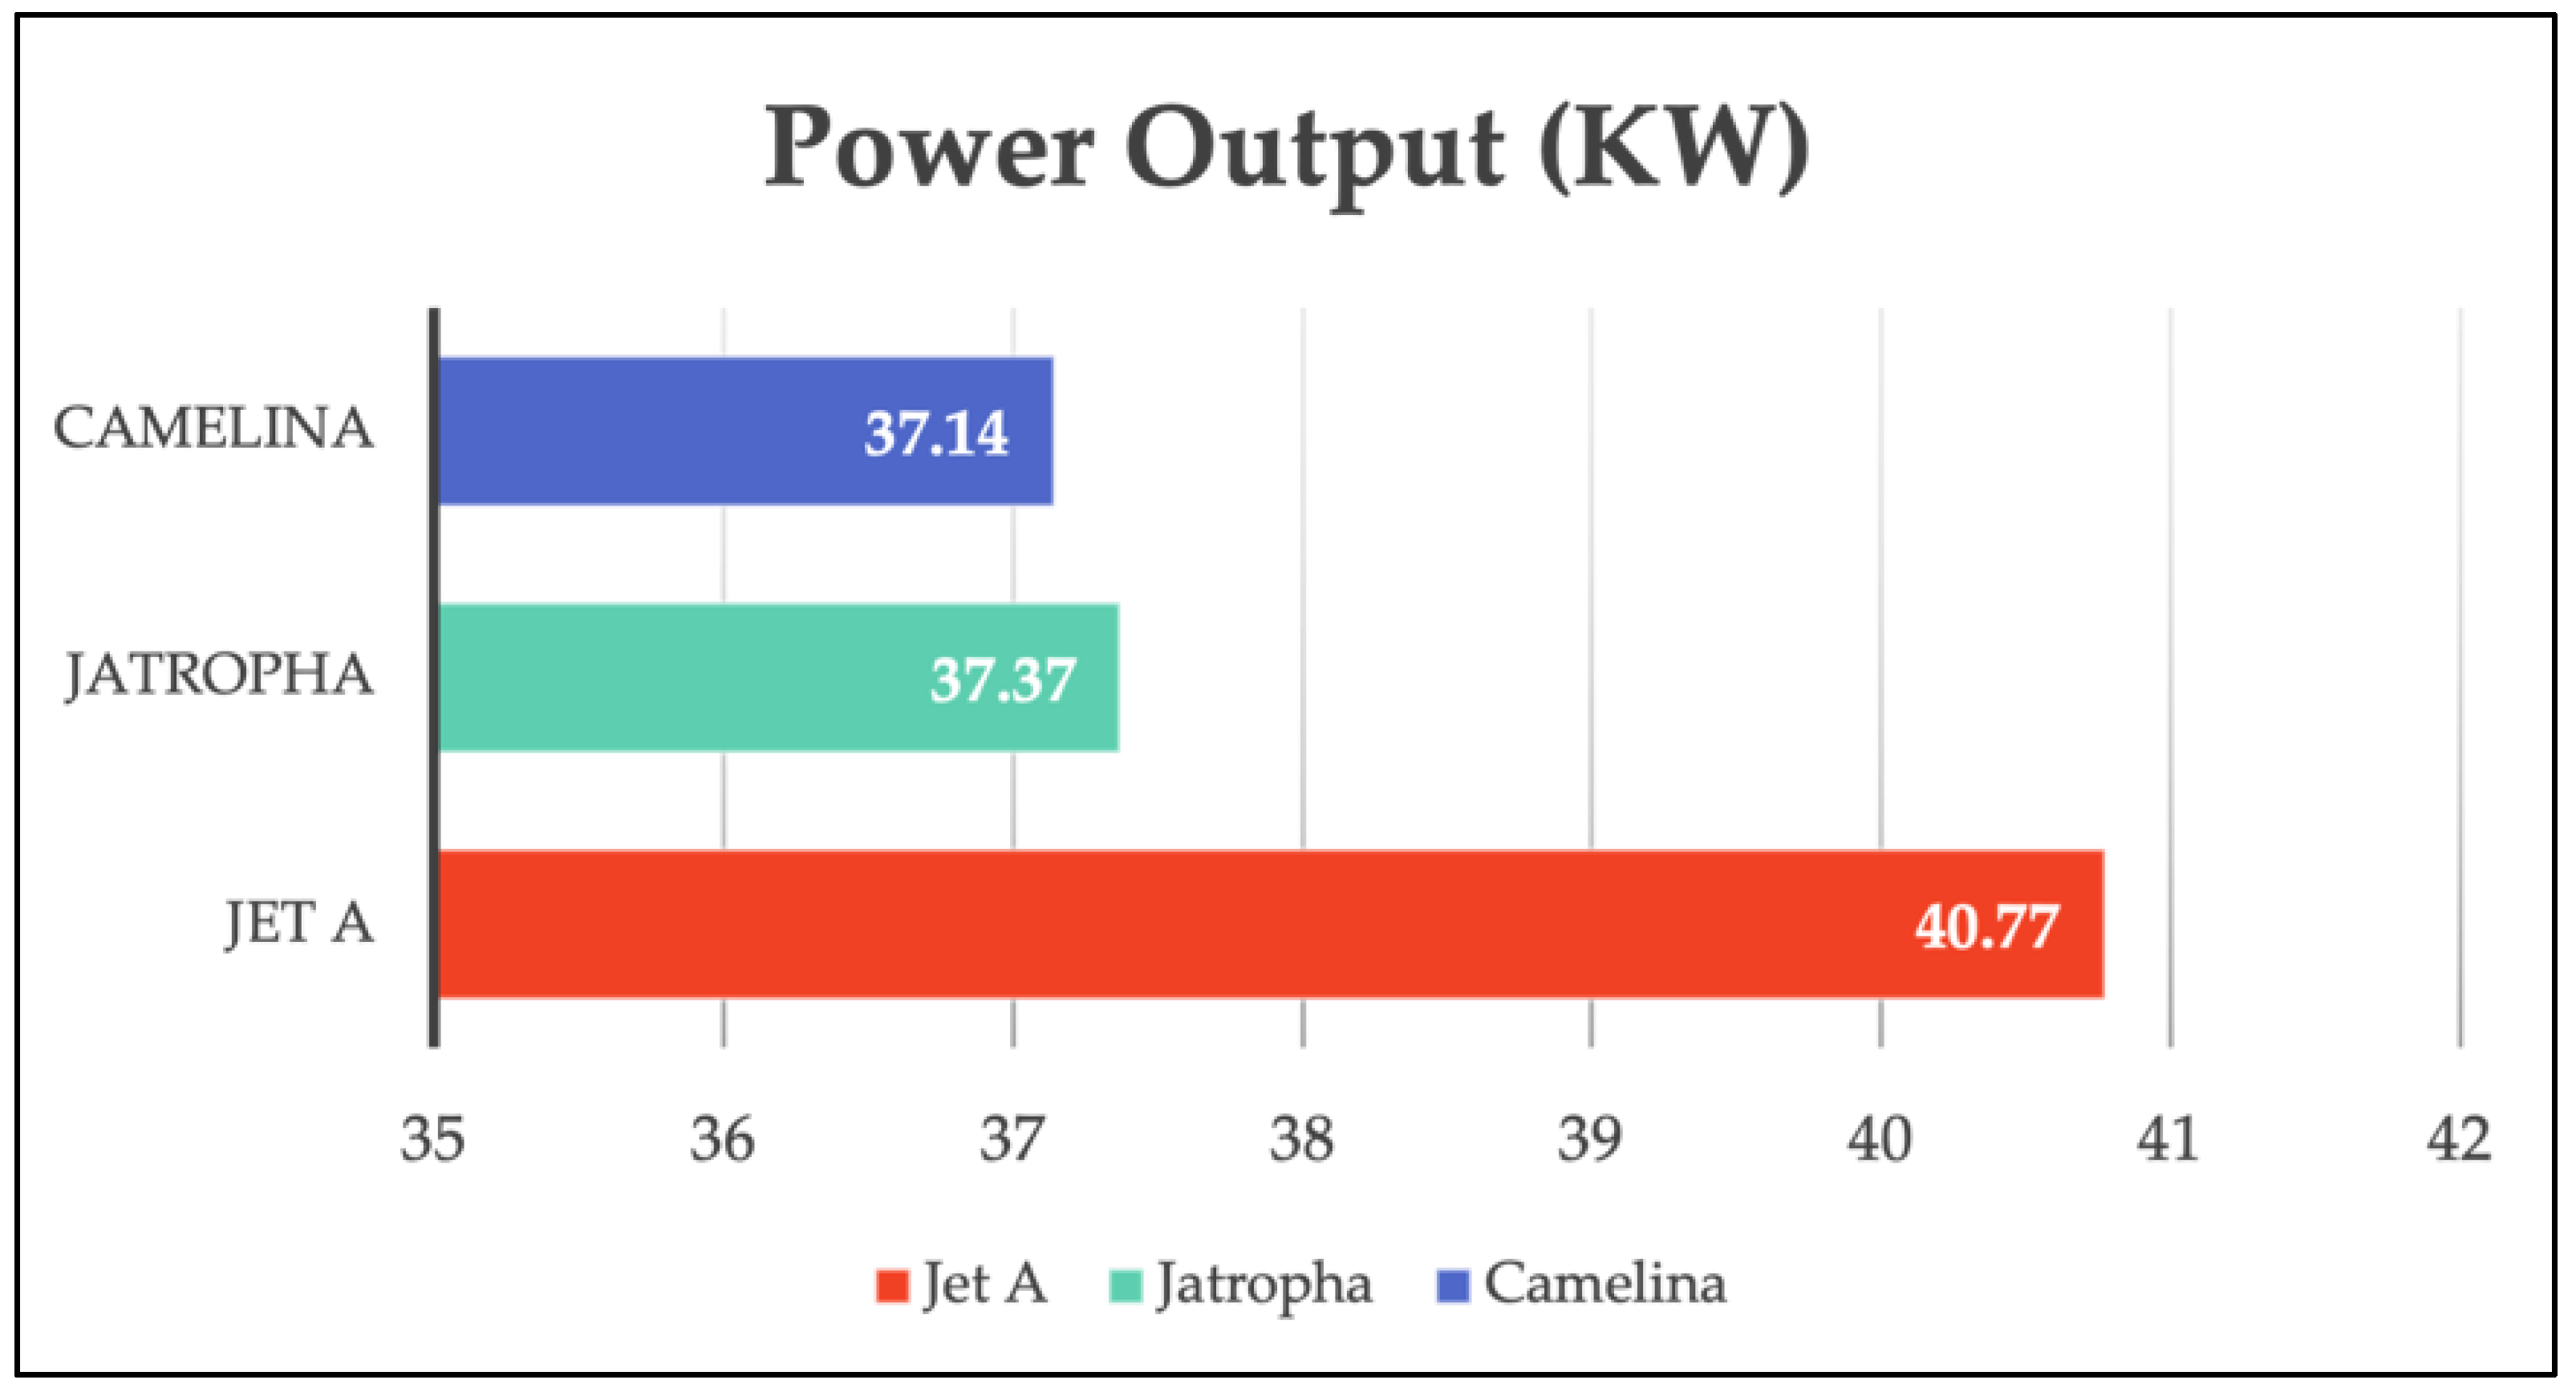
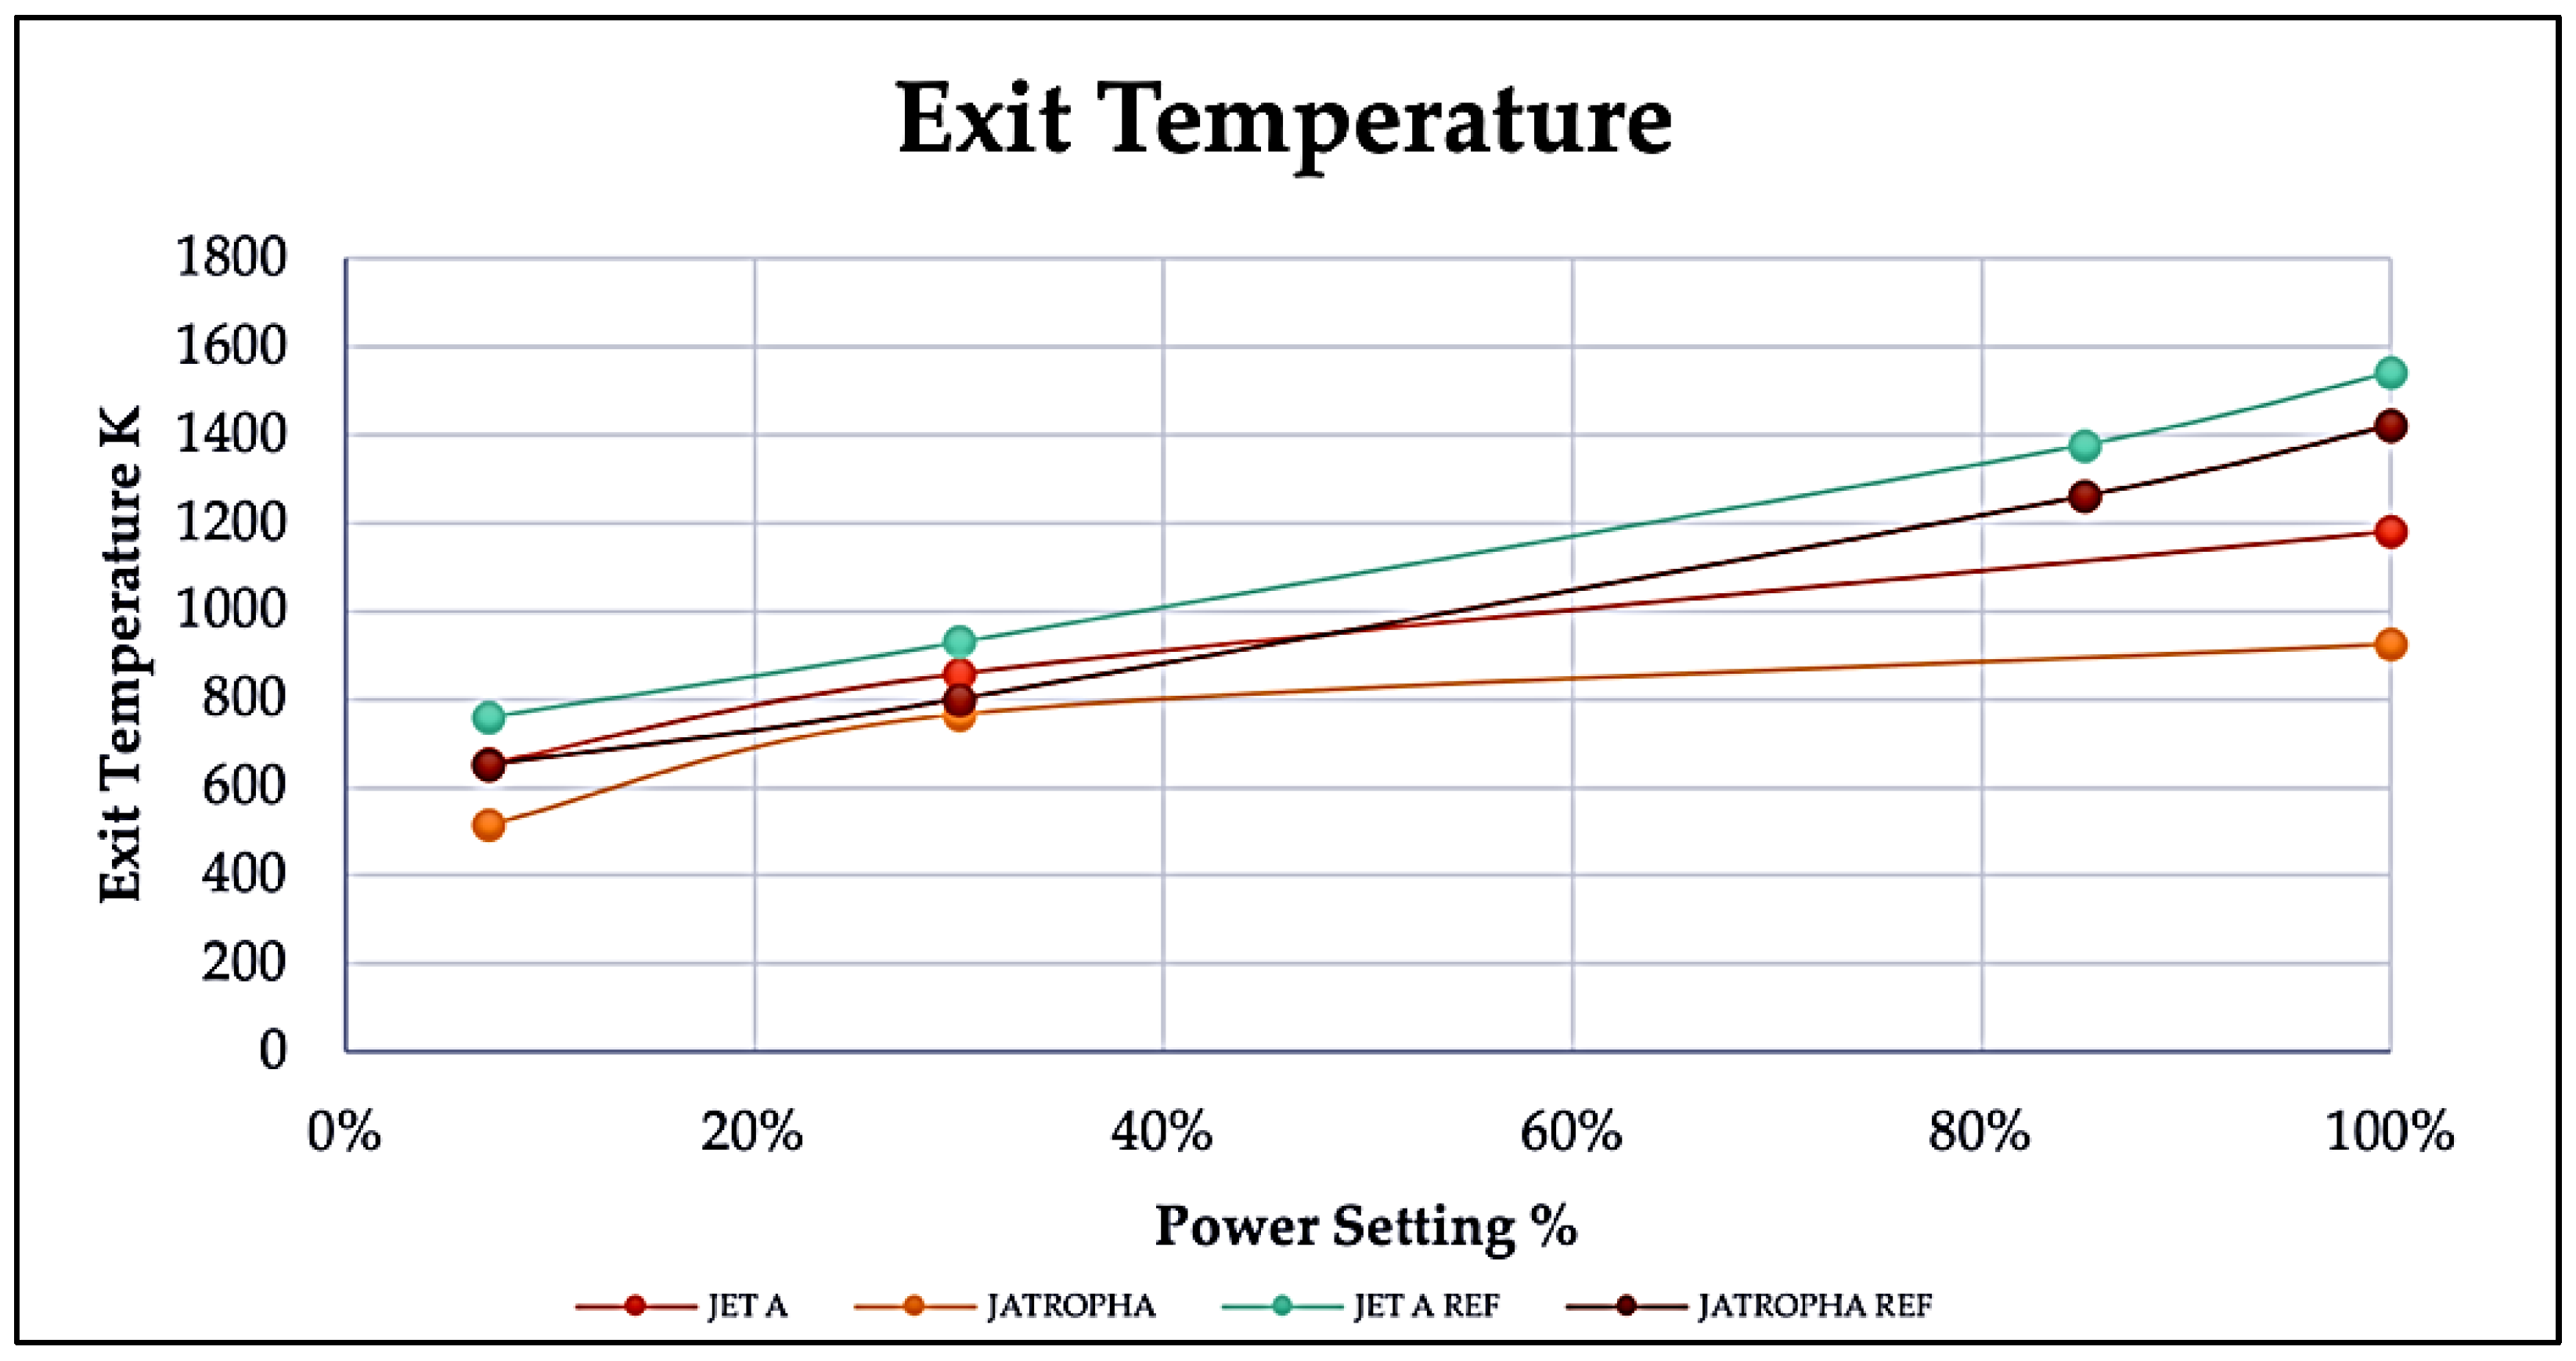
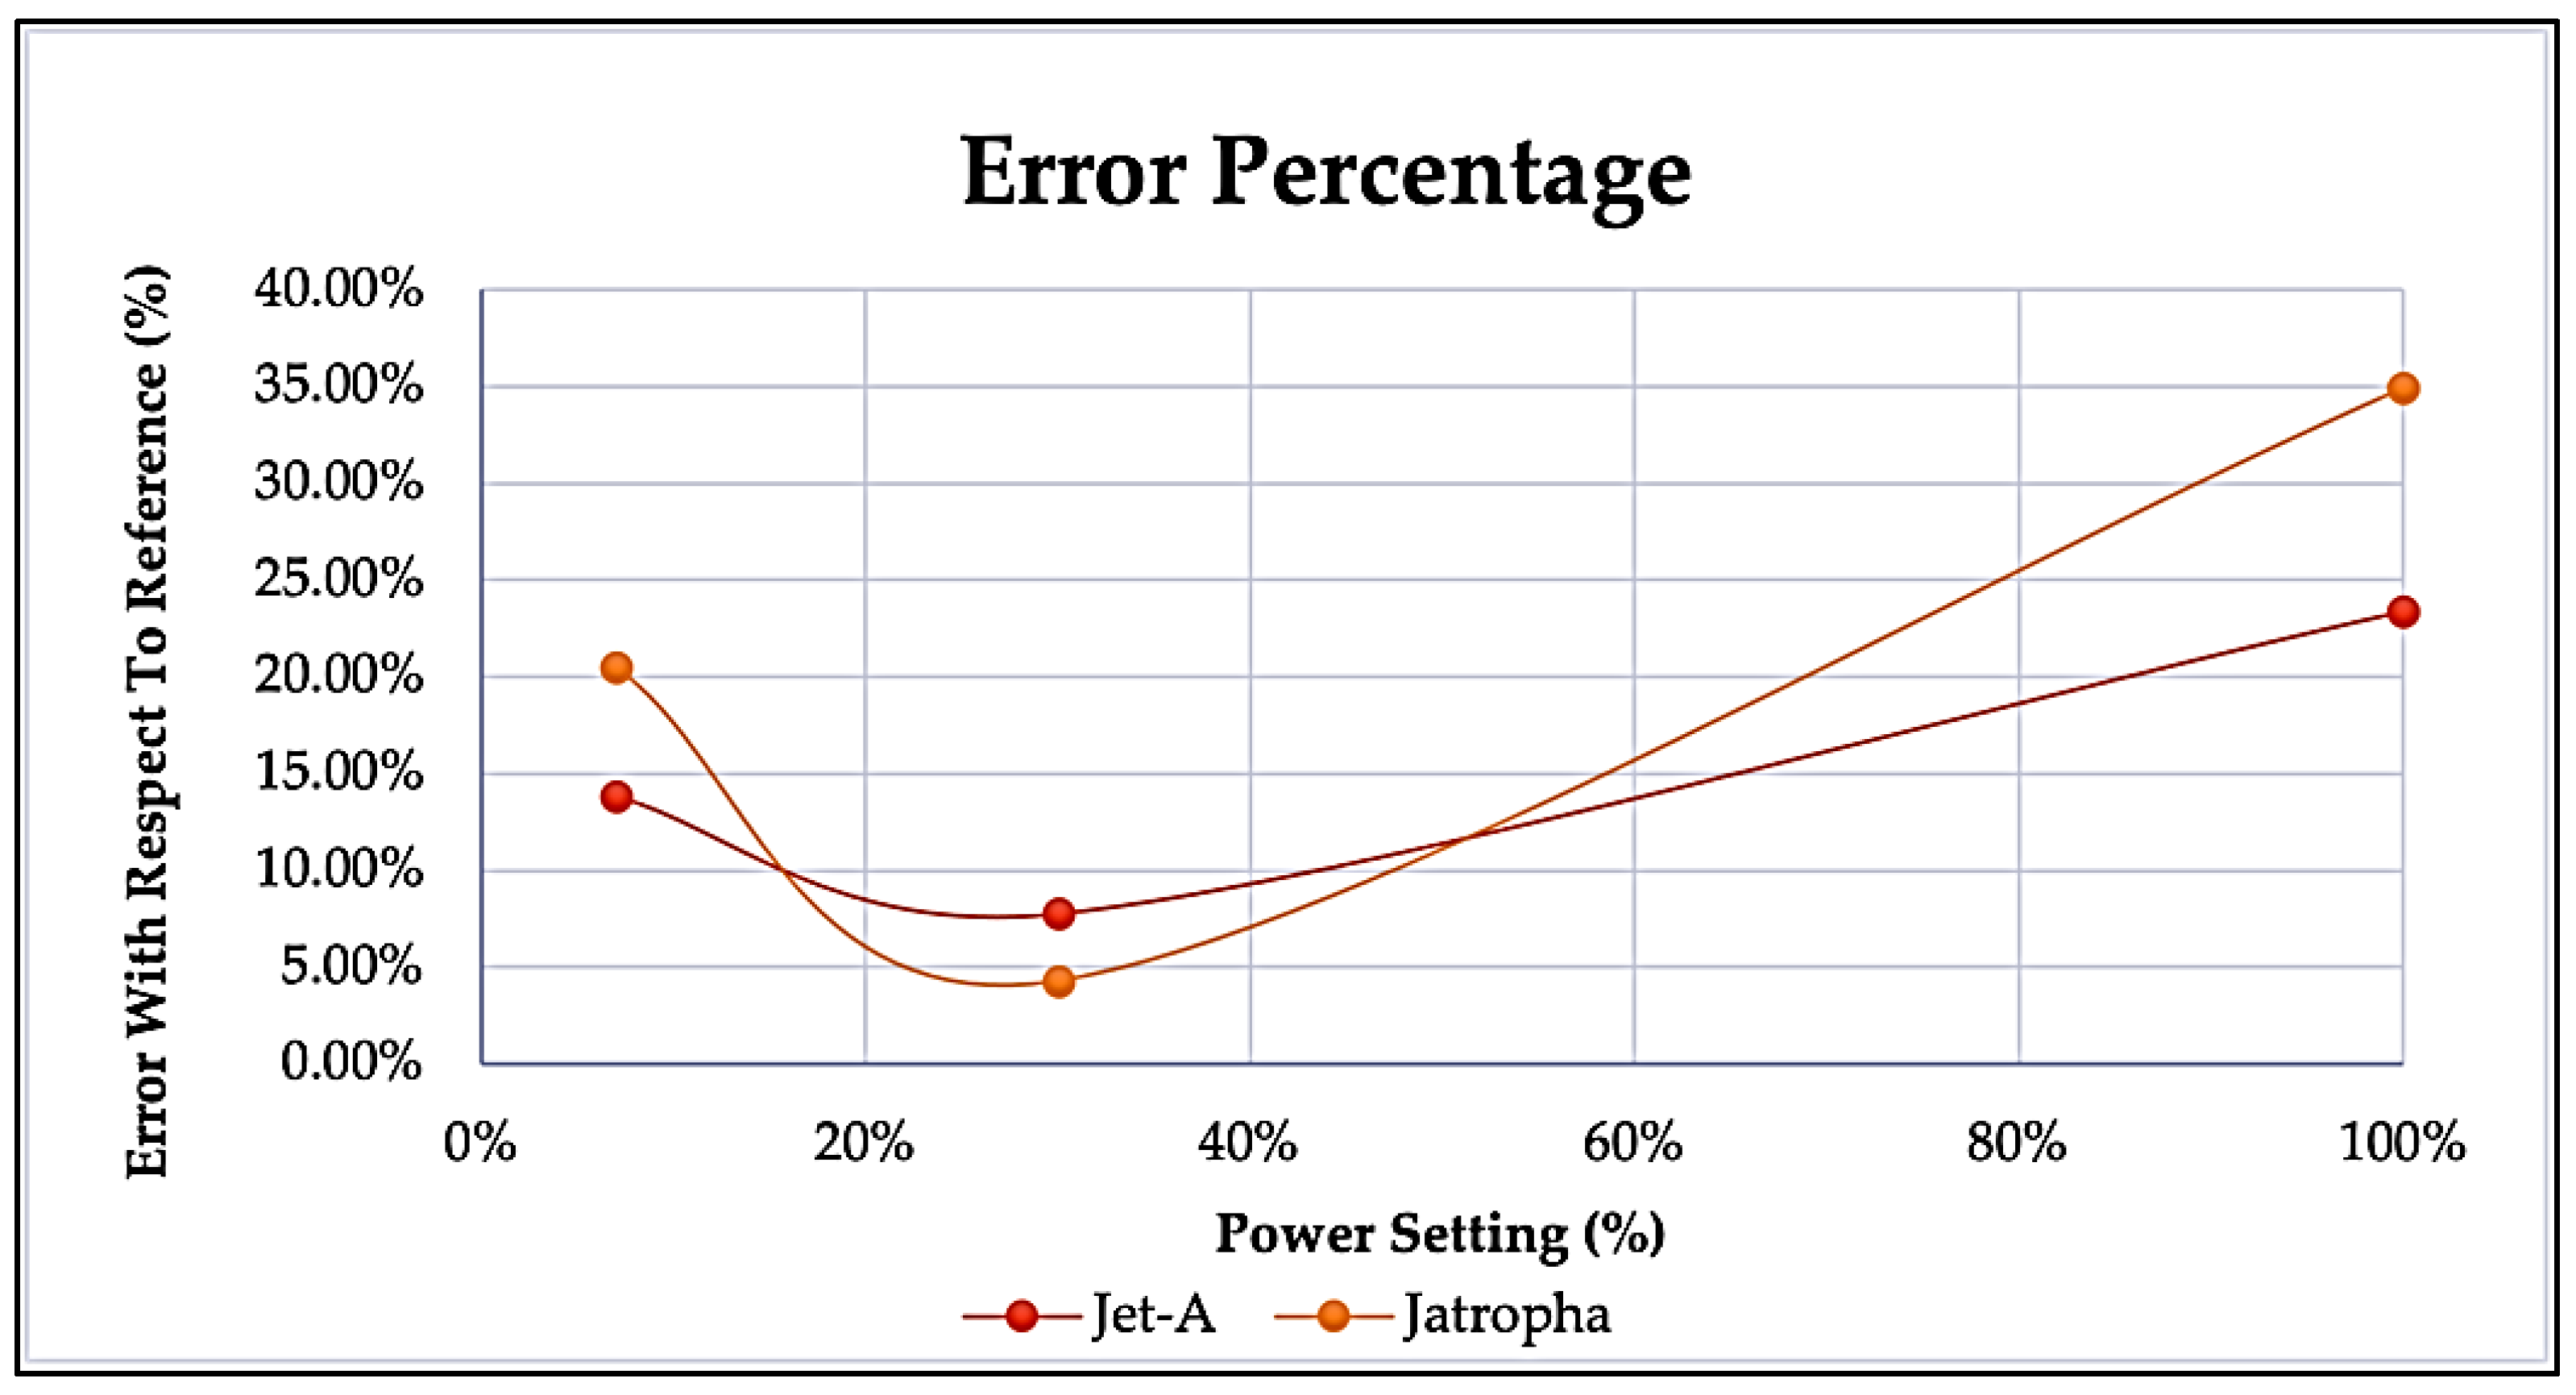
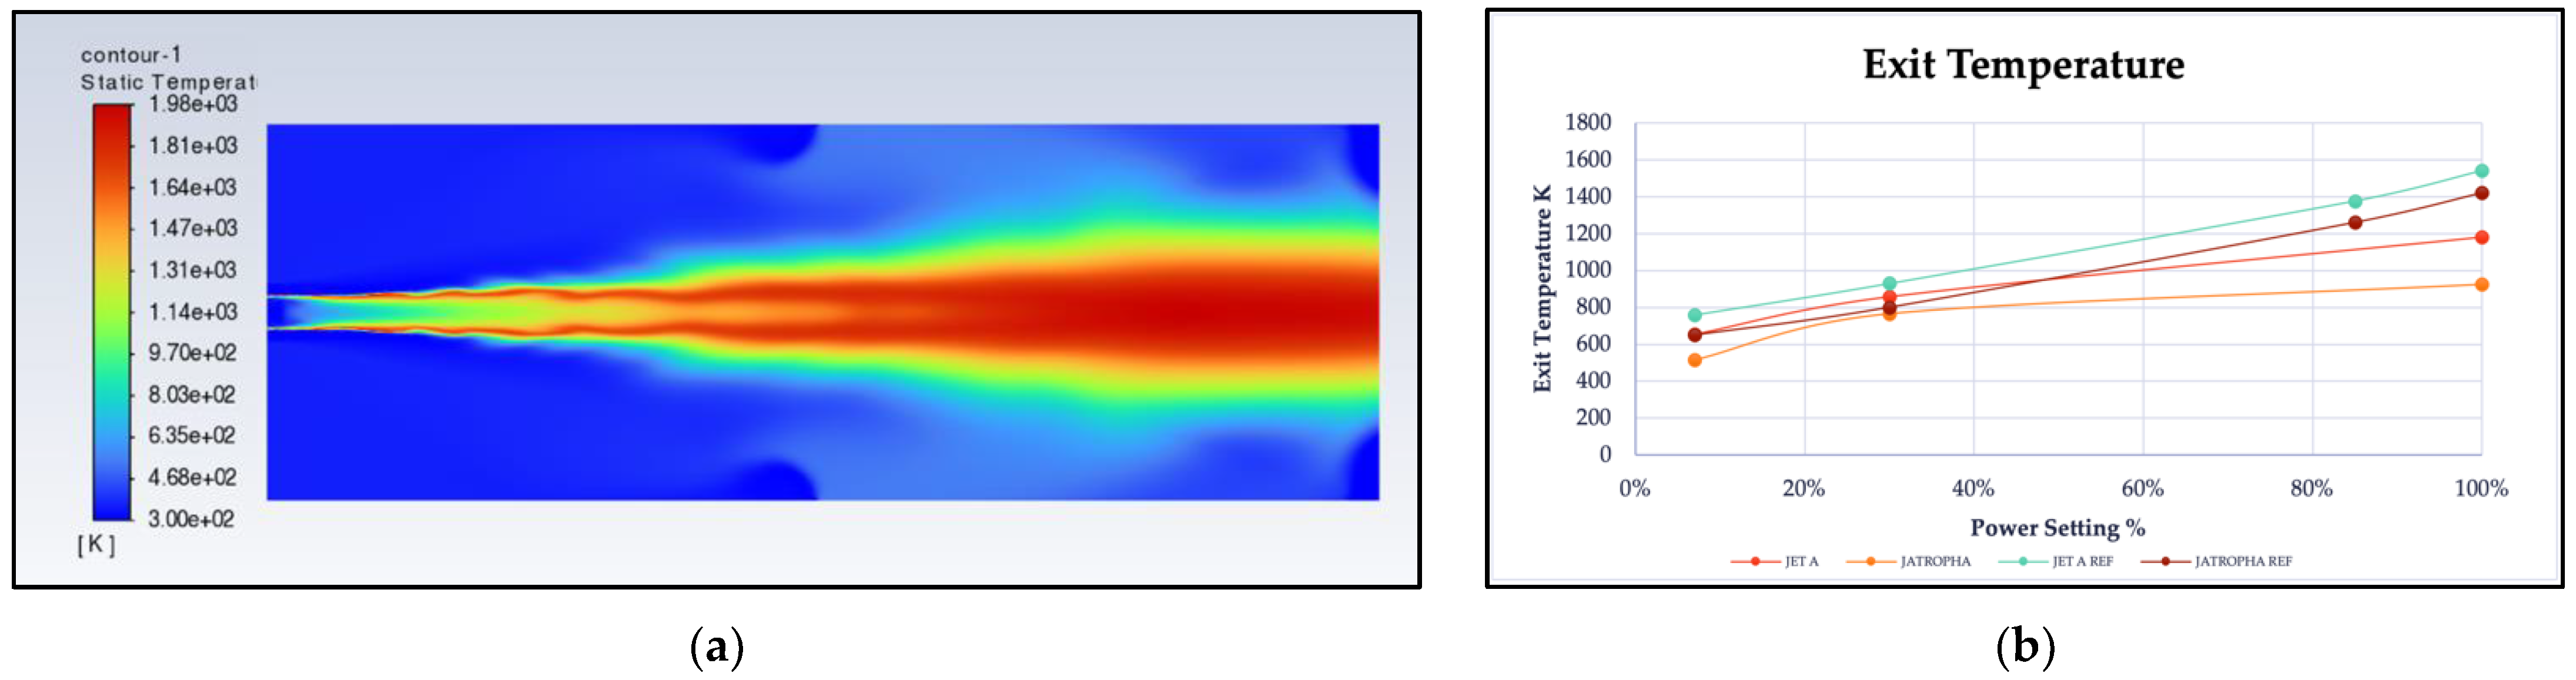
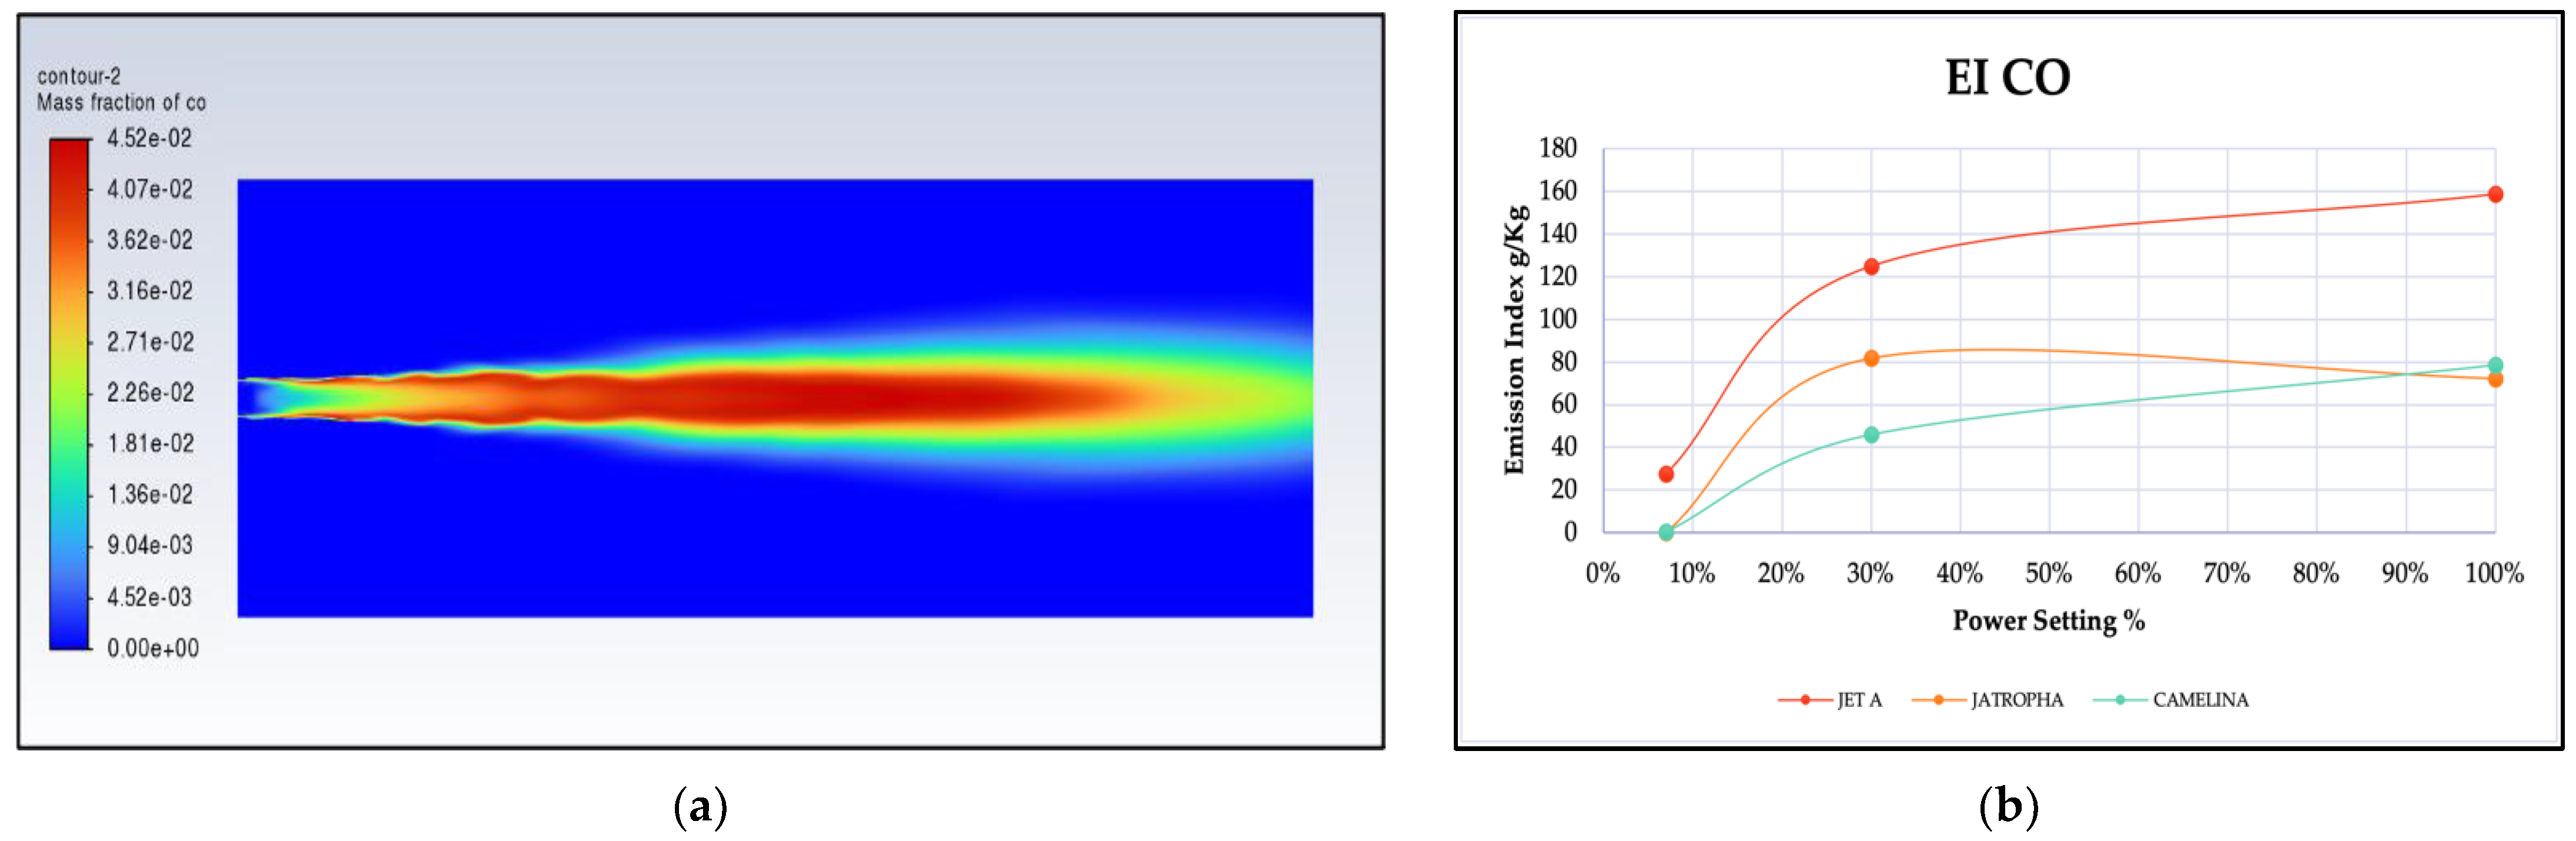
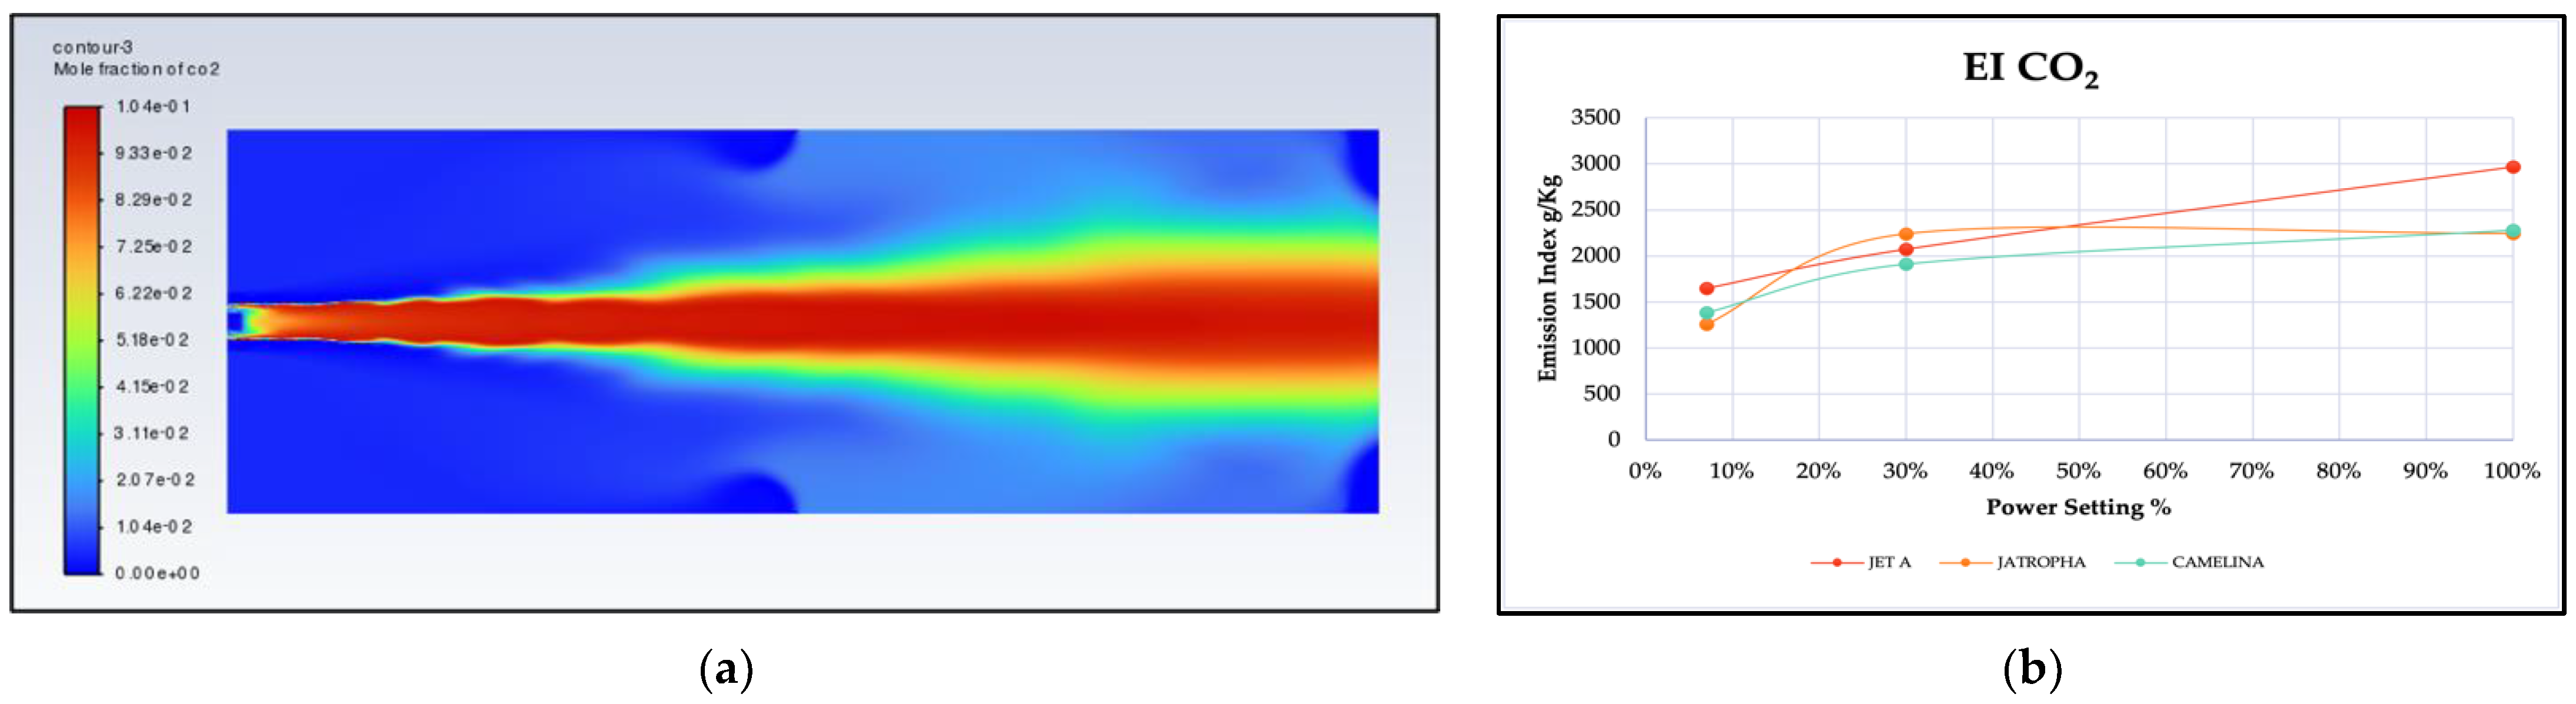
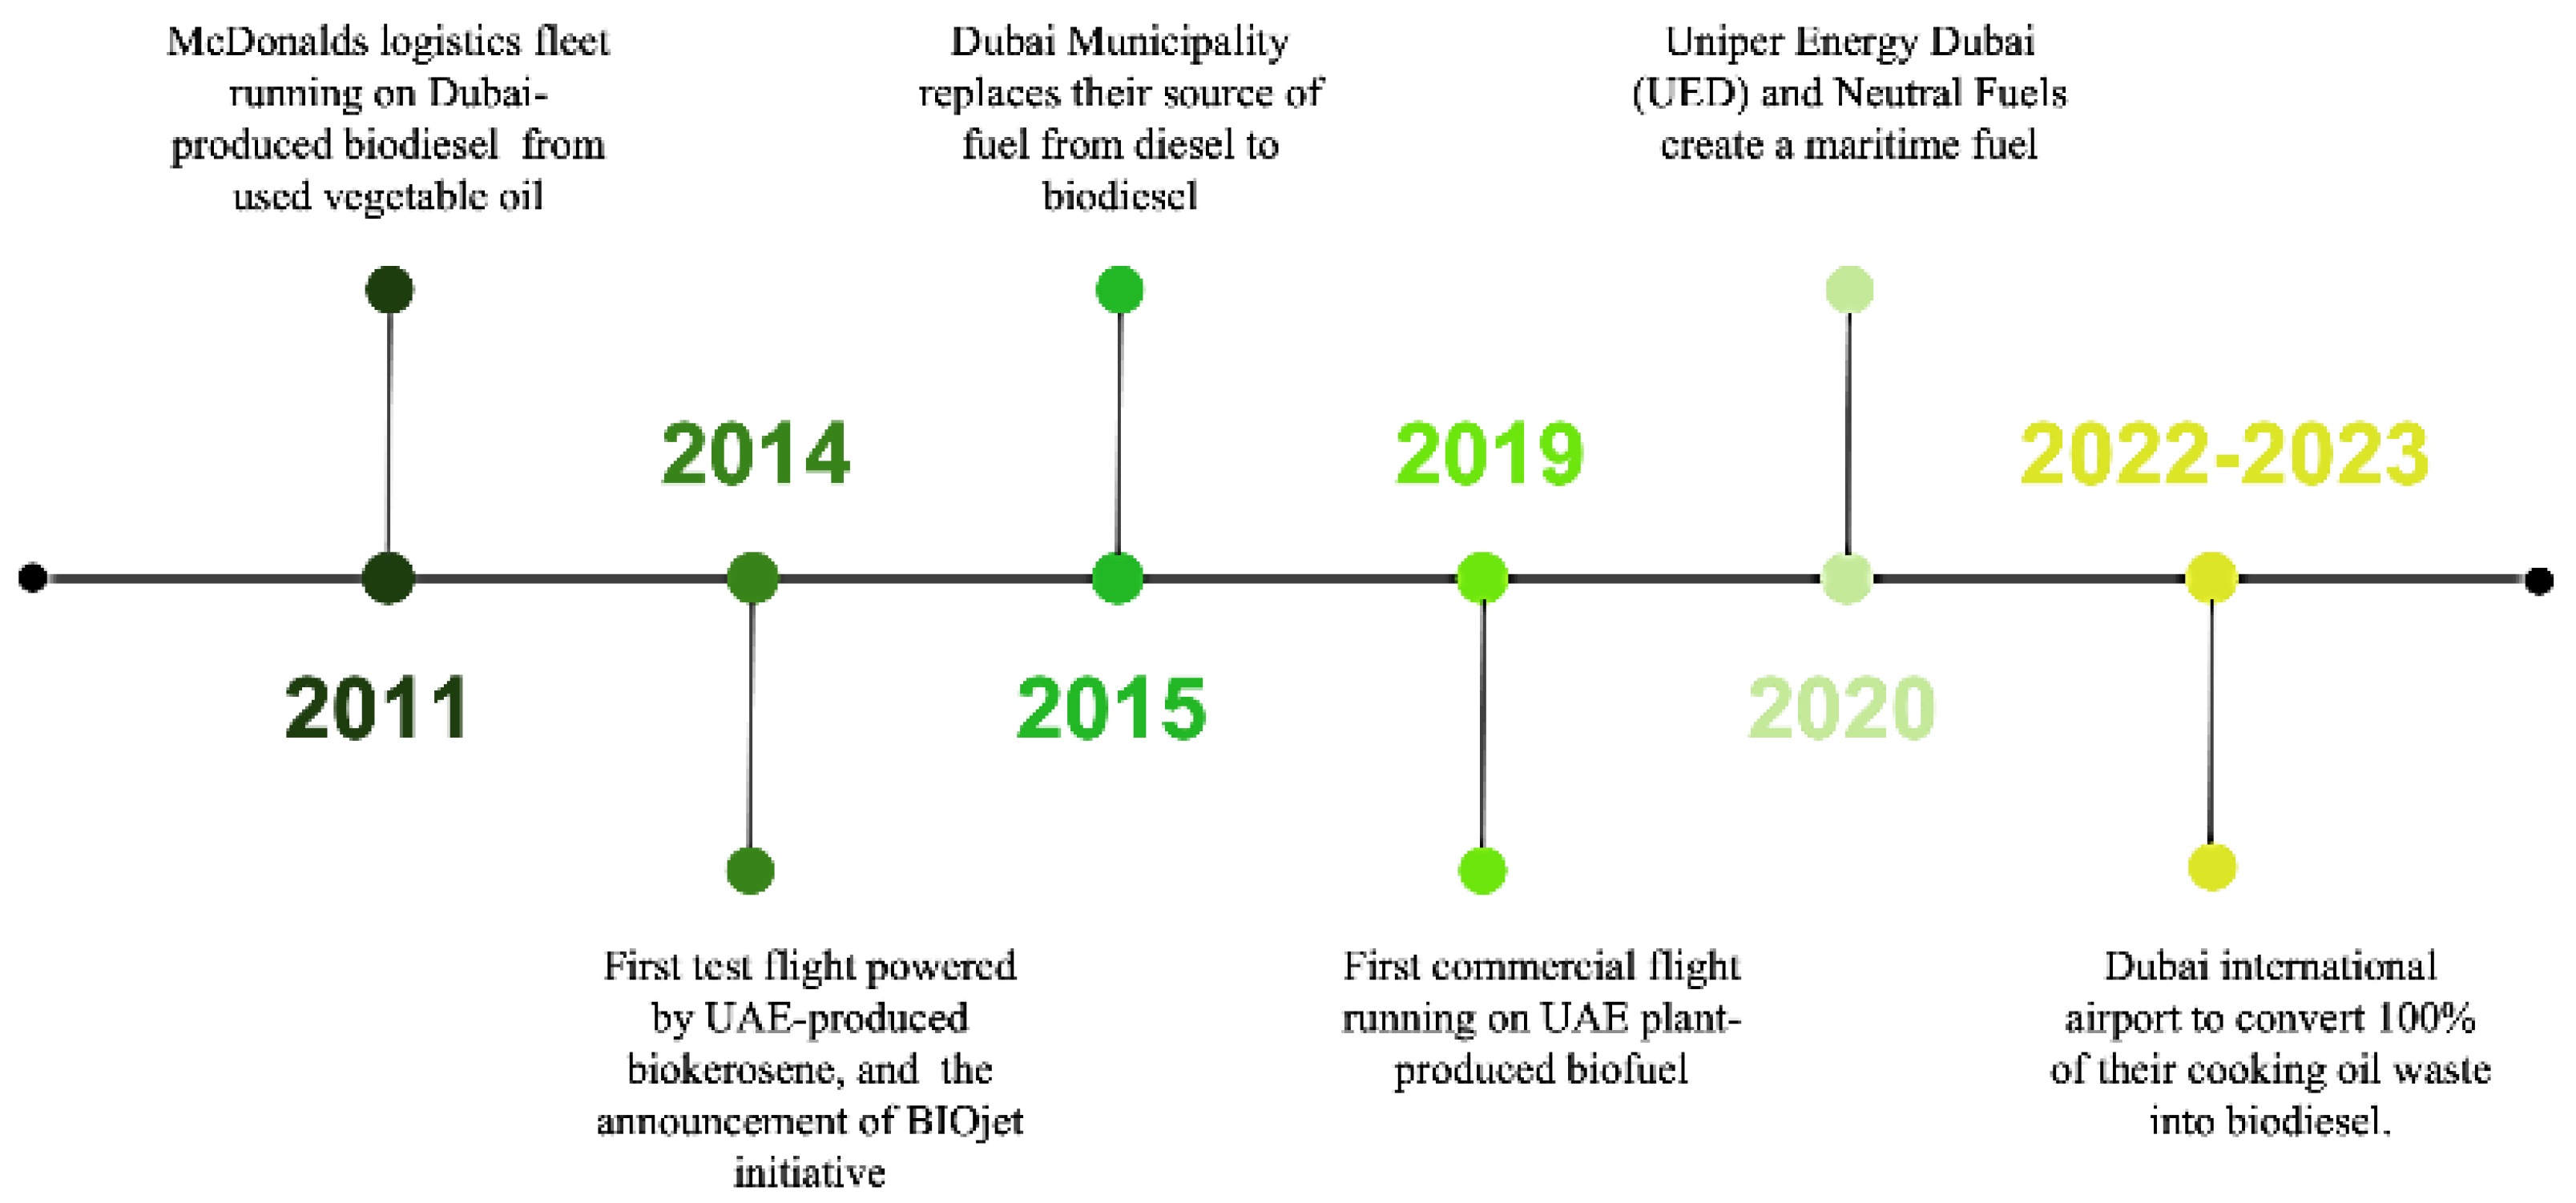
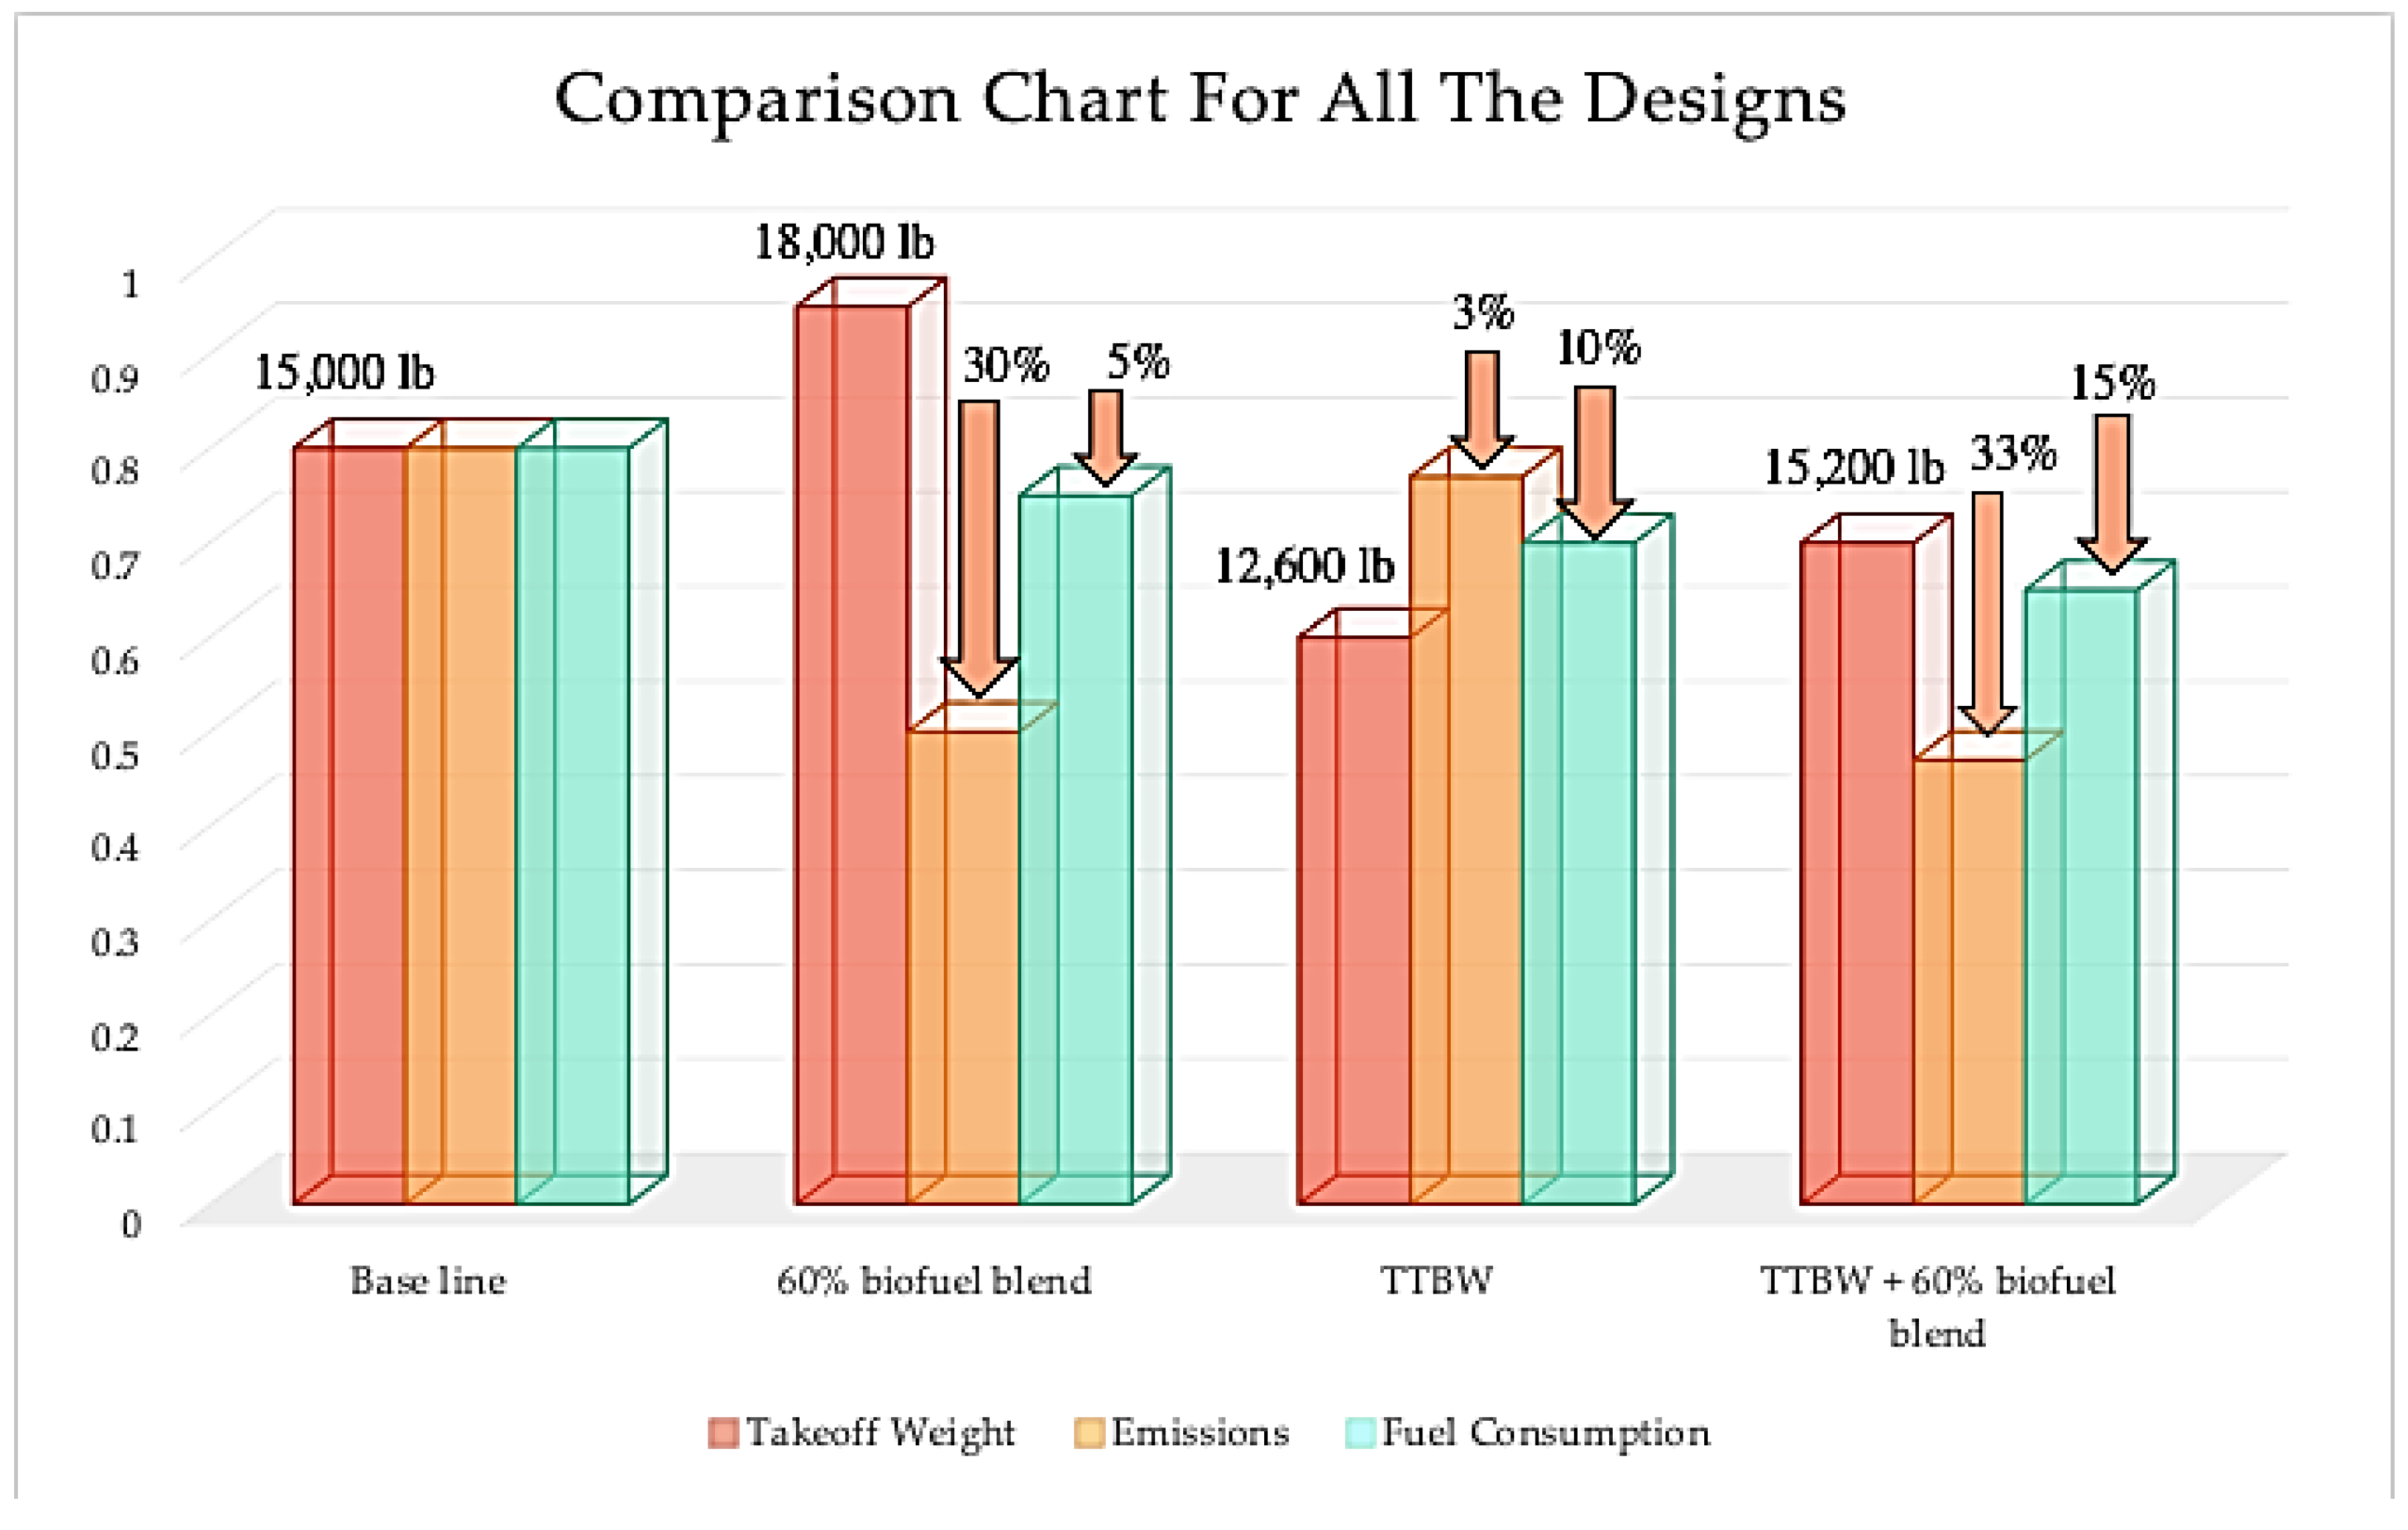
Table 1.
The final designs’ configuration options to be analyzed using the PUGH method.
| Design Option | Wing | Engine Placement and Number | Tail | Landing Gear |
|---|---|---|---|---|
| 60% Biofuel | Cantilever conventional wing | 2 Rear fuselage | T-tail | Retractable tricycle |
| TTBW_1 + Jet Fuel | TTBW_1 | 2 Under the wing | Cruciform | Retractable tricycle |
| TTBW_2 + Jet Fuel | TTBW_2 | 2 Under the wing | V-tail | Retractable tricycle |
| TTBW_1 + 60% Biofuel | TTBW_1 | 2 Under the wing | T-tail | Retractable tricycle |
| BWB + Jet Fuel | Blended wing | 2 toward the trailing edge of the fuselage | No tail | Retractable tricycle |
Table 2.
Final configuration using PUGH weighting.
| Criteria | Weighting | 60% Biofuel | TTBW_1 + Jet Fuel | TTBW_2 + Jet Fuel | TTBW_1 + 60% Biofuel | BWB + Jet Fuel |
|---|---|---|---|---|---|---|
| Wing configuration | 30% | 66.35 | 76.25 | 80.1 | 79.35 | 37.45 |
| Tail configuration | 5% | 76 | 74 | 71.5 | 76 | 0 |
| Engine | 15% | 71 | 82 | 77.5 | 81 | 71 |
| Engine number | 5% | 80 | 82.25 | 86.25 | 88.75 | 82.75 |
| Environmental impact and fuel | 40% | 66.75 | 67.5 | 70 | 82.75 | 70.5 |
| Aerodynamic performance | 5% | 71 | 71.5 | 81.5 | 77.5 | 83.5 |
| Total | 100% | 68.6 | 73.56 | 75.61 | 81.16 | 58.4 |
Table 3.
Operating pressures and oxidizer temperatures [38].
Table 3.
Operating pressures and oxidizer temperatures [38].
| Power | 7% | 30% | 85% | 100% |
|---|---|---|---|---|
| Operating Pressure (pa) | 101,325 | 655,804 | 1,981,730 | 2,343,346 |
| Oxidizer temperature (K) | 311.15 | 418.82 | 674.25 | 743.91 |
Table 4.
Fuel properties.
| Fuel | Jet-A [38] | Jatropha [38] | Camelina [67,68,69] |
|---|---|---|---|
| Stoichiometric Air-to-Fuel Ratio | 14.7 | 13.3 | 12.5 |
| Stoichiometric Fuel-to-Air Ratio | 0.0680 | 0.0751 | 0.0799 |
| Fuel Flammability | 0.0748 | 0.08261 | 0.0879 |
| Flash point (K) | 312 | 445 | 317.6 |
| Lower Heating Value (MJ/kg) | 43.1 | 39.5 | 39.26 |
| Fuel | Jatropha | Camelina |
|---|---|---|
| C16:0 | 16.2 | 5 |
| C18:0 | 8.2 | 2.2 |
| C18:1 | 38.4 | 17.7 |
| C18:2 | 36.8 | 18 |
| C18:3 | 0.4 | 37.9 |
| C20:0 | - | 1.4 |
| C20:1 | - | 9.8 |
| C20:2 | - | 1.6 |
| C20:3 | - | 1 |
| C22:0 | - | 0.4 |
| C22:1 | - | 4.5 |
| C24:0 | - | 0.3 |
| C24:1 | - | 0.2 |
Table 6.
Boundary conditions [38].
Table 6.
Boundary conditions [38].
| Fuel | Power % | 7% | 30% | 85% | 100% |
|---|---|---|---|---|---|
| Jet-A | primary | 0.96045 | 2.07676 | 3.3363 | 3.4765 |
| secondary | 1.88955 | 4.08573 | 6.5637 | 6.8327 | |
| total | 2.85 | 6.1625 | 9.9 | 10.3092 | |
| 0.0285 | 0.0725 | 0.198 | 0.2365 | ||
| Air-to-Fuel Ratio | 100 | 85 | 50 | 43.6 | |
| Jatropha | primary | 0.5973325 | 2.17557 | 3.62595 | 3.71899 |
| secondary | 1.1751675 | 4.2801291 | 7.1335 | 7.3166 | |
| total | 1.7725 | 6.4557 | 10.7595 | 11.0356 | |
| 0.0177 | 0.0759 | 0.2152 | 0.2532 | ||
| Air-to-Fuel Ratio | 100 | 85 | 50 | 43.6 | |
| Camelina | primary | 0.6007 | 2.1888 | 3.648 | 3.7427 |
| secondary | 1.18 | 4.306 | 7.177 | 7.3626 | |
| total | 1.7825 | 6.495 | 10.825 | 11.105 | |
| 0.0178 | 0.0764 | 0.2165 | 0.2547 | ||
| Air-to-Fuel Ratio | 100 | 85 | 50 | 43.6 |
Table 7.
The four selected design results.
| Baseline Conventional Business Jet | Conventional Business Jet with 60% Camelina Biofuel | TTBW_1T Business Jet with Conventional Fuel | TTB_1T Business Jet with 60% Camelina Biofuel | |
|---|---|---|---|---|
| Gross Take-Off Weight (WTO) | 15,000 lb | 18,000 lb | 12,600 lb | 15,200 lb |
| Wing Loading (W/S) | 75 psf | 75 psf | 87 psf | 87 psf |
| Thrust-to-Weight Ratio (T/W) | 0.48 | 0.48 | 0.55 | 0.55 |
Table 8.
Biofuel comparison—the best available options which can be achieved in the UAE.
| Fuel | Advantages | Disadvantages |
|---|---|---|
| Jet-A fuel [75] | ● Low melting point ● Proven effectiveness ● Well-established market ● Relatively cheaper | ● Non-renewable energy source ● Source of greenhouse gases ● High carbon emission |
| Camelina biofuel [76,77,78,79] | ● Renewable energy source ● Easy production ● No threat to the food supply ● Competitive calorific power | ● Expensive ● Extensive extraction process ● No well-established market |
| Jatropha biofuel [79,80] | ● Renewable energy source ● Can be grown in harsh conditions ● Low production cost ● No threat to the food supply | ● Lower yield through extraction ● High viscosity ● High density |
Table 9.
Effects of the biofuel price on the fuel expenses for the business jet operating cost and ticket price for the consumers.
Table 9.
Effects of the biofuel price on the fuel expenses for the business jet operating cost and ticket price for the consumers.
| Fuel Blends | Fuel Cost (USD/nm) | Ticket Price /Pax (USD) | Fuel Price /Pax (USD) | Price Increase /Pax (USD) | Price Increase /Pax (AED) |
|---|---|---|---|---|---|
| 40% BIO + 60% JET | 0.554 | 19,530.38 | 2929.55 | 179.60 | 659.69 |
| 50% BIO + 50% JET | 0.567 | 19,829.60 | 2974.44 | 224.49 | 824.57 |
| 60% BIO + 40% JET | 0.580 | 20,133.50 | 3020.02 | 270.07 | 991.99 |
| 70% BIO + 30% JET | 0.593 | 20,428.01 | 3064.20 | 314.25 | 1154.27 |
| 100% BIO | 0.631 | 21,333.53 | 3200.03 | 450.08 | 1653.18 |
Disclaimer/Publisher’s Note: The statements, opinions and data contained in all publications are solely those of the individual author(s) and contributor(s) and not of MDPI and/or the editor(s). MDPI and/or the editor(s) disclaim responsibility for any injury to people or property resulting from any ideas, methods, instructions or products referred to in the content. |
© 2023 by the authors. Licensee MDPI, Basel, Switzerland. This article is an open access article distributed under the terms and conditions of the Creative Commons Attribution (CC BY) license (https://creativecommons.org/licenses/by/4.0/).
Share and Cite
MDPI and ACS Style
Aldarrai, H.; Alsuwaidi, D.; Khan, B.; Xu, H.; Tolouei, E. Numerical Investigation of Bio-Aviation Fuel: Dubai’s Future Perspective. Aerospace 2023, 10, 338. https://doi.org/10.3390/aerospace10040338
AMA Style
Aldarrai H, Alsuwaidi D, Khan B, Xu H, Tolouei E. Numerical Investigation of Bio-Aviation Fuel: Dubai’s Future Perspective. Aerospace. 2023; 10(4):338. https://doi.org/10.3390/aerospace10040338
Chicago/Turabian StyleAldarrai, Houreya, Dhabya Alsuwaidi, Beenish Khan, Haoyang Xu, and Elham Tolouei. 2023. "Numerical Investigation of Bio-Aviation Fuel: Dubai’s Future Perspective" Aerospace 10, no. 4: 338. https://doi.org/10.3390/aerospace10040338
Note that from the first issue of 2016, this journal uses article numbers instead of page numbers. See further details here.