Article

Design and Preliminary Performance Assessment of a PHM System for Electromechanical Flight Control Actuators

Politecnico di Torino, Department of Mechanical and Aerospace Engineering, 10129 Torino, Italy
*
Author to whom correspondence should be addressed.
Aerospace 2023, 10(4), 335; https://doi.org/10.3390/aerospace10040335
Submission received: 27 February 2023 / Revised: 23 March 2023 / Accepted: 24 March 2023 / Published: 28 March 2023

Abstract

:
The evolution toward “more electric” aircraft has seen a decisive push in the last decade due to growing environmental concerns and the development of new market segments (flying taxis). Such a push has involved both the propulsion components and the aircraft systems, with the latter seeing a progressive trend in replacing traditional solutions based on hydraulic power with electrical or electromechanical devices. Flight Control Systems (FCSs) are one of the aircraft systems affected the most since the adoption of Electromechanical Actuators (EMAs) would provide several advantages over traditional electrohydraulic or mechanical solutions, but their application is still limited due to their sensitivity to certain single points of failure that can lead to mechanical jams. The development of an effective and reliable Prognostics and Health Management (PHM) system for EMAs could help in mitigating the risk of a sudden critical failure by properly recognizing and tracking the ongoing fault and anticipating its evolution, thus boosting the acceptance of EMAs as the primary flight-control actuators in commercial aircraft. The paper is focused on the results of the preliminary activities performed within the CleanSky 2/Astib research program, dedicated to the definition of the iron bird of a new regional-transport aircraft able to provide some prognostic capabilities and act as a technological demonstrator for new PHM strategies for EMAs employed in-flight control systems. The paper is organized as follows. At first, a proper introduction to the research program is provided, along with a brief description of the employed approach. Hence the simulation models adopted for the study are presented and used to build synthetic databases to inform the definition of the PHM algorithm. The prognostic framework is then presented, and a preliminary assessment of its expected performance is discussed.

1. Introduction

Prognostics and Health Management (PHM) is a relatively new, multidisciplinary research field aimed at the definition of routines capable of predicting the time of failure (ToF) of a defective system or component based upon a set number of signals (or “features”) extracted from the system itself. The capability to anticipate the failure occurrence and to estimate the remaining useful life (RUL) of a system or a component would provide a set number of valuable advantages. If completely realized, it would provide important strategic information pertaining to the opportunity to perform maintenance operations, the available time window to successfully replace the faulty component, and eventually to provide advice or an automatic reconfiguration of the defective system to compensate for the effects of the degradation or to extend the RUL [1]. Although application-agnostic in nature, PHM is of particular interest for aerospace applications, where the occurrence of unanticipated failures causes the disruption of aircraft availability, which is a costly and potentially dangerous situation in both commercial and military aviation. As such, the benefits of PHM are not limited to the optimization of the maintenance policy and a reduction of its costs but have significant ramifications over the maintenance logistics (e.g., spare parts, personnel, and dedicated facilities), business choices (spare aircraft number) and eventually strategic decisions (finish the mission or return to base). In this context, onboard actuation systems are one of the most critical aircraft systems and one of the major causes of disruption of aircraft availability. The vast majority of currently in-service aircraft are equipped with electrohydraulic or electrohydrostatic actuators. However, the growing push toward the design of “more-electric” aircraft has encouraged several research activities aimed at the design and certification of electromechanical solutions. Compared with hydraulic technology, Electromechanical Actuators (EMAs) completely avoid the environmental and cost issues associated with the use of aggressive hydraulic fluid, provide significant advantages in terms of reliability and system layout design, and offer a combination of weights competitive with the hydraulic counterpart, especially for low power requirements. Despite these advantages, EMAs are seldom used in flight-control systems and are mostly limited to UAVs or nonsafety critical controls due to their susceptibility to single points of failure, which can cause potentially catastrophic events like the jamming of the aerodynamic surface. Although these issues must be solved by design or through changes in the flight control architecture, the definition of a reliable PHM system would potentially help mitigate the probability of jamming, thus pushing the adoption of EMA technology. Although the literature on the definition of health monitoring schemes for electromechanical actuators and their most important components is fairly extensive [2,3,4,5], little can be found on the subject of the implementation and performance of such PHM logics on a real operating platform. There are two main reasons for this: first, the number of flying aircraft equipped with electromechanical actuation systems is still extremely low; and second, it is often impossible to gain access to and record the signals generated by the EMA sensors due to hardware constraints and data propriety restrictions. The lack of in-flight data represents a significant stopgap toward the definition of the PHM algorithm for flight-control systems since it becomes more difficult to fully represent the features uncertainty due to the widely varying operating conditions (temperature, loads, command pattern). To overcome these issues and reproduce as closely as possible the scenario in which the flight controls usually operate, researchers have resorted to highly complex simulation environments [6] and challenging experimental procedures, such as the in-flight test bench [7]. The aim of the ASTIB project (Development of Advanced Systems Technologies and hardware/software for the flight simulator and iron bird demonstrators for regional aircraft) is to bridge the gap between preliminary analysis and full-scale implementation through the design and realization of a technological demonstrator, or iron bird, for a new regional aircraft with fully electrical flight controls and PHM functionalities [8]. In the literature, very few iron birds have been presented, mainly aimed at studying electrohydraulic solutions. Li et al. [9] presented the development of an iron bird for an already in-service regional jet aircraft aimed at validating its troubleshooting plans, making some design improvements, and understanding the root of certain observed failures on the hydraulic nose landing gear system. A similar approach was followed by Spangenberg et al. [10], which developed a hardware-in-the-loop iron bird to perform certification tests during the early stage of aircraft design without constructing prototypes, focusing on electrohydraulic actuators for primary flight-control surfaces. Blasi et al. [11] analysed the control architecture of a modular iron bird oriented to the test of small/medium UAV’s electromechanical actuators subjected to realistic in-flight load conditions obtained by a real-time flight simulator. In [12], an iron bird of an F-18 research aircraft was constructed to execute in-flight tests to perform system integration tests, verification, validation, and failure mode analyses for electromechanical aileron actuators. The novelty of the iron bird presented in this paper resides in its implementation: in fact, it has a hybrid layout in which a half-wing is composed of real equipment, while the other half is completely simulated with a hardware-in-the-loop scheme. Furthermore, it not only represents a commercial technological demonstrator but also embraces innovative research goals, being the first iron bird also aimed at the definition of PHM algorithms. This paper deals with the activities pertaining to the development of such PHM systems and their implementation within the iron bird structure and is organized as follows. First, the research objectives, perimeter, and workflow are detailed, framing the research activities and highlighting the expected goals and known limitations of the proposed work. Then, the simulation activities necessary for the definition of the PHM framework are detailed and justified. Such activities include the definition of a high-fidelity dynamic model of the system under analysis needed to study the effects of the most common failure modes on the actuators signals and a real-time declination of such models to quickly generate data. The PHM system is then introduced and tested against several synthetic datasets to provide a preliminary assessment of its expected performances.

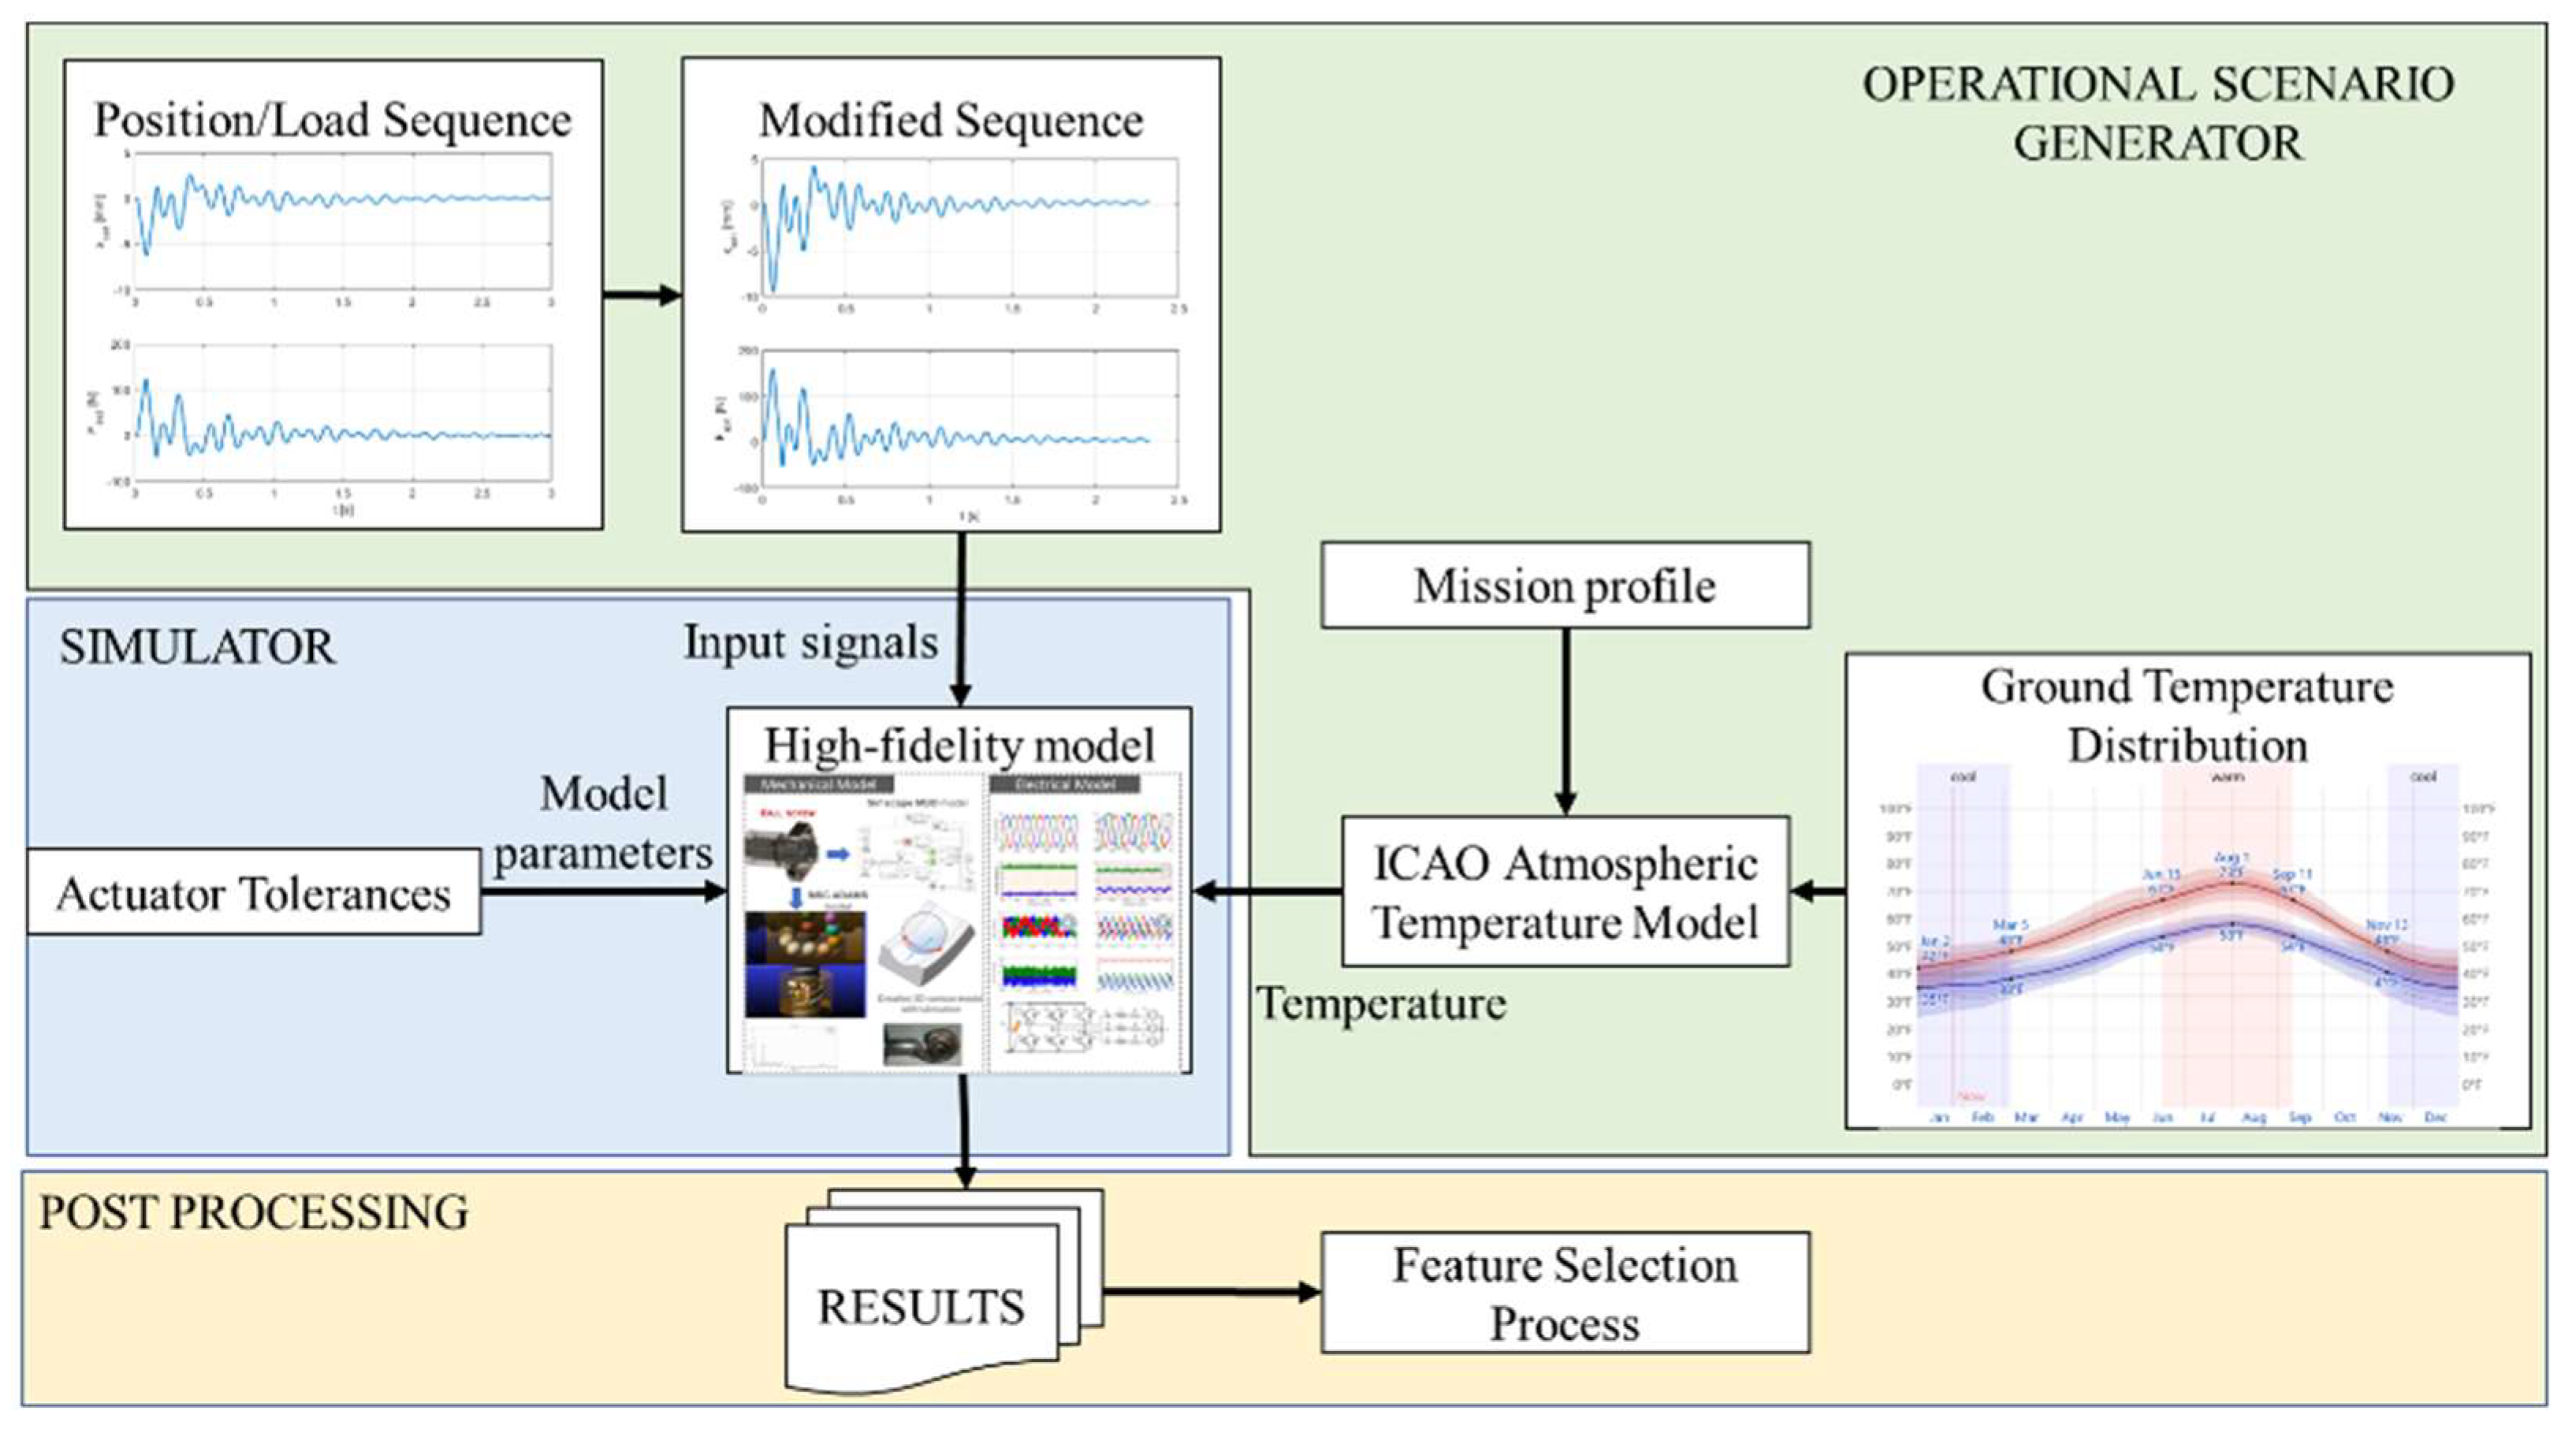
2. Research Workflow

The main objective of the “CleanSky2/Astib” consortium was the definition of an iron bird for a regional transport aircraft with fully electrical flight-control systems acting as a technological demonstrator for several new technologies, including PHM functionalities monitoring the health status of the flight-control actuators.
The iron bird followed the scheme provided in Figure 1 [8] and was roughly divided into 2 major sections, namely a “real” half-wing and a “simulated” half-wing. The electromechanical actuators developed during the program were seated within the “real” half-wing and coupled with a set of electrohydraulic actuators controlled in force. The “simulated” half-wing was instead realized through a real-time representation of the very same actuators present in the “real” half-wing (Actuators Simulation Module), while an Engineering Test Station allowed changing the parameters of the simulation and introducing faults or failures within the “simulated” actuators. Both the “real” and the “simulated” half-wings interacted with the Flight Control Computers (FCC), which received input from a real cockpit. A real-time simulation of the aircraft dynamics (Flight Mechanics Simulation Module) dialogued with the FCCs and computed the vehicle attitude considering the behavior of the flight-control system, of the simulated throttle, and of the simulated atmospheric conditions [13]. The choice to divide the FCS into “real” and “simulated” halves resided in the need to simulate the effects that ongoing faults or degradation may have at the component, system, and aircraft level without damaging the iron bird and while reducing the need for spare equipment. The Health Management System Module (HMSM) finally collected the data coming from both the “real” and the “simulated” actuators and ran the PHM routines. The PHM routines were developed following the scheme provided in Figure 2. The case study was first analyzed, assessing which were the constraints (only component-level signals available, system-level signals, and so forth), which were the sensors that could be employed to monitor the health status of the actuators, and which were the most critical failure modes. This information drove the definition of a first high-fidelity model of the system. Such a model was built to represent the component dynamics in detail and was exploited to assess which signals could be useful for PHM, and which features could be reasonably extracted to perform diagnostics/prognostics tasks with the help of an experimental setup [14]. In parallel, a streamlined version of the high-fidelity model, capable of representing the effects of ongoing degradations over the system dynamics and suitable for real-time deployment, was prepared. The goal of such a model was twofold. On the one hand, it was prepared to be deployed within the Actuators Simulation Module (“simulated” half-wing) of the iron bird. On the other hand, it could be used offline to quickly produce the datasets required to test the PHM routines before their installation on the iron bird, thus allowing the code to be debugged off-site and providing a preliminary performance assessment prior to the iron bird commissioning.

3. Preliminary Activities and Simulation Environment

Prior to the definition of the PHM system, a number of preliminary activities were performed to better assess the perimeter of the research program, define the architecture and the type of the simulation models to be employed (e.g., physics-based, black-box, surrogate), and how to translate such simulation models to make them suitable for deployment in the real-time environment of the iron bird. This section is intended as a summary of such preliminary activities, highlighting the most significant considerations for each passage and referring to the literature for additional details.

3.1. Approach and Design Goals

Before presenting the case study and proceeding to the description of the simulation models prepared for the project, it is necessary to detail the scope, objective, and limitations of the research activities. The main research goals pursued with the definition of the PHM system was to provide a proof of concept of a prognostic framework, demonstrating its feasibility within the constraints of a civil aviation application in terms of signals management and computational constraints, while assessing the maturity level of the algorithms available in the literature. As such, it is underlined that the objective of the research activities was not to provide a high-TRL solution, such as a PHM framework ready to be deployed in the operational scenario. In particular, the experimental activities supporting the definition of the high-fidelity models and the real-time models did not involve the study of real actuators under degraded health conditions. Such constraints could be justified considering that the actuators mounted on the iron bird were prototypes produced in very limited numbers, meaning that no spare actuators could be brought to failure during the experimental activities. Faulty conditions were studied through simulations only, through the degradation models available in the literature. It is worth mentioning that even if mutual interaction between different degradations is potentially available, in the context of the present work, only 1 fault at a time was considered for the definition of the PHM framework. Although the results obtained through this approach are expected to be realistic, it is worth noting that the complete validation of the PHM system falls outside the perimeter of the project.

3.2. Case Study and FMECA Analysis

The flight-control system considered for analysis is based on a set of new direct-drive Electromechanical Actuators (EMA) responsible for the movement of a few secondary flight-control surfaces (active winglet and wingtip). As depicted in Figure 3, each actuator was driven by a Brushless-AC (BLAC) electric motor and controlled through 3 nested control loops, each monitoring the motor currents, its angular frequency, and the actuator linear position. A ball screw integral with the motor shaft was used to transform the rotary motion imposed by the BLAC into the sliding motion of the end user. Spherical joints connected the actuator to the aerodynamic surface on 1 end and to the airframe on the other. Each actuator came with a number of sensors used for control purposes; phase currents were measured, while a resolver was mounted on the motor shaft to monitor its position, dictate the phases commutation, and infer the angular speed. An LVDT was instead integral with the ball screw and used to precisely measure the position of the end-user, providing this information to the associated control loop. Phase voltages were also acquired. Such signals were then considered available for the development of the PHM system and the basis on which to evaluate the possible features and health indexes.
Once the available sensors were identified, guidelines provided in [1,15] suggested that an FMECA analysis tailored for PHM be performed, with the objective of assessing which failure modes needed to be prioritized when designing the PHM system. The most significant failure modes for each component were studied and their causes, symptoms, and failure effects were detailed, while a composite score was computed based on the fault’s frequency of occurrence, the severity of effects, expected observability, and replaceability of the component. The results were hence ranked, and a priority list was derived, stating which failure modes were more interesting or more probably observable by a Health Monitoring framework. Such operations are described in more detail in [16] and allowed to select the following failure modes. For the electrical motor, 2 failure modes were selected: the occurrence of turn-to-turn shorts in the motor windings and the degradation of the motor’s permanent magnets [17,18]. The reasoning behind this choice is that the first was the most probable failure mode involving short circuits [16], while the second was critical from a severity perspective since it involved the loss of the actuator damping capability, which prevented flutter in the case of a sudden loss of power. Two additional failure modes pertaining to the motor were addressed for fault detection only, due to their causes and dynamics: the occurrence of static eccentricity in the Brushless-AC motor and the occurrence of MOSFET Base-Drive Open circuit conditions within 1 leg of the inverter supplying the actuator. The first is related to mistakes during the assembly and is tracked to avoid the triggering of a false alarm on the “real” half-wing of the iron bird, while the second is often indicated as one of the most probable failure modes involving PWM-driven inverters [19,20]. Switching the attention to the mechanical drive, 3 failure modes were assessed as preferential. The first was the effect of lubricant degradation, and the consequent efficiency losses within the ball screw [21]. The other 2 were the occurrence of backlash due to wear within the mechanical transmission and within the spherical rod end connecting the actuator to the aerodynamic surface. The lubricant degradation was chosen since it was expected to be a frequent and inevitable occurrence over prolonged usage, while the progressive increase of backlash was selected due to its expected frequency of occurrence and severity of the possible effects, especially when considering the rod end [22]. All of the selected failure modes were expected to be observable or detectable.
The turn-to-turn short failure mode is covered in the literature [3,16], and several studies are available on the topic of magnet degradation and its detection [18,23]. Similar considerations can be taken for the selected failure mode for the MOSFET [20], the occurrence of static eccentricity [24], and the issues associated with lubricant degradation and backlash opening [25,26].

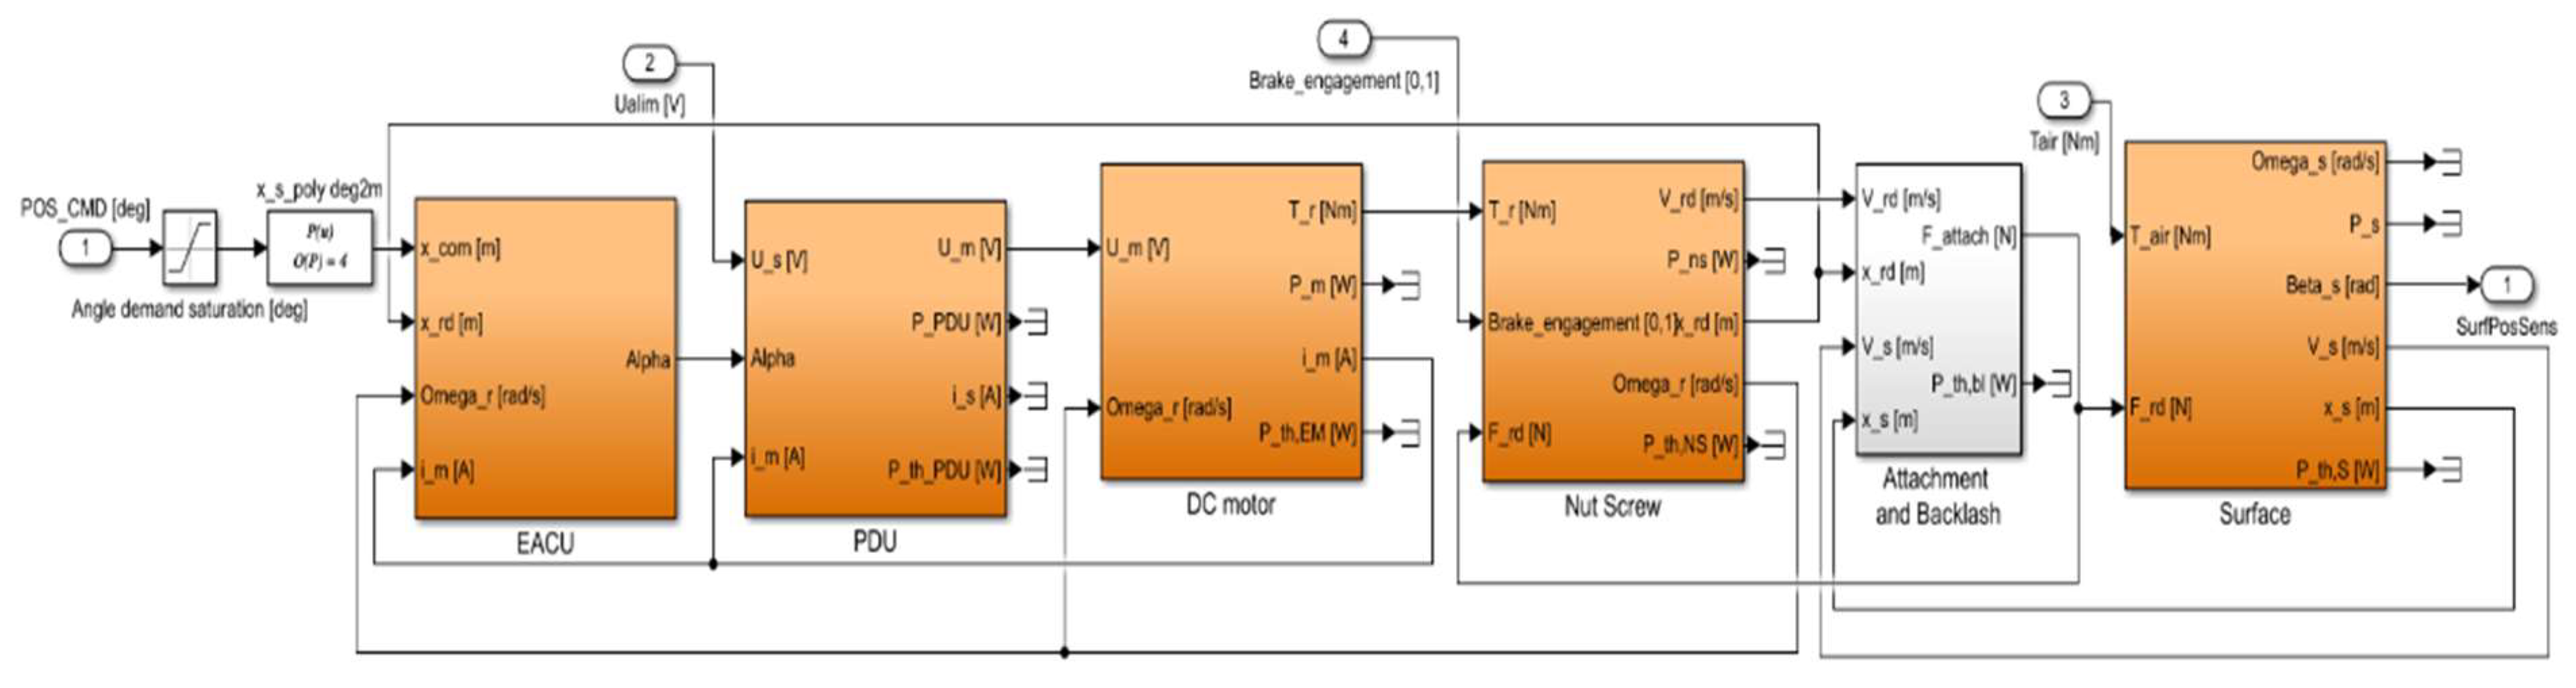
3.3. High-Fidelity Modeling

As previously stated, the creation of highly detailed mathematical models was paramount to studying the effect and evolution of selected failure modes on the different components of the electromechanical actuator without involving the real actuators’ damage. The high-fidelity models are expected to represent the real behavior of each component under investigation under both nominal and degraded conditions. In such a way, the model assumed the role of a virtual test bench on which to inject artificial flaws to study their effects on the available measurable signals.
The mathematical models were created following a complete white box approach, where the dynamics of every phenomenon were derived and dictated by physical laws and equations.

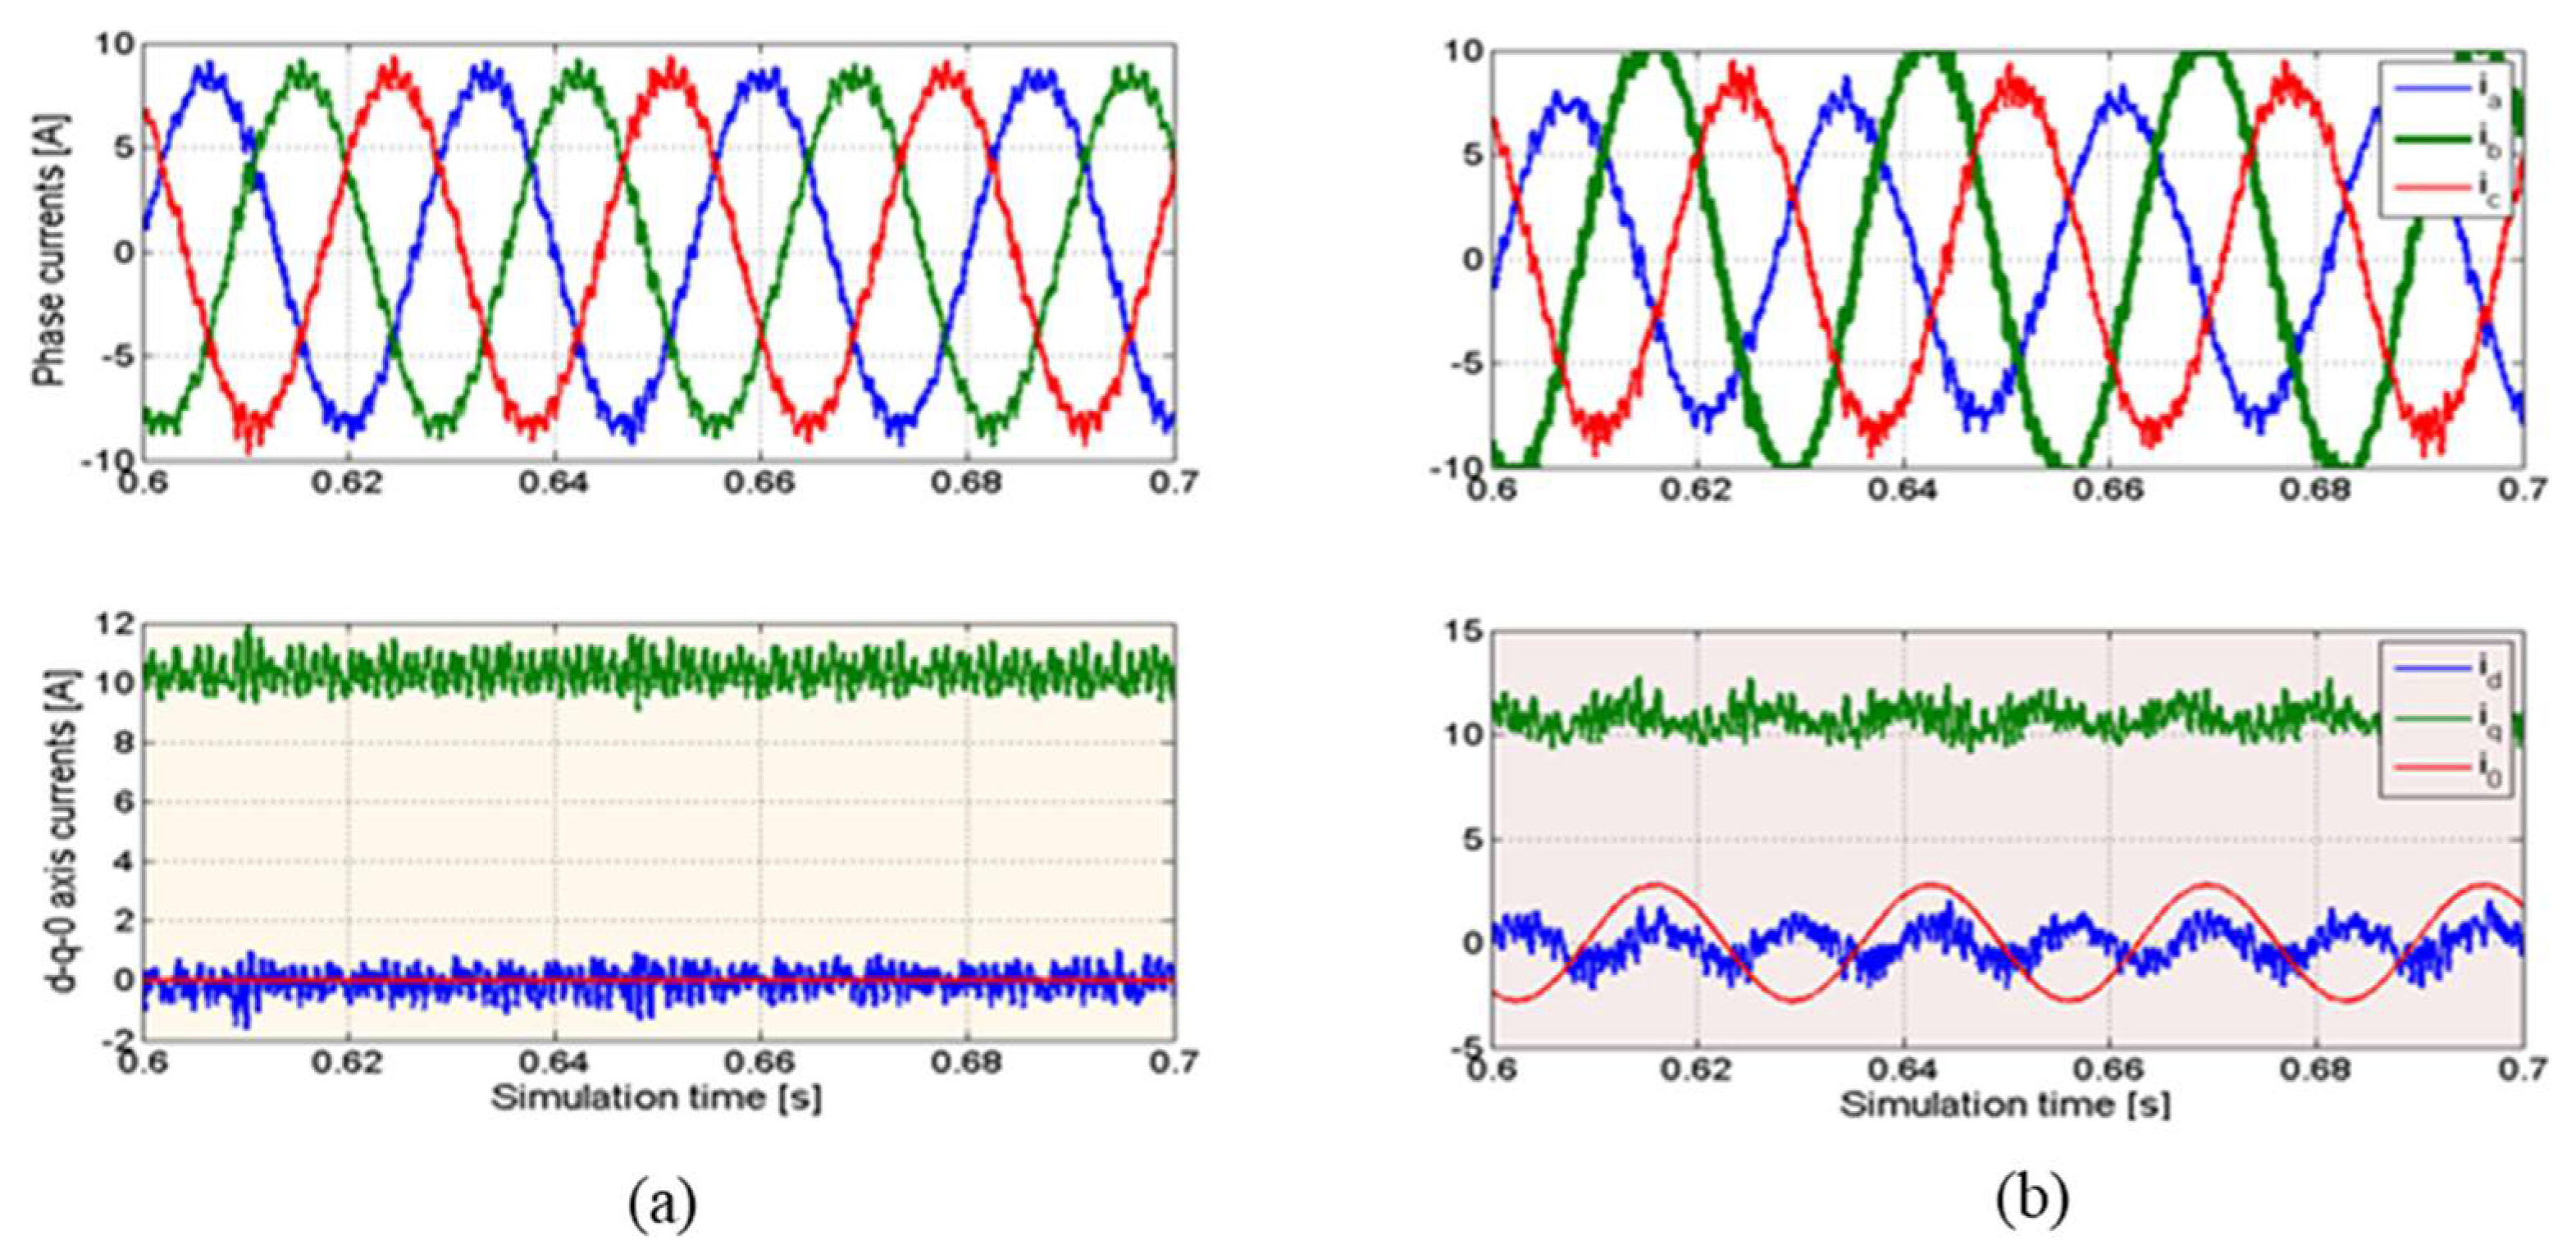
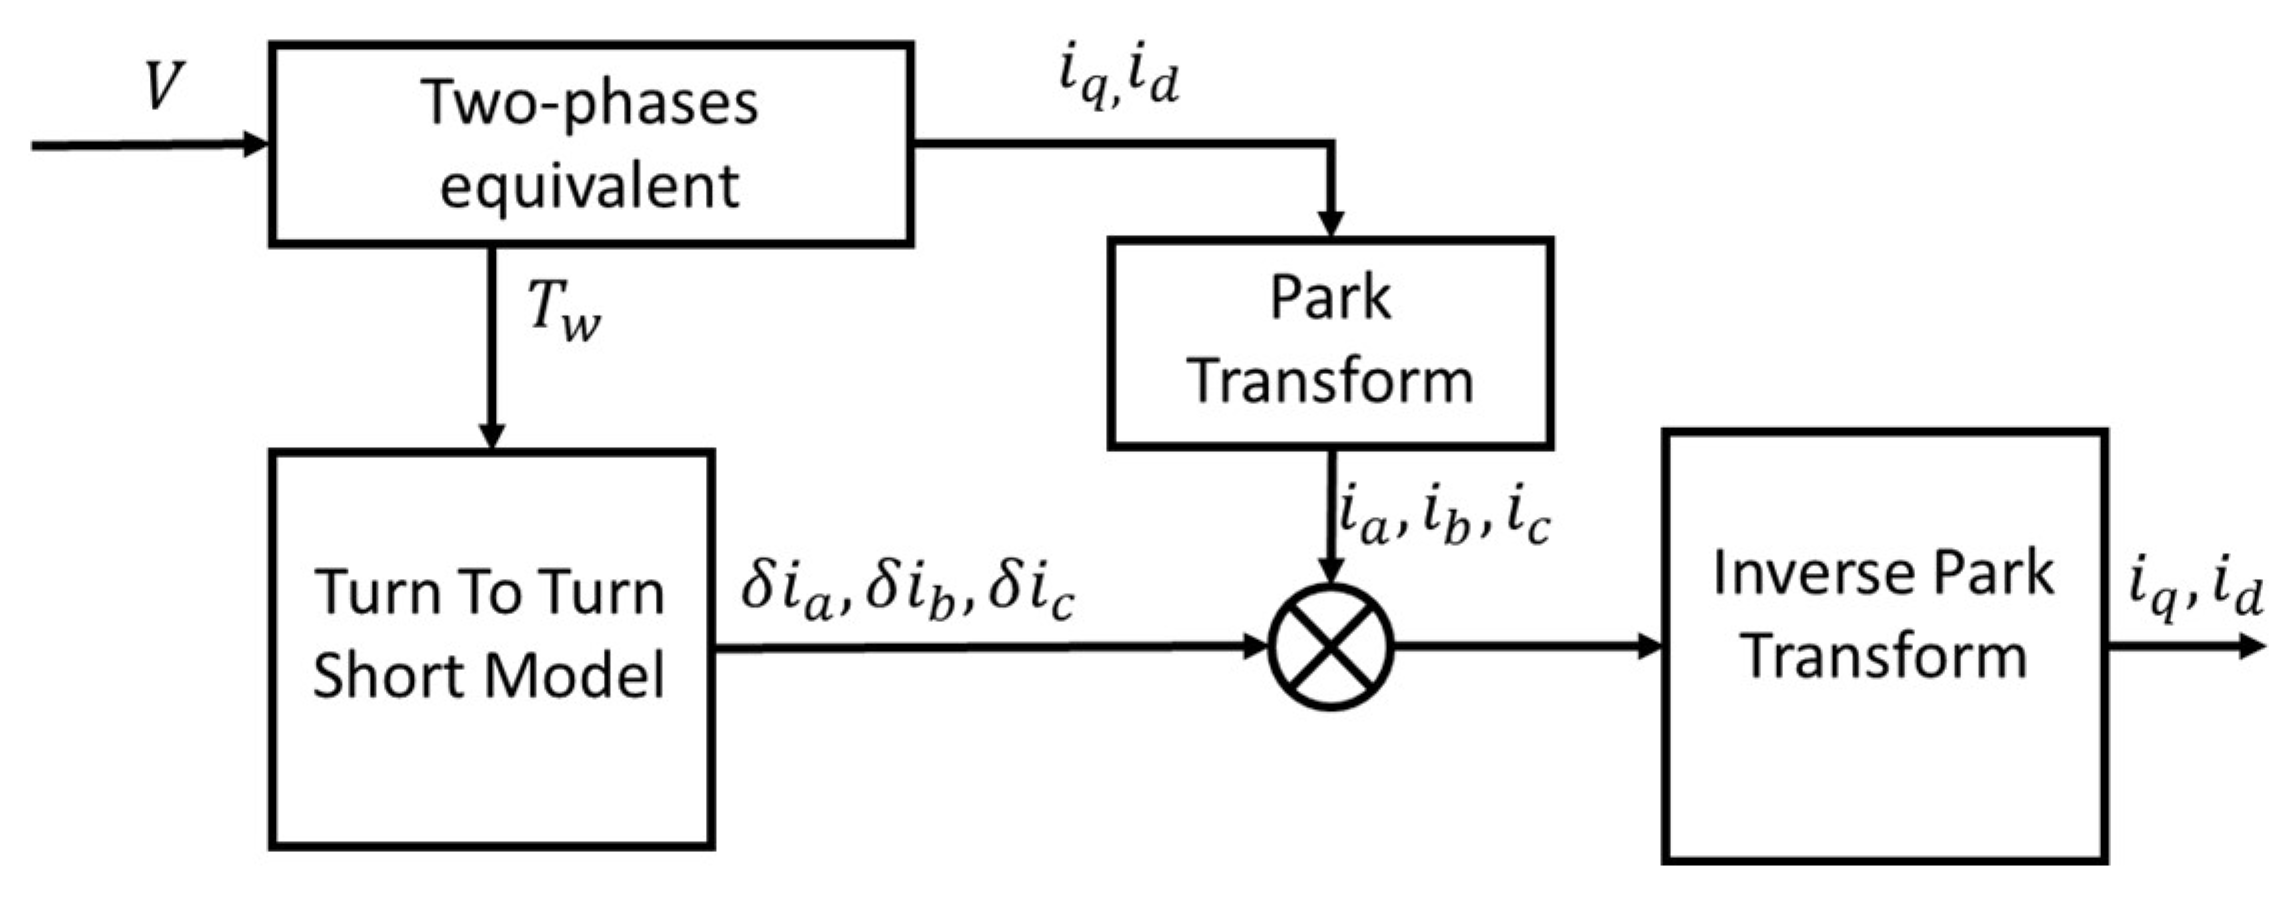
3.3.1. Electric Drive

The dynamic model of the electric drive was made of 3 main subsystems: the Electronic Control Unit (ECU), the Electronic Power Unit (EPU), and the brushless electric model. The model of the Electronic Power Unit made use of a functional description of the PWM-modulated inverter. It received the commands from the ECU, which was responsible for the motor current control in the d-q-0 axis and modulated the electric power exchanged with the motor. The d-q axis control featured PI regulators receiving as input the current command and the filtered current feedback subject to Park’s transformation. The output of the controllers was then transformed back to the 3-phase system and used inside a PWM modulator based on a triangular bipolar wave carrier that generated the digital control signal for each of the 3 commutation poles, thus modulating the DC-link tension and generating the 3 motor phase voltages as per [27]. The motor model was derived from that adopted in [16]. As depicted in Figure 4, it was based on the representation of the 3-phase dynamics through a lumped parameters representation, where each electrical parameter is a variable as a function of the windings’ temperature, itself computed at each time step as a function of the thermal power generated through the Joule effect and commutation losses and the external temperature according to a simplified first-dynamic order model of the motor’s thermal dynamics. The introduction of faults within the model was achieved according to the literature models. In particular, the occurrence of a turn-to-turn short was described according to [2], where the fault process caused the progressive decrease of 1 phase resistance, auto-inductance, and mutual inductance.
Such a failure mode was mainly caused by the progressive degradation of the insulating material separating the coils from each other. Such a degradation process was mainly driven by thermal issues and was modeled according to a modified Arrhenius Law as proposed by [28]. As evidenced in Figure 5, its occurrence caused asymmetric behavior between the 3-phase currents and increased a common node current which is not present under nominal health conditions. Similar considerations can be performed for the other considered failure modes. The progressive degradation of the motor permanent magnets was simulated by progressively reducing its magnetic flux term, while the occurrence of eccentricity was represented by changing the flux term according to the expected gap size variation as a function of the rotor angular position.

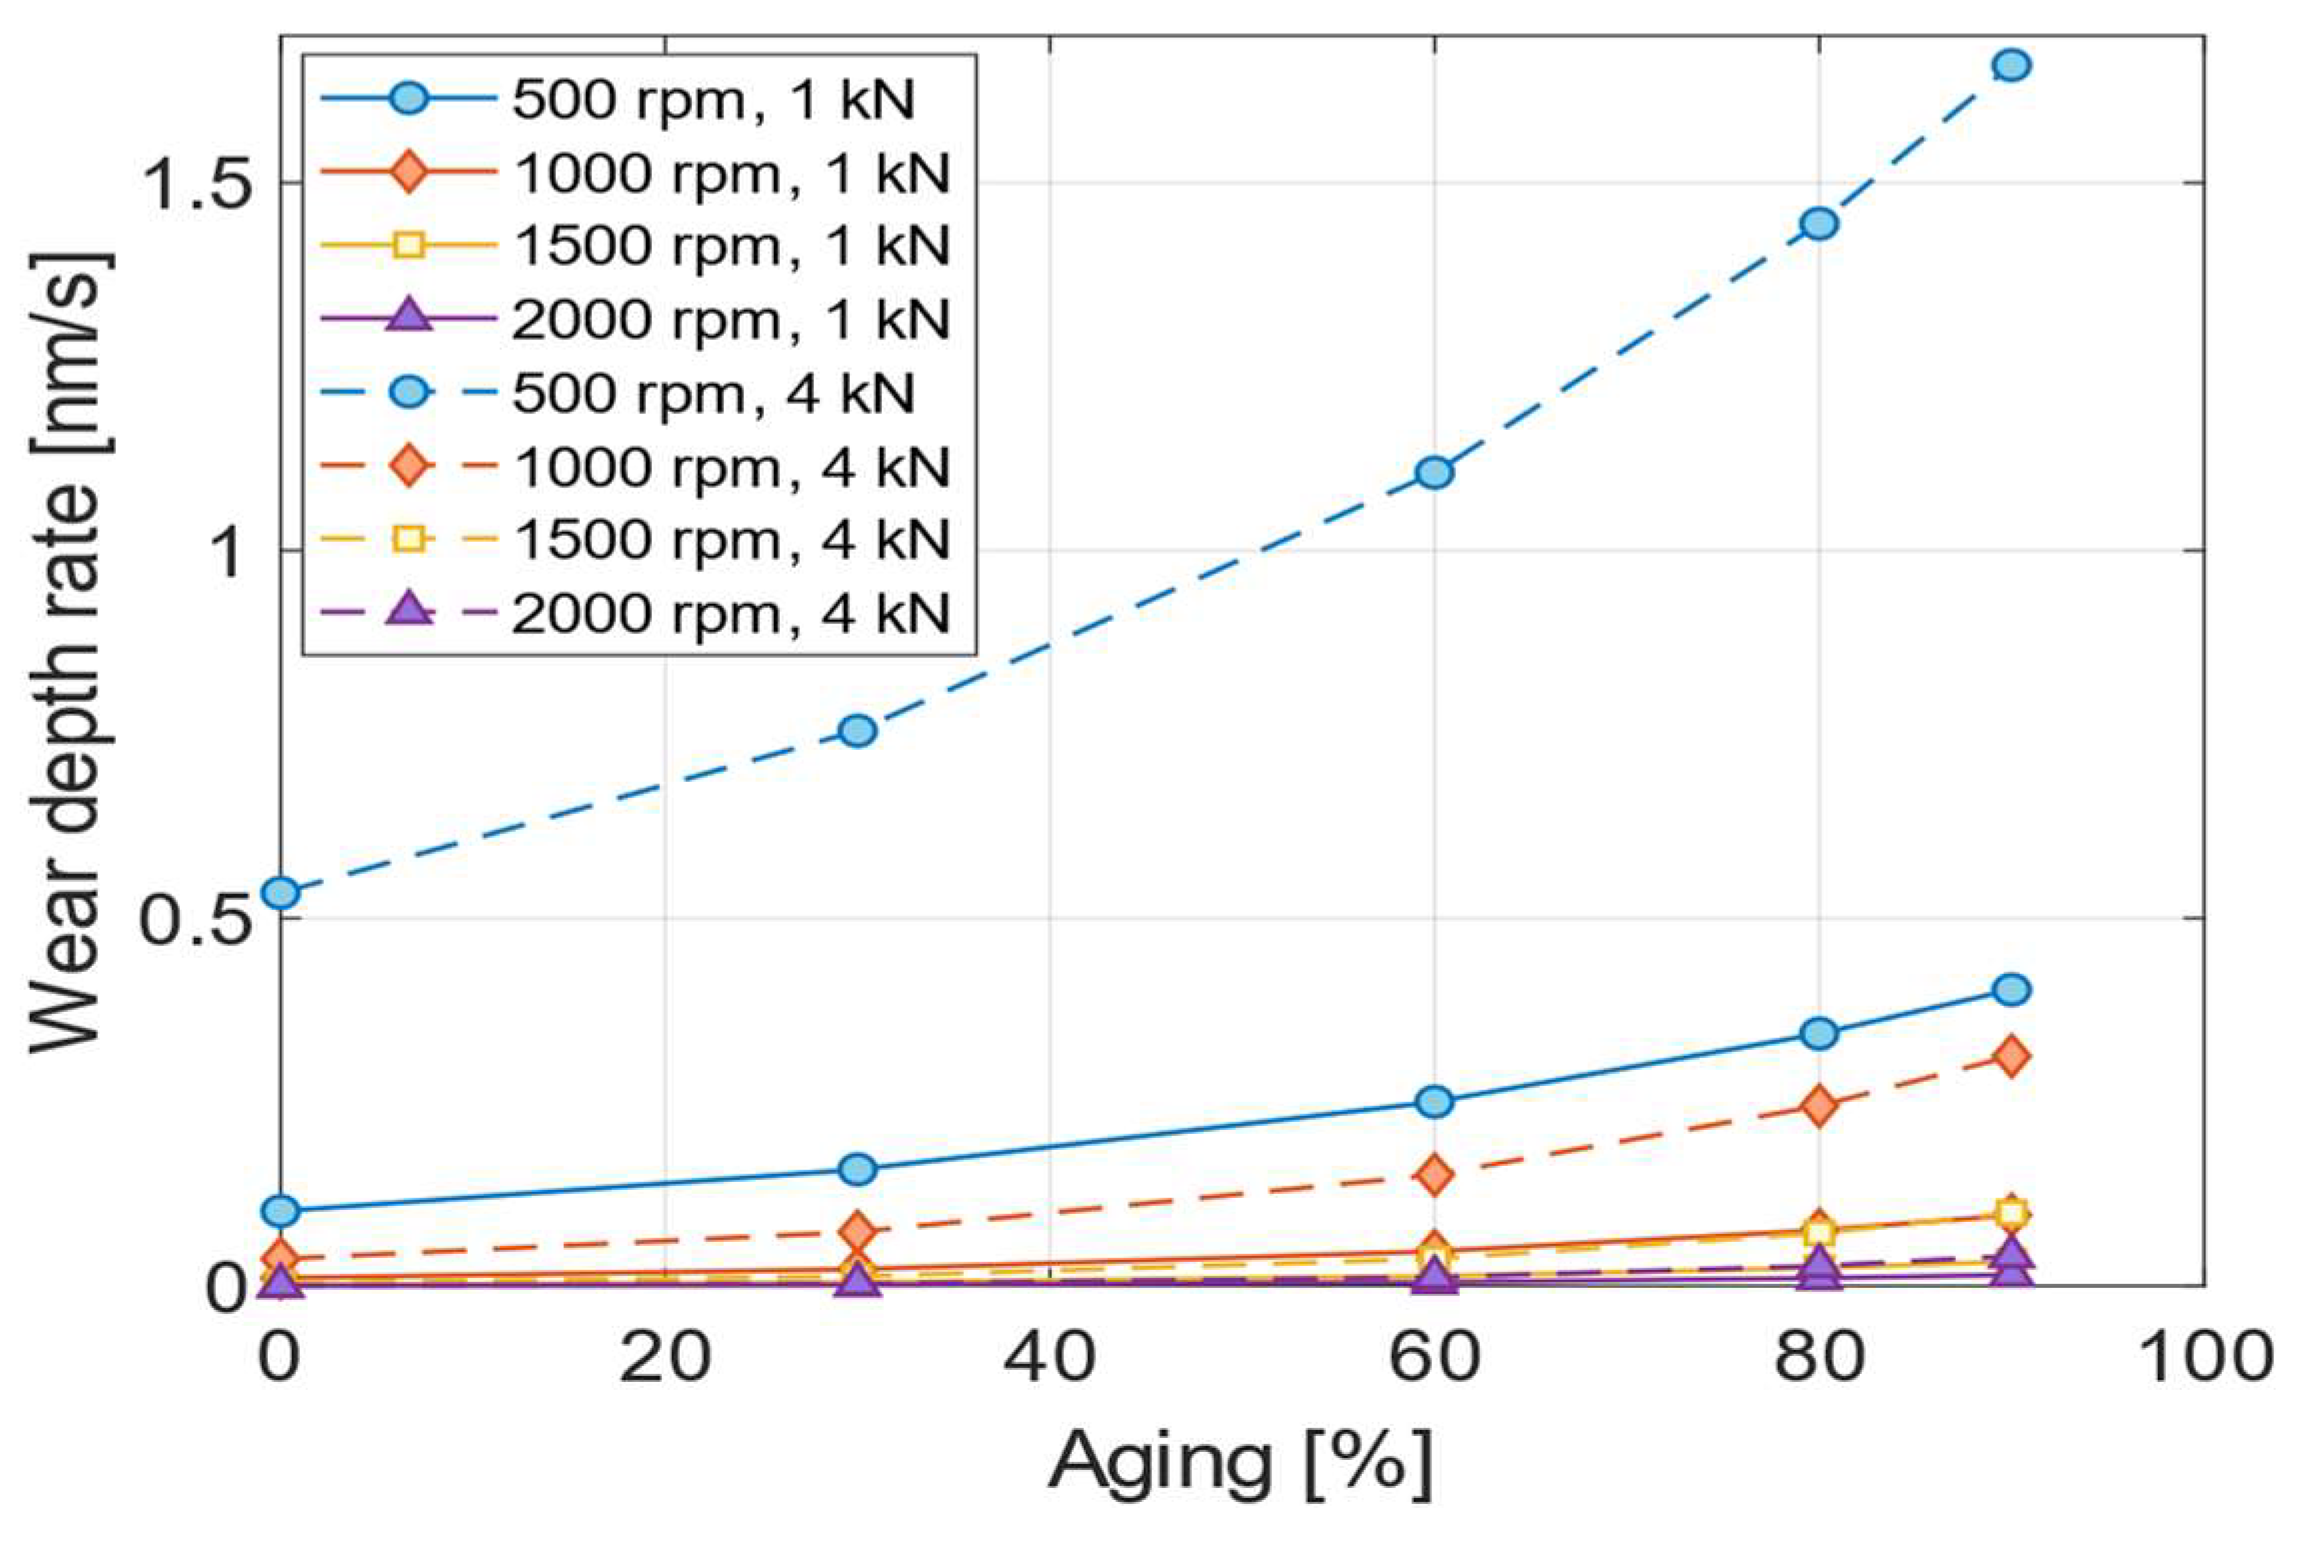
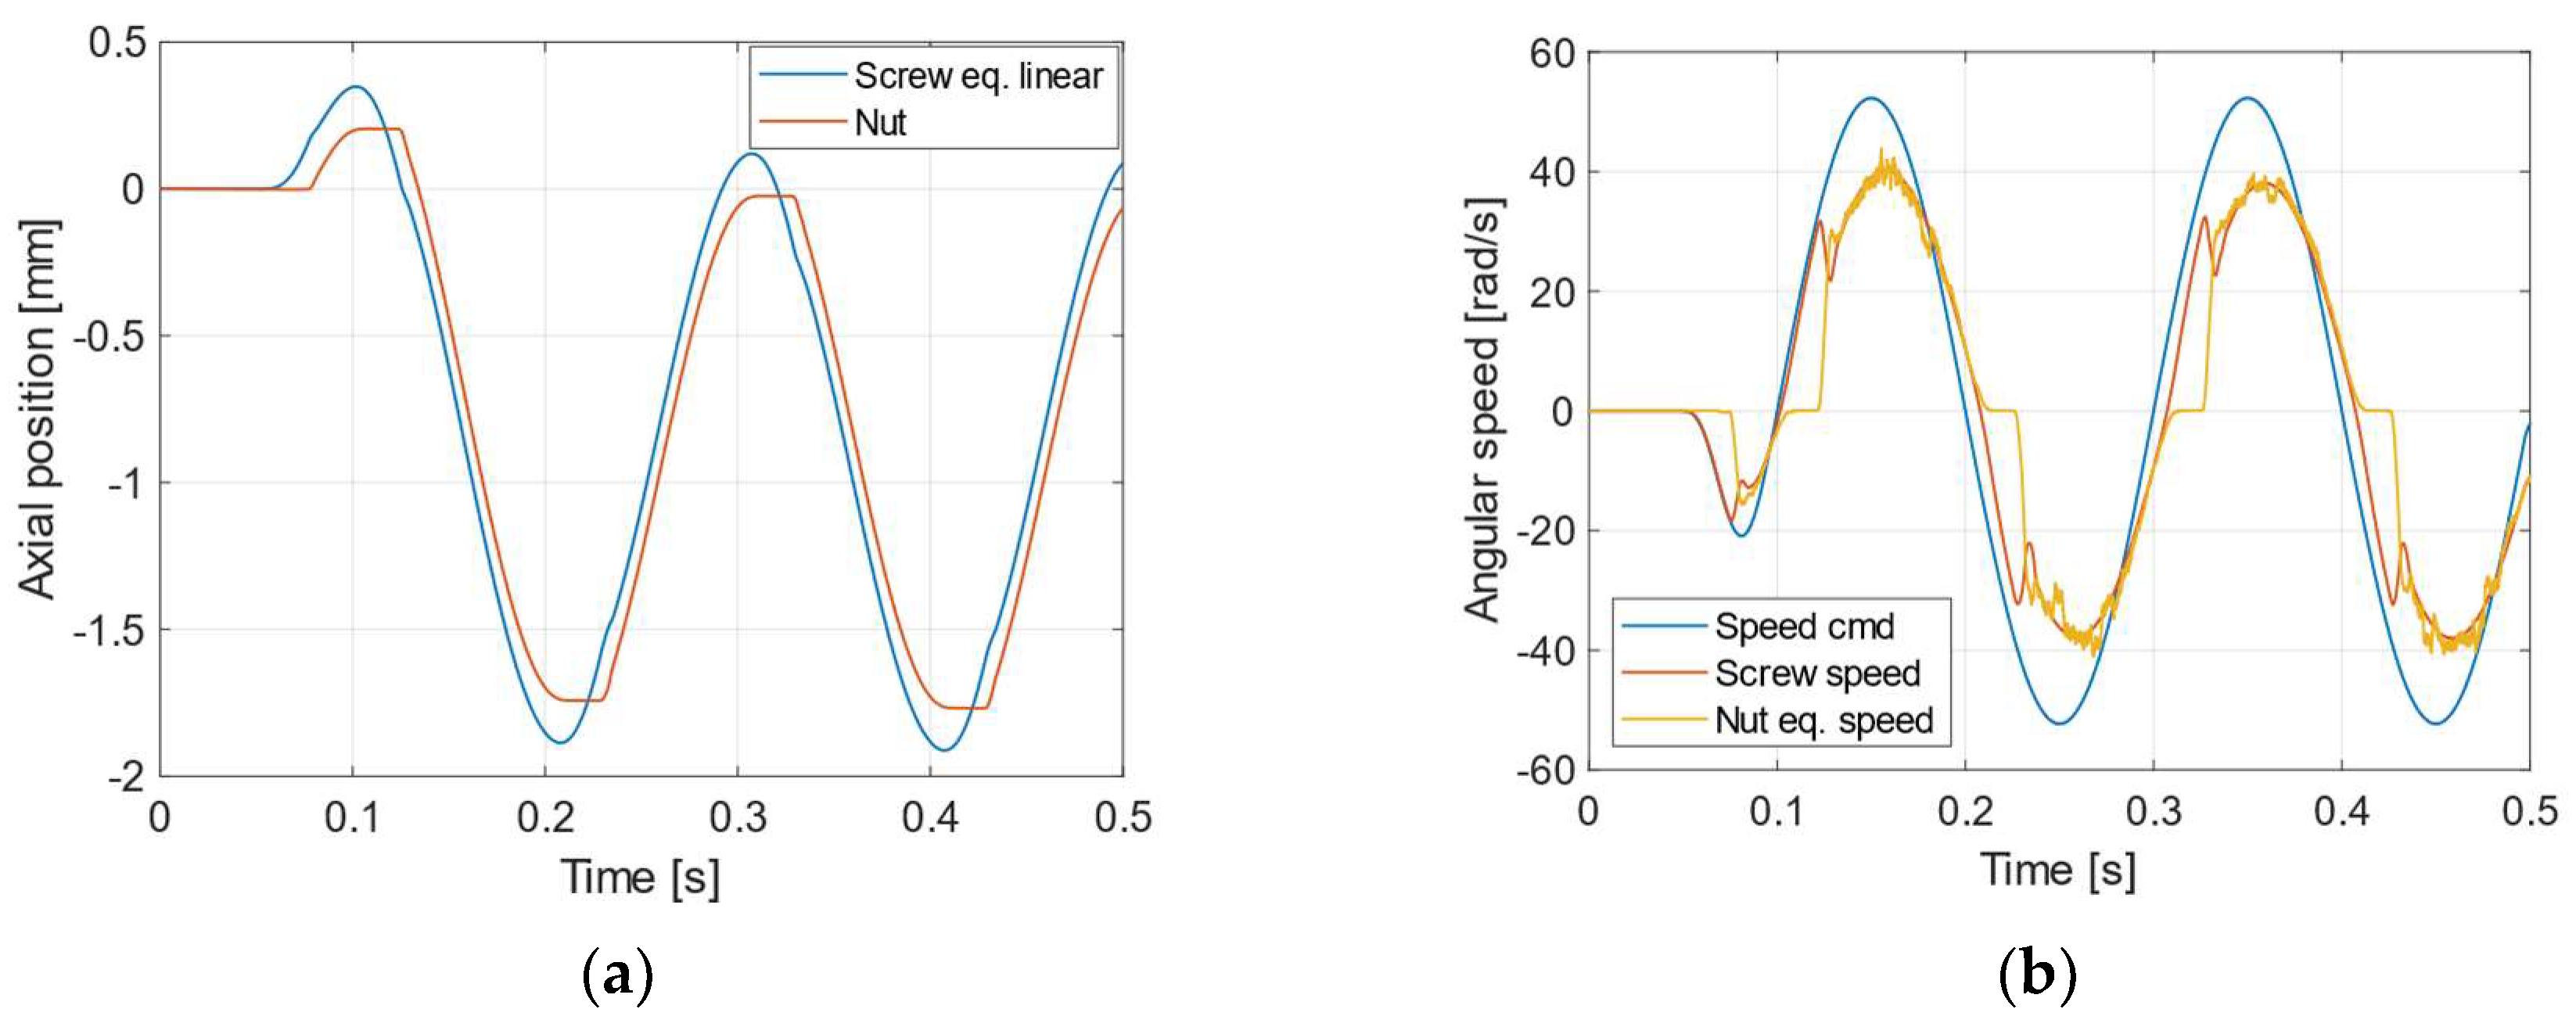
3.3.2. Mechanical Transmission
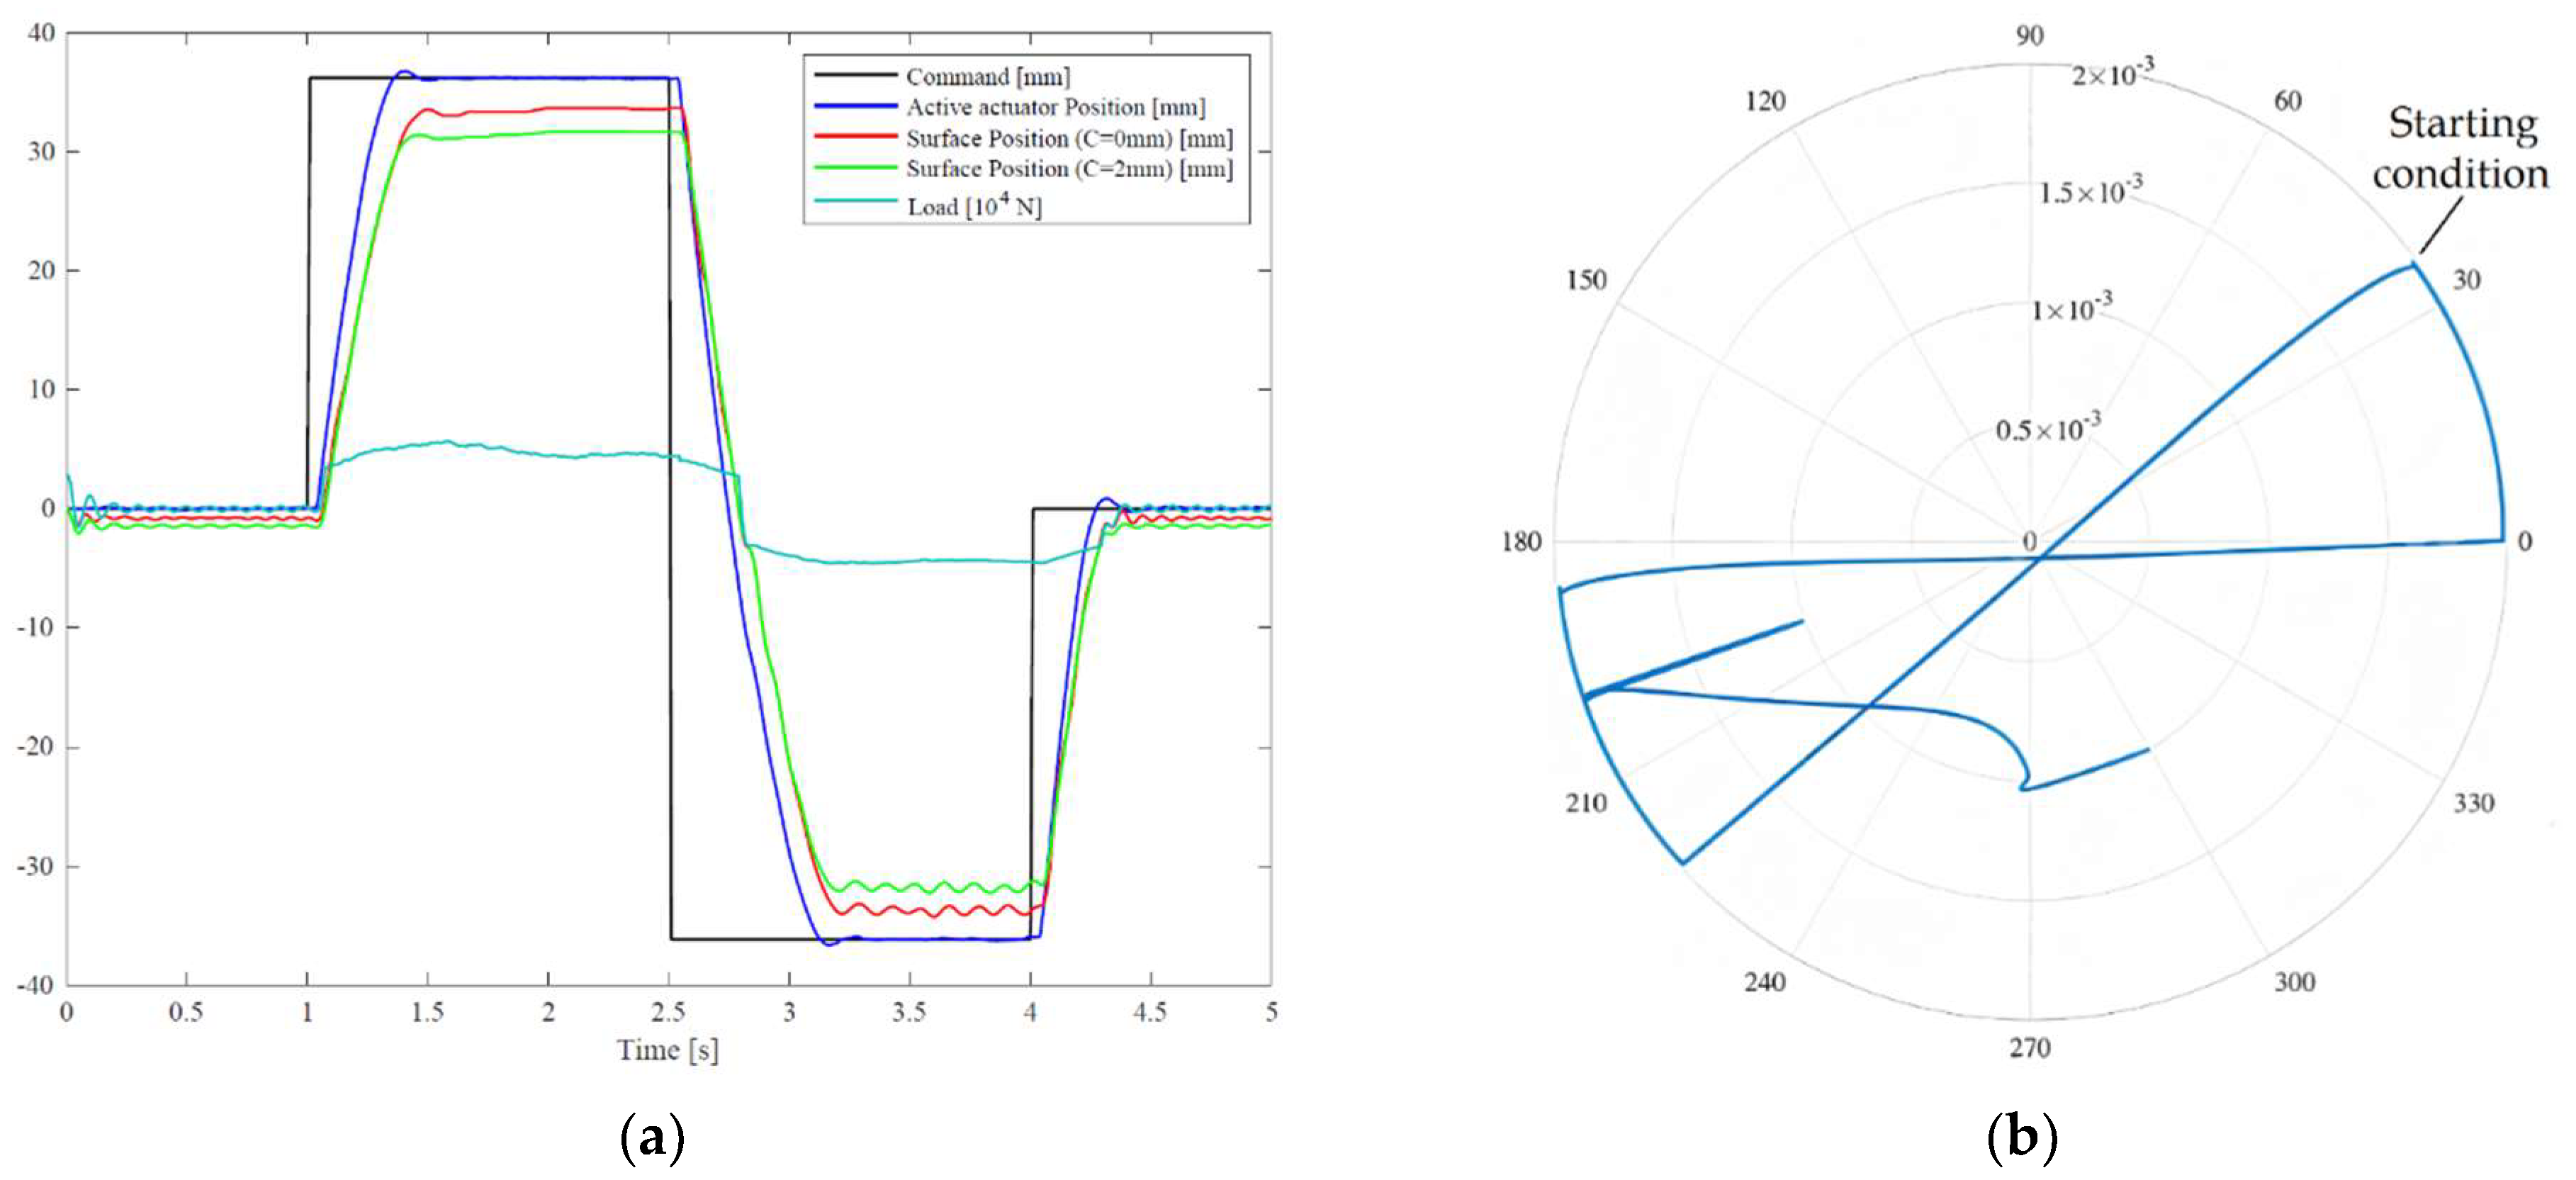
For what concerns the mechanical part of the EMA, particular attention was paid to the mechanical transmission between the rotatory motion of the electric motor and the linear displacement required to move the aerodynamic surface, i.e., the ball screw. It was mainly composed of a screw shaft, 1 or 2 nuts, and a set of spheres that allowed the mechanical efficiency of this component to reach extremely high values due to the replacement of sliding with rolling friction. To accurately describe its behavior and performance, a 3-dimensional modeling approach was necessary. In fact, in order to transmit the motion, the spheres rolled between the screw shaft and the nut’s grooves along a helical path. Moreover, a recirculating insert was present to maintain them within the nut body. As a result, the motion of each sphere was governed by an intrinsically 3D contact pattern.
The developed dynamic model, whose main screen is shown in Figure 6, considers all these peculiarities of the mechanism through a multibody approach, integrated with a highly detailed description of the contact conditions. In fact, a generic gothic arch profile of the raceways was considered; hence each sphere could enter in contact with each groove in a maximum of 2 points simultaneously, 1 for each circular side of the profile. The contact force and footprint extent were calculated at each time step by means of a penalty method with variable contact stiffness, dependent also on the contact angle. The contact parameters were calculated according to the approximated Hertzian theory [29]. The latter allows sensibly reducing the computational time with a precise closed form solution and without the need to run implicit iterative calculi at each integration time step. The normal contact force was obtained by the extent of the contact constraint violation and was composed by an elastic and a dissipative term, dependent on the approaching speed, related to energy dissipation that occurs during the deformation of the material.
To avoid unrealistic discontinuities in the contact force, the elastic component was also used as a saturation value for the damping part.
From the evaluation of the relative sliding speed in each contact point and of its direction, the friction forces were calculated. Although sliding friction was replaced with rolling friction, a little amount of slippage always occurs due to the elastic deformations of the bodies in the contact area and to the kinematics of the mechanism itself. Therefore, ball screws are usually lubricated with grease to create a proper separation of the mating bodies to avoid wear on the rolling surfaces and fatigue damage. The developed high-fidelity model took into account the presence of grease lubrication, considering the effect of its base oil, which is the main actor in the surface separation. The lubricating media rheology was considered by means of Roeland’s model for the viscosity dependence on shear stress and temperature, and of the Eyring model, which describes the nonlinear dependence of the shear stress from the shear rate in the lubricant film [30]. It depends on the film height that, following the Grubin approach [31] for the sake of simplicity, was obtained by the solution of the Nijembanning approximated formulation [32].
Generally, as in rolling bearings, elastohydrodynamic lubrication regime takes place in the contact regions; therefore hydrodynamic rolling resistance forces, rolling hysteresis torques, lubricant pressure components, and microslip losses were taken into account according to [33], as well as the spinning friction torque. Finally, for low entrainment speeds and/or high normal loads, the 2 surfaces had direct contacts: the model considered the variability of the lubrication regime, calculating the sliding friction force as a weighted sum of the dry and full film lubrication forces based on the Tallian parameter [34]. When the mating surfaces of the spheres and the grooves are sufficiently separated, almost no wear phenomena occur, while in the mixed and boundary lubrication regimes, wear becomes not negligible. The grooves’ wear is one of the most important issues in ball screws and is detrimental to their positioning accuracy as it causes preload loss, increased vibration, and, eventually, complete backlash [35]. Indeed, it was included as one of the ball screw degradation models through the well-known Archard equation, calculating the volume worn in each sphere/groove contact point at each time step and summing all the contributions to obtain a uniform mean wear of each raceway. The Archard coefficient was assumed to be dependent on the lubrication regime, a function of the Tallian parameter [36].
The probability of contact of the mating surfaces increases with the component’s usage. In fact, grease aging involves a degradation of the lubricity property of the base oil in time, i.e., viscosity reduction, meaning a decrease of the load-bearing capacity and a thinner film thickness, with increased direct contact probability and wear. Furthermore, particularly at high speeds, film thinning is also caused by lubricant starvation, which was considered following the approach presented in [37,38]. The adopted lubricant aging model calculated the reduction of viscosity as a function of the entropy generated within the lubricant due to internal mechanical shearing [21,39].
Figure 7 depicts the results of a study executed with the ball screw high-fidelity model on a ball screw with a 5 mm lead and a nominal diameter of 16 mm, directly connected to the electric motor and the grease, lubricated and subjected to different external loads levels while operating at various rotational speeds. Lubricant starvation, wear of the grooves, and lubricant aging were considered. The analyses were aimed at investigating the effect of the latter phenomenon on the macroscopic behavior of the component. It can be seen from the plot that higher external forces, combined with low speeds, lead to higher wear rates and, ultimately, to a shorter operative life. In the case of excessive wear, backlash can occur, as shown in Figure 8, where the effects of an excessive backlash are depicted for what concerns the speed and position. The left graph depicts the linear position of the nut and the equivalent linear position of the screw obtained considering the ideal transmission ratio, i.e., the 2 lines should overlap. The position of the screw shaft, being speed controlled, follows a sinusoidal trend; however, because of the presence of backlash, the nut fails to replicate its positioning and stops close to the motion reverse points. The internal spheres lose contact and engage again when the relative position reaches the backlash gap. This can be more easily observed in Figure 8b, which shows the equivalent rotational speed of the screw and the nut. At motion reversal points, due to the friction on the linear guides and the presence of backlash, the nut speed settles at 0 and remains steady until the backlash is closed; at this time, the screw’s speed also oscillates because of the new engagement.

3.3.3. Rod-End

Another important element of mechanical transmission that has been an object of study is the spherical rod-end, which connects the actuator to the airframe and the aerodynamic surface, performing a critical safety function at the aircraft level. Rod-ends are subjected to different failure modes, such as crack openings, lubricant degradation, surface denting, and so forth. However, the most common failure is represented by the wear of the internal surface of the spherical joint, with the consequent increase of backlash, which, if outside the acceptable range, could result in a significant accuracy reduction in surface positioning. Furthermore, a significant rise in friction forces within the spherical joint, due to lubricant degradation and improper lubrication regimes, can lead to excessive bending stress on the actuator. This component has been studied in conjunction with a high-fidelity model of a complete actuator to also investigate the effect on its expected performance [40]. To simplify the model definition and prepare for more complex models, some simplifying assumptions were made. This involved reducing the 3D spherical joint geometry to a 2D cylindrical approximation, ignoring misalignment and lubricant leakages. The rod-end model considered 3 different operating conditions based on the relative position between the shaft and bush. As the clearance decreased, the system transitioned from hydrodynamic lubrication to mixed and then to direct metal-on-metal contact. As for the ball screws, grease lubrication was considered and, therefore, the lubricant media was represented by its base oil. Conducting a PHM study on aerospace rod-ends requires defining models that are both computationally efficient and accurately reflect the component’s physics; for this reason, a finite difference scheme has been selected as a resolution method of the simplified Reynolds equation. To streamline the simulation and avoid the need for iterative solvers, the Half-Sommerfeld solution was chosen to describe cavitation regions, while the viscosity was computed at each FDM node, dependent on the temperature and local pressure according to the Vogel-Barus equation [31]. Depending on the operative conditions, the model was able to represent the variation of the lubrication regime from full film to mixed and boundary lubrication, monitoring the local Tallian parameter and weighting the results from the hydrodynamic and direct contact models.
Figure 9 illustrates the effect of the rod-end backlash on the final surface positioning when the control surface is moved by 2 parallel servo-actuators according to the active-standby control strategy. It can be observed in Figure 9a how the backlash in the rod-end due to excessive wear causes important variation in the deflection of the control surface, which can lead to increased surface vibration, damage, and controllability issues. In particular, it can be seen from Figure 9a that the equivalent surface displacement considering surface kinematics in the presence of backlash (green line) differs from that with no backlash (red line) by approximatively 2 mm, which corresponds to half the width of the imposed backlash for the current simulation for the fully deflected surface condition; while the surface position varies by about 0.6 mm for null commands of the active actuator, mainly due to the presence of external aerodynamic loads, internal damping, and the attachment with the second stand-by actuator.
Figure 9b depicts the motion of the internal sphere within the rod-end housing during the simulation and shows how it impacts the bushing’s race, contributing to damage progression and rod-end degradation. The model gives in the output the normal and frictional contact forces and the wear information, which are useful insights to understand the component’s behavior under various working conditions, helping in the definition of a suitable PHM framework.

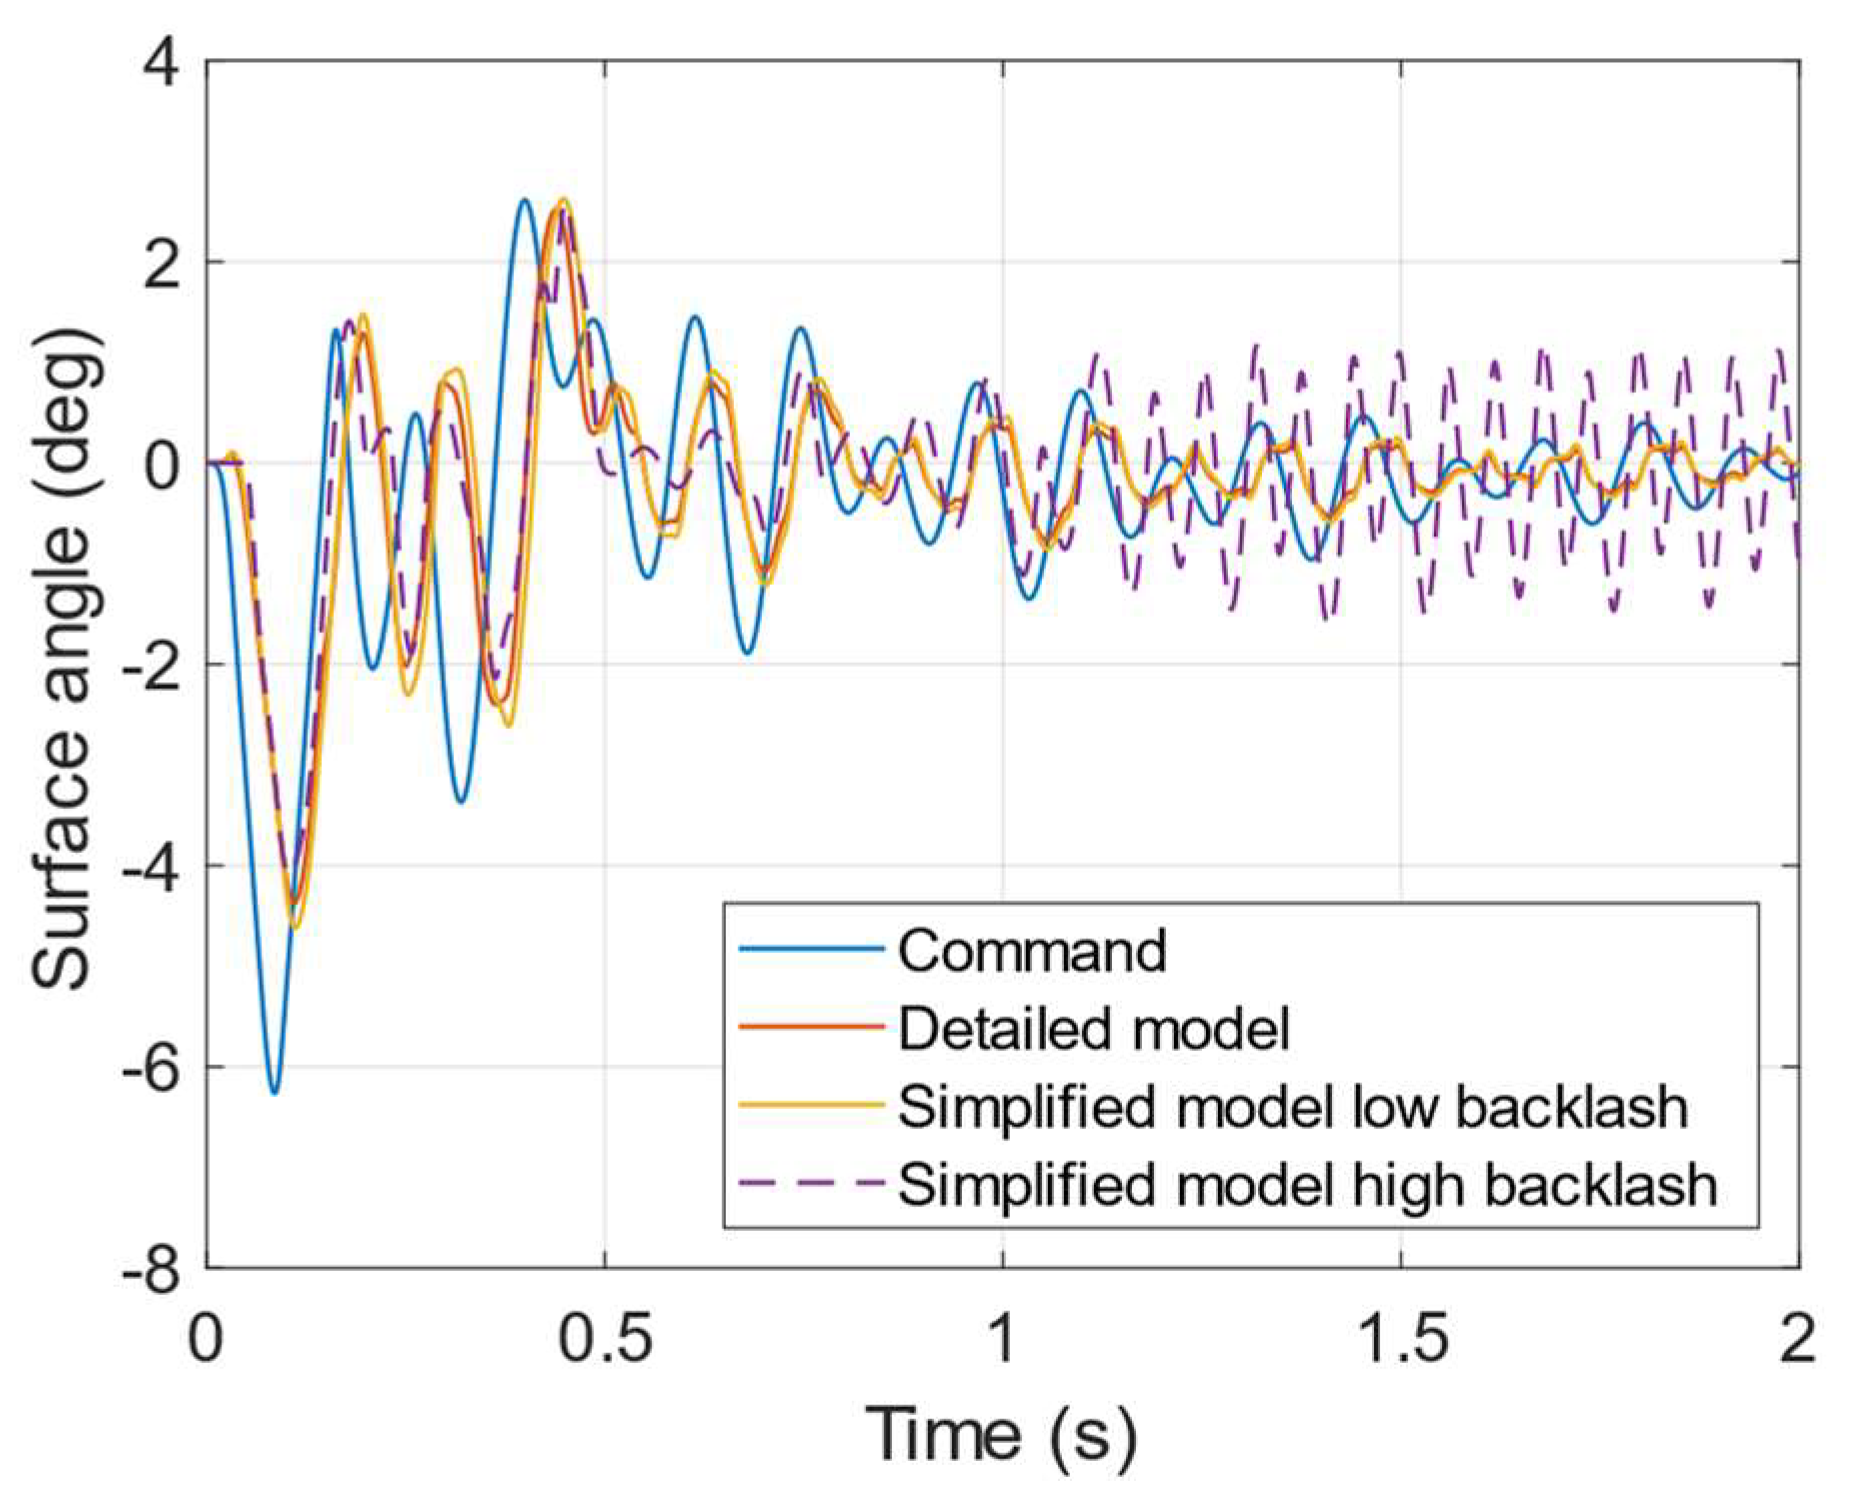
3.4. Real-Time Modeling

The abovementioned high-fidelity models are accurate, metaphysical, and extremely detailed, based on the physical descriptions of the involved phenomena. However, the high level of detail counterposes the computational constraints required to run PHM routines. In fact, such models are very computationally intensive and are not suitable for prolonged simulations of a complete servosystem. With the aim of streamlining the computational time to make them available to generate a large dataset of nominal and degraded system responses and to be used in real-time simulations on the iron bird, several reduction techniques were applied to the models to obtain a simplified EMA model capable of reproducing the main features required by the iron bird to enable the simulation of a complete flight, i.e., the position of the actuator and control surface. The various considered degradations were then inserted into the model with equivalent simplified models; they aimed to simply reproduce the effects of each fault progression on the relative signals which were seen as being affected by such degradations during the offline phase, according to the detailed results obtained with high-fidelity models. Because of the practical implementation of the iron bird and the performance of its hardware components, the real-time (RT) model must comply with the time constraint of a maximum integration frequency of 12 kHz.
Hence, only the more important dynamics were considered in the RT model to balance the need for realism with the computational effort. It is worth highlighting that not only 1, but multiple EMA models should be run simultaneously to enable the correct functionality of the iron bird; therefore, the actual model complexity must remain as low as possible to avoid CPU overloads. Furthermore, jitter usually occurs in the RT hardware, so a certain amount of security margin must be considered.
Following these constraints, the RT model was assembled, as shown in Figure 10. It was composed of several subsystems, each representing an interconnected subcomponent reflecting the physical arrangement. The main blocks represent the Power Drive Unit, controller, electric motor, mechanical transmission, and control surface. A number of simplifying assumptions were made to speed up the simulations. The 3-phase electric motor was modeled with the equivalent d-q axes representation, exploiting the Clarke-Park transformation. Also, the PDU was represented by a 3-leg inverter with conduction losses dependent on the temperature. The ball screw and rod-ends were contained in the mechanical transmission subsystem, describing the motion transformation from rotational to linear considering mechanical efficiency, stiffness, and friction. The latter was modeled with the fast and simple Karnopp model to maintain the computational requirements as low as possible. The surface’s block enclosed the description of the variable lever arm which allowed the linear displacement of the actuator to create a controlled rotation of the aerodynamic surface. The system was then basically reduced to a 2-body lumped mass model: 1 representative of the control surface and the other of the entire mechanical drive from the rotor to the translating part of the ball screw. The rod-end connection stiffness was considered in the connection point between the 2 lumped masses. All the sensors were represented with dynamic transfer functions and, together with the controller states, were sampled at the various control loops’ frequencies. A simple single-body thermal model was used to estimate the global temperature change of the EMA during the simulation.
The RT model was created according to the following principles:
  • Replace expressions with high computational cost with approximated low-order forms,
  • Minimize the number of integrators and state variables,
  • Reduce or avoid repeated calculi or Boolean checks,
  • Optimize the C++ executable creation options for RT target, and
  • Substitute continuous-time integrators with discrete-time state variable.
As stated in the previous paragraphs, 7 faults were considered, 5 of which described a progression in time, and 2 (i.e., motor’s static eccentricity and PDU’s MOSFET base drive open circuit) were imposed a priori before the simulation started. The introduction of the selected failure modes within the real-time models was achieved in 2 separate ways, depending on the model modifications required to adapt the high-fidelity model to the real-time framework requirement. The 1st type was represented by those failure modes whose progression could be successfully described by the reduced-order model, such as the magnet degradation, the occurrence of rotor eccentricity, and the degradation modes affecting the mechanical transmission. In such cases, the very same models adopted for the high-fidelity model were ported within the real-time simulation with minimal adjustments. For other failure modes, including the turn-to-turn short and the MOSFET base drive open circuit, a different approach was needed; the physics-based representation of such degradation process required a 3-phase dynamic model of the motor, while the real-time representation worked on a streamlined d-q axis description.
Starting with the latter case, the approach was to map the effects that the degradation mode had on the quantities represented in the real-time model through the high-fidelity environment, then proceeding to modify the signals of the real-time model according to such maps. To better explain this approach, please consider the case of the turn-to-turn short and the scheme provided in Figure 11. The real-time model described the nominal health behavior of the motor according to a d-q axis description, computing the expected windings temperature T w , according to a streamlined thermal model of the motor. Such temperature was then used to feed the turn-to-turn short model, which computed the expected variations on each of the 3-phase currents according to the fault mapping.
Such variations were then applied to the 3-phase currents i a , i b , and   i c derived from the direct, quadrature currents computed by the real-time model. Once the variations were applied, the updated d-q axis currents were obtained through the inverse Park transformation.
The faults of the mechanical transmission included the wear of ball screw and rod-end and the lubricant degradation. The latter, as seen, also caused an increment in the wear rate, but, as previously stated, mutual excitations of different failure modes were ignored in this work for being outside the original scope of the research project. Wear was considered by means of the Archard equation. The effect of wear is a backlash increase that was modeled by means of a double-sided elasto-backlash with hysteretic damping based on the relative position of the 2 bodies. Since only 2 bodies represented the mechanical dynamics of the system, the backlash models for both the ball screw and the rod-end were condensed into a single backlash located in the rod/surface joint. A smart approach was implemented to differentiate the 2 situations, consisting in sending the actual rod position back to the controller if no ball screw backlash was considered, while conveying the linear position on the surface’s side of the backlash if the degradation was introduced. Despite this, the backlash of the rod-end is normally taken into consideration in the model. As a result, the effective backlash seen by the RT model, concentrated in the rod/surface connection, was the sum of the 2 backlashes in series. The effect of lubricant degradation was obtained with a mechanical efficiency reduction in the RT model.
Figure 12 shows the results obtained with the RT model when a surface position command is imposed to the EMA with aerodynamic loads dependent on the surface deflection. To highlight the effect of 1 of the selected degradations, 2 simulations with low and high levels of backlash in the rod-end are shown; for the second case, the surface position exhibits flutter oscillations for little commands due to the excessive backlash under the action of the external loads. The discrepancies between the detailed and simplified models emphasized during the highly dynamic phases of the simulation, i.e., the first part, while tending toward 0 for steady conditions, assumes an RMS value of the absolute error between the results of the RT model and the detailed model, shown in Figure 12, of 0.23 deg, which is a reasonably small value and an acceptable compromise when considering the computational constraint imposed by the hardware implementation. The presence of the backlash model does not introduce substantial variations to the RMS error.

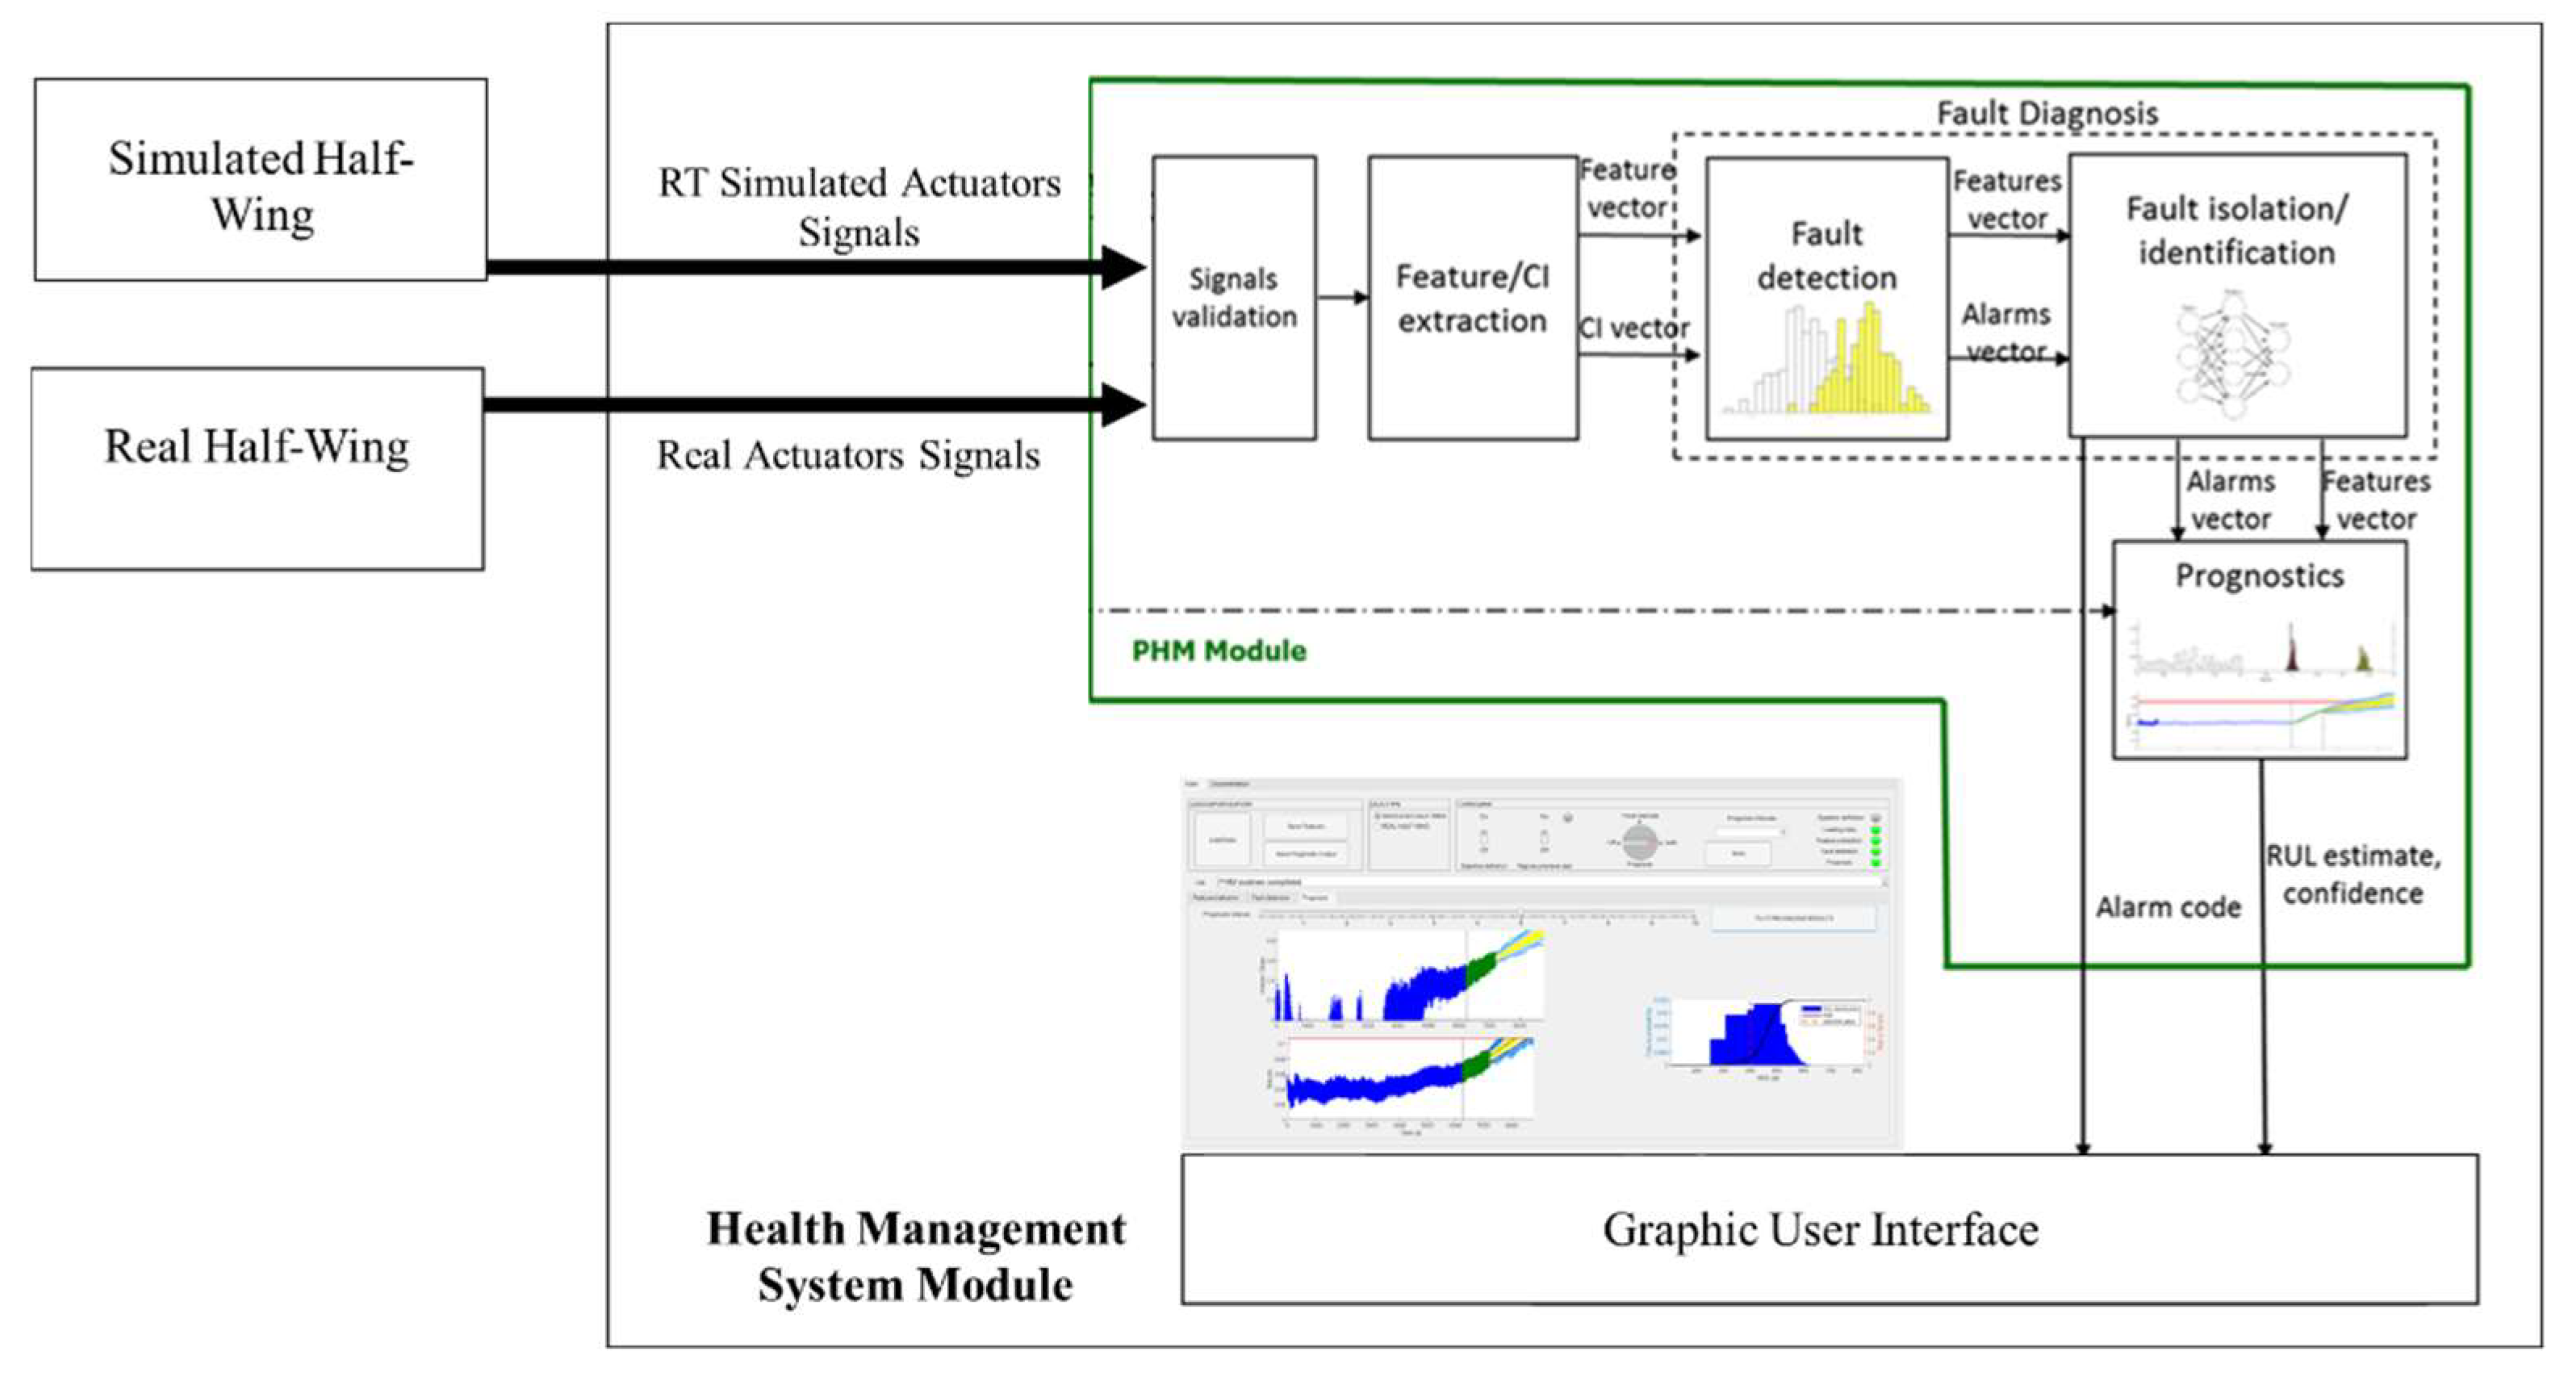
4. PHM Framework Design

Once the simulation environment, both in its high-fidelity and real-time declination, is defined, it is possible to use the data generated through repeated simulation cycles to inform the definition of the PHM system, study the expected behavior of the actuators under degraded health conditions, and assess which signals to use for health monitoring. This section details the approach followed in the definition of the PHM system, starting from the definition of the operational scenario.

4.1. PHM Framework Design-Preliminary Operations

The design of the PHM framework followed the procedures suggested by [1], where the high-fidelity model is first used to study the effects of the injected failure modes on the system performances, inform the feature selection process, and then lead to the choice of the fault diagnosis and failure prognosis routines.
The feature selection process was performed through the analysis of the simulation results, leading to the definition of a pool of possible feature candidates. Such feature candidates were then ranked according to metrics such as correlation with the failure mode behavior, signal-to-noise ratio, and precision. During this first stage of the design process, it was paramount to properly characterize the uncertainty surrounding the simulation results, including the effects that external disturbances, such as the external temperature, load, and command patterns, have on the system performance and on the possible feature candidates to obtain a statistically representative database of the possible operating conditions.
For the case study under analysis, this translates into the definition of a complete operative scenario, following the scheme provided in Figure 13. A sequence of position commands and aerodynamic load, representative of the expected operating cycle of the flight-control actuators under analysis, was provided by the industrial partners of the project. The operating cycle can be represented as a pair of t , x s e t and t , F e x t time series where t is the time vector, x s e t is the position command, and F e x t is the external force. Before each simulation, the sequence was warped and modified through the following equation
t = t   σ t x s e t = x s e t σ x + σ x 0 F e x t = F s e t σ F + σ F 0
where σ t is a random number drawn from a normal distribution with mean 1 and a standard deviation equal to 0.1. σ x and σ F are again drawn from a normal distribution with mean 1 and a standard deviation of 0.3, while σ x 0 and σ F 0 are chosen from a normal distribution with a 0 mean and standard deviation equal to 10% of the actuator stroke and of the nominal aerodynamic load, respectively.
Ten possible aircraft were then selected by imposing small perturbations, compatible with the expected production tolerances, on the actuator parameters. Of these aircraft, 4 are supposed to operate in temperate climate conditions, 3 in cold conditions, and 3 in hot conditions. Three reference location were then chosen: Turin for temperate conditions, Abu Dhabi for hot conditions, and Vancouver for cold conditions, and historical temperature distribution for each were saved. For each simulated flight, the temperature varied between the ground value, randomly drawn from the reference location datasets, and −40 °C, which is the expected temperature during cruise for the considered aircraft type. A total of 100 flights for each aircraft were simulated under nominal health conditions. Degradations were then injected and their progression was simulated through accelerated fault-to-failure model. Results were then analyzed to search for the most significant effects of each failure mode and provide the basis for the feature selection process. Among a pool of more than 50 candidates, 1 preferential feature for failure mode was chosen according to correlation and signal-to-noise ratio scores. A brief overview of the considered failure modes, along the signals required to compute the associated feature, is reported in Table 1. Between these failure modes, due to their interplay, 4 were analyzed in more detail: the occurrence of turn-to-turn short, magnet degradation efficiency loss, and wear-induced backlash in the mechanical transmission. This choice was justified by looking at the other failure modes. The occurrence of MOSFET Base Drive Open Circuit was expected to be a fast-evolving failure mode, thus, was treated only for fault detection and isolation. Similarly, the occurrence of a static eccentricity within the motor was traced to misalignments or mounting errors persistent in time and not to slowly evolving degradation. The wear in the spherical joint was finally tracked through a feature that was not affected by the occurrence of the other failure modes. Figure 14 depicts the correlation of the chosen features for the 4, possibly interplaying, failure modes against the progression of each considered degradation. As anticipated in Section 3, the main symptom of the occurrence of a turn-to-turn short in the electric motor windings was the formation of a growing asymmetric behavior between the 3-phase currents. The feature F T T S exhibited high correlation marks as expected, while the other 3 selected features were less affected. A very loose correlation occurred with the feature F M T E L due to the reduction of the motor efficiency due to the ongoing short circuit.
The occurrence of a distributed magnet degradation is associated with good correlation indexes for the associated feature F D M D only. The occurrence of efficiency loss in the mechanical transmission can instead affect more features, showing the highest correlation value with F M T E L , while also exhibiting a high correlation with F D M D due to an increase in the absorbed current. This result is, of course, suboptimal but does not represent a critical issue: F M T E L shows good correlation only for the efficiency-loss case and is not significantly correlated with the occurrence of magnet degradation. The opening of an increasing backlash in the mechanical transmission is also highly correlated with its own associated feature ( F M T W E A R ). The feature F D M D is also affected due to the current spikes caused by the impacts which originate whenever the freeplay is recovered. Its correlation is, however, lower than that associated with F M T W E A R , while the correlation of F M T W E A R with the occurrence of magnet degradation is negligible. As such, the selected feature set is expected to be suitable for fault diagnosis and failure prognosis.

4.2. PHM Framework Design-Framework and Algorithms Choice

The PHM framework was designed considering the need to keep the computational effort required to perform the diagnostics/prognostics tasks at a minimum to comply with the requirement of being installed on board the iron bird. As such, the scheme provided in Figure 15 was adopted, where the data coming from the iron bird are at first checked to verify their coherence, used to evaluate the features at any time, and then sent to the fault-detection routine.
Before being analyzed, the features were at first downsampled (80 Hz, against the 800 Hz of the iron bird signals) to reduce the computational effort and then preprocessed by an exponential filter to improve their signal-to-noise ratio. The fault-detection algorithm was based upon a simple, purely data-driven logic, comparing at each timestep the running feature distributions against the baselines obtained for health conditions. The remaining parts of the PHM algorithms were switched off. If the running distribution of 1 (or more) features deviated excessively from their own baselines, an alarm was triggered and the remaining routines of the PHM frameworks were activated. Such a solution has the benefits of keeping the most computationally expensive routines dormant until they are needed, hence, reducing the computational burden. An example of the fault-detection algorithm behavior is highlighted in Figure 16, where the running distribution of the feature overcomes a separation threshold, triggering the corresponding alarm of a fault declaration confidence equal to 0.98. In this instance the fault-detection algorithm observes a deviation of the feature associated with the occurrence of a turn-to-turn short in the motor windings, prompting a fault declaration once the confidence threshold is met.
If a fault is detected, the fault classification algorithm is called to assess which failure mode is occurring (or is being simulated) within the flight-control actuator. Given the preliminary nature of the study, only the case where 1 degradation may occur at any given time was considered. As such, a simple Linear Support Vector Machine, operating over the features vector, was considered. The LSVM was trained with a randomly chosen subset representative of 70% of the data generated through the high-fidelity model, while the remaining 30% was used for verification purposes.
Results of the training process are aimed at a total accuracy rate higher than 95%. Once a fault was detected and classified, the information was sent to the prognostic algorithm.
The prognostic routine was based on the particle-filtering structure, depicted in Figure 17, to infer the fault severity and forecast the degradation growth [41]. The particle filter scheme tracks the fault progression by iterating at each time stamp 2 consequential steps, the first being the “prediction” stage and the latter being the “filtering” stage. The prediction step combines the knowledge of the previous state estimate p x t | y t 1 with a process model p x 0 : t 1 | y 1 : t 1 to generate the a priori estimate of the state probability density functions for the next time instant,
p x 0 : t | y 1 : t 1 = p x t | y t 1 p x 0 : t 1 | y 1 : t 1 d x 0 : t 1
This expression usually cannot be analytically solved; the Sequential Monte Carlo algorithms can be used in combination with efficient sampling strategies for such purpose [42]. Particle filtering approximates the state probability density function through samples or “particles” characterized by discrete probability masses, or “weights”, as,
p x t | y 1 : t w ˜ t x 0 : t i δ x 0 : t x 0 : t i d x 0 : t 1
where x 0 : t i represents the state trajectory; thus, the fault severity while y 1 : t is the measurements up to time t. During the “filtering” stage, a resampling scheme is employed to update the state estimates by updating the particle weights. One of the most common versions of this algorithm, the Sequential Importance Re-sampling (SIR) particle filter [43], updates the state weights using the likelihood of y t as:
w t = w t 1 p y t | x t
Although widely adopted within the PHM community due to its simplicity and relatively low computational requirements, it is worth mentioning that this resampling scheme has limitations in the description of the distribution tails, and that more advanced resampling schemes, aimed at obtaining and improving representation of the distribution tails, have been proposed [44]. However, given the low-TLR nature of the study, the SIR scheme was deemed sufficient. The algorithm performs long-term predictions of the fault evolution in time by iterating the “prediction” stage. Evaluating the particle trajectories, it is then possible to estimate the probability of failure by comparing their behavior against a hazard zone, defined via a probability density function with lower and upper bounds for the domain of the random variable [45]. As shown in Figure 17, this approach is based on particle-filtering schemes in which tunable degradation models are adopted as process models. These models are then used both to estimate the current a priori state of the system, p x t | y 1 : t 1 , and to perform the iterative steps necessary to achieve the prognosis p x t + k | y 1 : t . Auto-tuned models are required to describe and follow changes in the degradation process and to describe the process and measurement noise. For the case study under consideration, the particle filter employs a nonlinear process model y t = f x t + ν , obtained considering the dependency of the selected features on degradation growth. The process noise ν is then obtained through a kernel function mirroring the feature distribution around the fitted model. The state model x t + 1 = f x t , t + σ is a time-dependent nonlinear model whose parameters are automatically tuned through a Recursive Least Square [46] algorithm operating over the state estimates provided by the particle filter itself. The measure of noise σ is also estimated at each time stamp computing the state estimate variance with respect to the noiseless output of the state model itself. The particle filter code also employs the noise compensation techniques described in [47] and self-adjusts the process noise by comparing the particle distribution at a given time instant (usually a few time steps ahead of the prediction time) of a previous long-time prediction against the particle distribution obtained for the same time instant from the prediction/filtering loop. The output of the prognostic algorithm is represented as the RUL distribution for each prediction, coupled with the evaluation of the risk of failure as detailed in [45]. An example of the results achievable with such a framework is provided in Figure 18, where its response against a simulated fault, the occurrence of accelerated degradation of the motor’s permanent magnets, is depicted for a single prediction step highlighting the trajectories of the long-term prognosis on both the estimated fault size (hidden state) and feature. Figure 19, instead, provides an example of the RUL distributions obtained for different prediction steps for the very same failure mode. It can be noticed that the RUL uncertainty estimate tends to decrease along with the degradation process. However, when the degradation severity has grown close to the failure declaration threshold, the prediction uncertainty tends to increase again. Such behavior is expected since the closer the degradation process approaches the failure status, the more it becomes susceptible to small variations of the physical variable responsible for its progression, thus, leading to increased uncertainty over its future expected behavior.

4.3. PHM Framework Design-Implementation and Verification Process

The proposed PHM framework was implemented within a Matlab GUI running as a standalone executable file within the HMSM module of the iron bird. The application to an integrated technological demonstrator, of which PHM is a part but not the only objective, means that some limitations were introduced. For the application at hand, it was chosen to replicate a system operating a periodical download of the actuators signals to be analyzed. For each simulated flight (or series of simulated flights), the Health Management System Module receives the signals from both the “simulated” half-wing and the “real” half-wing through the optical ring operating with a data transmission rate of 800 Hz. This posed a significant issue for data analysis, since all the electric current signals associated with a motor angular frequency higher than such transmission rate divided by 10 times the number of the magnetic pole couples of the Brushless-AC were not properly reconstructed. As such, it was necessary to limit the data analysis for low-speed conditions only. Before testing the behavior of the PHM algorithm on board the iron bird, it was necessary to verify its behavior and expected performances offline to avoid the need to debug or rethink parts of the framework once that system was installed. Such a verification process was achieved through the approach proposed in Figure 20, thus stressing the PHM routines with datasets generated through the real-time version of the model of the actuator, which are offline versions of the simulation models employed on the iron bird for the “simulated” half-wing. The use of the RT models was chosen because of 2 main reasons. The first was the significant cut in computational effort required to generate data. The second was the need to remain as close as possible to the iron bird configuration, to test possible issues with data exchange, labels, computational effort, and memory leaks. The test was performed again considering 10 different aircraft—different from those used during the design phase—subjected to several degradation patterns while using the same scenario generator described in Section 4.1. Data were then sent to the PHM GUI prepared for iron bird deployment. Data were analyzed, subjected through the fault-detection and classification routine, and then sent to the prognostic algorithm, which performed 10 RUL predictions at equally spaced time instants ranging from the time-at-detection (the time instant corresponding to the fault detection) to the end-of-life of the component (failure conditions).
Results were then analyzed by checking the percentage of false alarm and misclassification rates and the convergence of the RUL estimate to the ground truth provided by the simulations.

5. Results

Results of the preliminary performance assessment procedure are summarized in this section, divided between the verification of the implementation targets, in terms of computational effort, execution time of each routine, and the evaluation of the performance of the fault detection, fault classification, and failure prognosis routines against the simulated degradation histories.

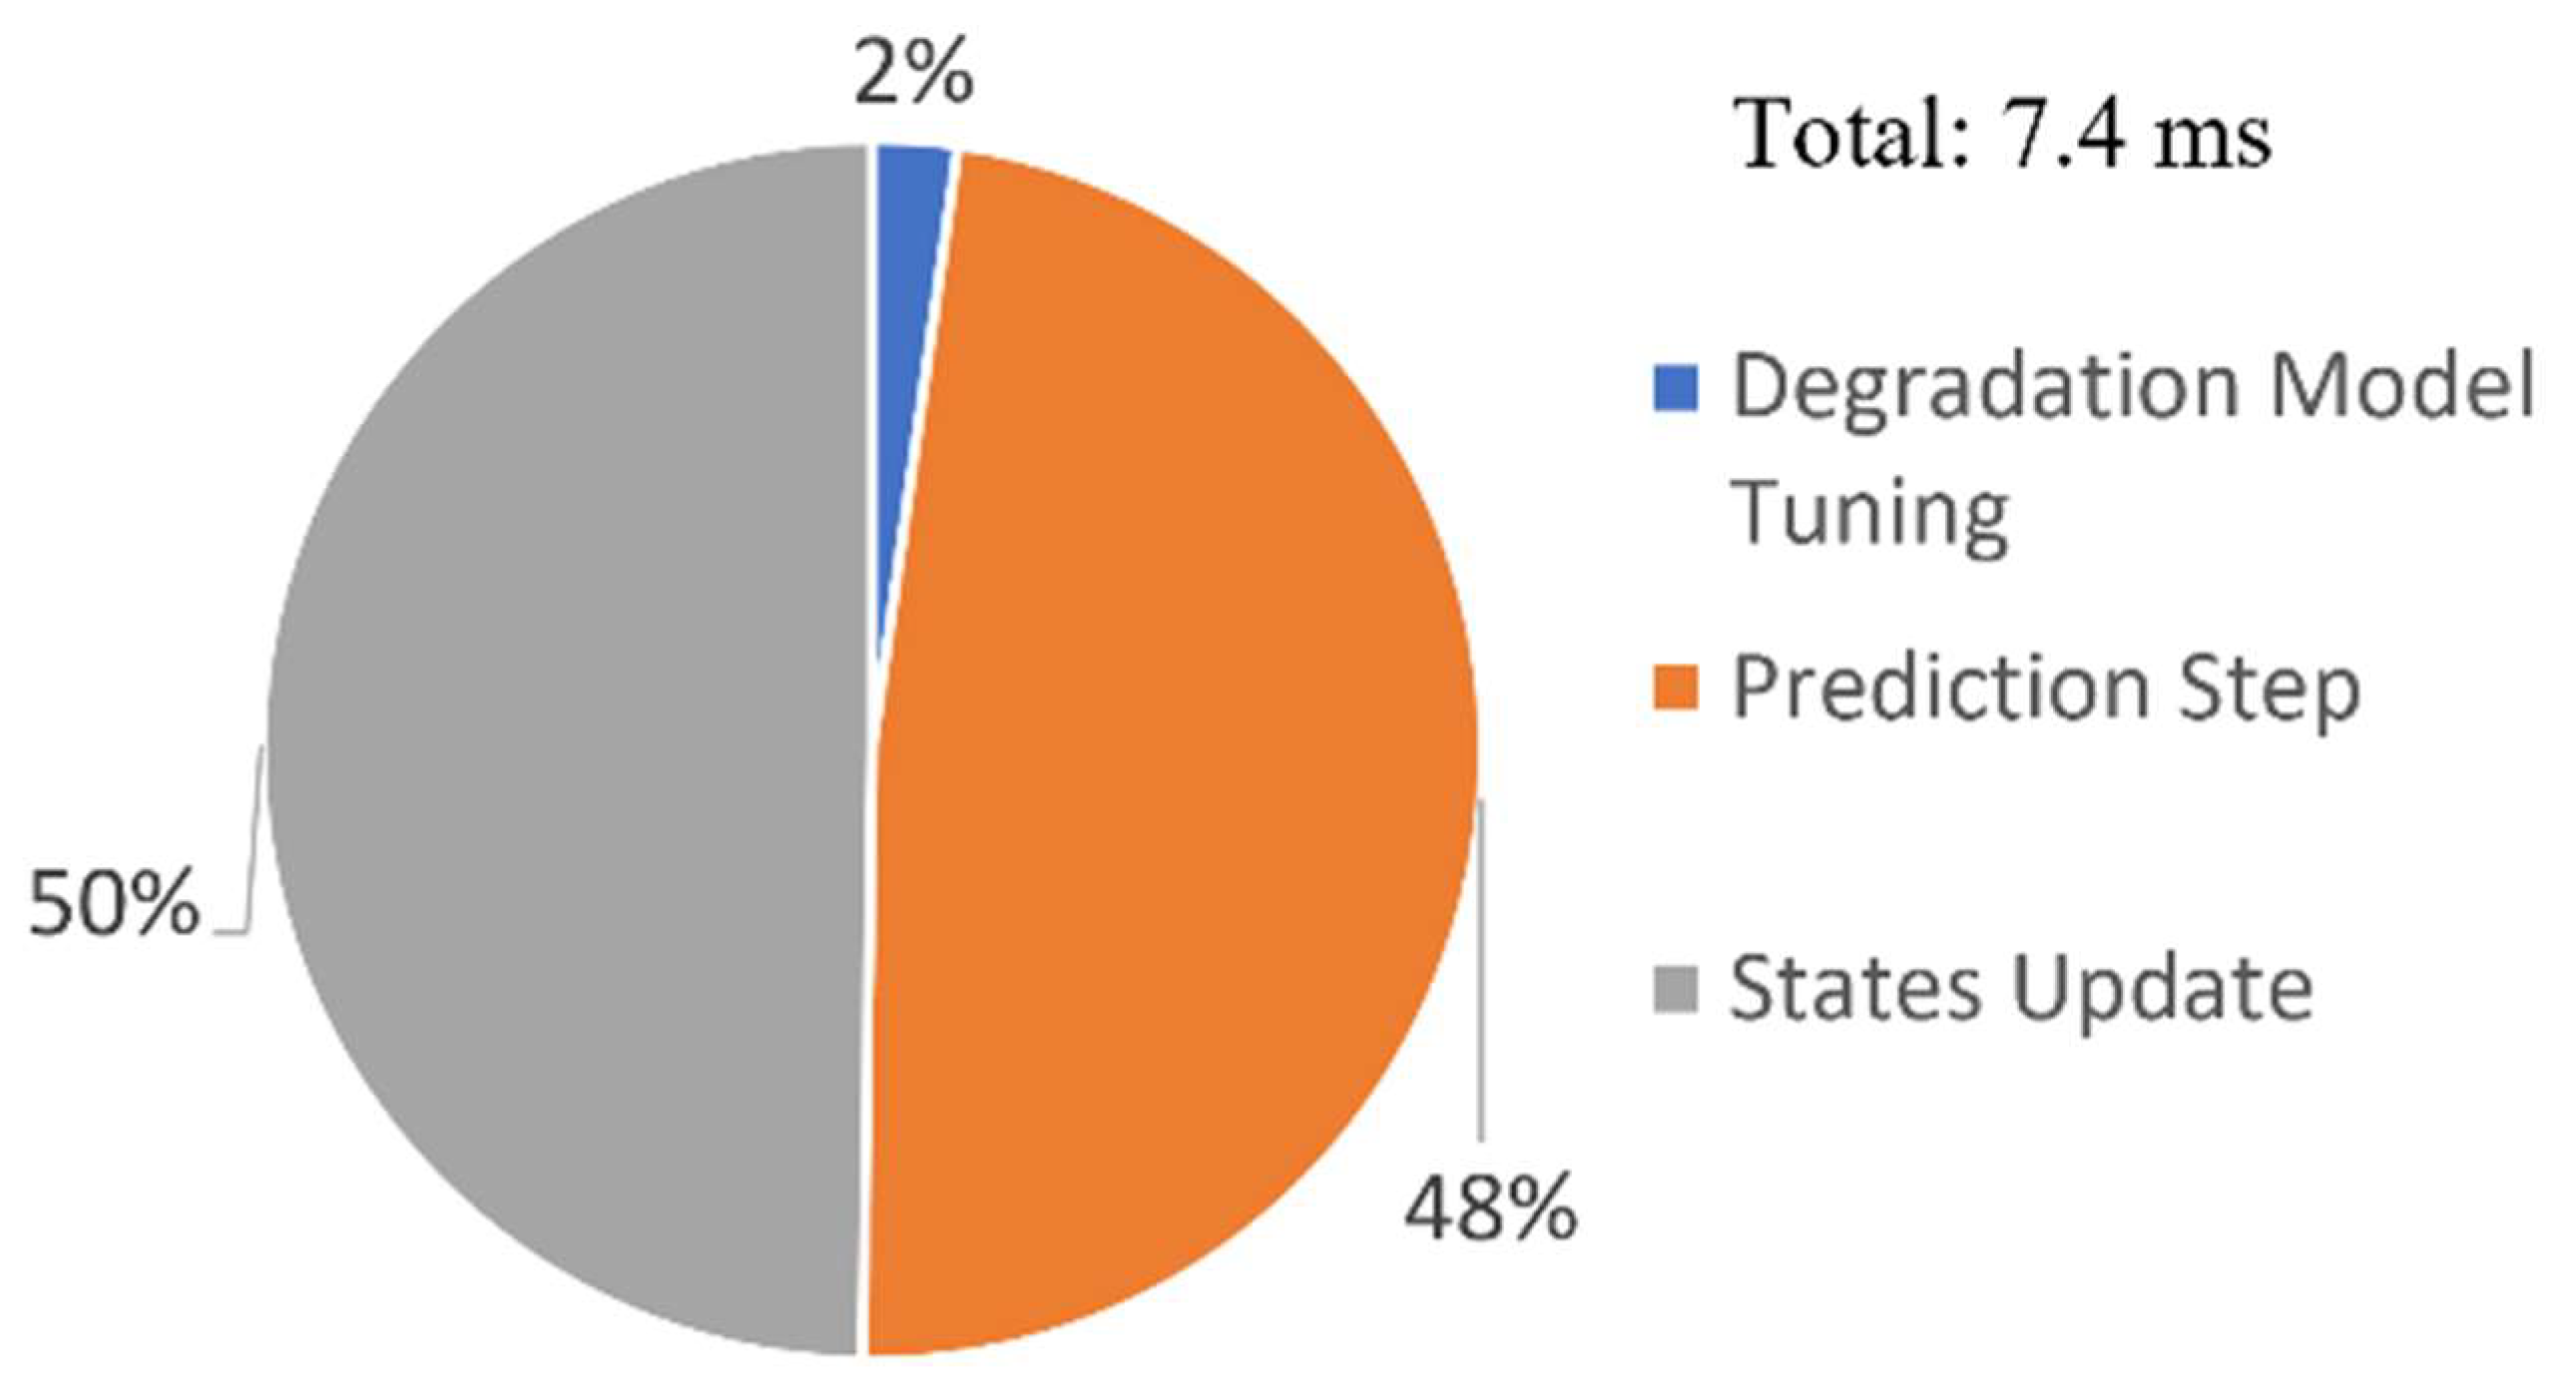
5.1. Implementation Targets

As stated in Section 4, the proposed PHM system works off-line with respect to the iron bird, analyzing data periodically; thus, no specific targets are set in terms of execution time of the algorithms. However, since the iron bird is meant to act as a technological demonstrator, it is useful to check whether the proposed algorithms are suitable for real-time applications. For this purpose, the PHM system employed in the GUI is embedded with a tool monitoring the computational performances of the PHM routines. Monitored activities include the execution time of the fault-diagnosis algorithm and of the failure-prognosis routine with its subroutine. Test conditions include the analysis of signals coming from three identical electromechanical actuators, two operating on a morphing winglet and one on the wingtip surface, for a total of 24 signals, sampled at 800 Hz, and 19 features, and downsampled at 80 Hz. The analysis was performed on an Intel Core i9-9880H CPU running at 2.30 GHz with 16 GB of DDR4 RAM, which was compatible with the performances of the HMSM and was conducted considering 200 degradation patterns, each comprehensive of a number ranging between 150 and 400 position/load sequences, which correspond to 25 degradation patterns for the seven considered faults and 25 simulation cycles performed in healthy conditions. The fault-detection algorithm completed the analysis of one data batch corresponding to advancement of a single time step in 11.3   ms . Such a result is compatible with the features sampling (80 Hz), hence suggesting that the feature extraction and fault-detection scheme is suitable for real-time applications. The same simulation cycles were also used to assess the computational performance of the long-term prognosis algorithm. As depicted in Figure 21, a single cycle of prediction and subsequent state updates of the particle-filtering routine requires 7.4   ms on the employed test machine, with the RLS algorithms responsible for the tuning of the degradation model accounting for the 2.25% of such a number. Such results were obtained for a particle-filtering scheme operating with 200 particles and are expected to scale almost linearly, increasing the number of particles.

5.2. Preliminary Evaluation of Prognostic Performances

The same simulated degradation patterns adopted for the evaluation of the execution time of the PHM algorithms were also used to evaluate the expected performances in terms of fault-detection metrics, fault classification (or misclassification) rates, convergence of the long-term prognosis, and expected accuracy of the RUL estimate. Results are provided below and divided between those pertaining to the fault diagnosis and those pertaining to the failure prognosis.

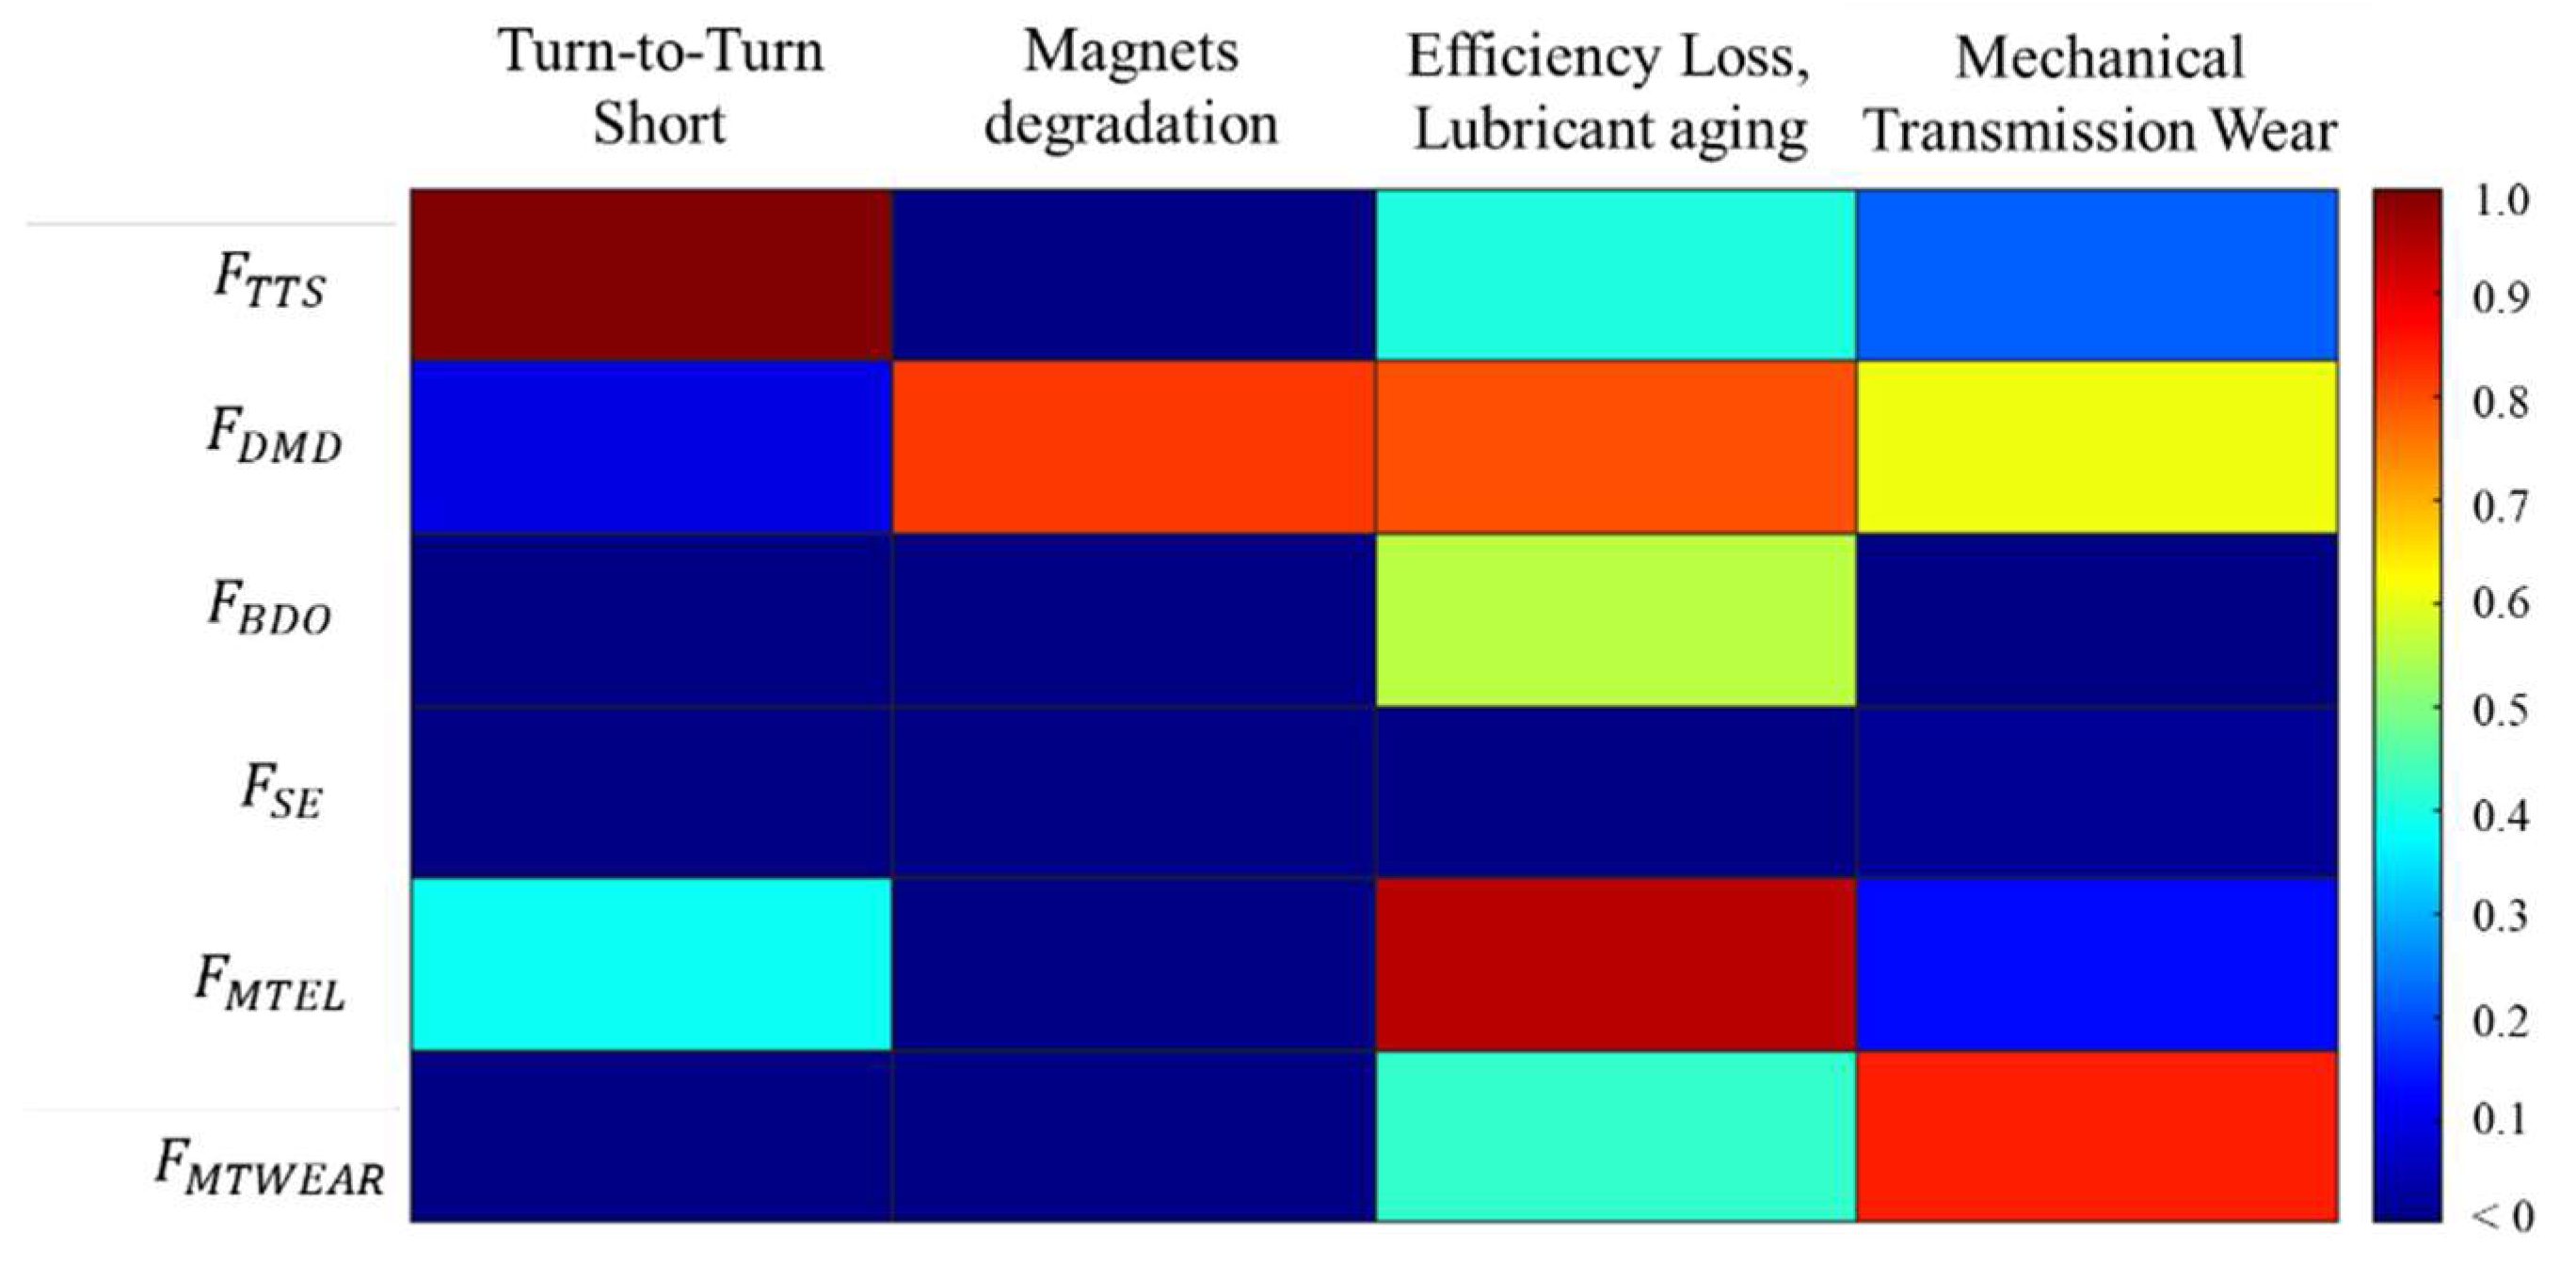
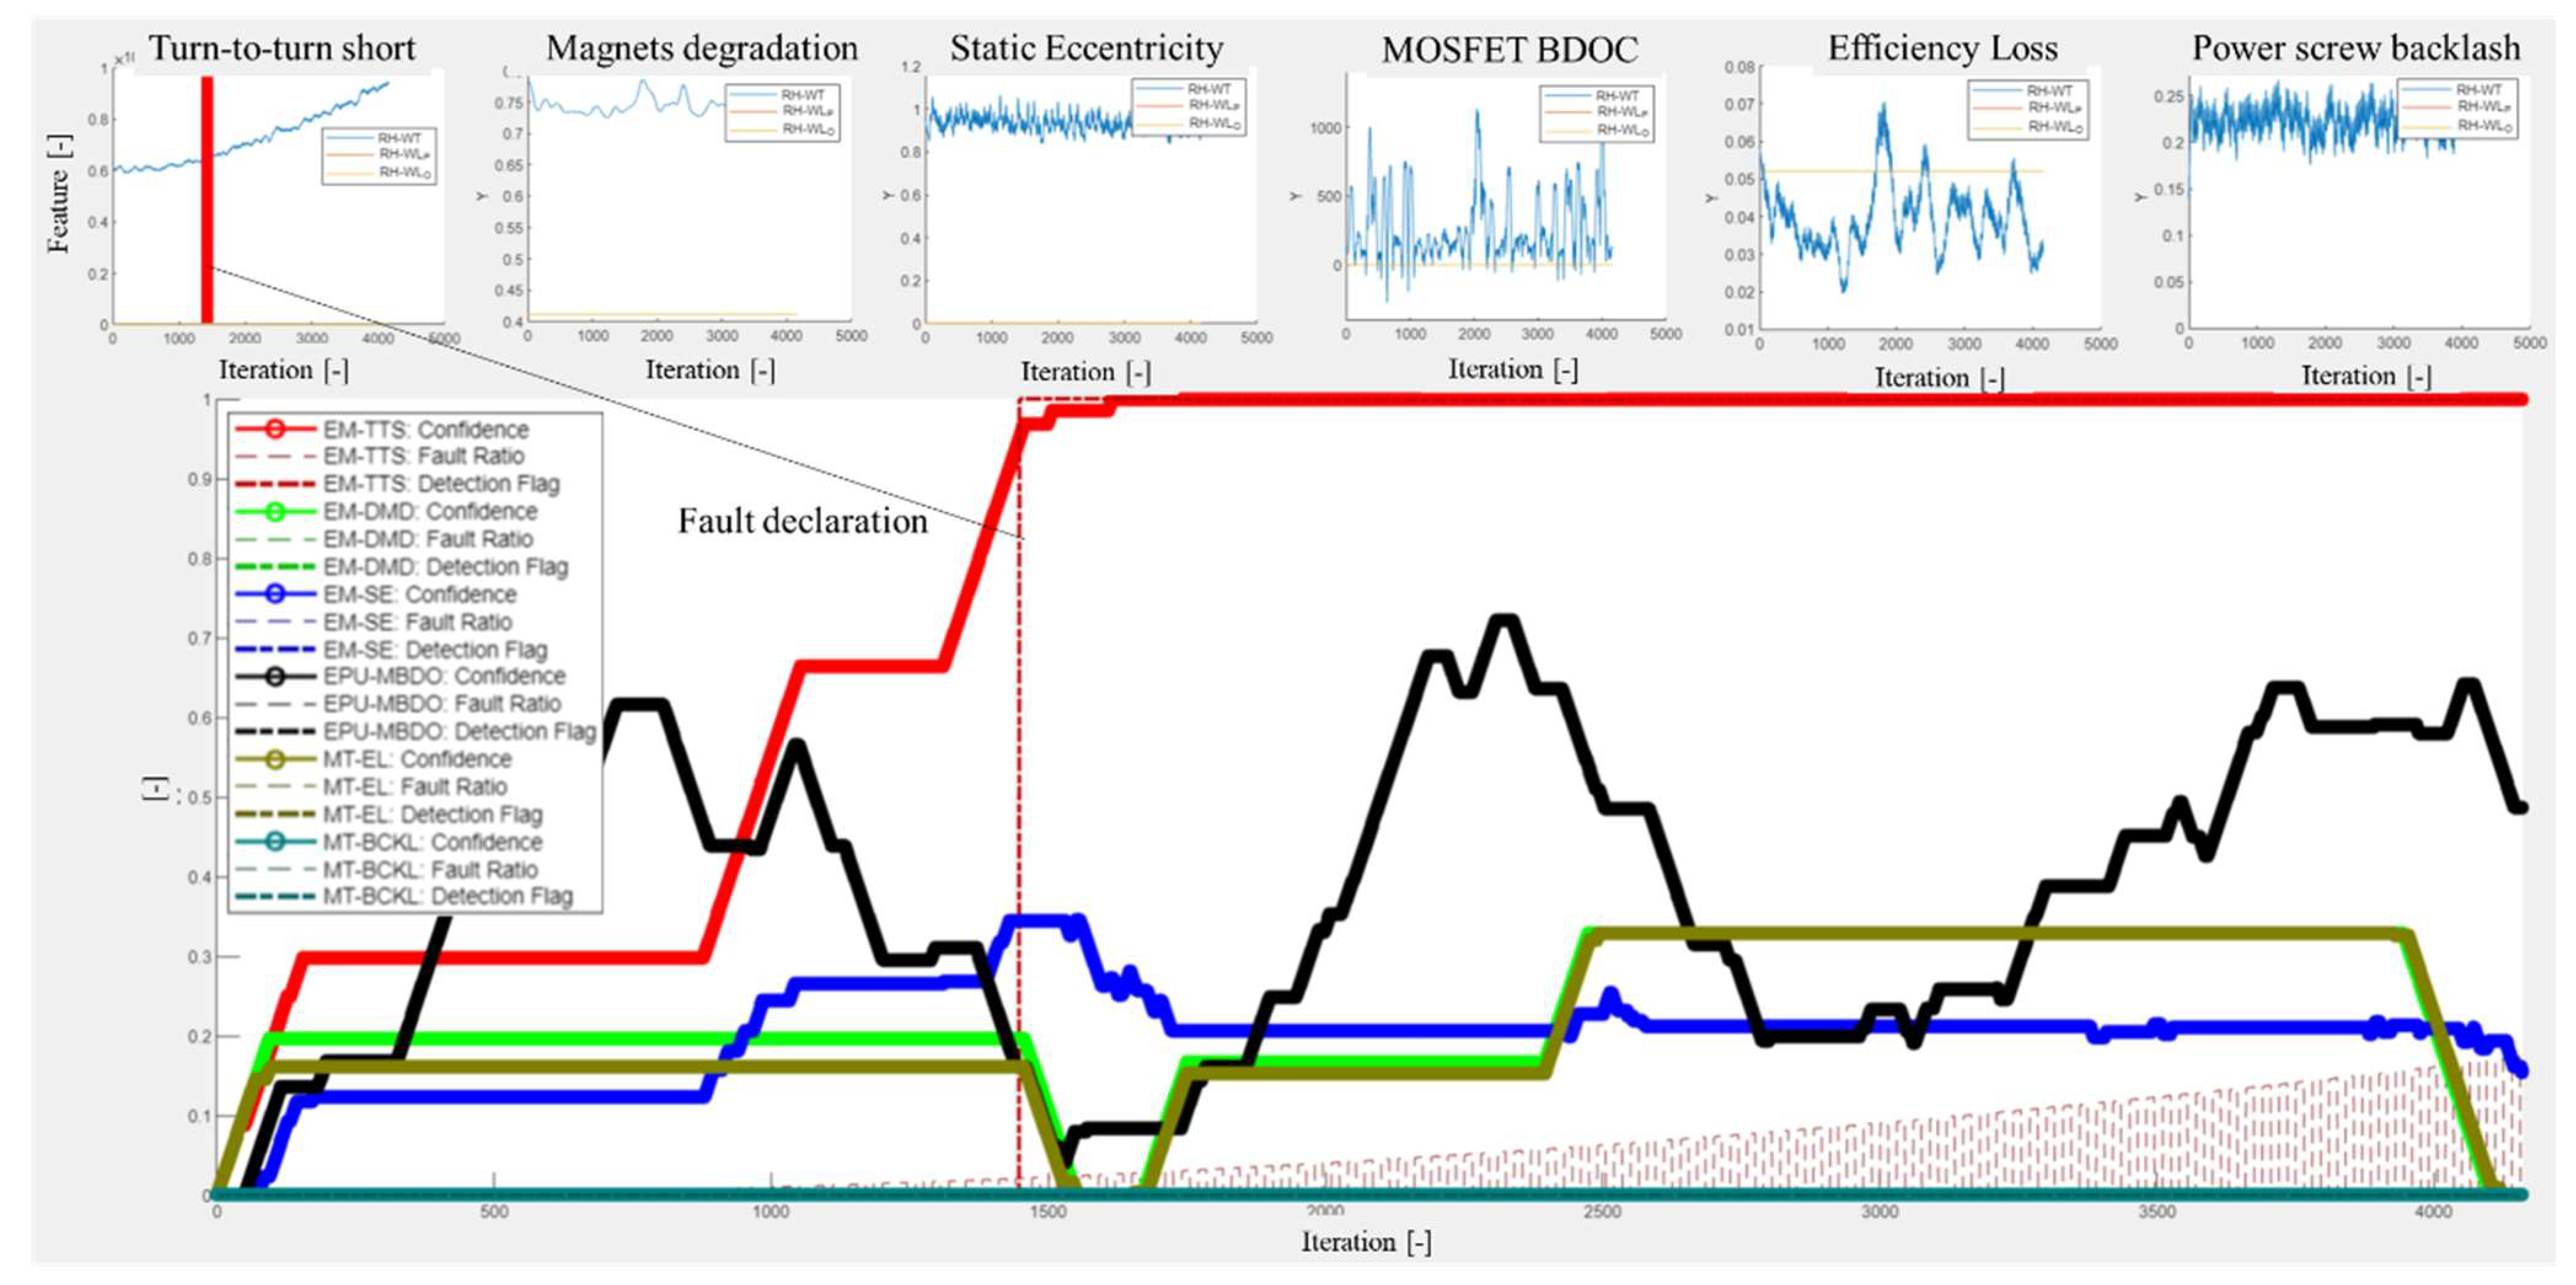
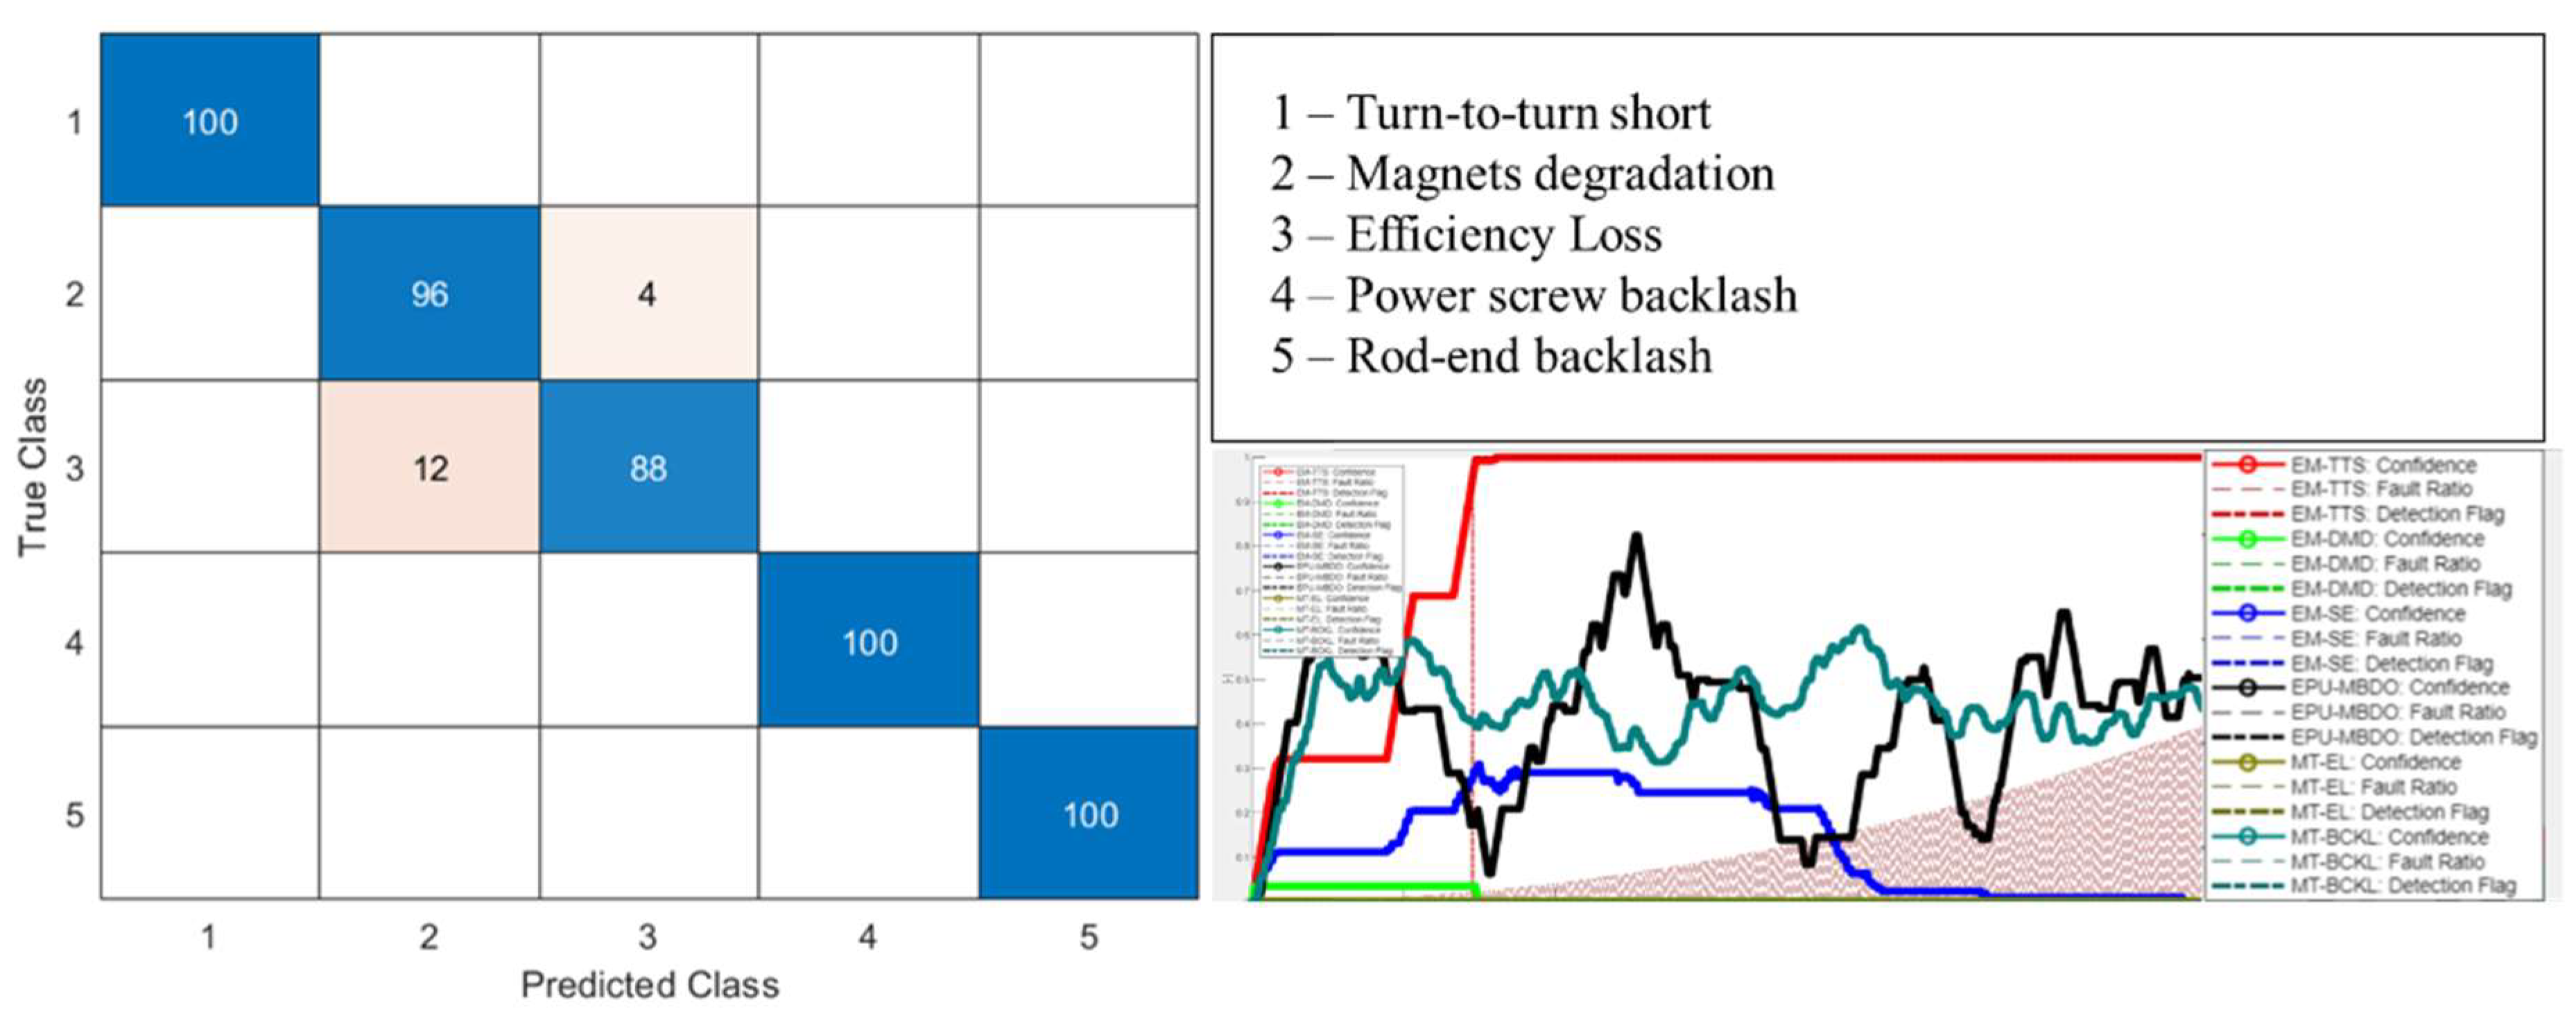
5.2.1. Fault Diagnosis

The fault-diagnosis routine is at first tested against the database of 25 simulation cycles representative of health conditions to check for the eventual occurrence of false alarms. As anticipated, such a database is built considering the expected distribution of actuator parameters, such as geometrical quantities, physical properties, and according to production tolerances. Similarly, temperature variations, load, and command histories are also randomly drawn from probability distributions representative of the expected operative conditions. Under such a hypothesis, the fault-detection algorithm provided no false alarms. The fault diagnosis was then employed to detect and classify the faults affecting the simulated dataset, achieving the results depicted in Figure 22, where the classification rate is expressed in percentage. Under the assumption of just one failure mode occurring at any time, consistent with the objectives of the technological demonstrator, the fault-diagnosis algorithm provides acceptable results, with misclassification occurring only between the efficiency loss and magnet degradation failure modes. In particular, 4% of the cases associated with the occurrence of magnet degradation were incorrectly classified as efficiency losses within the mechanical transmission, while the opposite situation occurred for 12% of the simulated efficiency losses patterns. No misclassifications were observed for the other failure modes, although this result is probably skewed by the absence of possible concurrent degradation modes.

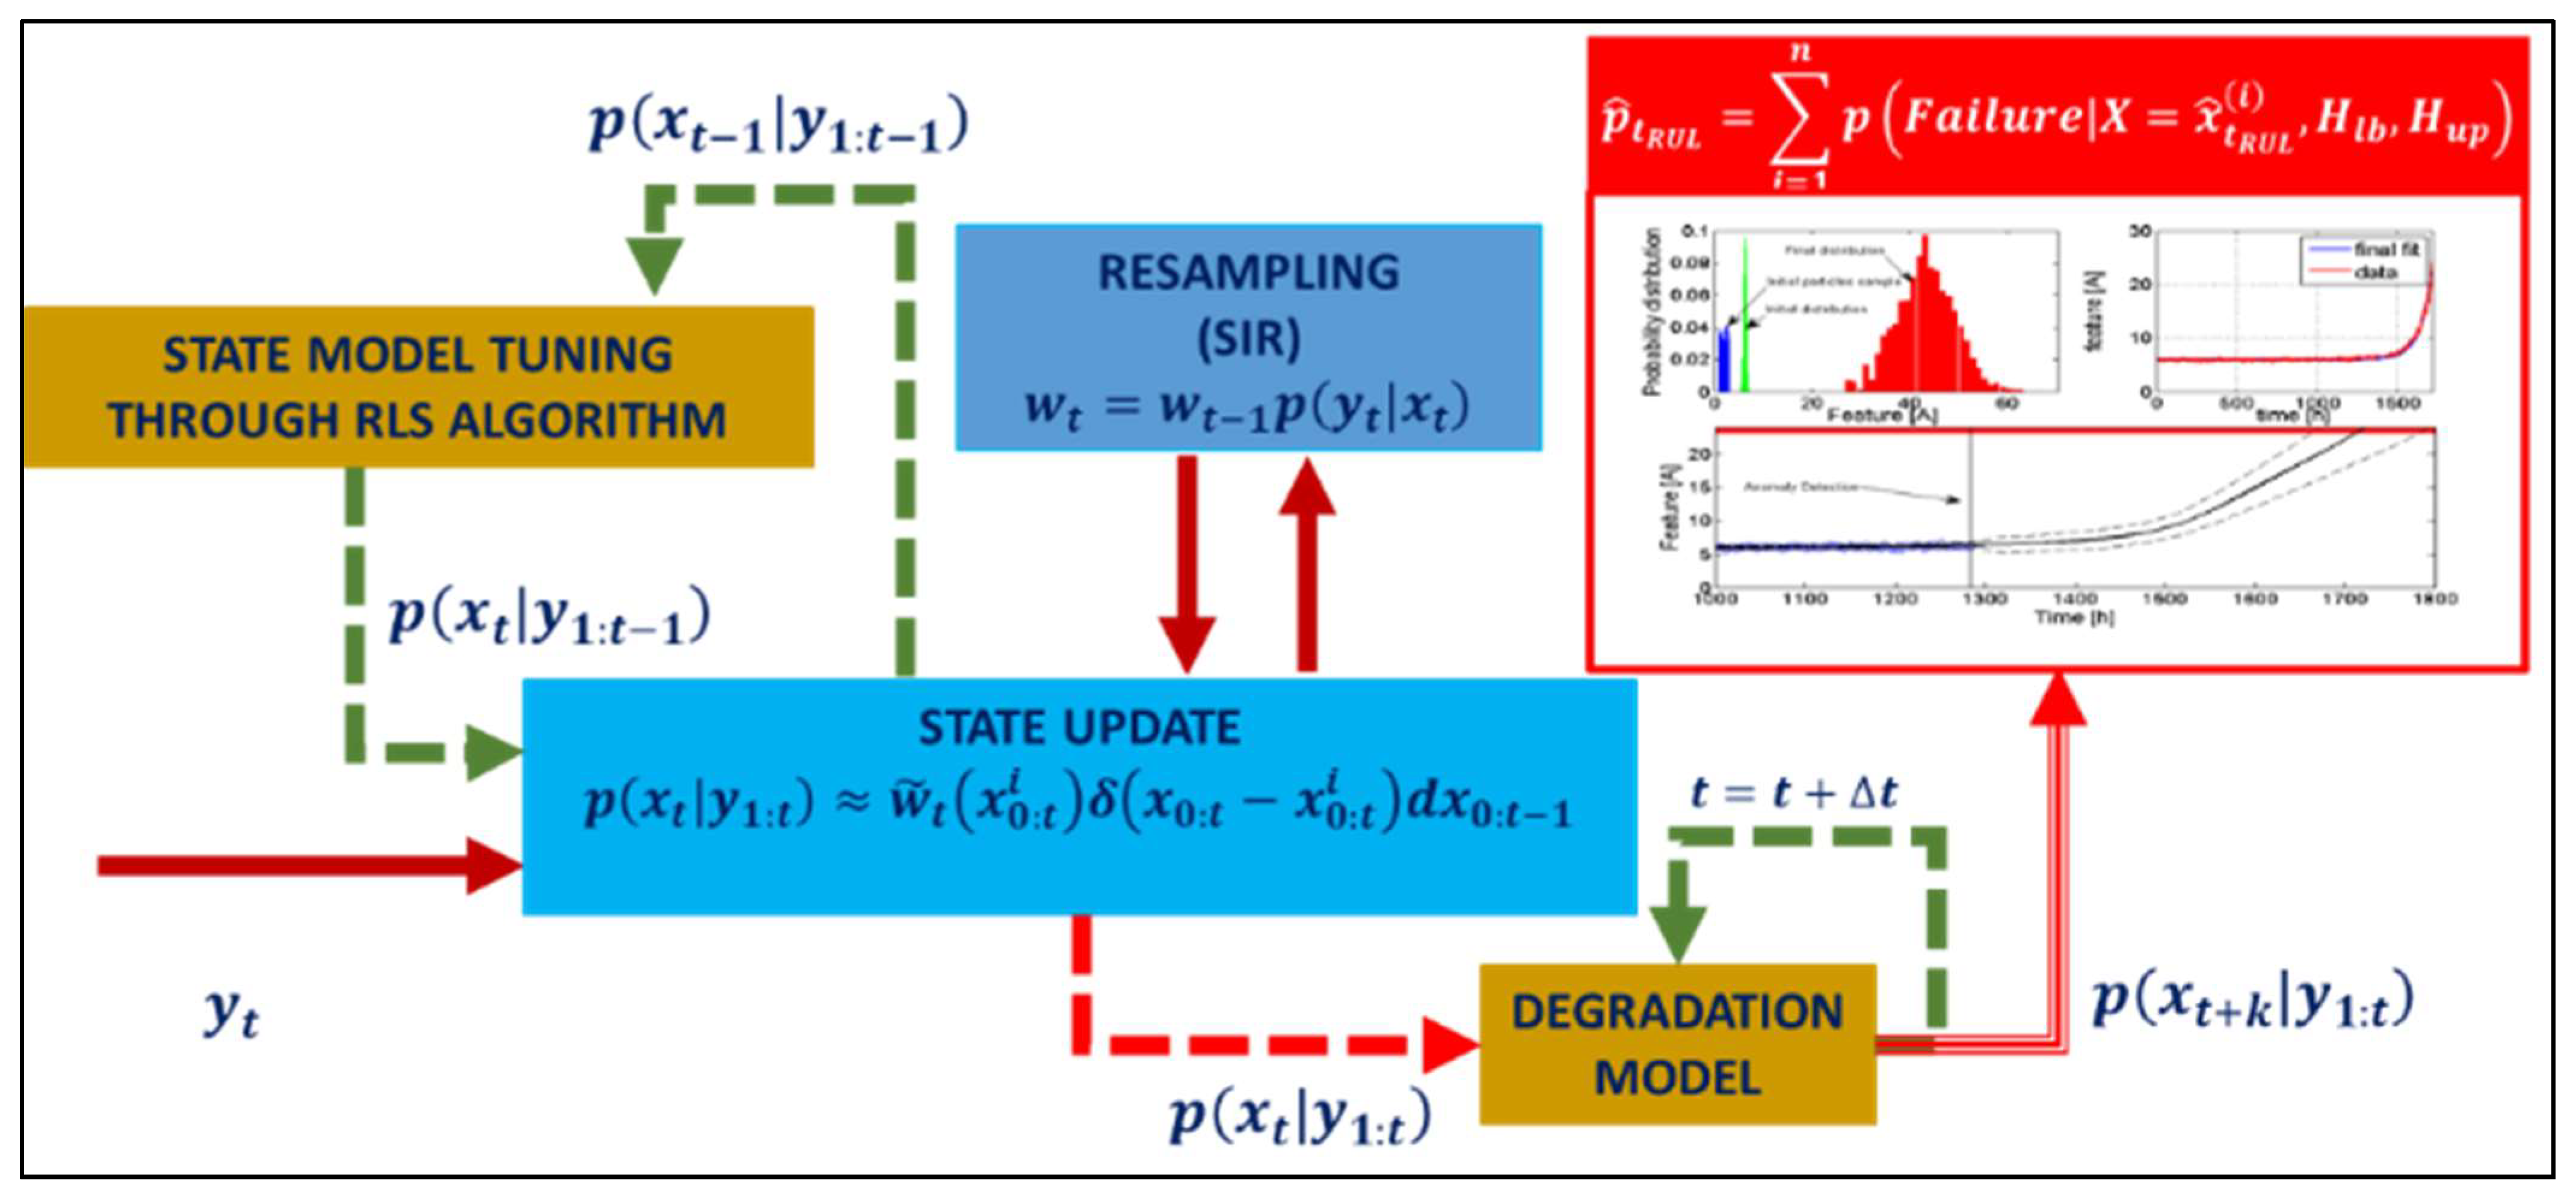
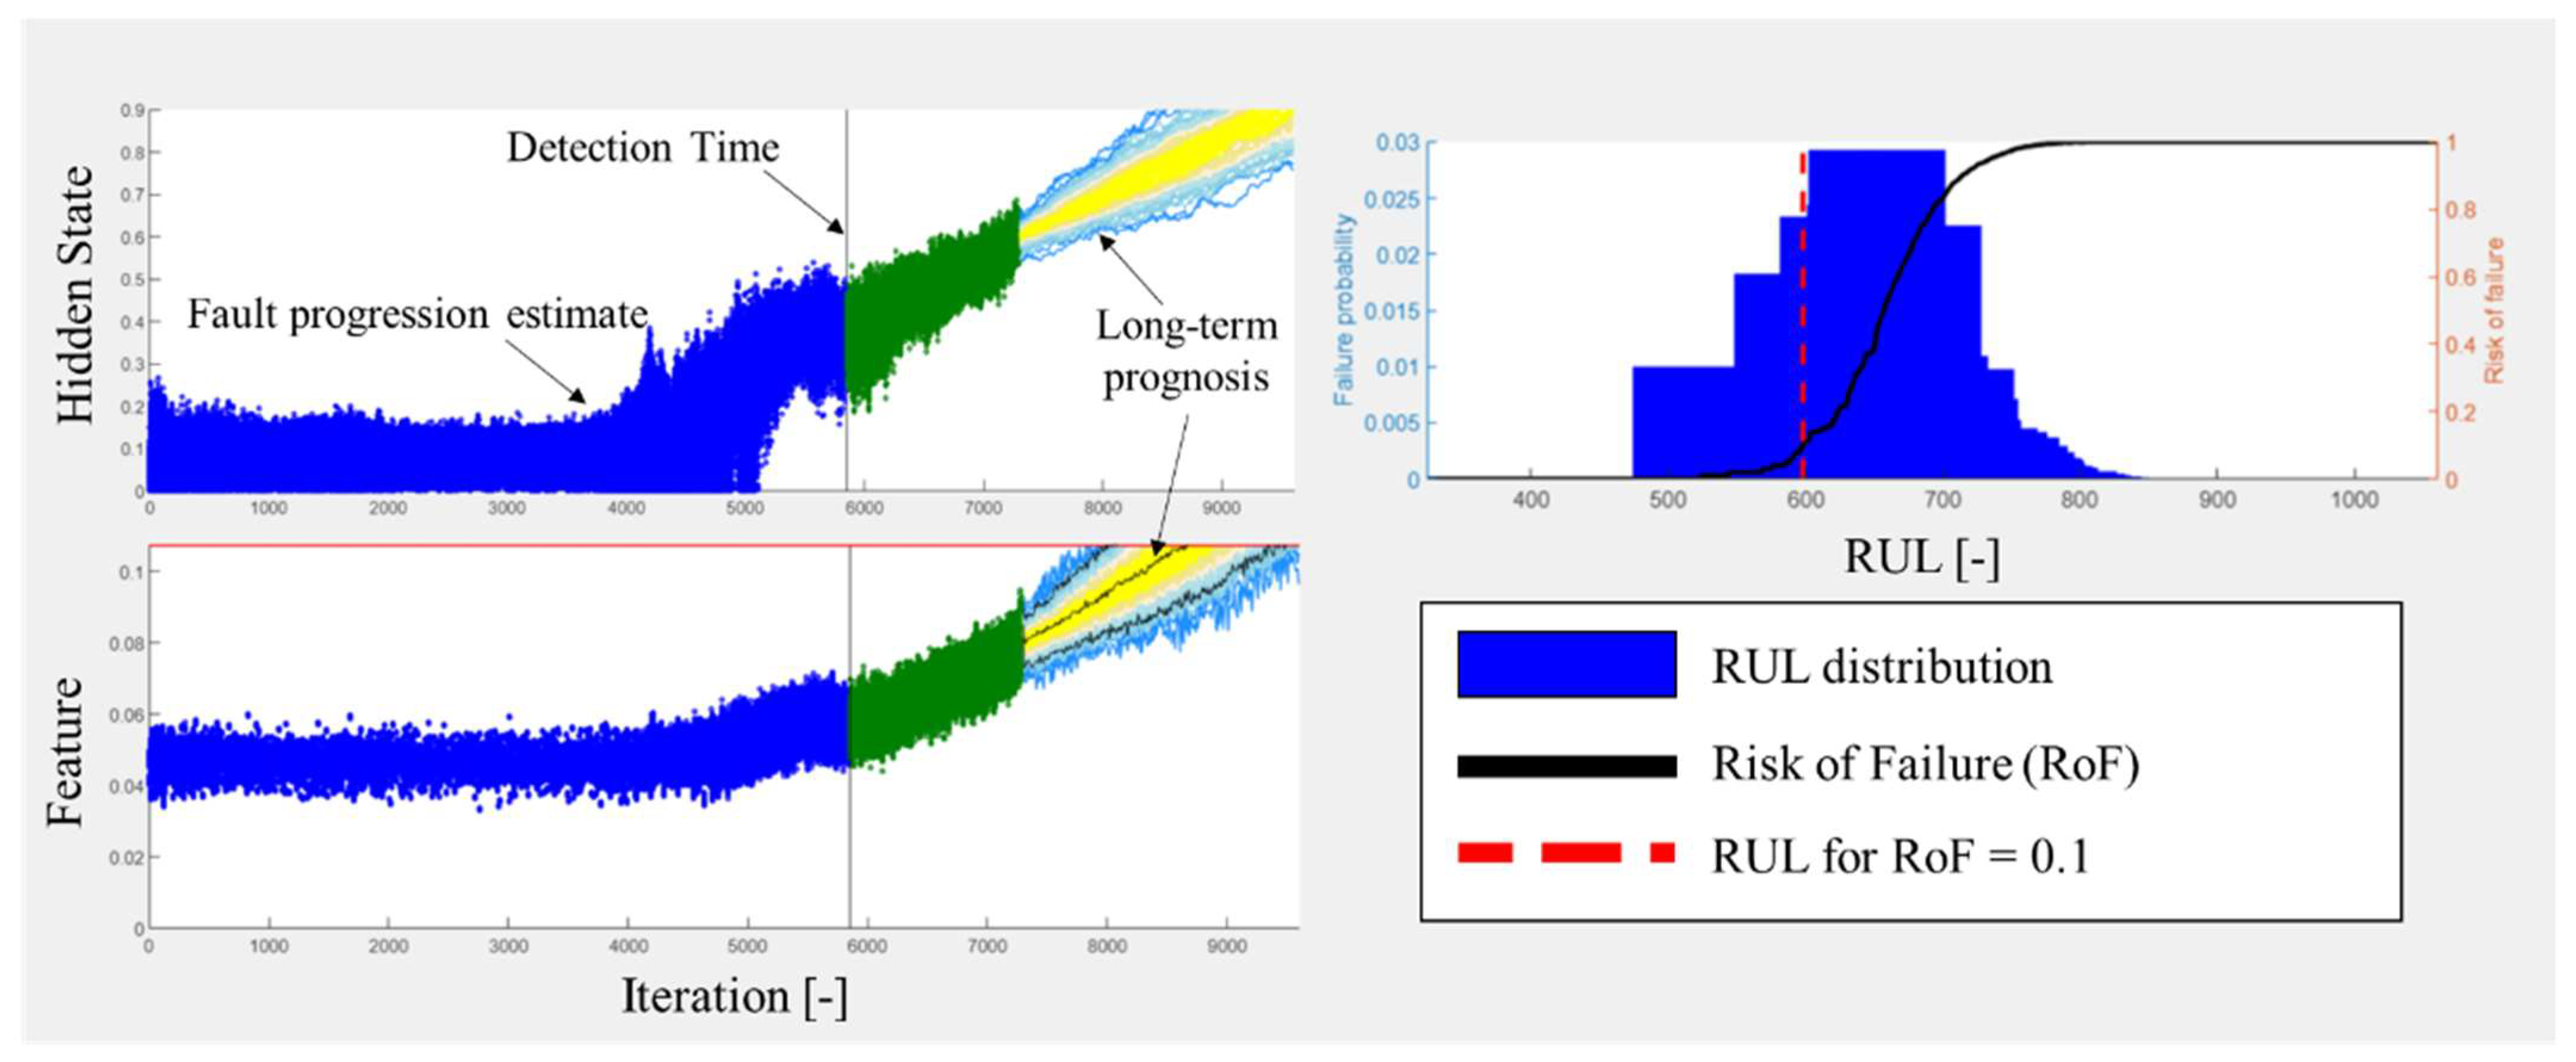
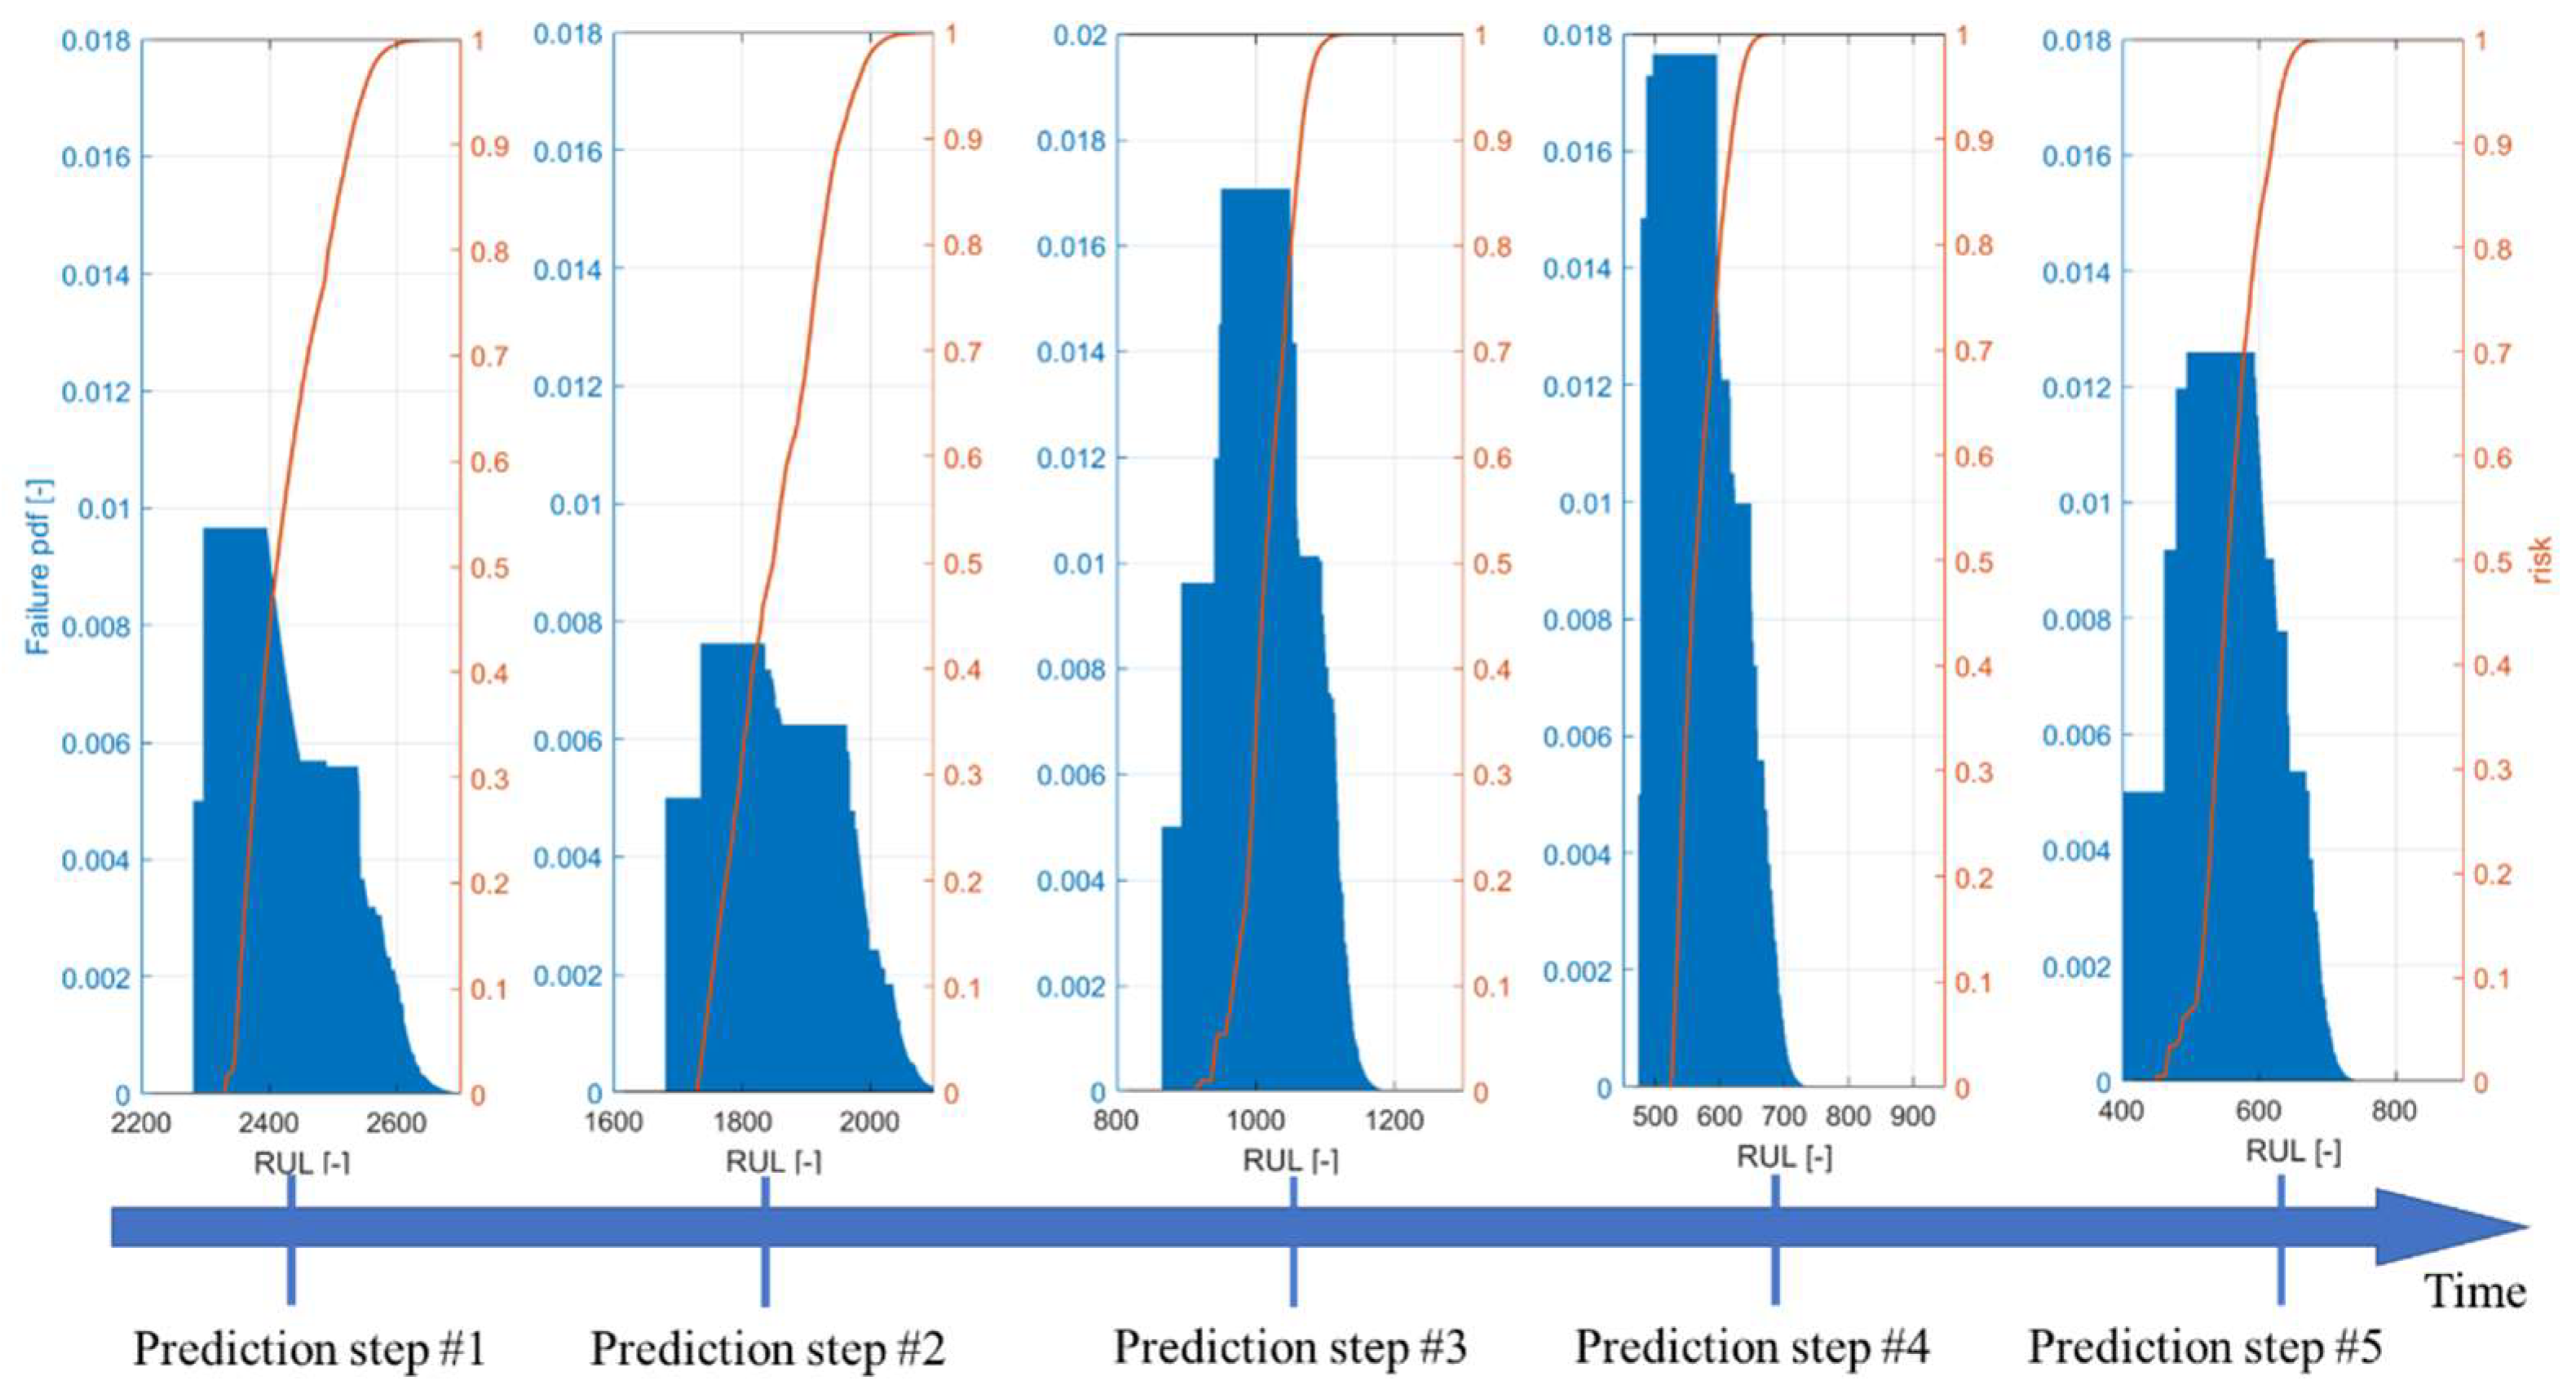
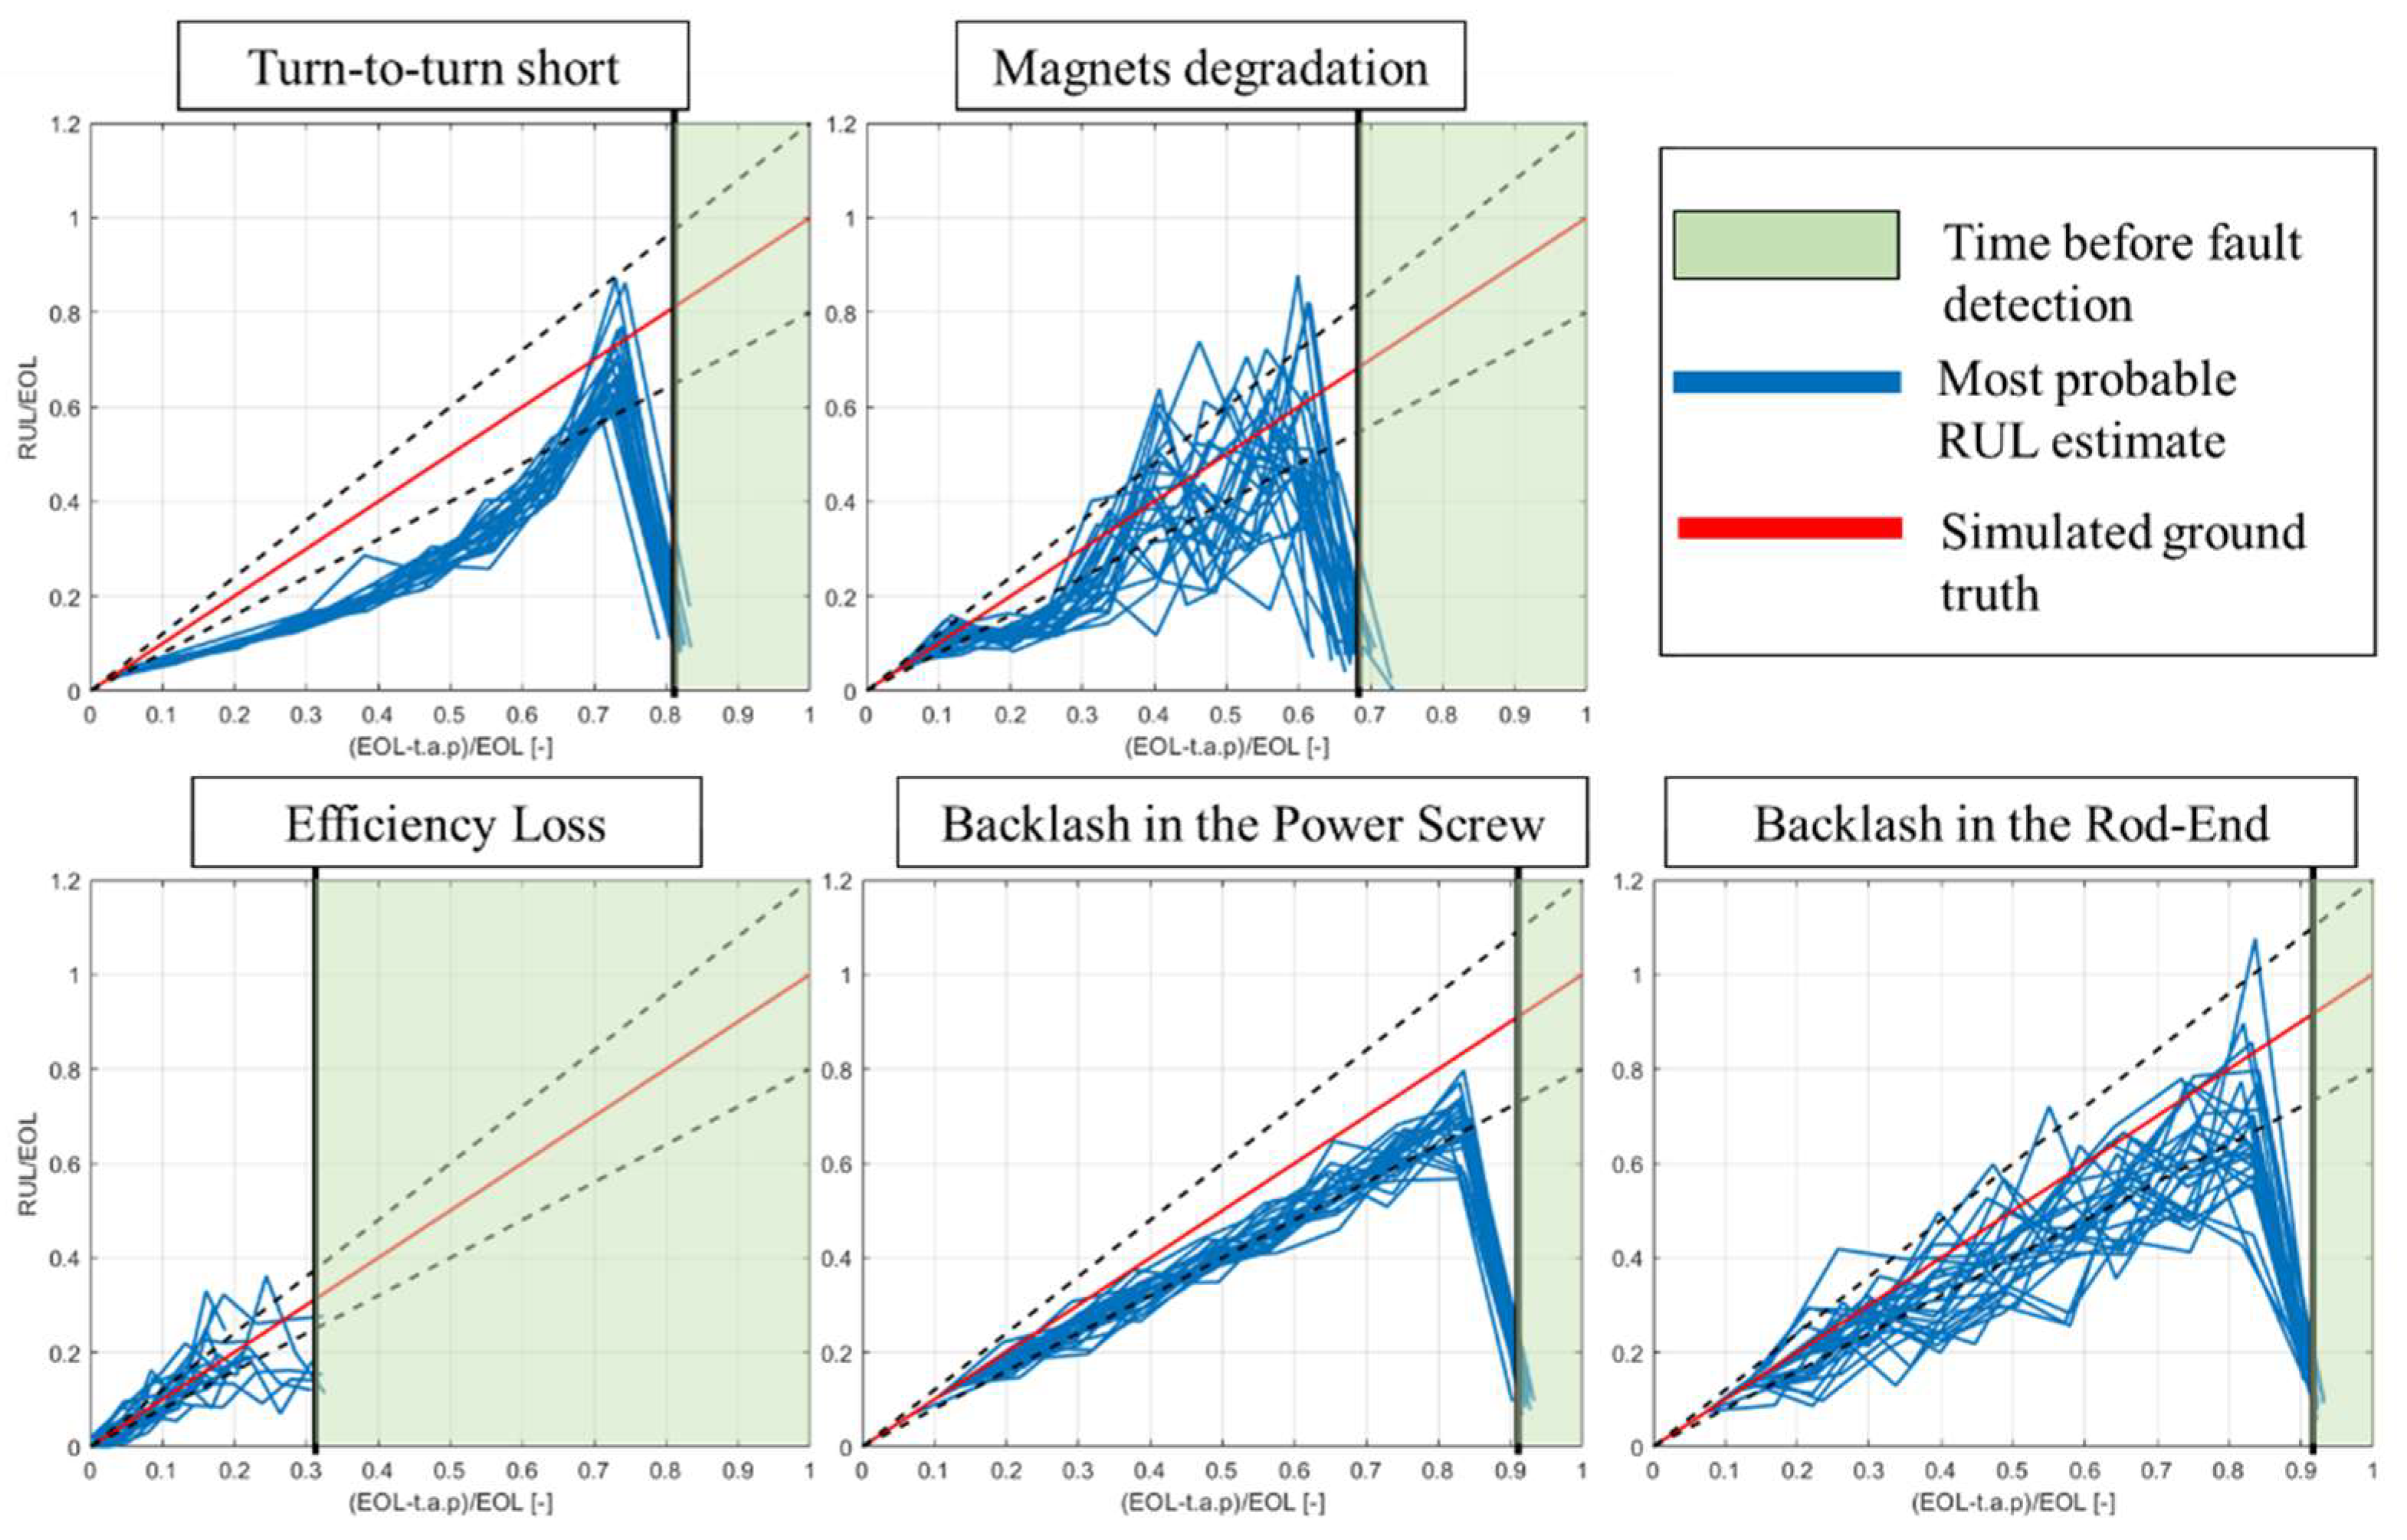
5.2.2. Failure Prognosis

The failure prognosis behavior is studied through the algorithm response to the 175 simulated degradation patterns previously described and analyzed to check their convergence to the simulated ground truth and its expected performances in terms of nondimensional Prognostic Horizon and mean accuracy metrics [48]. Figure 23 depicts the prediction trajectories associated with the most probable RUL estimate for each prediction step of each degradation pattern, comparing their behavior against the simulated ground truth. It can be observed that all the considered failure modes converge toward the ground-truth solution, although with different patterns and different performances.
In particular, the RUL associated with a turn-to-turn short is often underestimated with respect to the ground truth. Although suboptimal, such a result is still positive, since it would cause, at worst, a slight anticipation of the maintenance action. On the other hand, the remaining investigated failure modes all fare well, quickly converging within an uncertainty cone equal to ± 20 % of the ground-truth RUL value.
The first prediction step, that is the one performed right after the fault detection, is affected by significant uncertainty and provides the less accurate results. Such behavior is expected, since the initial parameters of the degradation models employed within the particle-filtering routines are first-trial values for the first prediction step, with the tuning process requiring more data to converge to the ongoing degradation process. Results are also analyzed according to two traditional metrics, the Prognostic Horizon and the average accuracy [48], and reported in Table 2. The Prognostic Horizon is defined as the remaining useful life for which the most probable RUL estimate falls, and remains, within a certain accuracy threshold. Since the results pertain forcefully to accelerated degradation and not to a naturally evolving one, such a metric is provided as a nondimensional value over the simulated lifetime of the equipment for each considered failure mode. All the results are the average obtained for the considered degradation patterns.
Overall, results are encouraging for long-lasting degradations, where high values of PH and good accuracy levels are observed. The low scores associated with the turn-to-turn failure mode denounce a lower level of accuracy associated with the prediction, but as already underlined, such a result is due to an underestimation of the RUL, which is less critical than an overestimation. Similarly, results for the efficiency loss are suboptimal in terms of the Prognostic Horizon. Such degradation is, however, a slowly evolving process requiring hundreds of flight hours; thus, the results still provide sufficient time to issue an early warning and plan the due maintenance accordingly.

6. Conclusions

The CleanSky 2/Astib research program was launched with the objective of building an iron bird for a new regional transport platform acting as a demonstrator for new technologies such as fully electrical flight-control systems and the definition of a PHM system. This paper detailed the activities performed to support the definition of such a PHM system, starting from a high-fidelity representation of the involved subsystems, then transitioning to a real-time representation to support both the implementation of such models within the iron bird and the rapid generation of a simulated dataset to study the behavior of the case study in both nominal and degraded health conditions. A PHM framework is proposed based on a simple data-driven routine to perform fault detection, an SVM for fault classification, and a particle-filtering routine with auto-tuning, and time-variant degradation models. Such a system was then stressed with several simulated degradation patterns to test the algorithm’s readiness to be deployed on the iron bird and its expected performances. Results are encouraging, as the algorithm is suitable for installation on board the technological demonstrator and its expected performances are coherent with the target of the research project. Future work will include the verification of the algorithm behavior in response to flight cycles simulated on the iron bird, which will allow stressing the PHM framework with a widely varying set of maneuvers and include in the analysis the effect of pilot-induced compensations on the fault evolution in time. Outside the scope of the research project, but of significant interest for further research, is the study of the effect of different concurring degradations and their effect on the PHM routines.

Author Contributions

Conceptualization, A.C.B., A.D.M., G.J. and M.S.; methodology, A.C.B., A.D.M., G.J. and M.S.; software, A.C.B. and A.D.M.; validation, A.C.B. and A.D.M.; formal analysis, A.C.B. and A.D.M.; investigation, A.C.B. and A.D.M.; resources, A.C.B. and A.D.M.; data curation, A.C.B. and A.D.M.; writing—original draft preparation, A.C.B. and A.D.M.; writing—review and editing, A.C.B., A.D.M., G.J. and M.S.; visualization, A.C.B. and A.D.M.; supervision, G.J. and M.S.; project administration, G.J. and M.S.; funding acquisition, G.J. and M.S. All authors have read and agreed to the published version of the manuscript.

Funding

The research work presented in this paper was performed within the ASTIB research project, which has received funding from the Clean Sky 2 Joint Undertaking under the European Union’s Horizon 2020 research and innovation program under grant agreement CSJU—GAM REG 2014–2015.

Data Availability Statement

Data sharing is not applicable to this article.

Conflicts of Interest

The authors declare no conflict of interest. The funders had no role in the design of the study; in the collection, analyses, or interpretation of data; in the writing of the manuscript, or in the decision to publish the results.

References

  1. Vachtsevanos, G.; Lewis, F.; Roemer, M.; Hess, A.; Wu, B. Intelligent Fault Diagnosis and Prognosis for Engineering Systems; John Wiley & Sons, Inc.: Hoboken, NJ, USA, 2006; ISBN 9780470117842. [Google Scholar]
  2. Brown, D.W.; Georgoulas, G.; Bole, B.M. Prognostics Enhanced Reconfigurable Control of Electro-Mechanical Actuators. In Proceedings of the Annual Conference of the Prognostics and Health Management Society, PHM 2009, San Diego, CA, USA, 27 September–1 October 2009. [Google Scholar]
  3. Balchanos, M.; Mavris, D.; Brown, D.W.; Georgoulas, G.; Vachtsevanos, G. Incipient failure detection: A particle filtering approach with application to actuator systems. In Proceedings of the 2017 13th IEEE International Conference on Control & Automation (ICCA), Ohrid, Macedonia, 3–6 July 2017; pp. 64–69. [Google Scholar] [CrossRef]
  4. Ismail, M.A.; Windelberg, J.; Bierig, A.; Spangenberg, H. A potential study of prognostic-based maintenance for primary flight control electro-mechanical actuators. In Proceedings of the Recent Advances in Aerospace Actuation Systems and Components, Toulouse, France, 16–18 March 2016; pp. 193–200. [Google Scholar]
  5. Dalla Vedova, M.D.L.; Germanà, A.; Berri, P.C.; Maggiore, P. Model-Based Fault Detection and Identification for Prognostics of Electromechanical Actuators Using Genetic Algorithms. Aerospace 2019, 6, 94. [Google Scholar] [CrossRef] [Green Version]
  6. Autin, S.; De Martin, A.; Jacazio, G.; Socheleau, J.; Vachtsevanos, G. Results of a Feasibility Study of a Prognostic System for Electro-Hydraulic Flight Control Actuators. Int. J. Progn. Health Manag. 2020, 12, 1–18. [Google Scholar] [CrossRef]
  7. Balaban, E.; Saxena, A.; Narasimhan, S.; Roychoudhury, I.; Goebel, K.F.; Koopmans, M.T. Airborne electro-mechanical actuator test stand for development of prognostic health management systems. Annu. Conf. Progn. Health Manag. Soc. PHM 2010, 2. Available online: https://papers.phmsociety.org/index.php/phmconf/article/view/1804 (accessed on 25 February 2023).
  8. Bertolino, A.C.; De Martin, A.; Jacazio, G.; Sorli, M. A technological demonstrator for the application of PHM techniques to electro-mechanical flight control actuators. In Proceedings of the 2022 IEEE International Conference on Prognostics and Health Management (ICPHM), Detroit, MI, USA, 6–8 June 2022; pp. 70–76. [Google Scholar] [CrossRef]
  9. Li, D.; Lin, M.; Tian, L. Design of iron bird for a regional jet aircraft. Proc. Inst. Mech. Eng. Part G J. Aerosp. Eng. 2020, 234, 681–688. [Google Scholar] [CrossRef]
  10. Spangenberg, H.; Friehmelt, H. Hardware-in-the-loop simulation with flight control actuators. In Proceedings of the Collection of Technical Papers—AIAA Modeling and Simulation Technologies Conference 2005, Grapevine, TX, USA, 9–13 January 2017; Volume 1, pp. 614–622. [Google Scholar]
  11. Blasi, L.; Borrelli, M.; D’amato, E.; Di Grazia, L.E.; Mattei, M.; Notaro, I. Modeling and control of a modular iron bird. Aerospace 2021, 8, 39. [Google Scholar] [CrossRef]
  12. Jensen, S.C.; Jenney, G.D.; Dawson, D. Flight test experience with an electromechanical actuator on the F-18 Systems Research Aircraft. In Proceedings of the 19th DASC. 19th Digital Avionics Systems Conference, Philadelphia, PA, USA, 7–13 October 2000. [Google Scholar] [CrossRef]
  13. Malisani, S.; Capello, E.; Guglieri, G. Development of a flight mechanics simulation computer based on a flexible aircraft model for a regional aircraft. IOP Conf. Ser. Mater. Sci. Eng. 2021, 1024, 012066. [Google Scholar] [CrossRef]
  14. Chiavaroli, P.; De Martin, A.; Evangelista, G.; Jacazio, G.; Sorli, M. Real Time Loading Test Rig for Flight Control Actuators Under PHM Experimentation. In Proceedings of the ASME International Mechanical Engineering Congress and Exposition, Proceedings (IMECE), Pittsburgh, PA, USA, 9–15 November 2018; Volume 1, p. V001T03A032. [Google Scholar] [CrossRef]
  15. SAE-AIR8012; Prognostics and Health Management Guidelines for Electro-Mechanical Actuators. HM-1 Integrated Vehicle Health Management Committee, 2020. Available online: https://saemobilus.sae.org/content/air8012 (accessed on 25 February 2023). [CrossRef]
  16. De Martin, A.; Jacazio, G.; Vachtsevanos, G. Windings Fault Detection and Prognosis in Electro-Mechanical Flight Control Actuators Operating in Active-Active Configuration. Int. J. Progn. Health Manag. 2017, 8, 1–13. [Google Scholar] [CrossRef]
  17. Moosavi, S.S.; Djerdir, A.; Amirat, Y.A.; Khaburi, D.A. Demagnetization fault investigation in permanent magnet synchronous motor. In Proceedings of the 5th Annual International Power Electronics, Drive Systems and Technologies Conference (PEDSTC 2014), Tehran, Iran, 5–6 February 2014; pp. 617–623. [Google Scholar] [CrossRef]
  18. Wang, C.; Delgado Prieto, M.; Romeral, L.; Chen, Z.; Blaabjerg, F.; Liu, X. Detection of Partial Demagnetization Fault in PMSMs Operating under Nonstationary Conditions. IEEE Trans. Magn. 2016, 52, 1–4. [Google Scholar] [CrossRef] [Green Version]
  19. Kastha, D.; Bose, B.K. Investigation of fault modes of voltage-fed inverter system for induction motor drive. In Proceedings of the Conference Record of the 1992 IEEE Industry Applications Society Annual Meeting, Houston, TX, USA, 4–9 October 1992; pp. 858–866. [Google Scholar] [CrossRef]
  20. Khanniche, M.S.; Mamat-Ibrahim, M.R. Fault Detection and Diagnosis of 3-Phase Inverter System. Rev. Energ. Ren. Power Eng. 2001, 1, 69–75. [Google Scholar]
  21. Bertolino, A.C.; De Martin, A.; Fasiello, F.; Mauro, S.; Sorli, M. A simulation study on the effect of lubricant ageing on ball screws behaviour. In Proceedings of the 2022 International Conference on Electrical, Computer, Communications and Mechatronics Engineering (ICECCME), Maldives, Maldives, 16–18 November 2022; pp. 16–18. [Google Scholar]
  22. García-Martínez, M.; García de Blas Villanueva, F.J.; Valles González, M.P.; Pastor Muro, A. Failure analysis of the rod-end bearing of an actuating cylinder. Eng. Fail. Anal. 2019, 104, 292–299. [Google Scholar] [CrossRef]
  23. Xiao, X.; Chen, C.M.; Zhang, M. Magnet Demagnetization Observation for Permanent Magnet Synchronous Motor. In Proceedings of the 2008 International Conference on Electrical Machines and Systems, Wuhan, China, 17–20 October 2008; pp. 3216–3219. [Google Scholar]
  24. Belmonte, D.; Vedova, M.; Maggiore, P. Electromechanical servomechanisms affected by motor static eccentricity: Proposal of fault evaluation algorithm based on spectral analysis techniques. In Safety and Reliability of Complex Engineered Systems, Proceedings of the 25th European Safety and Reliability Conference, ESREL 2015; CRC Press: Boca Raton, FL, USA, 2015; pp. 2365–2372. [Google Scholar]
  25. Di Rito, G.; Schettini, F.; Galatolo, R. Model-based prognostic health-management algorithms for the freeplay identification in electromechanical flight control actuators. In Proceedings of the 2018 5th IEEE International Workshop on Metrology for AeroSpace (MetroAeroSpace), Rome, Italy, 20–22 June 2018; pp. 340–345. [Google Scholar] [CrossRef]
  26. Candon, M.; Levinski, O.; Ogawa, H.; Carrese, R.; Marzocca, P. A nonlinear signal processing framework for rapid identification and diagnosis of structural freeplay. Mech. Syst. Signal Process. 2022, 163, 107999. [Google Scholar] [CrossRef]
  27. Mohan, N.; Undeland, T.M.; Robbins, W.P. Power Electronics, 3rd ed.; John Wiley and Sons, Inc.: Hoboken, NJ, USA, 2005. [Google Scholar]
  28. Gökdere, L.U.; Bogdanov, A.; Chiu, S.L.; Keller, K.J.; Vian, J. Adaptive control of actuator lifetime. In Proceedings of the 2006 IEEE Aerospace Conference, Big Sky, MT, USA, 4–11 March 2006. [Google Scholar] [CrossRef]
  29. Antoine, J.-F.; Visa, C.; Sauvey, C.; Abba, G. Approximate Analytical Model for Hertzian Elliptical Contact Problems. J. Tribol. 2006, 128, 660. [Google Scholar] [CrossRef]
  30. Lugt, P.M. Grease Lubrication in Rolling Bearings; John Wiley & Sons, Inc.: Hoboken, NJ, USA, 2013; ISBN 9781118353912. [Google Scholar]
  31. Stachowiak, G.W.; Batchelor, A.W. Engineering Tribology, 4th ed.; Elsevier: Amsterdam, The Netherlands, 2014; ISBN 978-0-12-397047-3. [Google Scholar]
  32. Nijenbanning, G.; Venner, C.H.; Moes, H. Film thickness in elastohydrodynamically contacts. Wear 1994, 176, 217–229. [Google Scholar] [CrossRef] [Green Version]
  33. Bertolino, A.C.; Mauro, S.; Jacazio, G.; Sorli, M. Multibody dynamic model of a double nut preloaded ball screw mechanism with lubrication. In Proceedings of the ASME International Mechanical Engineering Congress and Exposition, Proceedings (IMECE), Virtual, 1–5 November 2021; Volume 7B-2020. [Google Scholar]
  34. Balan, M.R.D.; Stamate, V.C.; Houpert, L.; Olaru, D.N. The influence of the lubricant viscosity on the rolling friction torque. Tribol. Int. 2014, 72, 1–12. [Google Scholar] [CrossRef]
  35. Zhou, H.X.; Zhou, C.G.; Feng, H.T.; Ou, Y. Theoretical and experimental analysis of the preload degradation of double-nut ball screws. Precis. Eng. 2020, 65, 72–90. [Google Scholar] [CrossRef]
  36. Bertolino, A.C.; Jacazio, G.; Mauro, S.; Sorli, M. Investigation on the ball screws no-load drag torque in presence of lubrication through MBD simulations. Mech. Mach. Theory 2021, 161, 104328. [Google Scholar] [CrossRef]
  37. Damiens, B.; Venner, C.H.; Cann, P.M.E.; Lubrecht, A.A. Starved Lubrication of Elliptical EHD Contacts. J. Tribol. 2004, 126, 105. [Google Scholar] [CrossRef]
  38. Van Zoelen, M.T.; Venner, C.H.; Lugt, P.M. Prediction of film thickness decay in starved elasto-hydrodynamically lubricated contacts using a thin layer flow model. Proc. Inst. Mech. Eng. Part J J. Eng. Tribol. 2009, 223, 541–552. [Google Scholar] [CrossRef]
  39. Zhou, Y.; Bosman, R.; Lugt, P.M. A Model for Shear Degradation of Lithium Soap Grease at Ambient Temperature. Tribol. Trans. 2018, 61, 61–70. [Google Scholar] [CrossRef] [Green Version]
  40. Bacci, A.; Bertolino, A.C.; De Martin, A.; Sorli, M. Multiphysics modelling of a faulty rod-end and its interaction with a flight control actuator to support PHM activities. In Proceedings of the IMECE 2021 Volume 7: Dynamics, Vibration, and Control, Virtual, 1–5 November 2021. [Google Scholar]
  41. Orchard, M.E.; Vachtsevanos, G.J. A particle-filtering approach for on-line fault diagnosis and failure prognosis. Trans. Inst. Meas. Control 2009, 31, 221–246. [Google Scholar] [CrossRef]
  42. Roemer, M.J.; Byington, C.S.; Kacprzynski, G.J.; Vachtsevanos, G.; Goebel, K. Prognostics. In System Health Management: With Aerospace Applications; Wiley: Hoboken, NJ, USA, 2011; ISBN 9780470741337. [Google Scholar]
  43. Arulampalam, M.S.; Maskell, S.; Gordon, N.; Clapp, T. A Tutorial on Particle Filters for Online Nonlinear/NonGaussian Bayesian Tracking. IEEE Trans. Signal Process. 2002, 50, 174–188. [Google Scholar] [CrossRef] [Green Version]
  44. Acuña, D.E.; Orchard, M.E. Particle-filtering-based failure prognosis via sigma-points: Application to Lithium-Ion battery State-of-Charge monitoring. Mech. Syst. Signal Process. 2017, 85, 827–848. [Google Scholar] [CrossRef]
  45. Acuña, D.E.; Orchard, M.E. A theoretically rigorous approach to failure prognosis. In Proceedings of the 10th Annual Conference of the Prognostics and Health Management Society 2018 (PHM18), Philadelphia, PA, USA, 24–27 September 2018. [Google Scholar]
  46. Bishop, C.M. Pattern Recoginiton and Machine Learning; Springer: Berlin/Heidelberg, Germany, 2006; ISBN 978-0-387-31073-2. [Google Scholar]
  47. De Martin, A.; Jacazio, G.; Sorli, M. Enhanced Particle Filter framework for improved prognosis of electro-mechanical flight controls actuators. In Proceedings of the PHM Society European Conference, PHME 2018, Utrecht, The Netherlands, 3–6 July 2018; Volume 4. [Google Scholar]
  48. Saxena, A.; Celaya, J.; Balaban, E.; Goebel, K.; Saha, B.; Saha, S.; Schwabacher, M. Metrics for evaluating performance of prognostic techniques. In Proceedings of the 2008 International Conference on Prognostics and Health Management, Denver, CO, USA, 6–9 October 2008; pp. 1–17. [Google Scholar] [CrossRef]
Figure 1. Iron-bird schematics.
Aerospace 10 00335 g001
Figure 2. Research program workflow.
Aerospace 10 00335 g002
Figure 3. Architecture of the case study.
Aerospace 10 00335 g003
Figure 4. Schematics of the Electric-Drive model.
Aerospace 10 00335 g004
Figure 5. Effect of an occurring turn-to-turn short in a BLAC drive. (a) Healthy condition. (b) Developing short.
Aerospace 10 00335 g005
Figure 6. Main screen of the Simscape Multibody high-fidelity model of the ball screw component.
Aerospace 10 00335 g006
Figure 7. Wear rate versus aging level for different speeds and loads for a ball screw with 5 mm lead and 16 mm nominal diameter (© 2022 IEEE. Reprinted, with permission, from [21]).
Aerospace 10 00335 g007
Figure 8. Simulation results of a ball screw with a high backlash of 0.3 mm. (a) Comparison between the nut position and the equivalent linear position of the screw shaft; (b) Comparison between the equivalent angular speeds of the screw shaft and the nut (© 2020 ASME. Reprinted, with permission, from [33]).
Aerospace 10 00335 g008
Figure 9. Simulation results of a rod-end with a high backlash of 2 mm connecting 2 servo-actuators to the control surface: (a) Pin trajectory within the rod-end housing during the simulation; (b) Comparison between the surface position obtained with (green) and without (red) backlash in the rod-end (© 2021 ASME. Reprinted, with permission, from [40]).
Aerospace 10 00335 g009
Figure 10. Main screen of the RT model.
Aerospace 10 00335 g010
Figure 11. Implementation of the turn-to-turn short in the real-time model.
Aerospace 10 00335 g011
Figure 12. Comparison between detailed model and RT model with low and high levels of backlash.
Aerospace 10 00335 g012
Figure 13. Data generation process to support PHM design.
Aerospace 10 00335 g013
Figure 14. Feature correlation against several failure modes propagation.
Aerospace 10 00335 g014
Figure 15. Architecture of the proposed PHM Framework.
Aerospace 10 00335 g015
Figure 16. Output of the fault-detection algorithm in response to fault occurrence in the winglet actuator.
Aerospace 10 00335 g016
Figure 17. Scheme of the employed particle-filtering algorithm.
Aerospace 10 00335 g017
Figure 18. Example of the particle filter framework output.
Aerospace 10 00335 g018
Figure 19. Example of RUL estimate for 5 consequent prediction steps for one of the degradation patterns associated with the demagnetization of the motor permanent magnets.
Aerospace 10 00335 g019
Figure 20. Procedure for the preliminary performance assessment.
Aerospace 10 00335 g020
Figure 21. Elapsed time breakdown—average execution time of a particle-filtering step.
Aerospace 10 00335 g021
Figure 22. Confusion matrix for fault classification and example of the fault diagnosis algorithm for the turn-to-turn short failure mode.
Aerospace 10 00335 g022
Figure 23. Elapsed time breakdown—average execution time of a particle-filtering step.
Aerospace 10 00335 g023
Table 1. Selected features.
ComponentFailure ModeFeature SymbolSignalsFeature
MotorTurn-to-turn short F T T S Phase currents
Phase voltage
Variance of the common node current over the average phase voltage
MotorMagnets degradation F D M D Phase currentsDistance between the mean root square of the phase currents from an expected baseline
MotorStatic eccentricity F S E Phase currents
Motor shaft position
Periodic disturbances over the phase currents signals
EPUMOSFET Base Drive Open Circuit F B D O Phase voltagePhase voltage standard deviation
Mechanical transmissionEfficiency loss, lubricant aging F M T E L Phase currents
Expected aerodynamic load based on deflection angle
Efficiency estimate at still actuator
Mechanical transmissionWear induced backlash F M T W E A R Rotor shaft position
LVDT measurement
Difference between LVDT output and shaft position
Spherical jointsWear-induced backlash F R E W E A R LVDT measurement from 2 actuators on the same aerodynamic tabDifference between LVDT outputs
Table 2. Expected performance metrics.
ComponentFailure ModePrognostic Horizon [−]Relative Accuracy [%]
MotorTurn-to-turn short0.1164.3%
MotorMagnet degradation0.5575.3%
Mechanical transmissionEfficiency loss, lubricant aging0.1578.2%
Mechanical transmissionWear-induced backlash0.8281.2%
Spherical jointsWear-induced backlash0.6579.3%
Disclaimer/Publisher’s Note: The statements, opinions and data contained in all publications are solely those of the individual author(s) and contributor(s) and not of MDPI and/or the editor(s). MDPI and/or the editor(s) disclaim responsibility for any injury to people or property resulting from any ideas, methods, instructions or products referred to in the content.

