

Design and Testing of Impacted Stiffened CFRP Panels under Compression with the VERTEX Test Rig

Abstract
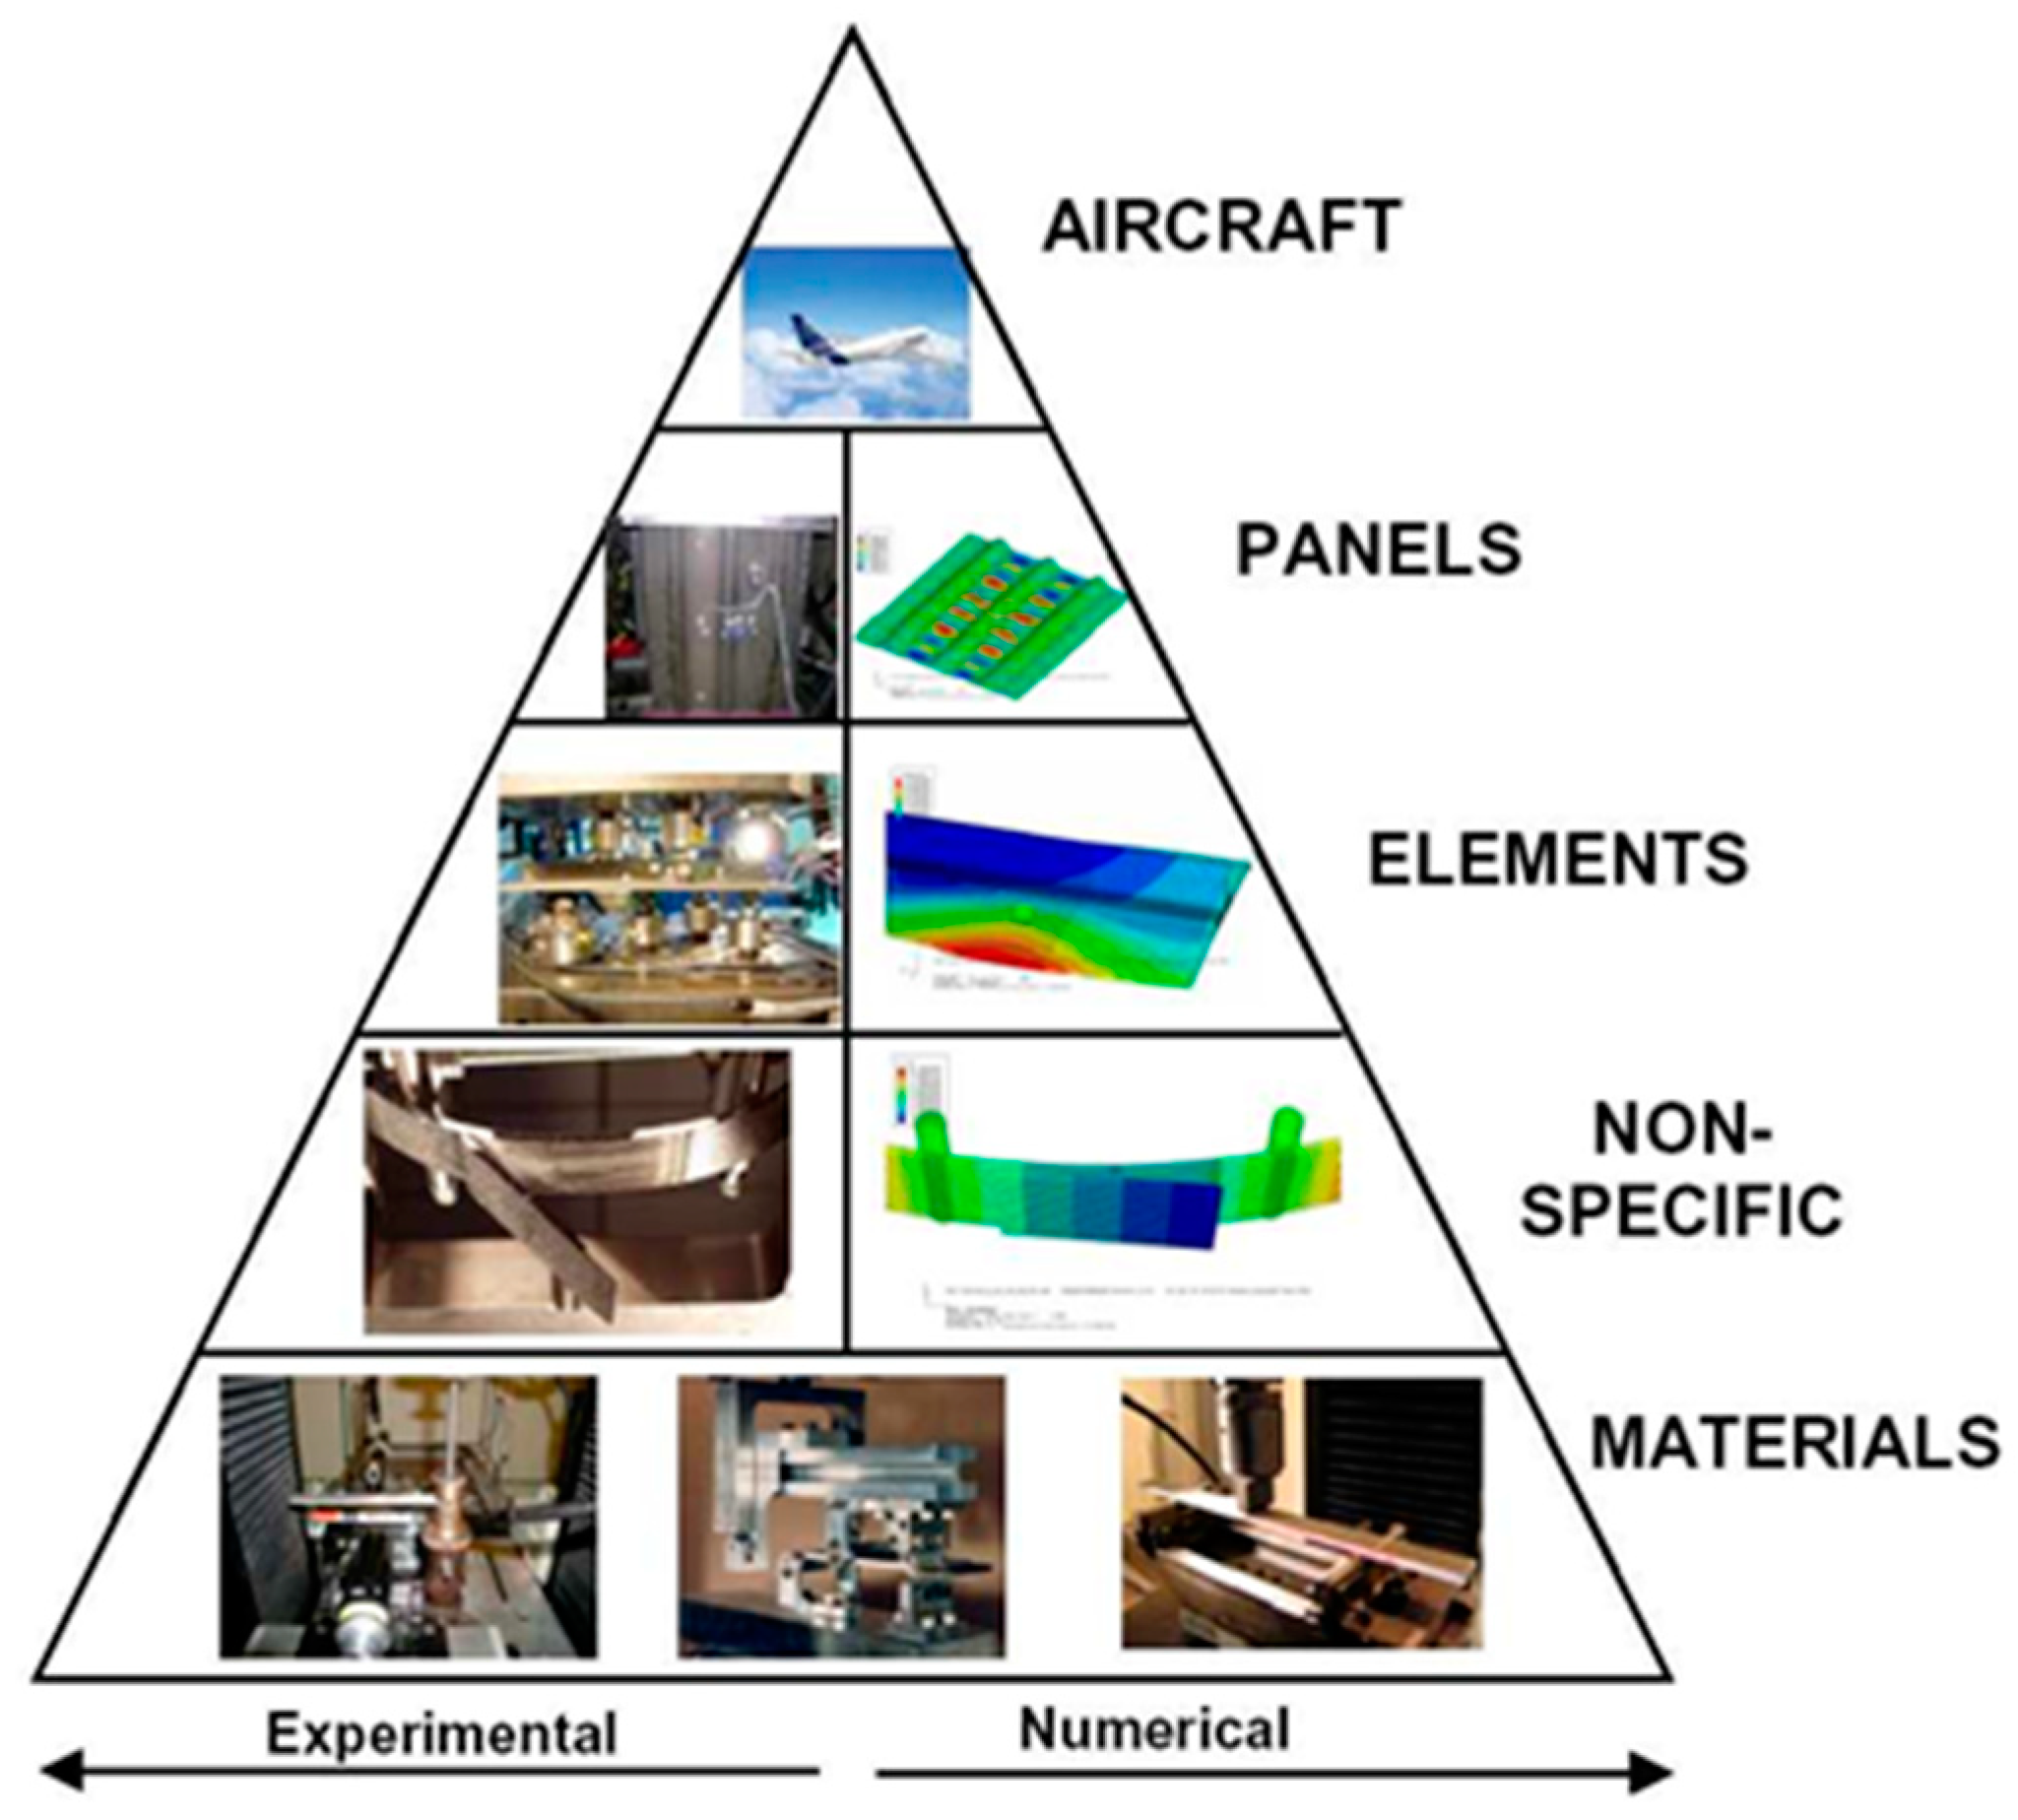
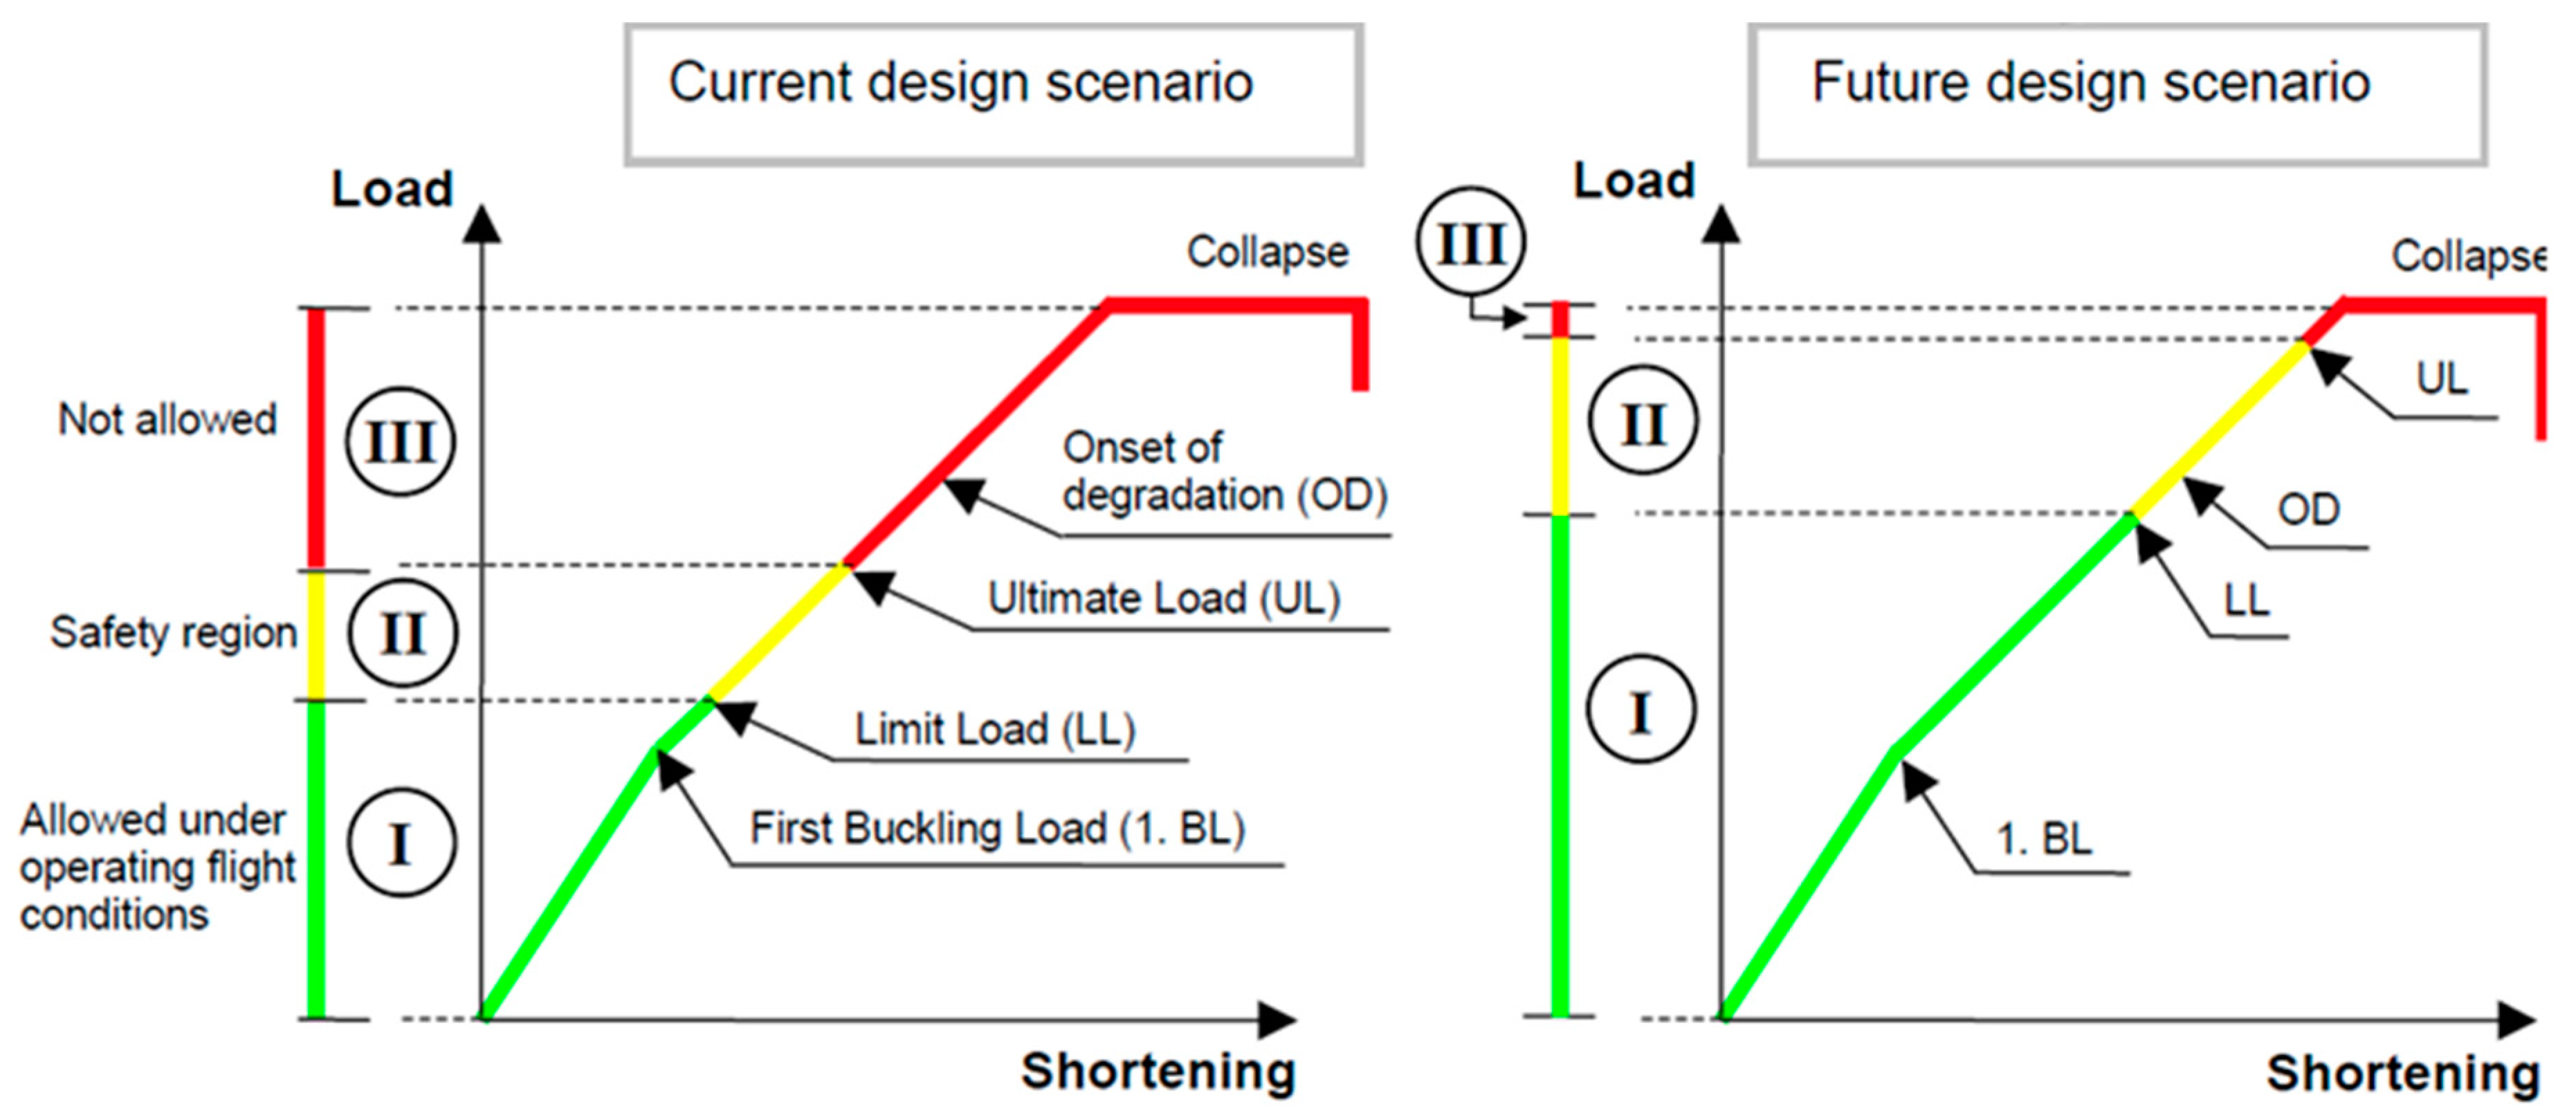
:1. Introduction
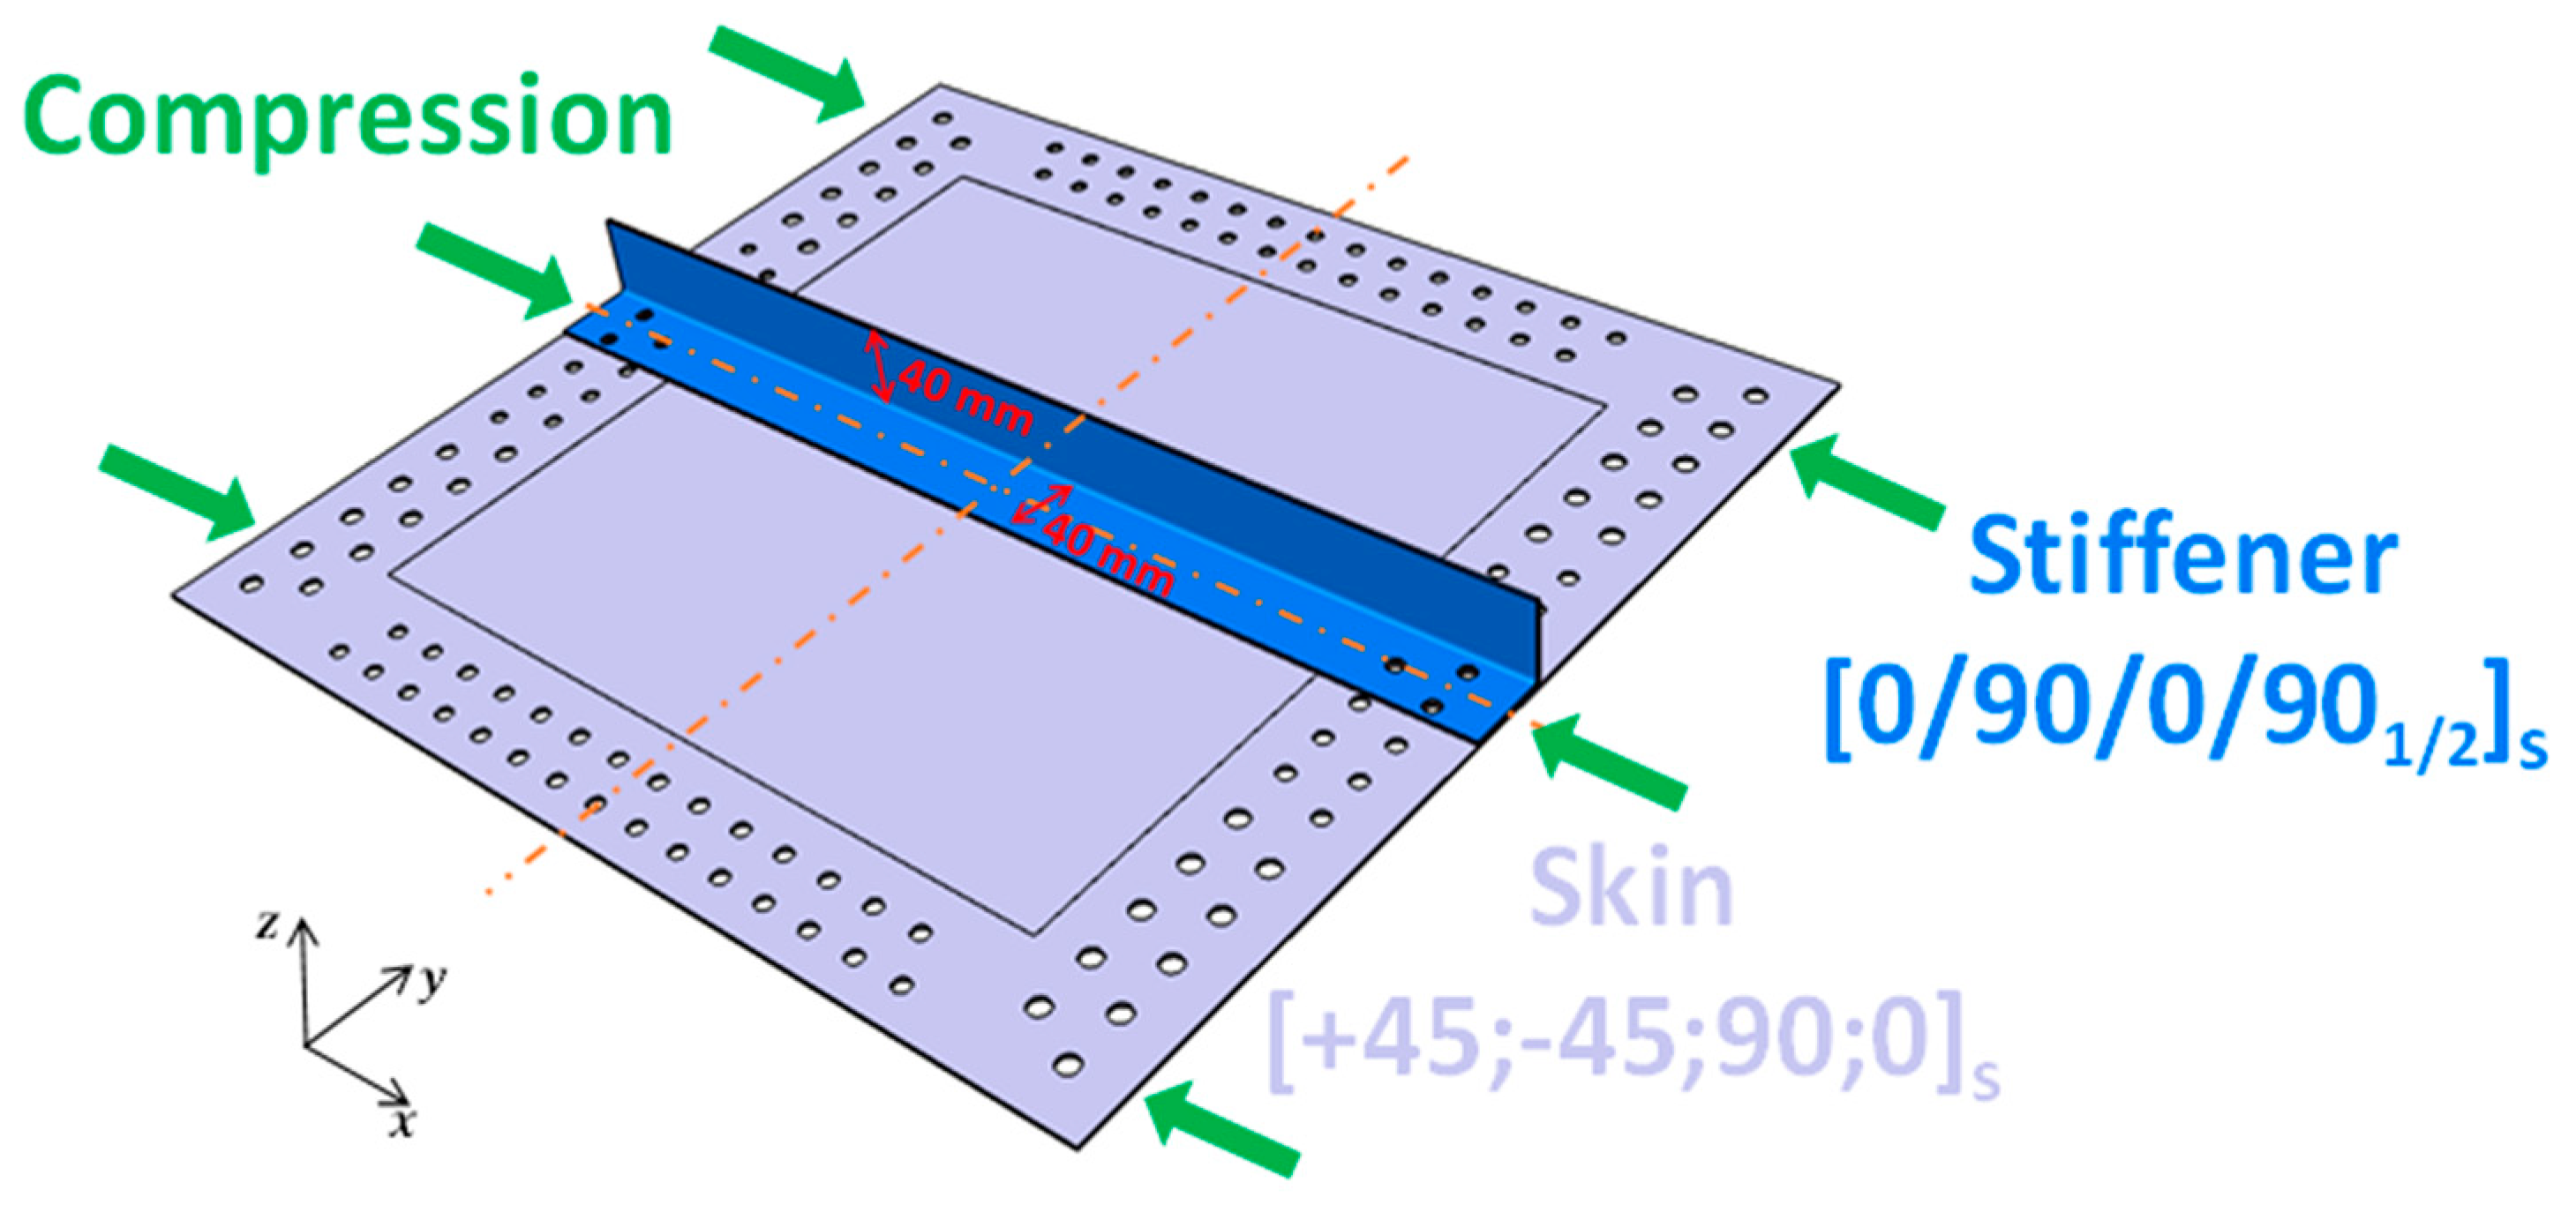
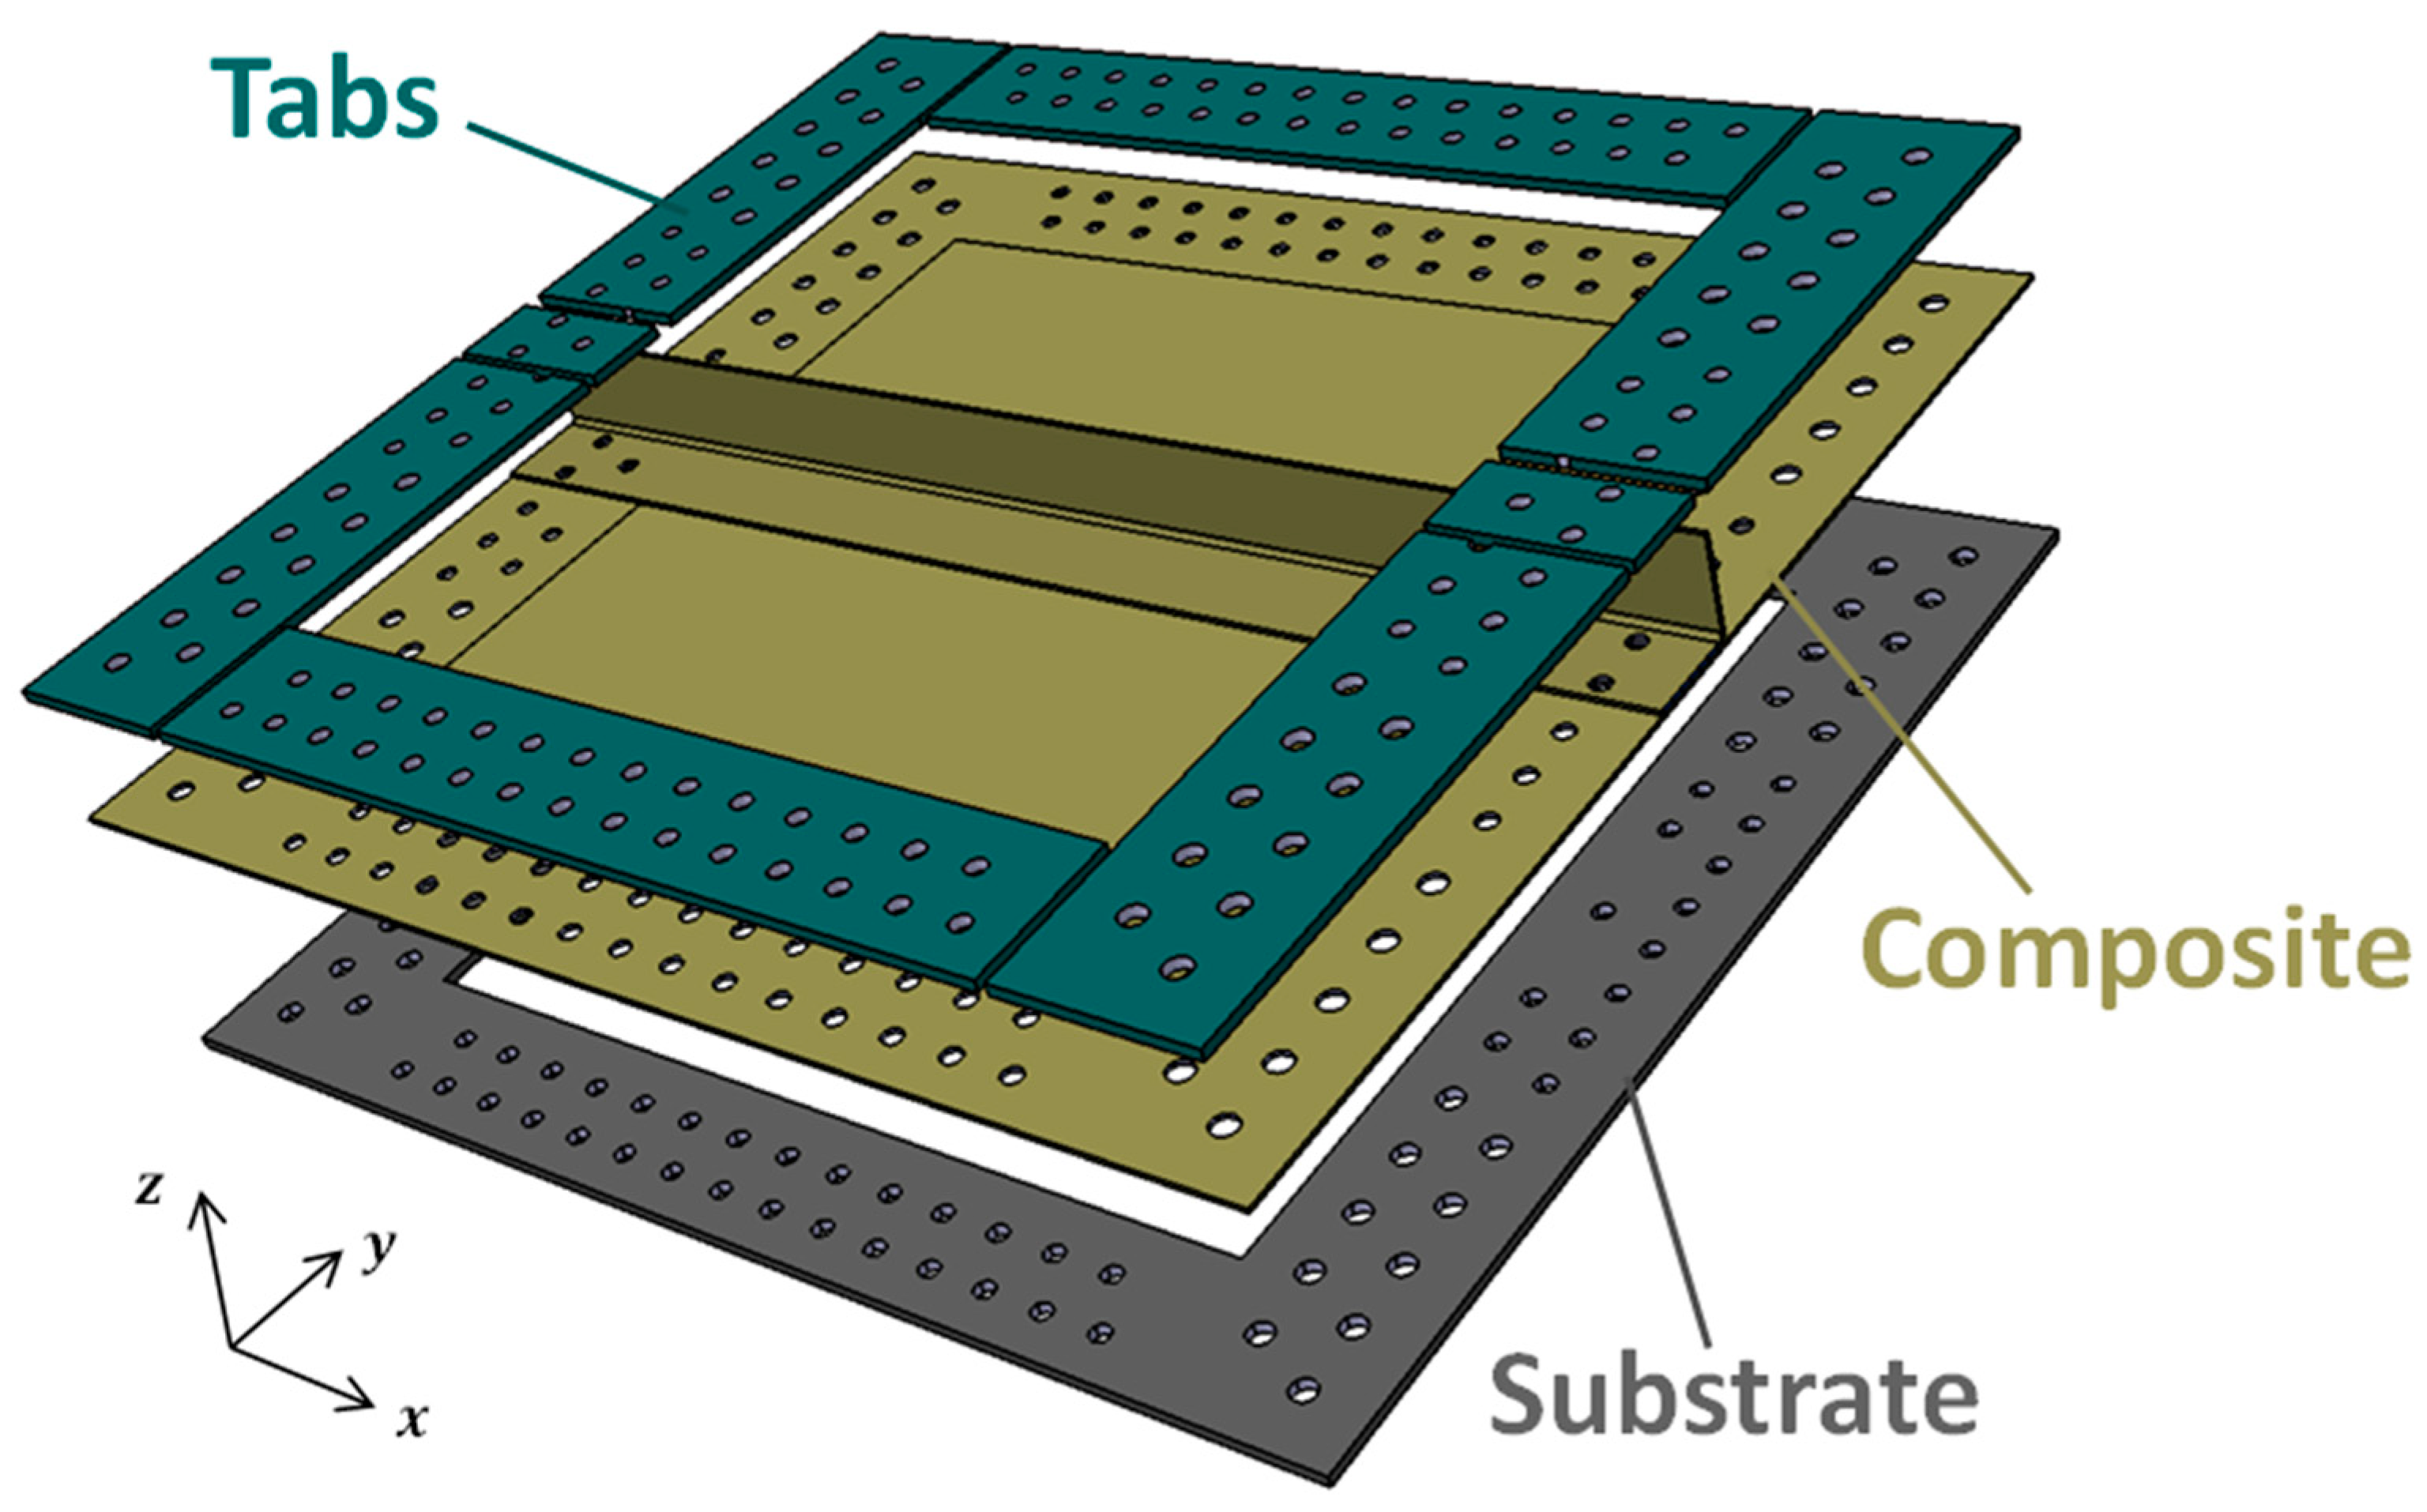
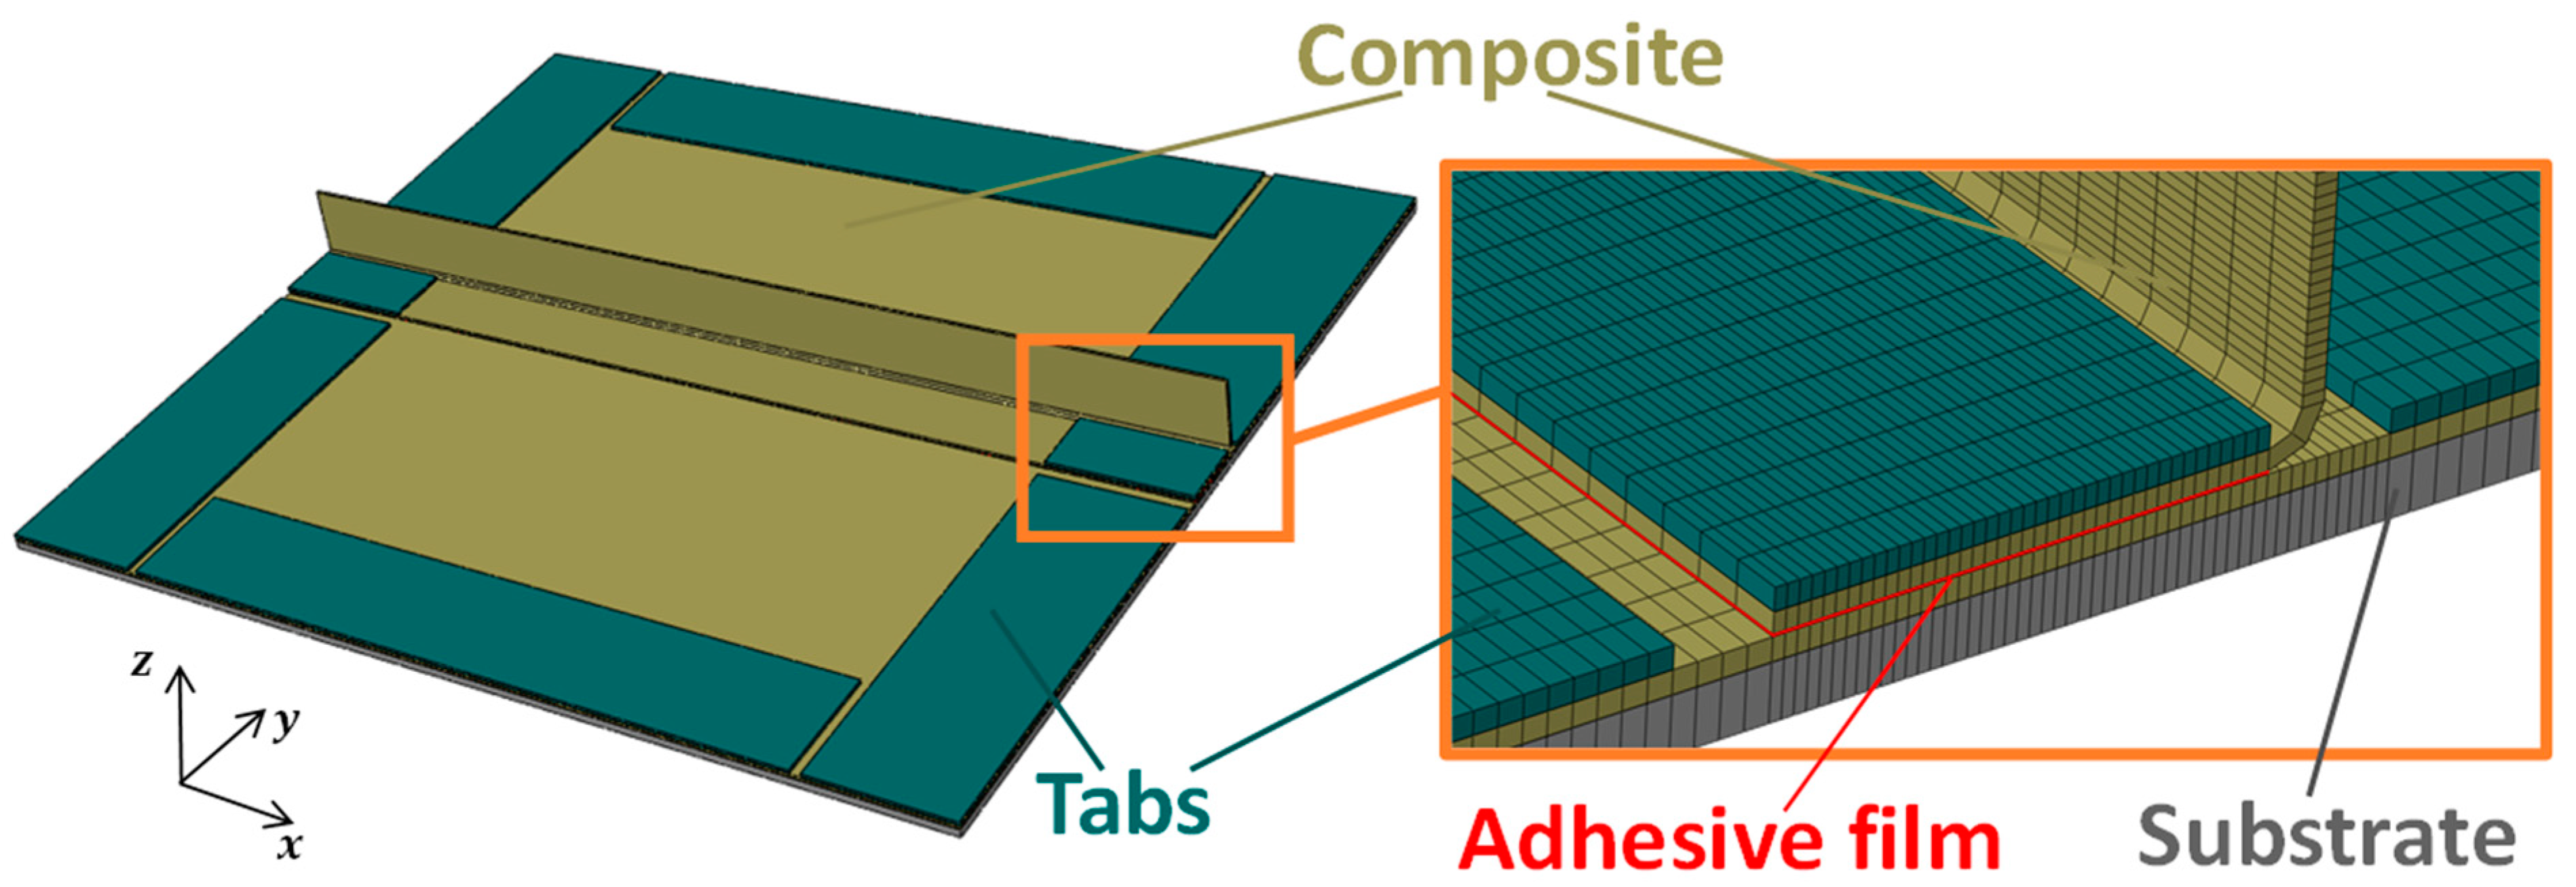
2. Experimental Specimen Configuration
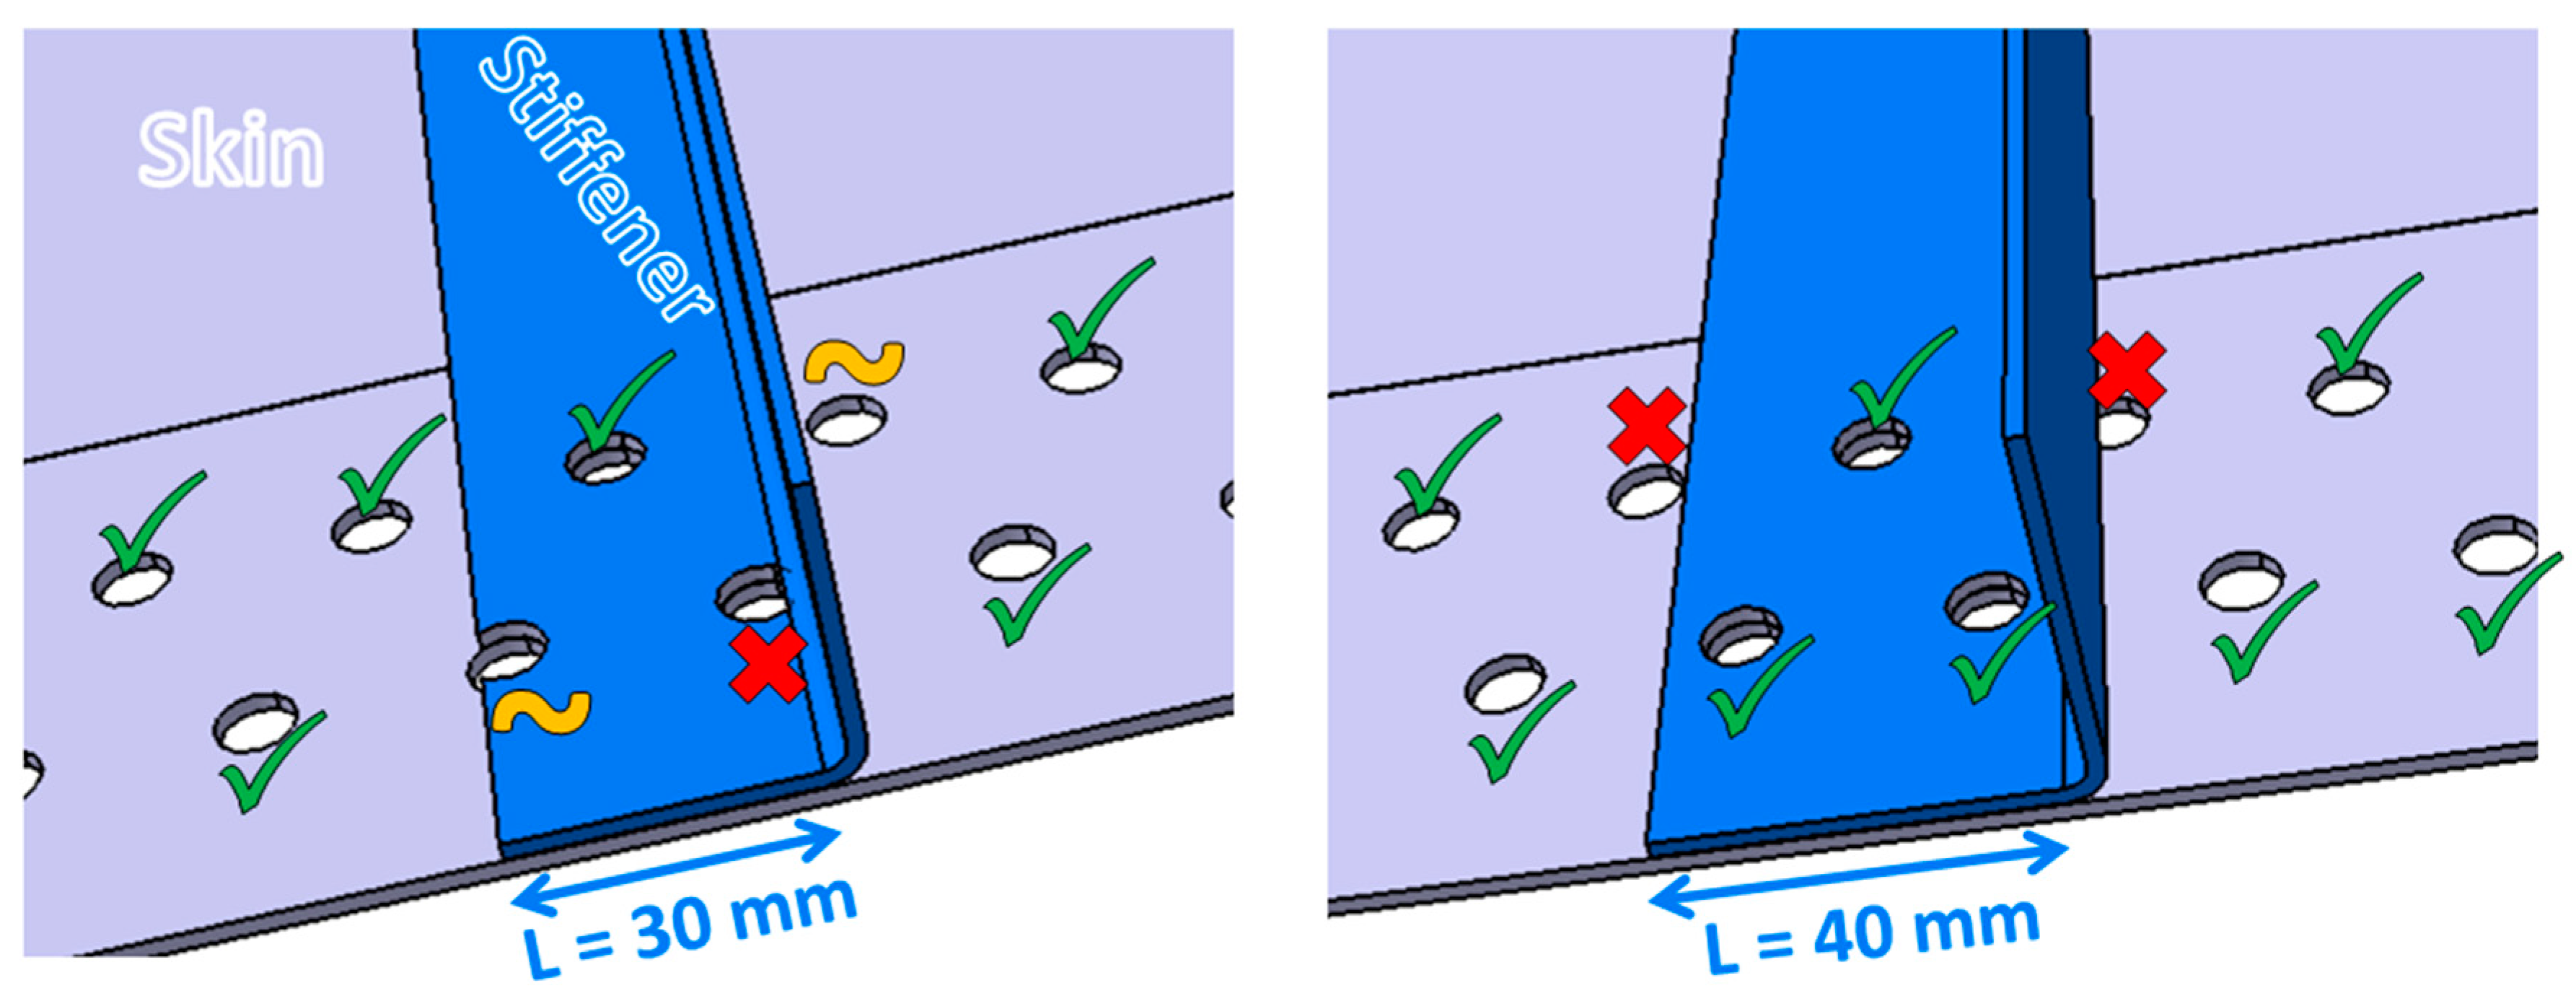
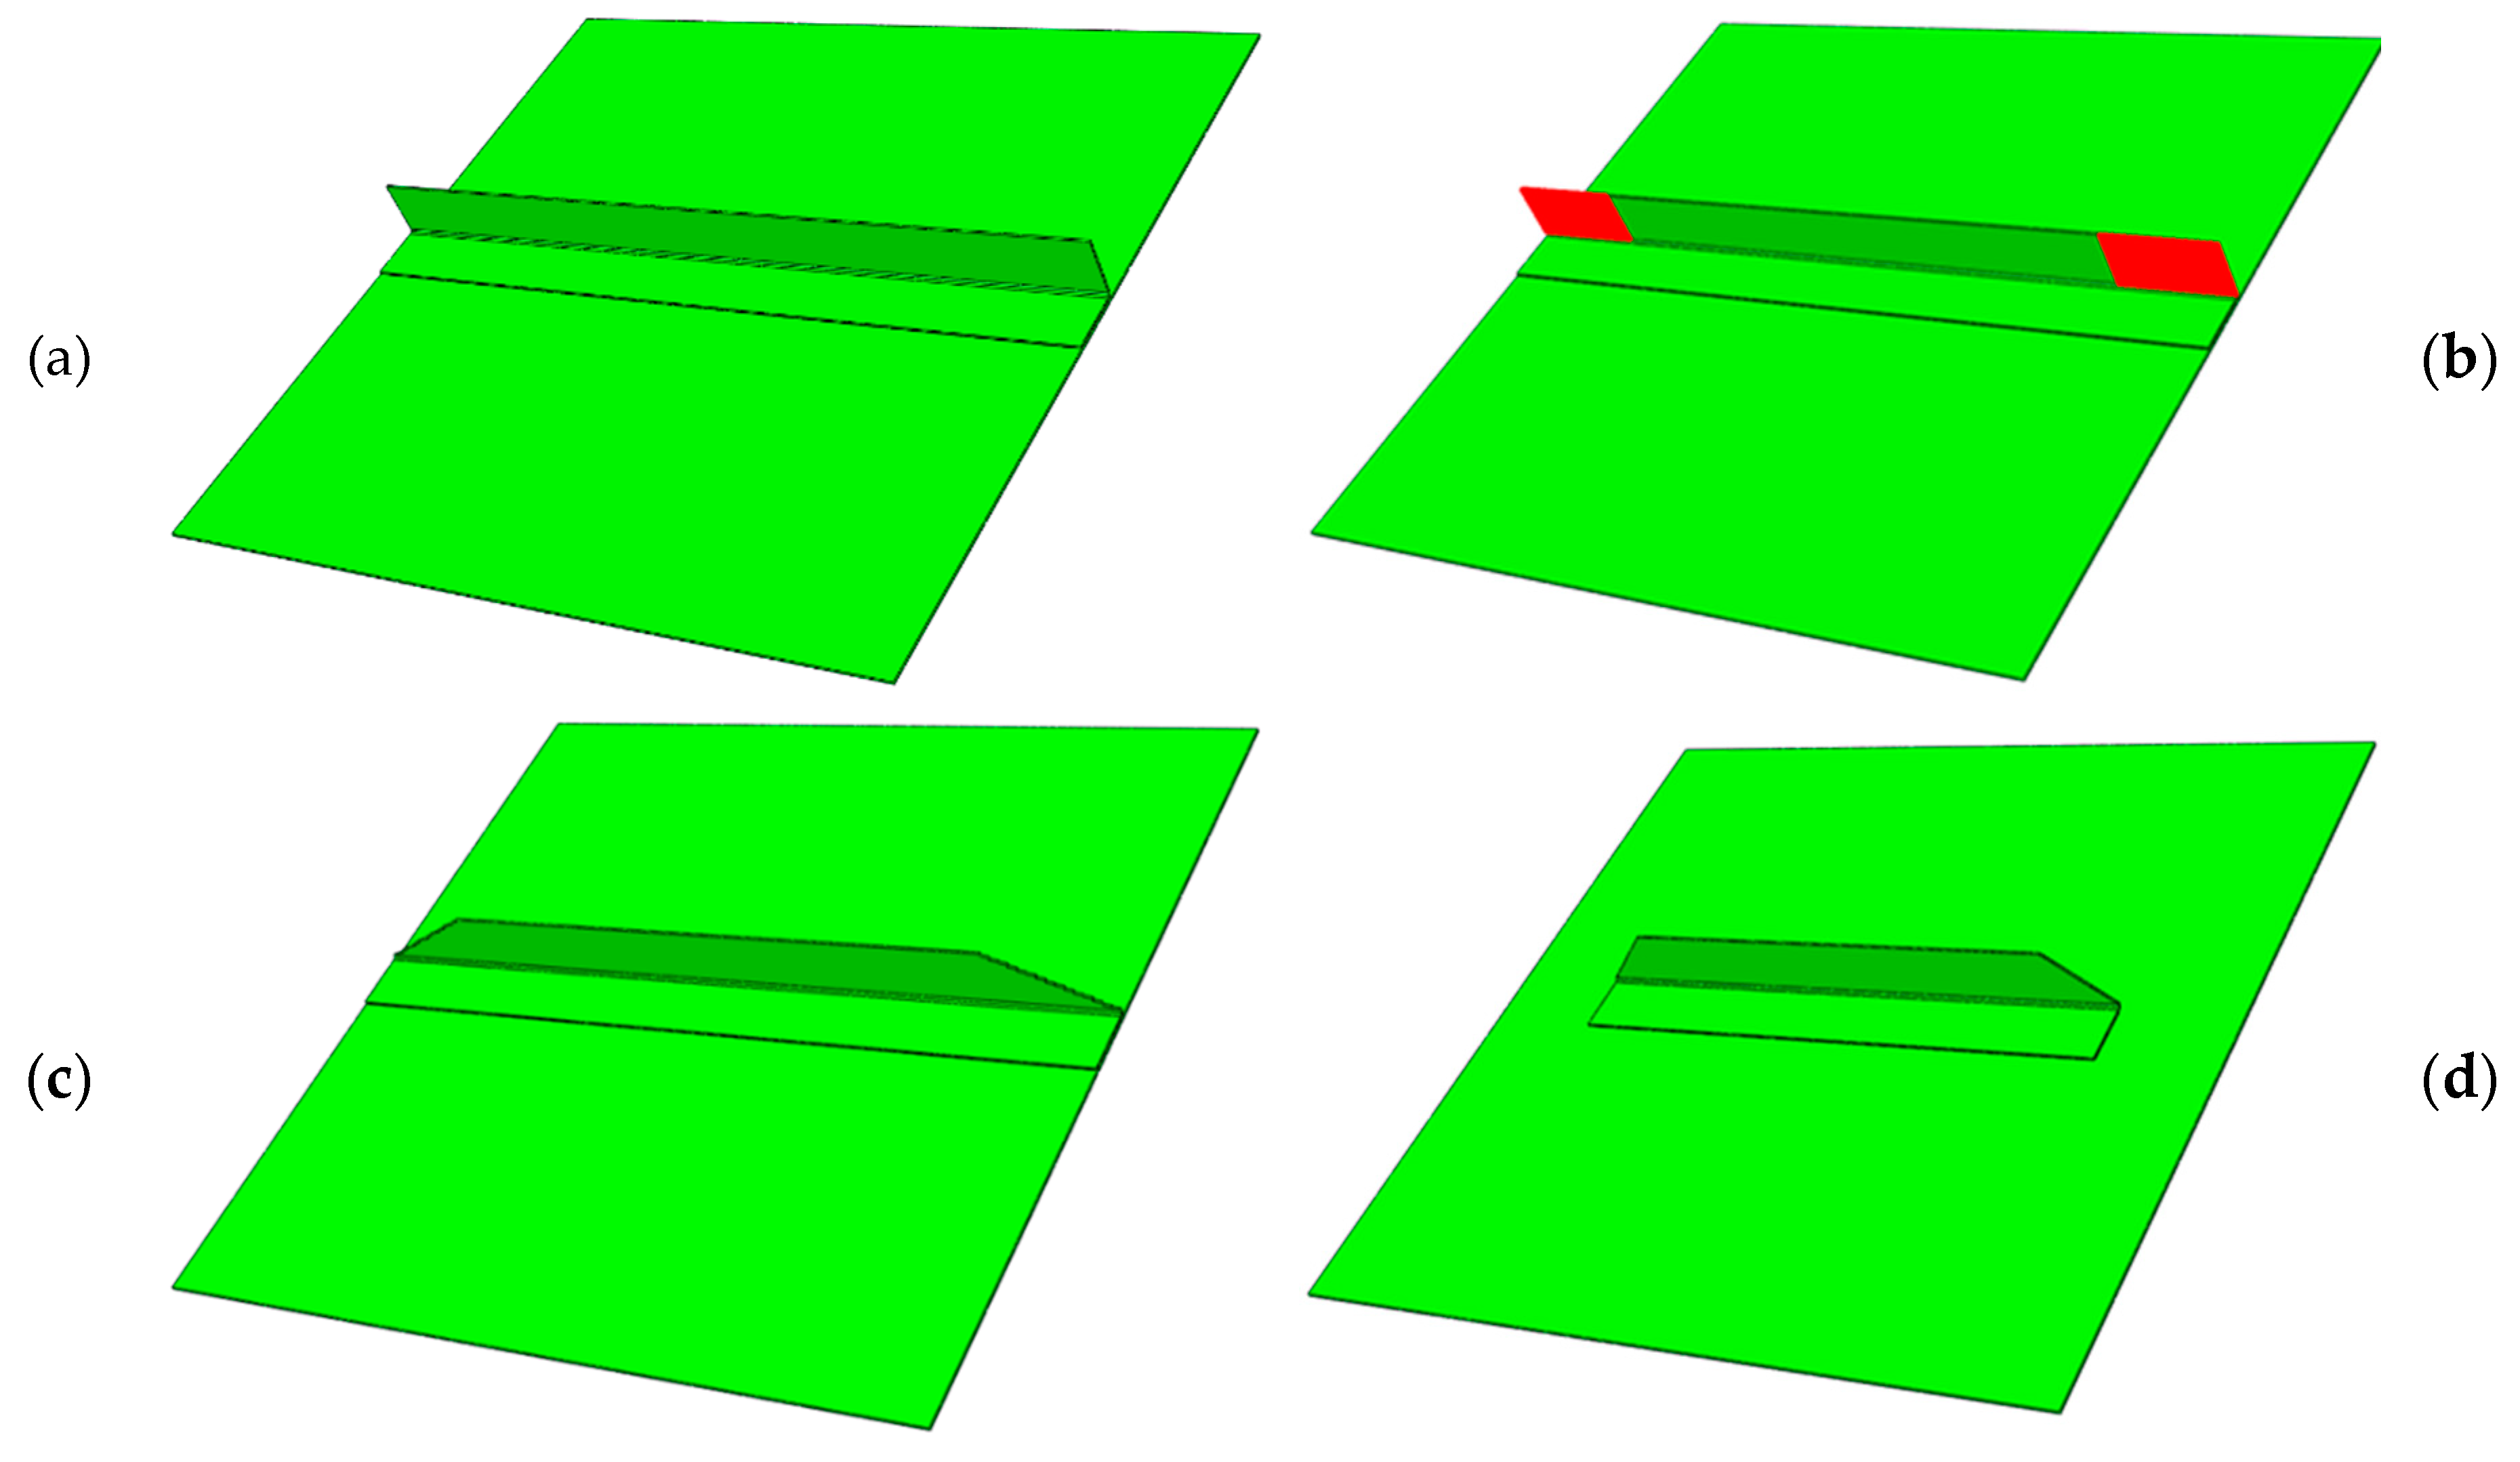
3. Specimen Sizing
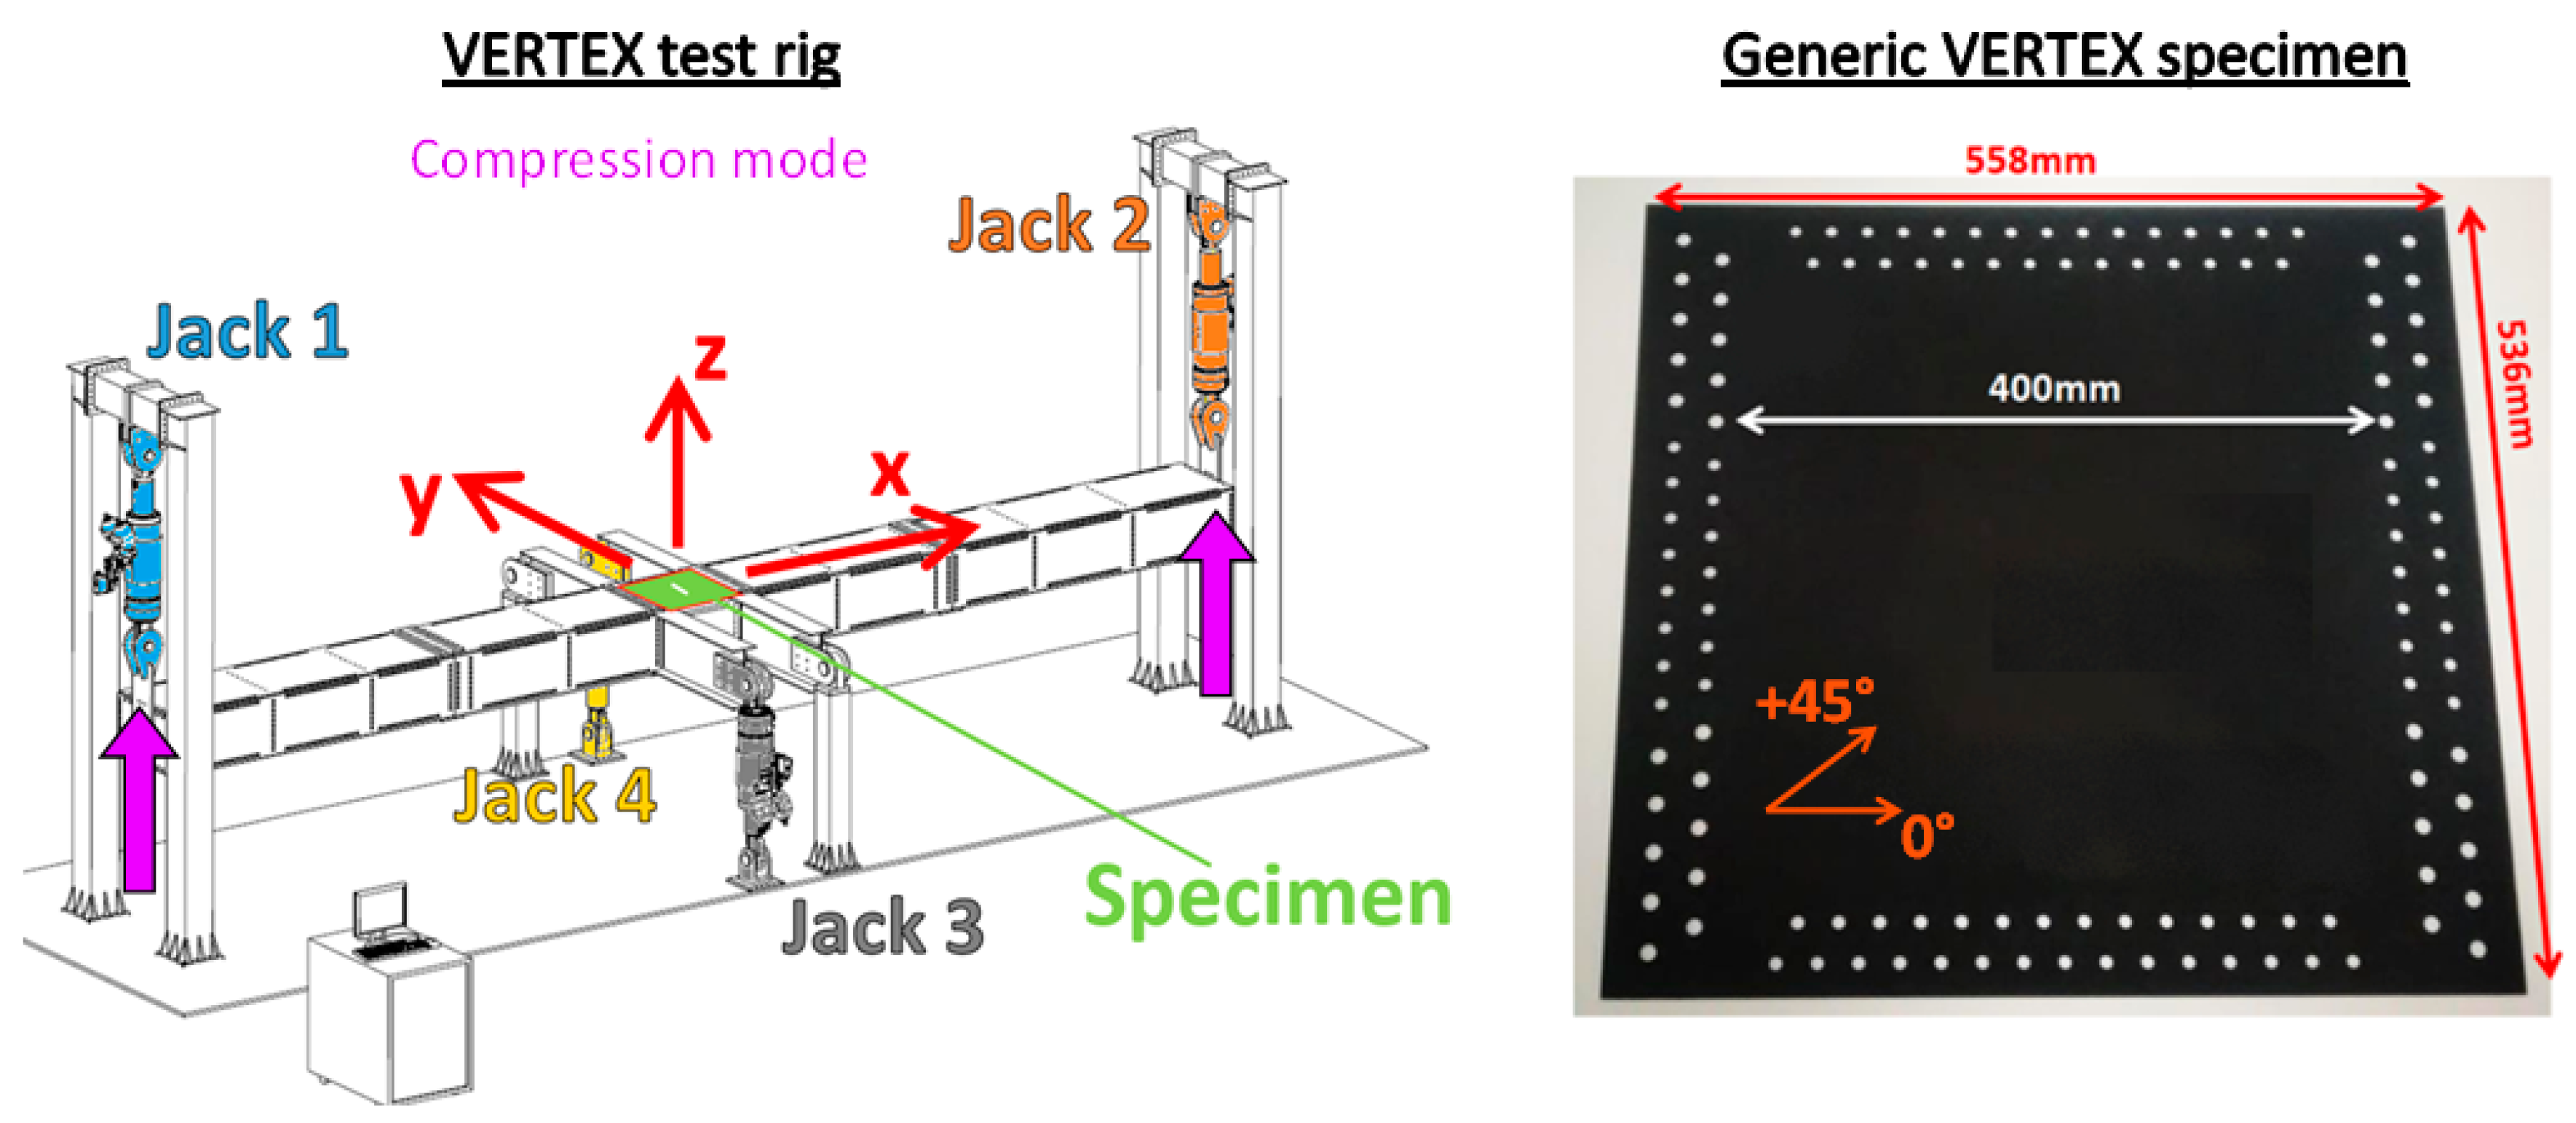
3.1. Issues and Objectives
3.2. Numerical Model
3.3. Virtual Testing of Configurations
3.4. Results
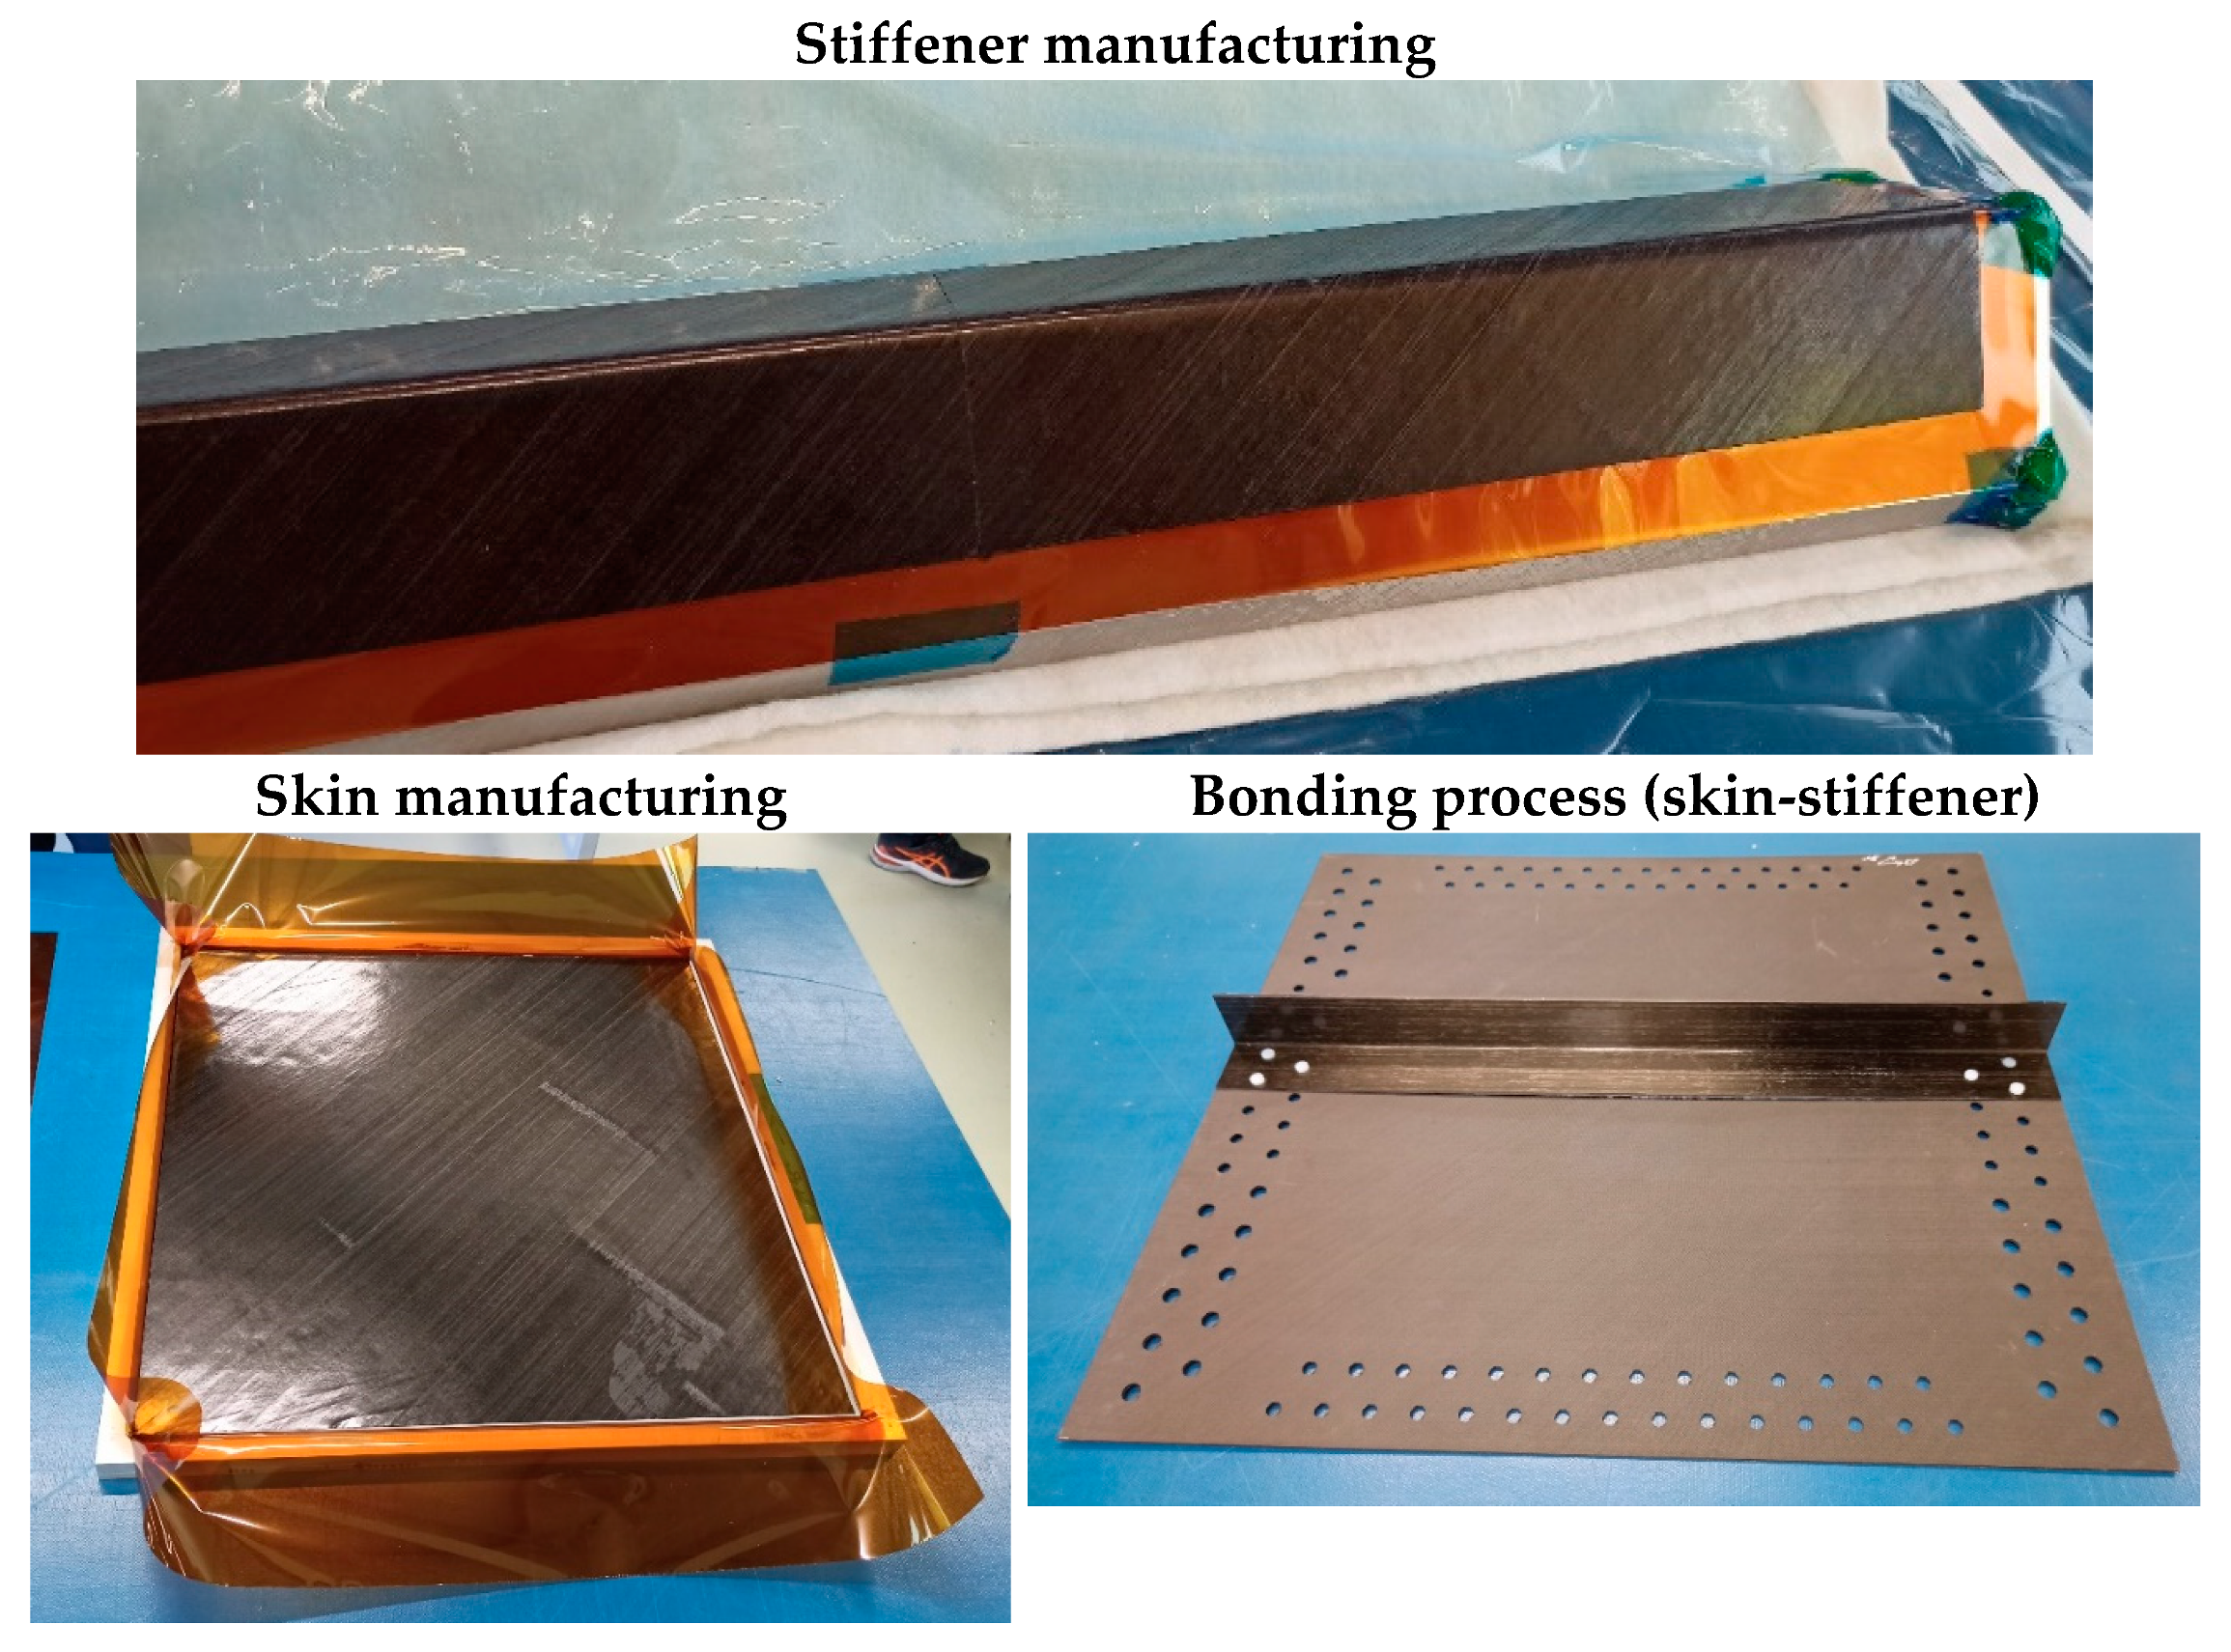
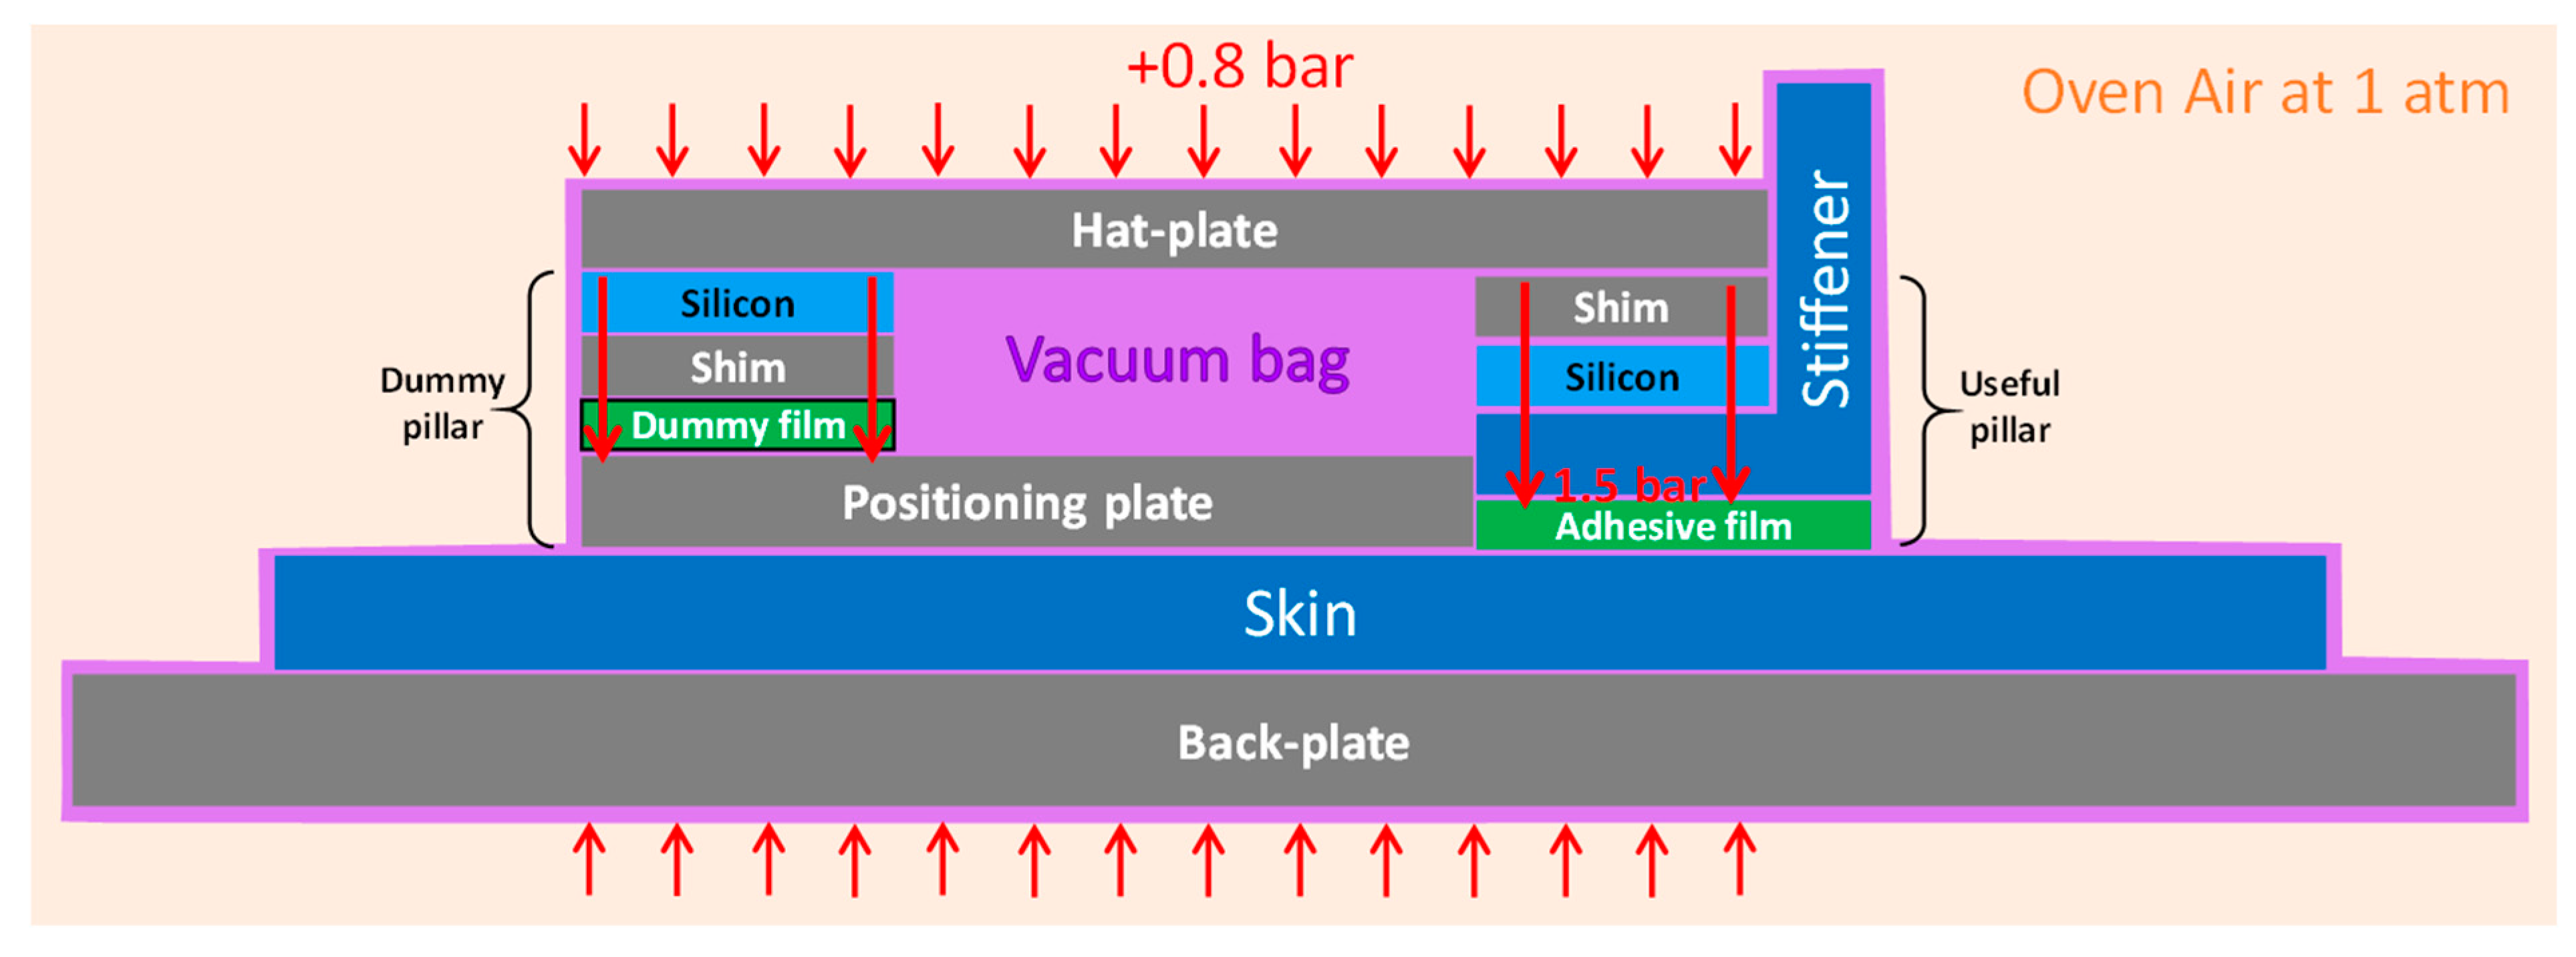
4. Manufacturing
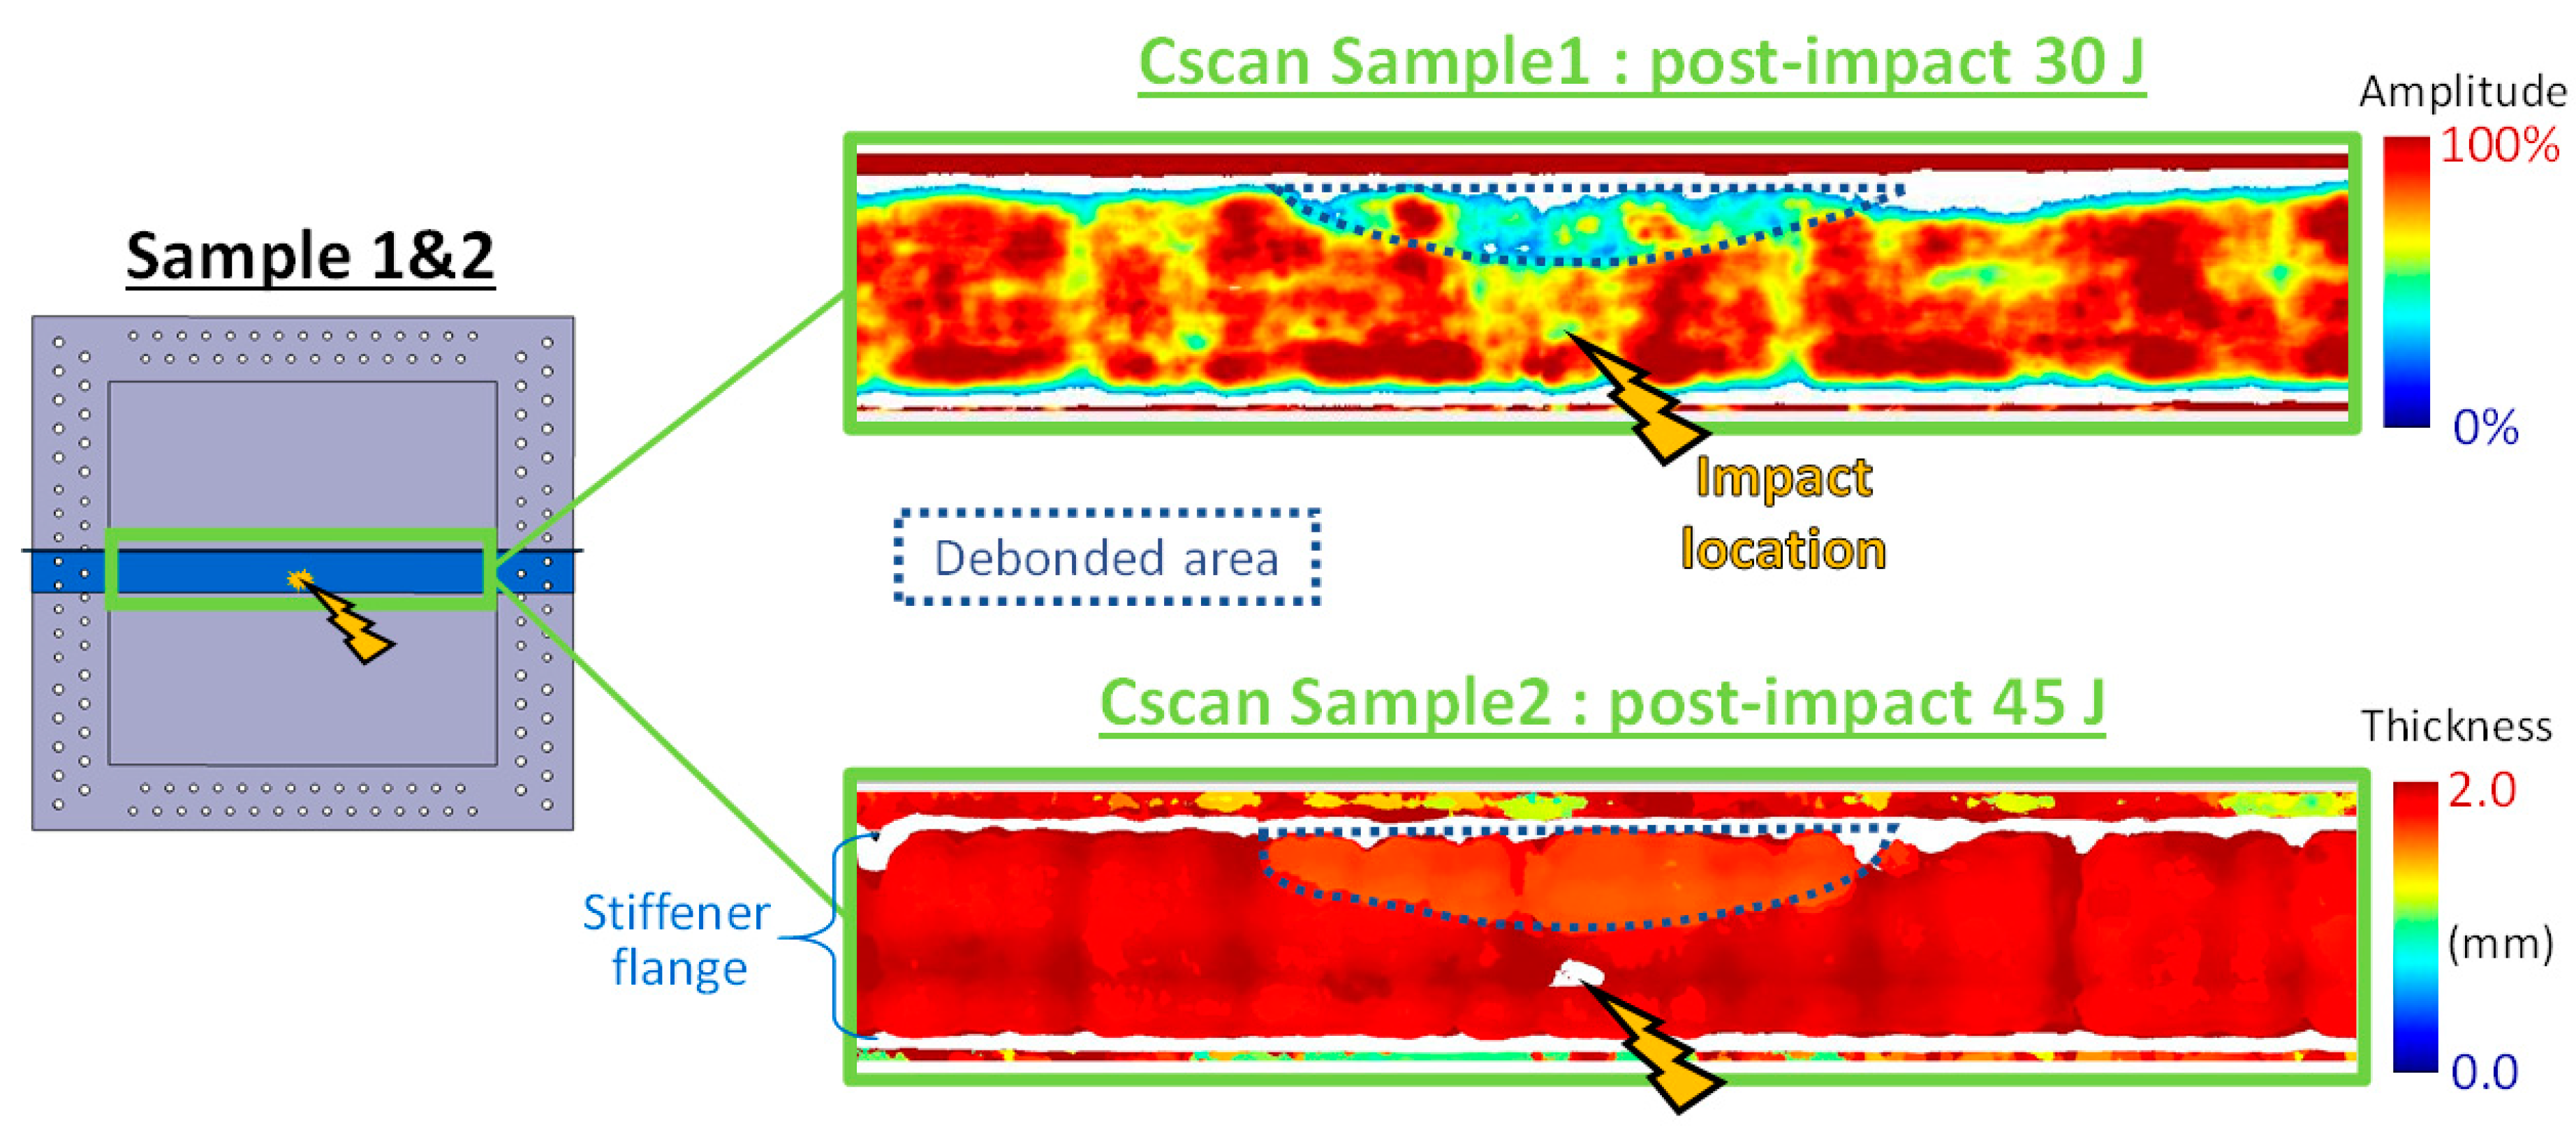
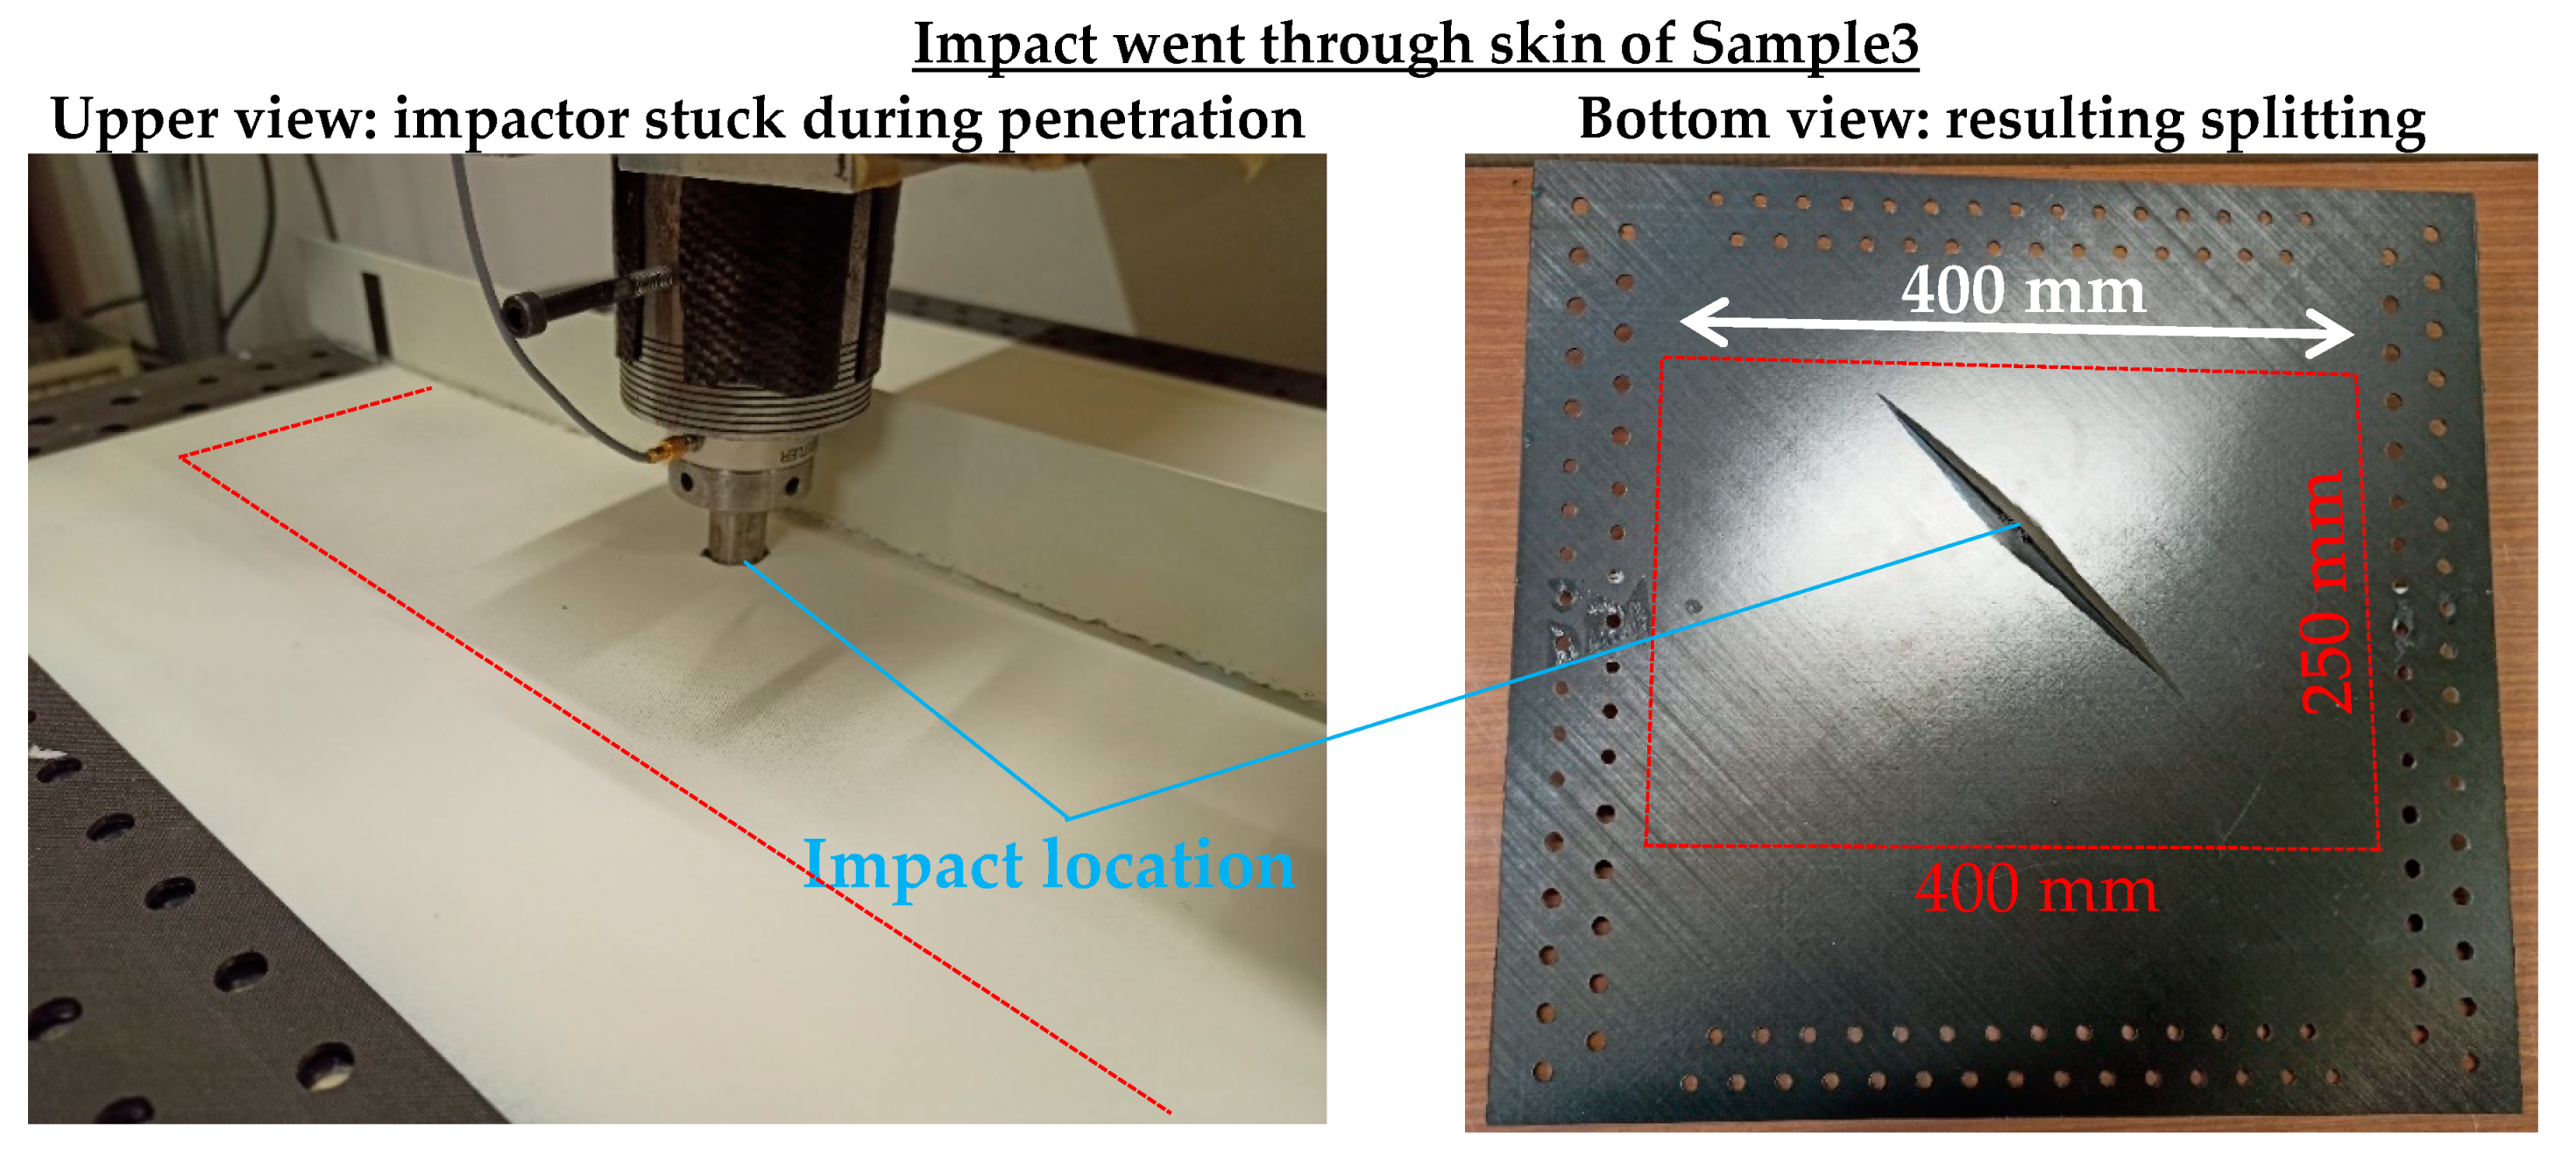
5. Impact
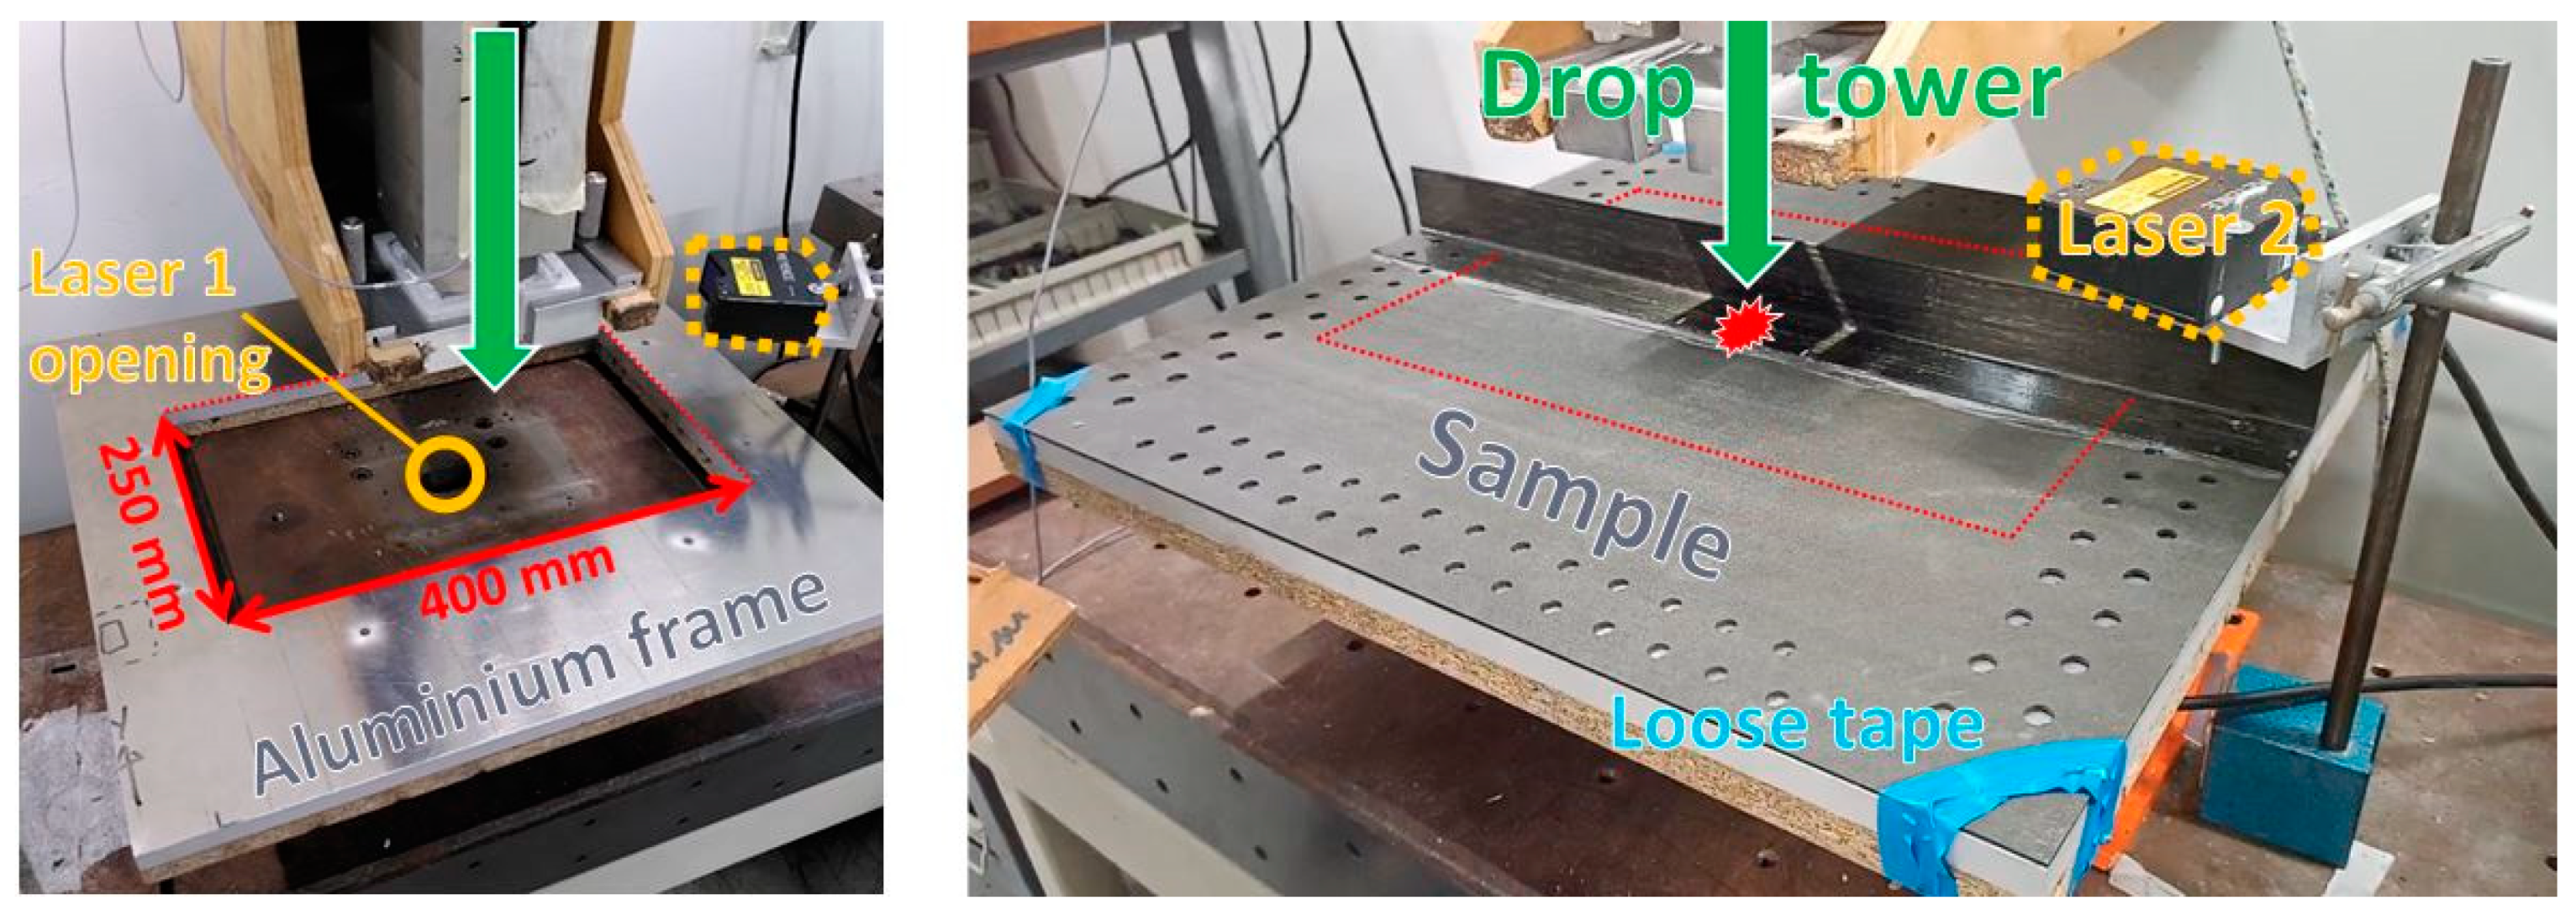
5.1. Method
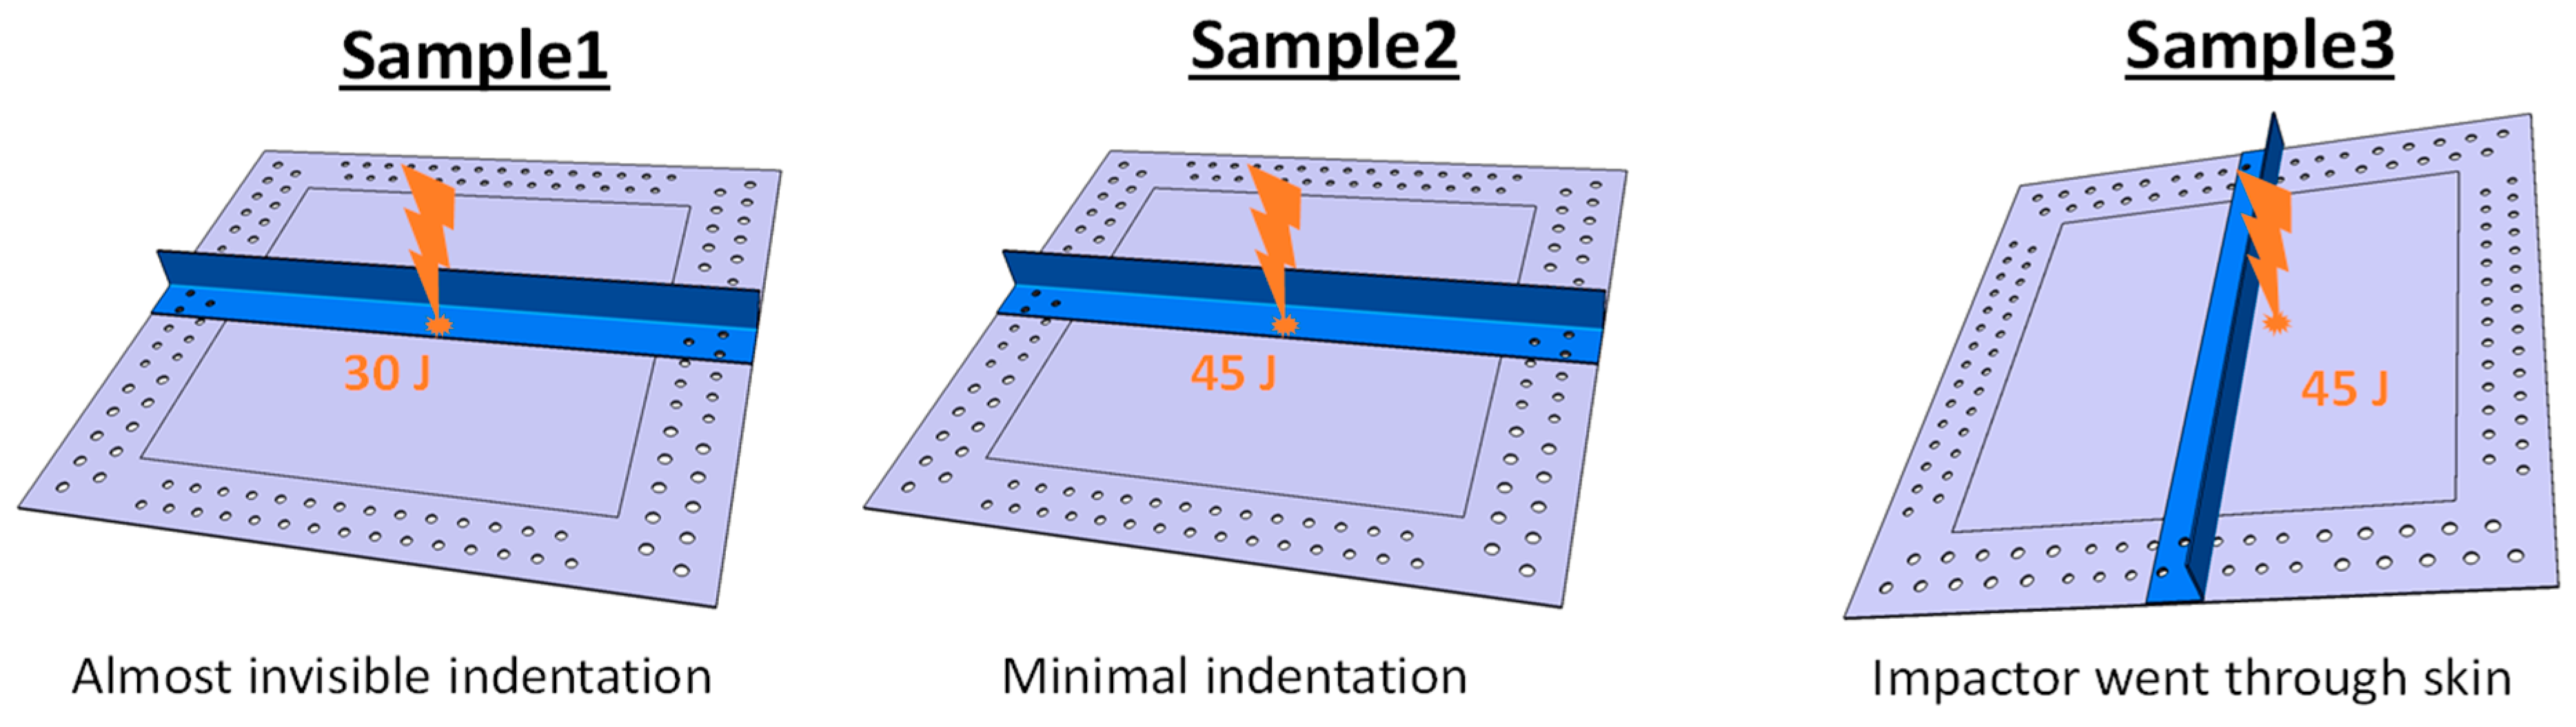
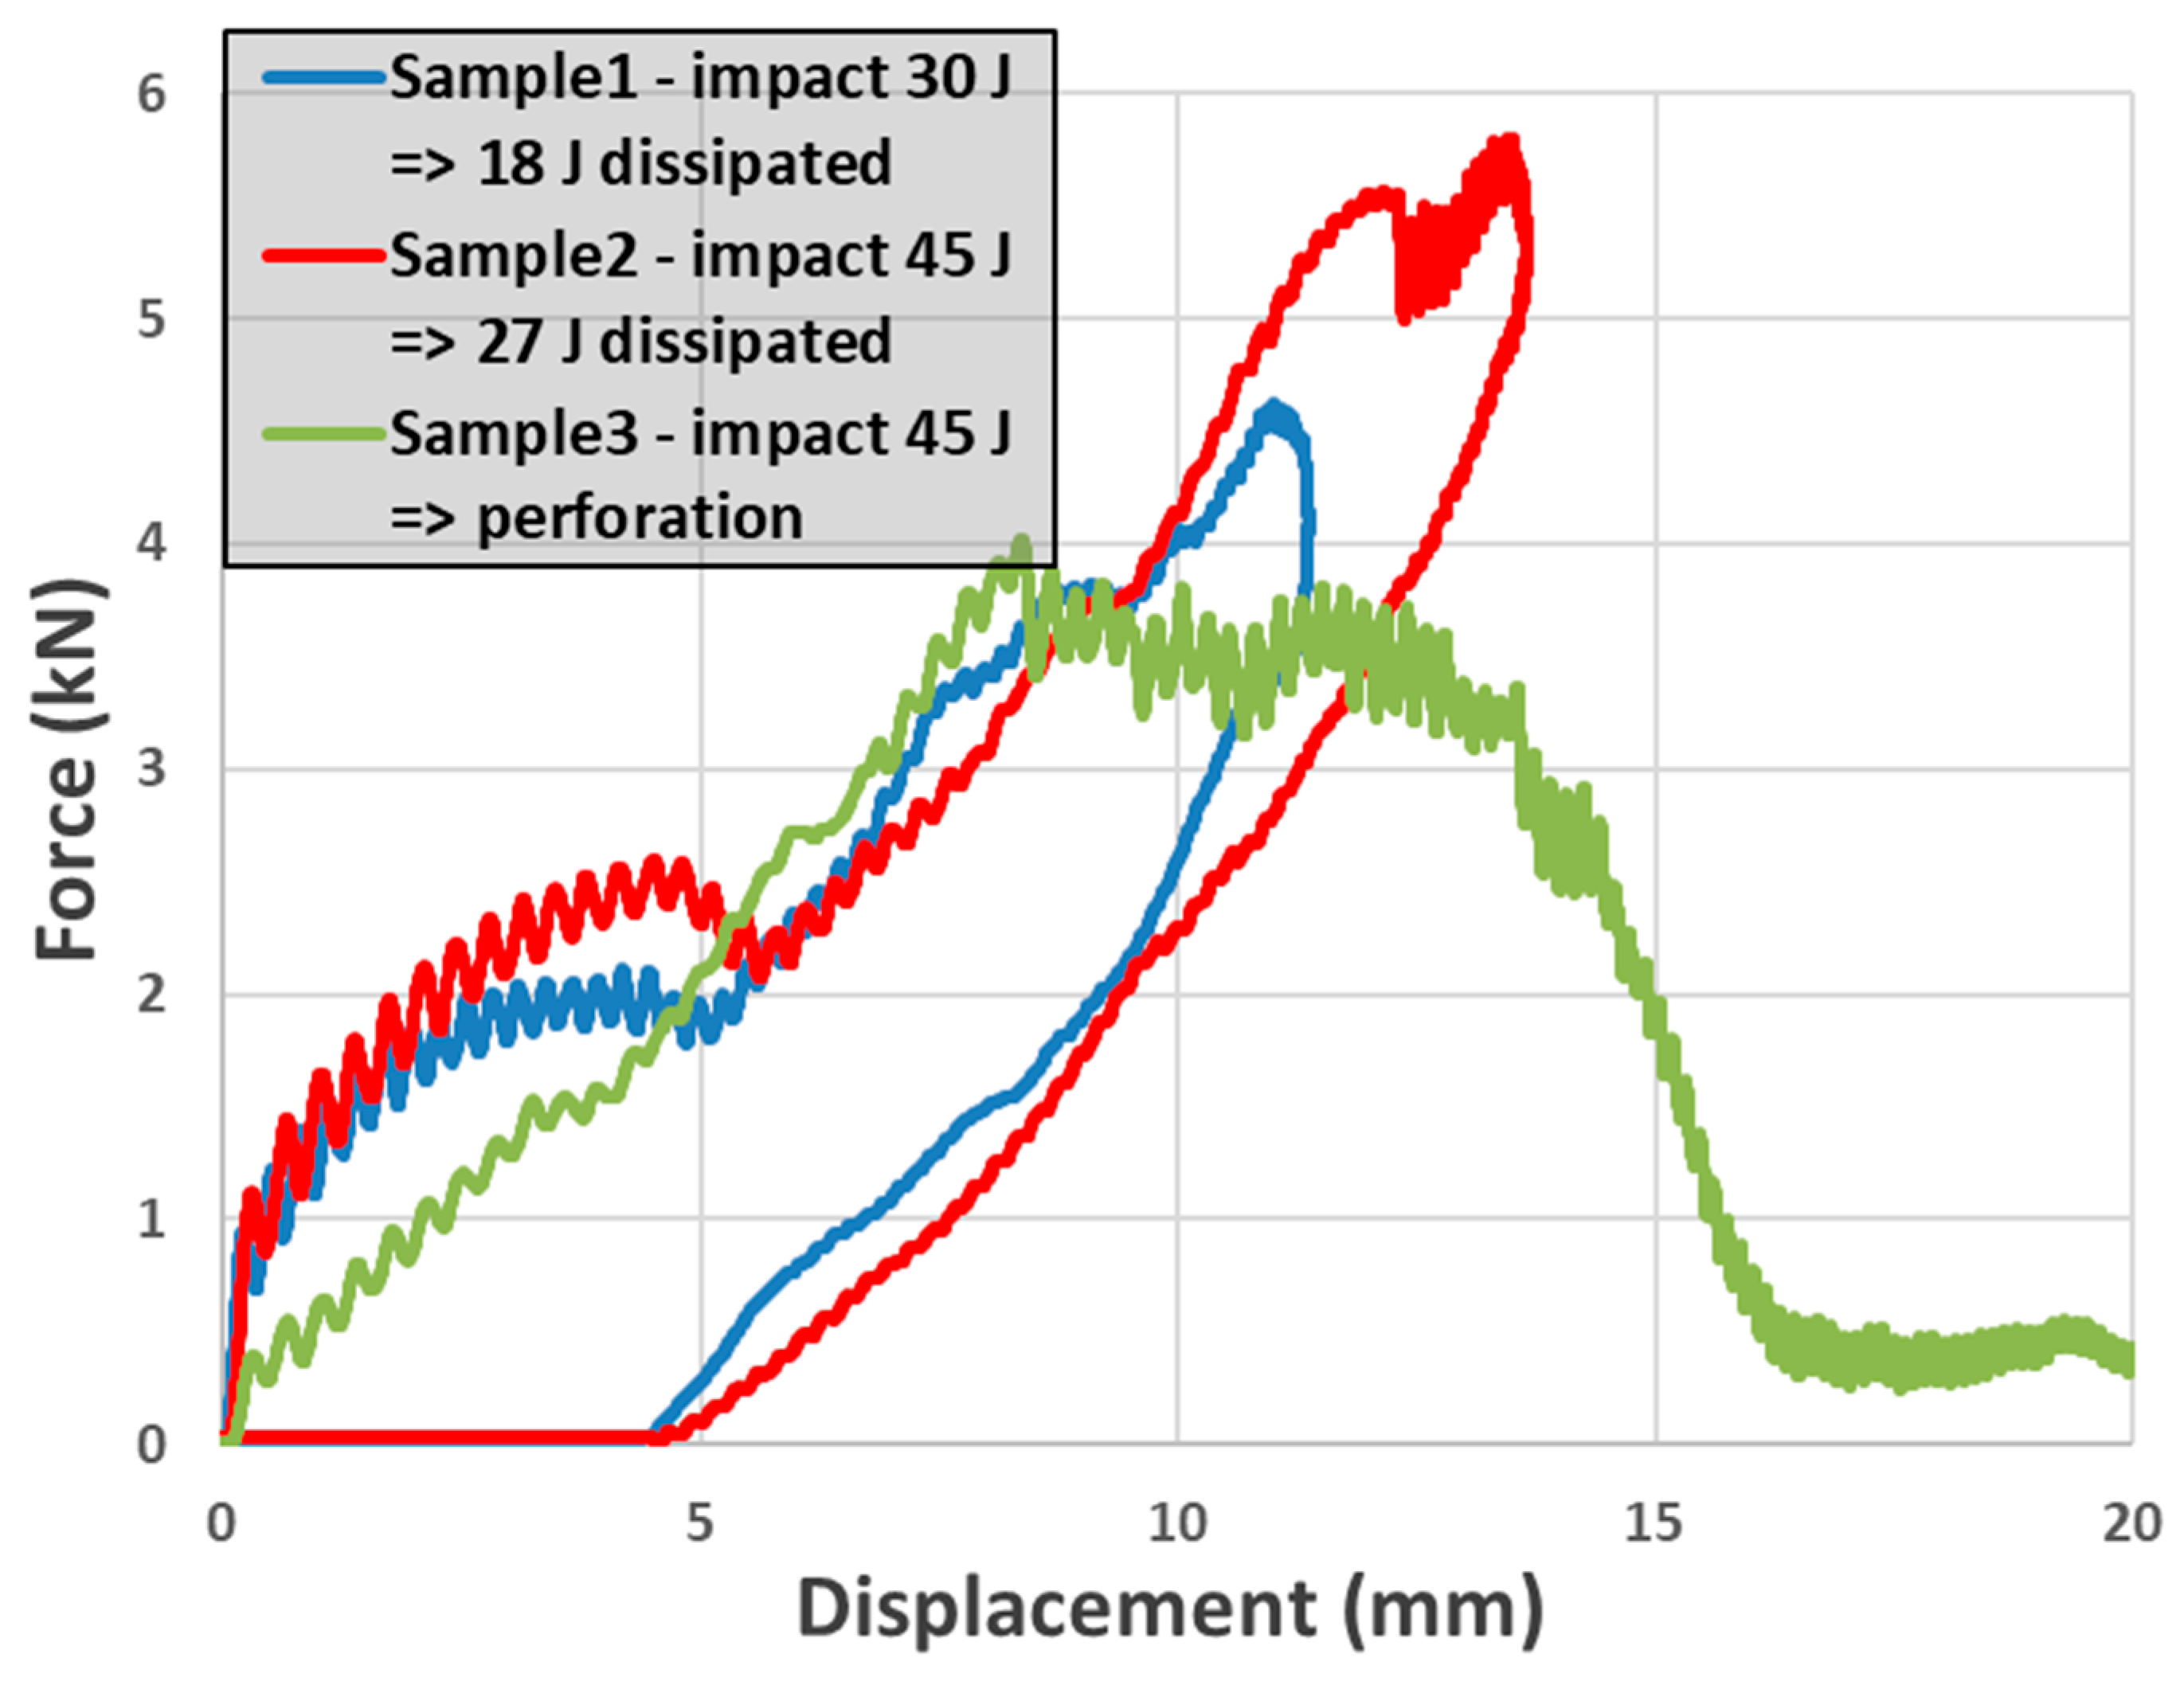
5.2. Experimental Results
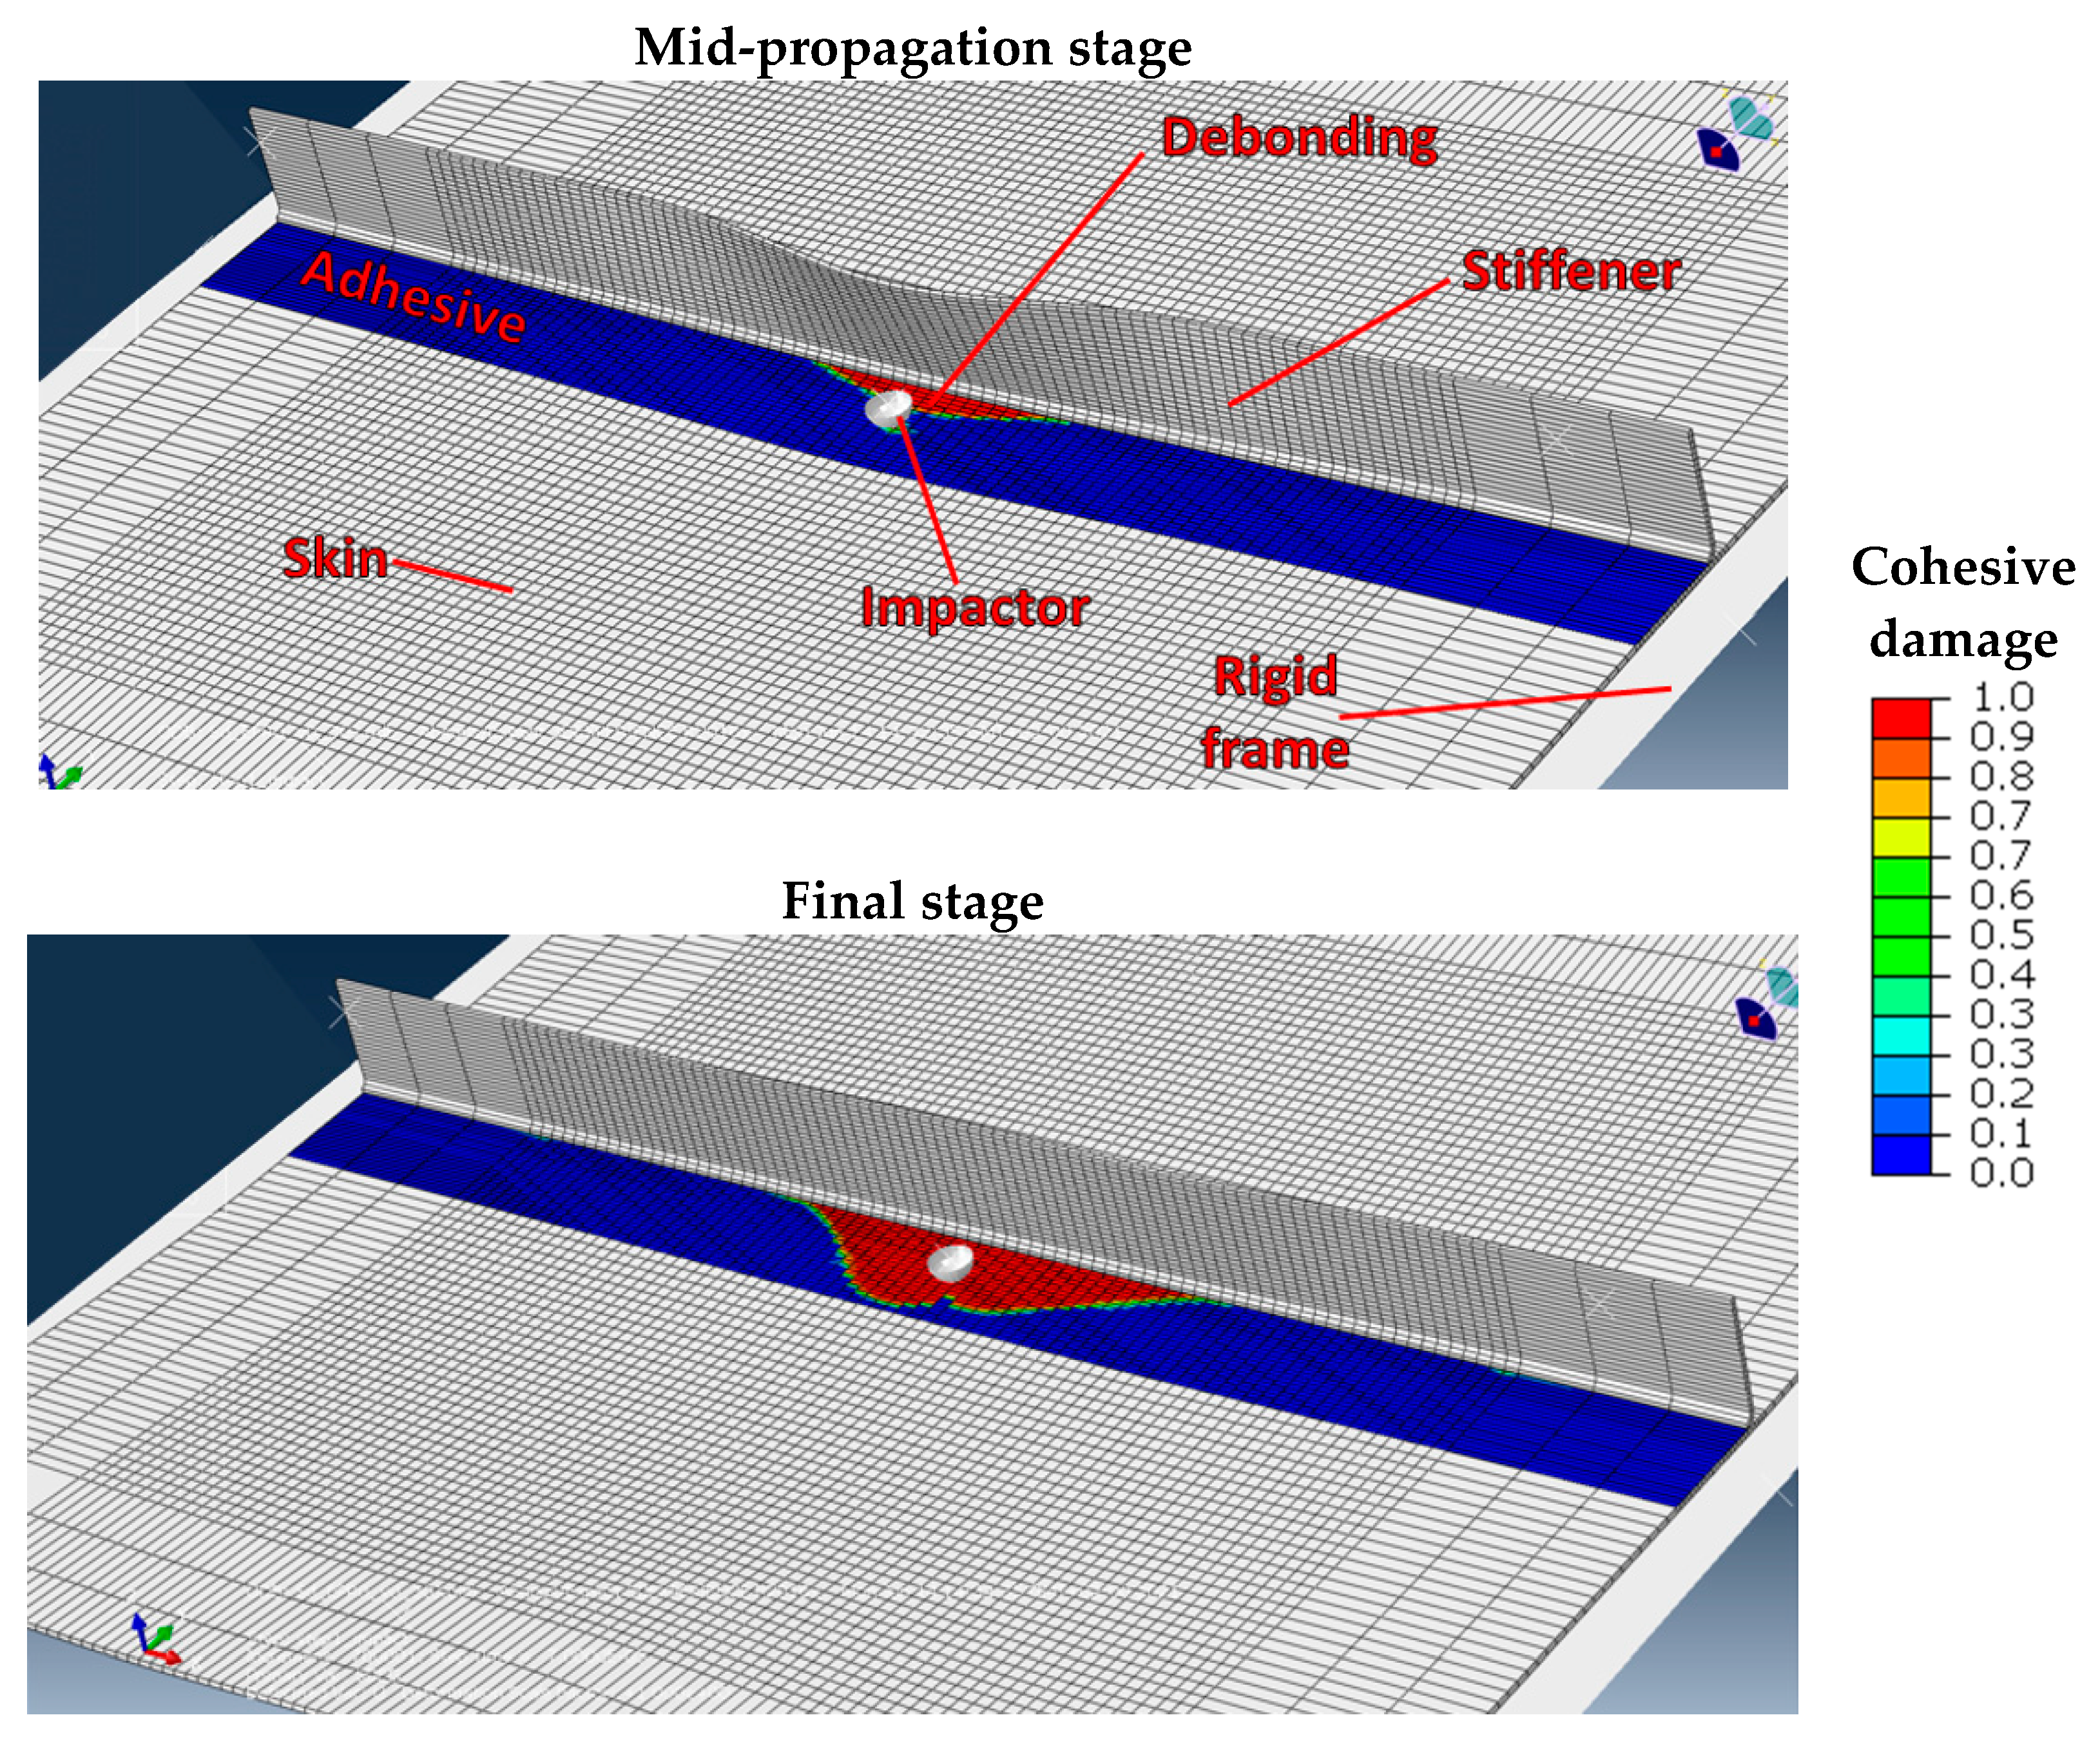
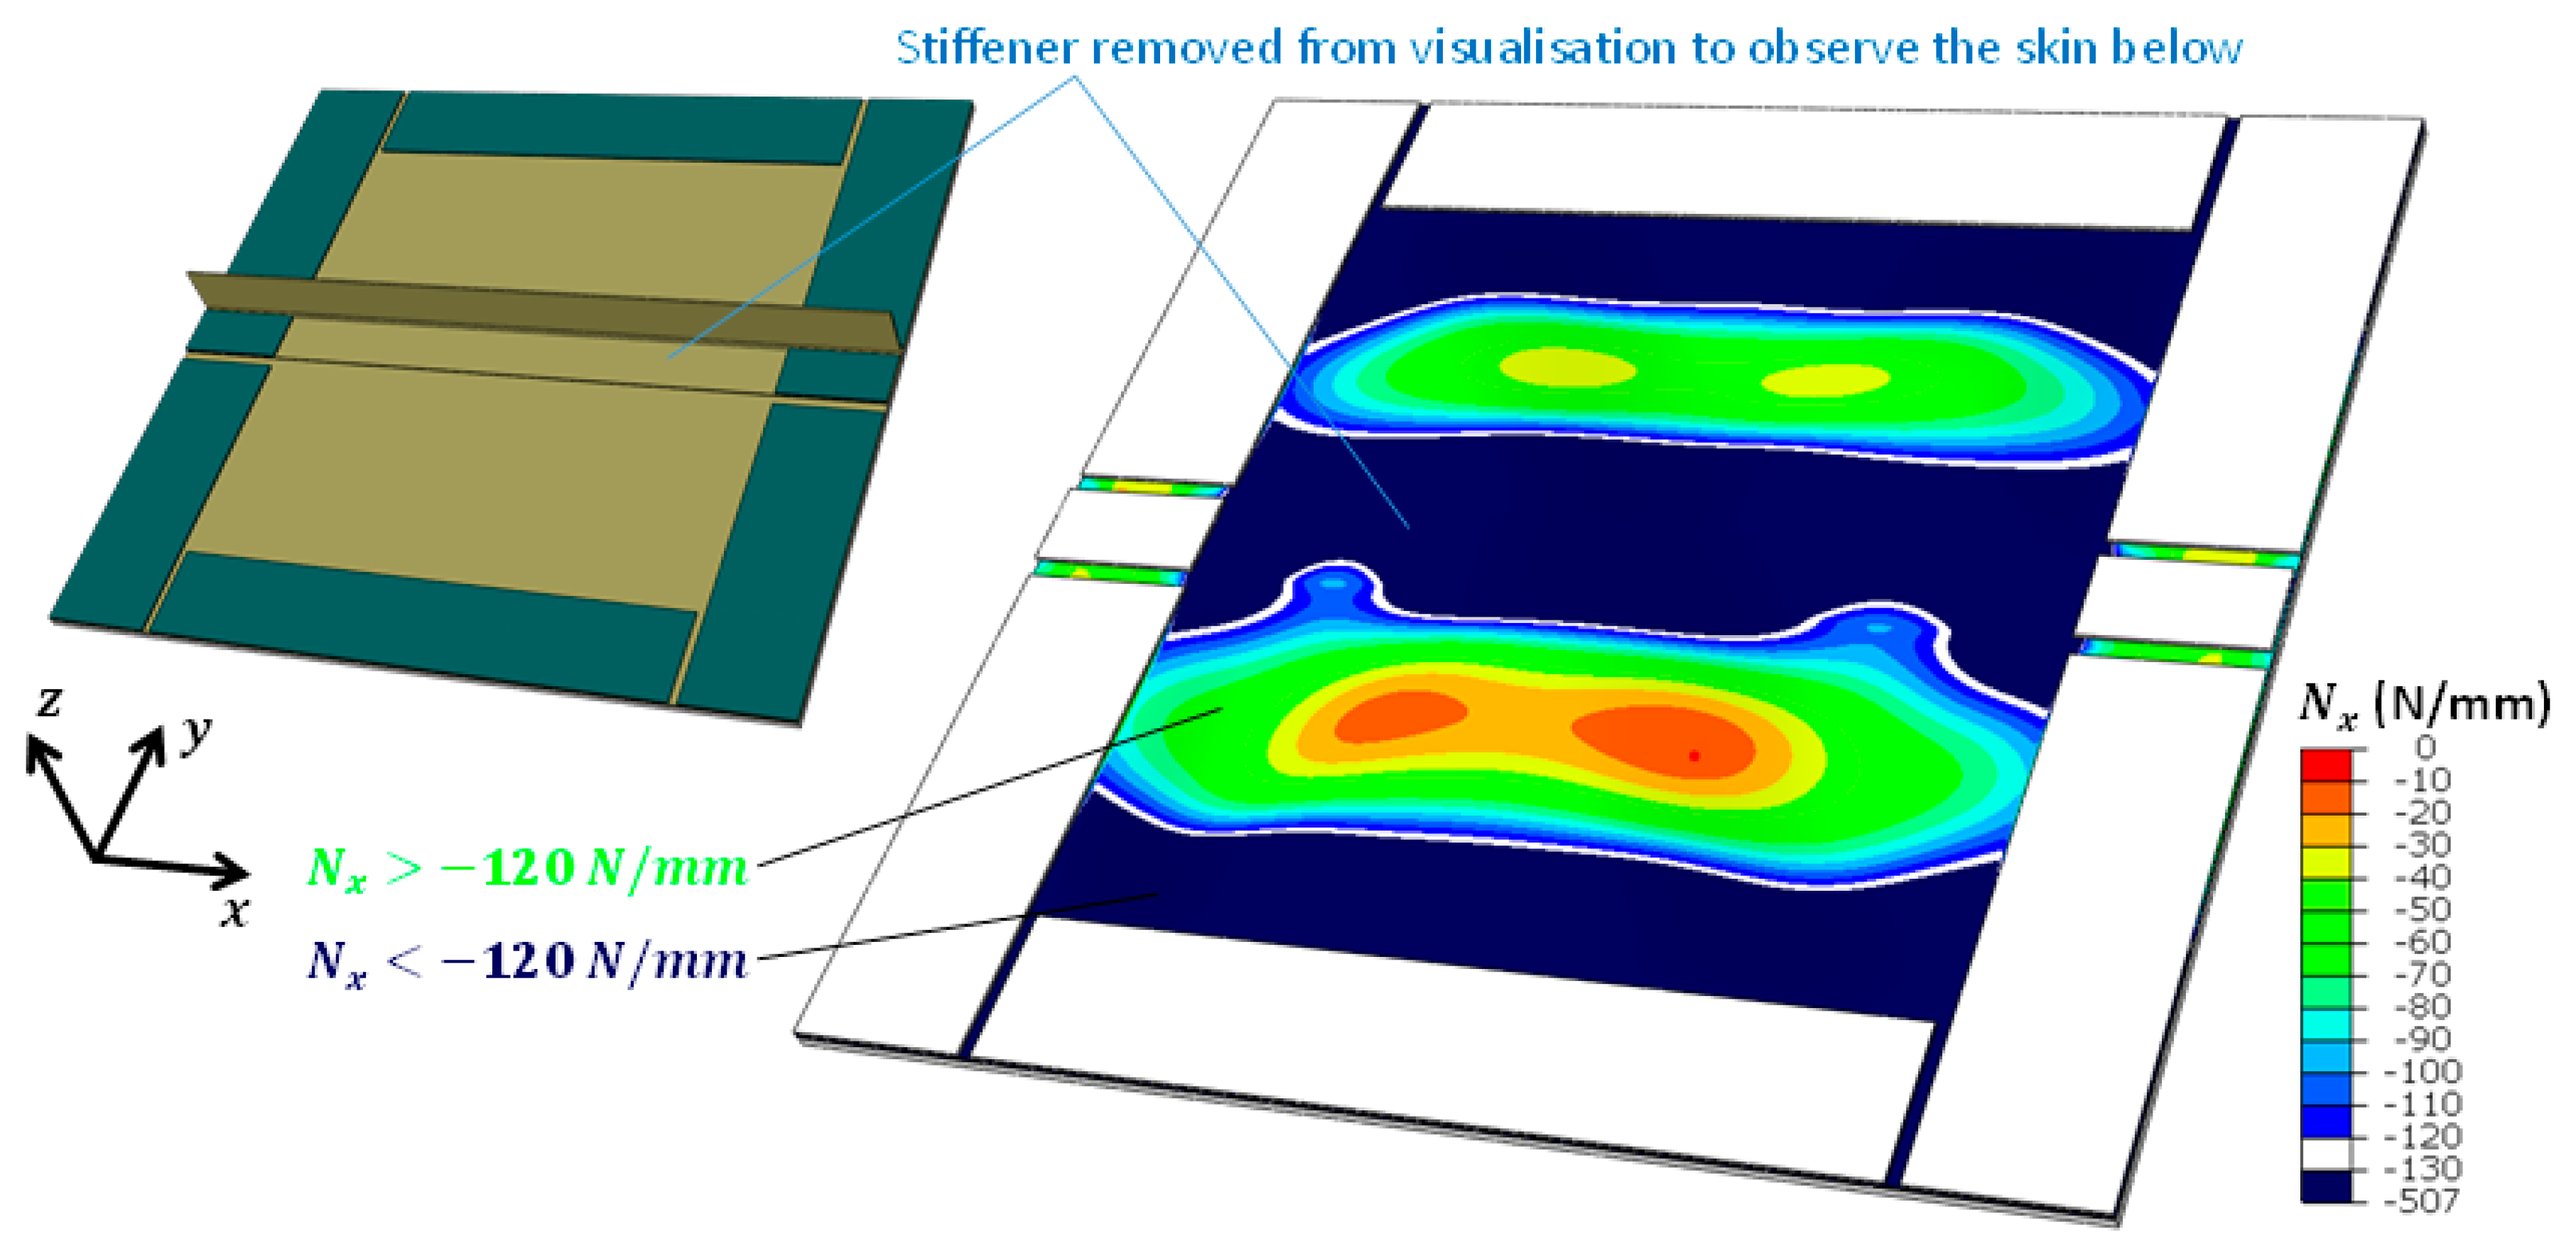
5.3. Numerical Simulation
6. Compression after Impact
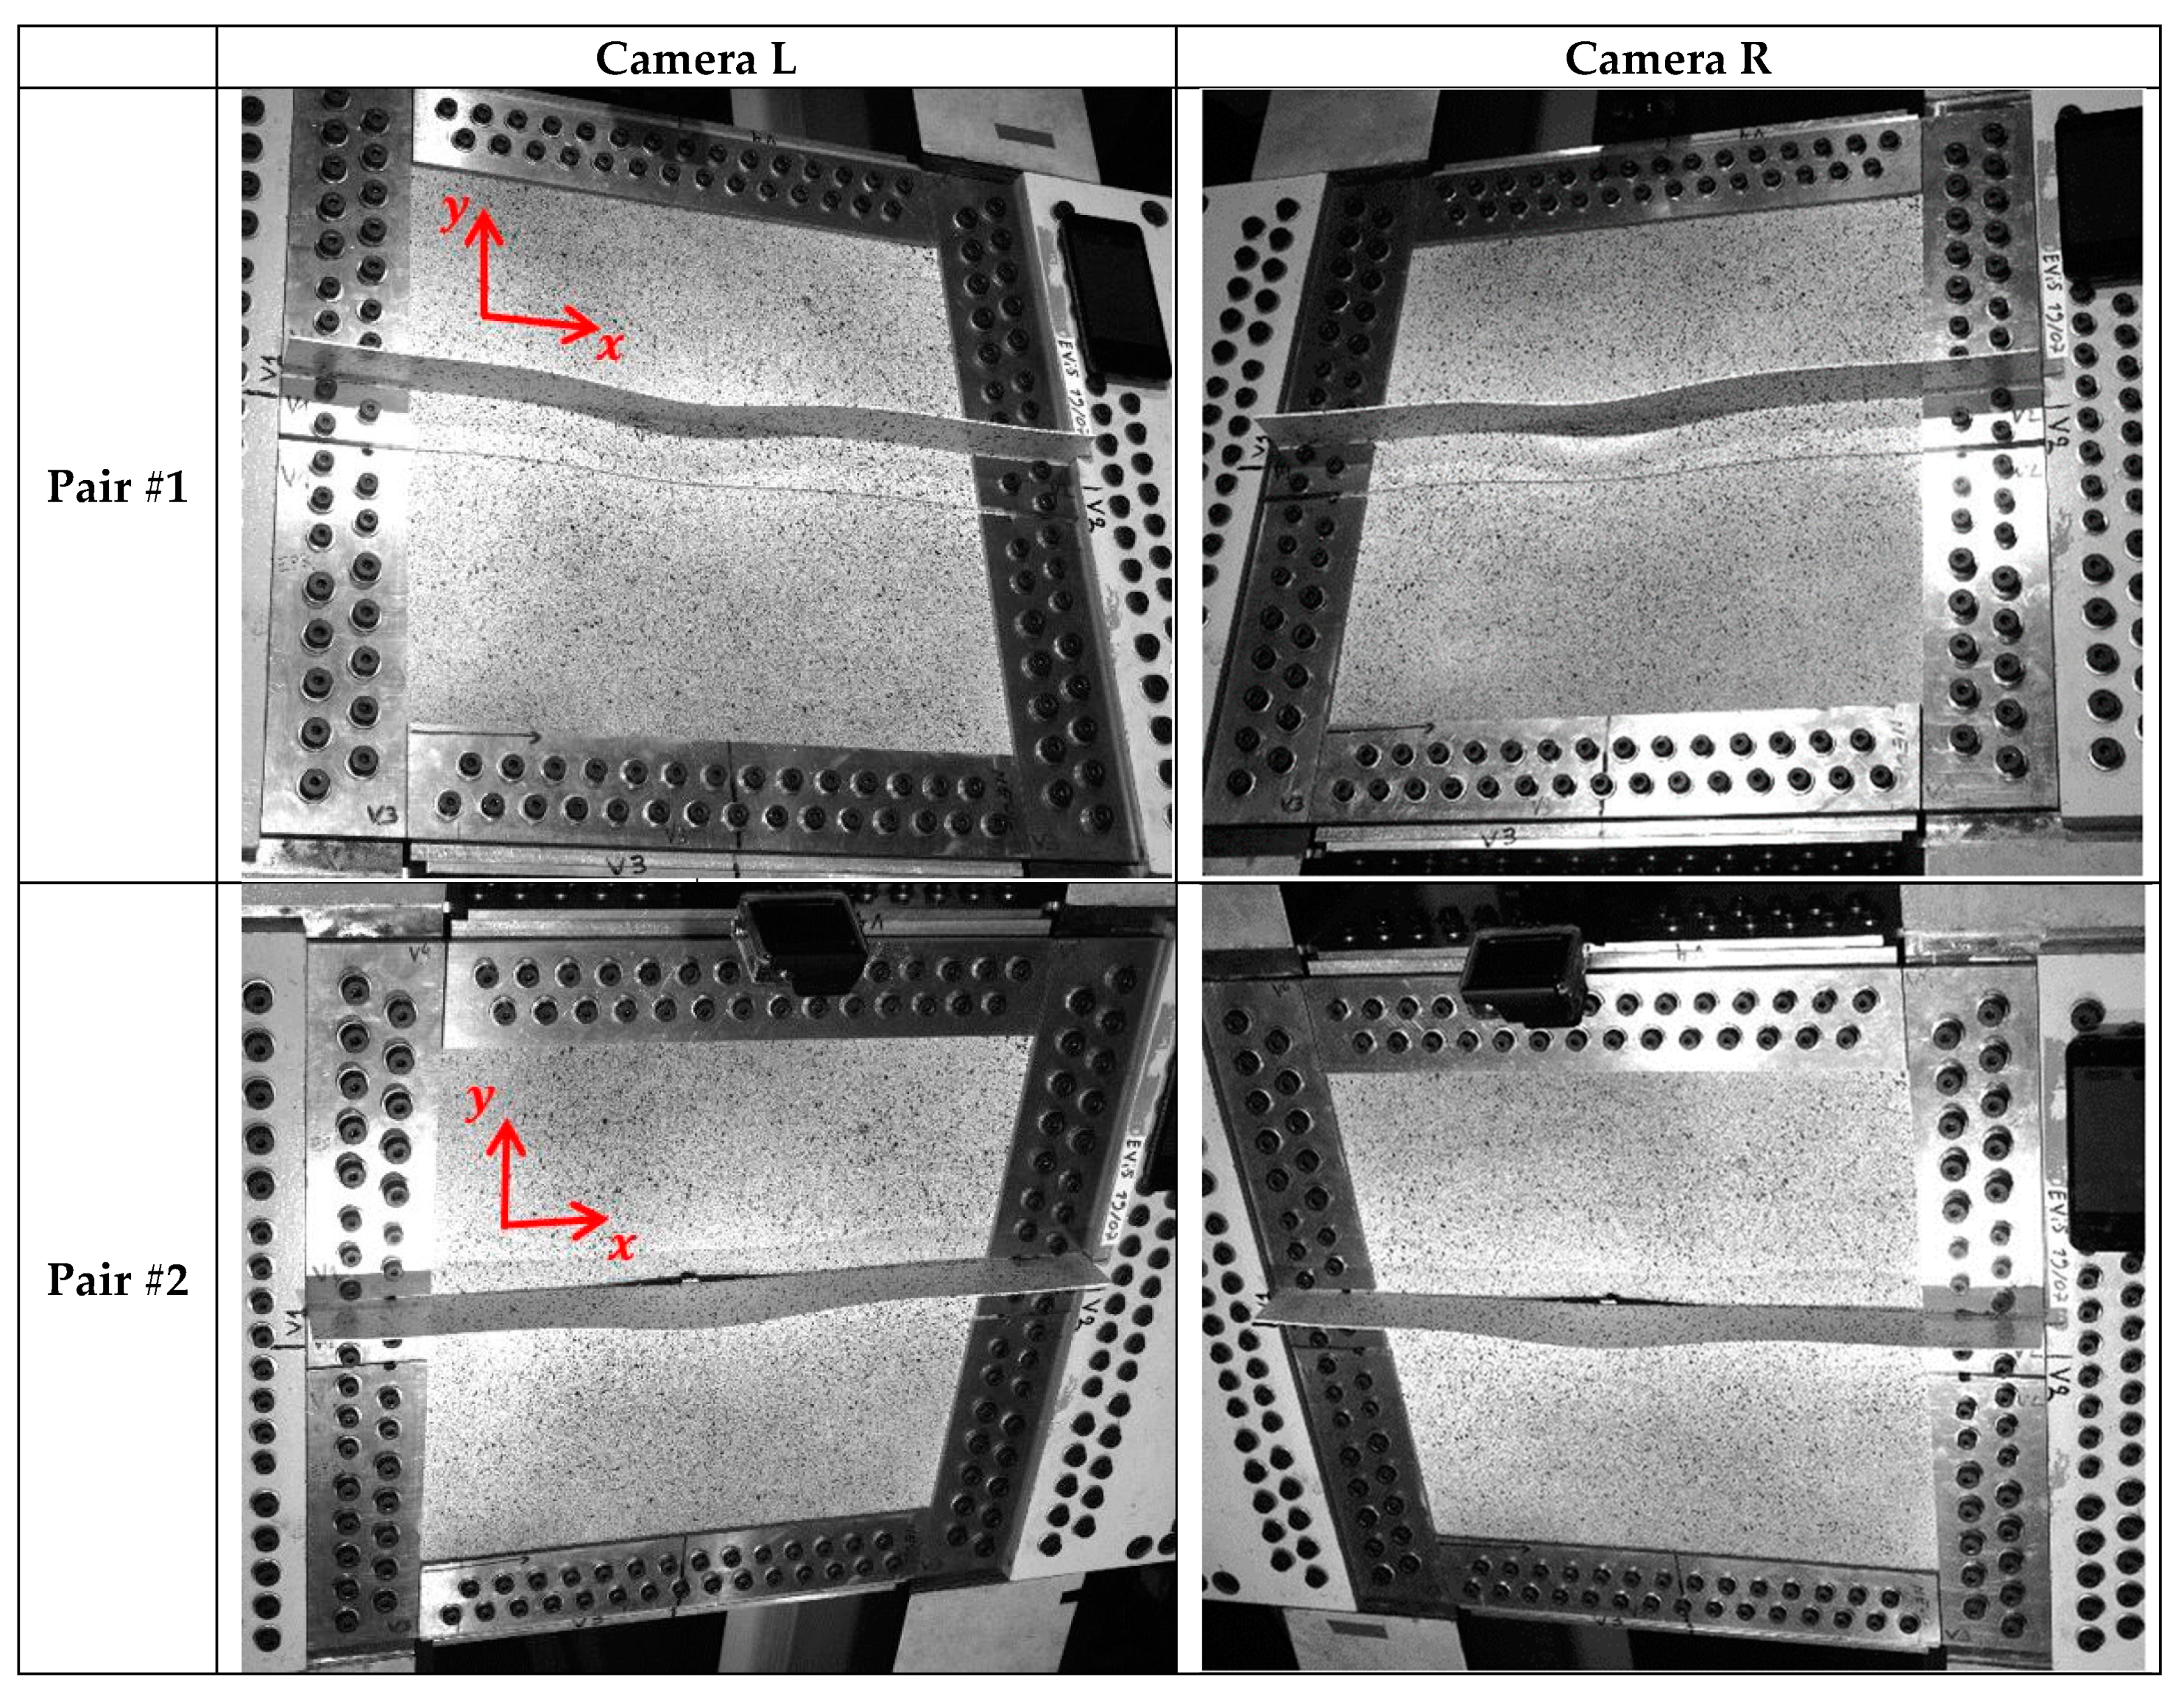
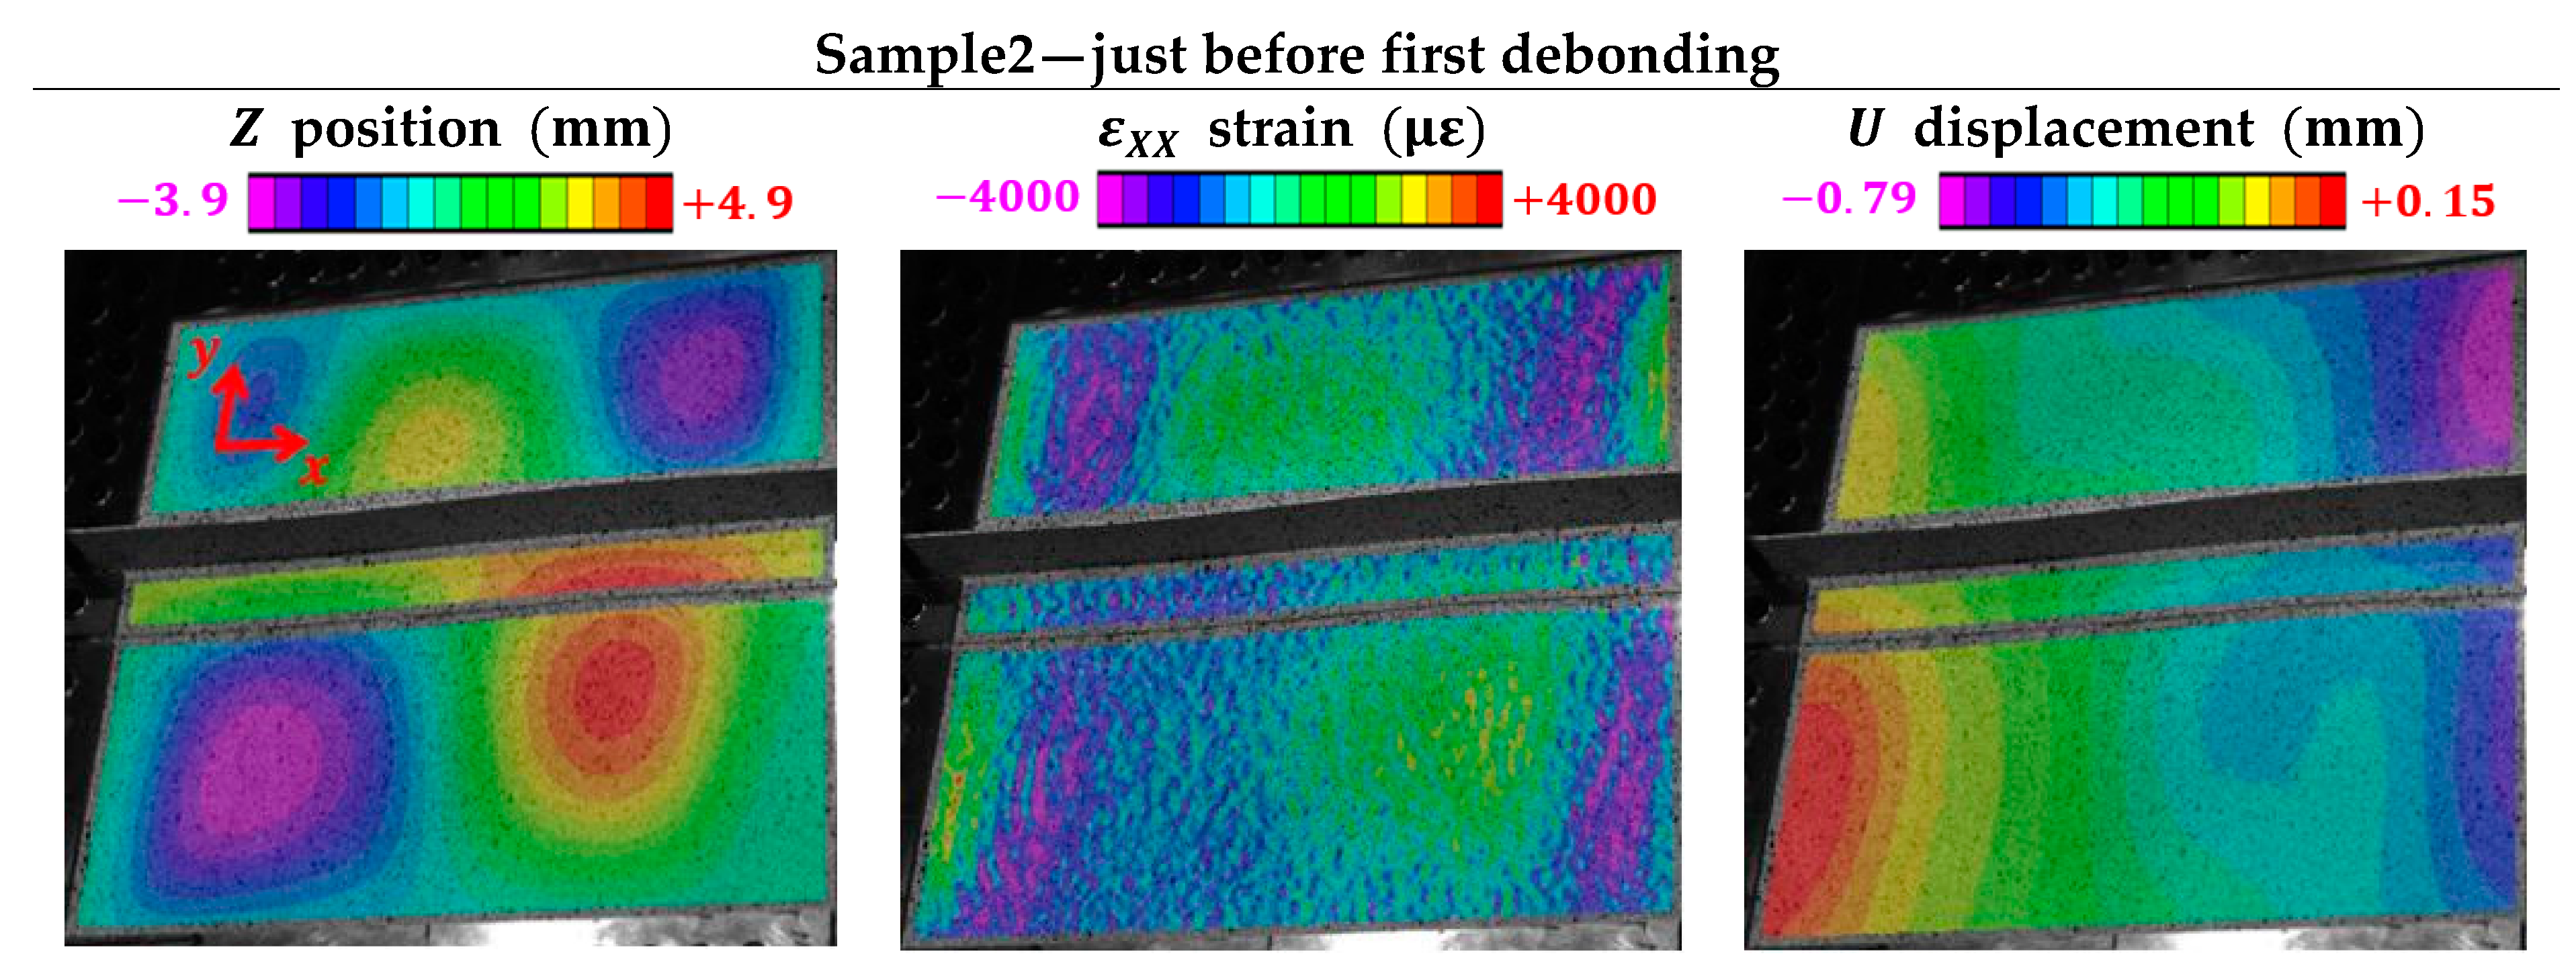
6.1. Monitoring
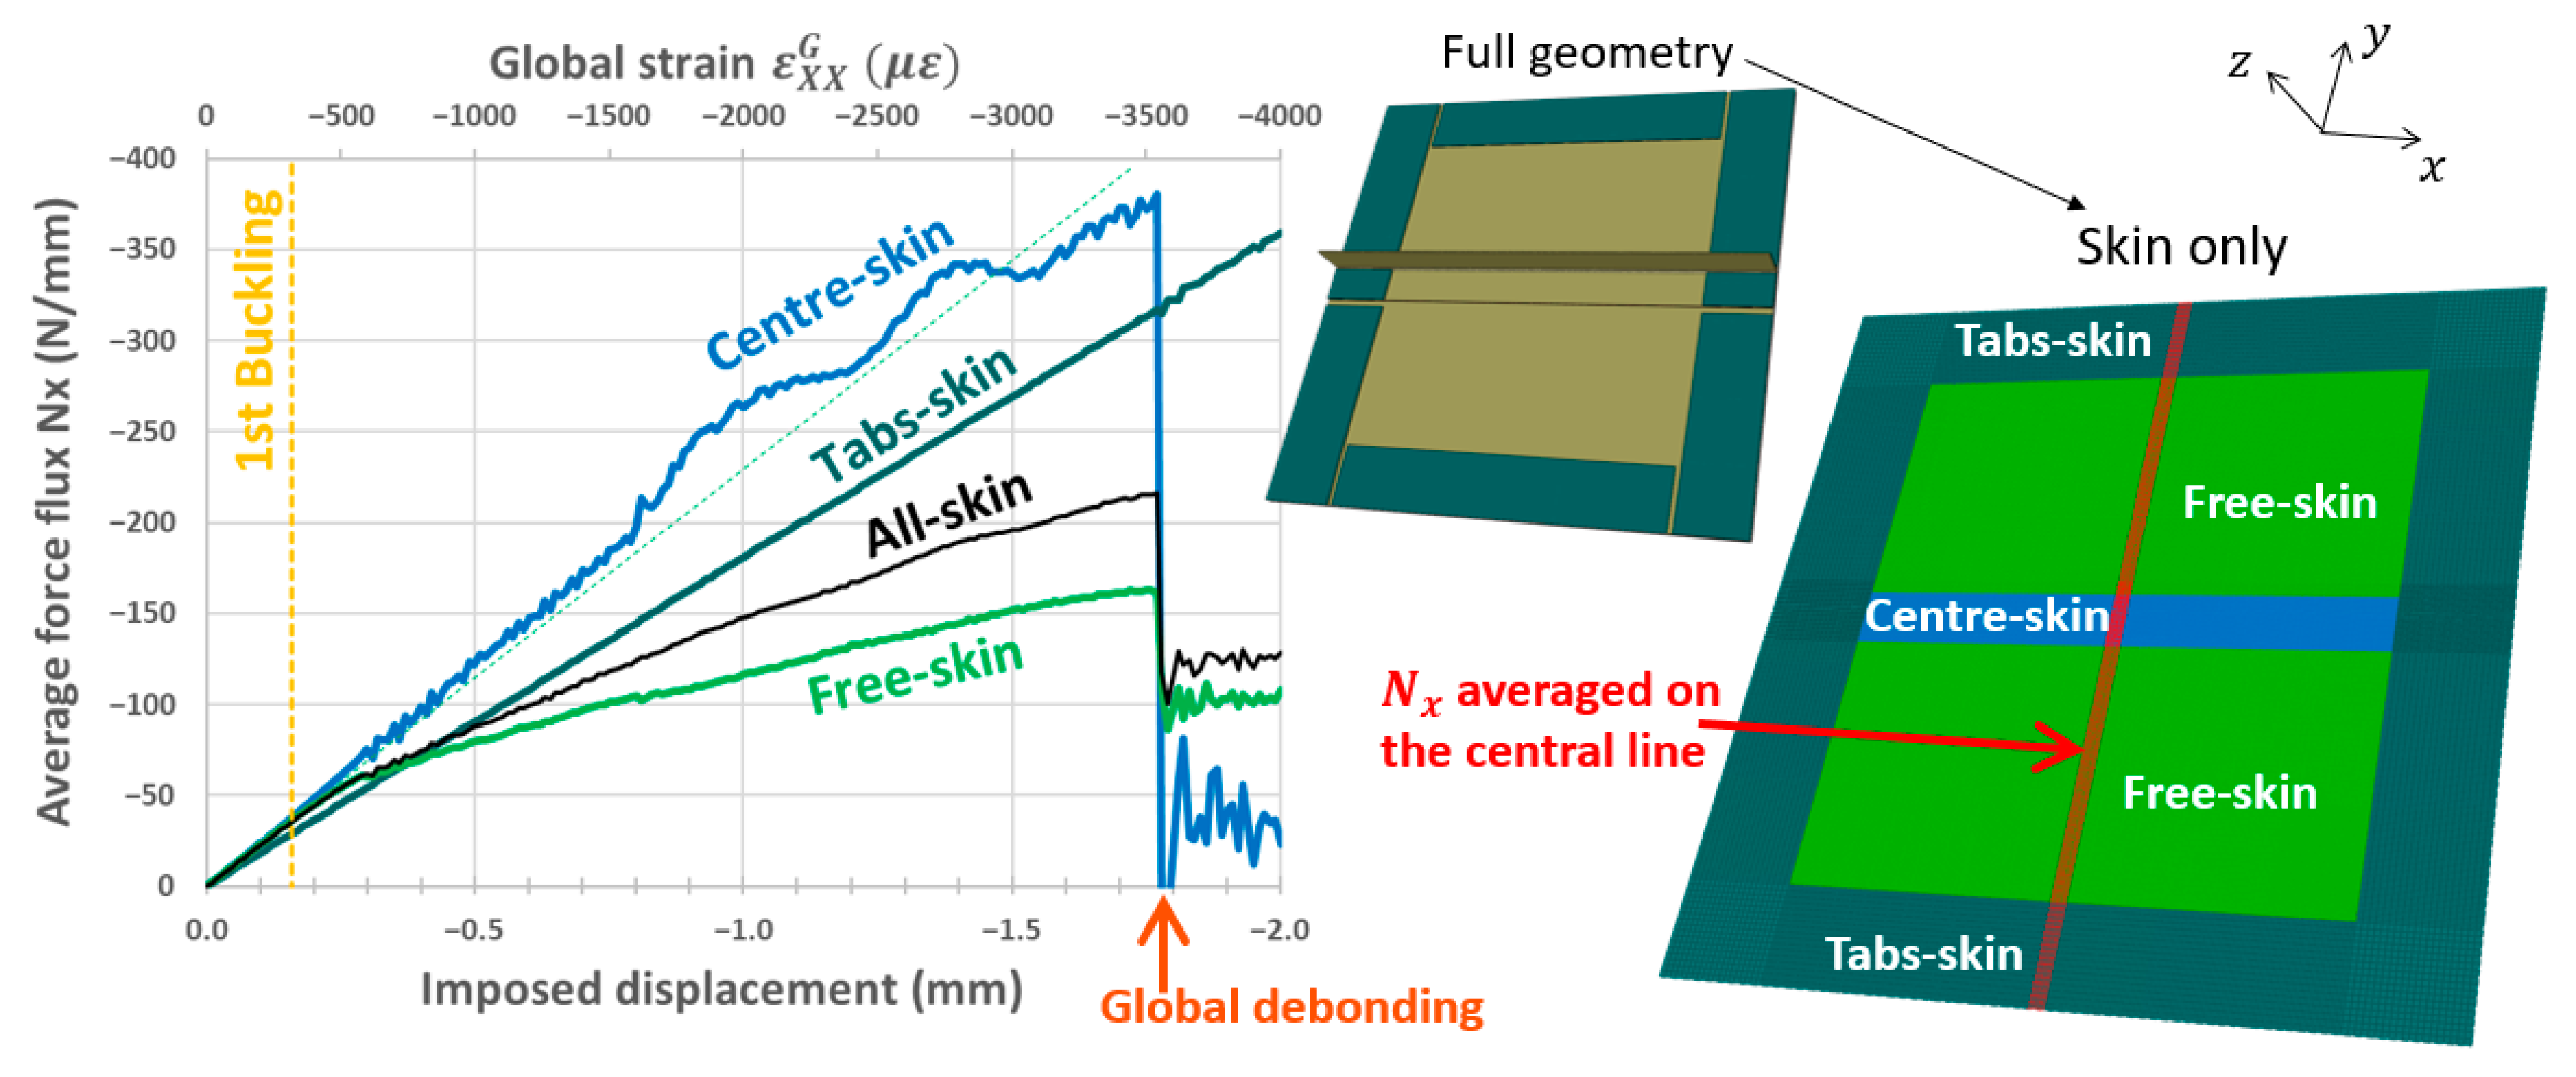
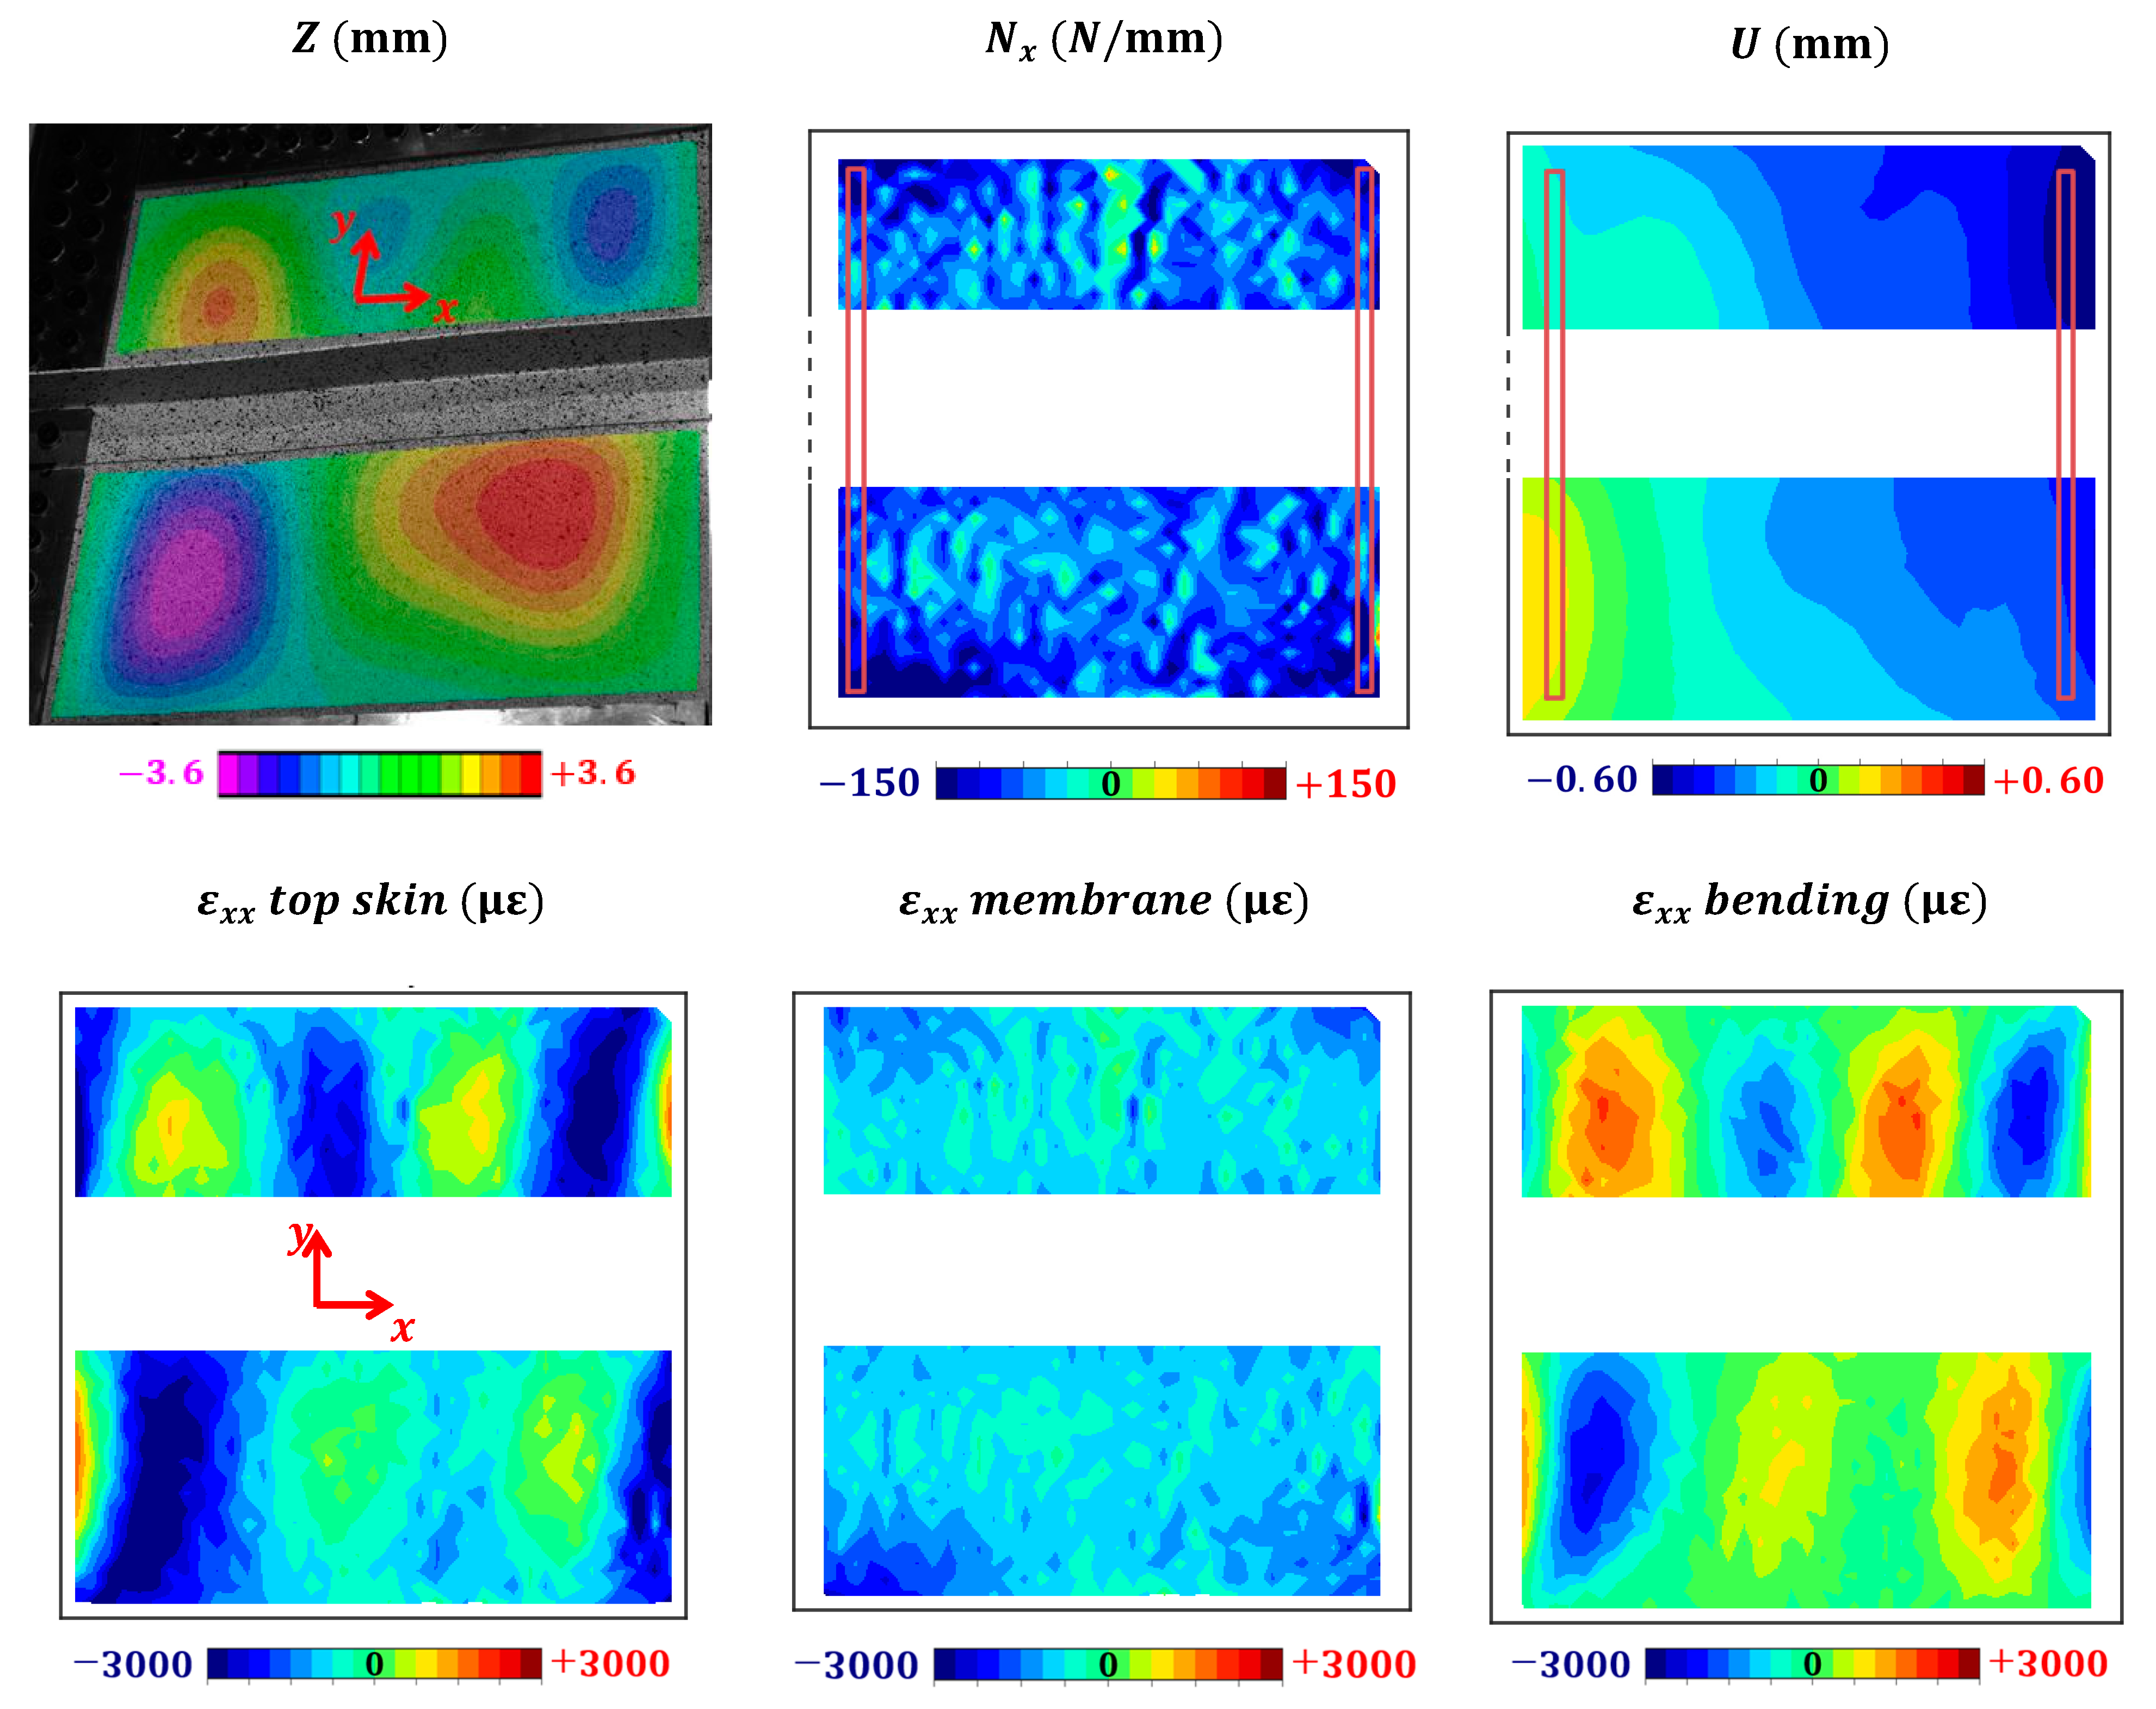
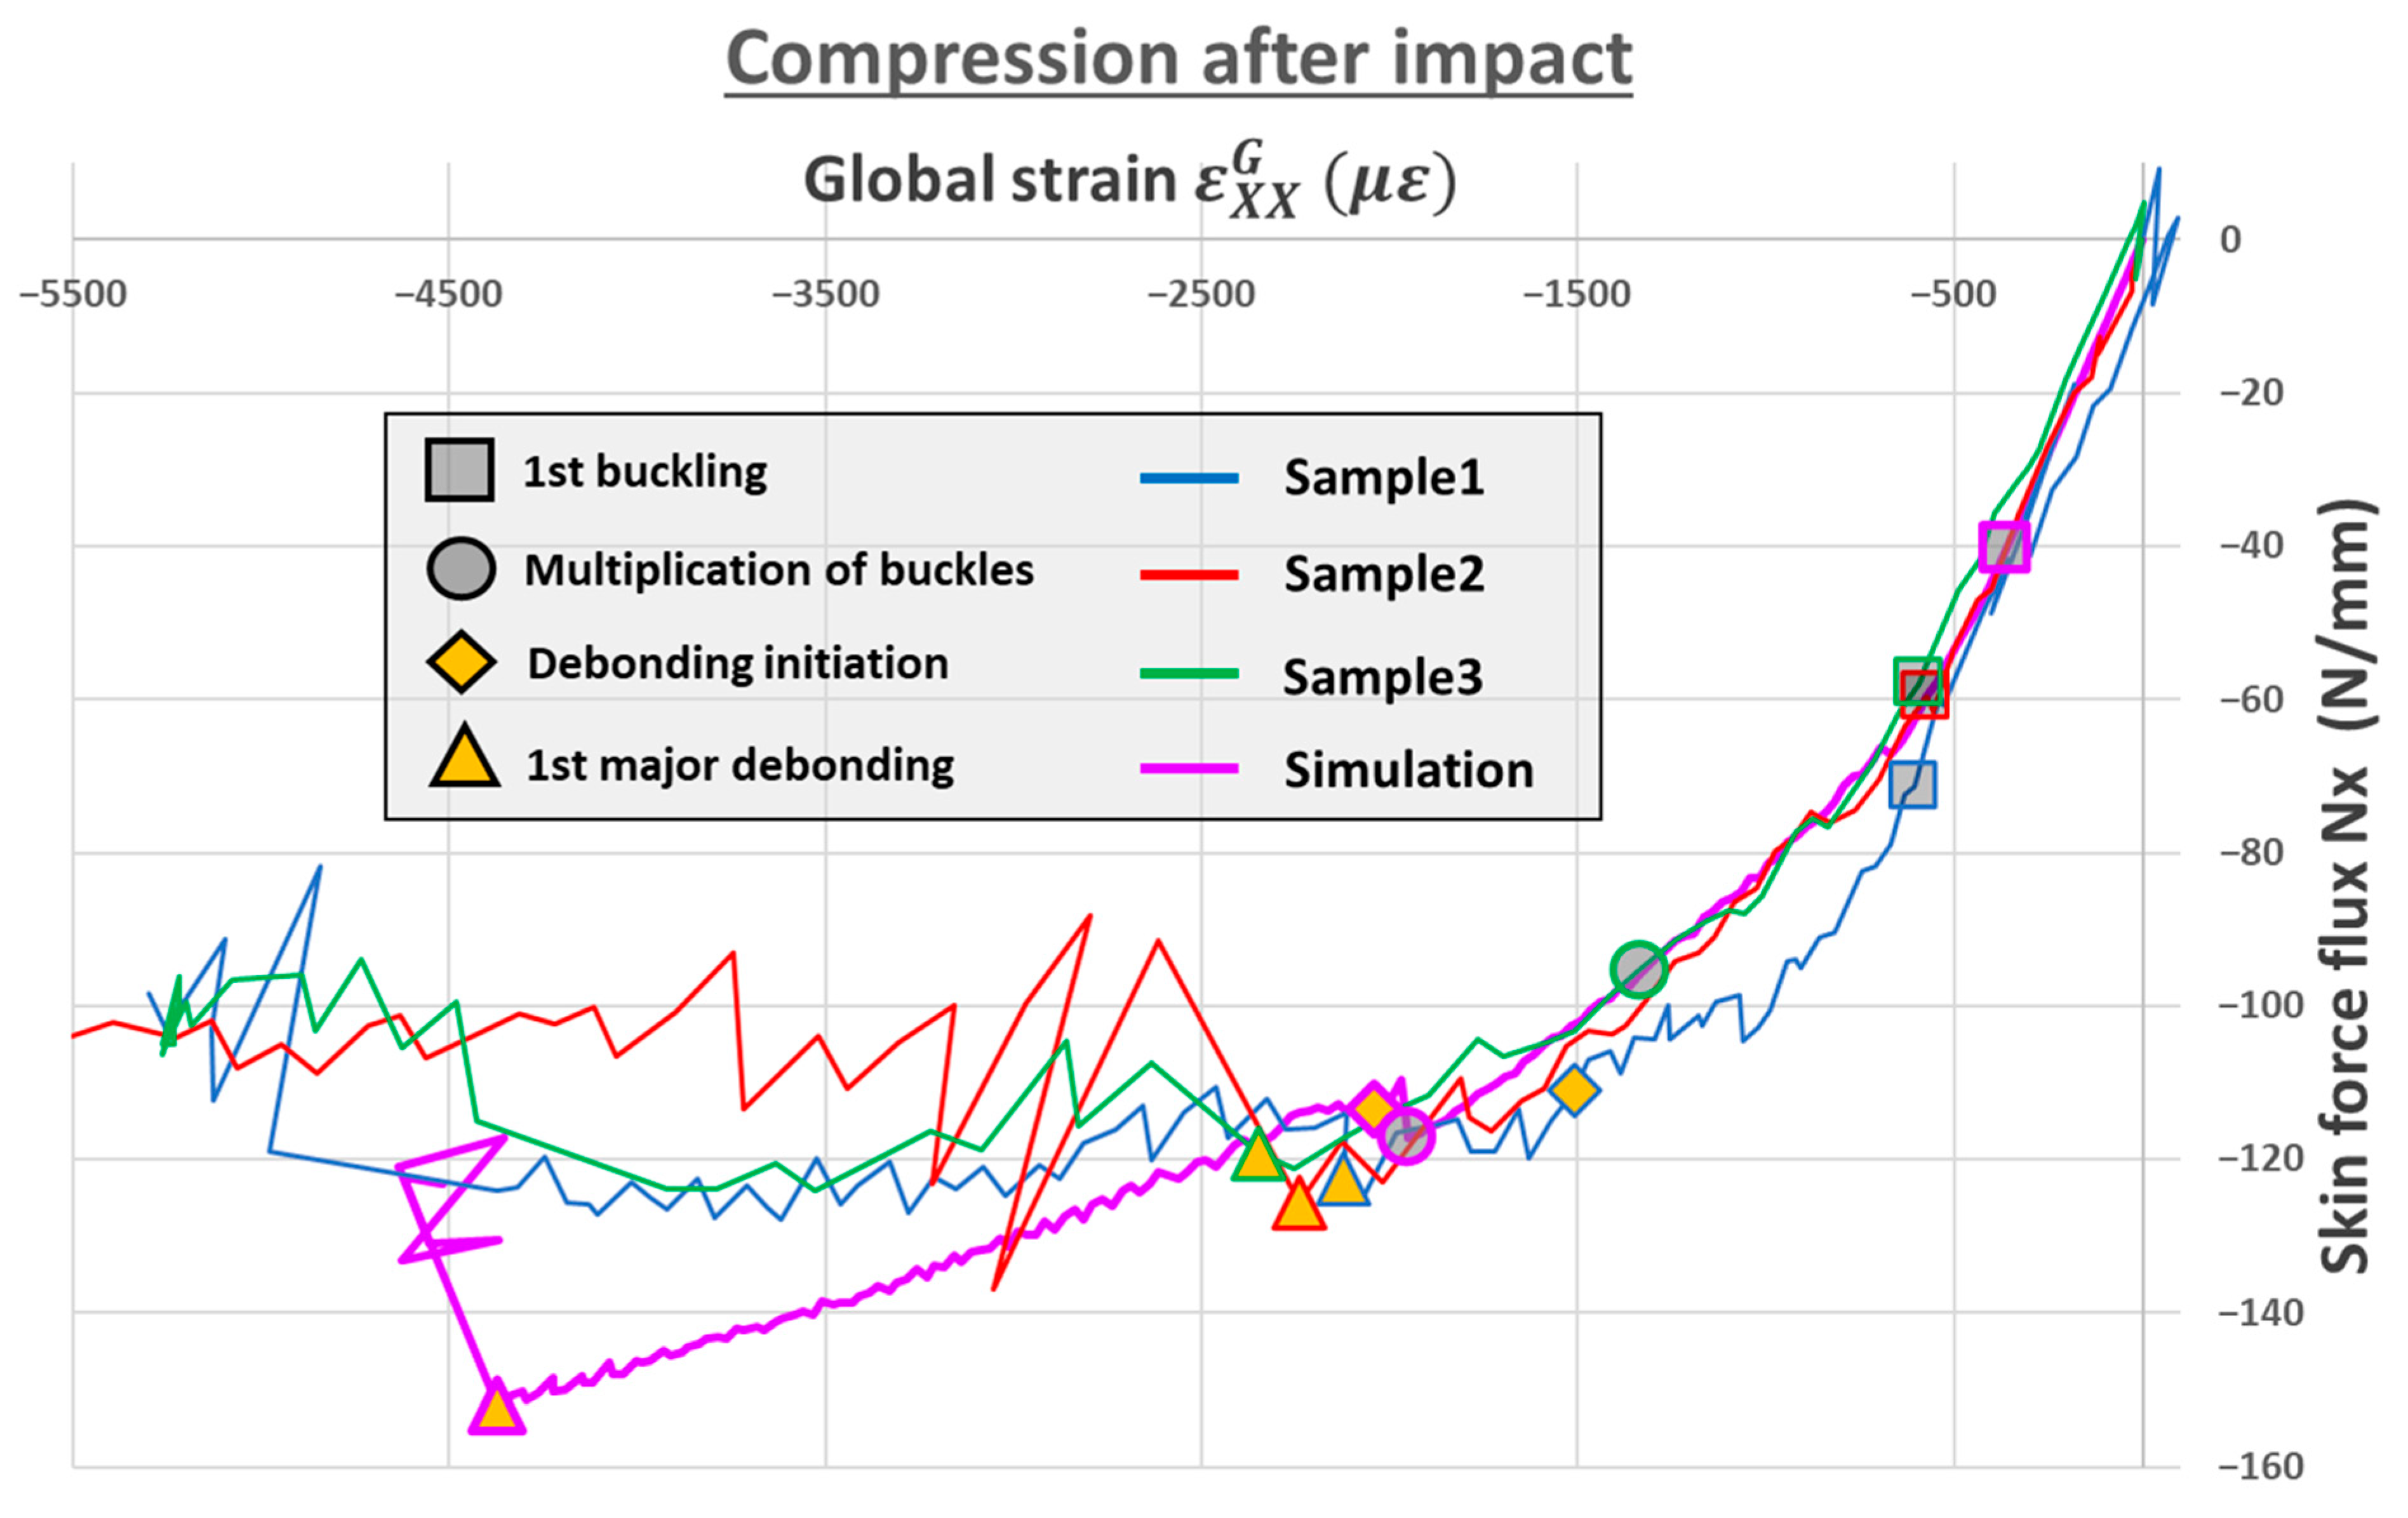
6.2. Loading Assessment: Force Flux and Global Strain
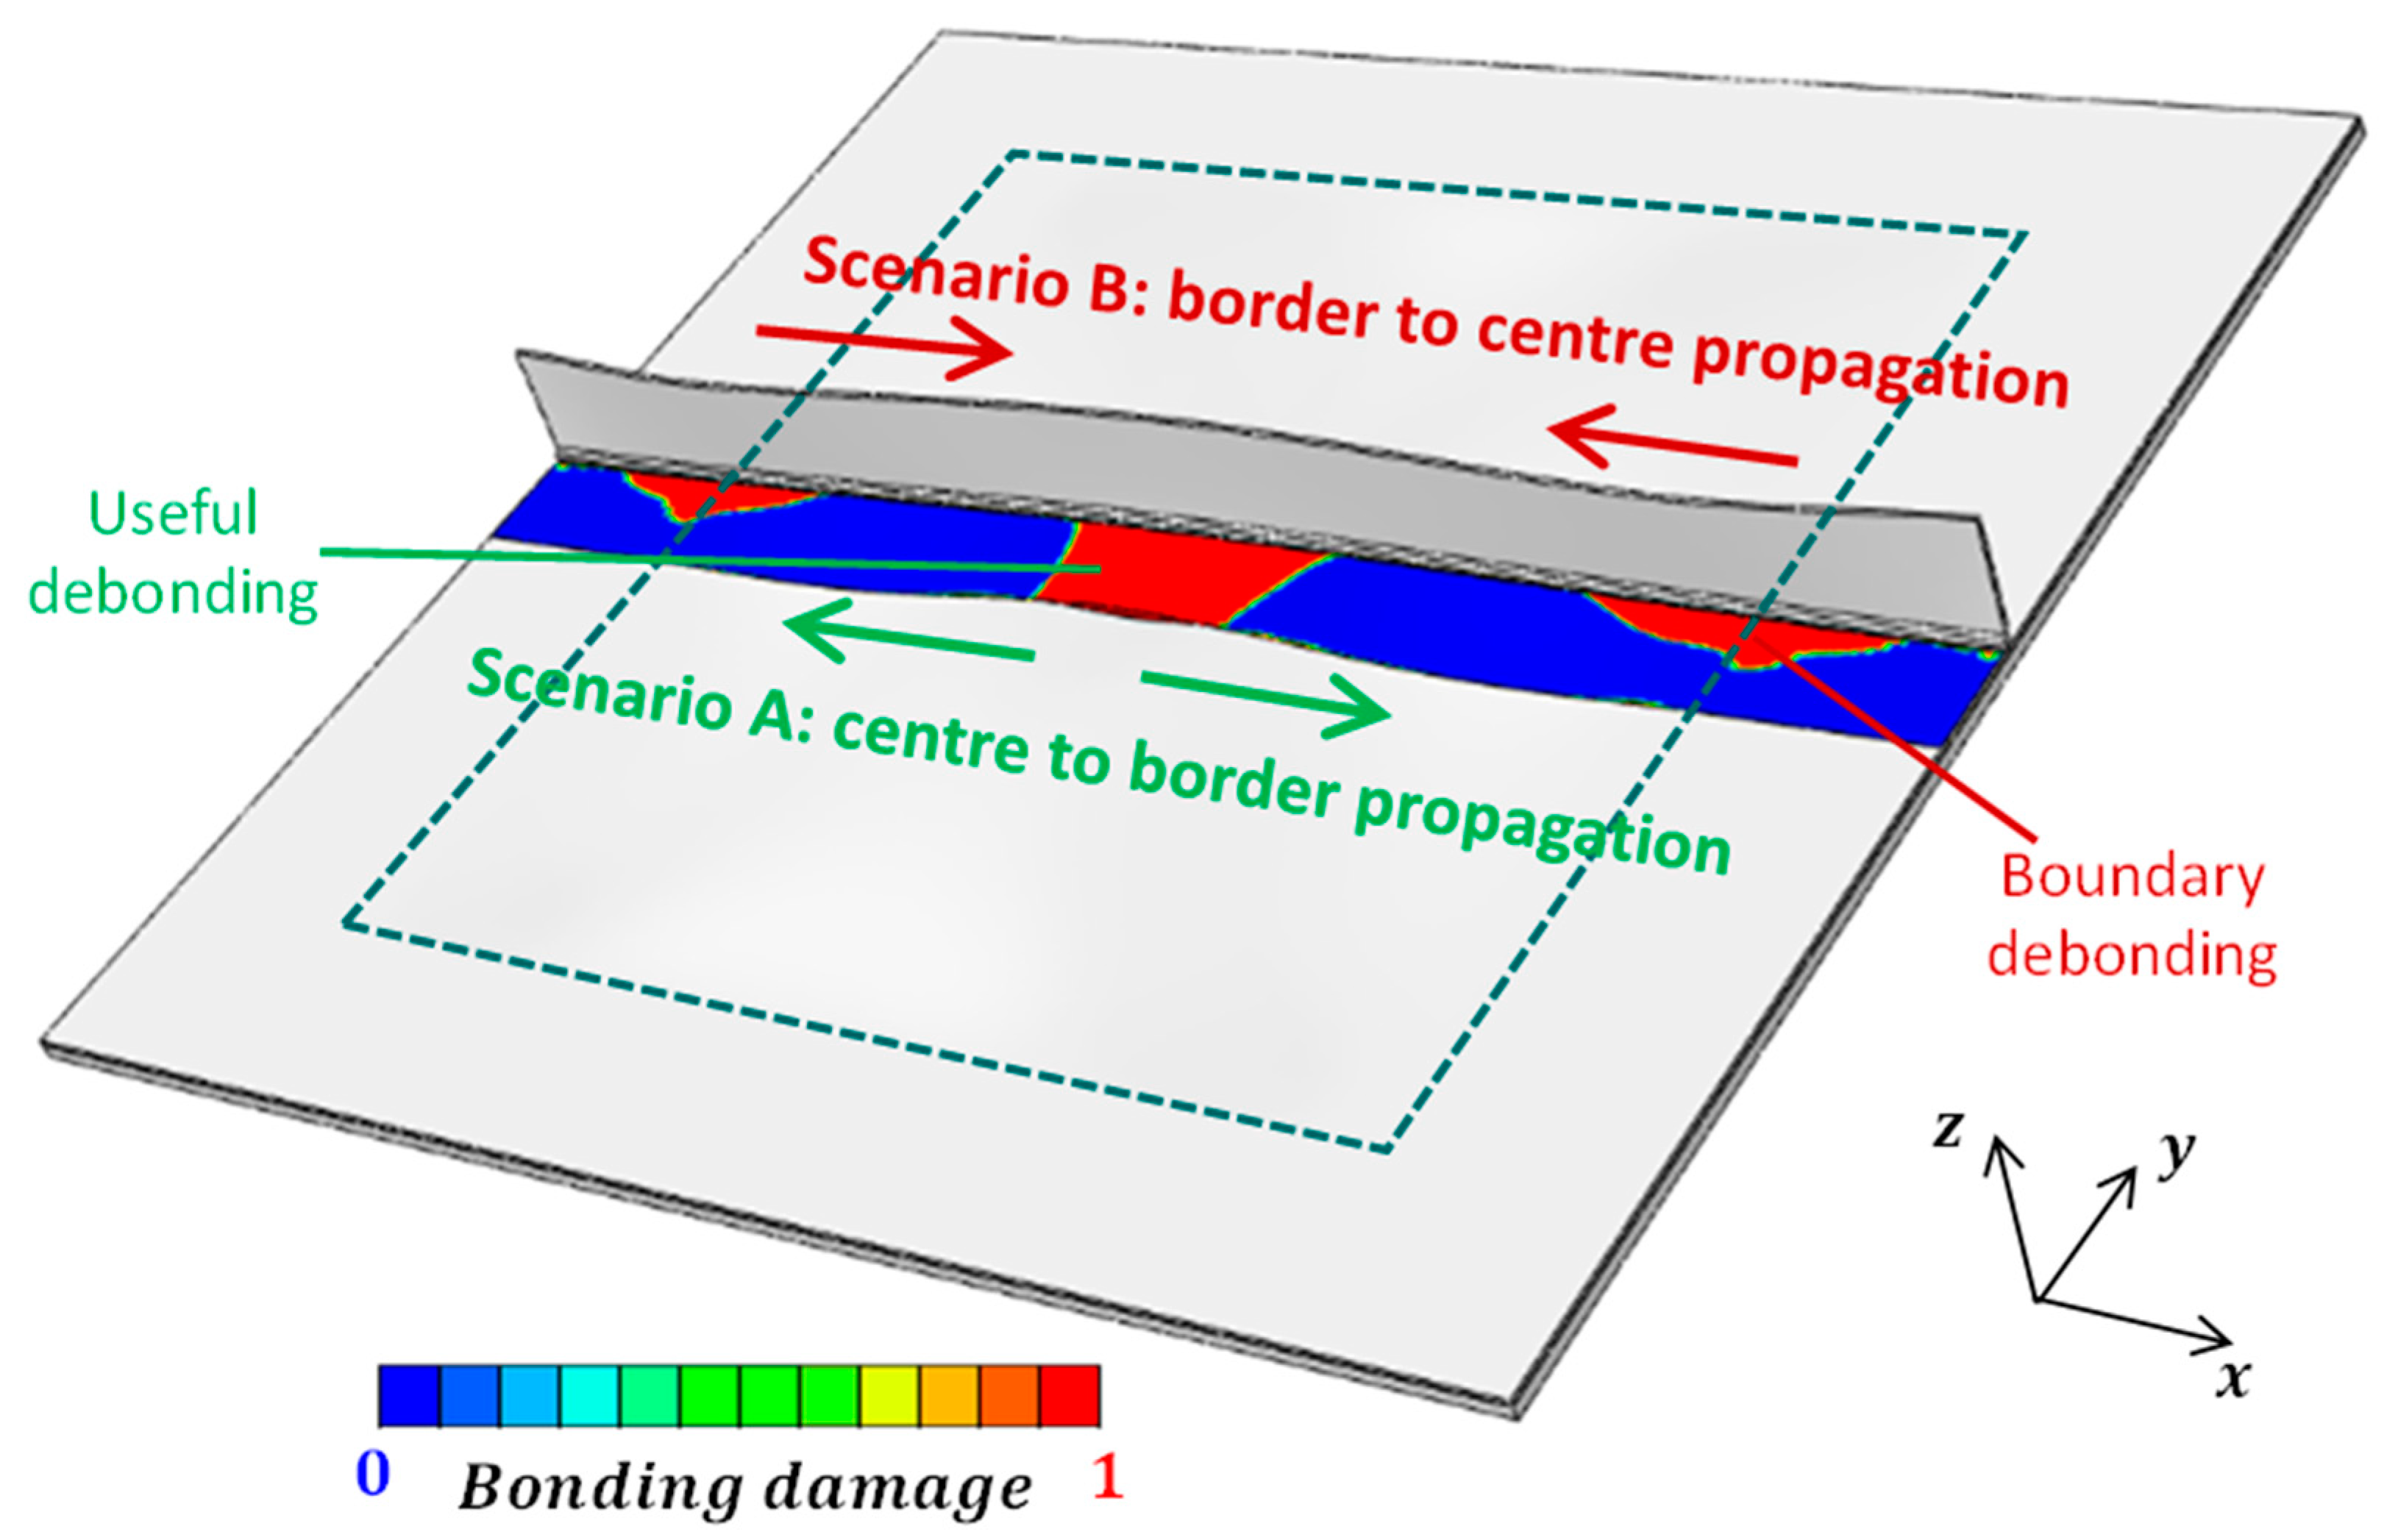
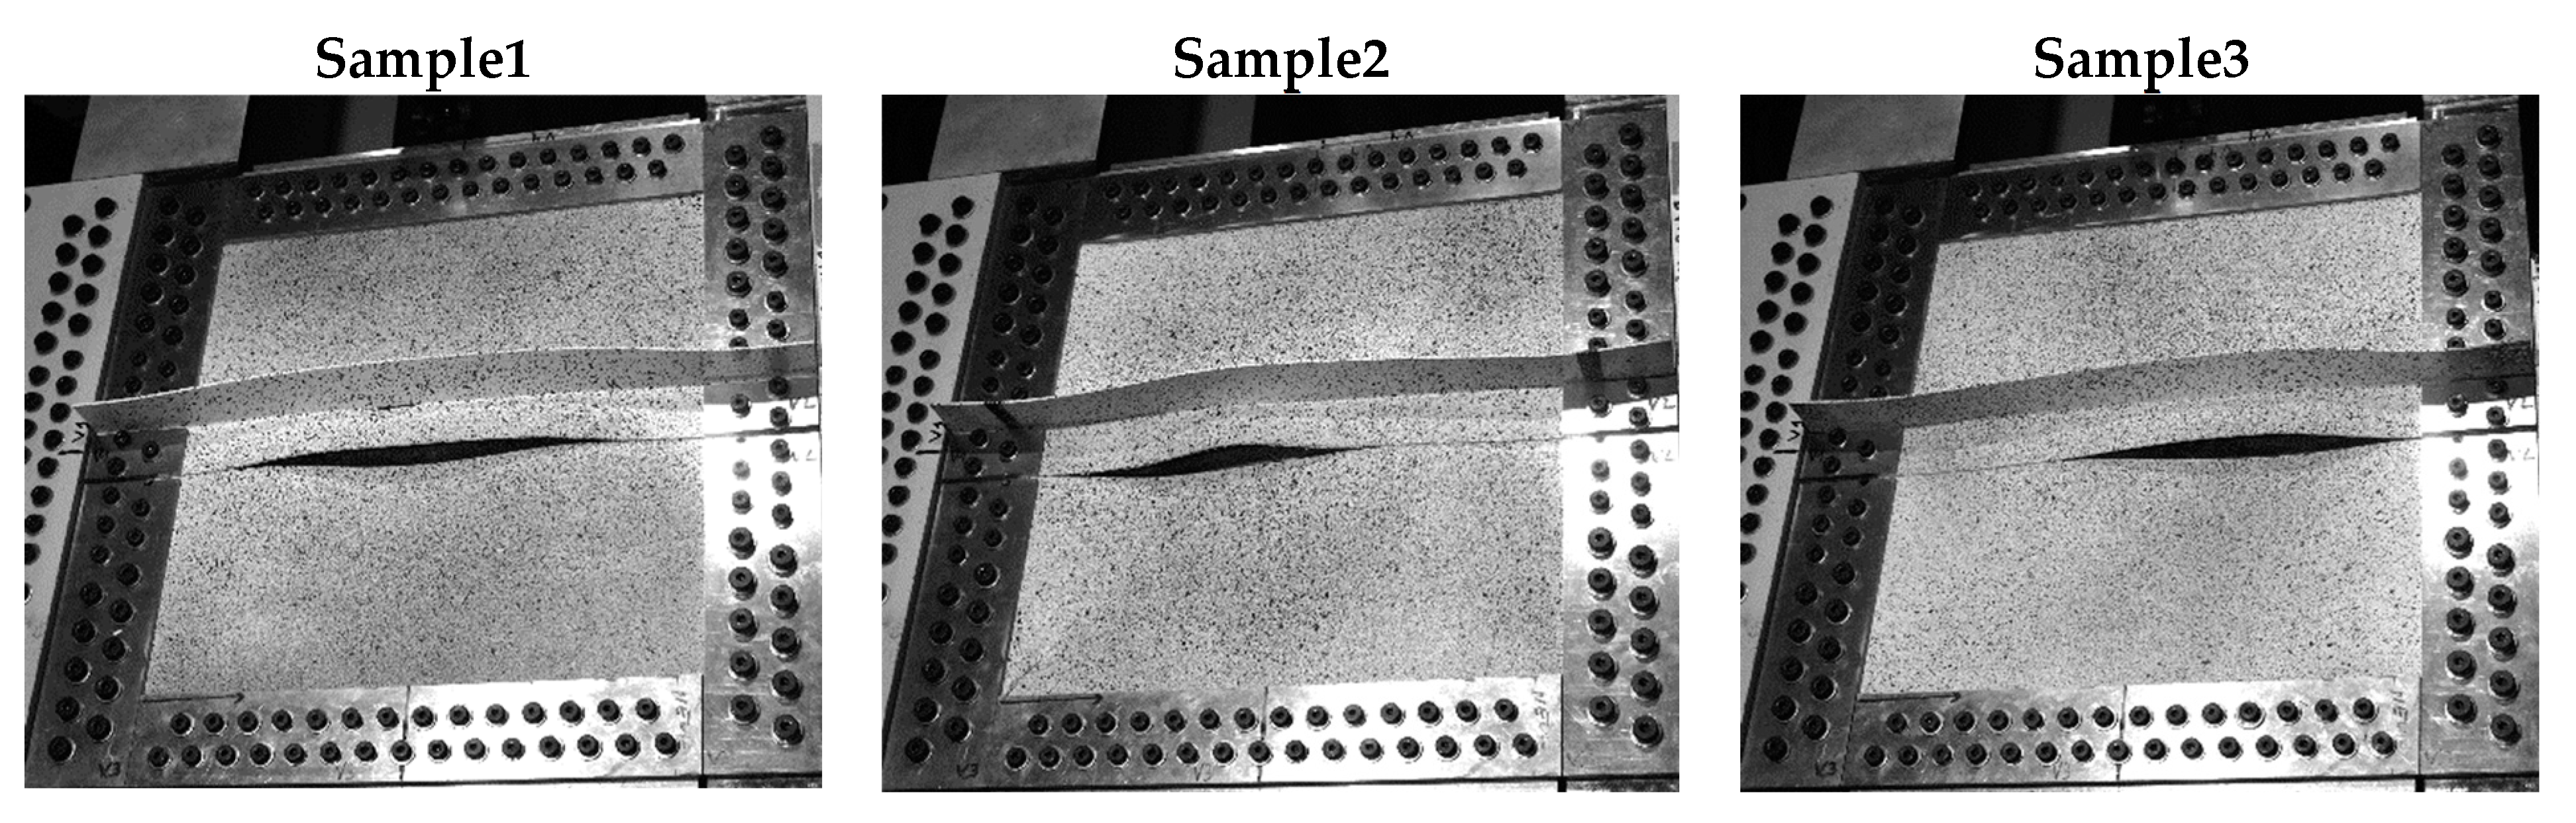
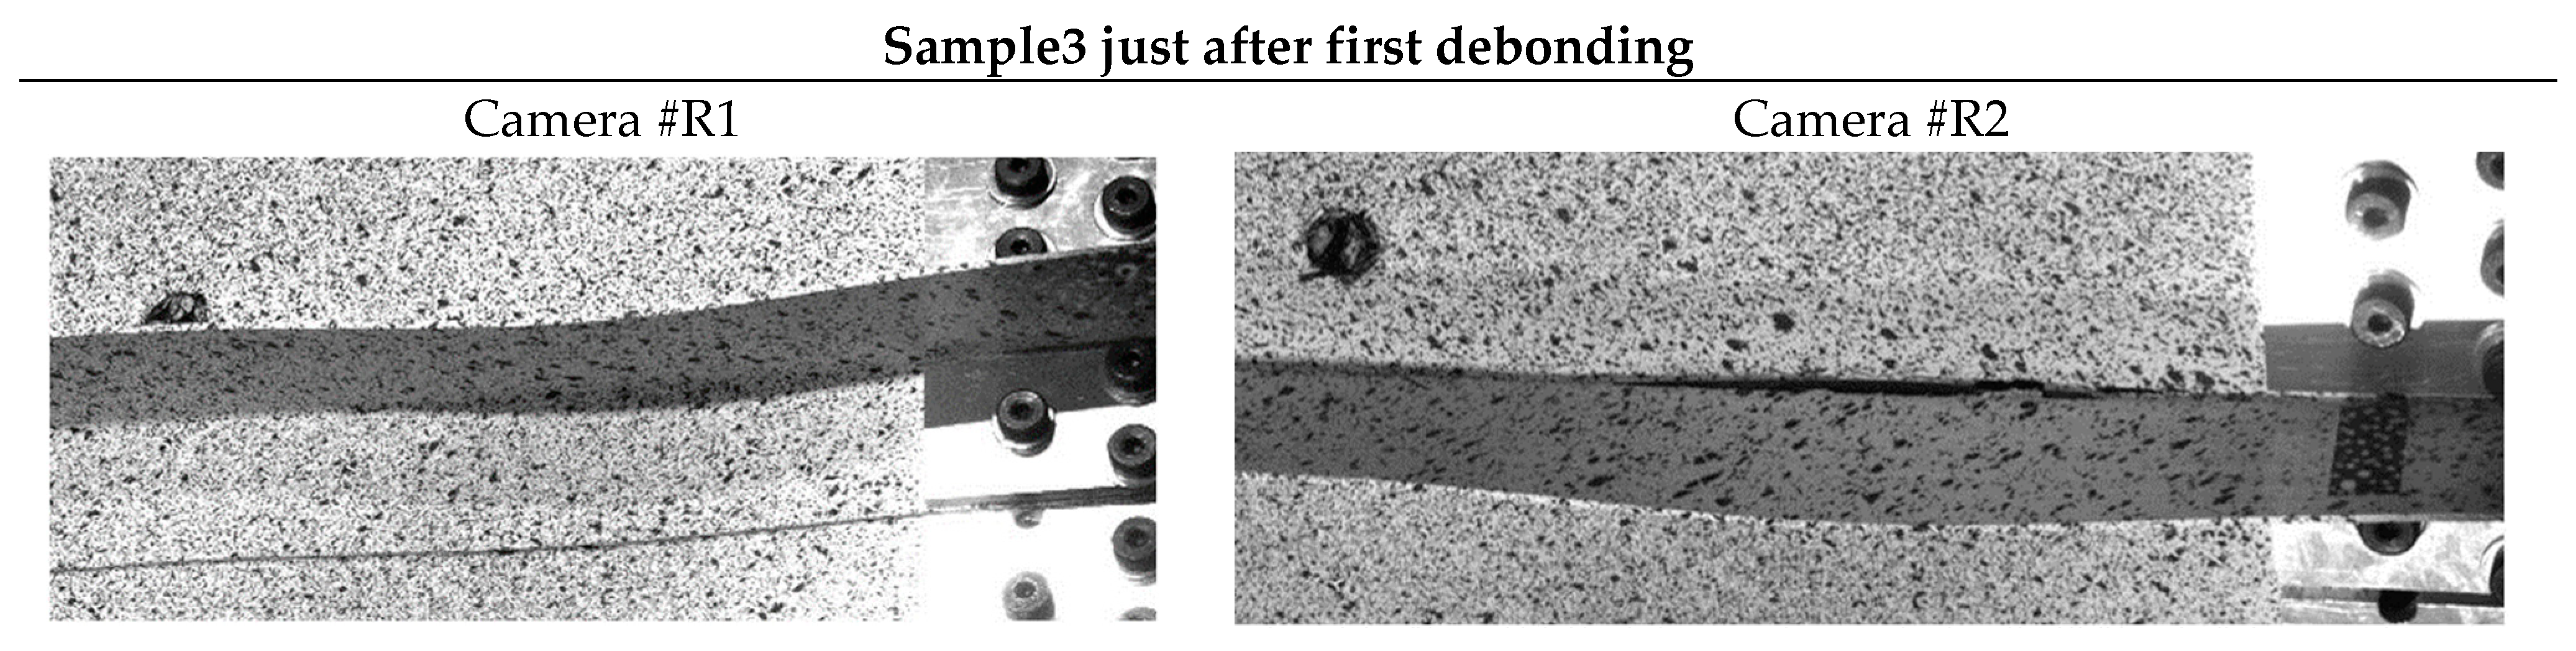
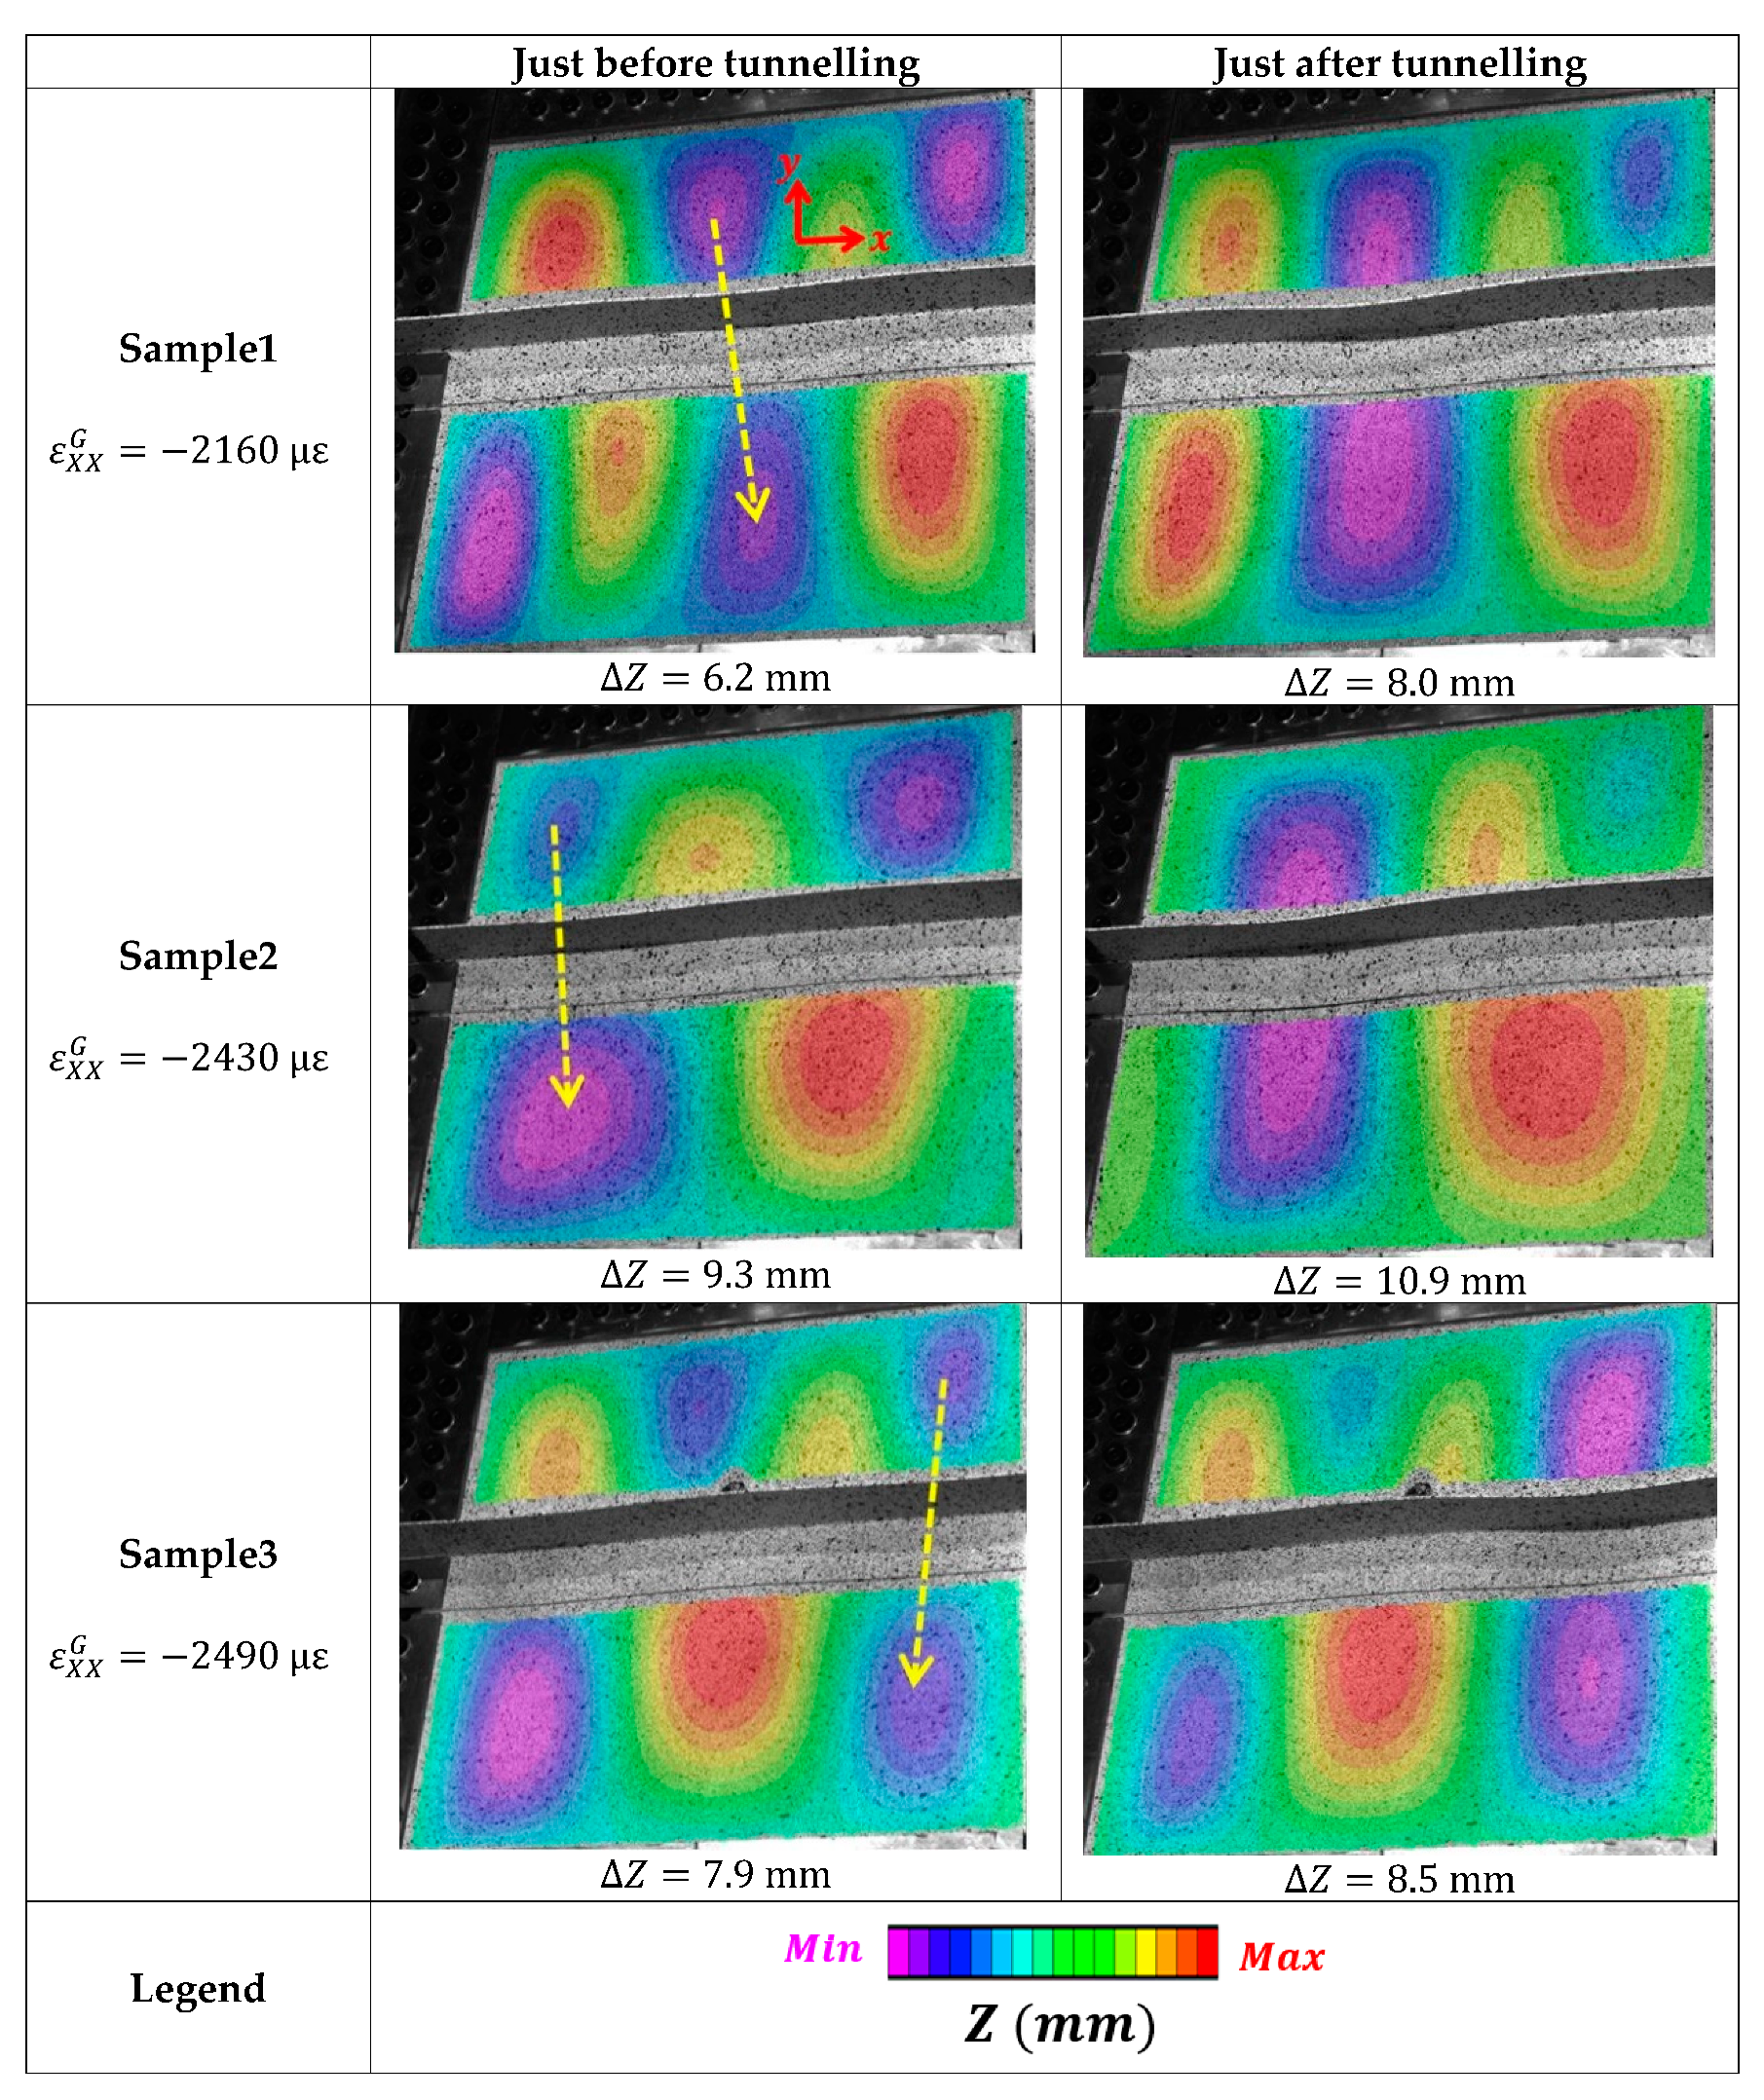
6.3. Debonding Observations
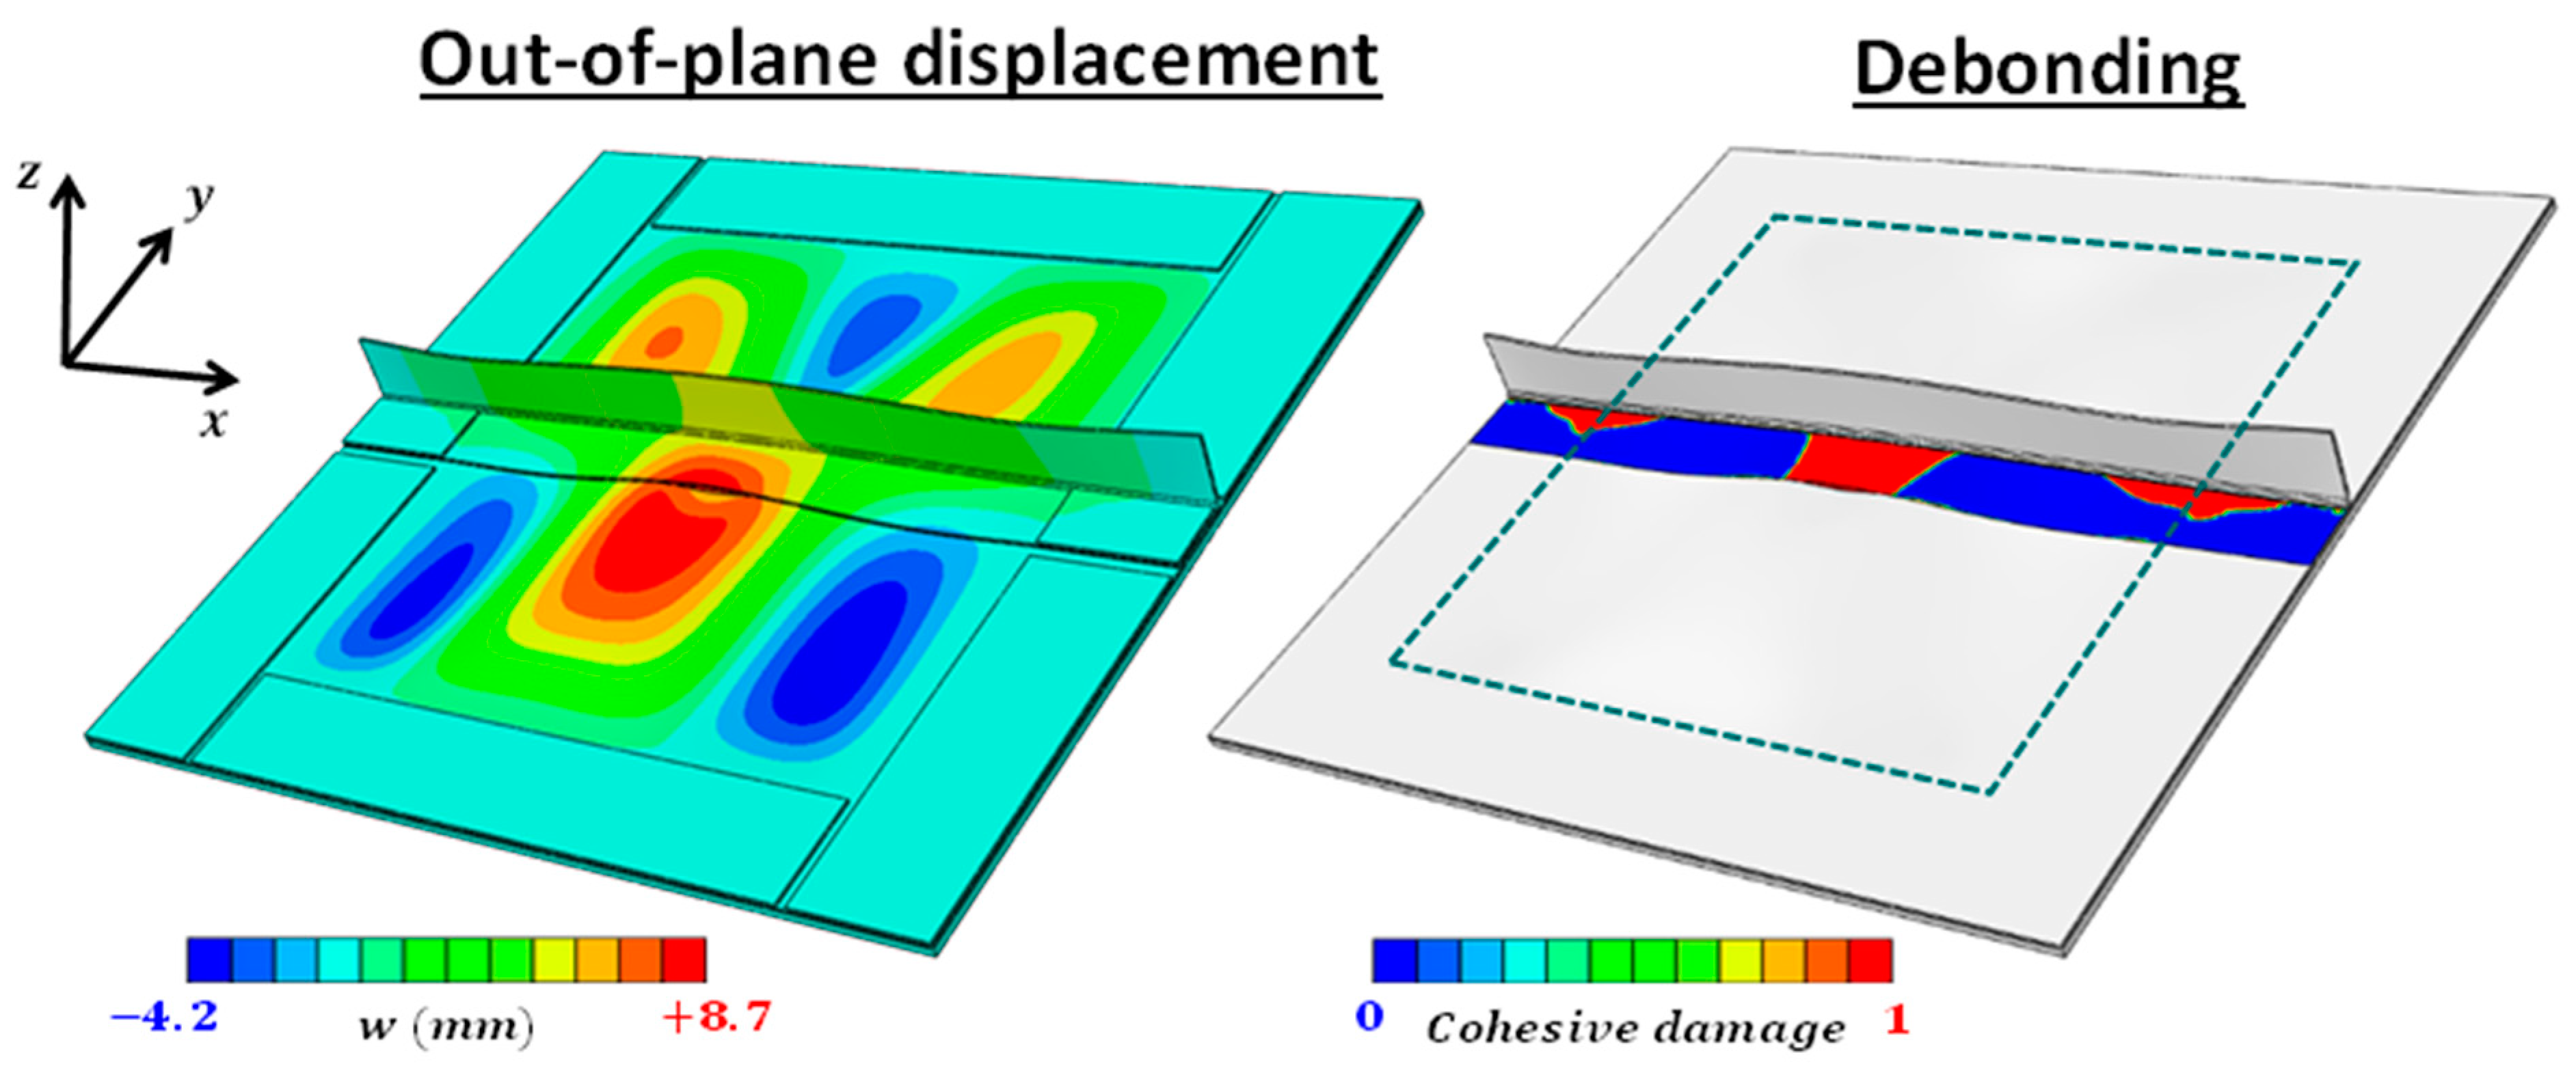
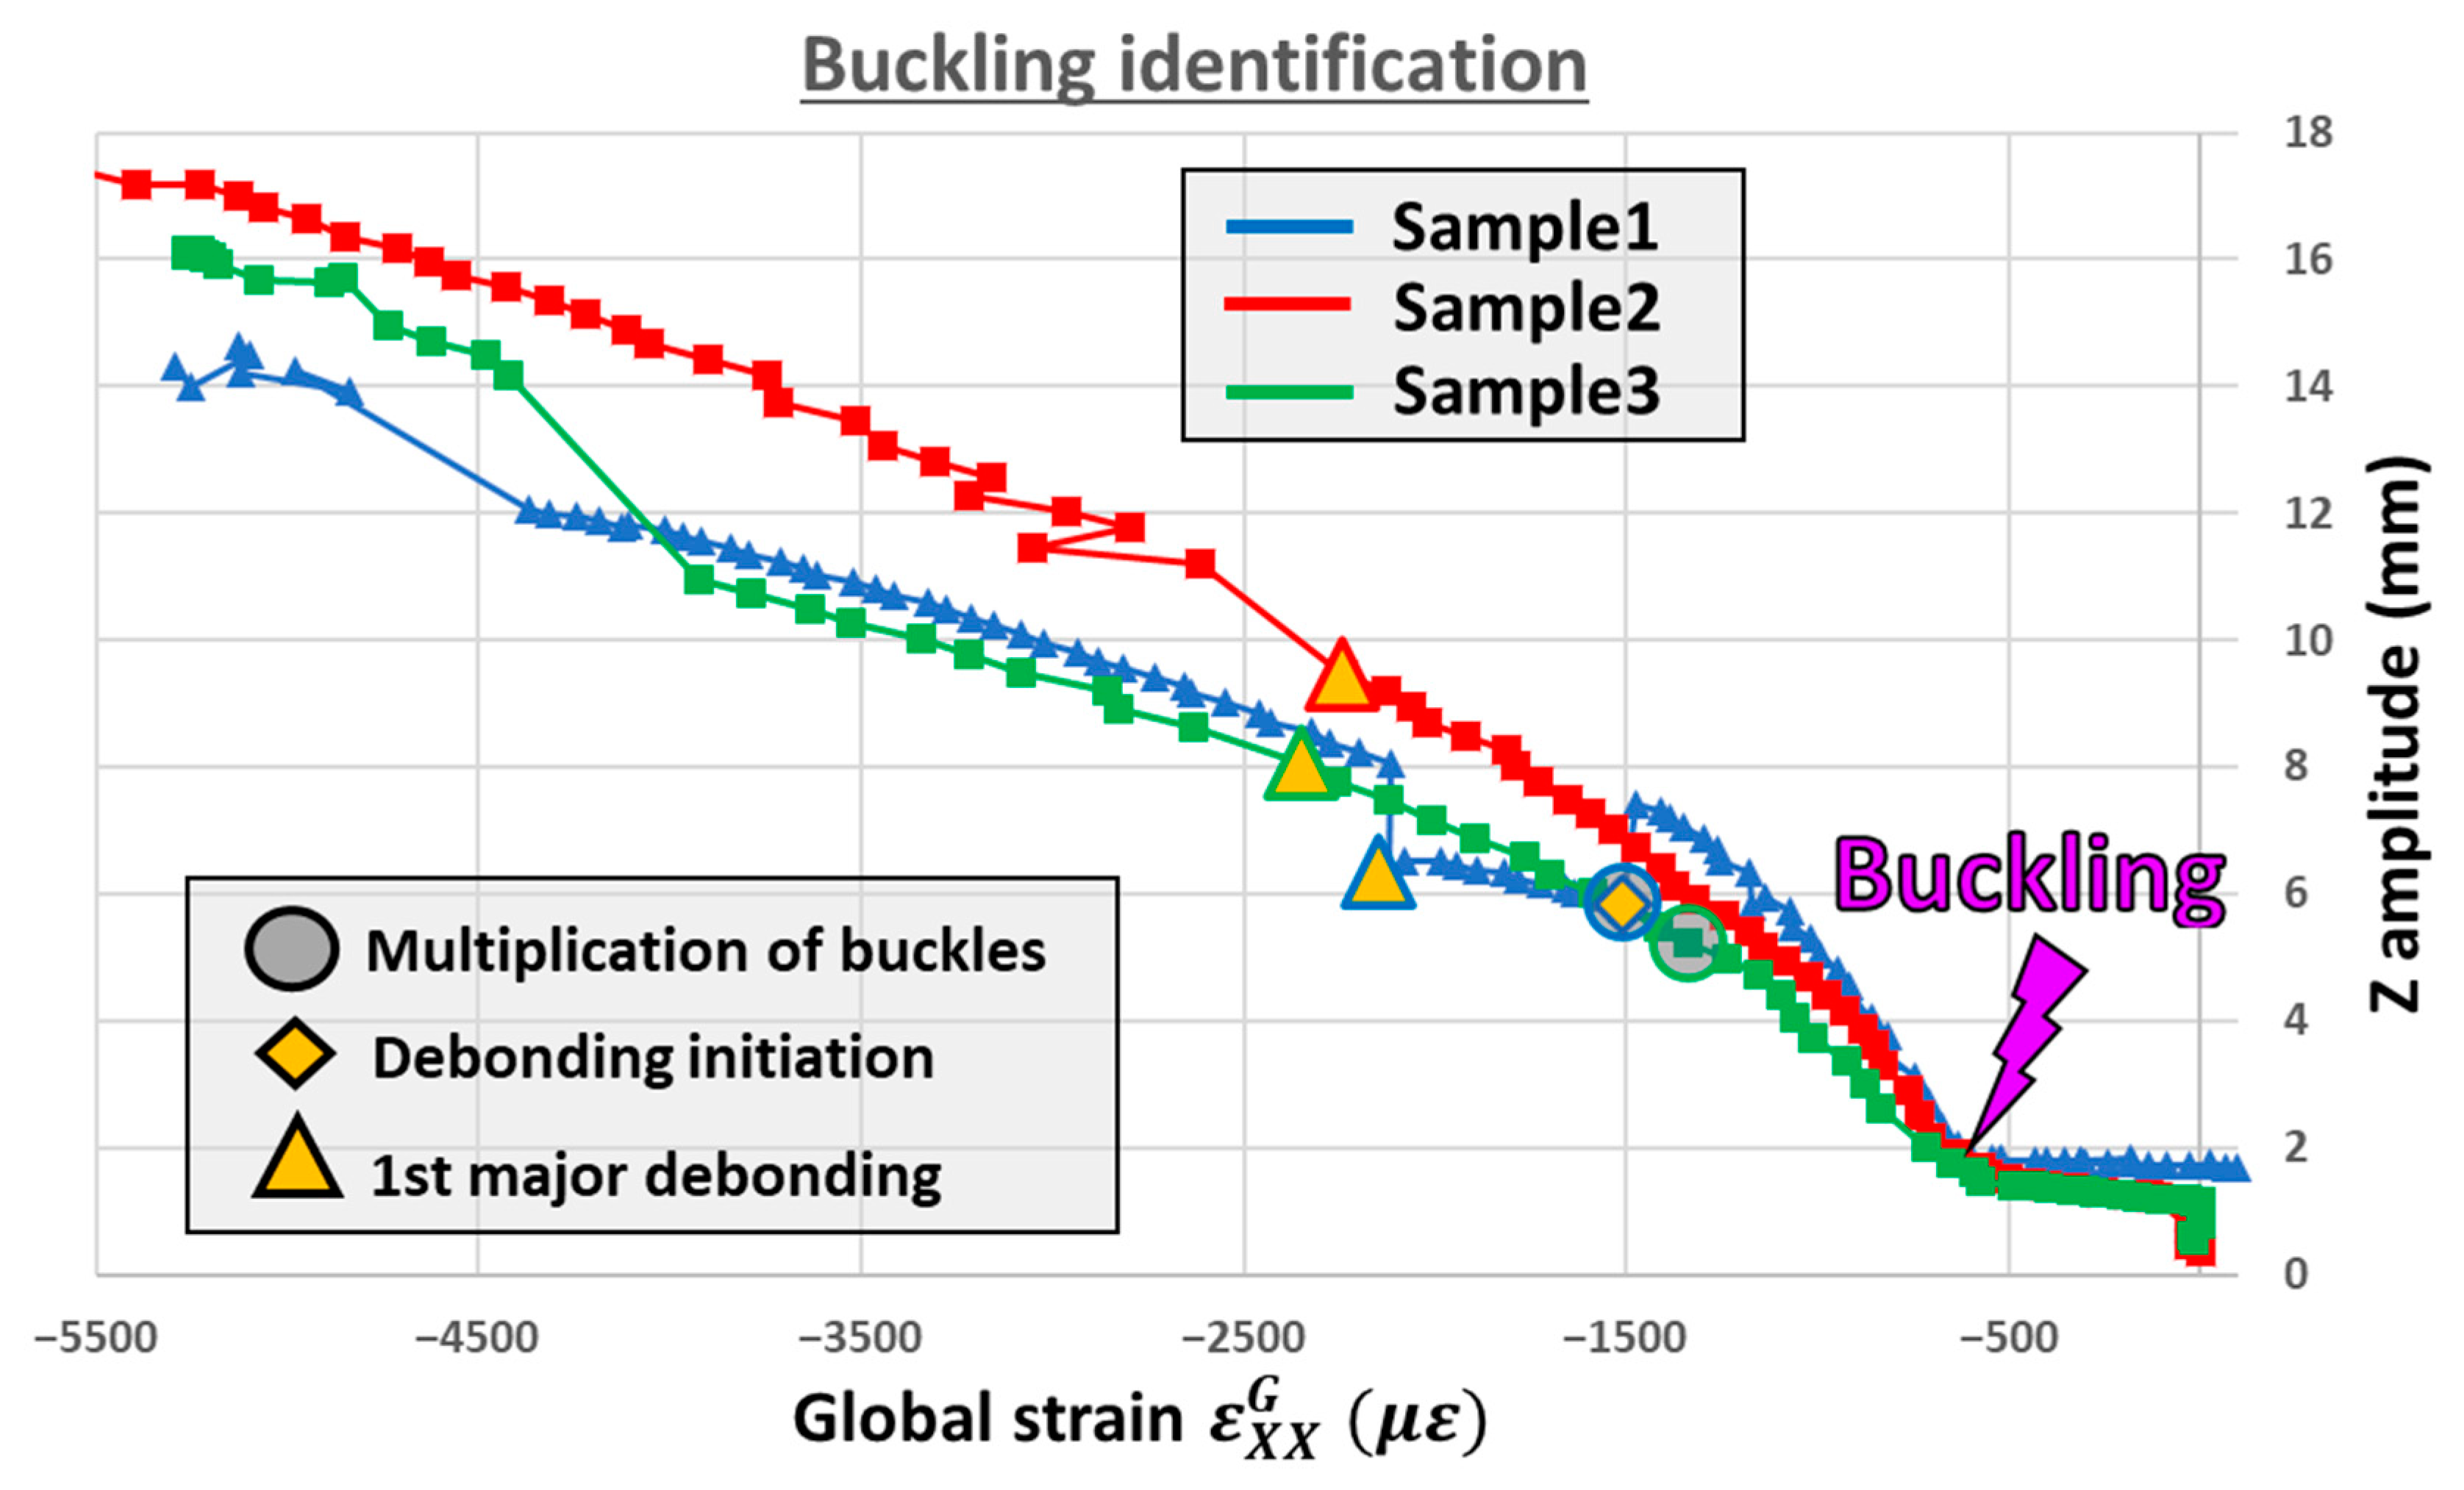
6.4. Debonding Interaction with Buckles
6.5. Results and Discussion
7. Conclusions
Author Contributions
Funding
Data Availability Statement
Acknowledgments
Conflicts of Interest
References
- Rouchon, J. Certification of Large Airplane Composite Structures. 1990. Available online: https://www.icas.org/ICAS_ARCHIVE/ICAS1990/ICAS-90-1.8.1.pdf (accessed on 30 January 2023).
- Bertolini, J.; Castanié, B.; Barrau, J.-J.; Navarro, J.-P. Multi-level experimental and numerical analysis of composite stiffener debonding. Part 1: Non-specific specimen level. Compos. Struct. 2009, 90, 381–391. [Google Scholar] [CrossRef] [Green Version]
- Meeks, C.; Greenhalgh, E.; Falzon, B.G. Stiffener debonding mechanisms in post-buckled CFRP aerospace panels. Compos. Part A Appl. Sci. Manuf. 2005, 36, 934–946. [Google Scholar] [CrossRef]
- Falzon, B.G.; Steven, G.P. Buckling mode transition in hat-stiffened composite panels loaded in uniaxial compression. Compos. Struct. 1997, 37, 253–267. [Google Scholar] [CrossRef]
- Riccio, A.; Raimondo, A.; Di Felice, G.; Scaramuzzino, F. A numerical procedure for the simulation of skin–stringer debonding growth in stiffened composite panels. Aerosp. Sci. Technol. 2014, 39, 307–314. [Google Scholar] [CrossRef]
- Romano, F.; Di Caprio, F.; Auriemma, B.; Mercurio, U. Numerical investigation on the failure phenomena of stiffened composite panels in post-buckling regime with discrete damages. Eng. Fail. Anal. 2015, 56, 116–130. [Google Scholar] [CrossRef]
- Safdar, N.; Daum, B.; Scheffler, S.; Rolfes, R. Experimental determination of a probabilistic failure envelope for carbon fiber reinforced polymers under combined compression–shear loads. Int. J. Solids Struct. 2022, 244-245, 111585. [Google Scholar] [CrossRef]
- Wiggenraad, J.F.M.; Greenhalg, E.S.; Olsson, R. Design and Analysis of Stiffened Composite Panels for Damage Resistance and Tolerance. National Aerospace Laboratory NLR. 2002. Available online: https://reports.nlr.nl/server/api/core/bitstreams/4fd9e329-770f-4deb-96f6-ba071fa0ace1/content (accessed on 30 January 2023).
- Kosztowny, C.J.; Waas, A.M. Postbuckling response of unitized stiffened textile composite panels: Experiments. Int. J. Non-linear Mech. 2021, 137, 103814. [Google Scholar] [CrossRef]
- Cartié, D.D.; Dell’Anno, G.; Poulin, E.; Partridge, I. 3D reinforcement of stiffener-to-skin T-joints by Z-pinning and tufting. Eng. Fract. Mech. 2006, 73, 2532–2540. [Google Scholar] [CrossRef]
- Degenhardt, R.; Rolfes, R.; Zimmermann, R.; Rohwer, K. COCOMAT—Improved material exploitation of composite airframe structures by accurate simulation of postbuckling and collapse. Compos. Struct. 2006, 73, 175–178. [Google Scholar] [CrossRef]
- Akterskaia, M. Global-Local Progressive Failure Analysis of Composite Panels Including Skin-Stringer Debonding and Intralaminar Damage. PhD Thesis, University of Hannover, Hannover, Germany, 2019. [Google Scholar]
- Yap, J.W.; Scott, M.L.; Thomson, R.S.; Hachenberg, D. The analysis of skin-to-stiffener debonding in composite aerospace structures. Compos. Struct. 2002, 57, 425–435. [Google Scholar] [CrossRef]
- Knight, N.F.; Starnes, J.H.; Tarnes, J.H. Postbuckling behavior of selected curved stiffened graphite-epoxy panels loaded in axial compression. AIAA J. 1988, 26, 344–352. [Google Scholar] [CrossRef]
- Hao, C.; Nan, C.Y.; Bo, Y.Z.; Lei, L. Experimental Research on the Stability behavior of Composite Curved Stiffened Fuselage Panel under Four-Point-Bending load. IOP Conf. Ser. Mater. Sci. Eng. 2019, 563, 022005. [Google Scholar] [CrossRef]
- Zou, D.; Bisagni, C. Skin–Stiffener Separation in T-Stiffened Composite Specimens in Postbuckling Condition. J. Aerosp. Eng. 2018, 31, 4. [Google Scholar] [CrossRef] [Green Version]
- Kolanu, N.R.; Raju, G.; Ramji, M. A unified numerical approach for the simulation of intra and inter laminar damage evolution in stiffened CFRP panels under compression. Compos. Part B Eng. 2020, 190, 107931. [Google Scholar] [CrossRef]
- Yetman, J.; Sobey, A.; Blake, J.; Shenoi, R. Modelling the variability of skin stiffener debonding in post-cured top-hat stiffened panels. Compos. Struct. 2018, 211, 187–195. [Google Scholar] [CrossRef] [Green Version]
- Van Rijn, J.C.F.N.; Wiggenraad, J.F.M. A Seven-Point Bending Test to Determine the Strength of the Skin-Stiffener Interface in Composite Aircraft Panels’. National Aerospace Laboratory NLR. 2000. Available online: https://core.ac.uk/download/pdf/53034637.pdf (accessed on 30 January 2023).
- Kosztowny, C.J.; Davila, C.G.; Song, K.C.; Rose, C.; Jackson, W. Experimental and Numerical Analysis of Skin-Stiffener Separation Using a Seven Point Bend Configuration. In Proceedings of the AIAA Scitech 2019 Forum 2019, San Diego, CA, USA, 7–11 January 2019. [Google Scholar] [CrossRef]
- Bertolini, J.; Castanié, B.; Barrau, J.-J.; Navarro, J.-P.; Petiot, C. Multi-level experimental and numerical analysis of composite stiffener debonding. Part 2: Element and panel level. Compos. Struct. 2009, 90, 392–403. [Google Scholar] [CrossRef] [Green Version]
- Vescovini, R.; Dávila, C.; Bisagni, C. Failure analysis of composite multi-stringer panels using simplified models. Compos. Part B Eng. 2013, 45, 939–951. [Google Scholar] [CrossRef]
- Sun, W.; Guan, Z.; Ouyang, T.; Tan, R.; Zhong, X. Effect of stiffener damage caused by low velocity impact on compressive buckling and failure modes of T-stiffened composite panels. Compos. Struct. 2018, 184, 198–210. [Google Scholar] [CrossRef]
- Zou, J.; Lei, Z.; Bai, R.; Liu, D.; Jiang, H.; Liu, J.; Yan, C. Damage and failure analysis of composite stiffened panels under low-velocity impact and compression after impact. Compos. Struct. 2020, 262, 113333. [Google Scholar] [CrossRef]
- Rivallant, S.; Bouvet, C.; Hongkarnjanakul, N. Failure analysis of CFRP laminates subjected to compression after impact: FE simulation using discrete interface elements. Compos. Part A Appl. Sci. Manuf. 2013, 55, 83–93. [Google Scholar] [CrossRef] [Green Version]
- Cózar, I.R.; Turon, A.; González, E.; Vallmajó, O.; Sasikumar, A. A methodology to obtain material design allowables from high-fidelity compression after impact simulations on composite laminates. Compos. Part A Appl. Sci. Manuf. 2020, 139, 106069. [Google Scholar] [CrossRef]
- Reiner, J.; Zobeiry, N.; Vaziri, R. Efficient finite element simulation of compression after impact behaviour in quasi-isotropic composite laminates. Compos. Commun. 2021, 28, 100967. [Google Scholar] [CrossRef]
- Chaibi, S.; Bouvet, C.; Laurin, F.; Rannou, J.; Berthe, J.; Congourdeau, F.; Martini, D. Experimental and Numerical Study of Damages Induced by Low-Velocity Impact on 4th Generation Composite Laminates. In Proceedings of the American Society for Composites 2020, Online, 4–17 September 2020. [Google Scholar] [CrossRef]
- Akterskaia, M.; Jansen, E.; Hühne, S.; Rolfes, R. Efficient progressive failure analysis of multi-stringer stiffened composite panels through a two-way loose coupling global-local approach. Compos. Struct. 2018, 183, 137–145. [Google Scholar] [CrossRef]
- Abbadi, A.; Michel, L.; Castanié, B. Experimental Analysis of Debonding of Skin/Stringer Interfaces under Cyclic Loading and Ageing. Adv. Compos. Lett. 2014, 23, 096369351402300602. [Google Scholar] [CrossRef] [Green Version]
- Davila, C.; Camanho, P.; de Moura, M. Mixed-mode decohesion elements for analyses of progressive delamination. In Proceedings of the 19th AIAA Applied Aerodynamics Conference, Anaheim, CA, USA, 11–14 June 2001. [Google Scholar] [CrossRef] [Green Version]
- Zucco, G.; Oliveri, V.; Rouhi, M.; Telford, R.; Clancy, G.; McHale, C.; O’Higgins, R.; Young, T.; Weaver, P.; Peeters, D. Static test of a variable stiffness thermoplastic composite wingbox under shear, bending and torsion. Aeronaut. J. 2020, 124, 635–666. [Google Scholar] [CrossRef]
- van Dooren, K.; Tijs, B.; Waleson, J.; Bisagni, C. Skin-stringer separation in post-buckling of butt-joint stiffened thermoplastic composite panels. Compos. Struct. 2023, 304, 116294. [Google Scholar] [CrossRef]
- da Silva, D.C.; Donadon, M.V.; Arbelo, M.A. A semi-analytical model for shear buckling analysis of stiffened composite panel with debonding defect. Thin-Walled Struct. 2021, 171, 108636. [Google Scholar] [CrossRef]
- Telford, R.; Peeters, D.; Rouhi, M.; Weaver, P. Experimental and numerical study of bending-induced buckling of stiffened composite plate assemblies. Compos. Part B Eng. 2022, 233, 109642. [Google Scholar] [CrossRef]
- Serra, J.; Pierré, J.; Passieux, J.; Périé, J.; Bouvet, C.; Castanié, B. Validation and modeling of aeronautical composite structures subjected to combined loadings: The VERTEX project. Part 1: Experimental setup, FE-DIC instrumentation and procedures. Compos. Struct. 2017, 179, 224–244. [Google Scholar] [CrossRef] [Green Version]
- Grotto, F.; Bouvet, C.; Castanié, B.; Serra, J. Experimental behaviour of aeronautical notched carbon fibre reinforced thermoplastic panels under combined tension-shear-pressure loadings. Eng. Fail. Anal. 2023, 146, 107075. [Google Scholar] [CrossRef]
- Serra, J.; Bouvet, C.; Castanié, B.; Petiot, C. Experimental and numerical analysis of Carbon Fiber Reinforced Polymer notched coupons under tensile loading. Compos. Struct. 2017, 181, 145–157. [Google Scholar] [CrossRef] [Green Version]
- Hexcel Corporation. Datasheet for HexBond ST1035 Epoxy Film Adhesive’. 2019. Available online: https://www.hexcel.com/user_area/content_media/raw/HexBondST1035pdf(1).pdf (accessed on 30 January 2023).
- Journoud, P.; Bouvet, C.; Castanié, B.; Ratsifandrihana, L. Experimental analysis of the effects of wrinkles in the radius of curvature of L-shaped carbon-epoxy specimens on unfolding failure. Compos. Part A Appl. Sci. Manuf. 2022, 158, 106975. [Google Scholar] [CrossRef]
- Serra, J.; Pierré, J.; Passieux, J.; Périé, J.; Bouvet, C.; Castanié, B.; Petiot, C. Validation and modeling of aeronautical composite structures subjected to combined loadings: The VERTEX project. Part 2: Load envelopes for the assessment of panels with large notches. Compos. Struct. 2017, 180, 550–567. [Google Scholar] [CrossRef] [Green Version]
- Abdulhamid, H.; Bouvet, C.; Michel, L.; Aboissière, J.; Minot, C. Influence of internally dropped-off plies on the impact damage of asymmetrically tapered laminated CFRP. Compos. Part A Appl. Sci. Manuf. 2015, 68, 110–120. [Google Scholar] [CrossRef] [Green Version]
- Trellu, A.; Pichon, G.; Bouvet, C.; Rivallant, S.; Castanié, B.; Serra, J.; Ratsifandrihana, L. Combined loadings after medium velocity impact on large CFRP laminate plates: Tests and enhanced computation/testing dialogue. Compos. Sci. Technol. 2020, 196, 108194. [Google Scholar] [CrossRef]


| Symbol | Value | Name |
|---|---|---|
| Ply elastic properties (T700GC/M21 CFRP) [38] | ||
| Young’s modulus in fibre direction | ||
| Transverse Young’s modulus | ||
| Poisson’s ratio | ||
| In-plane shear modulus | ||
| Out-of-plane shear modulus | ||
| Ply thickness | ||
| Bonding properties (epoxy film adhesive) [39] | ||
| Young’s modulus, isotropic | ||
| Tensile strength | ||
| In-plane shear strength | ||
| Critical energy release rate in Mode I | ||
| Critical energy release rate in Mode II | ||
| Bond thickness | ||
Disclaimer/Publisher’s Note: The statements, opinions and data contained in all publications are solely those of the individual author(s) and contributor(s) and not of MDPI and/or the editor(s). MDPI and/or the editor(s) disclaim responsibility for any injury to people or property resulting from any ideas, methods, instructions or products referred to in the content. |
© 2023 by the authors. Licensee MDPI, Basel, Switzerland. This article is an open access article distributed under the terms and conditions of the Creative Commons Attribution (CC BY) license (https://creativecommons.org/licenses/by/4.0/).
Share and Cite
Grotto, F.; Bouvet, C.; Castanié, B.; Serra, J. Design and Testing of Impacted Stiffened CFRP Panels under Compression with the VERTEX Test Rig. Aerospace 2023, 10, 327. https://doi.org/10.3390/aerospace10040327
Grotto F, Bouvet C, Castanié B, Serra J. Design and Testing of Impacted Stiffened CFRP Panels under Compression with the VERTEX Test Rig. Aerospace. 2023; 10(4):327. https://doi.org/10.3390/aerospace10040327
Chicago/Turabian StyleGrotto, Florent, Christophe Bouvet, Bruno Castanié, and Joël Serra. 2023. "Design and Testing of Impacted Stiffened CFRP Panels under Compression with the VERTEX Test Rig" Aerospace 10, no. 4: 327. https://doi.org/10.3390/aerospace10040327