1. Introduction
Launched on 5 July 2021, the FY-3E satellite was developed by Shanghai Academy of Spaceflight Technology (SAST) and used by the China Meteorological Administration. It is mainly used for weather forecasting, climate prediction, environmental monitoring, disaster prevention and mitigation, etc. It provides the world with all-weather, three-dimensional, full-spectrum, high-precision, and quantitative meteorological exploration information, and provides reliable meteorological data for government departments at all levels to make decisions and assessments of weather emergencies [
1,
2].
The orbit of the FY-3E satellite is a sun-synchronous orbit of 830 km, which is located at the edge of the inner radiation belt. During the quiet time of the space environment, the particles in this orbit are distributed in the negative magnetic anomaly zone of the South Atlantic (SAA). When the space environment is disturbed, there are also be particle distributions in high latitude areas. The particles are mainly composed of protons and electrons [
3,
4]. The main detection objects of the medium energy proton detector (MEPD) onboard the FY-3E satellite are the medium energy protons in the inner radiation belt and in the polar region. Due to the extremely low deposition energy of the measured particles in the sensor (the lower limit of deposition energy is 14 keV), the MEPD is susceptible to electromagnetic interference, and the medium energy protons are easily contaminated by other particles and sunlight, which are difficult to eliminate. Based on the above reasons, except for the MEPEDs on the NOAA/POES series of satellites, there are few medium energy proton detectors carried on previously launched satellites [
5,
6,
7]. The MEPD onboard the FY-3E satellite is also the first detector on a Chinese satellite to detect protons in this energy band.
There are three main functions of the MEPD data. First, the cause and generation mechanism of magnetic storms and “killer electron” [
8] events can be studied using the energy spectrum and the pitch angle distribution of medium energy protons, which can serve the early warning and forecasting of space weather. Second, through the measurement of medium energy protons, scientific data can be accumulated and the time-space distribution of charged particles in the orbit space can be studied, which supplements the missing parts of medium energy protons in the radiation belt model of China and helps with studying the source of high energy particles [
9,
10]. Third, it can provide support for space environment security monitoring system of China, and also provide analysis data for satellite flying control management and abnormal situation analysis.
The MEPD on the FY-3E satellite is equipped with two parts, detector A and detector B. They are installed on the -X direction and +Y direction, respectively, in a satellite fixed coordinate, in which “+X” points to the heading direction of the satellite, “+Z” points to the center of Earth, and “+Y” is determined by the right-hand rule. After being powered up in orbit, the MEPD worked well and obtained a large amount of on-orbit detection data, which have been applied to satellite operation and on-orbit management analysis, effectively promoting the development of space environment and space physics research in China.
This article is organized as follows:
Section 2 introduces the scientific indicators and engineering requirements of the MEPD.
Section 3 describes the detector design, including the working principle, electronics design, sensor design, and electromagnetic compatibility (EMC) design.
Section 4 discusses the contents of calibration and the testing results of the ground. The calibration test shows that the design of the detector meets the requirements of the detection tasks.
3. Detector Design
3.1. System Composition and Working Principle
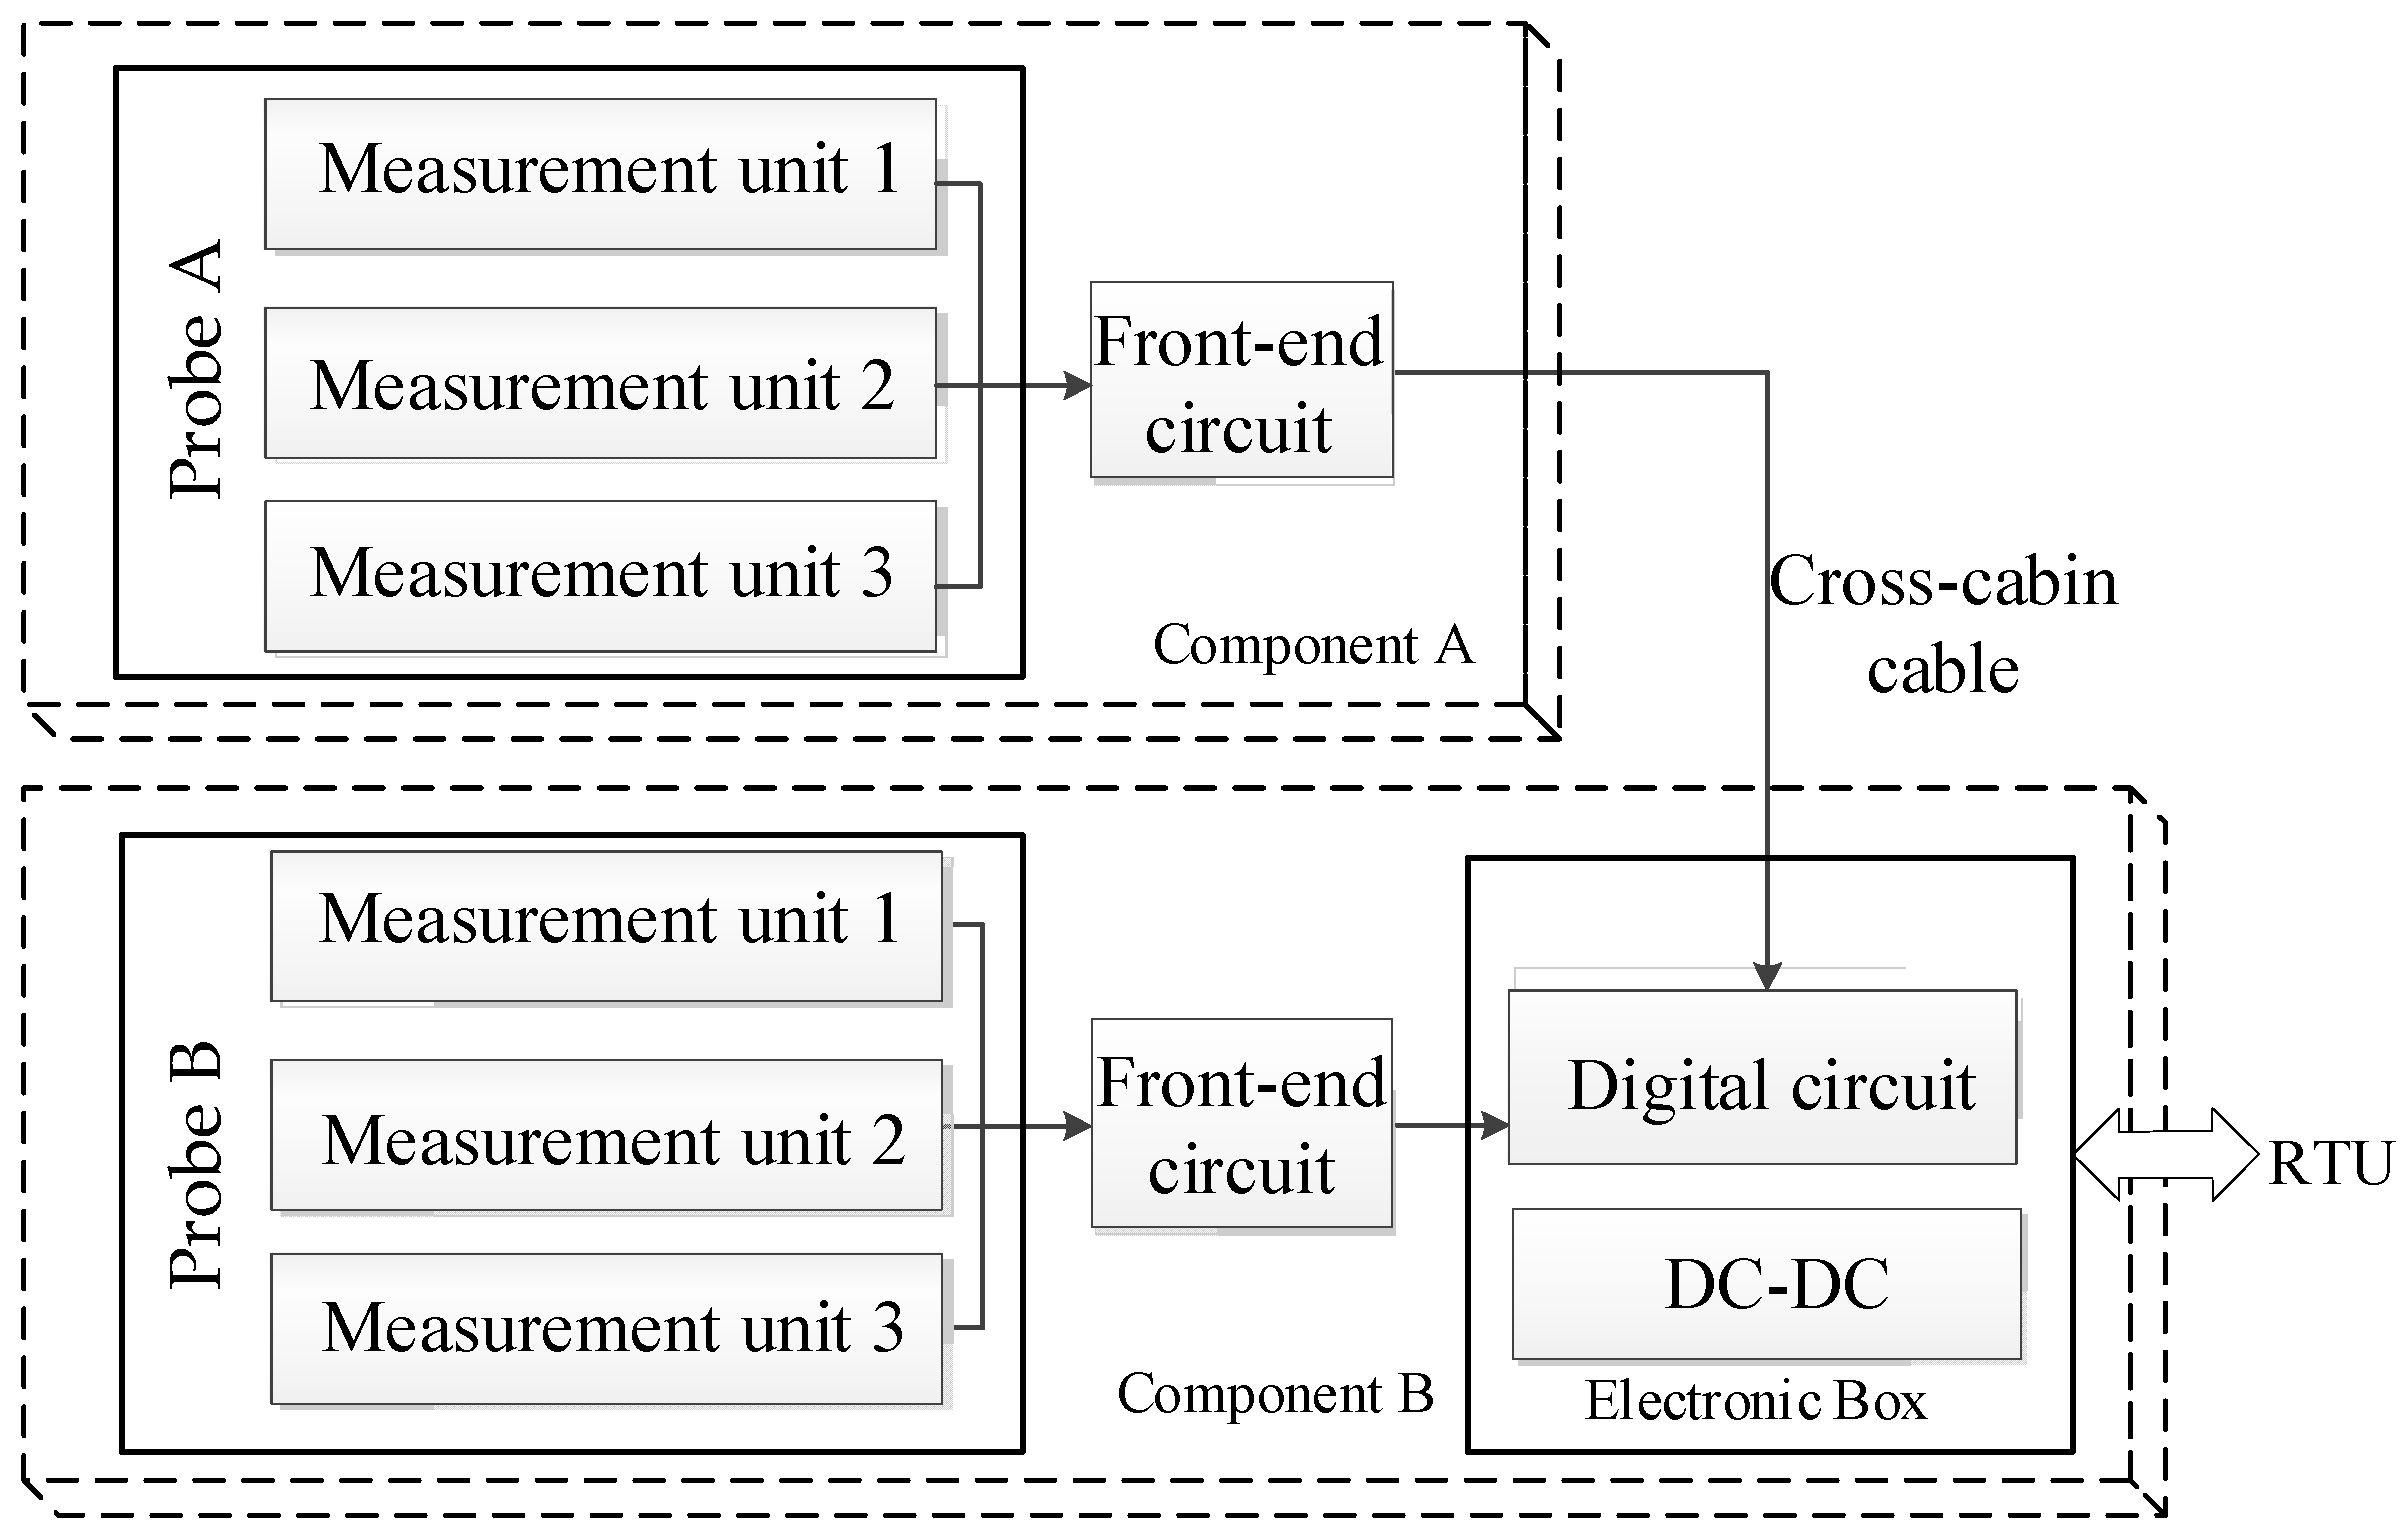
The MEPD consists of two components and the system scheme composition is shown in
Figure 1. Component A includes the sensor probe A and the matching front-end circuit, and its data are transmitted to the component B through a cross-cabin cable. In addition to probe B and the front-end circuit, component B also has a digital circuit (inside the electronics box) for data acquisition and processing. Furthermore, component B accepts the output signals from component A to process. After data acquisition and data storage with a time-sharing strategy (
Section 3.2) for the two components, the data packet is transmitted to the remote terminal unit (RTU) of the space environment monitor. RTU realizes the following functions: communicating with the satellite, receiving remote control commands from the satellite, and distributing them to the MEPD.
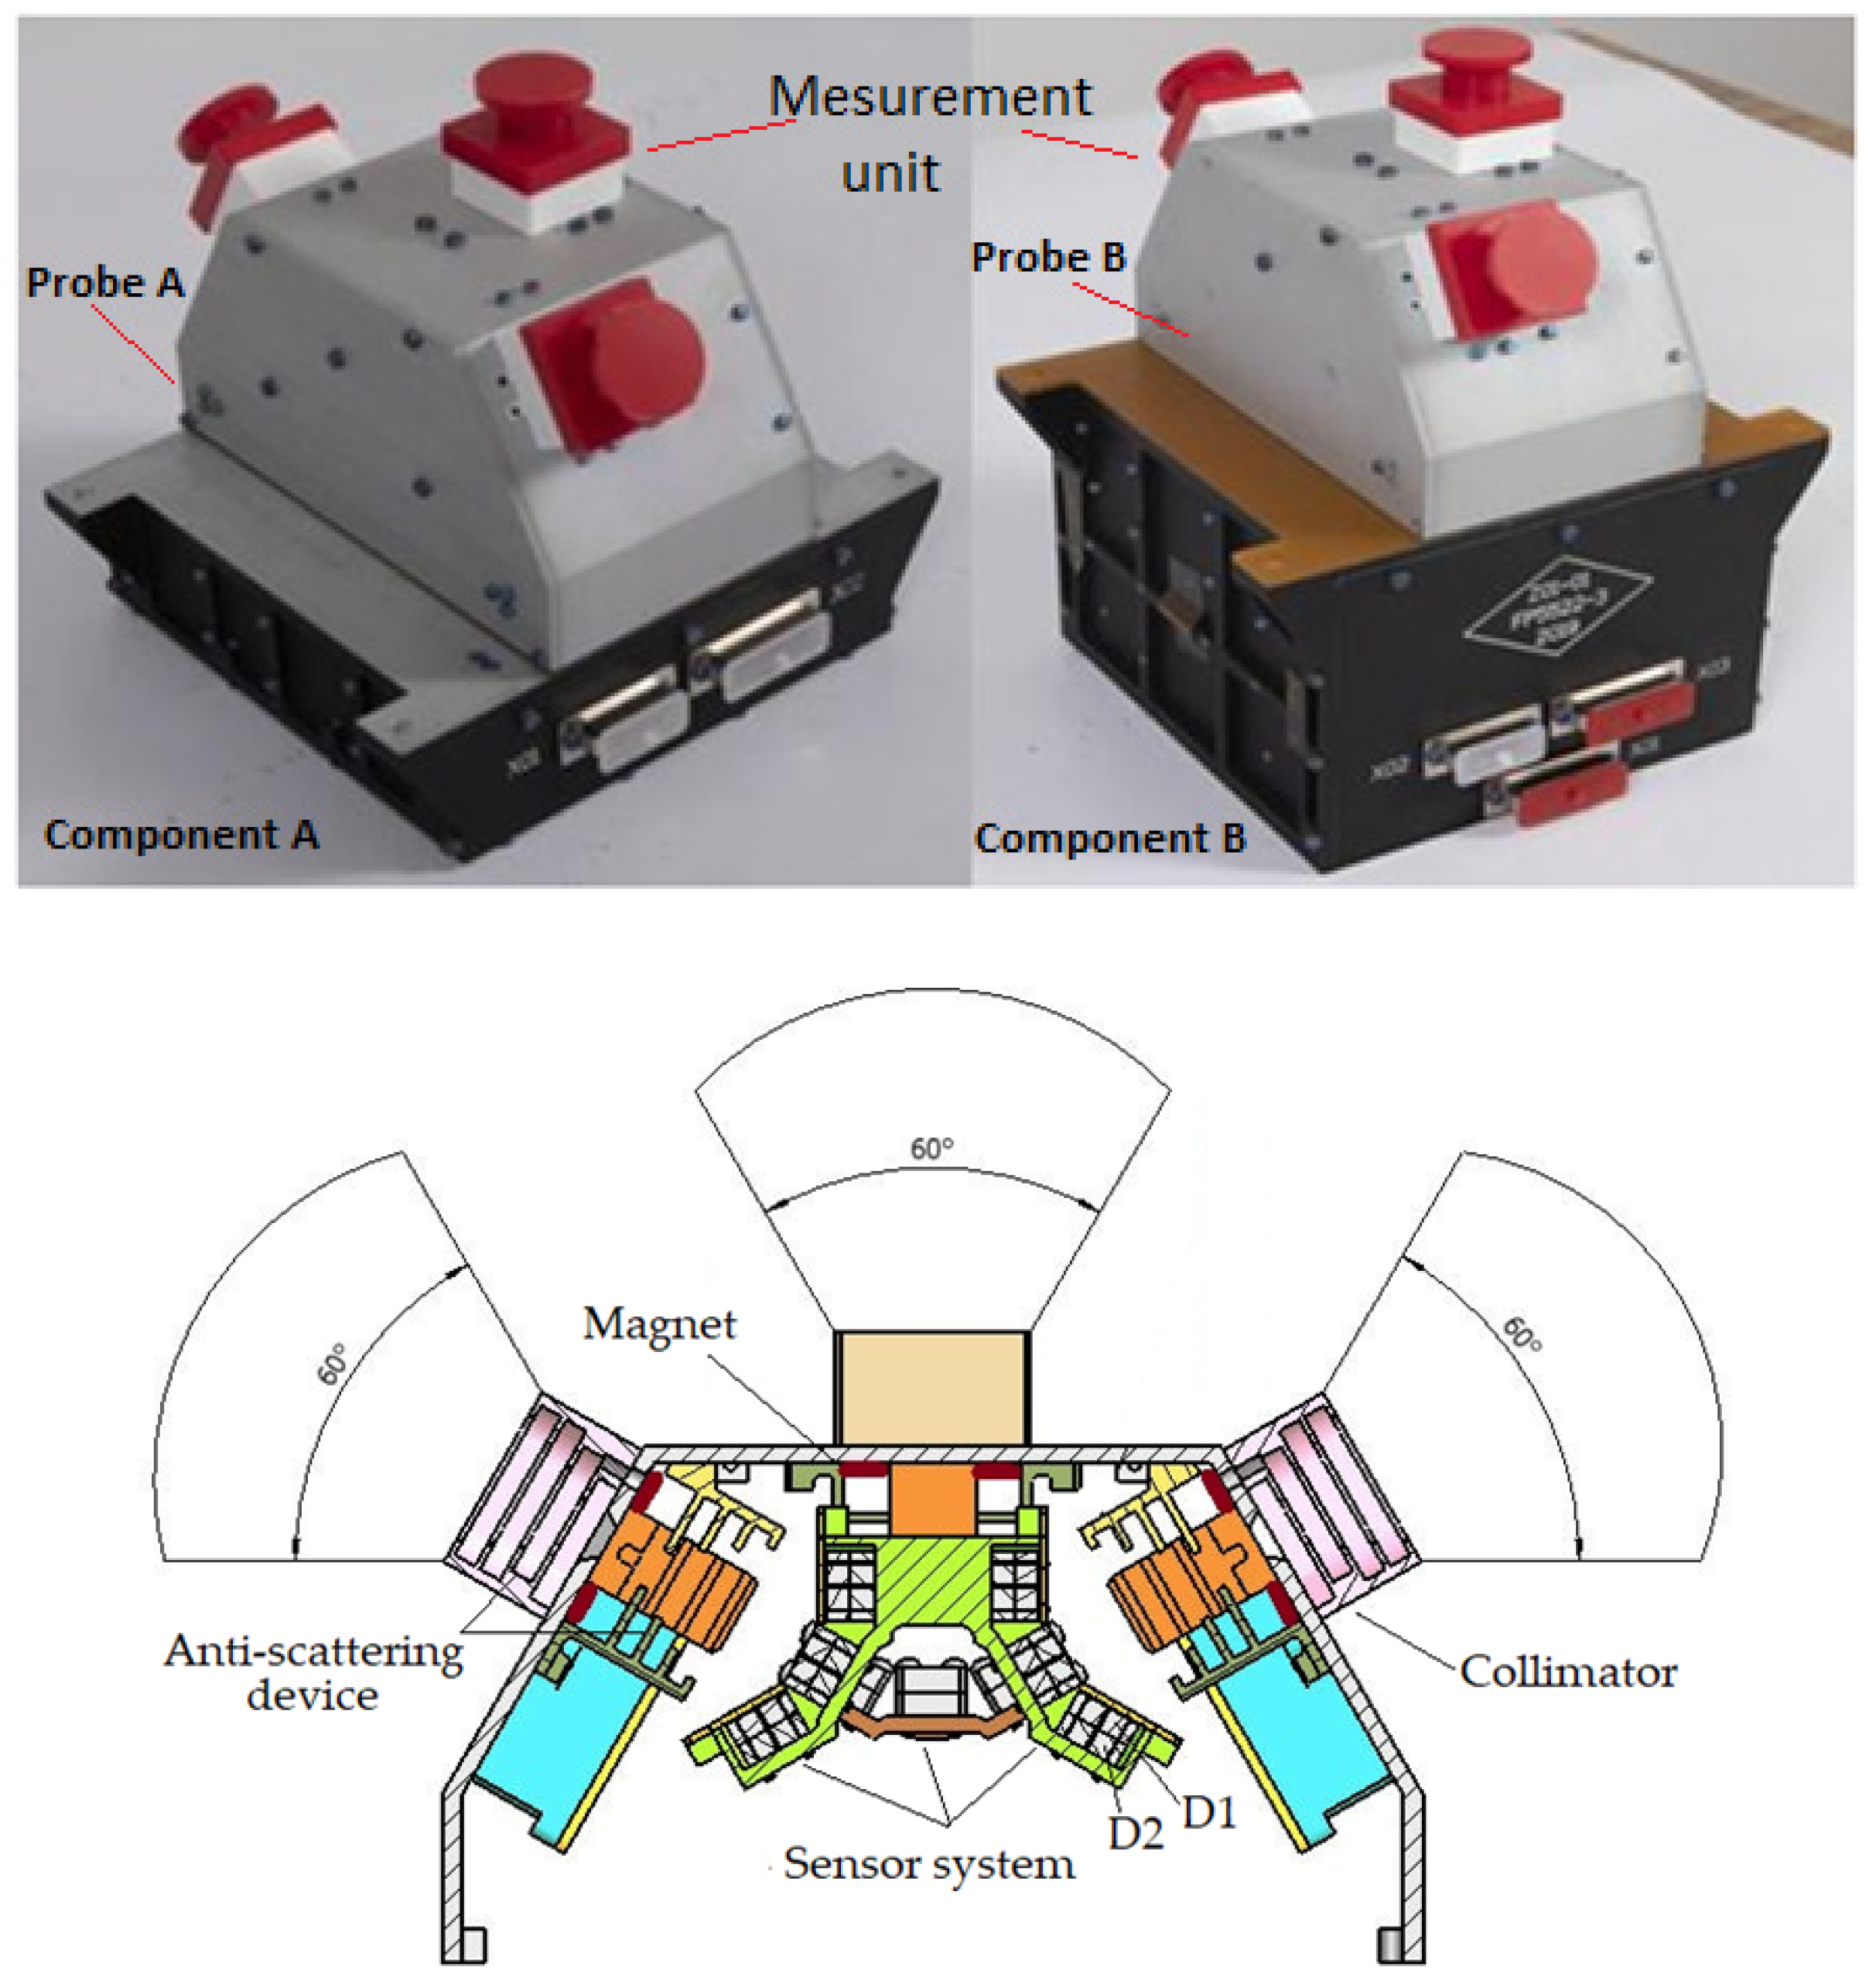
Each probe is composed of three groups of “pinhole imaging” measurement units. Each measurement unit has three groups of sensors organized in a fan-shaped arrangement. The three groups of sensors share an incident window to perform measurements in three directions. The field of view of each group of sensors is 20° × 20°, so the field of view of each measurement unit is 20° × 60°, and each probe can cover a detection range of 20° × 180°. The detector appearance and the internal structure of the probe are shown in
Figure 2.
The design idea of the MEPD is to use the form of a telescope composed of silicon semiconductor sensors for achieving the measurement of medium energy protons in eighteen directions through six sets of measurement units. The basic working principle of the detectors is as follows: an incident particle hits on the sensors after passing through the collimator and generates a charge signal, which is proportional in amplitude to the energy deposited by the particle. Then, the charge signal is converted into a voltage signal by a preamplifier and a main amplifier, through which the voltage signal is shaped and sequentially amplified. After that, the voltage signal maintains its maximum amplitude through the peak holding circuit to obtain a signal that is easy to collect, at the same time the trigger circuit triggers A/D to start the analog-to-digital conversion of the peak holding signal. Subsequently, the FPGA analyzes the amplitude of the signal converted by the A/D and compares it with the energy channel division logic to determine which energy channel the incident particle belongs to, then immediately updates the energy channel data in the storage. When the acquisition time of each cycle ends, data from all the measurement units are packaged and marked with a time tag and packing identification by the FPGA. Finally, the FPGA sends the data packet to RTU.
3.2. Electronics Design
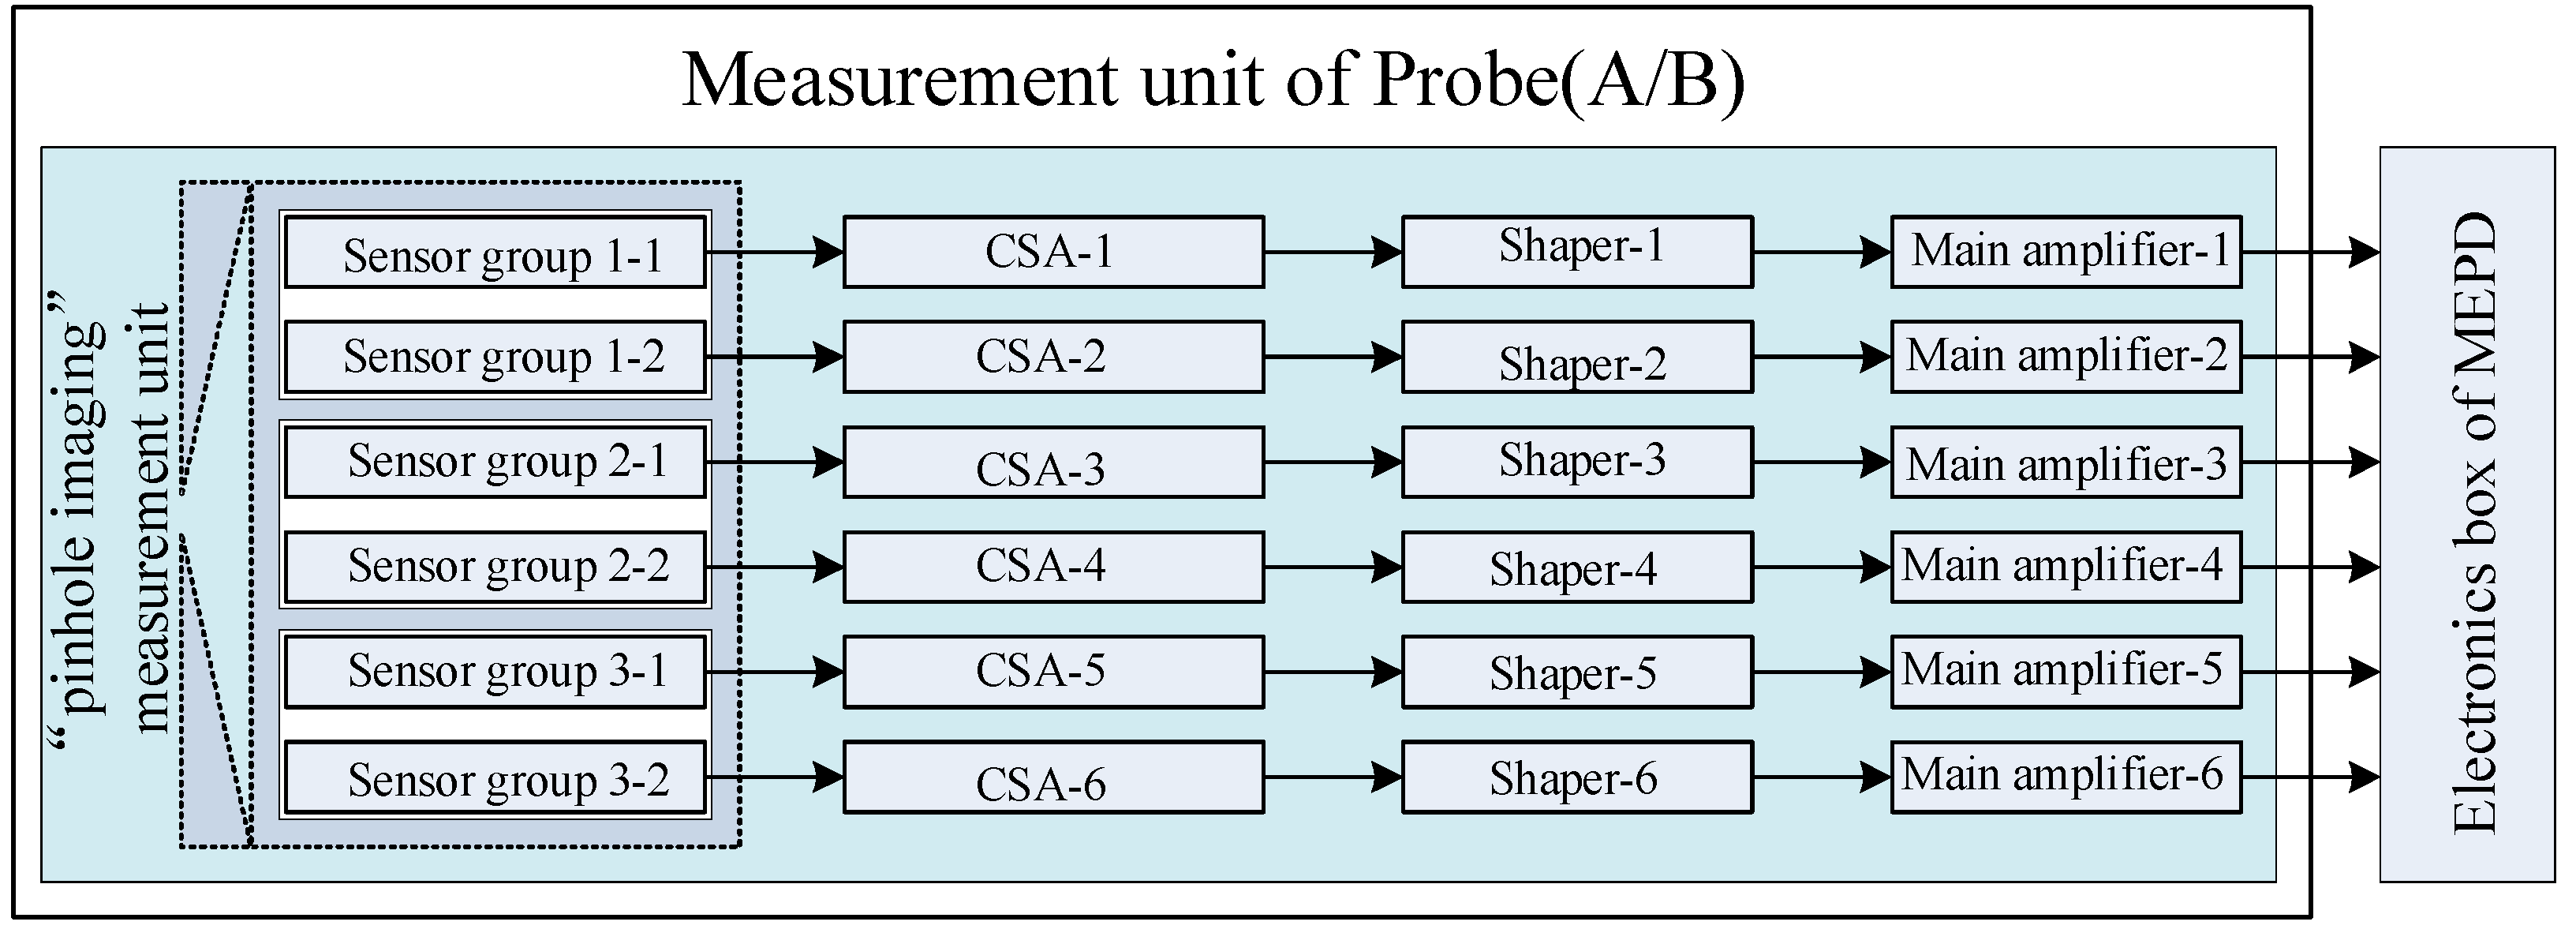
There are three measurement units inside each probe. Each measurement unit has 3 groups of sensors (2 sensors in each group, namely D1 and D2, as shown in
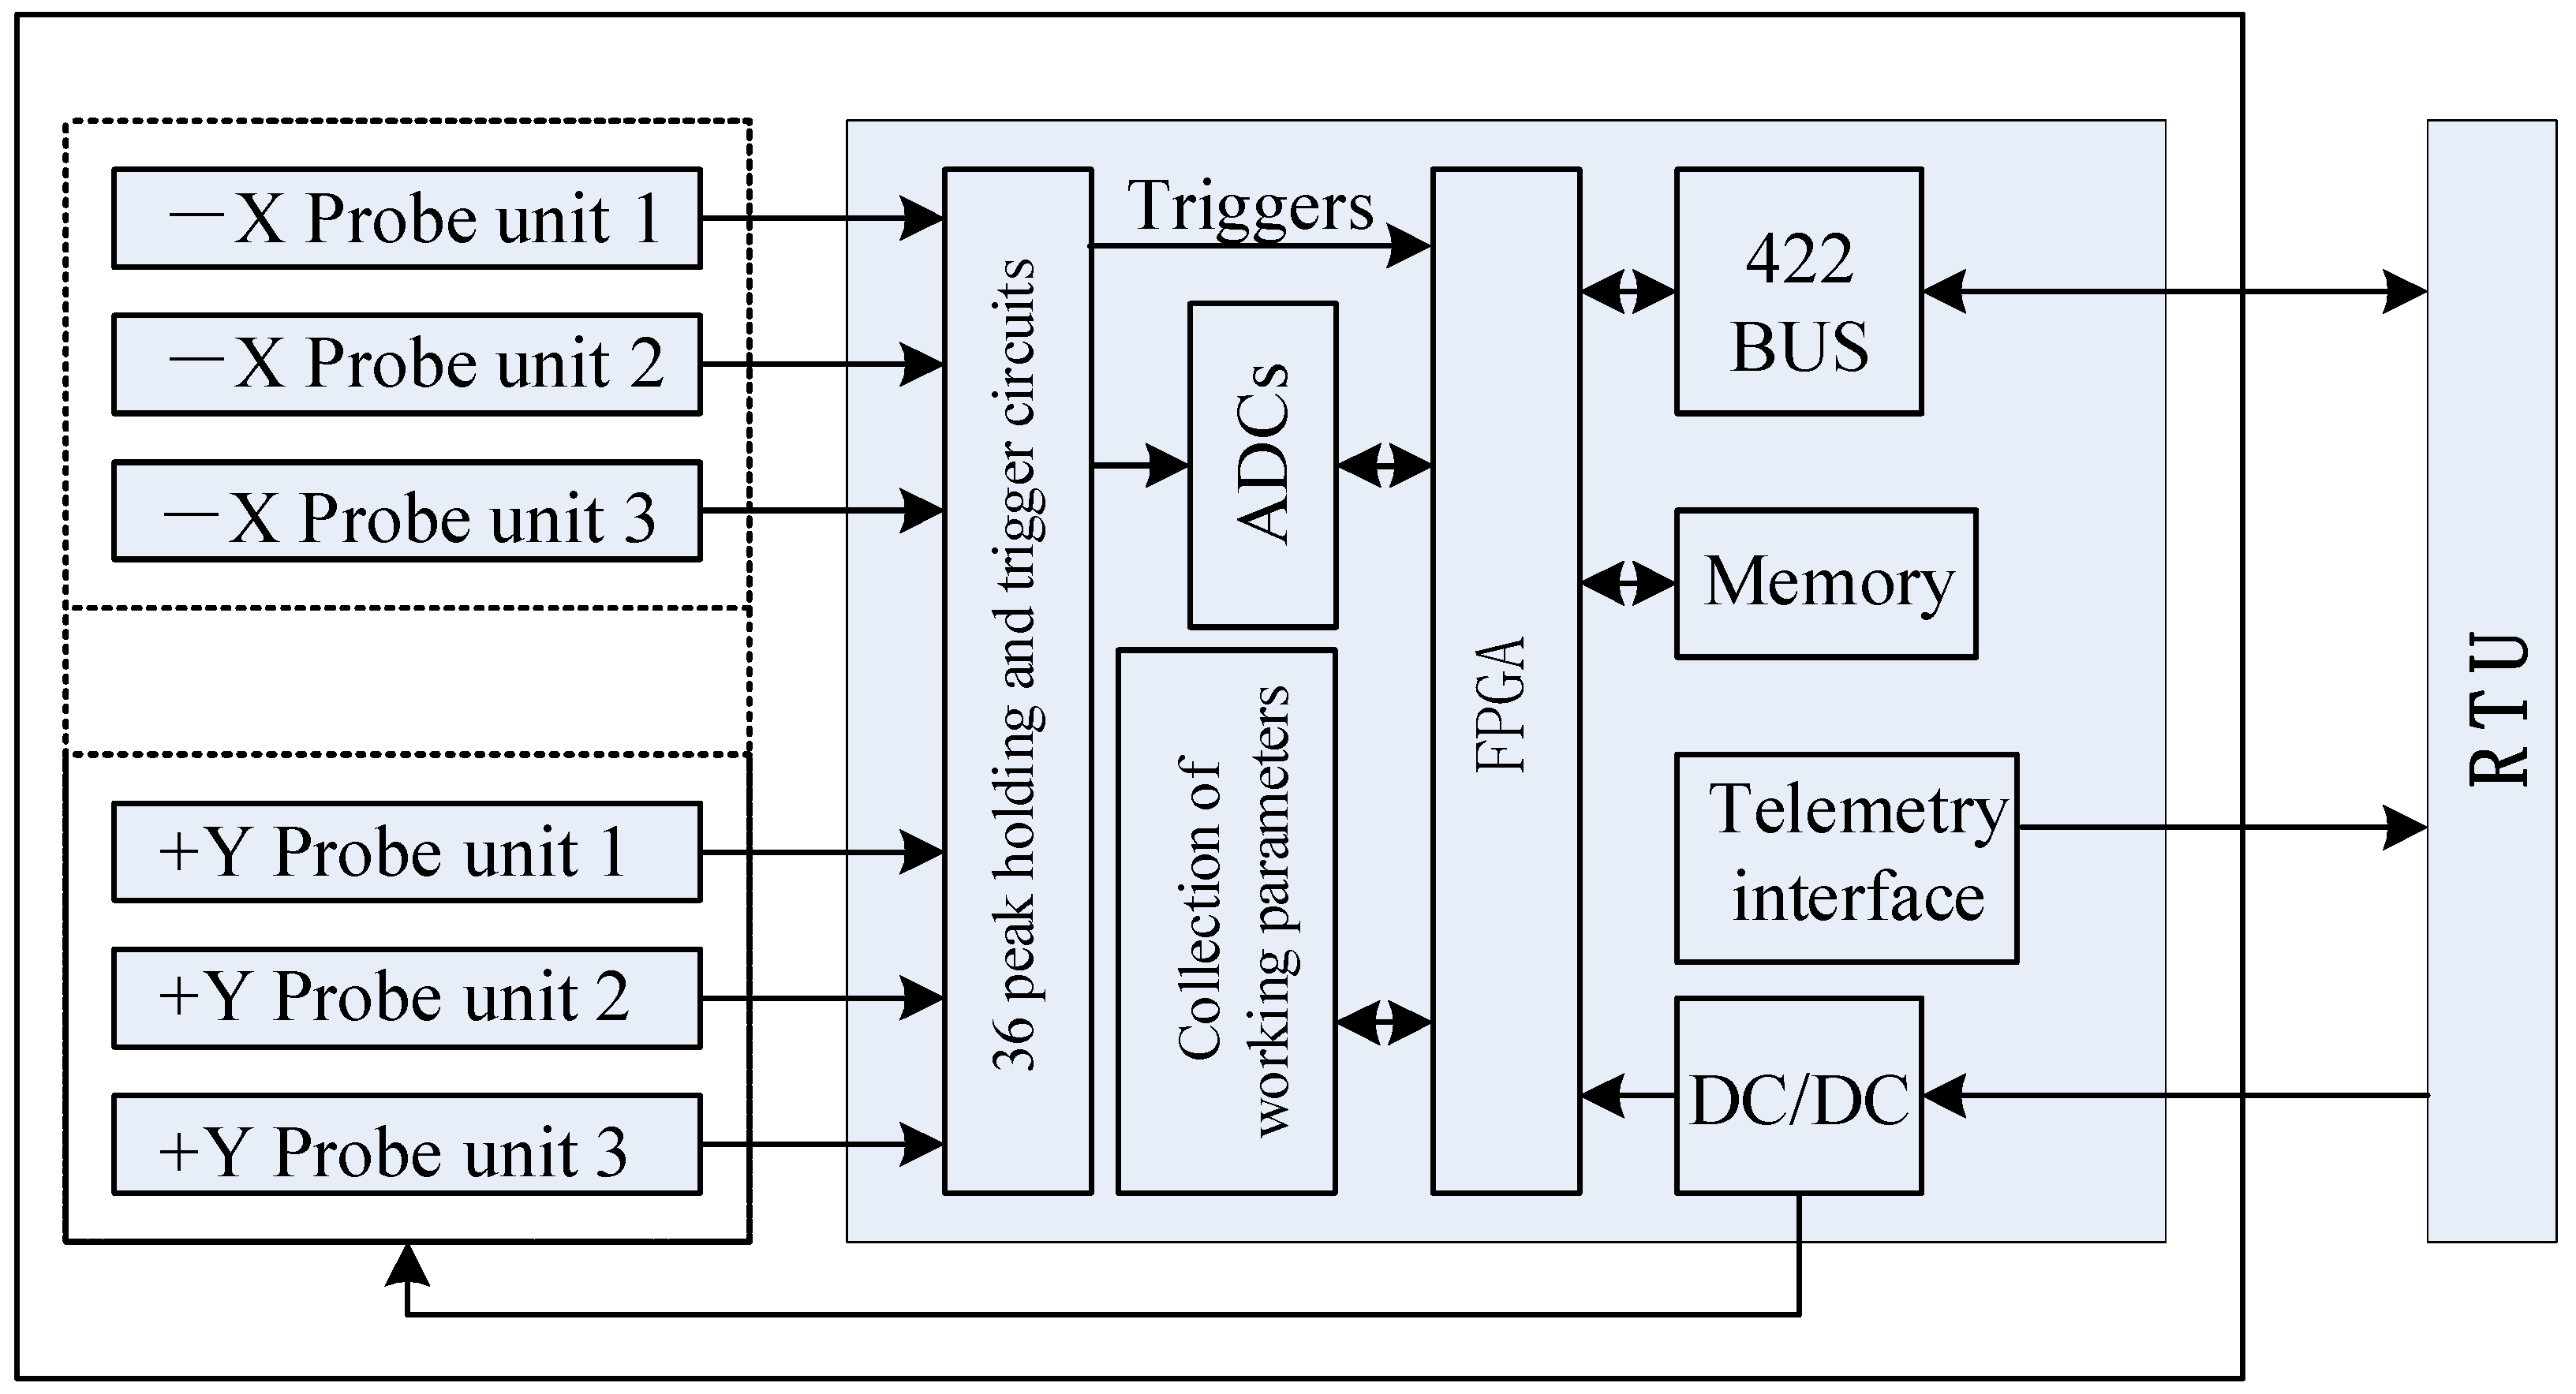
Figure 2), and each sensor is connected to an electronic system. Thus, the whole instrument has a total of 36 circuits of electronics. The internal electronics of each measurement unit are shown in
Figure 3, and the overall circuit composition of the MEPD and the schematic diagram of the electronics box is shown in
Figure 4.
The electronics system mainly includes a power module, pre-amplifier circuit, main amplifier circuit, peak holding circuit, AD data acquisition circuit, FPGA data processing module, and communication circuit. Because of the wide energy detection range, each main amplifier includes two grades, which realize the measurement of the low and high energy sections, respectively.
The scientific data formation cycle is 1 s, which is divided into 3 parts: probe A data collection in the first 0.45 s, probe B data collection in the second 0.45 s, and data transmission between the FPGA and RTU in the last 0.1 s. The advantage of this strategy is that the work of each probe does not interfere with each other, reducing the electromagnetic interference. During the process of scientific data collection, the three detection units of each probe are also independently carried out. The data collection of the MEPD is driven by particle event triggering, which means the AD converters start the conversion process only if there is a which particle enters one of the sensors; thus, the power consumption is greatly reduced.
3.3. Sensor System Design
3.3.1. Sensor Selection and Working Mode
The ion-implanted Si semiconductor sensor has a good energy resolution and linear response and it is the mainstream sensor currently used. In order to achieve the lower measurement limit of 30 keV, the sensor uses an ultra-thin dead layer ion-implanted silicon sensor from the British Micro-semiconductor Company. The light blocking layer was not applied in front of the sensor, but a certain thickness of aluminum was plated on the sensor surface to shield the contamination by sunlight. Currently, the thickness of the aluminum coated layer is 100 nm, and the thickness of the ion-implanted layer is 50 nm. Hence, the total thickness of the dead layer is 150 nm, which means no charge signals output from it. The thickness of the semiconductor sensor is 300 μm, and the sensitive area is 8 mm × 8 mm.
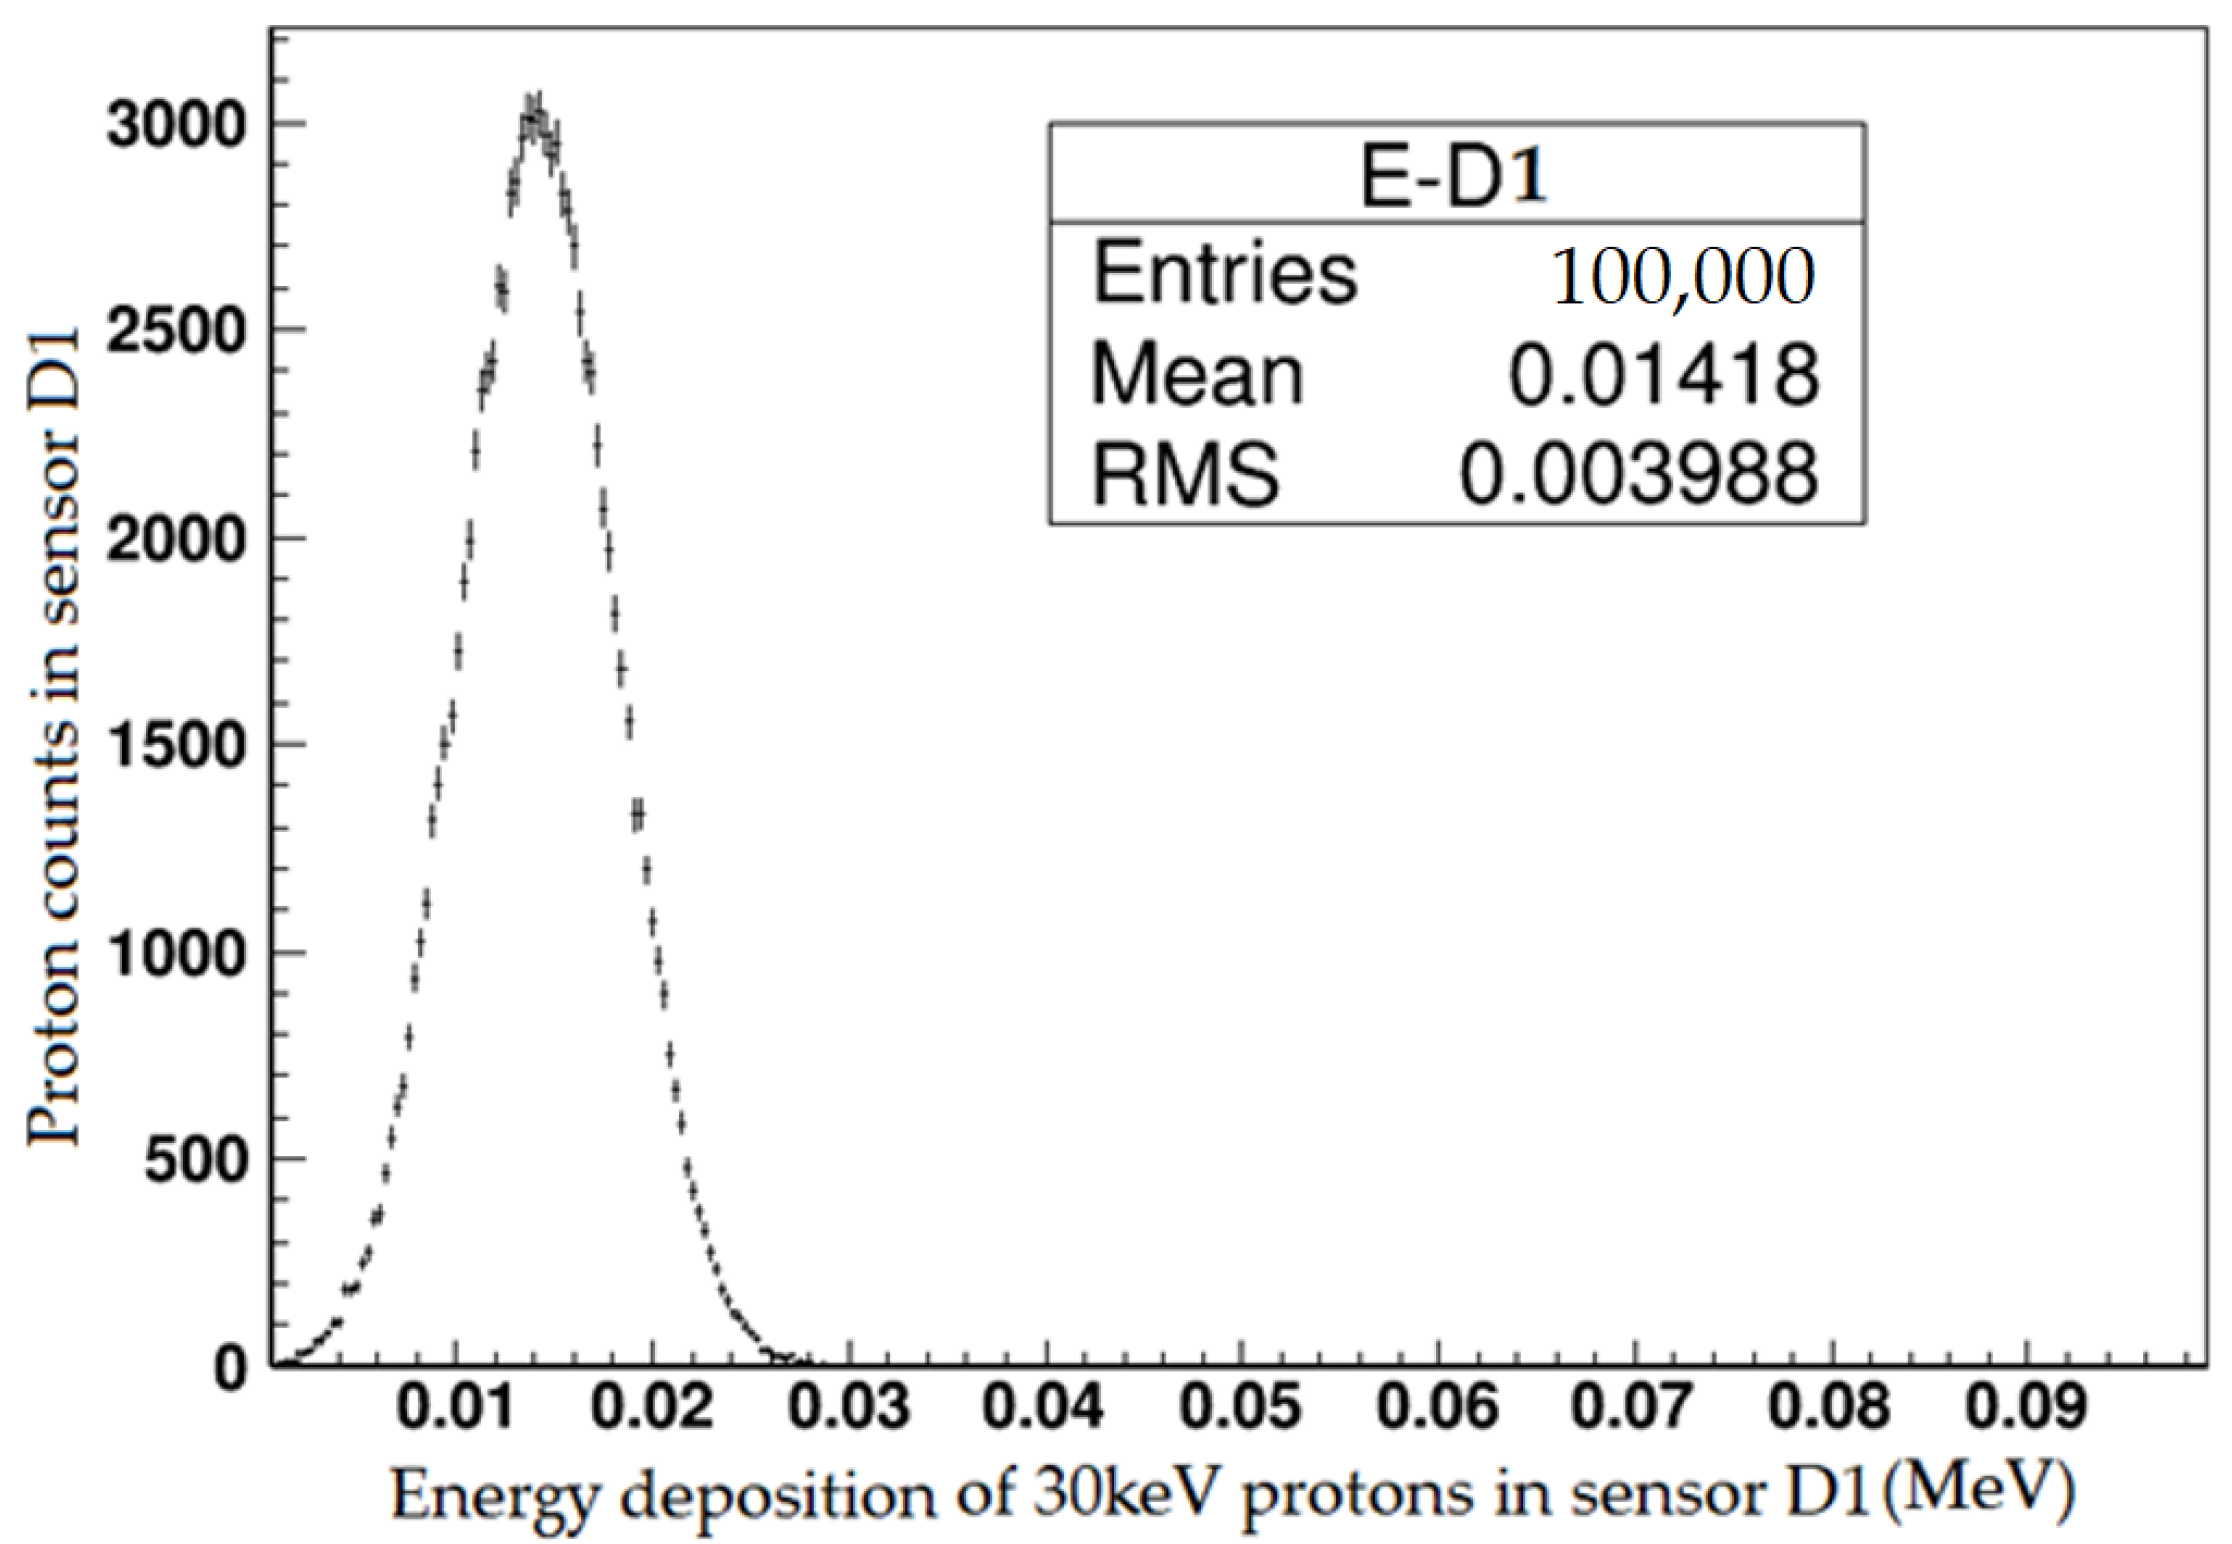
Geant4 is a Monte Carlo simulation tool mainly used for particle transportation simulation in materials. Written in object-oriented C++ language and characterized by a complete range of simulated particles, a wide range of energy, numerous physical process models with flexible selections, and observable particle tracks, it was developed by hundreds of scientists and engineers from dozens of research institutes around the world, organized by the European Organization for Nuclear Research (CERN). Using Geant4,
Figure 5 simulates the energy deposition of 30 keV protons incident into a silicon sensor after passing through a 150 nm (100 nm AL + 50 nm Si) dead layer.
According to the simulation, after 30 keV protons pass through the 150 nm dead layer, the residual energy of the proton is about 14 keV, which is the minimum energy that the MEPD must be able to detect.
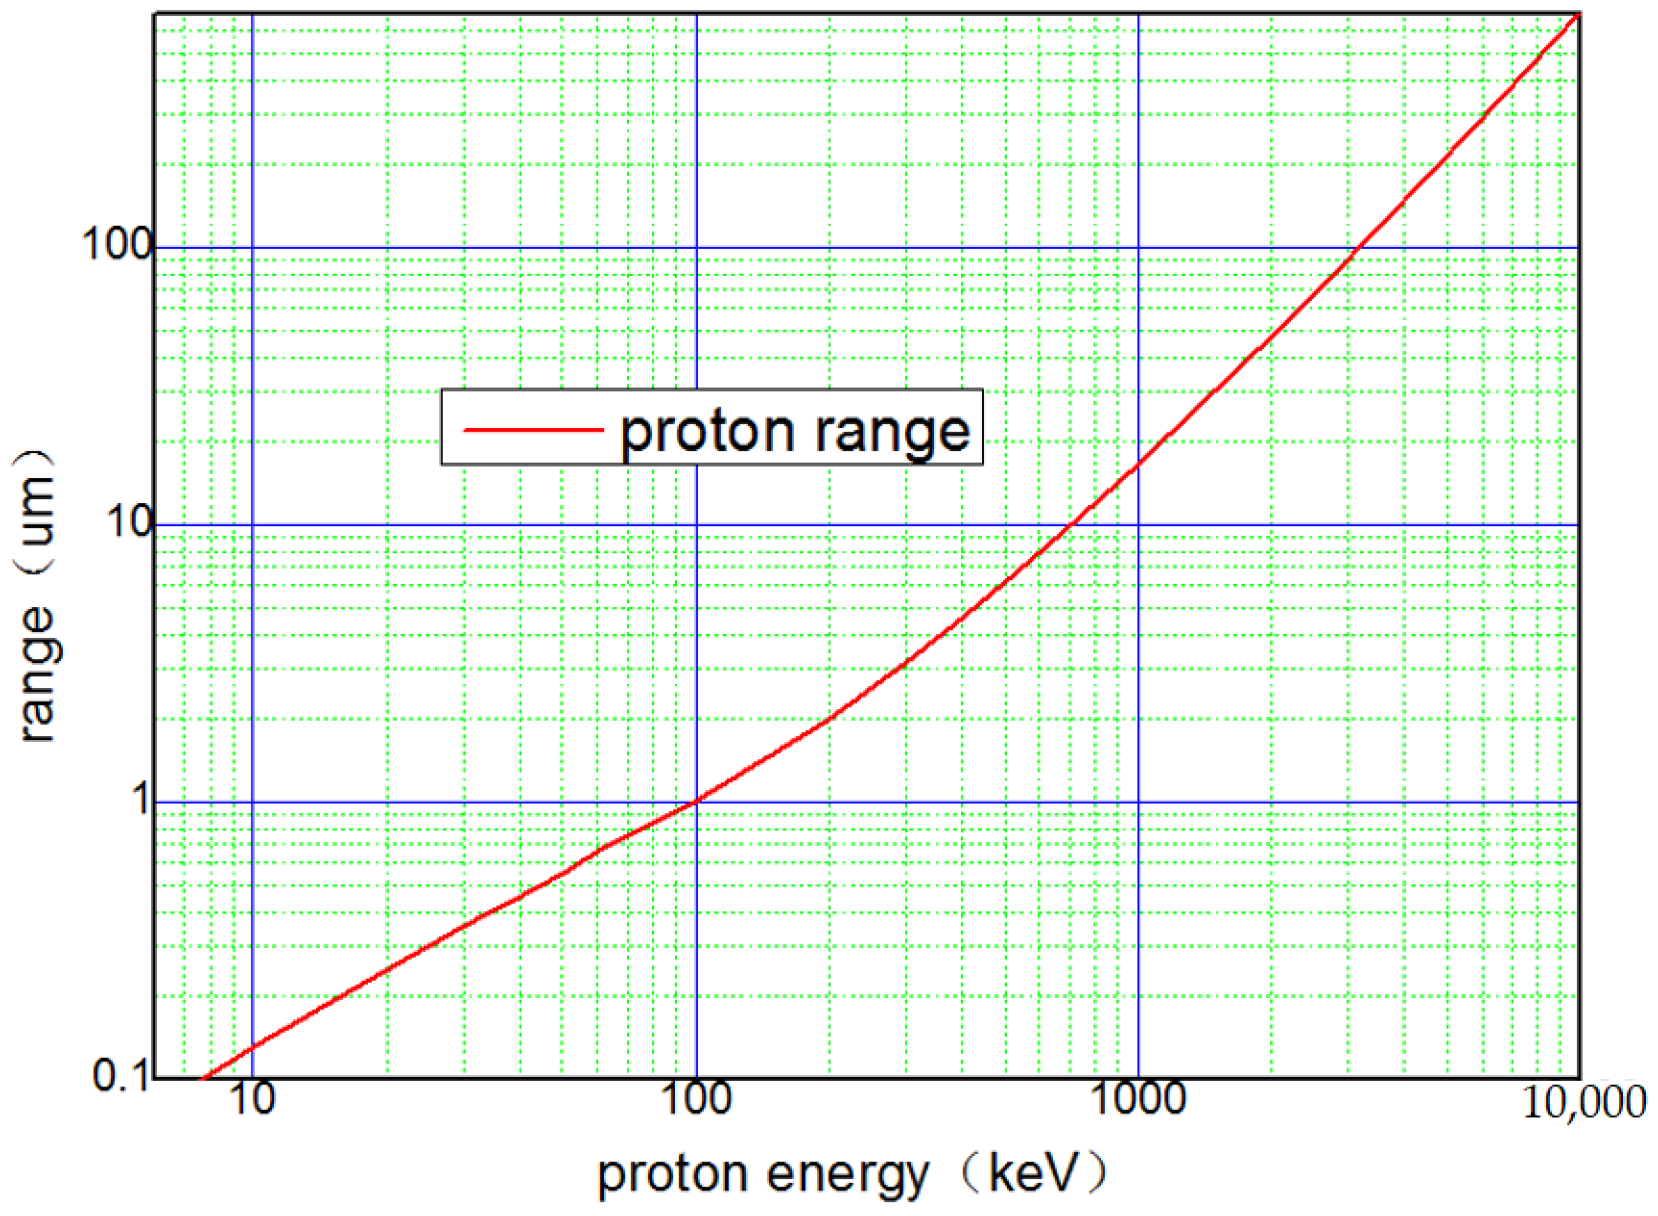
Figure 6 shows the range of protons in the silicon sensor, which is obtained by Monte Carlo simulation using a 1 mm thick silicon sensor and 10
5 entries at each energy point. It can be seen that a 300 μm thick silicon can block 6.0 MeV protons. Therefore, the sensor can achieve an upper measurement limit of 5 MeV.
Sensor D1 and sensor D2 are connected to independent amplifying circuits. Sensor D1 is used as a pulse amplitude analyzer for energy division, and D2 is used as an anticoincidence detector to exclude the contamination by high energy protons and high energy electrons, where the “anti-coincidence” means that the signal to be analyzed is discarded when the amplitude of the D2 sensor signal meets the preset conditions. The working mode logic of the sensors is
, as shown in
Figure 7. For every energy channel, there are two thresholds corresponding to it: an upper threshold and a lower threshold, and the threshold here refers to the signal voltage corresponding to the deposited energy in the sensor D1. As for D2, the anti-coincidence threshold is preset by hardware.
3.3.2. Collimator Design and Geometric Factor
The collimator system mainly includes two parts: the external structure and the anti-scattering structure, as shown in
Figure 2. Three detection directions in each measurement unit share one collimator. There are three functions of the collimator system. Firstly, it is designed to form a suitable detection field of view (FOV), which determines the geometric factor of the measurement unit. Secondly, it can provide certain shielding conditions to prevent the contamination by particles obliquely incident from the side of the sensor and to reduce the elastic scattering effect of electrons in the structure material [
12]. Thirdly, it is used to put deflection magnets inside to deflect medium energy electrons.
The design of the geometric structure of the collimator is related to the geometric factor, which is an important characteristic parameter of the detector. It is necessary for data normalization and data comparison, as shown in Equation (1):
where
N represents the detector’s count rate and
G represents the detector’s geometric factor. The geometric factor determines the ability of the detector to accept space particles and also determines the final count rate state of the detector. The geometric factor cannot be too large to avoid saturation due to the high counting rate and cannot be too small to avoid too large of a statistical fluctuation when the counting rate is too low. The design of the geometric factor refers to the detection results of POES satellites [
13,
14] (see
Figure 8).
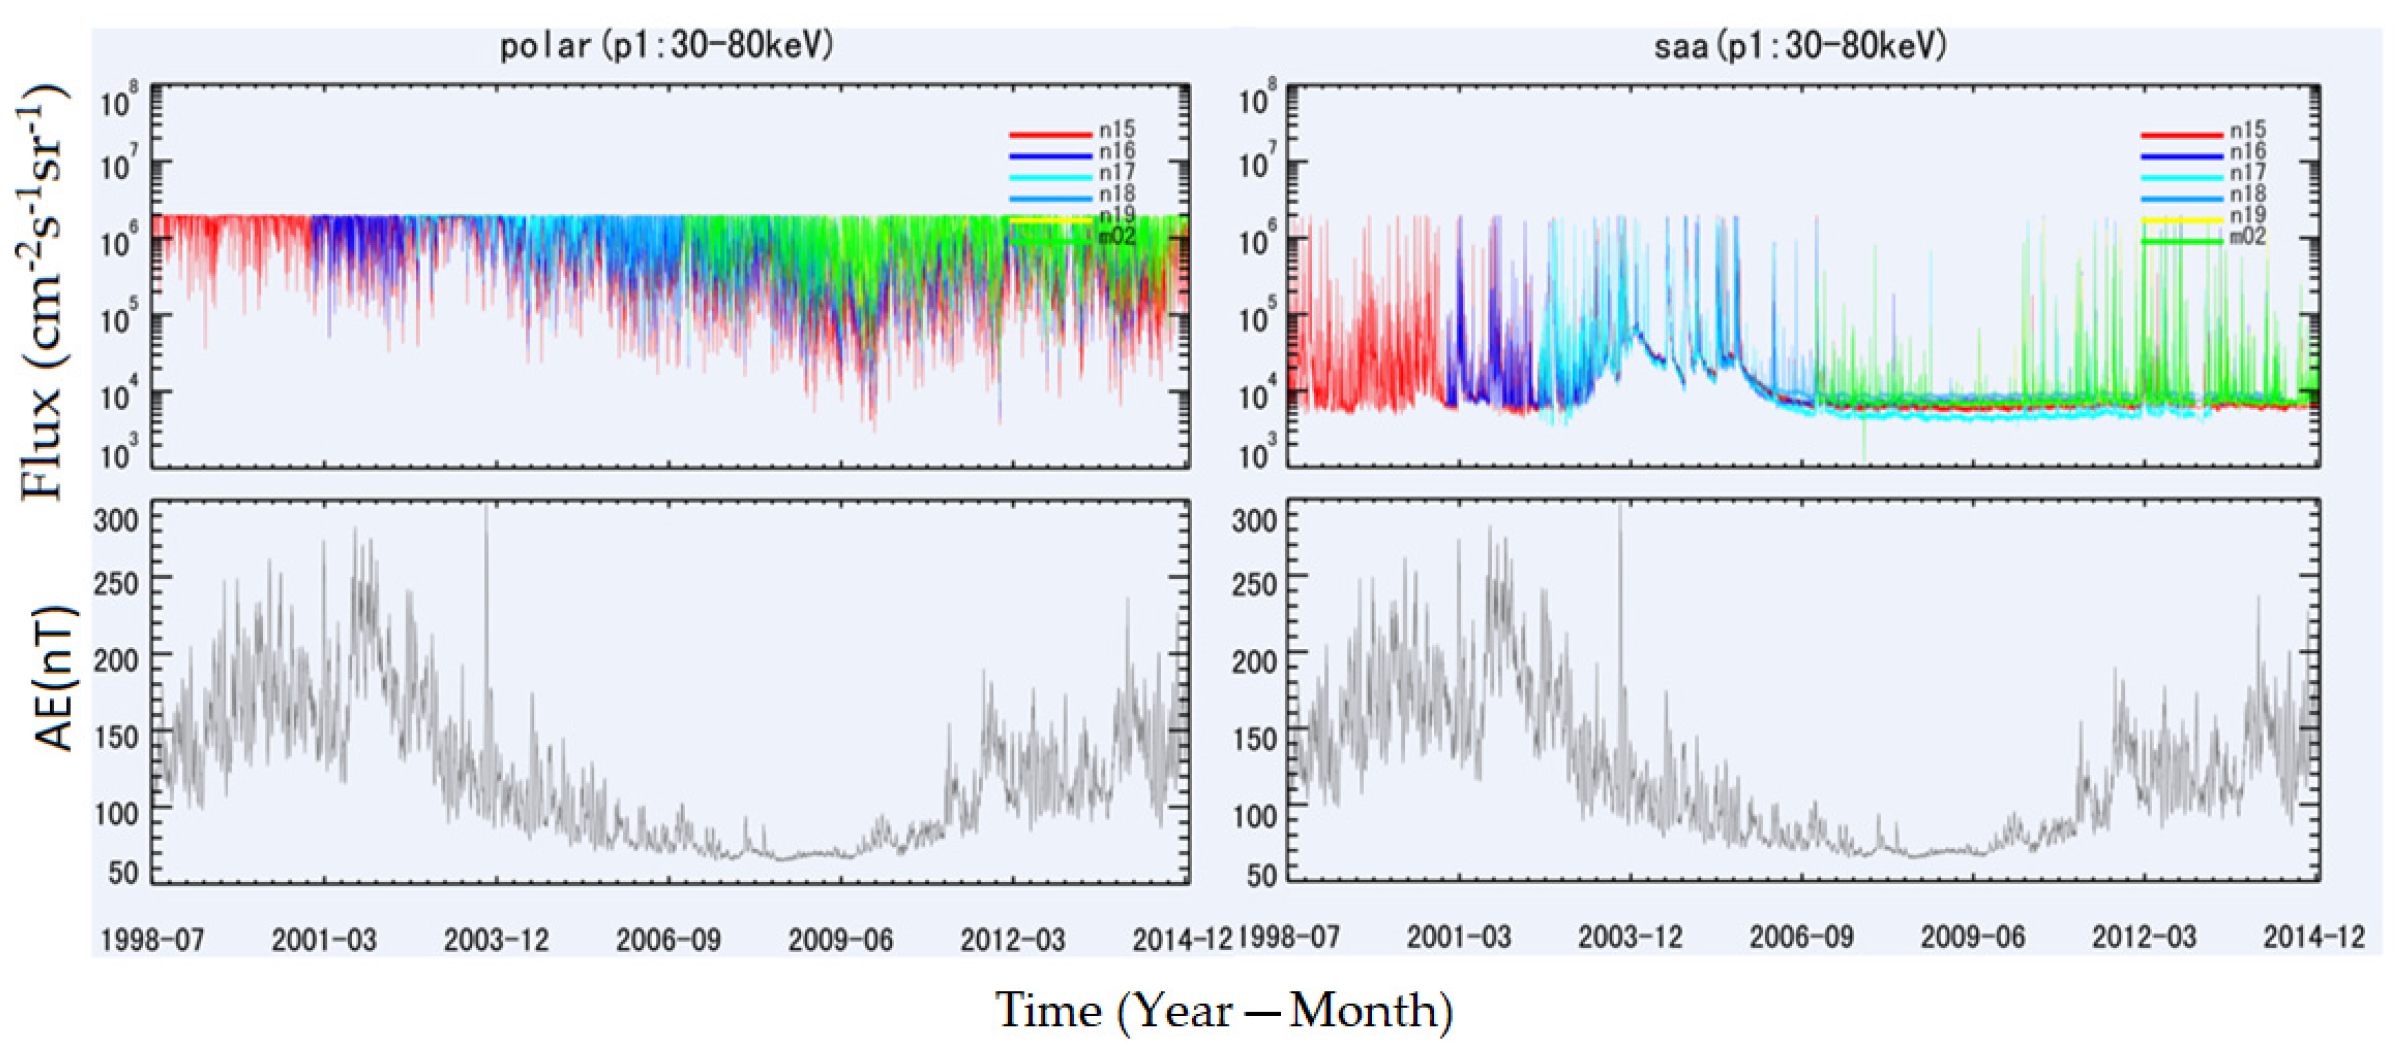
As shown in
Figure 8, the maximum flux of protons above 30 keV in the SAA region is roughly 2 × 10
6 cm
−2s
−1sr
−1 and the maximum flux in the polar region should be greater. Since the POES satellite is saturated at 2 × 10
6 cm
−2s
−1sr
−1, it is impossible to obtain accurate data. Here, we assume that the maximum flux in the polar region is 6 × 10
6 cm
−2s
−1sr
−1. The geometric factor of the POES satellite is 0.01 cm
2sr, according to which the count rate of the detector on orbit can be estimated as shown in
Table 3. The geometric factor of the medium energy proton probe on the FY-3E satellite is designed to be 0.005 cm
2sr, which is obtained by adopting the method of Monte Carlo simulation [
15].
The minimum response time of the medium energy proton probe to particles is 6 μs, and the corresponding maximum counting ability is 1.6 × 10⁵/s. Considering the random incident effect, even if the maximum count rate of the detector is controlled at about 1/5 of the maximum counting ability, which is 3.2 × 10⁴/s; also, it meets the requirements of the maximum count rate.
Due to the large flux dynamic range of medium energy protons, the dynamic range of the maximum value in the polar region exceeds two orders of magnitude. The maximum flux at quiet time is about 104 cm−2s−1sr−1, and the corresponding maximum count is about 50/s, within the reasonable range of processing.
3.3.3. Deflection Magnets
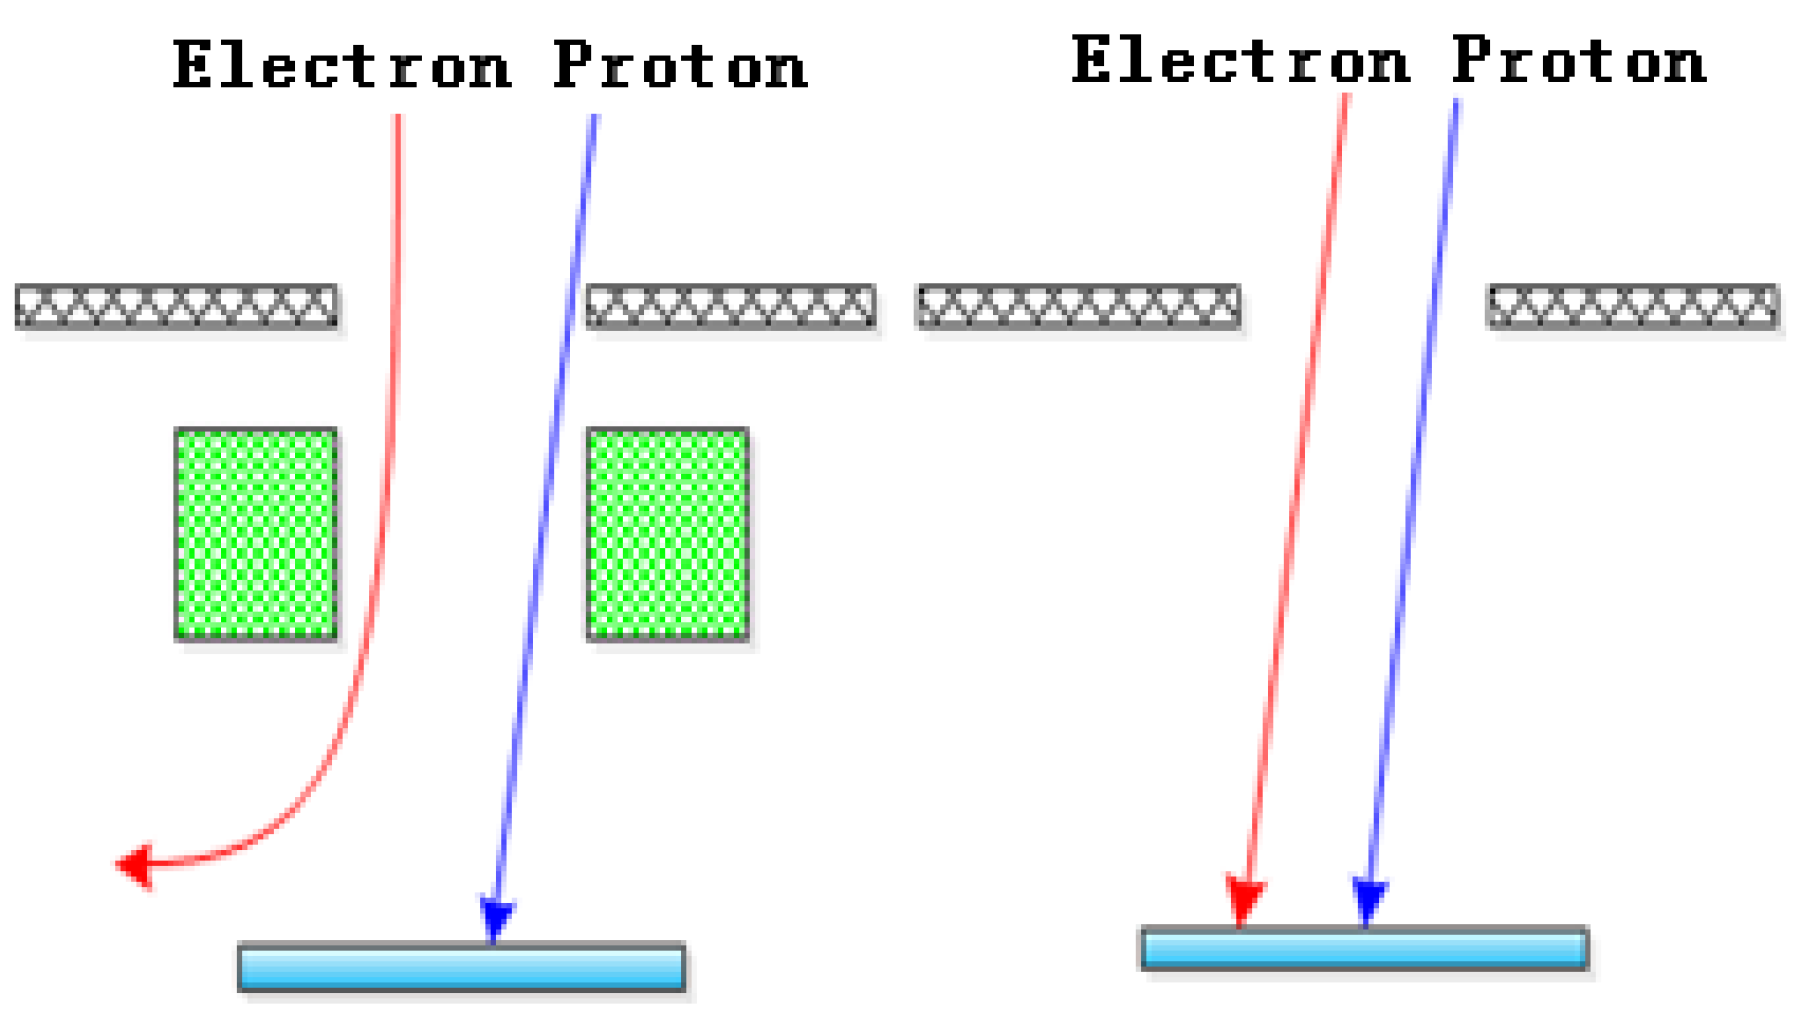
The function of deflection magnets is to exclude the contamination of medium and low energy electrons [
16]. For the medium energy protons and electrons of a similar energy, their energy loss in the silicon semiconductor sensor is basically the same, and they cannot be identified by the circuit. Therefore, deflection magnets are used inside the collimator to deflect the electrons so that they cannot come into the silicon sensor (
Figure 9). The deflection magnet can exclude medium-low energy electrons easily, thus ensuring the measurement of clean proton signals. Since the number of electrons in orbital space is the largest, while the number of other particles such as heavy ions can be ignored compared with protons, the contamination of electrons to protons is mainly discussed here.
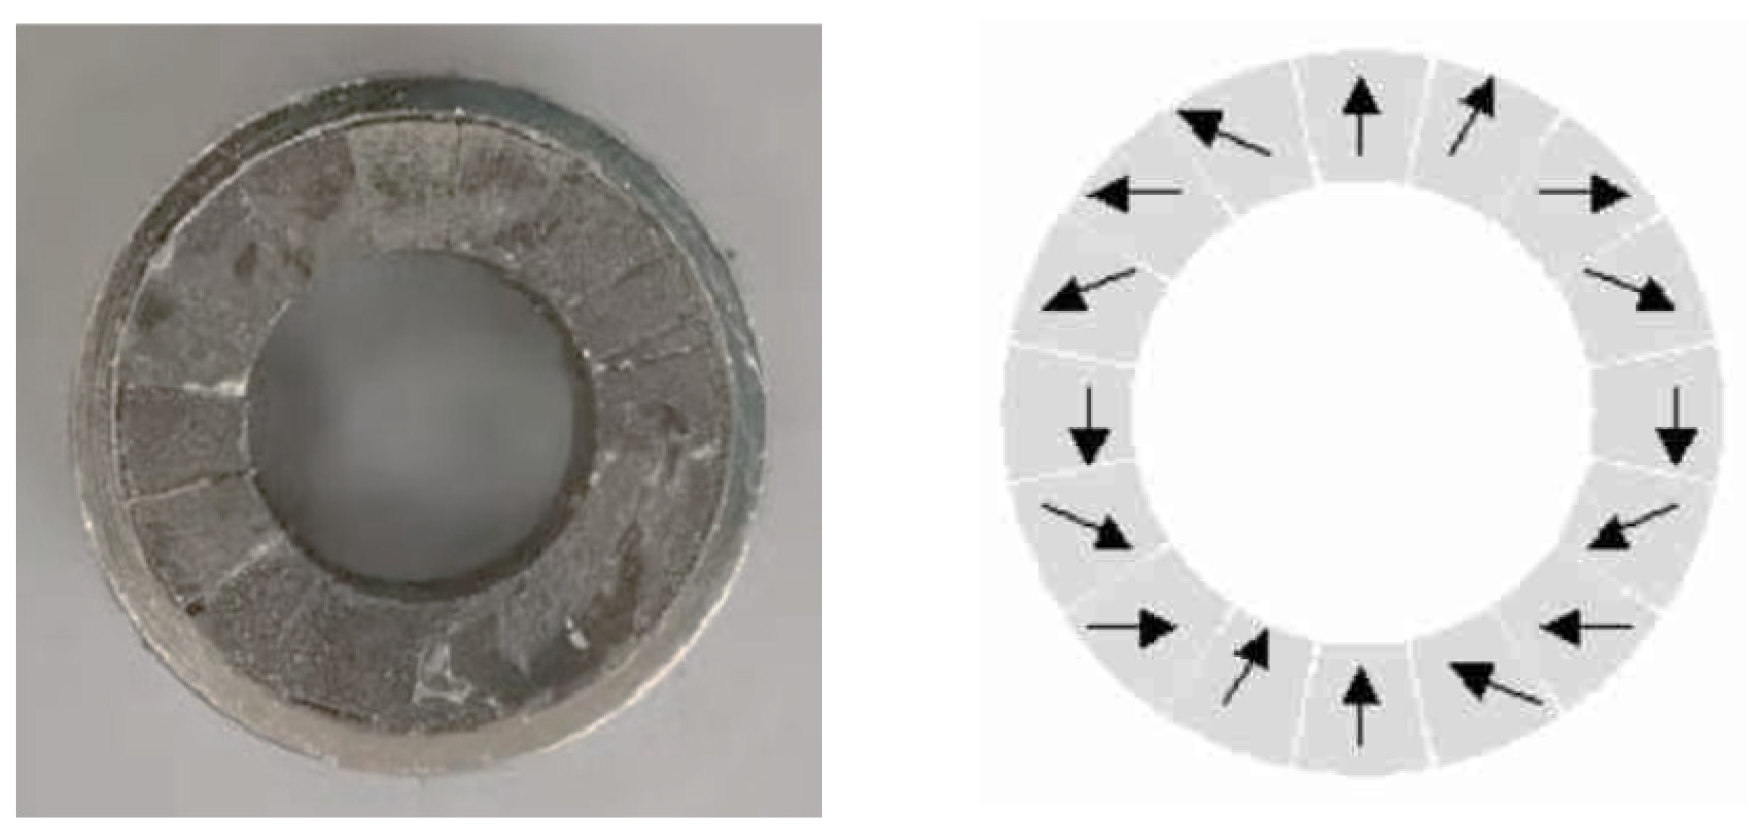
The deflection magnet used by the detector is a permanent annular magnet structure. Its structure and magnetic field direction are shown in
Figure 10.
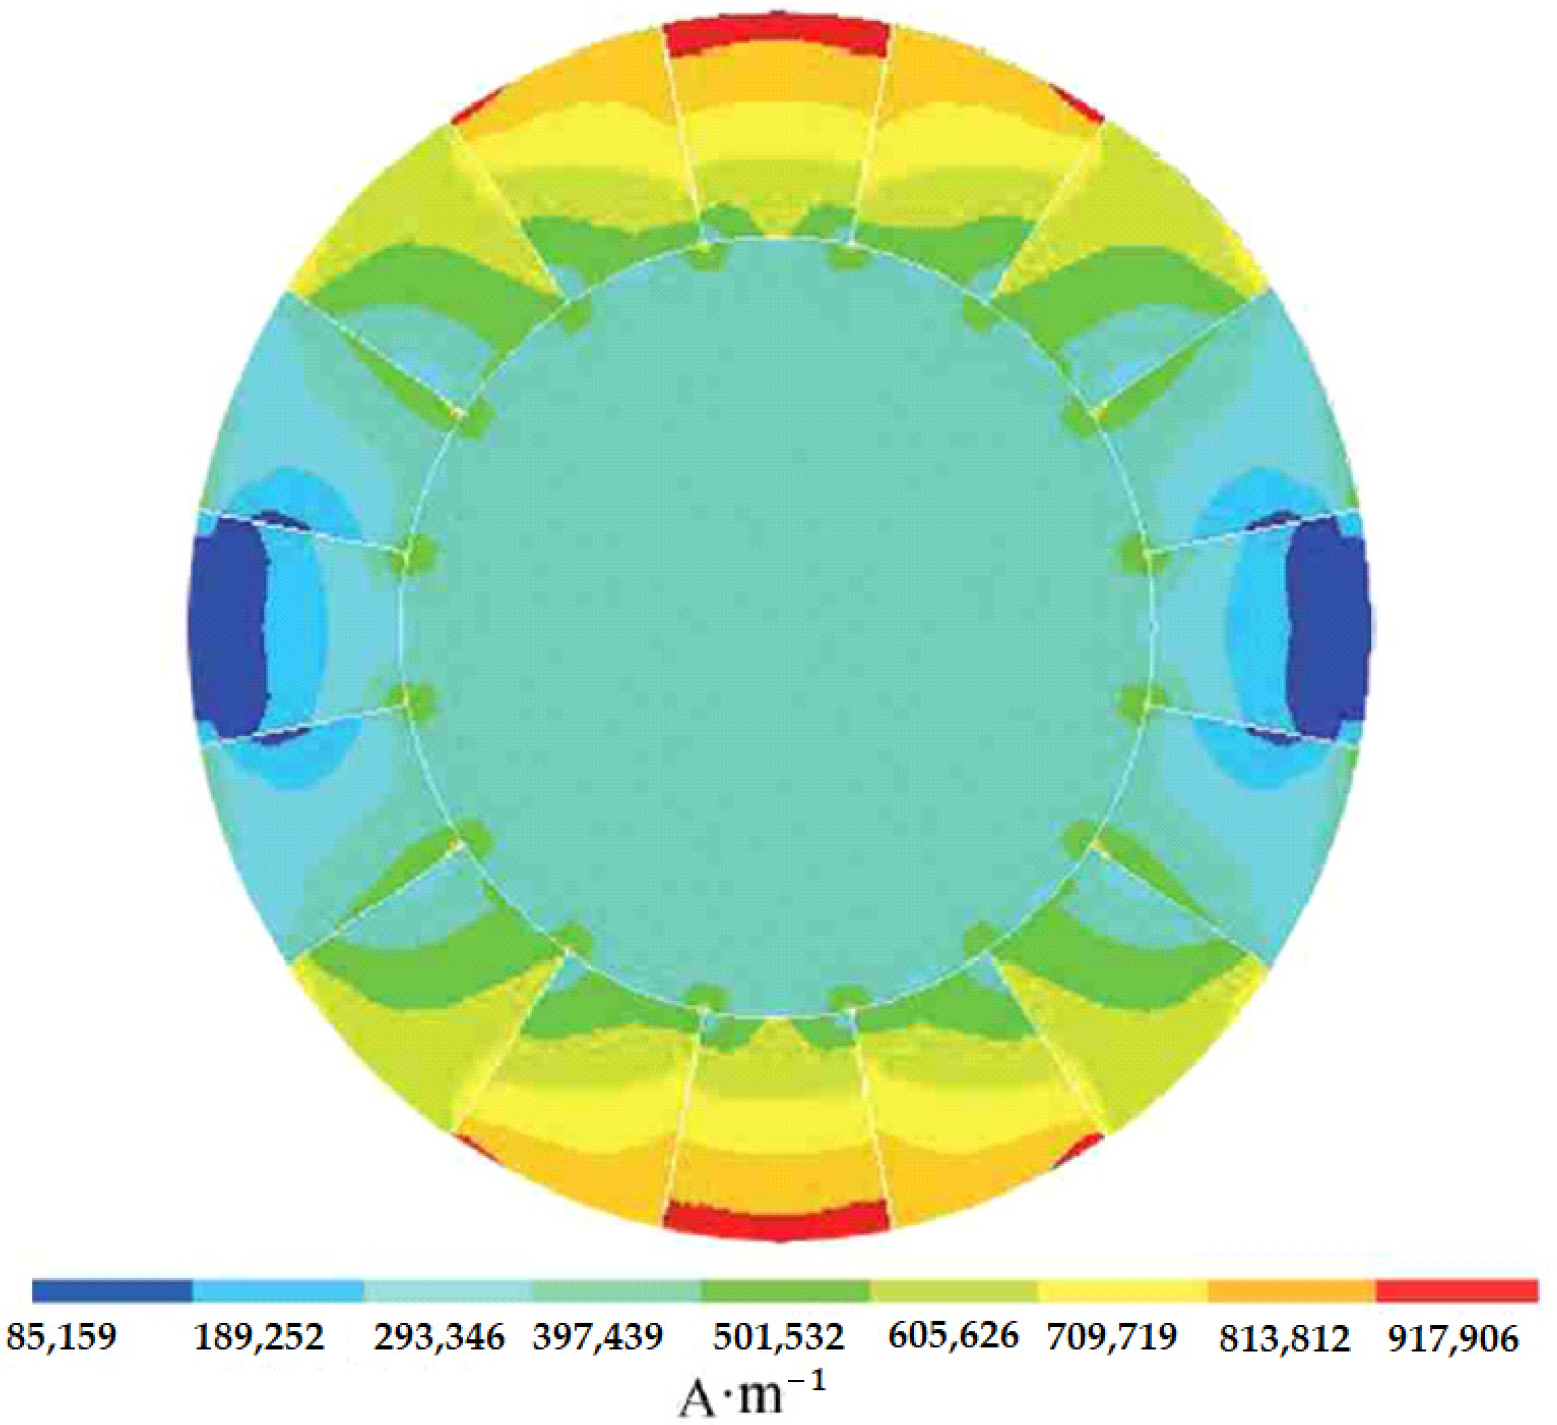
Figure 11 is the magnetic field distribution inside the magnet, simulated with ANSYS [
16]. The magnet parameters are shown in
Table 4.
In
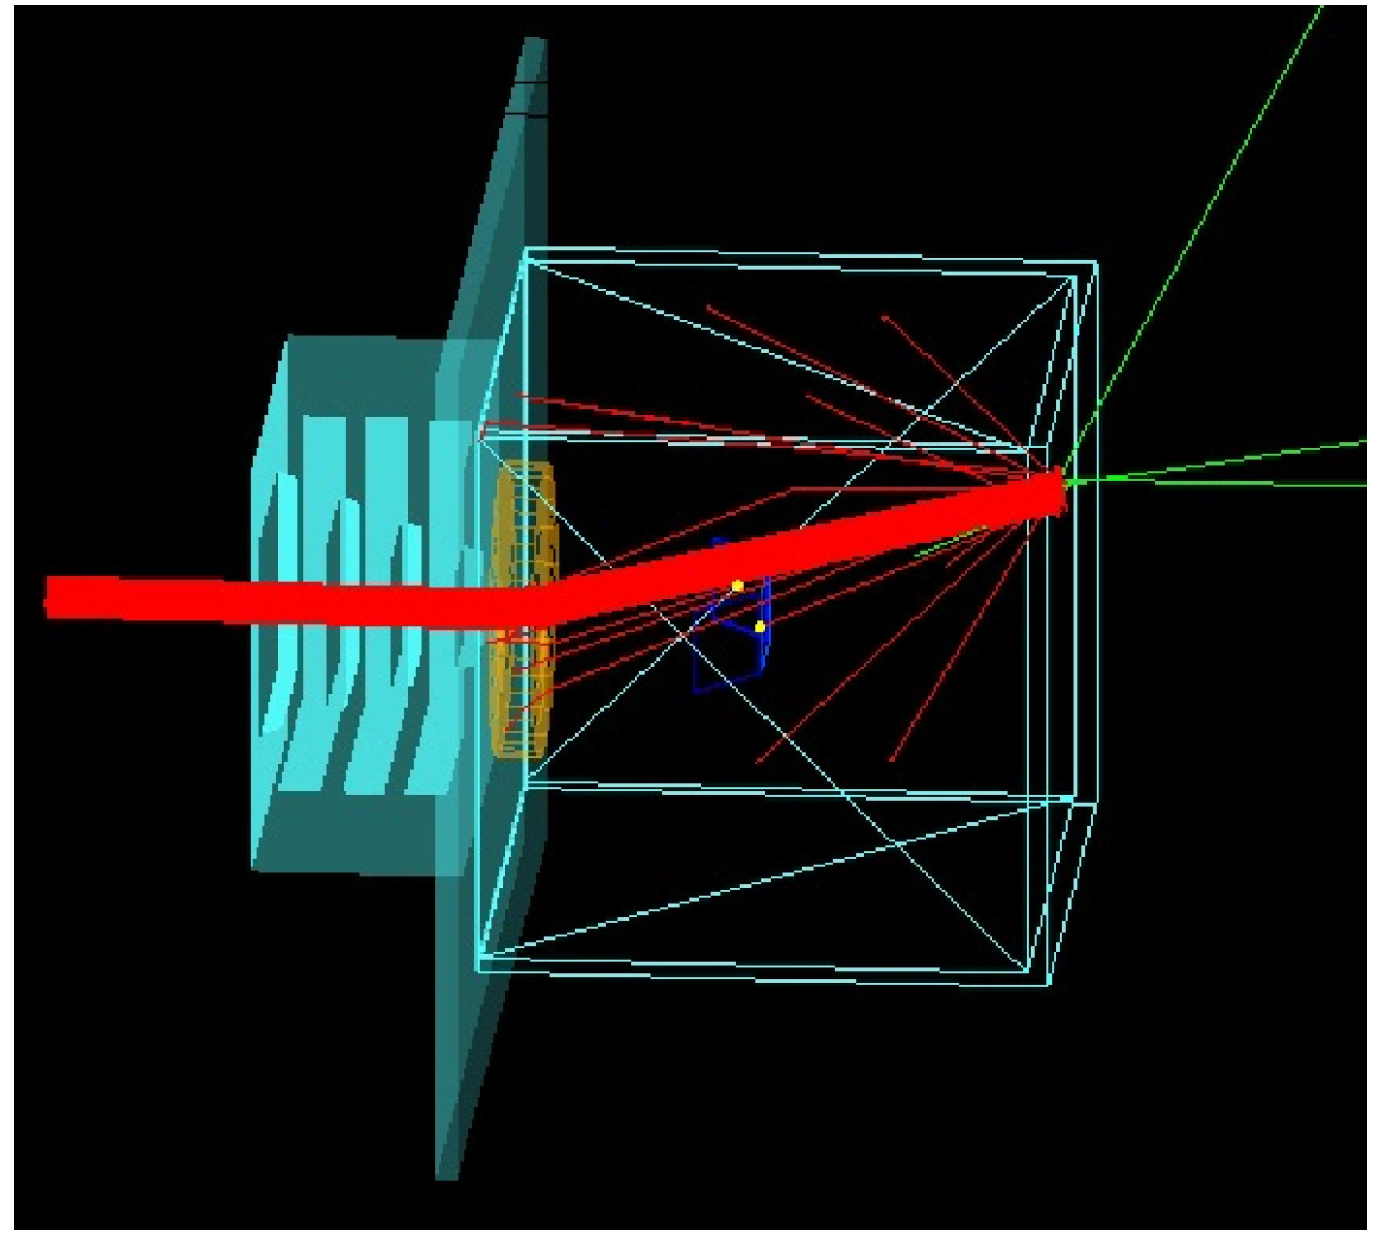
Figure 12, the Monte Carlo method was applied to simulate the contamination of electrons on proton measurements after electrons pass through a magnetic field.
After simulation, it is found that, even if a high-strength deflection magnetic field is used, electrons with higher energy (>1 MeV) still had a certain probability (>5%) to enter the detector after being deflected by the magnetic field. The interference ratio of electrons to protons can be effectively reduced to within 2% using the anti-coincidence sensor.
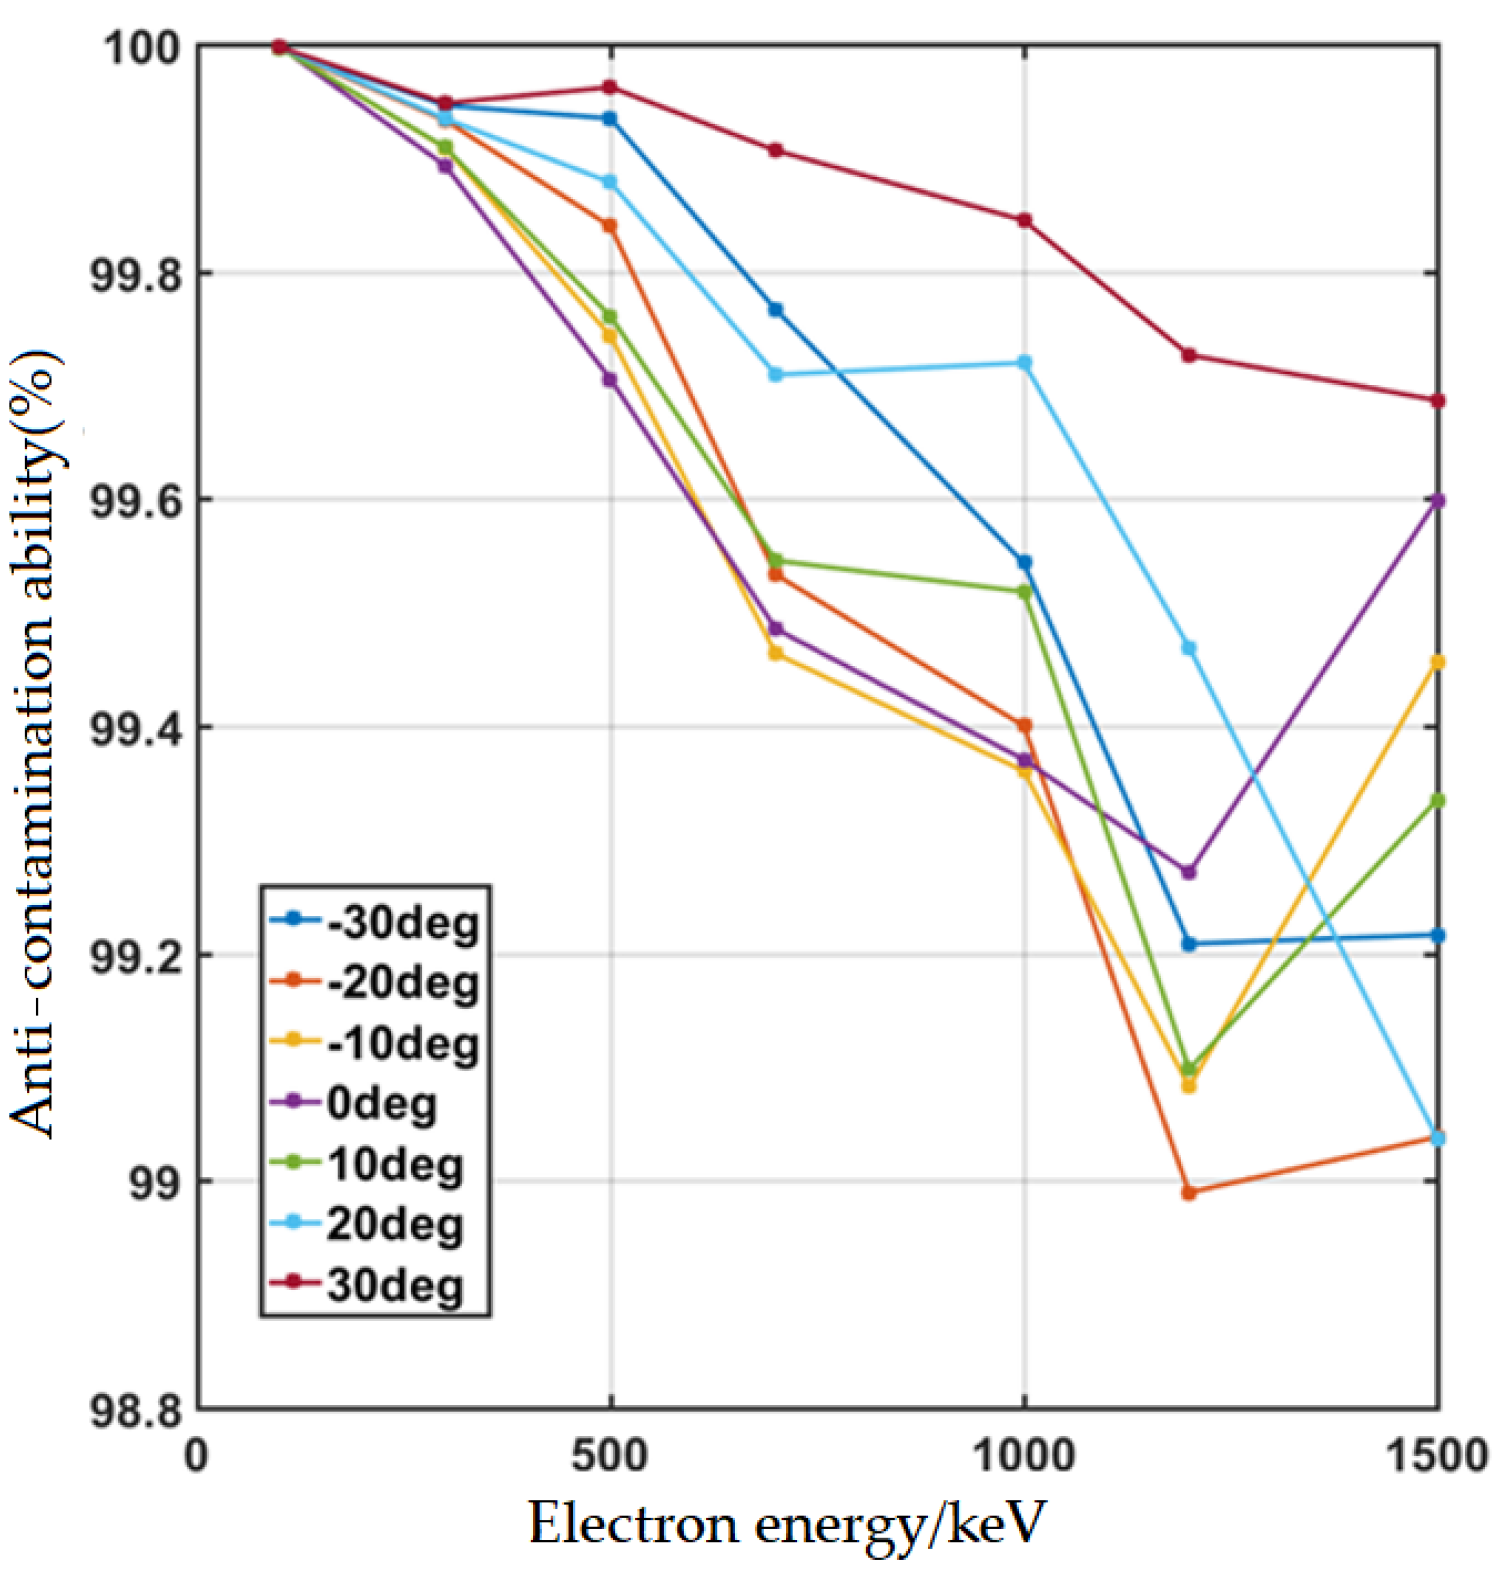
Figure 13 shows the anti-contamination ability of the sensor under different incident angles, given by the electron accelerator. The test used a measurement unit (including three adjacent detection directions) to cover a 60 degrees field of view. The detector is placed on a rotating platform in the vacuum tank. When electrons are incident perpendicular to the middle group of sensors, it is recorded as 0 degree. Because it is difficult to place the geometric center of the three groups of sensors on the rotation axis of the rotating platform, the test results at equal incidence angles (±10 degrees, ±20 degrees, ±30 degrees) are not completely symmetrical about 0 degree, as shown in
Figure 13. With the electron energy increasing, the anti-contamination ability of the sensor first decreases and then increases, which is because the deflection ability of the magnet is decreasing while the anti-coincidence ability of the sensor is increasing.
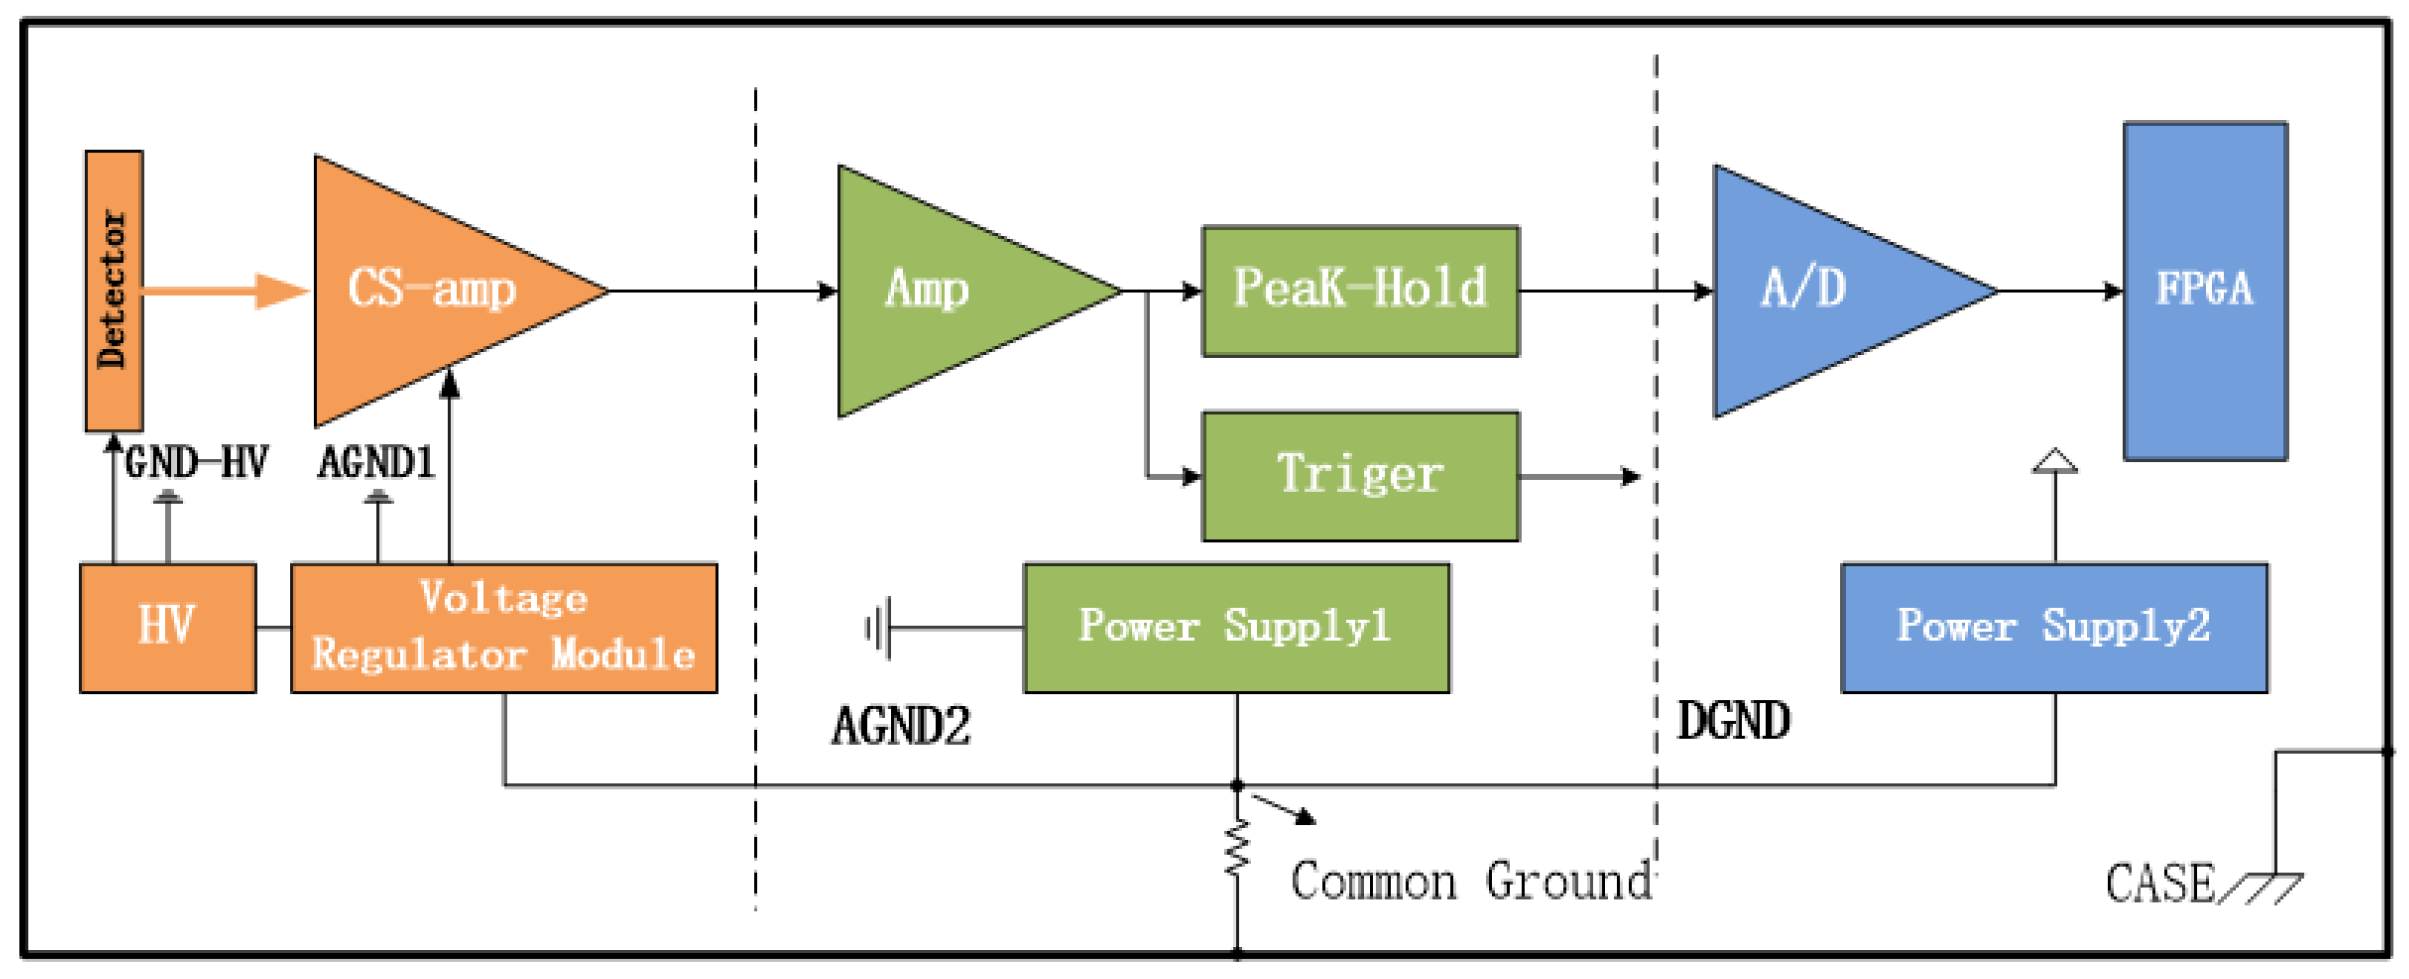
3.4. EMC Design
For medium energy proton detection, the lower energy limit of the detection range is a key index. In this design, a low-loss, ultra-thin coating is used as a light-blocking layer to reduce the energy loss of protons on the incident path. The ultra-low-noise circuit technology is adopted to control the background noise of the detector within 5 keV, while the noise of the high energy particle detector is controlled below 50 keV. Hence, the low-noise control of electronics is a key technology. The solutions include power isolation, selection of low-noise components, and optimization of grounding design. For example, different power supply modules are used in the sensor power supply, digital circuit, front-end of analog circuit, and back-end of analog circuit, respectively; the preamplifier part uses a regulated power supply alone, and its ripple voltage is less than 1 mV. In the grounding mode, each module has a single point common ground at the power output to avoid common-loop interferences. The power supply relationship of the circuit of each part is shown in
Figure 14.
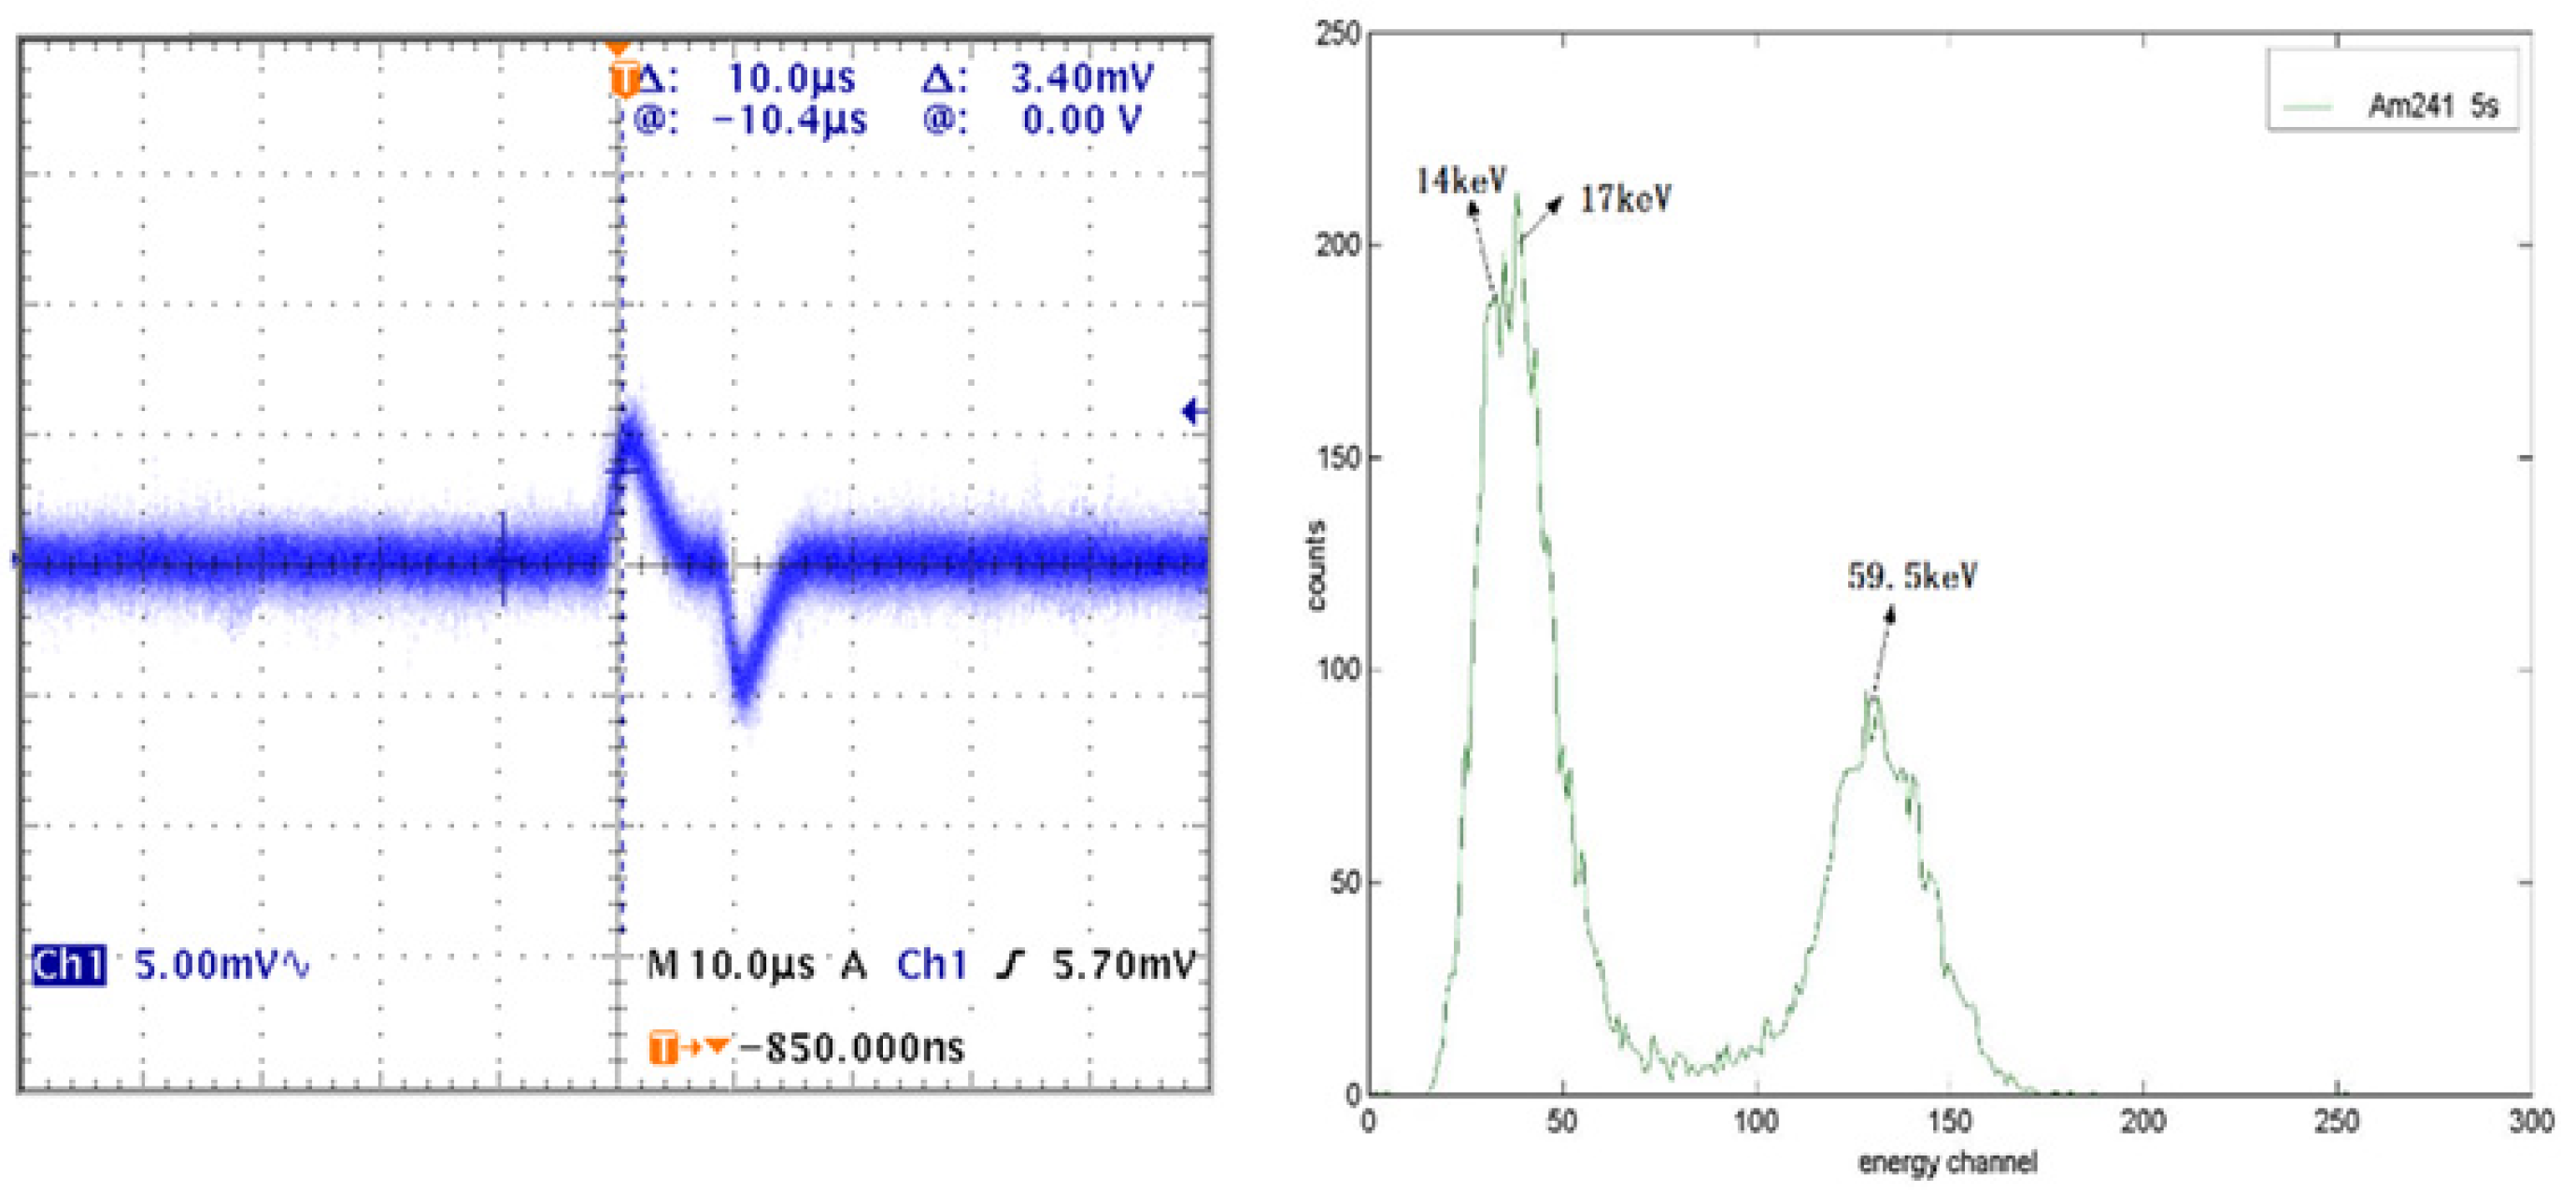
After using the above-mentioned detection technologies, a noise verification test was performed. An analog signal source was used to connect the electronic system, and an oscilloscope was used to examine the noise of the circuit. When inputting an analog signal equivalent to 14 keV (analog signal: 0.5 pF, 1.25 mV; equivalent incident proton energy: 30 keV) of deposited particle energy, the amplitude of the effective signal after pre-amplification was 5 mV. The background noise of the electronic system was less than 2 mV. The signal-to-noise ratio can reach about 3:1, which can meet the requirement of the lower limit of measurement. The test waveform of the analog signal source is shown in
Figure 15 (left). The entire detector used the Am
241 radioactive source (peak value: 14 keV, 17 keV, and 59.5 keV) to conduct the verification test. The test results are shown in
Figure 15 (right).
4. Calibration
4.1. Calibration Method
The calibration method is the same with all other charged particle detectors. The main calibration item of the MEPD is the energy spectra, including the energy spectra range, energy linearity, and energy resolution. In addition, the calibration of the detector also includes the test of the sensor thickness, size, field of view, and the particle identification capability, as mentioned in
Section 3.3.
The purpose of energy spectra range calibration is to determine the threshold of energy channel division, which corresponds to the actual boundary point of each energy channel. The basic principle is that, when a particle with the energy of the boundary point enters the detector, the probability of it falling into the upper and lower energy ranges is equal. Part of the energy channels (depending on the conditions of the accelerator) can be calibrated by the accelerator, and the rest need to be extrapolated based on the existing calibration results or completed by the analog signal source.
Energy linearity and energy resolution can be used to evaluate the accuracy of instrument electronics and can be used as indicators to characterize the level of the detector development.
The energy spectra calibration was carried out on the 200 keV and 2 MeV accelerators of the “Space Payload Test and Calibration Platform” in Huairou District, Beijing.
4.2. Calibration Results
Since the calibration results of 18 directions of the MEPD are highly consistent in the energy spectra range, linearity, and energy resolution, the ground testing results of the MEPD in direction two are given here to verify its performance.
4.2.1. Energy Linearity and Energy Resolution
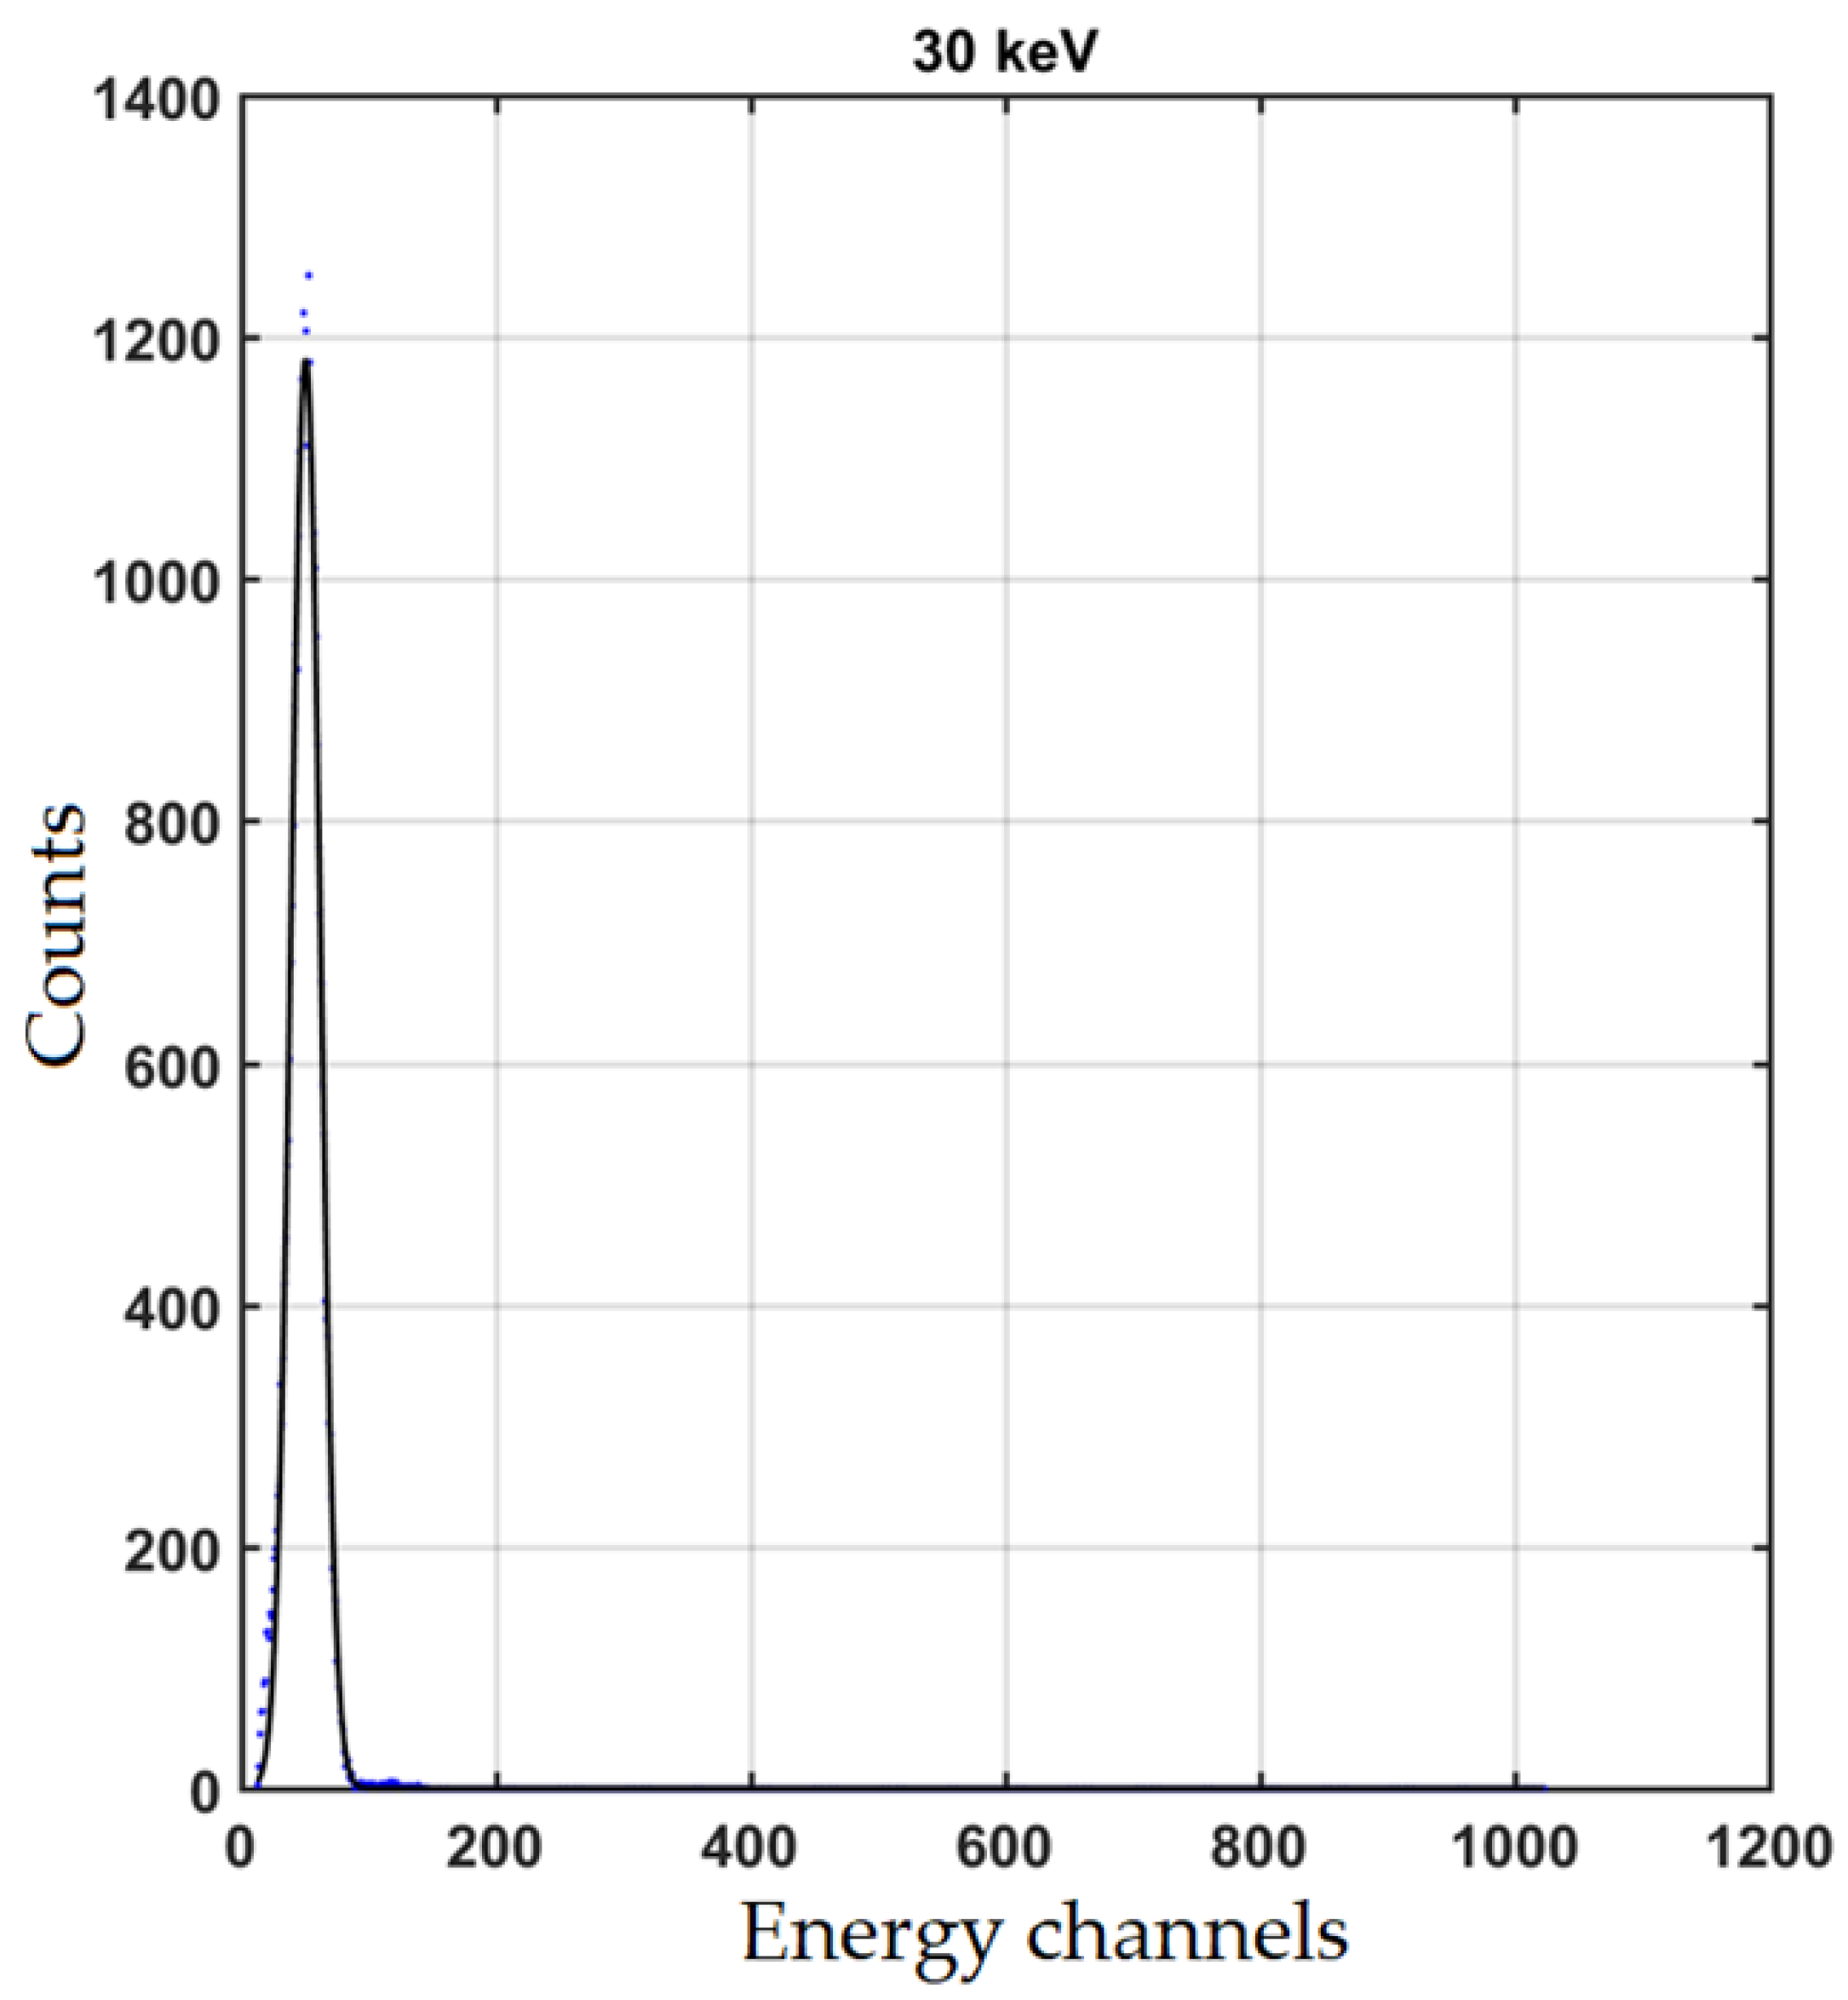
The Gaussian fitting results of the measured data @30 keV in the multi-channel analysis mode in the direction two of the MEPD are shown in
Figure 16, where the ordinate of the blue points is the multi-channel counting data corresponding to the fixed incident electron energy, the abscissa is the channel number, and the black curve is the fitting result.
To obtain the energy linearity, more than ten energy points were tested. The corresponding relationship between the deposited energy and the multi-channel Gaussian peak is shown in
Table 5, and the energy resolution obtained according to the Gaussian fitting results is also listed here. Energy resolution refers to the energy broadening measured by the detector for particles with fixed energy and it is equal to the ratio of the full width at half maximum (FHWM) to the center value, as shown in Equation (2):
In Equation (2), λ0 is the abscissa of Gaussian peak position and is FHWM of Gaussian fitting curve.
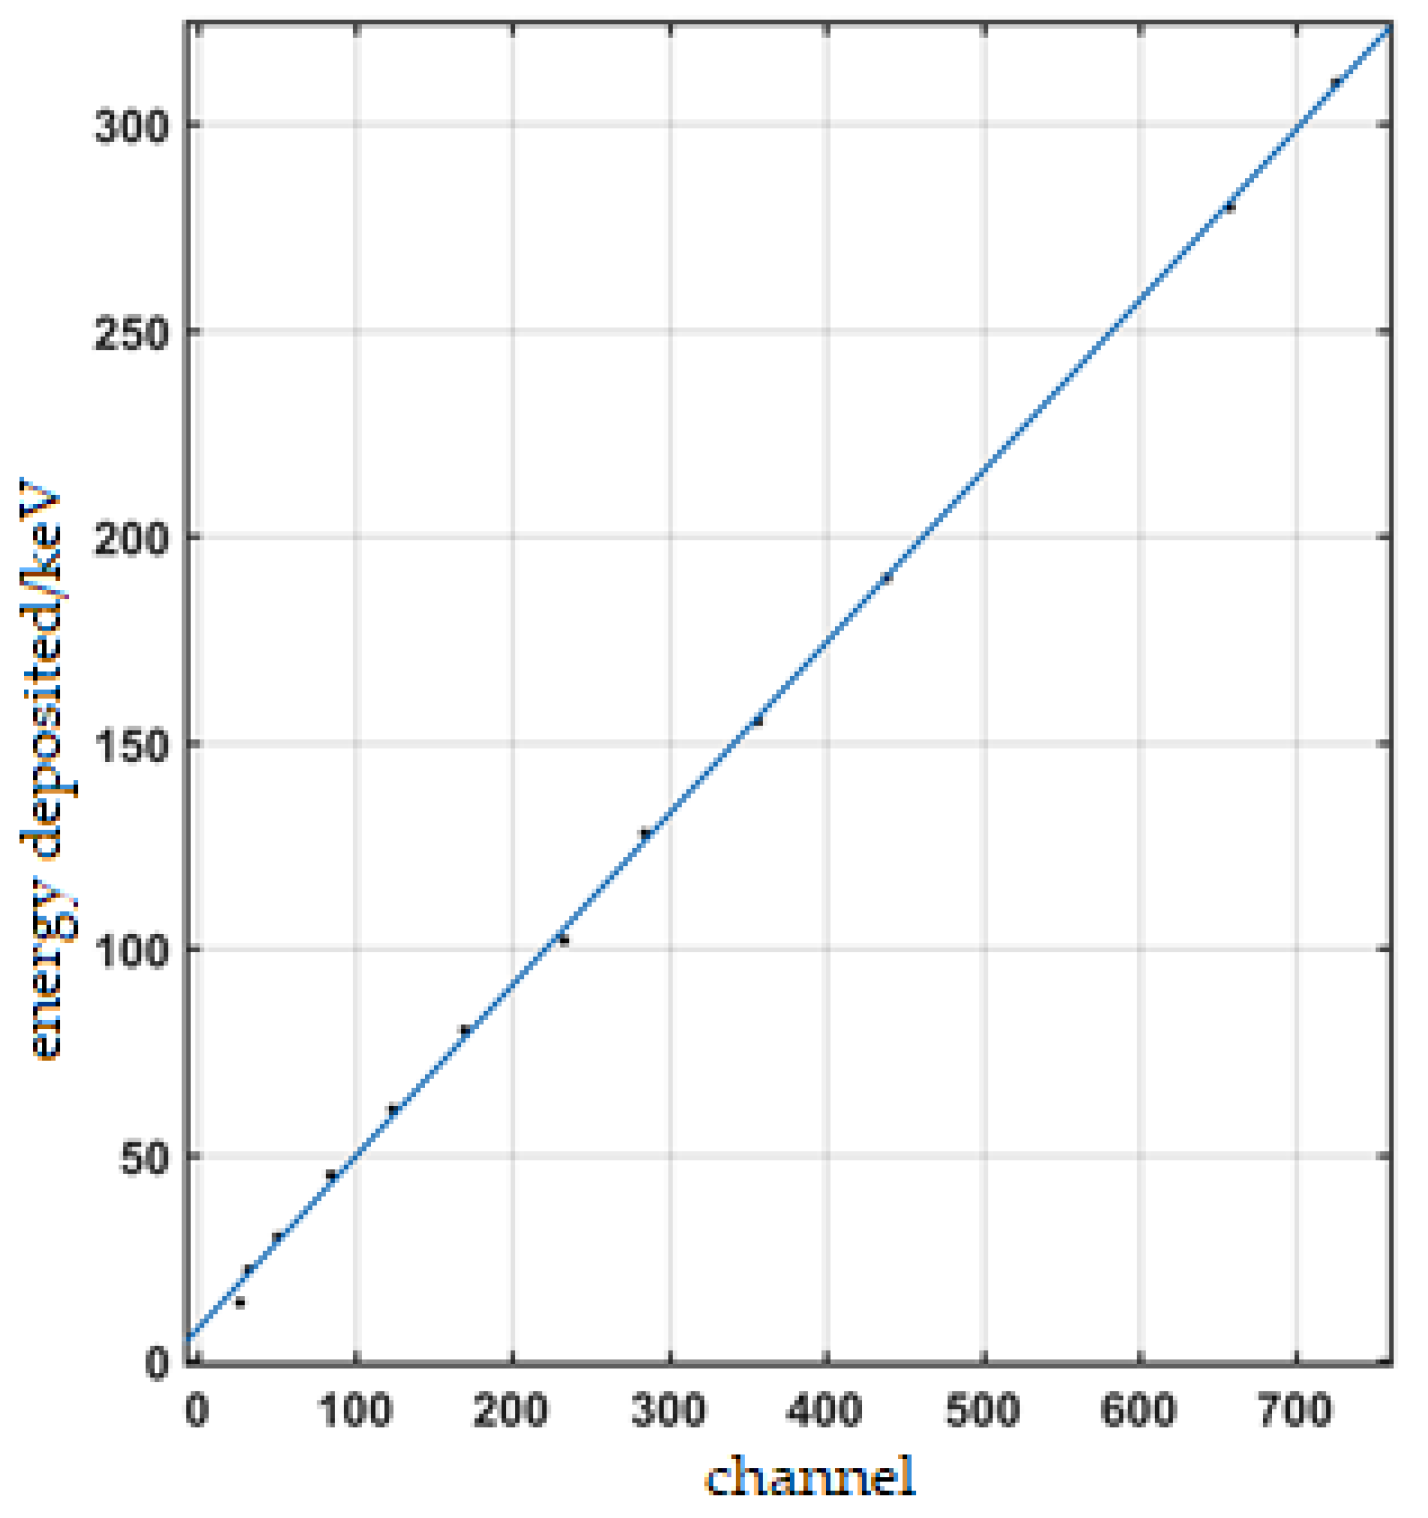
According to the testing data of the Gaussian peak position corresponding to the deposited energy in
Table 5, the energy linearity is obtained by linear fitting these peak positions, as shown in
Figure 17.
The linear formula obtained by the fitting is y = 0.4156x + 7.806, where y is the energy loss in keV, and x is the channel position in the multi-channels. According to the fitting formula, the linearity in this direction is calculated to be 95.06%.
It should be noted that, in
Table 5, the energy resolution looks very high, even more than 100% when the energy deposition is low. The main reason for this is the energy loss of protons when passing through the dead layer (the aluminized layer and the ion implanted layer) is quite different, so the residual energy broadening is relatively large at a lower energy, which can be seen from
Figure 5.
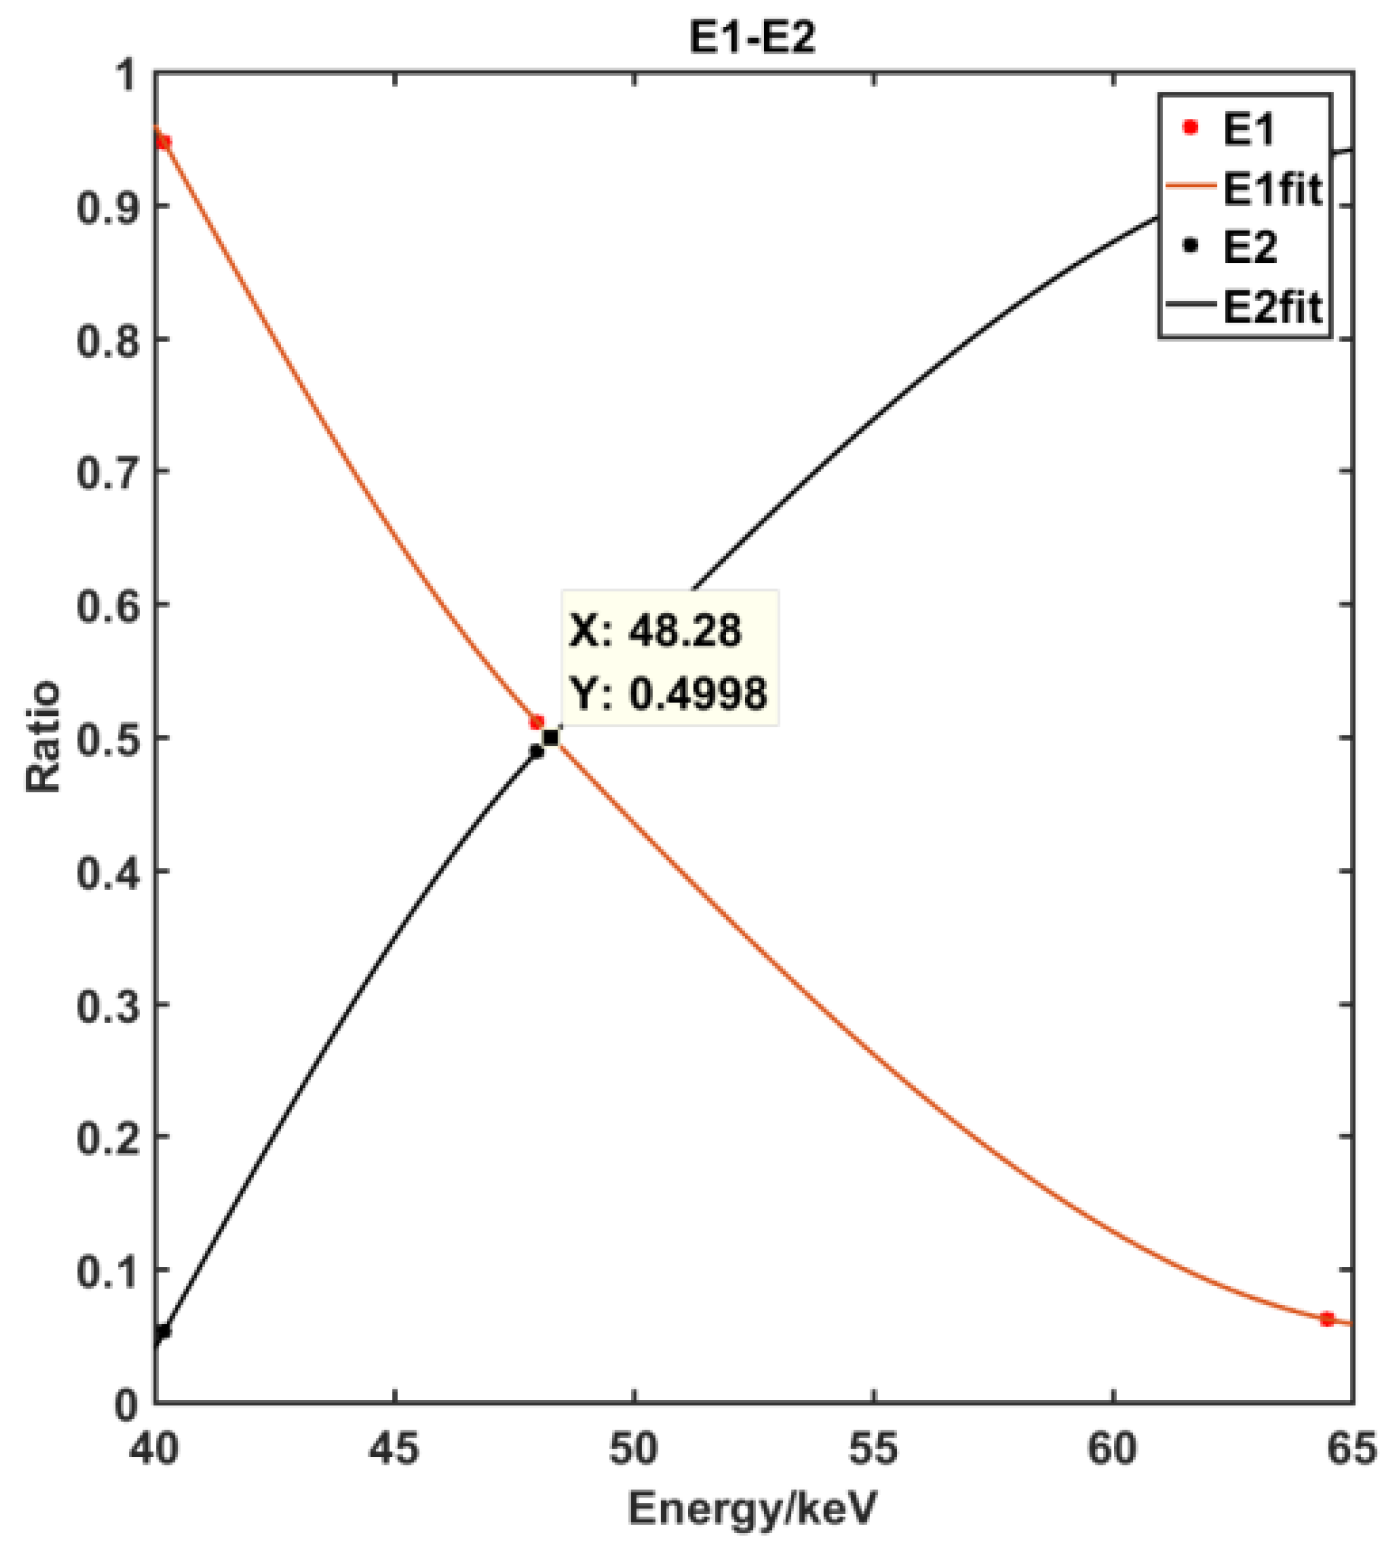
4.2.2. Energy Channel Division
The actual demarcation points of energy channels are determined by the count change between two adjacent energy channels. Normalizing the counts of the two energy channels to obtain the proportion of counts in each energy channel, the central intersection point can be found according to the changing trend of the counting ratio, as shown in
Figure 18.
The actual obtained boundary values are shown in
Table 6. The error range of energy channels division is calculated by Equation (3):
In the formula, Ca is the actual energy boundary position, Cd is the designed energy boundary position, and is the error range.
5. Conclusions
This work focused on the design and development of the MEPD onboard the FY-3E satellite. The sensor system (including the logical working mode, collimator, and deflection magnets), electronics system, and calibration were mainly discussed. The working mode of sensors combined with the deflecting magnets can eliminate the contamination by electrons effectively and the ultra-thin aluminum coating on sensors makes it insensitive to sunlight. The EMC design significantly improved the signal-to-noise ratio and greatly enhanced anti-electromagnetic interference ability, which ensured the realization of the lower detection limit of 30 KeV. The testing and calibration results showed that the detector could meet the established requirements for scientific indicators, providing a basis for the on-orbit data processing of the MEPD.


 ,
, 


