
Analyzing the Effect of Dynamic Pressure Drop on Corona Discharges for Aircraft Applications

Electrical Engineering Department, Universitat Politècnica de Catalunya, 08222 Terrassa, Spain
*
Author to whom correspondence should be addressed.
Aerospace 2023, 10(3), 320; https://doi.org/10.3390/aerospace10030320
Submission received: 29 January 2023
/
Revised: 13 March 2023
/
Accepted: 20 March 2023
/
Published: 22 March 2023
Abstract
:The combination of the low-pressure environment found in aircraft systems and the gradual electrification of aircraft increases the risk of electrical discharges occurrence. This is an undesirable situation that compromises aircraft safety and complicates maintenance operations. Experimental data are needed to understand this problem. However, most of the published studies are based on static pressure conditions, but aircraft systems are exposed to dynamic pressure conditions, especially during the climb and descent phases of flight. This paper analyzes the effect of dynamic pressure during the climb phase on the corona inception voltage because this phase experiences the worst pressure drop rate. The experimental evidence presented in this paper shows that within the analyzed pressure drop rate range, the dynamic pressure conditions do not have a significant effect on the corona inception value under typical conditions found in aircraft systems during the climb phase.
1. Introduction
It is a recognized fact that aviation is one of the fastest growing sources of greenhouse gas emissions. According to a recent study published by the Environmental Protection Agency [1], greenhouse gas (GHG) emissions from transportation accounted for 27.2 percent of U.S. GHG emissions in 2020, while GHG emissions from aviation accounted for 7.5 percent of GHG emissions from transportation. Similar trends are occurring in Europe, where despite improvements in aircraft fuel efficiency in recent years, in the EU in 2017, direct emissions from aviation accounted for 3.8 percent of total CO2 emissions, which represented 13.9 percent of transportation emissions [2]. Stringent international regulations related to the reduction in GHG emissions are leading to the increasing electrification of aircraft, resulting in new technologies such as the More Electric Aircraft (MEA) and the All Electric Aircraft (AEA), where the increased electrical power requirements force the aircraft to operate at higher voltage levels due to weight constraints [3,4,5]. While the main idea of MEA aircraft is to replace pneumatic and hydraulic systems with electromagnetic actuators [6], AEA aircraft will be electrically propelled.
The combined effect of increased electrical stress due to high-voltage levels, high compaction factors typical of aircraft systems, and reduced pressure at cruising altitude greatly increases the risk of electrical discharges in aircraft electrical and electronic systems. A critical factor to consider is the wide pressure range that aircraft must withstand, and in particular the low-pressure environment that facilitates the ignition of electrical discharges, which is consistent with Paschen’s Law [7]. Environmental conditions are known to be a determining factor in the premature aging of aircraft wiring systems, while discharge monitoring and health assessment are challenging tasks [8].
The effects of the discharges are a premature degradation of the insulation systems [9], thus facilitating the occurrence of surface discharges, arc tracking, arcing, and arcs [10]. These types of discharges, in their early stages, often manifest as corona in gaseous insulation systems and partial discharges (PDs) in liquid and solid insulation materials [11].
The dielectric strength of air decreases gradually with pressure [12,13]. This effect is very important at flight altitudes characteristic of commercial aircraft. Therefore, lower voltage levels are required to initiate corona discharges at cruising altitude compared to sea level. This effect is due to the reduced air density [14,15], since charged particles have a higher mobility at reduced air density, allowing for more effective collisions. Under low air pressure, the electrons released by the discharge process ionize neutral molecules more efficiently because they can accelerate more and gain more kinetic energy due to a combination of higher mobility and an increased mean free path due to the reduced air density [16]. The discharge process also releases photons resulting from excited electrons transitioning from a high-energy to a low-energy state. Since the main constituent of atmospheric air is nitrogen (78 vol%), the optical radiation spectrum of electrical discharges in air is governed by the energy level transitions of the nitrogen molecules [17,18]. Since each transition has a characteristic energy change, the emission spectrum is formed by the contribution of photons generated in the different transitions, resulting in a continuum spectrum [19].
Corona discharges are known to produce radiation in the near-UV region and in the high-energy region of the visible spectrum [17,18,19,20]. According to [21], the normalized emission spectra of corona discharges under AC and positive and negative DC supply show a great similarity, regardless of the amplitude of the applied voltage.
This paper uses published data from existing aircraft to analyze the effects of dynamic pressure conditions during the climb phase. The climb phase is analyzed since it represents the worst situation due to the pressure (and air density) drop with the increase of altitude. In order to analyze representative conditions, data from commercial and military aircrafts are needed. Table 1 shows the pressure drop rate (PDR) for different aircraft models at an altitude of 4000 m (13,123 ft) [22] and a temperature of −10 °C, which corresponds to a pressure of about 62 kPa and an air density of about 0.82 kg/m3 [23].
The altitude of 4000 m corresponds to the initial climb phase of commercial and military aircraft, so the data presented in Table 1 cover a wide spectrum of pressure drop rates of existing aircrafts. The altitude of 4000 m is studied in this paper because it corresponds to the fastest pressure drop during the climb phase. Therefore, if there is an effect of the pressure drop rate on the corona inception voltage, this effect should be detected during this phase. Furthermore, the pressure at 4000 m is high enough to have a good experimental resolution and also to avoid the occurrence of sudden arcs.
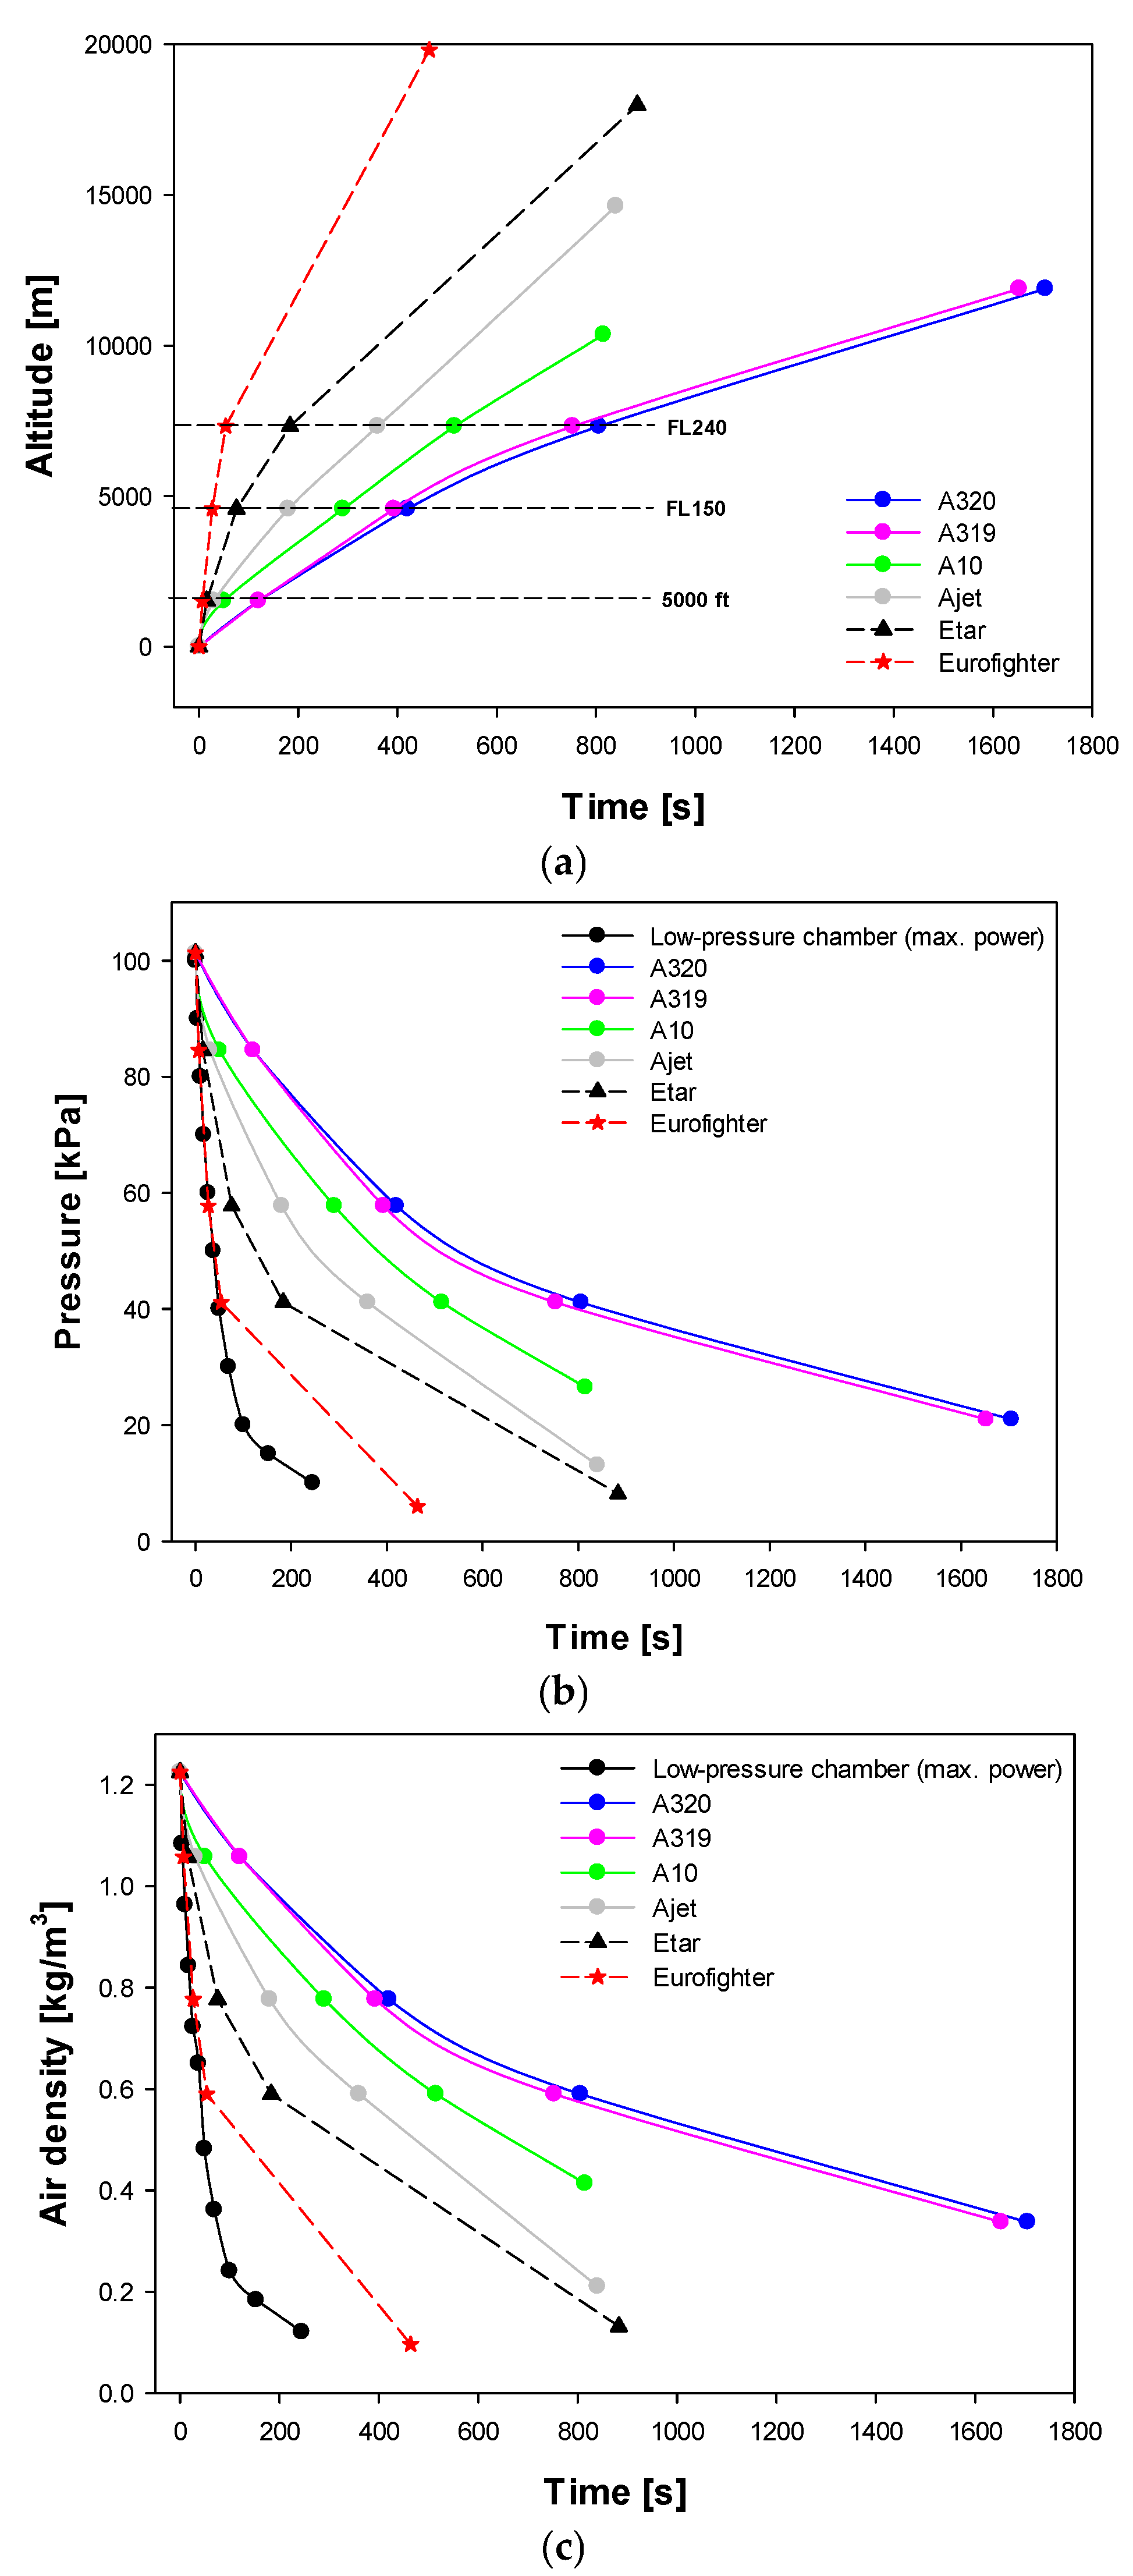
Figure 1a shows the altitude versus time during a typical climb for several aircraft models using data from [22]. Next, the altitude is transformed into pressure from the ISO 2533 standard atmosphere [24] to obtain the data presented in Figure 1b, which shows the evolution of the dynamic pressure versus time during the climb. Finally, the pressure is converted to air density according to (1), resulting in the data shown in Figure 1c. Figure 1 also shows the dynamic behavior of a low-pressure chamber used in the experiments to simulate pressure conditions in aircraft systems. Details of this chamber are given in Section 2.
The experimental tests carried out in this paper are based on three types of voltages, i.e., 400 Hz alternating current (AC), positive direct current (DC), and negative direct current (DC). These three voltage types have been selected because electric circuits of modern aircrafts use AC (mostly 400 Hz) and DC.
Li et al. [7] investigated the discharge behavior in a sphere-plate electrode configuration with a polymer thin film deposited on the grounded plate electrode and in contact with the sphere top electrode. The tests were performed under dynamic pressure conditions by decreasing the pressure from 100 kPa to 20 kPa under constant and positive DC voltage supply. By analyzing various parameters of the partial discharges, the authors attributed the increase in the magnitude of the partial discharges to the rate of pressure drop, but not to the pressure level itself. Similar conclusions were made in [8]. However, to the best of the authors’ knowledge, there are no studies focusing on the analysis of the role of dynamic pressure conditions on the initiation of corona discharges. This paper tries to fill this gap by analyzing the effect of the rate of climb (RoC) on the inception of corona discharges in air during the climb stage, which is an important stage in the flight of the aircraft [25]. During the climb phase, the atmospheric pressure decreases due to the increase in height, and the air density decreases as well. Therefore, the reduced pressure (and air density) favors the occurrence of electrical discharges. This work tries to find out if there is any influence of the additional stress due to variable pressure conditions, which could be added to the stress due to the reduced pressure typical of aircraft flight. This study considers the ascent rather than the descent phase since the former represents the worst condition due to the effect of depressurization. The effect of dynamic pressure conditions has hardly been analyzed in the literature because most of the works focus on either standard or constant atmospheric pressure conditions. This work tries to clarify the effect of the dynamic pressure conditions, if any, since in case of noticeable effects due to the rate of climb, they must be considered in the new designs.
2. Experimental Setup
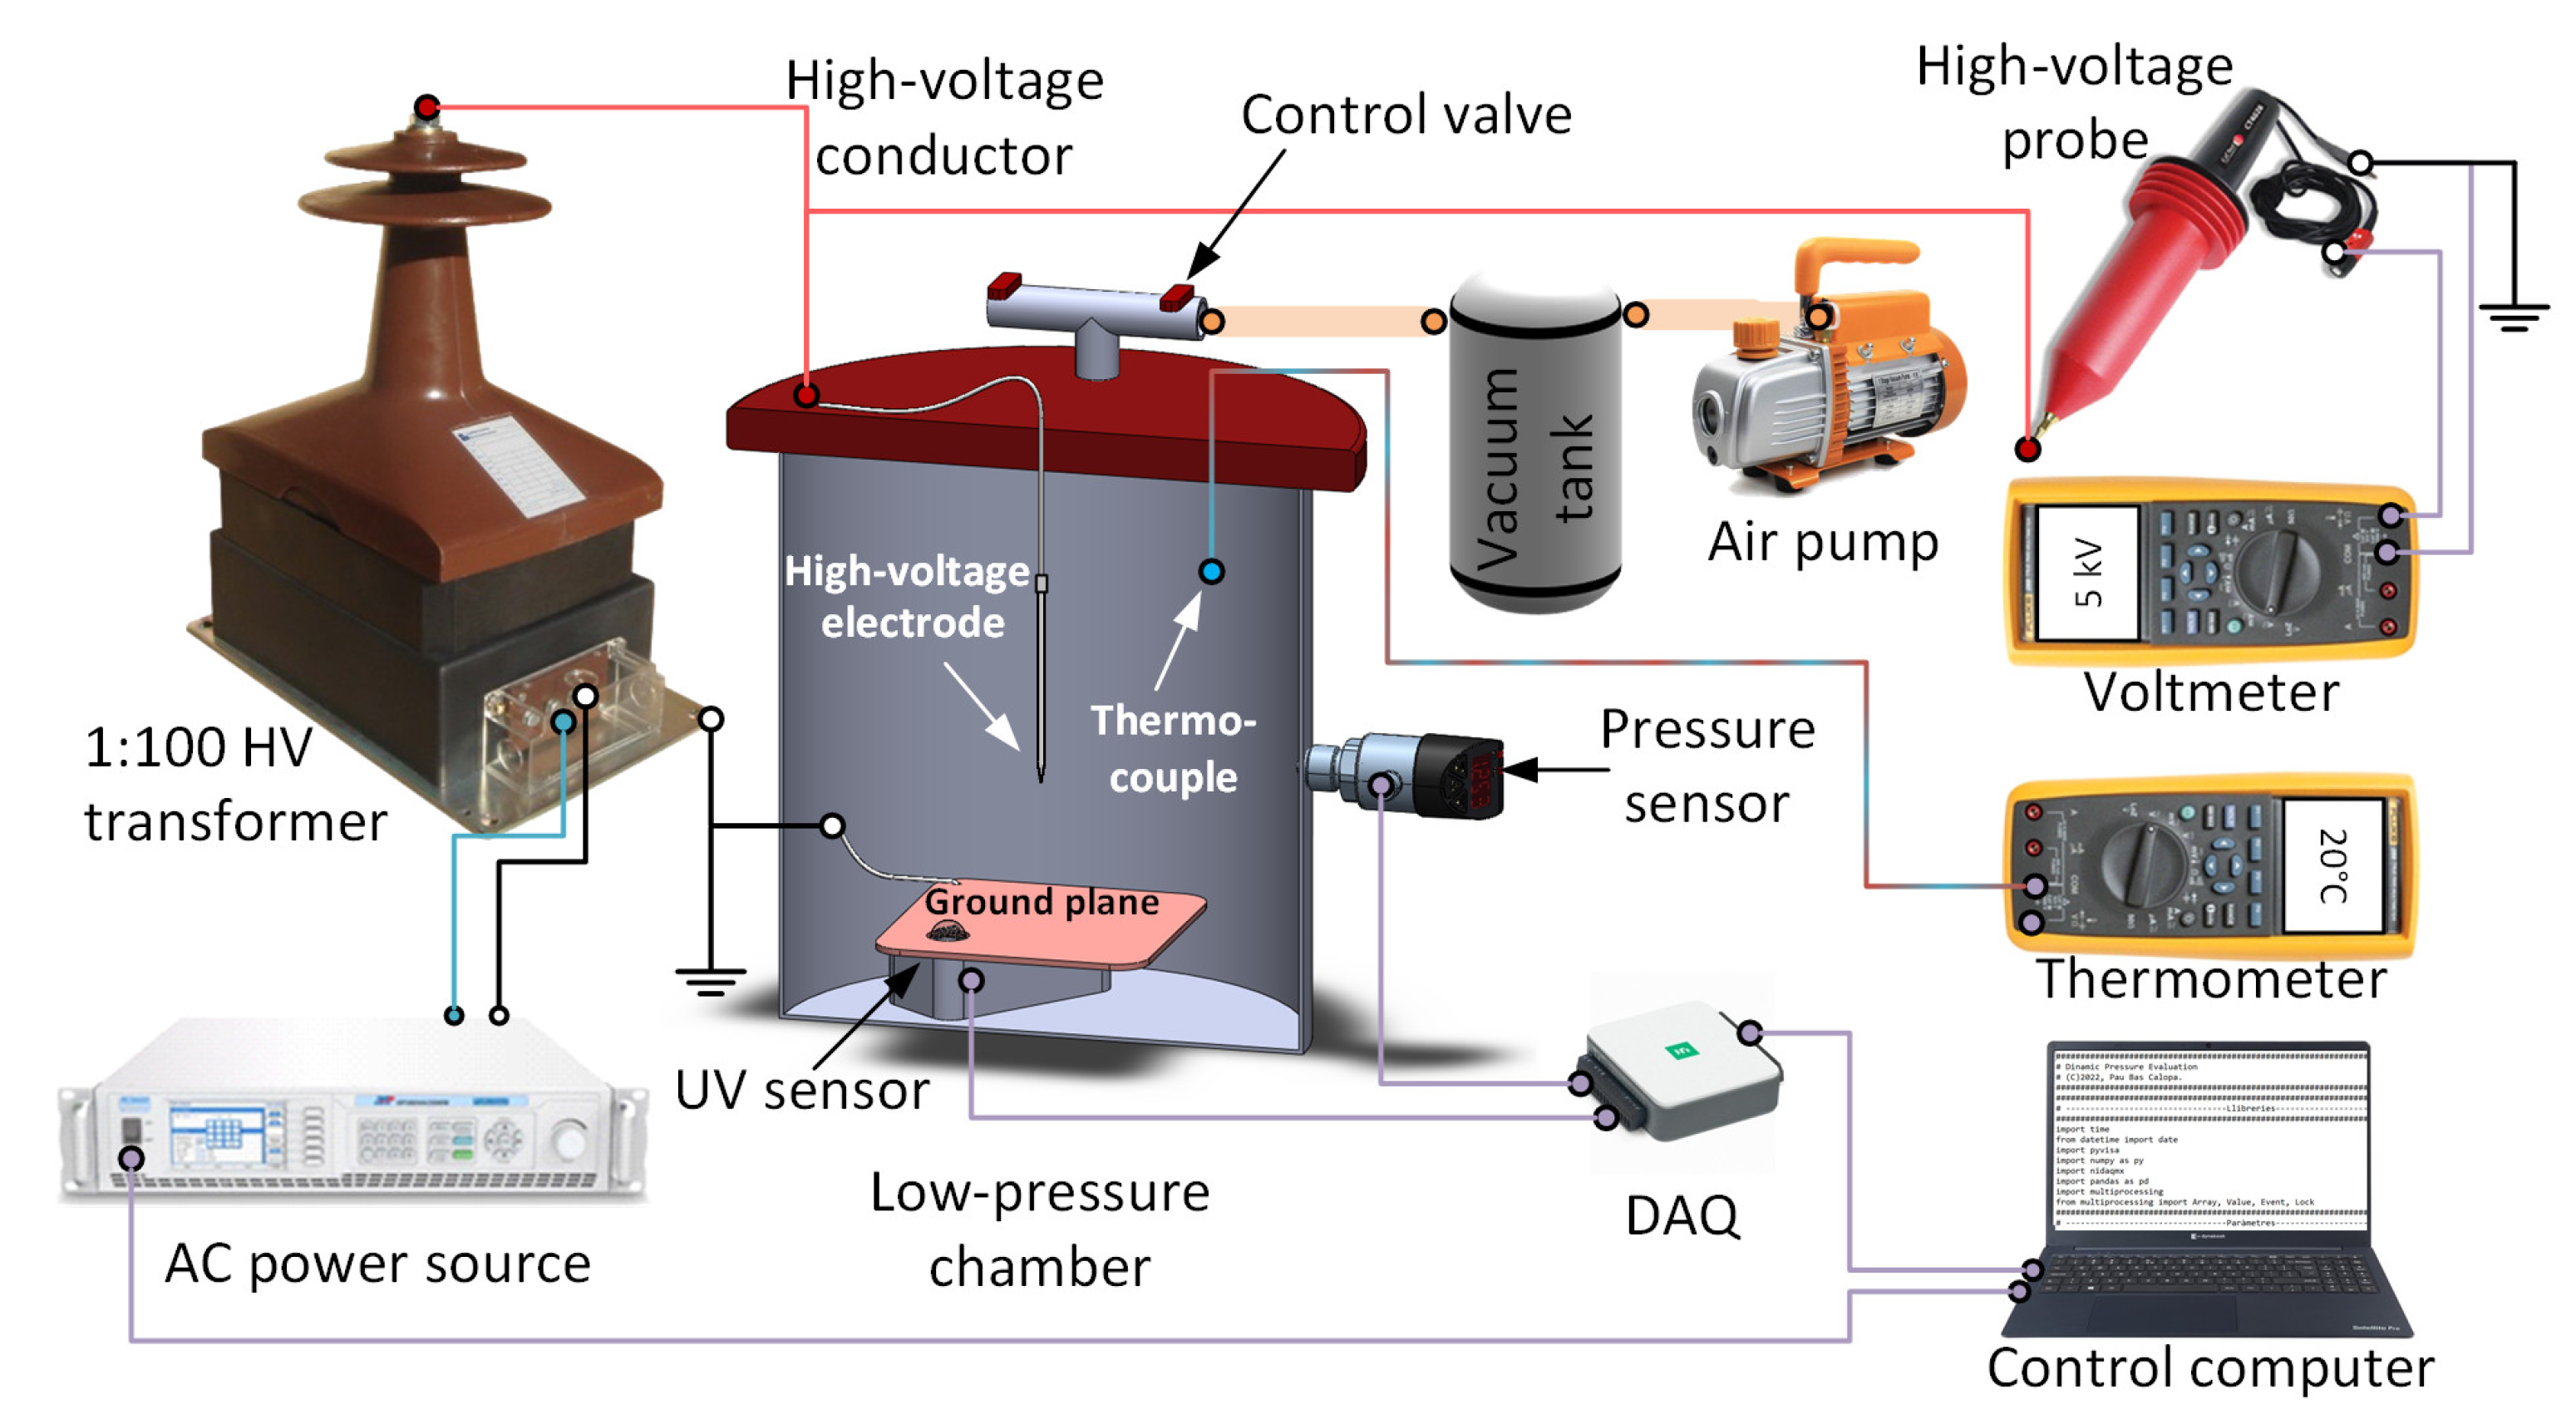
The applied voltage and supply frequency were controlled by a programmable AC power source SP300VAC600W (600 W, 0–300 V, ±0.1 V, 15–1000 Hz, APM Technologies, Dongguan, China). A VKPE-36 high-voltage transformer (single-phase, 600 VA, turns ratio 1:100, maximum voltage 36 kV, Laboratorio Electrotécnico, Cornellà de Llobregat, Spain) was connected to the output terminals of the AC source to step up the voltage and supply the electrode. During the DC tests, the output terminals of the high-voltage transformer were connected to a rectifier consisting of two 2CL2FP diodes (30 kV, 100 mA, 100 ns) connected in series and a high-voltage film capacitor (HVSHP 40 nF, 20 kV) connected in parallel with the needle-plane gap (load). The high voltage was measured with a CT4028 high-voltage probe (0–39 kV, ≤3%, 1000:1, DC to 220 MHz, Cal Test Electronics, Yorba Linda, CA, USA) connected to a Fluke 289 true-RMS multimeter (Fluke, 0.025% DC volts, 0.4% AC volts, Everett, Washington, WA, USA).
In order to reduce the pressure and simulate the environmental conditions of the aircraft during the climb phase, tests were carried out inside a low-pressure chamber. It consists of a cylindrical tube (aluminum, diameter = 250 mm, height = 500 mm, wall thickness = 6 mm) sealed with a methacrylate lid. The pressure was manually regulated by means of a control valve connected to a 90 L steel tank in which a vacuum was constantly maintained by means of a BA-1 vacuum pump (1/4 HP, 0.085 /min, Bacoeng, Suzhou, China). The pressure level was measured with a PSD-4 digital sensor (−1–0 bar, ±0.5%, Wika, Sabadell, Barcelona). In order to avoid any influence on the pressure measurements due to the pressure disturbance caused by the air flow in the pressure sensor, it was placed far enough away from the outlet hole of the lid. The temperature of the gas inside the chamber was measured using a very low inertia T-type thermocouple connected to a Fluke 289 true-RMS multimeter (Fluke, Everett, Washington, WA, USA) configured in thermometer mode.
Corona discharges were detected using a head-on UVtron sensor (R9533, Hamamatsu Photonics, Hamamatsu City, Japan). This sensor was selected because of its proven ability to detect corona discharges in low-pressure environments [26,27,28], its high sensitivity, its wide field of view, and its immunity to electromagnetic noise and to sporadic discharges since it detects the ultraviolet light emitted by the corona discharges. The UVtron sensor was driven by a C10807 driver (Hamamatsu Photonics, Hamamatsu City, Japan), which allows the sensor to operate safely while minimizing the probability of false detections due to the built-in signal processing circuitry. The sensor was placed inside the low-pressure chamber facing the electrode and connected to an external computer via a USB-6000 DAQ device (1 kS/s, 12 bits, ≤±26 mV, National Instruments, Austin, TX, USA). The computer simultaneously ran a Python script to process the signal and determine if corona activity was present.
Figure 2 shows the experimental setup and the instrumentation used in the experimental part.
Corona discharges were generated using two needle-plane electrode configurations. Electrode #1 consists of a stainless steel needle 13 cm long, 2.4 mm in diameter, and a conical tip of 0.2 mm radius and 40° angle, as described in Figure 3b. The tip of Electrode #1 was placed 80 mm above a grounded copper plate. Electrode #2 consists of a stainless steel needle 13 cm long, 1.3 mm in diameter, and a hollow tip of 0.03 mm radius of 0.03 mm and 50° angle, as described in Figure 3c. The tip of Electrode #2 was placed 40 mm above a grounded copper plate. The use of these two different electrodes provides two levels of corona inception voltages, thus allowing a greater generalization of the results.
3. Experimental Method
This section describes the procedure for experimentally determining the air density at which the corona is induced at the tip of the needle electrode as the pressure decreases at a rate that simulates the climb phase of an airplane while a high value of constant voltage is applied to the electrode.
3.1. Experimental Process
To determine if the pressure drop rate influences the corona inception voltage, two types of tests were proposed, that is, tests under dynamic and static pressure conditions.
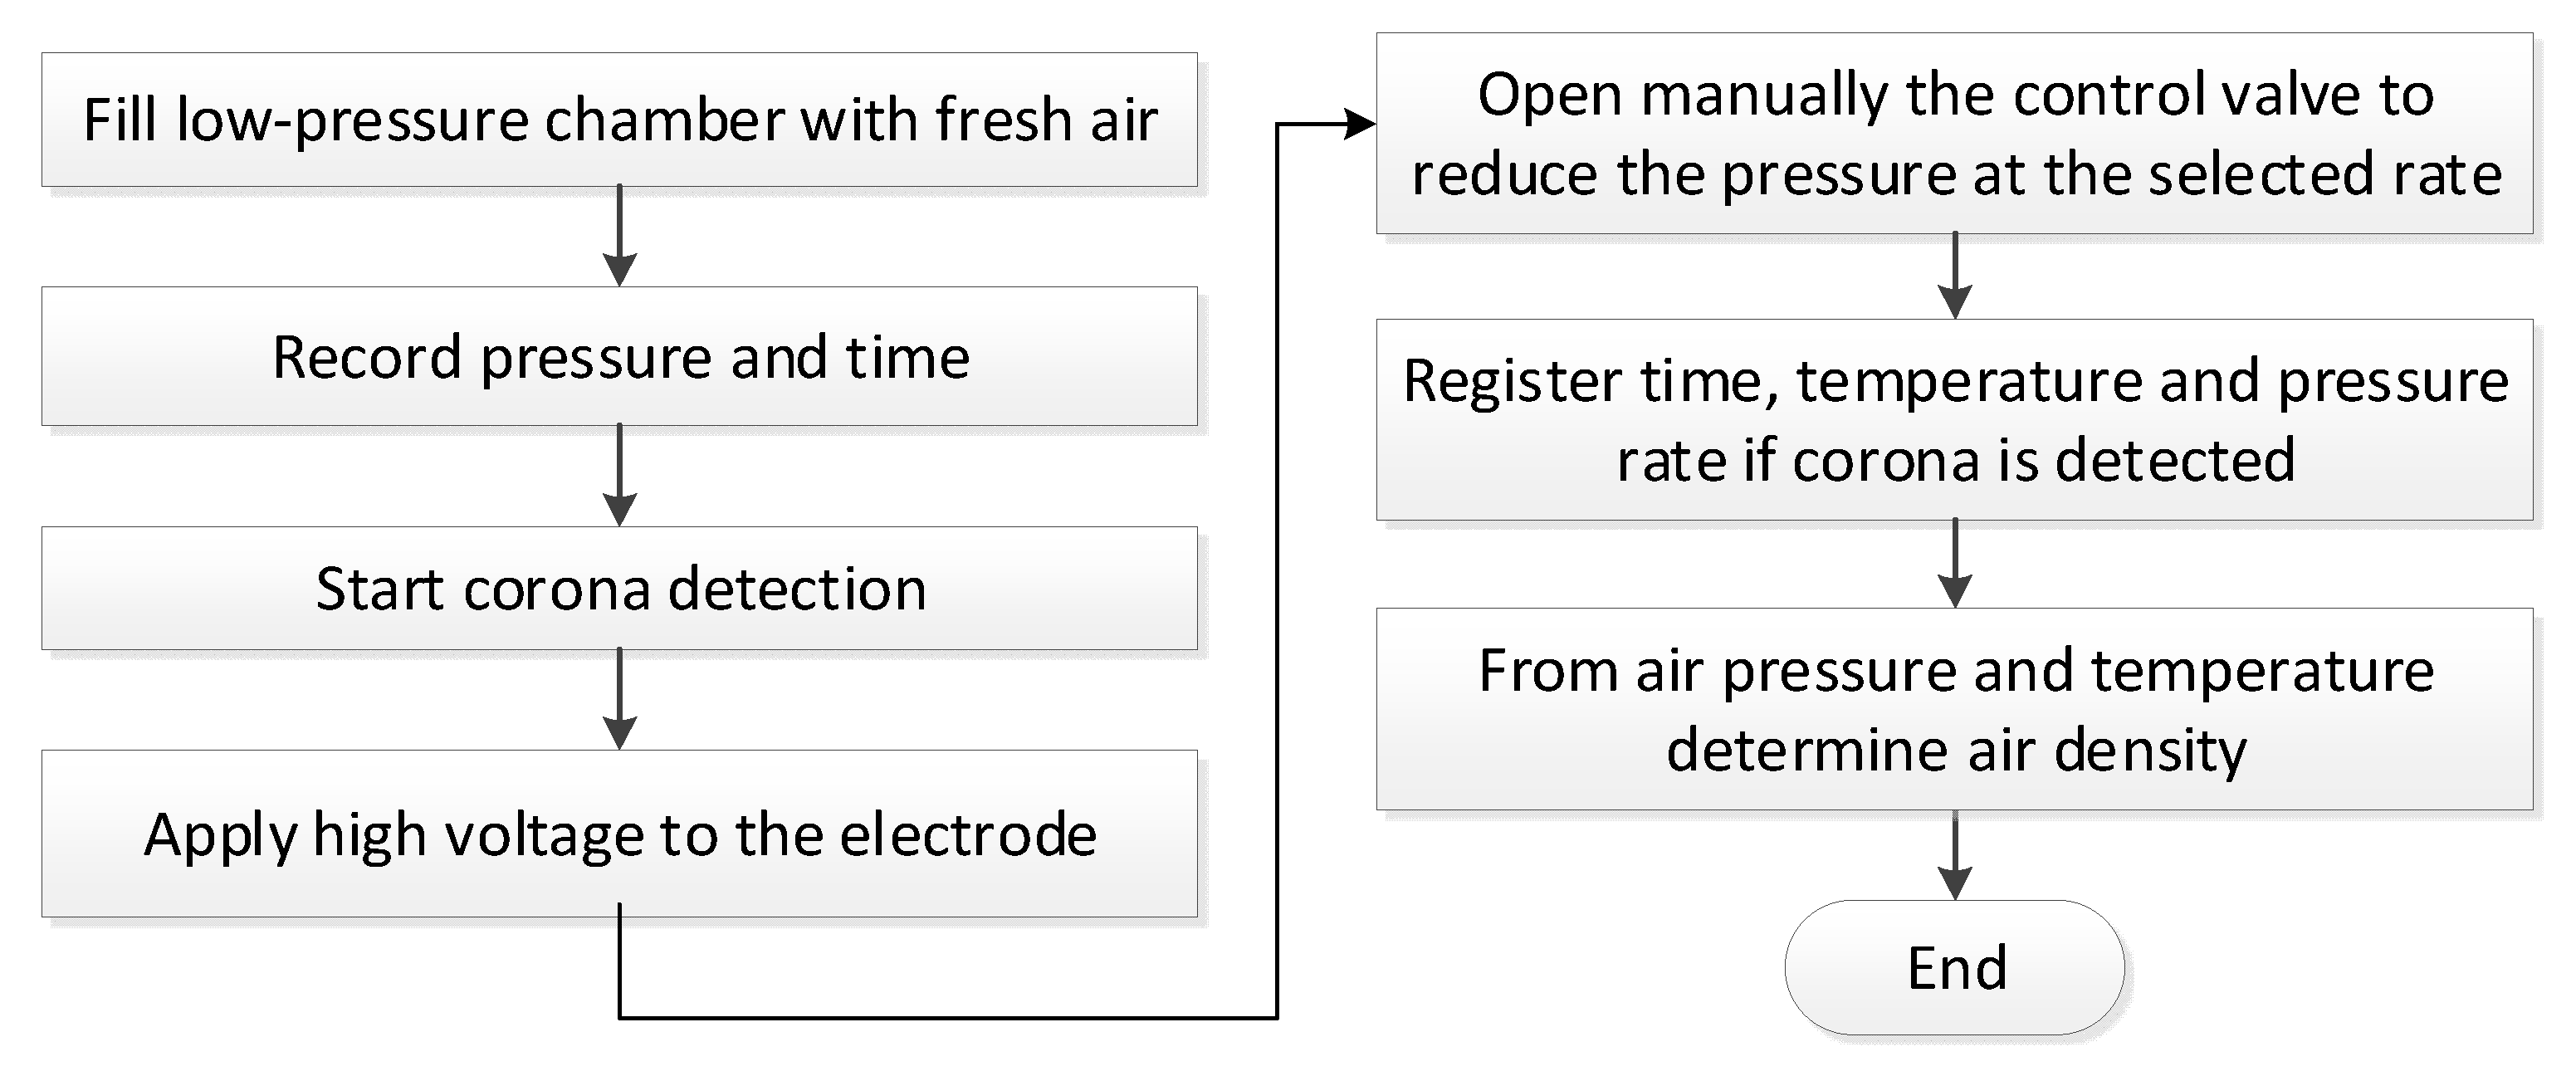
Figure 4 summarizes the process used in the laboratory to determine the pressure at which the corona is first detected under dynamic pressure conditions.
During the experiments, the needle electrode was connected to the high-voltage terminal of the power supply. Before starting each experiment, the pressure chamber was filled with fresh air to avoid contamination from previous experiments. Next, the valve connecting the chamber to the vacuum tank was manually opened to allow the pressure in the low-pressure chamber to drop at a selected rate. The rate of air density drop was determined from the experimental measurements of time, pressure, and temperature using a Python script. Finally, when the pressure was low enough, corona activity was detected by the UVtron sensor. The Python code evaluated the possible presence of a corona at one-second intervals. Each test was repeated ten times to minimize experimental error.
The pressure was changed at four pressure drop rates to simulate the pressure decline of different aircraft models during the initial climb phase. The results obtained were compared with tests performed under static pressure conditions to verify whether the pressure change affected the corona inception voltage. The experiments were repeated for different high-voltage waveforms, i.e., 400 Hz sinusoidal AC, negative DC and positive DC.
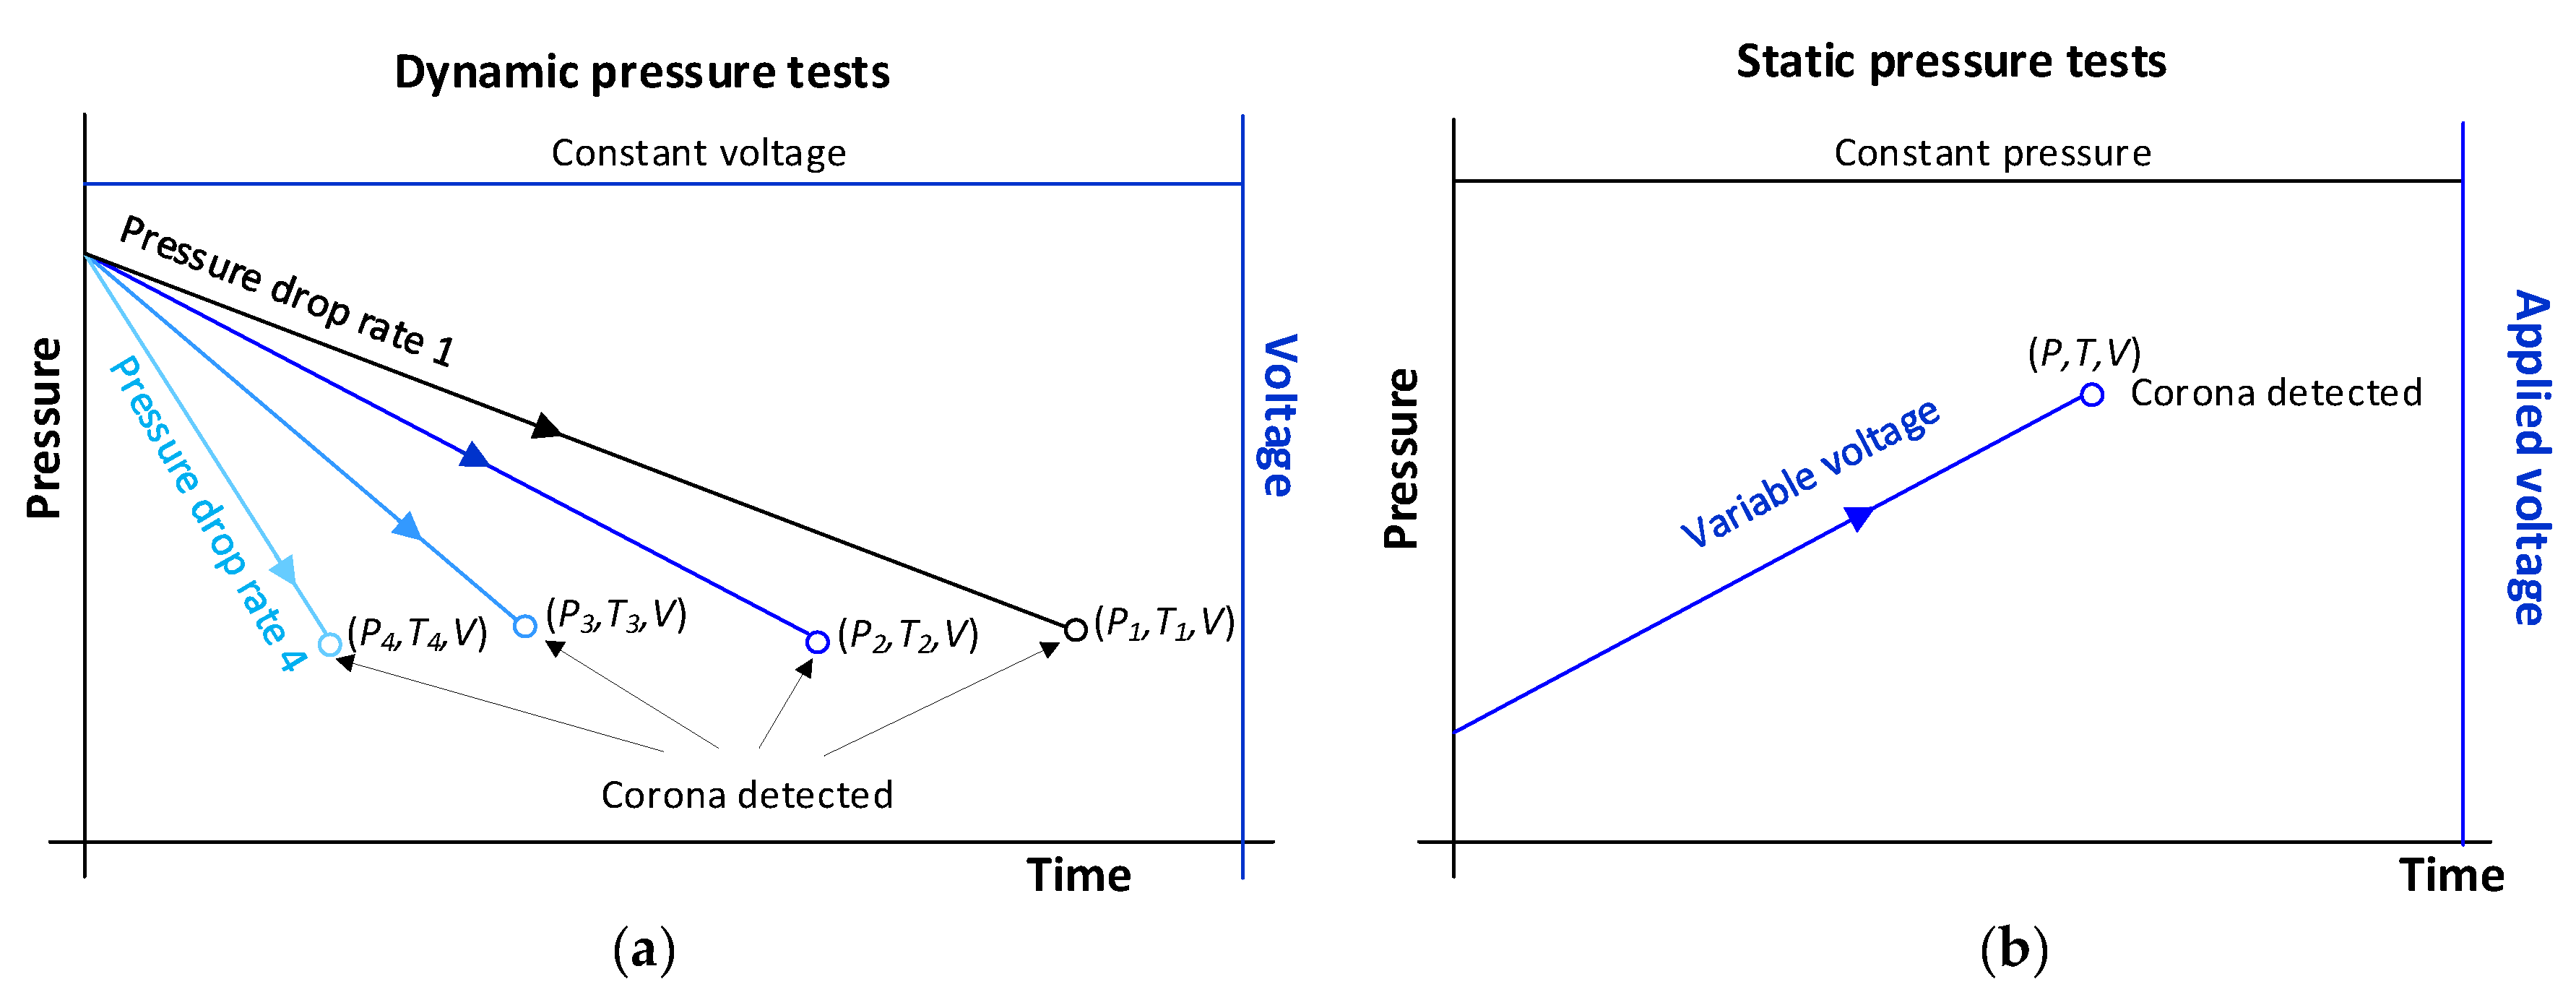
During the dynamic pressure experiments, the amplitude of the applied voltage was kept constant, and the pressure was reduced at various pressure drop rates until corona discharges occurred, as shown in Figure 5a.
To determine if the dynamic pressure conditions have a measurable effect on the corona inception voltage, tests were also performed under constant pressure conditions, applying an increasing voltage amplitude with time until corona appearance, as shown in Figure 5b. If pressure drop has no measurable effect on corona inception voltage (CIV) at a given air density, the CIV value should be the same under static and dynamic pressure conditions.
3.2. Relationship between Pressure and Air Density
As discussed in the Introduction section, air density plays a key role in the inception of corona discharges. According to the standard atmosphere [24], the air density ρair [kg·m−3] can be obtained from the ideal gas law in molar form as
where p [Pa] is the pressure of air, T [K] is the absolute temperature, Rspecific = R/M = 287.0528 J⋅(kg·K)−1 is the specific gas constant for dry air, where M = 28.9644 kg·kmol−1 is the molar mass of air at sea level, and R = 8314.32 J⋅(kg·kmol)−1 is the universal constant of gases.
According to (1), the density of air decreases linearly with pressure at constant temperature. Equation (1) also explains that the density of air decreases at elevated temperatures, thus reducing the inception voltage of electrical discharges [26]. Note that (1) is compatible with the formula given in various international standards, such as the IEEE Standard for High-Voltage Testing Techniques [27]:
where ρair,0 is the density of air under normal conditions, i.e., P0 = 101.3 kPa and T0 = 293.15 K. Both Equations (1) and (2) assume that air is as an ideal gas.
4. Experimental Results
This section presents and discusses the experimental results obtained in the low-pressure chamber at four pressure drop rates covering the pressure drop rates during the climb phase of a wide range of aircraft models (see Table 1). Tests were also performed at variable voltage amplitude and constant pressure conditions using Electrode #1 (distance electrode to ground plane of 80 mm) and Electrode #2 (distance electrode to ground plane of 40 mm). The tests were performed under three types of voltages, i.e., 400 Hz sinusoidal AC, negative DC, and positive DC.
4.1. Uncertainty Calculation
As explained, this paper performs tests under dynamic and static pressure conditions to determine the effect of the pressure drop rate on corona inception voltage. The experimental uncertainties associated with each test are explained in the following subsections.
4.1.1. Dynamic Pressure Tests
Dynamic pressure tests are performed at constant voltage and variable pressure. The major sources of uncertainty in the determination of air density are due to the propagation of the instrumental uncertainty Δρa,instruments, the time delay during the corona detection Δρa,delay, and the standard deviation inherent in the corona inception phenomenon Δρa,2σ.
The air density is determined from the measurement of the pressure and temperature of atmospheric air. This process introduces an experimental uncertainty Δρa,instruments that can be calculated from (1) as
where Δρ = ±506.5 Pa is the uncertainty of the PSD-4 digital pressure sensor, and ΔT = ±1 °C is the uncertainty of the temperature measurement made with a T-type thermocouple connected to a Fluke 289 multimeter. Substituting these parameters in (3), at 70 kPa and 20 °C (the experimental conditions at which the measurements are made), it yields Δρa,instruments = ±0.0066 kg/m3, which is approximately ±0.8% of the air density at 70 kPa and 20 °C.
The uncertainty due to the time delay during the corona detection Δρa,delay, is due to the response time of the UVtron sensor, which was programmed with a sampling period of 1 s between successive samples. This uncertainty depends directly on the air density drop rate, so that higher drop rates correspond to higher uncertainties.
where is the density of air, tdetection is the time instant at which corona is detected, and tdelay = 1 s is the time delay between successive samples. Note that Δρa,delay changes with each test due to the different pressure and air density drop rates.
Corona is a complex phenomenon, in which ionization depends on internal and external factors, so under the same experimental conditions the inception of corona does not always occur at the same point. To evaluate this uncertainty, each experimental condition was repeated 10 times and the standard deviation was obtained. Therefore, the uncertainty introduced by the corona inception at the 95% confidence level can be calculated as follows,
where σρa,corona is the standard deviation of the air density at the corona inception conditions.
Finally, the combined air density uncertainty can be calculated as
4.1.2. Static Pressure Tests
Static pressure tests are performed at constant pressure and variable voltage.
Voltage is measured with a CT4028 high-voltage probe connected to a Fluke 289 true-RMS multimeter. This combination has an uncertainty ΔVinstruments = ±3.02%.
During the static pressure test, the voltage is slowly increased in discrete steps of 20 V, where the uncertainty of the voltage steps is ΔVstep = ±10 V.
Finally, each experimental condition was repeated 10 times to obtain the standard deviation. Therefore, the uncertainty introduced by the inception of corona can be calculated at the 95% confidence level as
Finally, the combined uncertainty can be calculated as follows:
4.2. Results
Table 2 shows the average air density at which corona was first detected during the dynamic pressure experiments performed with the two analyzed electrodes. It also shows some statistics and the different sources of uncertainties. Note that the amplitude of the voltage was different in each test (400 Hz AC, negative DC and positive DC) because negative corona appears at a lower voltage than positive corona, and the corona inception voltage decreases as the frequency increases [28], which is the case with 400 Hz AC. It is noted that each experimental condition was repeated 10 times to obtain the mean and standard deviation and the total uncertainty of the air density at the inception of corona. As detailed in Section 4.1., the uncertainty due to the instruments is Δρa,instruments = ±0.8% at about 70 kPa and 20 °C, the experimental conditions during the tests presented in Table 2.
The use of the two electrode geometries allows tests to be performed at different voltage levels. As shown in Table 2, due to the sharpness of Electrode #2 and the proximity of the ground plane, the operating voltages of this electrode are almost half of those of Electrode #1.
The uncertainty of the air density calculated according to the method detailed in Section 4.1.1 depends on the specific experiment and is always between 1.1% and 5.5%, which shows the accuracy of the results presented in Table 2.
Results presented in Table 2 were performed at four different pressure drop rates (PDRn where n = 1, 2, 3, 4). These four levels of pressure were selected following the rule PDRn = PDRn−1 + n·0.1 [kPa/s], where PDRn [kPa/s] is the pressure drop rate corresponding to the n-th step which are –0.1 kPa/s, –0.3 kPa/s, –0.6 kPa/s, −1.0 kPa/s. Due to the manual regulation of the air flow, every test had a slightly different PDR than the previous one. Therefore, the four pressure levels consist of four PDR ranges, which include the conditions that different types of aircraft, from commercial jetliners (−0.06 kPa/s) to military fighters (−1.2 kPa/s), must withstand during the climb stage.
The results presented in Table 2 show that the air density averaged over 10 tests at which corona occurs remains almost constant regardless of the pressure drop rate at which the experiments are performed. The same comment applies to both analyzed electrodes. Note that the voltage amplitude remained a constant value throughout these tests. The results also show marginal differences in the pressure drop rate at which corona discharges first appeared between tests under 400 Hz AC, negative DC, and positive DC.
Table 3 shows the average voltage amplitude at which corona was first detected in the static pressure tests under increasing voltage conditions and some statistical indicators. The static pressure tests were performed at a constant air density of 0.83 kg/m3, which roughly corresponds to corresponds 70 kPa at 20 °C. This value of the air density is very similar to the ones shown in Table 2.
Comparing the results presented in Table 2 and Table 3, it can be seen that the corona inception voltage is almost the same in both tests, i.e., under different pressure drop rates (dynamic pressure test) and under constant pressure (static pressure tests).
The uncertainty of the air density calculated according to the method detailed in Section 4.1.2 depends on the specific experiment lies on range from 3.4% to 5.0%, which shows the accuracy of the results presented in Table 3.
For a better interpretation of the experimental results, the data summarized in Table 2 corresponding to the dynamic pressure tests are plotted in Figure 6. As explained, ten replicates of each experimental condition were performed. The minimum, mean, and maximum experimental values obtained in each experimental condition are plotted in Figure 6.
The results shown in Figure 6 for all the applied voltage types and the two analyzed electrodes indicate that the air density at which corona inception occurs is almost independent of the pressure drop rate. These results are compatible with those obtained in tests conducted under static pressure conditions. Regarding Electrode #1, the dynamic pressure results obtained with 400 Hz supply yielded a mean corona inception voltage of 3.08 kVRMS for air densities in the range from 0.82 to 0.87 kg/m3 (3.09 kVRMS at 0.83 kg/m3 for the static pressure tests). In the case of negative DC, the dynamic pressure results yielded a mean corona inception voltage of 4.73 kV for air densities in the range from 0.79 to 0.85 kg/m3 (4.86 kV at 0.83 kg/m3 for the static pressure tests). Finally, for positive DC, the dynamic pressure results yielded a mean corona inception voltage of 5.74 kV for air densities in the range from 0.80 to 0.89 kg/m3 (5.63 kV at 0.83 kg/m3 for the static pressure tests). The comparison between the dynamic tests and the static tests shows that corona inception occurs under very similar air density and voltage conditions, regardless of whether the tests are conducted under static or dynamic pressure conditions.
Regarding Electrode #2, the dynamic pressure results obtained with 400 Hz supply yielded a mean corona inception voltage of 1.54 kVRMS for air densities in the range from 0.80 to 0.85 kg/m3 (1.58 kVRMS at 0.83 kg/m3 for the static pressure tests). In the case of negative DC, the dynamic pressure results yielded a mean corona inception voltage of 2.56 kV for air densities in the range from 0.80 to 0.86 kg/m3 (2.54 kV at 0.83 kg/m3 for the static pressure tests). Finally, for positive DC, the dynamic pressure results yielded a mean corona inception voltage of 3.21 kV for air densities in the range from 0.83 to 0.87 kg/m3 (3.1 kV at 0.83 kg/m3 for the static pressure tests). Similarly, as in the case of Electrode #1, corona occurs under very similar air density and voltage conditions, regardless of whether the tests are conducted under static or dynamic pressure conditions.
All of the experimental evidence presented in this section leads to the conclusion that over the range of pressure drop rates analyzed, the corona inception voltage is almost invariant to the pressure drop rate. This means that the dynamic pressure conditions have very little or negligible effect on the corona inception value under typical conditions found in aircraft systems during the climb phase. Therefore, these results suggest that no additional measures are required to prevent electrical discharges in aircraft insulation systems during the climb and descent phases. However, it should be noted that the experimental results presented in this paper were obtained under simulated aircraft conditions using a low-pressure chamber, so further work performed under different temperature and humidity conditions could better support the results obtained in this paper.
5. Conclusions
The low-pressure environments characteristic of aeronautical applications trigger the inception of electrical discharges in electronic and electrical circuits located in unpressurized areas. The gradual electrification of modern aircraft also increases the risk of electrical discharges due to the ever-increasing voltage levels required. Due to the complexity of the phenomenology associated with electrical discharges, it is very difficult and inaccurate to perform simulation studies, so it is necessary to perform realistic experimental tests. Although more experimental studies are needed to better understand the effect of low-pressure conditions, most of them are based on static pressure conditions. However, aircraft systems are exposed to dynamic pressure conditions, especially during the climb and descent phases of flight.
The aim of this work was to determine if there is a relationship between the corona inception voltage and the pressure (air density) drop during the climb stage of aircraft. To this end, this paper has studied the range of pressure drop rates characteristic of the climb stage of different types of aircraft (including commercial jetliners and jet fighters, which have much higher acceleration and climb rates), as it corresponds to the highest pressure drop rate. Tests under variable and constant pressure conditions were performed to determine a possible influence of varying pressure conditions on the corona inception voltage. The experimental results presented in this paper show that within the range of pressure drop rates analyzed, which covers the current capabilities of commercial aircraft, the dynamic pressure conditions have no significant effect on the corona inception voltage during the climb phase of flight under typical aircraft conditions. Therefore, these results suggest that no additional measures are required to prevent electrical discharges in aircraft insulation systems during the climb and descent phases.
Author Contributions
Conceptualization, P.B.-C. and J.-R.R.; methodology, J.-R.R. and M.M.-E.; software, J.-R.R. and P.B.-C.; validation, P.B.-C., J.-R.R. and M.M.-E.; formal analysis, J.-R.R. and M.M.-E.; investigation, P.B.-C. and J.-R.R.; resources, J.-R.R. and M.M.-E.; writing—original draft preparation, P.B.-C. and J.-R.R.; writing—review and editing, P.B.-C. and J.-R.R. All authors have read and agreed to the published version of the manuscript.
Funding
This research was funded by Ministerio de Ciencia e Innovación de España, grant number PID2020-114240RB-I00 and by the Generalitat de Catalunya, grant number 2021 SGR 00392.
Institutional Review Board Statement
Not applicable.
Informed Consent Statement
Not applicable.
Data Availability Statement
Not applicable.
Conflicts of Interest
The authors declare no conflict of interest.
References
- EPA. Inventory of U.S. Greenhouse Gas Emissions and Sinks: 1990–2020; EPA: Washington, DC, USA, 2022.
- European Commission. Reducing Emissions from Aviation. 2023. Available online: https://climate.ec.europa.eu/eu-action/transport-emissions/reducing-emissions-aviation_en (accessed on 25 January 2023).
- Borghei, M.; Ghassemi, M. Insulation Materials and Systems for More- and All-Electric Aircraft: A Review Identifying Challenges and Future Research Needs. IEEE Trans. Transp. Electrif. 2021, 7, 1930–1953. [Google Scholar] [CrossRef]
- Riba, J.-R.; Gómez-Pau, Á.; Moreno-Eguilaz, M. Experimental Study of Visual Corona under Aeronautic Pressure Conditions Using Low-Cost Imaging Sensors. Sensors 2020, 20, 411. [Google Scholar] [CrossRef] [PubMed] [Green Version]
- Sumsurooah, S.; He, Y.; Torchio, M.; Kouramas, K.; Guida, B.; Cuomo, F.; Atkin, J.; Bozhko, S.; Renzetti, A.; Russo, A.; et al. ENIGMA—A Centralised Supervisory Controller for Enhanced Onboard Electrical Energy Management with Model in the Loop Demonstration. Energies 2021, 14, 5518. [Google Scholar] [CrossRef]
- Cavallo, A.; Canciello, G.; Russo, A. Buck-Boost Converter Control for Constant Power Loads in Aeronautical Applications. In Proceedings of the 2018 IEEE Conference on Decision and Control (CDC), Miami, FL, USA, 17–19 December 2018; pp. 6741–6747. [Google Scholar] [CrossRef]
- Li, C.; Shahsavarian, T.; Baferani, M.; Ronzello, J.; Cao, Y. Surface discharge behaviors of high temperature insulation subjected to gas pressure variations in hybrid propulsion systems. In Proceedings of the 2020 IEEE Conference on Electrical Insulation and Dielectric Phenomena (CEIDP), East Rutherford, NJ, USA, 18–30 October 2020; pp. 288–291. [Google Scholar] [CrossRef]
- Shahsavarian, T.; Li, C.; Baferani, M.; Cao, Y. Surface discharge studies of insulation materials in aviation power system under DC voltage. In Proceedings of the 2020 IEEE Conference on Electrical Insulation and Dielectric Phenomena (CEIDP), East Rutherford, NJ, USA, 18–30 October 2020; pp. 271–274. [Google Scholar] [CrossRef]
- Riba, J.-R.; Gómez-Pau, Á.; Moreno-Eguilaz, M.; Bogarra, S. Arc Tracking Control in Insulation Systems for Aeronautic Applications: Challenges, Opportunities, and Research Needs. Sensors 2020, 20, 1654. [Google Scholar] [CrossRef] [PubMed] [Green Version]
- FAA. Aircraft Electrical Wiring Interconnect System (EWIS) Best Practices; FAA: Washington, DC, USA, 2020.
- Shafiq, M.; Robles, G.; Kauhaniemi, K.; Stewart, B.; Lehtonen, M. Propagation Characteristics of Partial discharge Signals in Medium Voltage Branched Cable Joints using HFCT Sensor. In CIRED 2019 Conference; CIRED: Madrid, Spain, 2019; pp. 1–5. [Google Scholar] [CrossRef]
- Kuffel, J.; Zaengl, W.; Kuffel, P. High Voltage Engineering Fundamentals, 2nd ed.; Newnes: Oxford, UK, 2000; Available online: http://www.amazon.com/Voltage-Engineering-Fundamentals-Second-Edition/dp/0750636343 (accessed on 20 December 2015).
- Riba, J.-R.; Gomez-Pau, A.; Moreno-Eguilaz, M. Sensor Comparison for Corona Discharge Detection Under Low Pressure Conditions. IEEE Sens. J. 2020, 20, 11698–11706. [Google Scholar] [CrossRef]
- Huang, S.; Ha, L.; Liu, Y. The altitude correction term of the corona loss on alternating-current transmission lines. Energy Rep. 2023, 9, 2149–2152. [Google Scholar] [CrossRef]
- Riba, J.-R.; Bas-Calopa, P.; Moreno-Eguilaz, M. Analysing the influence of geometry and pressure on corona discharges. Eur. J. Phys. 2022, 43, 055201. [Google Scholar] [CrossRef]
- Lusuardi, L.; Rumi, A.; Neretti, G.; Seri, P.; Cavallini, A. Assessing the severity of partial discharges in aerospace applications. In Proceedings of the 2019 IEEE Conference on Electrical Insulation and Dielectric Phenomena (CEIDP), Richland, WA, USA, 20–23 October 2019; pp. 267–270. [Google Scholar] [CrossRef] [Green Version]
- Muhr, M.; Schwarz, R. Experience with optical partial discharge detection. Mater. Sci. Pol. 2009, 27, 1139–1146. Available online: https://yadda.icm.edu.pl/yadda/element/bwmeta1.element.baztech-article-BPW7-0012-0020 (accessed on 11 June 2022).
- Zhao, Y.; Li, Y.; Li, K.; Han, D.; Qiu, Z.; Zhang, G. Emission Spectrum Analysis of Two Typical Partial Discharge Forms Under High Frequency Square Wave Voltages. IEEE Access 2020, 8, 219946–219954. [Google Scholar] [CrossRef]
- Czech, T.; Sobczyk, A.T.; Jaworek, A. Optical emission spectroscopy of point-plane corona and back-corona discharges in air. Eur. Phys. J. D 2011, 65, 459–474. [Google Scholar] [CrossRef]
- Janda, M.; Martišovitš, V.; Hensel, K.; Machala, Z. Generation of Antimicrobial NOx by Atmospheric Air Transient Spark Discharge. Plasma Chem. Plasma Process. 2016, 36, 767–781. [Google Scholar] [CrossRef]
- Riba, J.-R. Spectrum of Corona Discharges and Electric Arcs in Air under Aeronautical Pressure Conditions. Aerospace 2022, 9, 524. [Google Scholar] [CrossRef]
- Aircraft Performance Database. 2023. Available online: https://contentzone.eurocontrol.int/aircraftperformance/default.aspx? (accessed on 23 January 2023).
- The Engineering ToolBox. Available online: https://www.engineeringtoolbox.com/ (accessed on 23 January 2023).
- ISO 2533:1975; Standard Atmosphere. ISO: Geneva, Switzerland, 1975; pp. 1–11. Available online: http://www.iso.org/iso/catalogue_detail?csnumber=7472 (accessed on 3 January 2016).
- Wan, J.; Zhang, H.; Liu, F.; Lv, W.; Zhao, Y. Optimization of Aircraft Climb Trajectory considering Environmental Impact under RTA Constraints. J. Adv. Transp. 2020, 2020, 1–17. [Google Scholar] [CrossRef]
- Driessen, A.B.J.M.; Van Duivenbode, J.; Wouters, P.A.A.F. Operational conditions influencing the partial discharge performance of cables under low and medium vacuum. IEEE Trans. Dielectr. Electr. Insul. 2019, 26, 81–89. [Google Scholar] [CrossRef]
- 4-2013; IEEE Standard for High-Voltage Testing Techniques. IEEE: Piscataway, NJ, USA, 2013; pp. 1–213. [CrossRef]
- Bas-Calopa, P.; Riba, J.-R.; Moreno-Eguilaz, M. Measurement of Corona Discharges under Variable Geometry, Frequency and Pressure Environment. Sensors 2022, 22, 1856. [Google Scholar] [CrossRef] [PubMed]
Figure 1.
Parameters for different aircraft during the climb stage. (a) Altitude versus time [22]. (b) Pressure versus time t. (c) Air density versus time.
Figure 1.
Parameters for different aircraft during the climb stage. (a) Altitude versus time [22]. (b) Pressure versus time t. (c) Air density versus time.

Figure 2.
Sketch of the experimental setup.

Figure 3.
(a) Sketch of the experimental setup with the AC programmable power supply, the high-voltage transformer, the diode rectifier, the capacitor filter, and the needle-to-plane gap. (b) Detail of Electrode #1. (c) Detail of the Electrode #2.
Figure 3.
(a) Sketch of the experimental setup with the AC programmable power supply, the high-voltage transformer, the diode rectifier, the capacitor filter, and the needle-to-plane gap. (b) Detail of Electrode #1. (c) Detail of the Electrode #2.

Figure 4.
Flowchart of the laboratory procedure used to determine the pressure at which corona is first detected under dynamic pressure conditions.
Figure 4.
Flowchart of the laboratory procedure used to determine the pressure at which corona is first detected under dynamic pressure conditions.

Figure 5.
(a) Dynamic pressure tests. Tests conducted at constant applied voltage and various pressure drop rates. Voltage, pressure, and temperature were recorded at the inception of corona. (b) Static pressure tests. Tests performed at constant pressure and variable voltage amplitude.
Figure 5.
(a) Dynamic pressure tests. Tests conducted at constant applied voltage and various pressure drop rates. Voltage, pressure, and temperature were recorded at the inception of corona. (b) Static pressure tests. Tests performed at constant pressure and variable voltage amplitude.

Figure 6.
Air density at the instant of corona inception during dynamic pressure tests. (a) Electrode #1. (b) Electrode #2.
Figure 6.
Air density at the instant of corona inception during dynamic pressure tests. (a) Electrode #1. (b) Electrode #2.


Table 1.
Approximate pressure drop rate during climb at 4000 m altitude for various aircraft models.
Table 1.
Approximate pressure drop rate during climb at 4000 m altitude for various aircraft models.
| Aircraft Model | Pressure Drop Rate at 4000 m [kPa·s−1] | Air Density Drop Rate at 4000 m [kg·m−3·s−1] | Ceiling Altitude [ft] | Pressure * [kPa] | Temperature * [°C] |
|---|---|---|---|---|---|
| B747-100 | −0.061 | −0.00066 | 45,000 | 14.8 | −56.5 |
| A320 | −0.081 | −0.00087 | 39,000 | 19.9 | −56.5 |
| B787-8 DL | −0.081 | −0.00087 | 43,000 | 16.3 | −56.5 |
| A319 | −0.089 | −0.00096 | 39,000 | 19.9 | −56.5 |
| B777-200 | −0.101 | −0.00109 | 43,000 | 16.3 | −56.5 |
| CRJ1 (RJ-100) | −0.101 | −0.00109 | 41,000 | 18.1 | −56.5 |
| A330-200 | −0.101 | −0.00109 | 41,000 | 18.1 | −56.5 |
| A380-800 | −0.101 | −0.00109 | 43,000 | 16.3 | −56.5 |
| B737-700 | −0.101 | −0.00109 | 41,000 | 18.1 | −56.5 |
| A10 Thunderbolt 2 | −0.101 | −0.00109 | 34,000 | 25.0 | −52.0 |
| Ajet (Alpha Jet) | −0.162 | −0.00175 | 48,000 | 12.8 | −56.5 |
| Etar (Étendard IV) | −0.406 | −0.00437 | 50,000 | 11.6 | −56.5 |
| Eurofighter | −1.218 | −0.01312 | 65,000 | 5.6 | −56.5 |
* At the ceiling altitude according to the ISO 2533 standard atmosphere [24].
Table 2.
Dynamic pressure tests made with the two electrodes performed at constant voltage and applying different types of voltage at different pressure drop rates.
Table 2.
Dynamic pressure tests made with the two electrodes performed at constant voltage and applying different types of voltage at different pressure drop rates.
| Applied Voltage | Pressure Drop Rate [kPa/s] | Mean Air Density ρmean [kg/m3] | Standard Deviation σρ [kg/m3] | Instrument Uncertainty Δρa,instruments [%] | Delay Uncertainty Δρa,delay [%] | Standard Deviation Uncertainty Δρa,2σ [%] | Total Uncertainty Δρa [%] | |
|---|---|---|---|---|---|---|---|---|
| Electrode #1 placed 80 mm above ground | 3.07 kVRMS 400 Hz sinusoidal AC | −0.10 ± 0.09 | 0.856 | 0.006 | 0.8 | 0.1 | 1.4 | 1.6 |
| −0.30 ± 0.07 | 0.855 | 0.003 | 0.8 | 0.1 | 0.7 | 1.1 | ||
| −0.60 ± 0.14 | 0.850 | 0.008 | 0.8 | 0.2 | 1.9 | 2.1 | ||
| −1.00 ± 0.21 | 0.843 | 0.016 | 0.8 | 0.2 | 3.8 | 3.9 | ||
| 4.85 kV negative DC | −0.10 ± 0.09 | 0.825 | 0.010 | 0.8 | 0.2 | 2.4 | 2.6 | |
| −0.30 ± 0.13 | 0.825 | 0.014 | 0.8 | 0.2 | 3.4 | 3.5 | ||
| −0.60 ± 0.14 | 0.822 | 0.016 | 0.8 | 0.2 | 3.9 | 4.0 | ||
| −1.00 ± 0.36 | 0.810 | 0.014 | 0.8 | 0.3 | 3.5 | 3.6 | ||
| 5.74 kV positive DC | −0.10 ± 0.04 | 0.833 | 0.020 | 0.8 | 0.1 | 4.8 | 4.9 | |
| −0.30 ± 0.08 | 0.835 | 0.019 | 0.8 | 0.2 | 4.6 | 4.6 | ||
| −0.60 ± 0.15 | 0.833 | 0.021 | 0.8 | 0.2 | 5.0 | 5.1 | ||
| −1.00 ± 0.30 | 0.843 | 0.023 | 0.8 | 0.2 | 5.5 | 5.5 | ||
| Electrode #2 placed 40 mm above ground | 1.54 kVRMS 400 Hz sinusoidal AC | −0.10 ± 0.04 | 0.841 | 0.003 | 0.8 | 0.2 | 0.7 | 1.1 |
| −0.30 ± 0.09 | 0.840 | 0.012 | 0.8 | 0.2 | 2.9 | 3.0 | ||
| −0.60 ± 0.29 | 0.837 | 0.009 | 0.8 | 0.2 | 2.2 | 2.3 | ||
| −1.00 ± 0.24 | 0.832 | 0.010 | 0.8 | 0.3 | 2.4 | 2.5 | ||
| 2.56 kV negative DC | −0.10 ± 0.04 | 0.833 | 0.007 | 0.8 | 0.2 | 1.7 | 1.9 | |
| −0.30 ± 0.12 | 0.831 | 0.016 | 0.8 | 0.2 | 3.9 | 3.9 | ||
| −0.60 ± 0.21 | 0.839 | 0.011 | 0.8 | 0.2 | 2.6 | 2.8 | ||
| −1.00 ± 0.33 | 0.832 | 0.017 | 0.8 | 0.3 | 4.1 | 4.2 | ||
| 3.21 kV positive DC | −0.10 ± 0.04 | 0.845 | 0.010 | 0.8 | 0.2 | 2.4 | 2.5 | |
| −0.30 ± 0.10 | 0.842 | 0.006 | 0.8 | 0.2 | 1.4 | 1.6 | ||
| −0.60 ± 0.23 | 0.844 | 0.011 | 0.8 | 0.2 | 2.6 | 2.7 | ||
| −1.00 ± 0.32 | 0.850 | 0.010 | 0.8 | 0.3 | 2.4 | 2.5 |
Table 3.
Static pressure tests. Summary of experimental results at constant pressure when the voltage was increased at an approximate rate of 20 V/s.
Table 3.
Static pressure tests. Summary of experimental results at constant pressure when the voltage was increased at an approximate rate of 20 V/s.
| Applied Voltage | Mean Voltage Vmean [kV] | Standard Deviation σV [V] | Instruments Uncertainty ΔVa,instruments [%] | Step Uncertainty ΔVa,step [%] | Standard Deviation Uncertainty ΔVa,2σ [%] | Total Uncertainty ΔVa [%] | |
|---|---|---|---|---|---|---|---|
| Electrode #1 placed 80 mm above ground | 400 Hz AC | 3.09 (RMS) | 0.027 | 3.0 | 0.3 | 1.7 | 3.5 |
| Negative DC | 4.73 | 0.093 | 3.0 | 0.2 | 3.9 | 5.0 | |
| Positive DC | 5.63 | 0.055 | 3.0 | 0.2 | 2.0 | 3.6 | |
| Electrode #2 placed 40 mm above ground | 400 Hz AC | 1.58 (RMS) | 0.024 | 3.0 | 0.6 | 3.0 | 4.3 |
| Negative DC | 2.55 | 0.027 | 3.0 | 0.4 | 2.1 | 3.7 | |
| Positive DC | 3.11 | 0.025 | 3.0 | 0.3 | 1.6 | 3.4 |
Disclaimer/Publisher’s Note: The statements, opinions and data contained in all publications are solely those of the individual author(s) and contributor(s) and not of MDPI and/or the editor(s). MDPI and/or the editor(s) disclaim responsibility for any injury to people or property resulting from any ideas, methods, instructions or products referred to in the content. |
© 2023 by the authors. Licensee MDPI, Basel, Switzerland. This article is an open access article distributed under the terms and conditions of the Creative Commons Attribution (CC BY) license (https://creativecommons.org/licenses/by/4.0/).
Share and Cite
MDPI and ACS Style
Bas-Calopa, P.; Riba, J.-R.; Moreno-Eguilaz, M. Analyzing the Effect of Dynamic Pressure Drop on Corona Discharges for Aircraft Applications. Aerospace 2023, 10, 320. https://doi.org/10.3390/aerospace10030320
AMA Style
Bas-Calopa P, Riba J-R, Moreno-Eguilaz M. Analyzing the Effect of Dynamic Pressure Drop on Corona Discharges for Aircraft Applications. Aerospace. 2023; 10(3):320. https://doi.org/10.3390/aerospace10030320
Chicago/Turabian StyleBas-Calopa, Pau, Jordi-Roger Riba, and Manuel Moreno-Eguilaz. 2023. "Analyzing the Effect of Dynamic Pressure Drop on Corona Discharges for Aircraft Applications" Aerospace 10, no. 3: 320. https://doi.org/10.3390/aerospace10030320
Note that from the first issue of 2016, this journal uses article numbers instead of page numbers. See further details here.