Communication

Angle-of-Attack Estimation for General Aviation Aircraft

Faculty of Mechanical Engineering and Naval Architecture, University of Zagreb, Ivana Lučića 5, 10000 Zagreb, Croatia
*
Author to whom correspondence should be addressed.
Aerospace 2023, 10(3), 315; https://doi.org/10.3390/aerospace10030315
Submission received: 30 January 2023 / Revised: 9 March 2023 / Accepted: 16 March 2023 / Published: 22 March 2023
(This article belongs to the Collection Avionic Systems)

Abstract

:
The angle of attack is one of the most important flight parameters. In the framework of the present study, a flight data recording method was designed to analyze the Valasek angle-of-attack estimation method and investigate its applicability for general aviation aircraft. This was performed using two devices characterized by substantially different characteristics. The test flight, and the ground test, i.e., a flight simulator experiment, were conducted. Two flight regimes were analyzed: (a) steady climb and descent with low values of angle of attack, (b) approach to stall with idle power with an increase of the angle of attack to the critical value. A satisfactory angle of attack estimate was obtained for the steady climb and descent regime, while the approach to stall estimate was less accurate but still indicative and considered useful for the pilot. The results indicate that less expensive synthetic sensors may provide acceptable results compared to high-quality certified equipment. A proposed modification of the estimation method enables simplification of the required equipment, while offering important information to the pilot.

1. Introduction

Reliable flight data is crucial for the safe operation of aircraft. In order for flight data to be accurate, a large amount of sensors has been commonly employed in aircraft [1], while their failure [2,3] may lead to tragic events. Synthetic sensors (SS) enable new possibilities for key data verification [4], particularly regarding the aircraft airspeed and the angle of attack (AoA), and other parameters [5]. The SS device delivers air data without measuring properties of the air flow; instead, it utilizes sensors such as a gyroscope, accelerometer, or Global Positioning System (GPS). There are generally three types of SS [6], i.e., model-based [7], data-driven [8], and model-free [9,10] SS. When the flight model is not available, it is appropriate to use the model-free scheme for the AoA and angle of sideslip (AoS) estimation. These parameters may be calculated using a system of nonlinear equations governing the aerodynamic angles based on aircraft dynamics, airspeed, and wind data [11]. In this approach, neither the aircraft flight model nor the data from the test flight are required. The proposed scheme is based on the actual airspeed, angular rates, inertial accelerations, aircraft attitude, and wind acceleration vector. Nevertheless, this approach is applicable only if the aircraft is maneuvering, i.e., when the aircraft is not in steady flight. This limitation is mitigated in the model-based Valasek method [12]. This model-based scheme encompasses data collected by an independent GPS, inertial measurement unit (IMU), and control input data to estimate airspeed, AoA, and other relevant parameters.
Regardless of the choice of the AoA estimation method, reliable sensors providing flight data are mandatory. These sensors have been commonly classified based on the amount of noise they create. Although sophisticated certified devices have been commonly used in commercial aircraft, their application in general aviation (GA) is rather limited because of their high price. Given that flying past a critical AoA is the main cause of GA aircraft accidents [13], new SS solutions are considered useful in enhancing aircraft safety. The present work is a contribution in this direction.
Enhancing aircraft safety motivated Ref. [12] to develop an approach where AoA and AoS estimations were compared using the data recorded by sophisticated (preinstalled in aircraft) and simple (attitude heading reference system—AHRS) devices, i.e., more and less expensive approaches, respectively. In Ref. [12], a model of three representative AHRS devices was developed and subjected to the data acquired using a flight simulator. While Cessna 172 was the subject in Ref. [12], there is a potential for this approach to be employed also for other types of aircraft. The proposed scheme outputs AoA and AoS during steady flight and dynamic maneuver. While both these approaches yield nearly the same mean AoA and AoS, the sophisticated devices are characterized by substantially less noise. This issue did not prove to be crucial, so the simpler approach proved suitable for practice.
Given the importance of the Valasek approach [12] and its important implications for GA, the present work was undertaken to further address this approach. The evaluation of the AoA and AoS estimations in Ref. [12] was based on computational modeling only, while in the present study the AoA estimation approach was validated and further enhanced in the flight test. The present study is based on a test flight performed on a Cessna 172 aircraft and a concurrent simulation on a flight simulator. During the test flight, the data were recorded using two SS devices, i.e., a preinstalled high-quality certified device GARMIN G5 (Device 1) and a simple device PIXHACK (Device 2). In particular, in Ref. [12] the results of the Monte-Carlo simulations for various sensor noise levels were reported, while Device 1 (low noise) and Device 2 (high noise) in our present study correspond to the COTS AHRS suggested for further analysis in Ref. [12]. While in Ref. [12] both AoA and AoS estimation schemes were addressed, the focus of the present study was on the AoA estimation. Another important contribution is the effect of various parameters included in the AoA estimation. These findings may enable a simplification of the AoA estimation for GA aircraft.

2. Methodology

The test flight was performed on a Cessna 172N aircraft. Its aerodynamic characteristics are provided in Ref. [12] and the mass characteristics for the flight test are given in Table 1. A decrease in the total mass caused by burning fuel was calculated assuming linear correlation between the mass of fuel burned during the flight and the flight duration time.
The flight data were recorded using Device 1, Device 2, and three video cameras. The first camera was placed next to the magnetic compass facing forward, the second one was on the cabin ceiling to record the instruments and crew behavior, while the third camera was placed on the right-hand side steering wheel to record its position for the purpose of post flight determination of the elevator deflection angle without disturbing the pilot. During the preliminary tests, a selection of these devices proved appropriate for the intended scope of the study. The meteorological data for the test flight are provided in Table 2.
The test flight lasted 30 min and is represented with altitude and flight path data recorded by Devices 1 and 2 in Figure 1. The flight test addressed several specific elements: (1) straight level flight in four directions, (2) response on impulse excitation of the elevator, (3) response on impulse excitation with rudder, (4) steady climb and descent, (5) steep turns, (6) stall with idle power, and (7) stall with power. In the present work, two maneuvers were studied in detail to support the intended scope of the study, i.e., steady climb and descent, and stall with idle power (power-off stall), Figure 1.
The reference AoA data were obtained in the flight simulator where the maneuvers performed in the test flight were simulated. The coefficients for the 6DOF aircraft model were adopted from the JSBsim Cessna 172 aircraft [14], the same as the one used in Ref. [12]. The educational-research flight simulator at the Faculty of Mechanical Engineering and Naval Architecture, University of Zagreb, was used for these purposes. The flight simulations were performed including a visualization of the surrounding terrain with FlightGear [15] using three XGA resolution projectors that create a 180° horizontal field of view on a cylindrical screen of 5 m in diameter. The flight instruments were displayed on a monitor in front of the pilot. The flight simulator setup was subjectively tested by several experienced Cessna 172 pilots, including a type flight instructor, who suggested that the flight model in the simulator setup performed practically the same as the Cessna 172 aircraft on which the flight test was conducted. The pilot inputs to the 6DOF model were applied using three devices, i.e., a steering wheel for aileron and elevator deflection angle, steering pedals for rudder deflection angle, and a power adjustment lever for engine power. The inertial and aerodynamic characteristics of the aircraft, meteorological conditions, and the initial position and orientation of the aircraft were the same as during the flight test.
The elevator deflection angle during the flight was determined under the assumption that it is linearly dependent on the steering wheel position, while the steering wheel readings were converted to the elevator deflection angles by the linear interpolation. Figure 2 shows the recorded elevator deflection angle for one portion of the flight. Since in this preliminary analysis only the elevator deflection angle was observed during the flight, it was not appropriate to use only this control input in the simulated flight without other pilot control inputs.
Model-based AoA estimation was performed using the expression in Ref. [12]:
α ^ = C L 0 + C L q q c ¯ 2 V T + C L δ E δ E q ¯ S W n z C L α q ¯ S W n x ,
for the given aerodynamic lift coefficient gradients C L 0 , C L α , C L q , C L δ E , reference length c ¯ , reference area S, and weight W, while the variables taken from the flight, simulated or measured, are the aerodynamic speed V T , the dynamic pressure q ¯ , components of the acceleration n x , n z , the pitch rate q, and the elevator deflection δ E . For further analysis, Equation (1) was rearranged as follows:
α ^ C L 0 = C L 0 q ¯ S W C L α q ¯ S W n x ,
α ^ q = C L q q c ¯ 2 V T q ¯ S W C L α q ¯ S W n x ,
α ^ δ E = C L δ E δ E q ¯ S W C L α q ¯ S W n x ,
α ^ n z = n z C L α q ¯ S W n x .
It is therefore possible to present the AoA estimation (1) in the following form, thus emphasizing the effect of four variables:
α ^ = α ^ C L 0 + α ^ q + α ^ δ E + α ^ n z .

3. Results

Two maneuvers from the test flight were studied in detail to fulfill the objectives of this work. The first maneuver, a steady climb and descent, was used to study the difference in the AoA recorded during the flight and the AoA estimations in the flight simulator, Device 1, and Device 2, respectively. The results were further compared to the results presented in Ref. [12]. The second maneuver, a stall with idle power, was used to study the effect of the various terms in Equation (1), as given in (6), on the AoA estimation, and furthermore to check whether the flight model describes the stall flight regime in a satisfactory manner. The effect of neglecting parameters in the AoA estimation (6), i.e., the elevator deflection angle δ E and the pitch rate q, was studied as well.

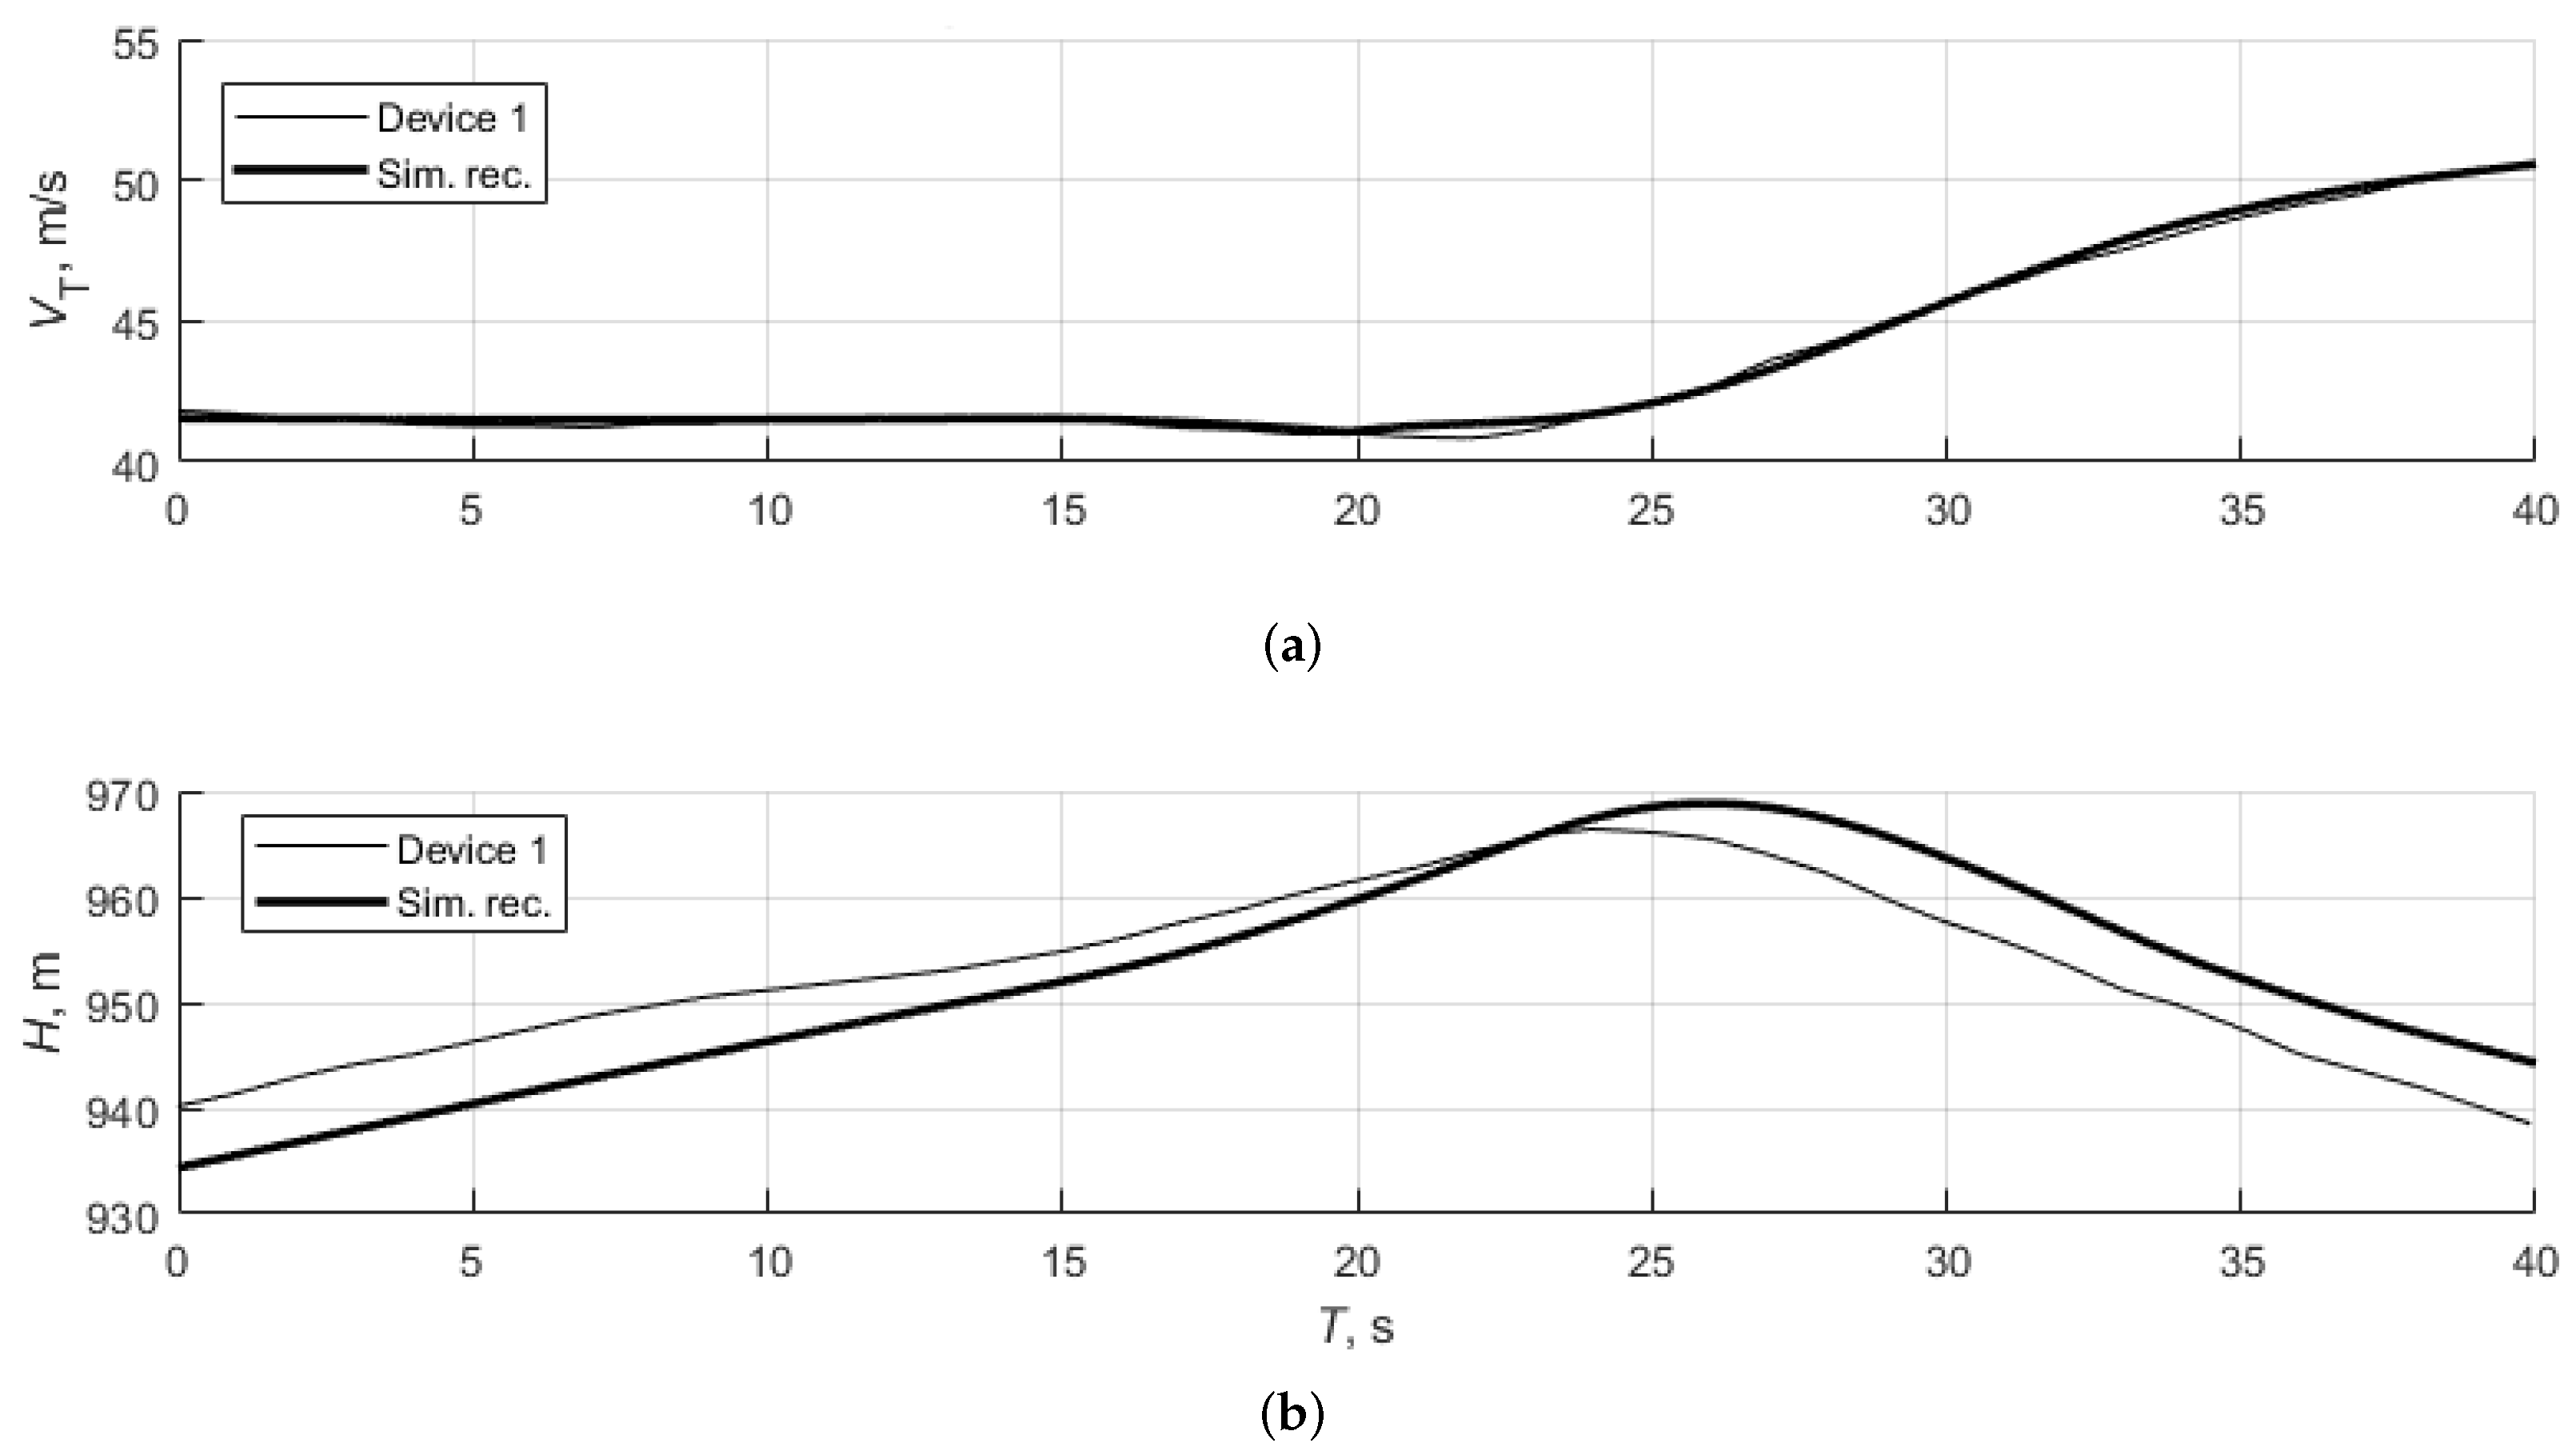
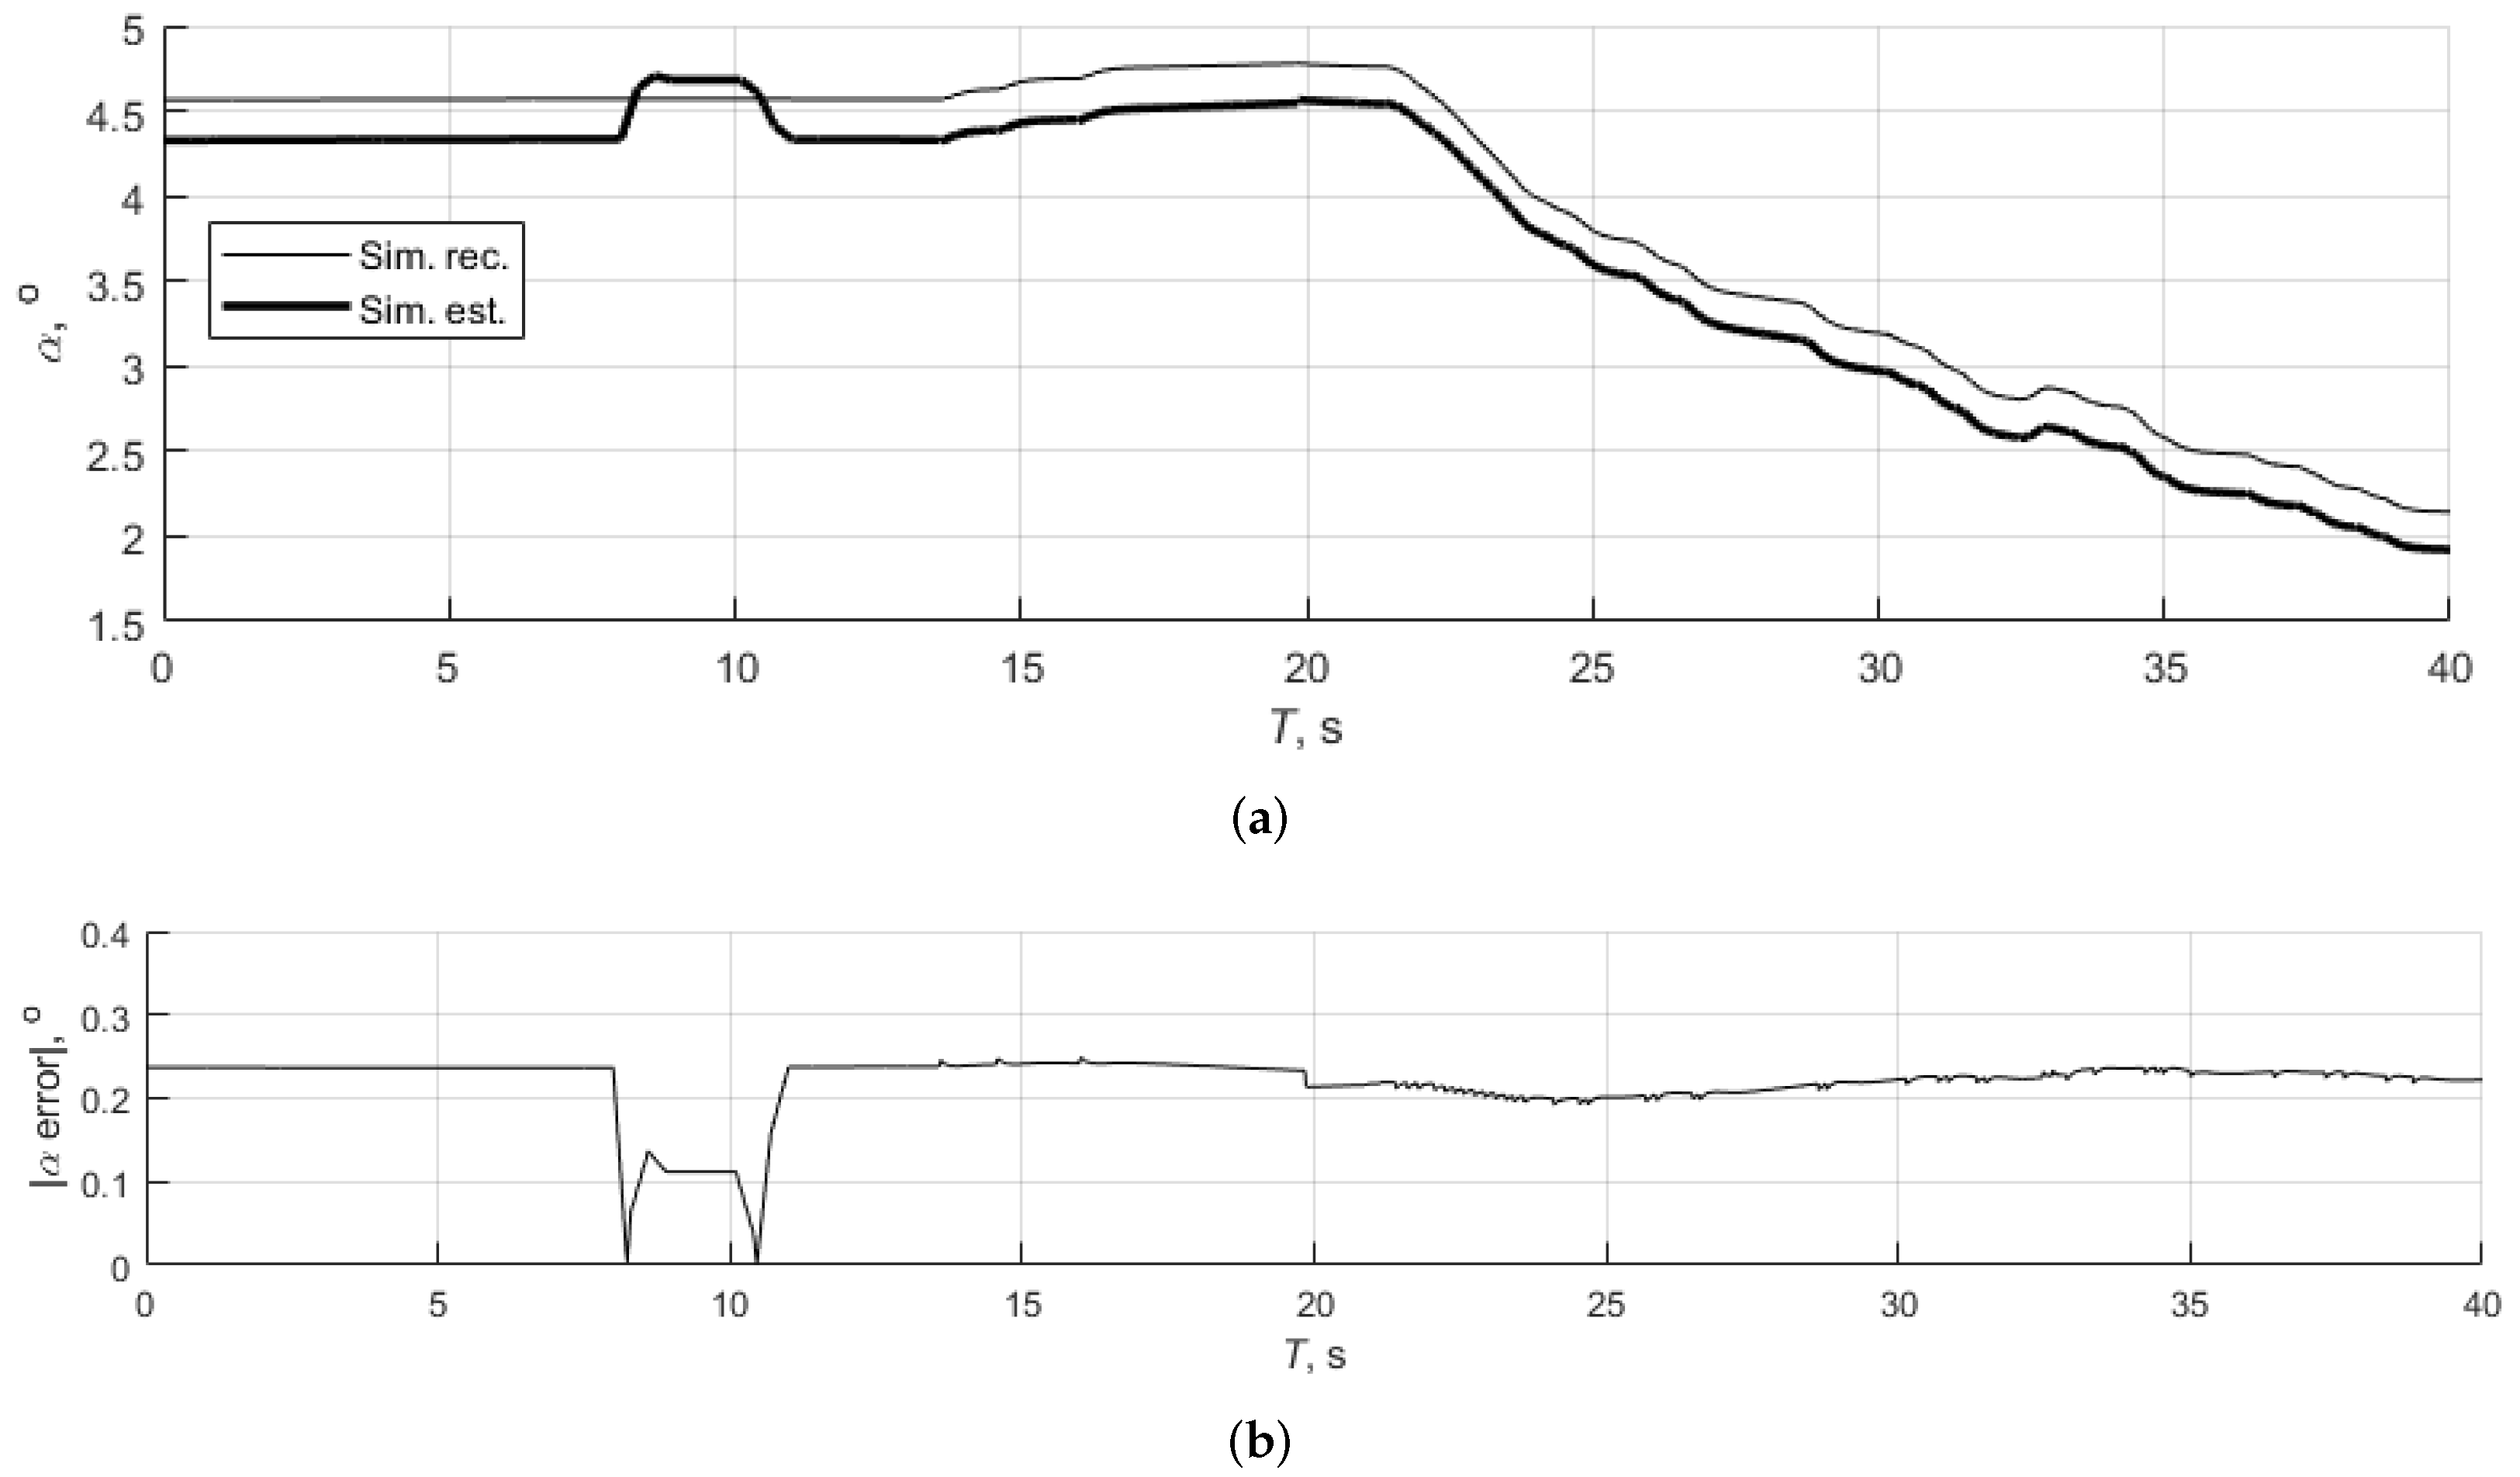
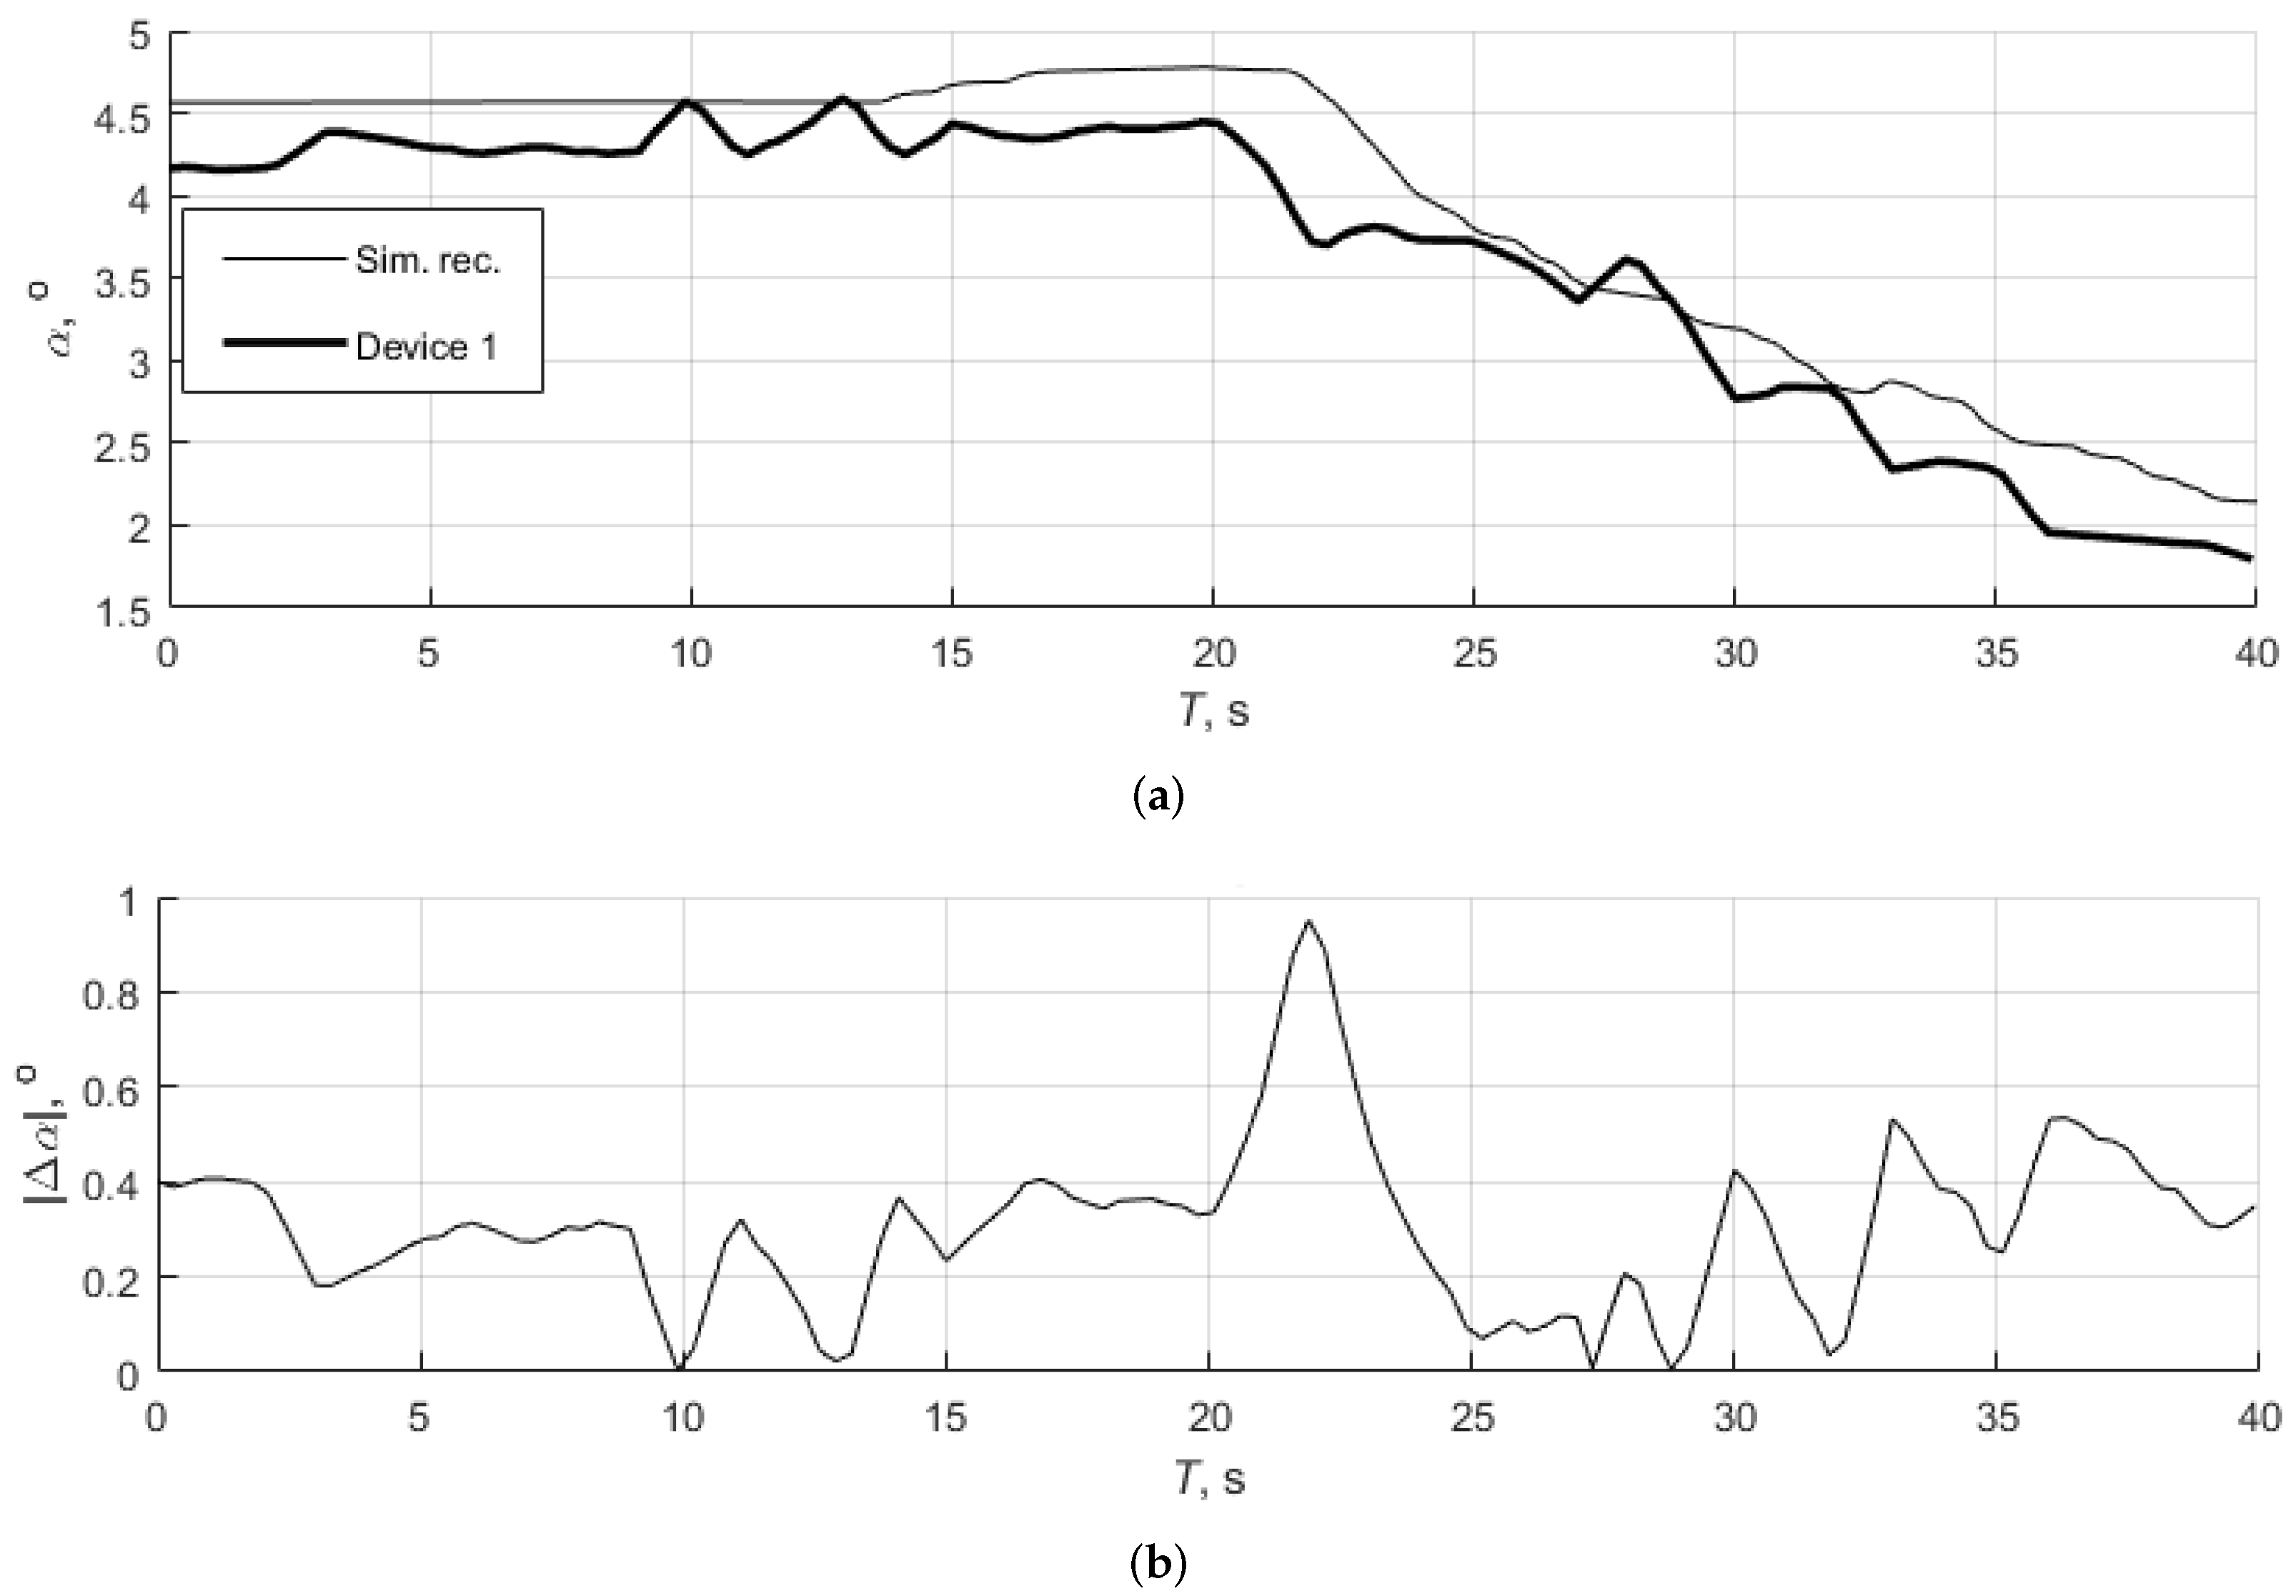
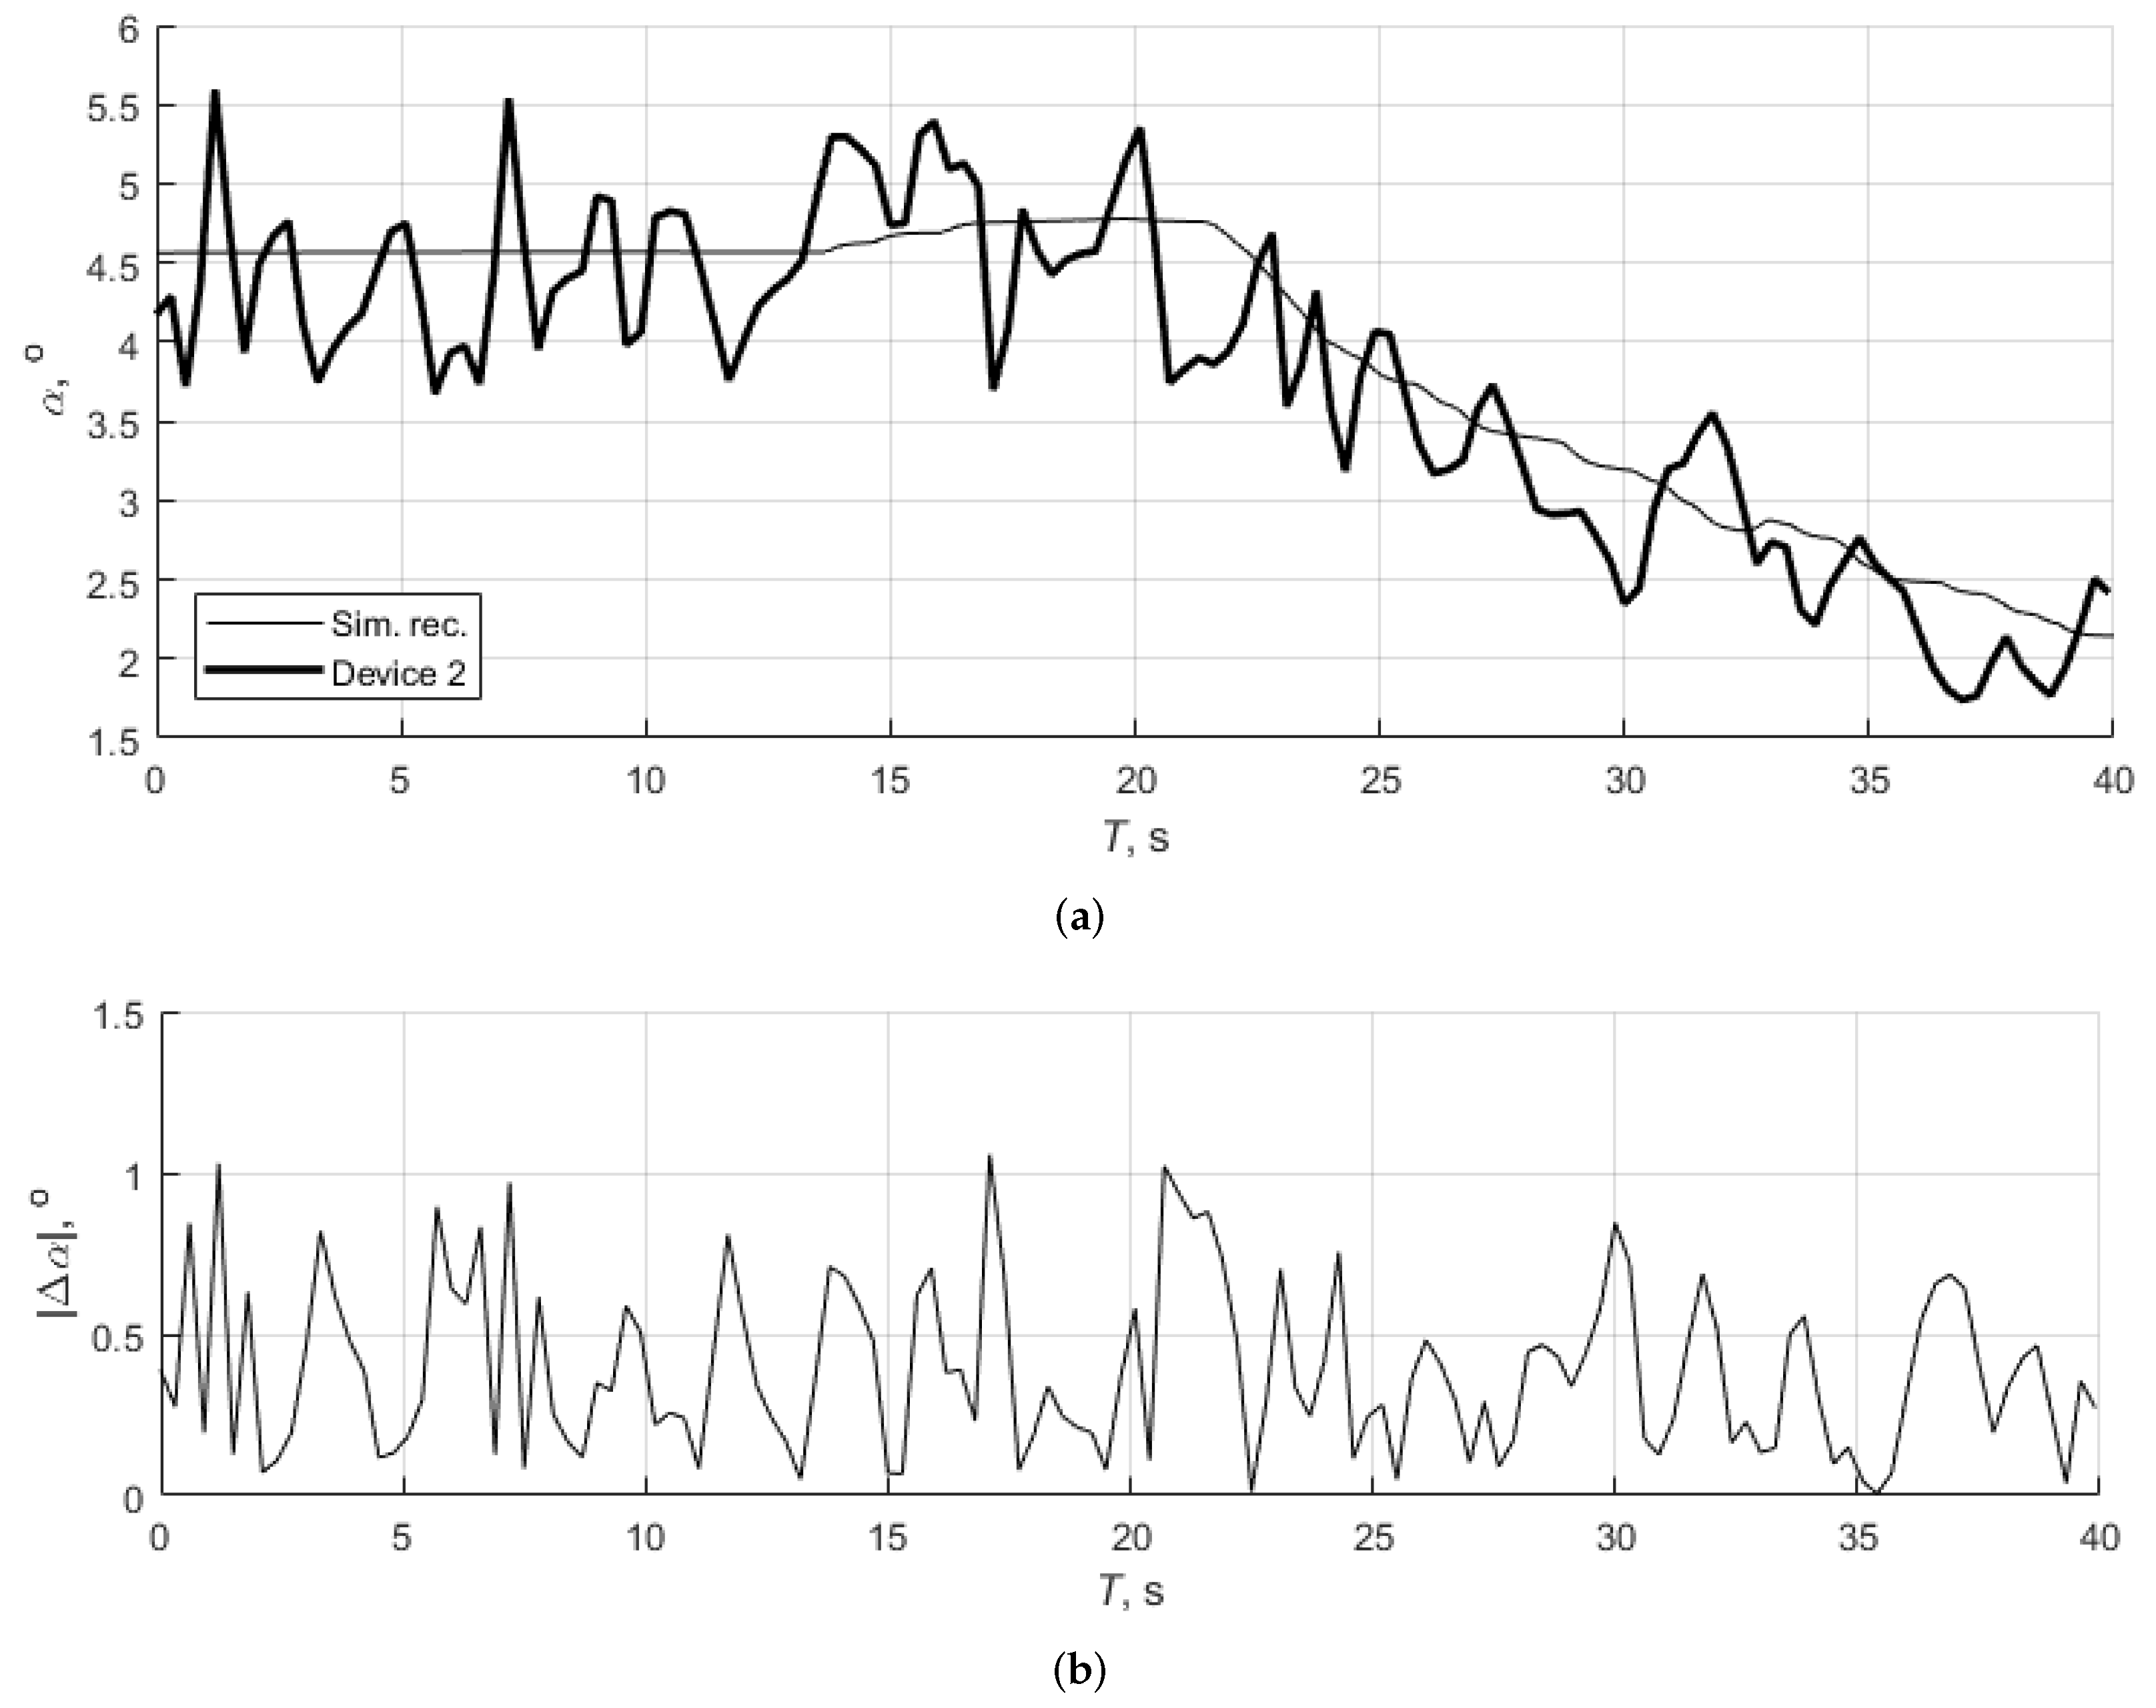
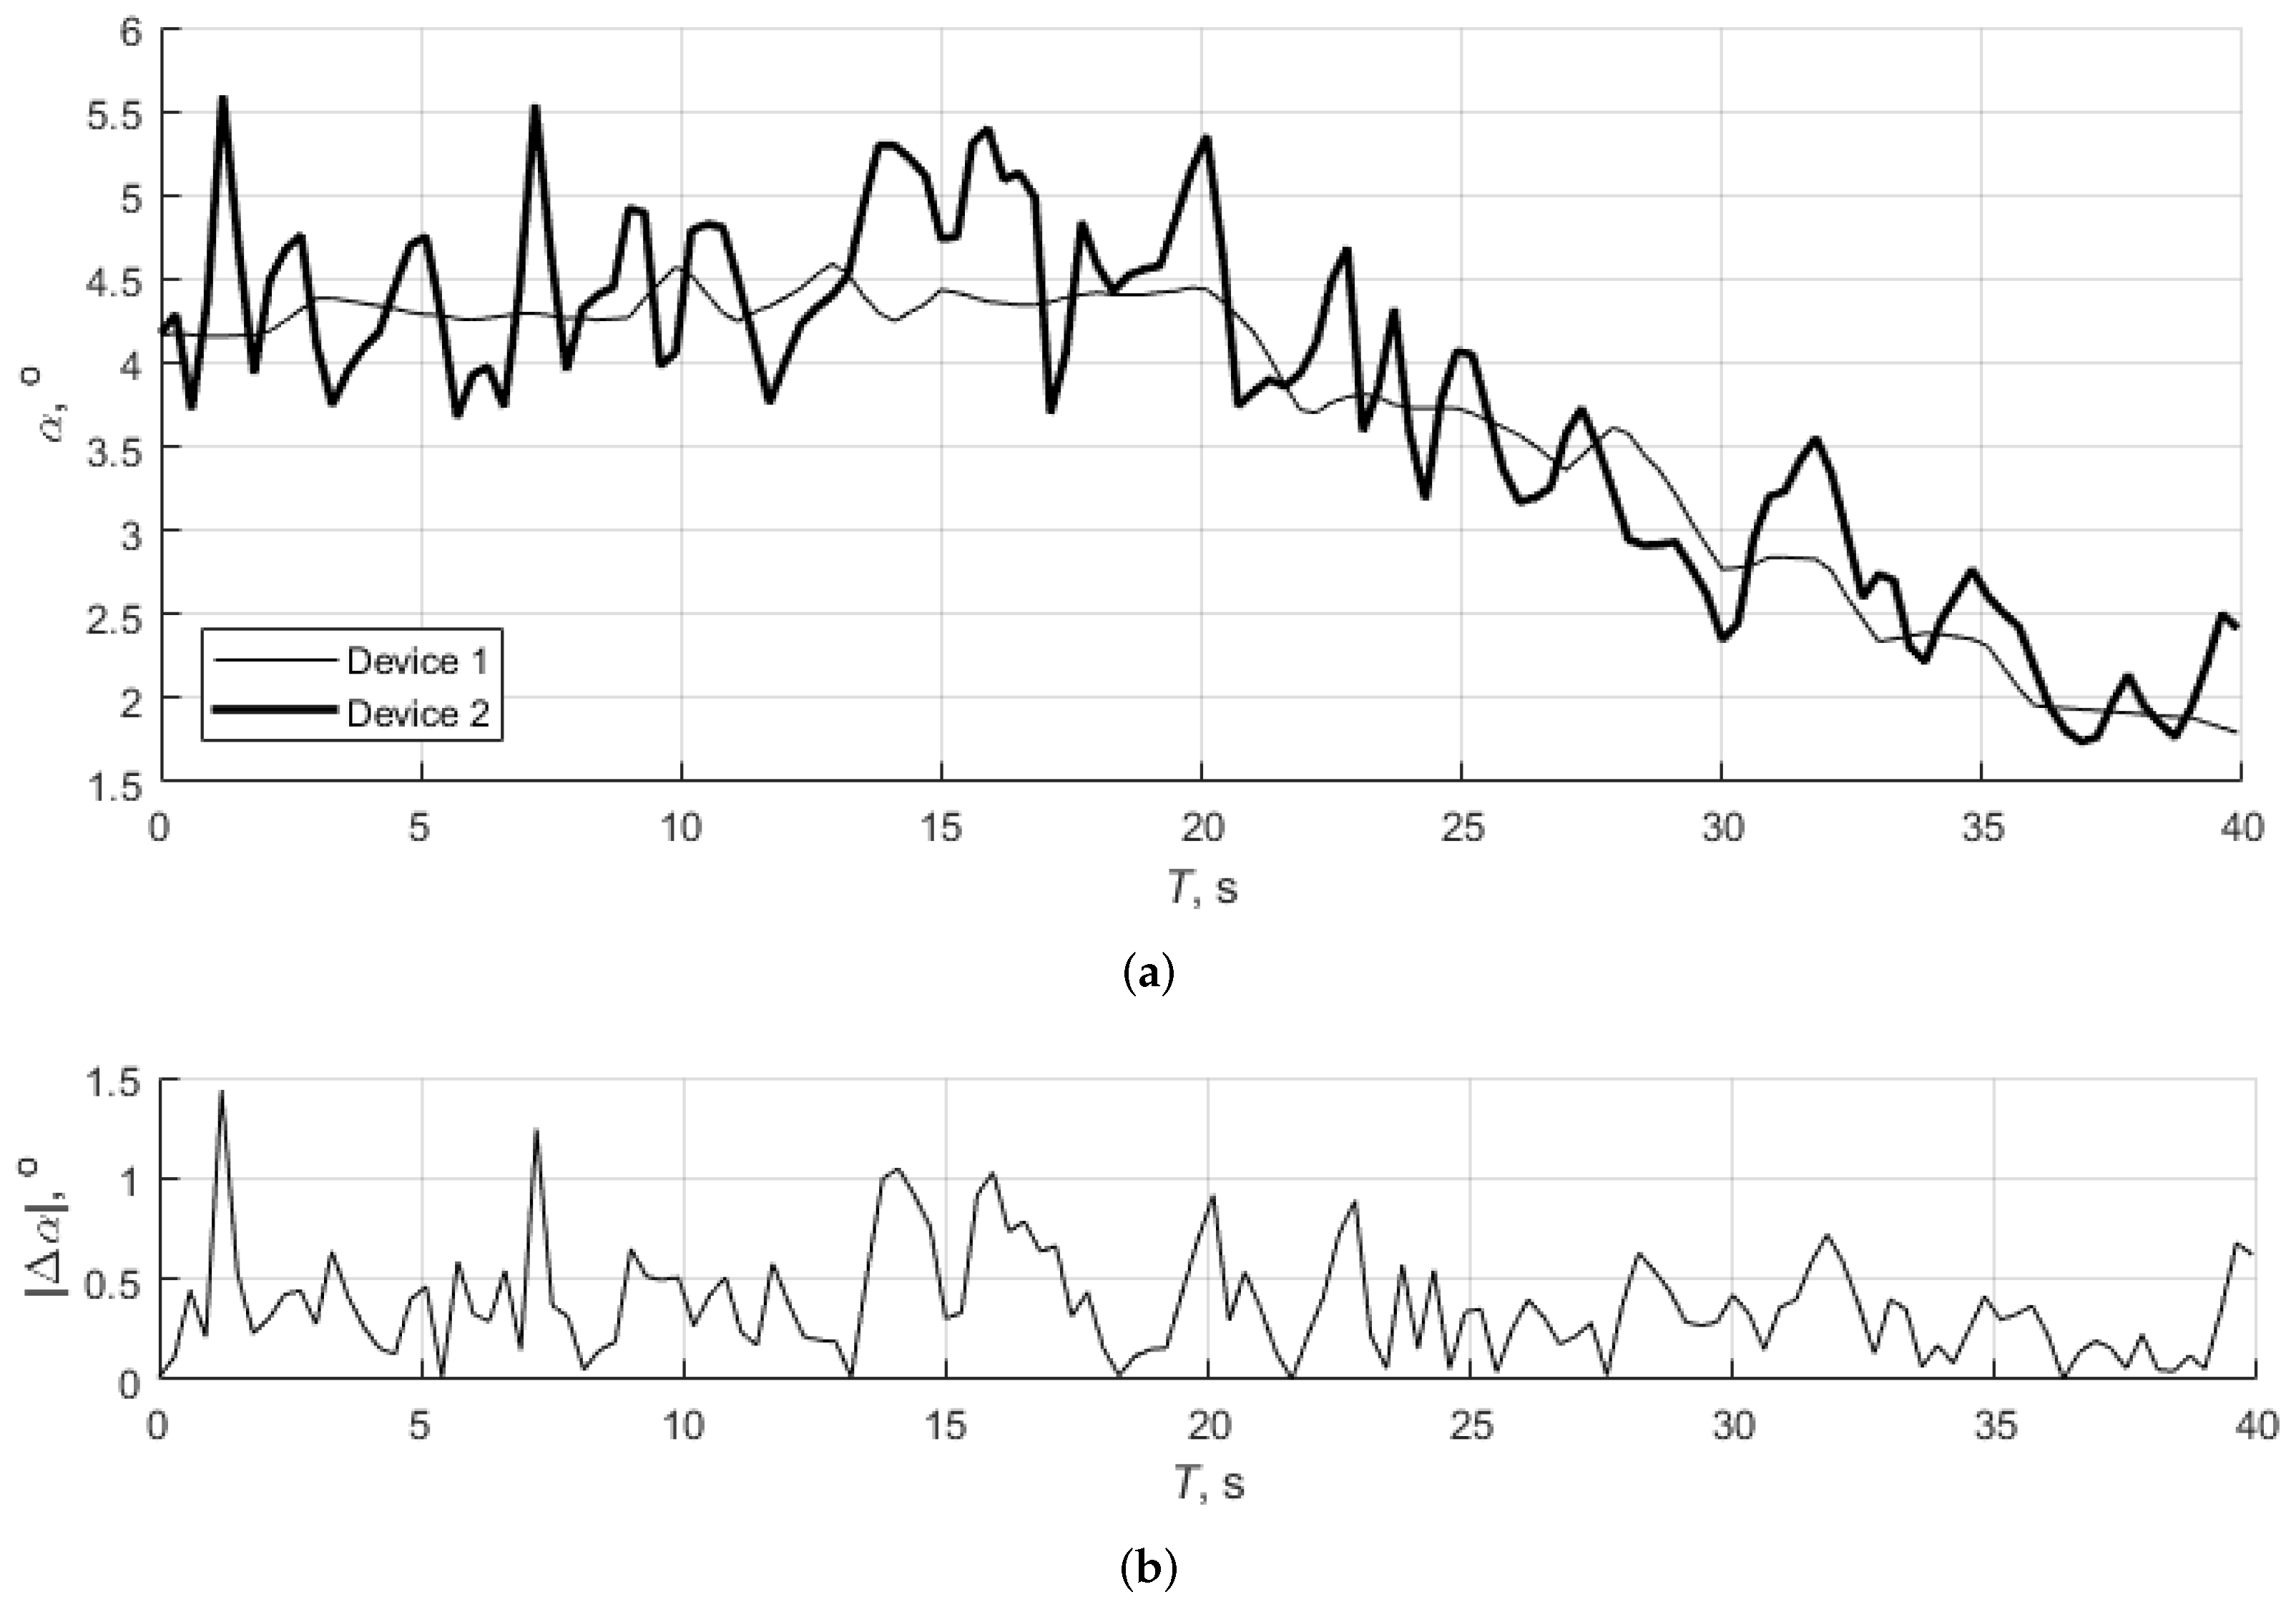
3.1. Test 1: Steady Climb and Descent

The first maneuver, steady climb and descent, was comparable to the maneuver reported in Ref. [12]. In particular, the aircraft was set off from a horizontal steady flight with a speed of 51 m/s (100 kt) at an altitude of 915 m (3000 ft). The task was to climb to 965 m (3170 ft) and then to descend to the initial height, while both tasks occurred at a constant pitch angle. The aerodynamic speed V T and altitude H of this maneuver observed in the test flight and the flight simulator are shown in Figure 3, which uses these abbreviations: “Sim. rec.” for the AoA recorded in the flight simulator, “Device 1” for the AoA estimated from the test flight data from Device 1.
It can be observed that the data from the test “Device 1” and simulator flight “Sim.rec.” are in good agreement. Since the AoA required for the steady flight is more sensitive to a difference in airspeed than to a difference in altitude, more effort was devoted to obtain the most accurate possible overlap of airspeed data.
The reference AoA recorded in the flight simulator “Sim.rec.”, the AoA estimation from the flight simulator “Sim.est.”, and two onboard devices “Device 1” and “Device 2” are reported in Figure 4, Figure 5, Figure 6 and Figure 7 where the following abbreviations were used: “Sim. est.” for the AoA estimated from the flight simulator data, and “Device 2” for the AoA estimated from the test flight data from Device 2. All estimations, from the flight simulator recordings and test flight recordings, utilized Equation (1). The results presented here in Figure 4, Figure 5, Figure 6 and Figure 7 are shown in a way comparable to the results presented in Ref. [12].
Figure 4 shows the recorded AoA “Sim.rec.” and the AoA estimated using the data in the flight simulator “Sim.est.”. In general, there are two sources of error in the AoA estimation, i.e., the error of the estimation method and the error of the measured data. The AoA estimation in Figure 4 includes only the error of the estimation method, and, for this maneuver, the error was less than 0.3° between the recorded and the estimated AoA. In Ref. [12], the error of the order of 1° was considered satisfactory for the purposes of this type of analysis.
Figure 5 compares the AoA from the flight simulator “Sim.rec.” and the test flight estimation from Device 1 data. While the agreement is generally good, there are some discrepancies, mostly exhibited at the time point 22 s when there was a transition from climb to descent. The differences between the simulated and actual flights were likely due to modeling, piloting, and meteorological conditions.
Considering that the AoA in the test flight and the flight simulator were obtained separately, relying on pilot skills to repeat the same maneuver, the overlap of the results is satisfactory when Device 1 was used. During the first 20 s of the maneuver, there is a constant difference of approximately 0.5°, thus nearly equal to the error of the estimation method. The AoA in the test flight is thus basically equal to the respective value in the flight simulator. These findings agree well with the results of the Monte-Carlo simulations of “low sensor noise” presented in Ref. [12]. The error in the AoA estimation does not exceed 1° and the constant error of the method is present in certain flight regimes.
Similar results may be observed in Figure 6 for the data recorded using Device 2 (low-cost device with higher noise).
Higher amplitude and higher frequency noise is present compared to the data obtained from Device 1. For Device 2, the maximum error of the AoA estimation slightly exceeds 1°, in agreement with Monte–Carlo simulations of “high sensor noise” in Ref. [12]. It is worth noting that the mean value of the AoA in the test flight is again slightly lower than the AoA in the flight simulator. Figure 7 shows the AoA recorded by Device 1 and Device 2 and the difference between these two results. The difference between the test flight and the flight simulator results “Sim.rec.” was neglected, so it was possible to accurately compare the characteristics of the data on two devices using “Sim.rec.”, which is shown in Figure 5 and Figure 6 for “Device 1” and “Device 2”, respectively.
The mean difference and maximal deviation between the AoA in the test flight “Device 1” and “Device 2” and the flight simulator “Sim.est.” are shown in Table 3.
On average, the AoA estimation method outputs smaller AoA than the reference AoA value in the simulation. Device 2 is characterized by larger data deviation than Device 1, as expected, but the AoA mean value is very well reproduced. Table 3 also presents results for the AoA estimation that neglects the effects of the elevator deflection angle α ^ δ E and the pitch rate α ^ q in Equation (6).

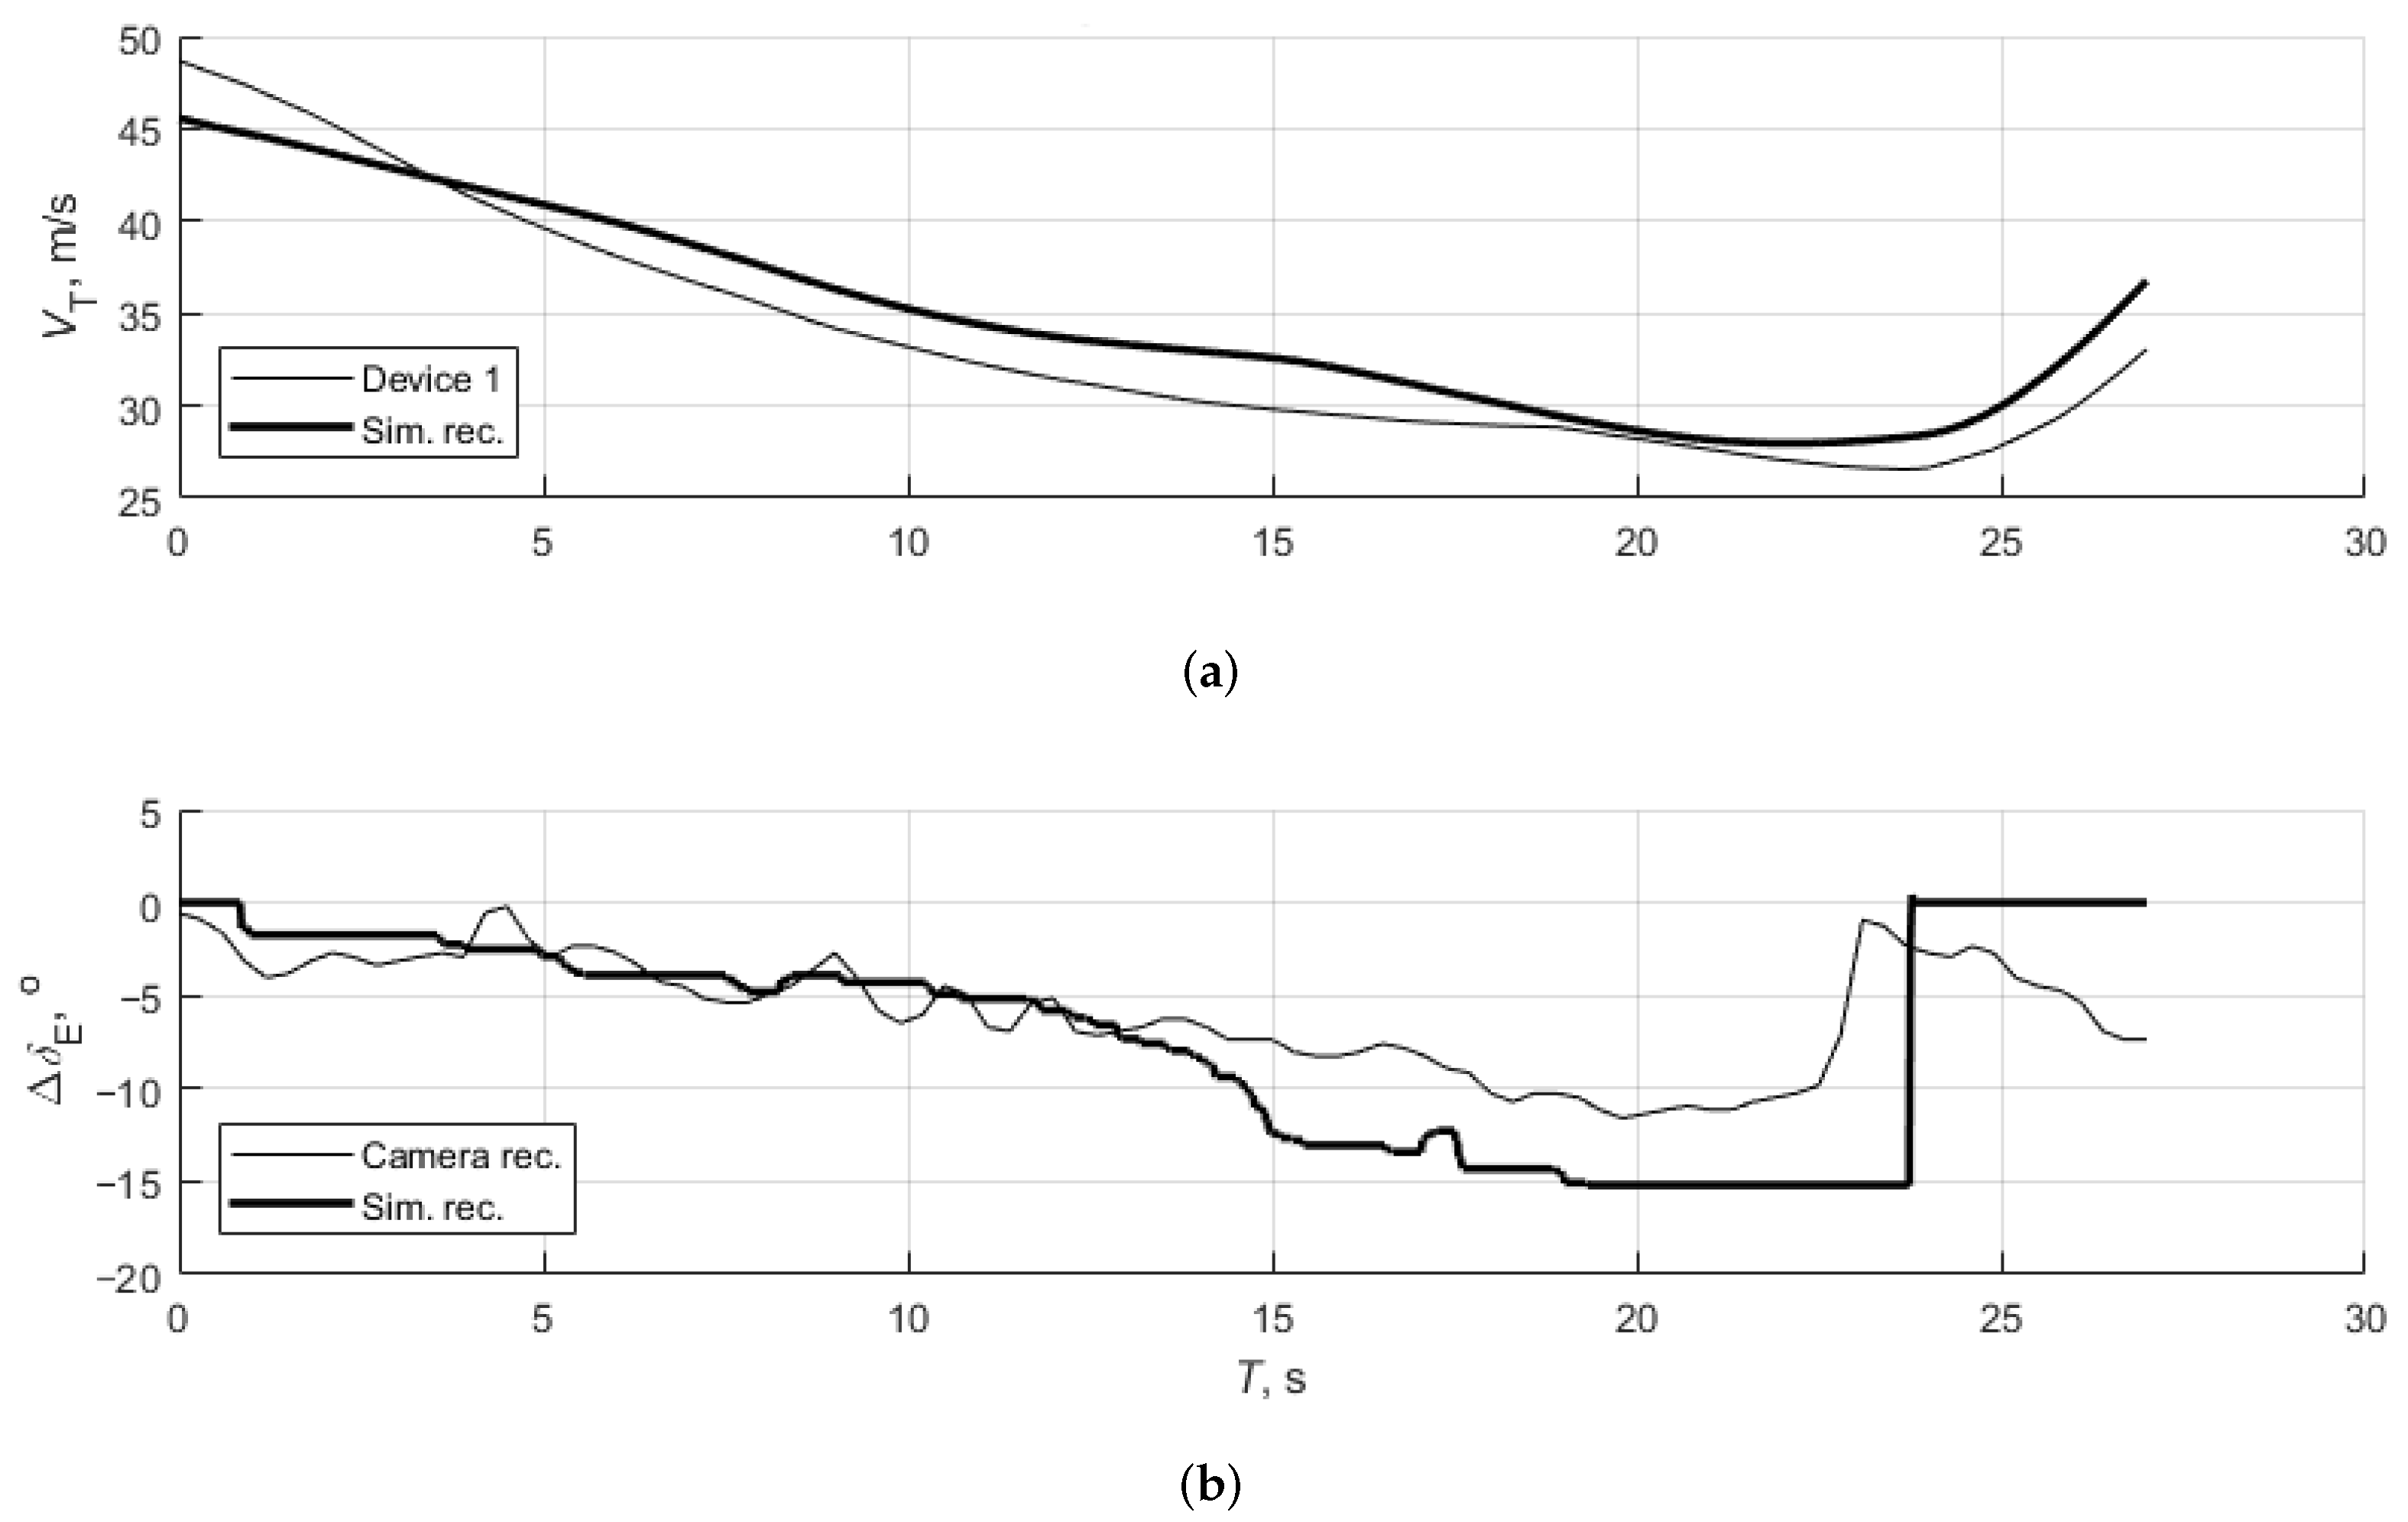
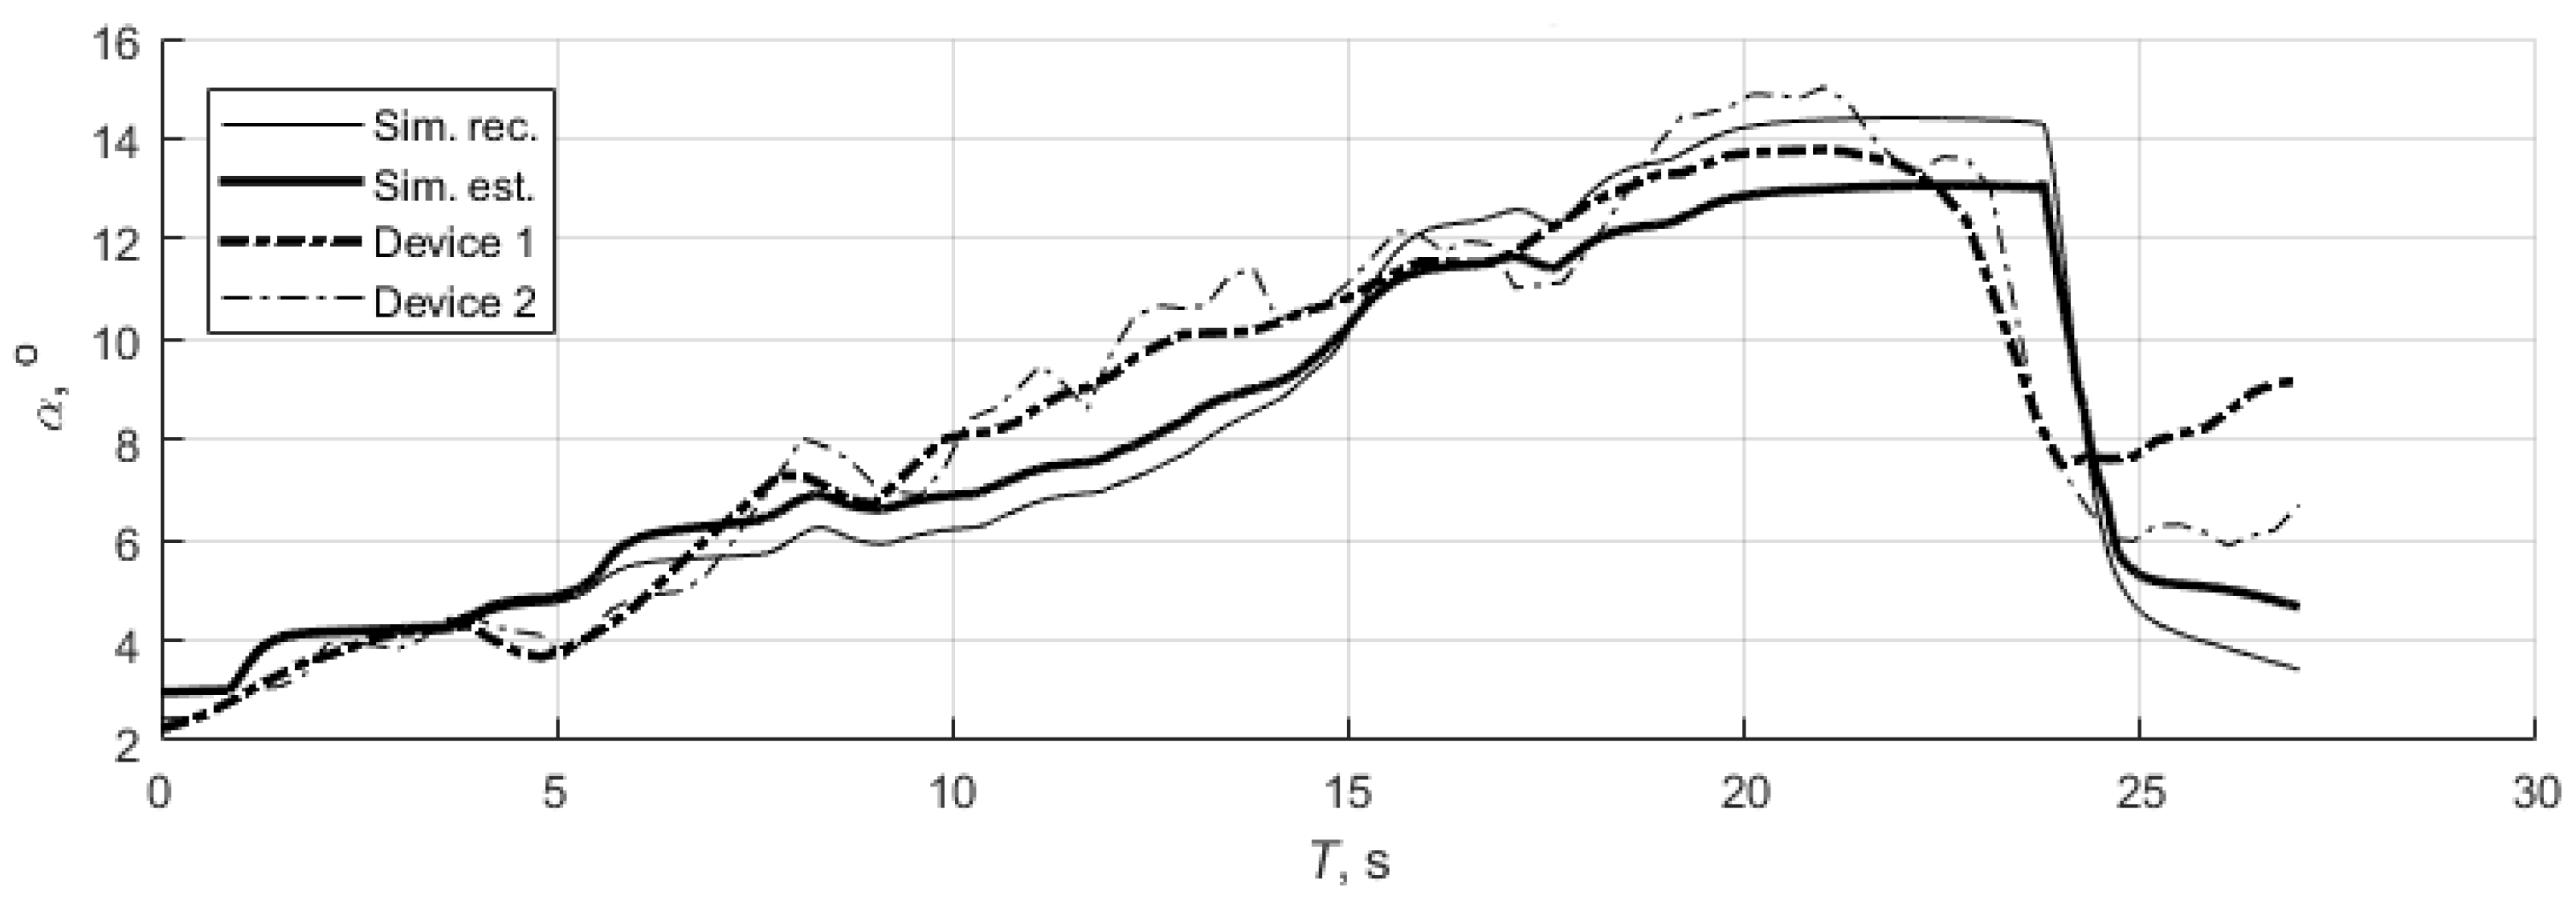
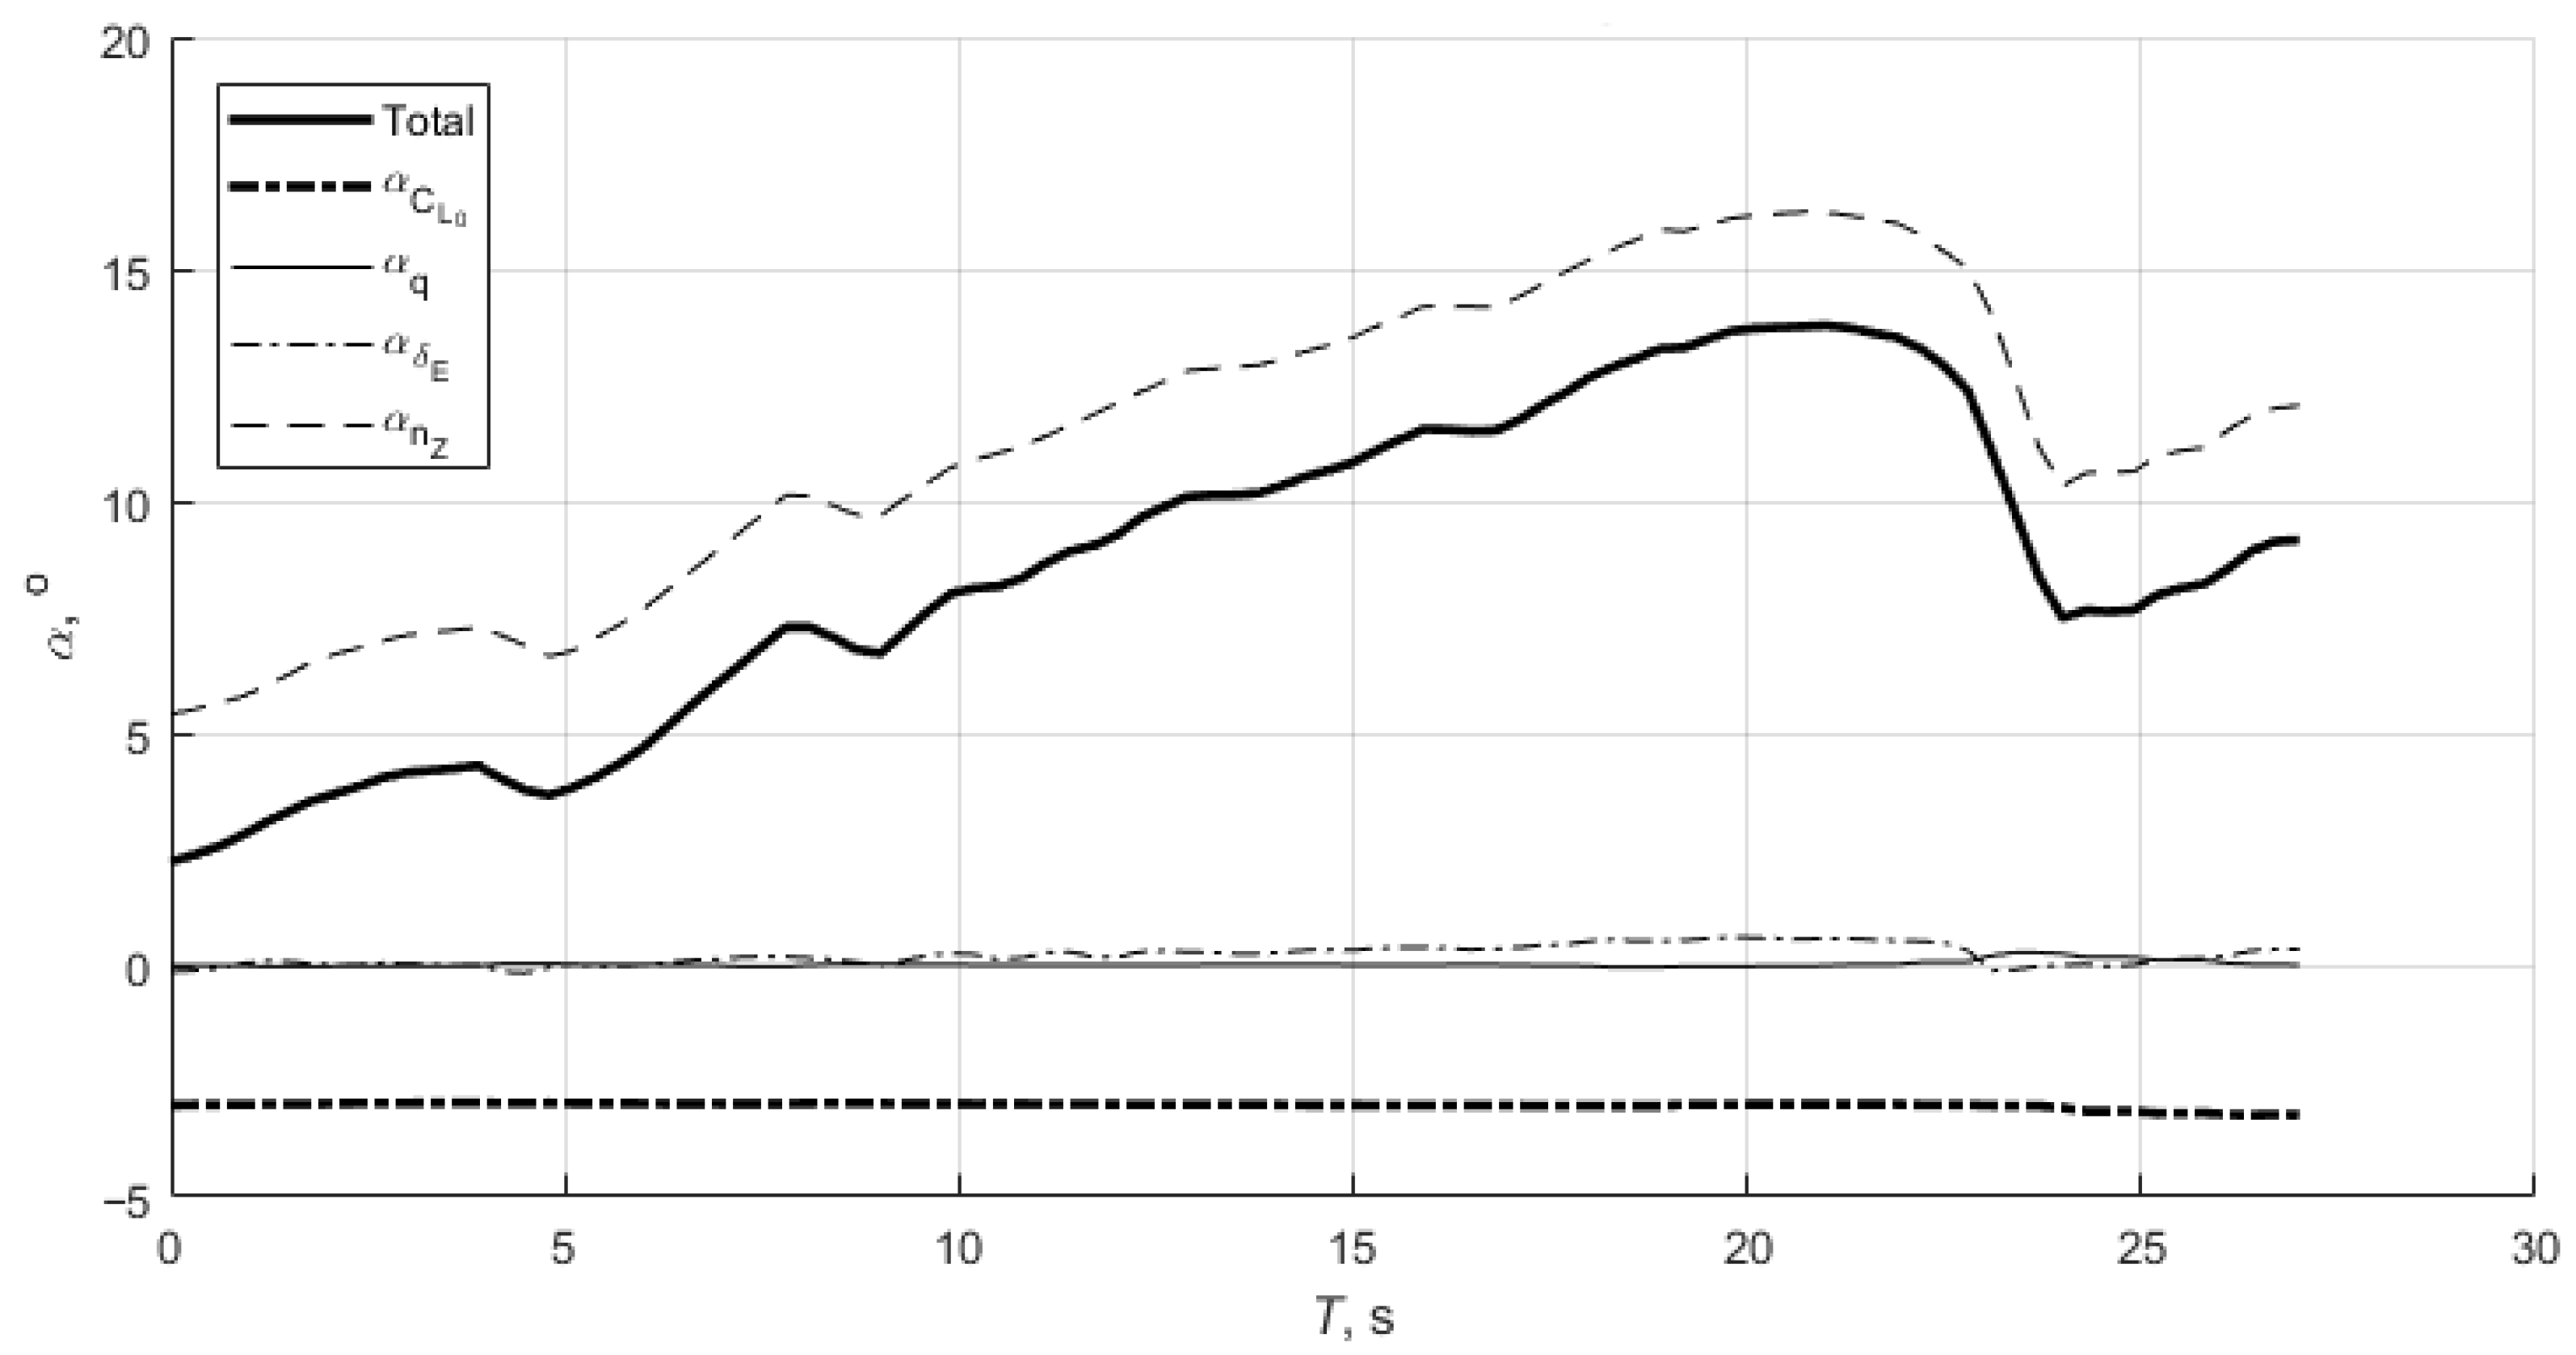
3.2. Test 2: Stall with Idle Power

The second maneuver analyzed is stall with idle power, Figure 8. The aircraft was brought into horizontal straight flight at a speed of 51 m/s at an altitude of 915 m. The throttle was subsequently reduced while the vertical speed was zero. The result was a decrease in airspeed (Figure 8a) and accordingly an increase in the AoA (Figure 9). At the time the aircraft was approaching the critical AoA, the aircraft was put into dive to reduce the AoA and to increase the airspeed. It was not allowed to let the aircraft enter the full stall regime for safety reasons. In the flight simulator, however, the aircraft was allowed to reach the full stall regime before pressure on the control column was released.
Figure 9 shows the flight simulator recordings “Sim.rec.”, AoA estimation from flight simulation “Sim.est.”, and the test flight estimations “Device 1” and “Device 2” recorded with the respective devices.
There is very good agreement in this test, too. The difference of the AoA in the test flight and the flight simulator is negligible at the beginning of this maneuver, and subsequently increases to its maximum of approximately 1.5° before entering the stall.
In order to investigate to what extent each term of the Equation (6) influences the AoA estimation, a representation of the quantities influencing the final result was made. Figure 10 shows the AoA estimation according to the data recorded by Device 1.
The α ^ n z term related to the acceleration in the z direction proved to have the greatest influence on the angle of attack. α ^ C L 0 also has a significant influence, while α ^ δ E and α ^ q do not substantially contribute to the final result. Table 4 presents the stall AoA, while it also shows an effect on the stall AoA estimation caused by neglecting the members in Equation (6) due to the elevator deflection angle α ^ δ E and due to the pitch rate α ^ q .
Based on these results, we propose a simplification of the AoA estimation given in Equation (1) that neglects the effect of the elevator deflection angle δ E and the pitch rate q:
α ^ = C L 0 q ¯ S W n z C L α q ¯ S W n x .
It is clear that the deviation is significantly greater for this maneuver than for the steady climb and descent maneuver, which yielded smaller values of the AoA. The largest difference is in the flight simulator, while Devices 1 and 2 exhibit a smaller difference from the reference value. This is likely due to the lower accuracy of the 6DOF model in the stall regime because the aircraft can fly at higher AoA than predicted in the flight simulator. Given that the main purpose of the SS was enhancing flight safety by providing the pilot with information about the AoA, the pilot should not reach the stall angle predicted in the flight simulator.

4. Concluding Remarks

A flight data recording method was designed. This was performed using two devices characterized by substantially different characteristics. The test flight was conducted along with the flight simulator modeling. The test flight data were compared to the respective flight simulator data to make an estimation of the AoA obtained from two different devices.
Several important findings emerged from this work. In particular, the developed 6DOF flight model implemented in the flight simulator satisfactorily mimics the aircraft behavior. Nevertheless, when the aircraft is brought to the full stall regime, this 6DOF model exhibits some drawbacks. During steady horizontal flight with a low AoA, a satisfactory AoA estimate is obtained from all the approaches taken. The developed approach proved less accurate in the stall regime, but even then, the data may be useful to the pilot. These results clearly indicate that the AoA estimation method proposed in Ref. [12] is applicable using the data recorded in a real flight. It is also important to note that less expensive SS provide equally accurate results compared to high-quality certified equipment. This approach based on both the test flight and computational model allows for the validation and further enhancement of the computational model reported in Ref. [12].
To reduce the complexity of the aircraft equipment, the effect of neglecting the elevator deflection and angular pitch rate on the AoA estimation was studied as well, for two flight regimes typical for general aviation aircraft. Neglecting these data and estimating AoA according to Equation (7) did not significantly change the AoA estimate according to the original approach given in Equation (1) but reduced the safety margins when approaching stall. A suitable solution for this issue may be to assume an elevator deflection that creates the maximum increase in the AoA, so the AoA estimation achieves higher values.
In the future, it would be important to use all pilot control inputs performed during the test flight also in the flight simulation. Along with the improvement of the simulator flight model data according to the identification techniques from the flight test, this will minimize the discrepancy between the test and simulated flight and the respective dependence on pilot skills. Further work is encouraged regarding a detailed analysis of the proposed simplification for general aviation aircraft in various flight regimes and conditions.

Author Contributions

Conceptualization, M.V. and H.K.; methodology, M.I. and M.V.; software, M.I. and M.A.; validation, M.I.; formal analysis, M.I.; investigation, M.I.; resources, M.A.; writing—original draft preparation, M.I.; writing—review and editing, H.K.; supervision, M.V. All authors have read and agreed to the published version of the manuscript.

Funding

This research received no external funding.

Institutional Review Board Statement

Not applicable.

Informed Consent Statement

Not applicable.

Data Availability Statement

Not applicable.

Conflicts of Interest

The authors declare no conflict of interest.

References

  1. Treaster, A.L.; Yocum, A.M. The Calibration and Application of Five-Hole Probes; Technical Report NAVSEA TM 78-10; Pennsylvania State Univ University Park Applied Research Lab: State Collage, PA, USA, 1978. [Google Scholar]
  2. Lerro, A.; Battipede, M. Safety Analysis of a Certifiable Air Data System Based on Synthetic Sensors for Flow Angle Estimation. Appl. Sci. 2021, 11, 3127. [Google Scholar] [CrossRef]
  3. Lie, F.A.P. Synthetic Air Data Estimation: A Case Study of Model-Aided Estimation. Ph.D. Thesis, University of Minnesota, Minneapolis, MN, USA, 2014. [Google Scholar]
  4. Lerro, A.; Gili, P.; Pisani, M. Verification in Relevant Environment of a Physics-Based Synthetic Sensor for Flow Angle Estimation. Electronics 2022, 11, 165. [Google Scholar] [CrossRef]
  5. Lerro, A.; Brandl, A.; Battipede, M.; Gili, P. A Data-Driven Approach to Identify Flight Test Data Suitable to Design Angle of Attack Synthetic Sensor for Flight Control Systems. Aerospace 2020, 7, 63. [Google Scholar] [CrossRef]
  6. Tian, P.; Chao, H.; Rhudy, M.; Gross, J.; Wu, H. Wind Sensing and Estimation Using Small Fixed-Wing Unmanned Aerial Vehicles: A Survey. J. Aerosp. Inf. Syst. 2021, 18, 132–143. [Google Scholar] [CrossRef]
  7. Lie, F.A.P.; Gebre-Egziabher, D. Synthetic Air Data System. J. Aircr. 2013, 50, 1234–1249. [Google Scholar] [CrossRef]
  8. Calia, A.; Denti, E.; Galatolo, R.; Schettini, F. Air Data Computation Using Neural Networks. J. Aircr. 2008, 45, 2078–2083. [Google Scholar] [CrossRef]
  9. Sun, K.; Regan, C.D.; Gebre-Egziabher, D. Observability and Performance Analysis of a Model-Free Synthetic Air Data Estimator. J. Aircr. 2019, 56, 1471–1486. [Google Scholar] [CrossRef]
  10. Lerro, A.; Brandl, A.; Gili, P. Model-Free Scheme for Angle-of-Attack and Angle-of-Sideslip estimation. J. Guid. Control Dyn. 2021, 44, 595–600. [Google Scholar] [CrossRef]
  11. Lerro, A.; Gili, P.; Fravolini, M.L.; Napolitano, M. Experimental Analysis of Neural Approaches for Synthetic Angle-of-Attack Estimation. Int. J. Aerosp. Eng. 2021, 2021, 9982722. [Google Scholar] [CrossRef]
  12. Valasek, J.; Harris, J.; Pruchnicki, S.; McCrink, M.; Gregory, J.; Sizoo, D.G. Derived Angle of Attack and Sideslip Angle Characterization for General Aviation. J. Guid. Control Dyn. 2020, 43, 1039–1055. [Google Scholar] [CrossRef]
  13. General Aviation Joint Steering Committee (GAJSC). Loss of Control Work Group Approach and Landing. 2012. Available online: https://www.gajsc.org/safety-enhancem,ents/loss-of-control/ (accessed on 30 January 2023).
  14. Berndt, J.S. JSBSim: An Open Source, Platform-Independent, Flight Dynamics Model in C++: 2011. Available online: https://jsbsim.sourceforge.net/ (accessed on 30 January 2023).
  15. Basler, M.; Spott, M.; Buchanan, S.; Berndt, J.; Buckel, B.; Ludwicki, R.; Moore, C.; Olson, C.; Perry, D.; Selig, M.; et al. The FlightGear Manual. For FlightGear Version 2020.3.15. 2022. Available online: https://flightgear.sourceforge.net/manual/2020.3/en/getstart-en.html (accessed on 30 January 2023).
Figure 1. Aircraft data during the test flight: (a) altitude H; (b) flight path.
Aerospace 10 00315 g001
Figure 2. The elevator deflection angle during the test flight.
Aerospace 10 00315 g002
Figure 3. Flight parameters for simulator validation: (a) airspeed V T ; (b) altitude H.
Aerospace 10 00315 g003
Figure 4. (a) The recorded AoA “Sim.rec.” and AoA estimated using simulated flight data “Sim.est.”; (b) absolute error of estimate, difference between “Sim.rec.” and “Sim.est.”.
Aerospace 10 00315 g004
Figure 5. The estimated AoA: (a) from the flight simulator “Sim.rec.” and test flight data “Device 1”; (b) absolute difference between the “Sim.rec.” and “Device 1”.
Aerospace 10 00315 g005
Figure 6. The estimated AoA: (a) from the flight simulator “Sim.rec.” and test flight data “Device 2”; (b) absolute difference between the “Sim.rec.” and “Device 2”.
Aerospace 10 00315 g006
Figure 7. The estimated AoA: (a) using Devices 1 and 2; (b) absolute difference between the two.
Aerospace 10 00315 g007
Figure 8. Flight parameters for stall with idle power maneuver from flight simulation “Sim.rec.” and from test flight “Device 1” and “Camera rec.”: (a) airspeed V T ; (b) elevator deflection angle from trim position Δ δ E .
Aerospace 10 00315 g008
Figure 9. The AoA in the test flight and flight simulator in the stall with idle power maneuver.
Aerospace 10 00315 g009
Figure 10. The effect of each term in Equation (6) on the AoA estimated from Device 1.
Aerospace 10 00315 g010
Table 1. Mass characteristics of the Cessna 172N aircraft.
ParameterMass, kg
Empty aircraft693.5
Pilot102
Co-pilot87
Flight engineer87
Equipment5
Initial fuel104
Total take-off mass1079
Table 2. Meteorological data during the test flight.
Wind speed (at 914 m)2.57 m/s
Wind direction (at 914 m, in ref. to N)200°
Air temperature (at 914 m)0 °C
Air pressure (at airfield, 91 m)1010 hPa
Table 3. Mean difference and maximal deviation between the AoA in the test flight (“Device 1” and “Device 2”) and the flight simulator “Sim.est.”, all in reference to “Sim.rec.”.
Data SourceMean Difference and Max. DeviationMean Difference and Max. Deviation without α ^ δ E and α ^ q
Simulation estimation−0.21° ± 0.35°−0.23° ± 0.02°
Device 1 estimation−0.30° ± 0.65°−0.26° ± 0.64°
Device 2 estimation−0.17° ± 1.2°−0.13° ± 1.12°
Table 4. The stall AoA in the test flight and flight simulator in the stall with idle power maneuver.
Data SourceEstimated Stall AoAEstimated Stall AoA without α ^ δ E and α ^ q
Simulation estimation13.1°11.7°
Device 1 estimation13.8°13.2°
Device 2 estimation15.0°14.4°
Simulation recording14.4°
Disclaimer/Publisher’s Note: The statements, opinions and data contained in all publications are solely those of the individual author(s) and contributor(s) and not of MDPI and/or the editor(s). MDPI and/or the editor(s) disclaim responsibility for any injury to people or property resulting from any ideas, methods, instructions or products referred to in the content.

