1. Introduction
Forest fires not only result in financial losses but also threaten natural life, often leading to casualties or property damage. Therefore, it is crucial to make correct decisions when battling forest fires [
1]. With the increasing impact of global warming, it is more important than ever to take new measures against forest fires. While preventive measures are crucial, it is also critical to make the initial attack (IA) as soon as possible after the first ignition [
2]. The strategies of the most successful countries in combating forest fires are based on intervening in fires as soon as possible and preventing them from spreading [
3]. Helicopters are the most effective option for IA, especially in forest areas where terrestrial transportation is difficult. The use of helicopters for IA is widespread worldwide and in Europe. Both their water-carrying capacity and the transportation of the crew to the relevant region are provided by helicopters. Airtankers and helicopters have been one of the most effective means of fighting forest fires since the 1970s, especially when used in the early stages of the fires [
4]. The duration of IA is directly related to the locations of the helicopters. Heliports are used by helicopters to locate the site, land, and take off. Compared to runways, heliports can be built quite easily and cost less. In addition, heliports do not require as many facilities as an airport. Therefore, in countries with enough firefighting helicopters, it is essential to establish heliports that can intervene in the entire forest area in a very short time to use existing aerial resources most efficiently. Minimizing the number of heliports to be constructed will be cost-effective. For this reason, in this study, two multi-objective programming models were developed for the set-covering problem. In the first model, the objectives were the minimization of the number of heliports and the minimization of IA time coverage. In the second model, on the other hand, objectives were the minimization of the number of water sources and the minimization of EA time coverage. Several operational and geographical constraints were also considered. Parameters including forest density, land slope, wetlands, existing facilities, etc. were obtained using geographic information systems (GIS) for the sample of Milas, which is one of the districts in the Muğla Regional Directorate of Forestry in Turkey. Most of the data about the region were obtained from the General Directorate of Forestry (GDF) and the Republic of Turkey Ministry of National Defense General Directorate of Mapping. Only settlement and road data were taken from open sources.
GIS facilitate the management and processing of multi-layered spatial data. The combination of GIS and optimization techniques, on the other hand, may allow for the optimal location of heliports and water sources considering geographical constraints. GIS provides detailed information about the forest density, proximity to roads, existing heliports, restricted zones, the slope of regions, wetlands, and altitude, to identify the most suitable locations for heliports and water sources. Optimization techniques, such as multi-objective programming, can then be used to determine the minimum number of heliports and water sources needed to cover the entire region within the specified response times. Such an approach can help reduce the cost of forest firefighting efforts and improve the effectiveness of IA and EAs on forest fires.
Literature Review
The integration of GIS and mathematical modeling has been widely used in various studies to improve forest fire management. These studies cover a range of topics, from the optimization of the location and allocation of resources to risk assessment and mapping of forest-fire-prone areas. The use of GIS data and mathematical modeling has enabled researchers to identify the key factors that contribute to forest fires and develop effective strategies to mitigate their impact. With the increasing frequency and severity of forest fires worldwide, the insights gained from these studies are crucial in enhancing forest fire management and reducing the risk of damage to lives, property, and the environment. Various studies have integrated geographic information systems (GIS) and mathematical modeling to improve wildfire management. For instance, Aktaş et al. (2013) and Wang et al. (2021) utilized the spatial locations of fire stations in their models [
5,
6], while Yao et al. (2019) provided a comprehensive literature review of similar studies [
7]. From an aviation perspective, Zeferino (2020) explored the distribution of available aerial sources for forest fires [
2], while Akay et al., (2010) assessed the accuracy of aerial resources’ current locations [
8].
Marchi et al. (2014) evaluated the efficiency of helicopter usage in combatting forest fires in Tuscany by comparing two periods (1998–2000 and 2001–2005) with different numbers of allocated helicopters. Their results suggested that reorganizing the location of helicopter bases can increase efficiency [
4]. Similarly, Islam (1998) developed mathematical and simulation models to analyze and improve the performance of IA airtanker systems used by regional fire duty officers [
9]. Calkin et al. (2014) addressed the challenges of determining the cost-effectiveness of alternative airtanker fleets used in wildfire management. They analyzed spatially explicit drop location data to identify the outcomes of fires that received drops during the IA and suggested improvements in data collection and aviation management [
10].
Trethewey (2004) focused on optimizing helicopter deployment for wildfire suppression by developing a comparison index to evaluate helicopter efficiency and using mixed integer programming and a genetic algorithm to assign helicopters to fires while minimizing cost and travel time [
11]. Bookbinder and Martell (1979) presented a time-dependent queueing model of the helitack system used to transport initial-attack crews to forest fires in Ontario. They used numerical methods to estimate its operating characteristics and a dynamic programming model to identify the optimal allocation of helicopters to helitack bases [
12]. Martell (2015) presented a review focused on the use of operational research and management science (OR/MS) methods to address suppression resource management decision support needs, particularly in situations of uncertainty [
13].
Considering the current literature, the integration of GIS and mathematical modeling has significantly contributed to the improvement of forest fire management by providing valuable insights into various aspects of the problem. The current study stands out from the previous literature on optimal heliport locations for emergency responses by specifically addressing the problem of forest fire responses in a heavily forested region in Turkey. It considers the unique characteristics of the study area, such as forest density and topography, and integrates several conditions related to the area into the mathematical model based on GIS. The study uses a multi-objective model to account for the tradeoffs between initial attack times and heliport locations in the first model and water sources and EA in the second model. Furthermore, the study quantifies the potential savings of the proposed model by comparing it to the current locations of helicopters based on historical fire data, providing valuable insights into the real-world impact of optimizing heliport locations for forest fire responses.
Other studies have examined forest fire risk considering various factors. In one of these studies, Gai et al. (2011) developed a risk assessment model that utilized land use, topography, meteorological data, population density, and the value of forest resources to identify, classify, and map wildfire risk areas [
14]. Zhao et al. (2021) created a forest fire risk map for Nanjing Laoshan National Forest Park in China using elevation, aspect, topographic wetness index, slope, distance to roads and populated areas, normalized difference vegetation index, and temperature data [
15]. Bingöl (2017) evaluated the GIS-based forest fire risk of Burdur province in Turkey with vegetation cover, topography, distance to road, and distance to settlement data [
16], while Güvendi and Şişman (2022) determined the forest fire risk of Sakarya Geyve district in Turkey based on tree species, slope, aspect, and proximity to road and settlement [
17]. In addition, Erden and Coşkun (2010) used multi-criteria area selection, an analytical hierarchy model, and geographic information systems to determine the most suitable fire stations for the province of Istanbul based on population density, proximity to main roads, distance to existing fire stations, distance to hazardous material facilities, the density of wooden structures, and distance to areas under earthquake risk [
18]. In the current study, a comprehensive approach was adopted to determine the optimal heliport locations by considering the level of risk associated with forest fires. The forest density of regions, primarily comprising highly vulnerable trees, was considered as a key factor and integrated as a weight parameter to the objective function to prioritize high-risk areas while the optimal heliport locations were determined.
2. Methodology
In this study, a multi-objective programming algorithm is described for addressing the set-covering problem. A case study is used to illustrate the potential benefits of the model. Geographic data from various formal sources are integrated into the mathematical model, and values are analyzed using GIS to provide necessary information for the mathematical model. The objectives of the first model are the minimization of the number of heliports and the minimization of IA time coverage. The objectives are the minimization of the number of water sources and the minimization of EA time coverage in the second model. To account for the tradeoff between these objectives, the epsilon constraint method is used to scalarize them. The model provides several Pareto optimal results for decision makers, and the tradeoff between the objectives is revealed. Finally, the model’s decisions are evaluated by comparing them with historical forest fires and initial and extended attack times.
2.1. Case Study
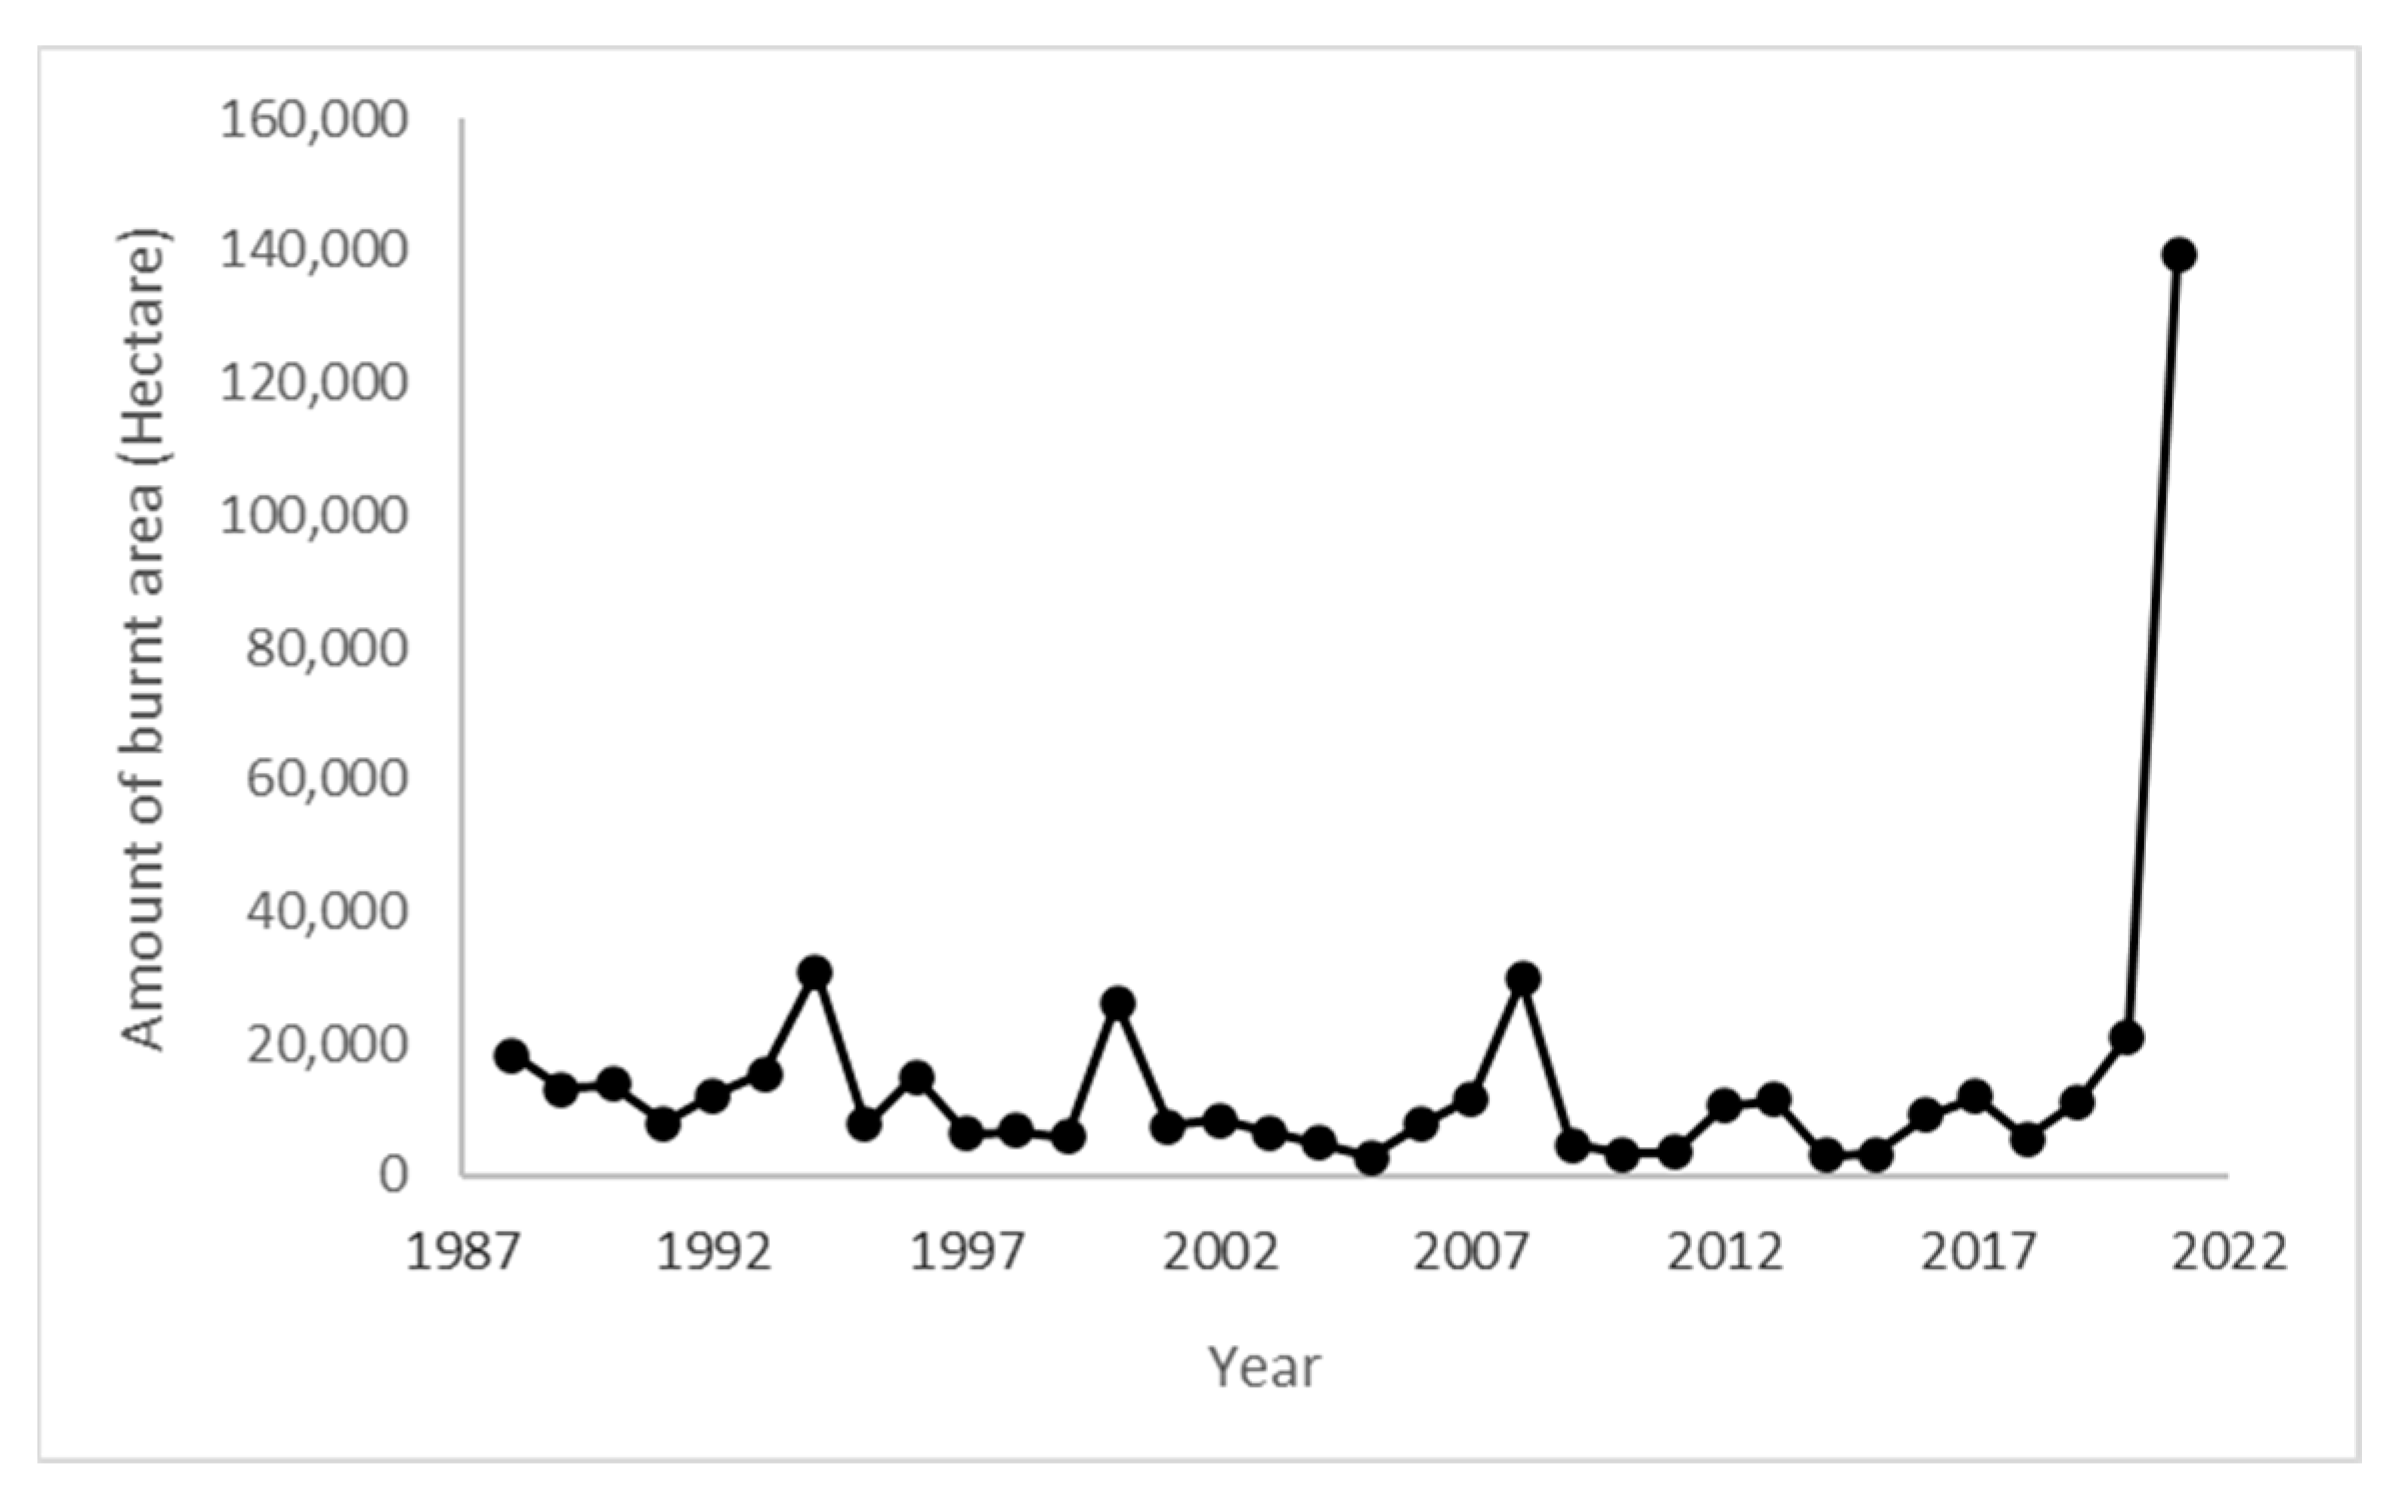
According to data from the General Directorate of Forestry of Turkey (GDF), the maximum annual amount of burned area in Turkey since 1988 was 139 thousand hectares in 2021 (
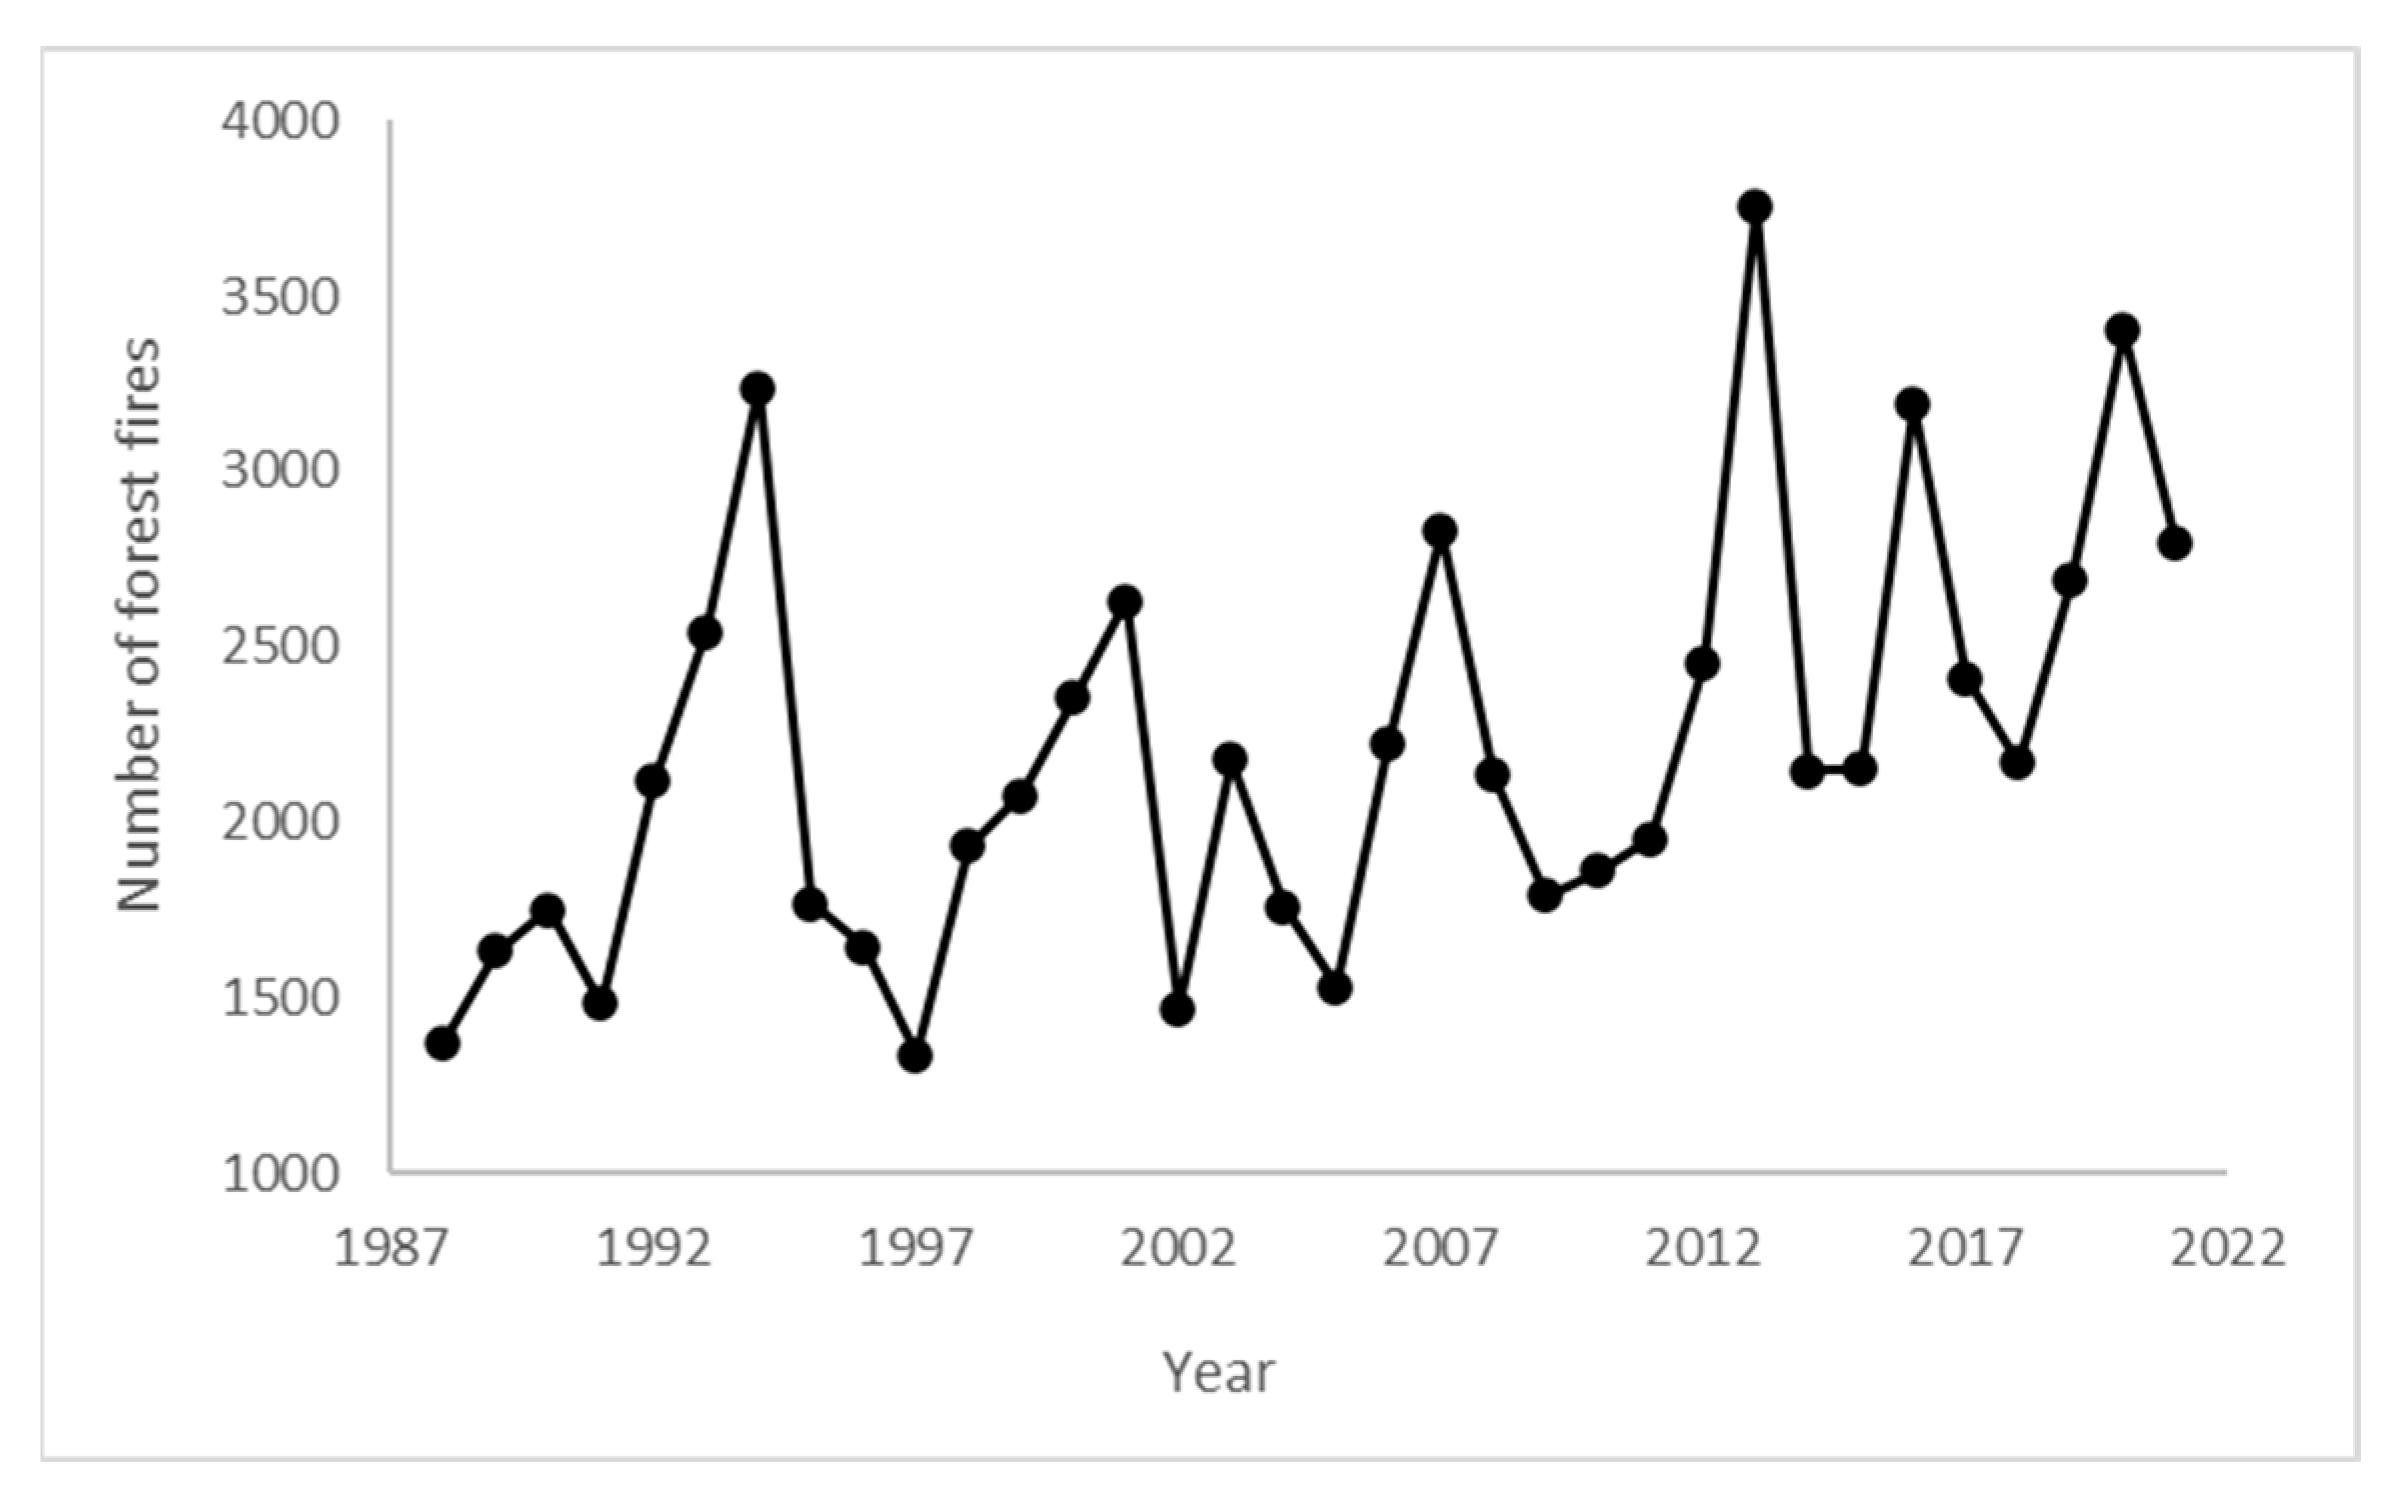
Figure 1). This number is 6.6 times greater than the previous year (2020), and approximately 13 times the annual average between 1988 and 2020 (around 11 thousand hectares). On average, there were about 2181 fires per year until 2020, with the number increasing to 2793 in 2021 (
Figure 2). While the number of fires did not increase significantly as much as burned area, the amount of burned area increased significantly in 2021 [
19]. During July and August of 2021, there were numerous simultaneous forest fires across the country. In recent years, the size of the fires has been more significant than the number of fires.
Studies have shown that the frequency of large fires has increased in the last few decades in many Mediterranean countries [
4]. The fire-prone areas in Turkey also stretch from the eastern Mediterranean coastline to the Marmara region [
8].
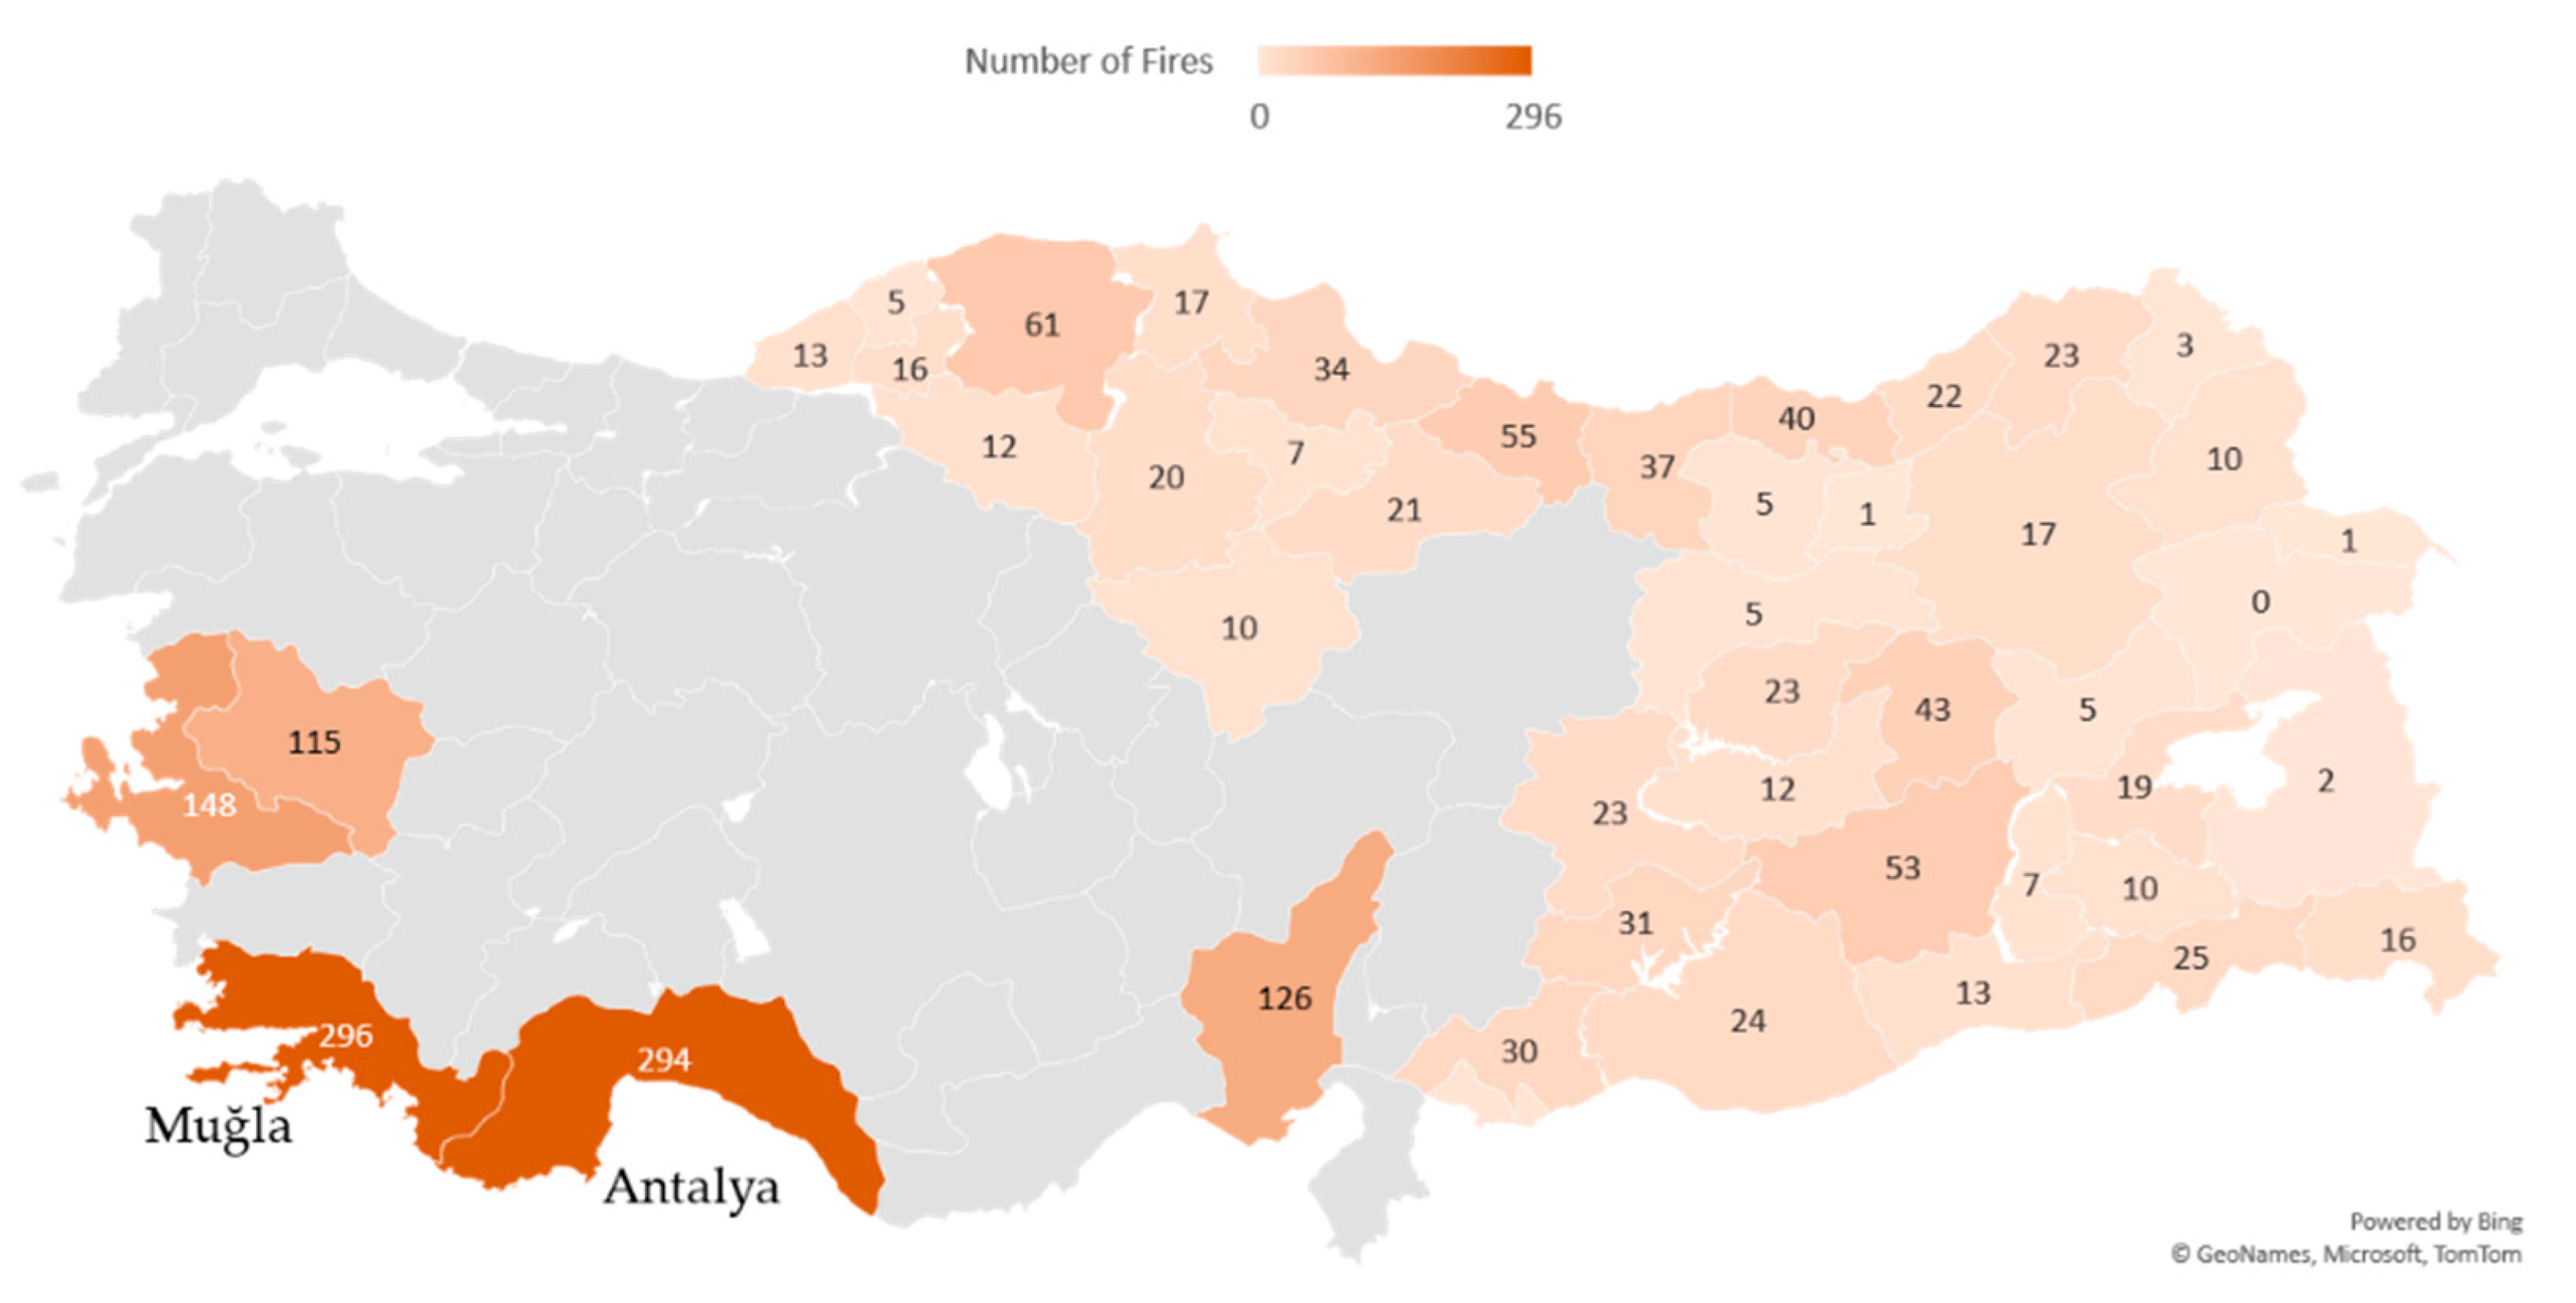
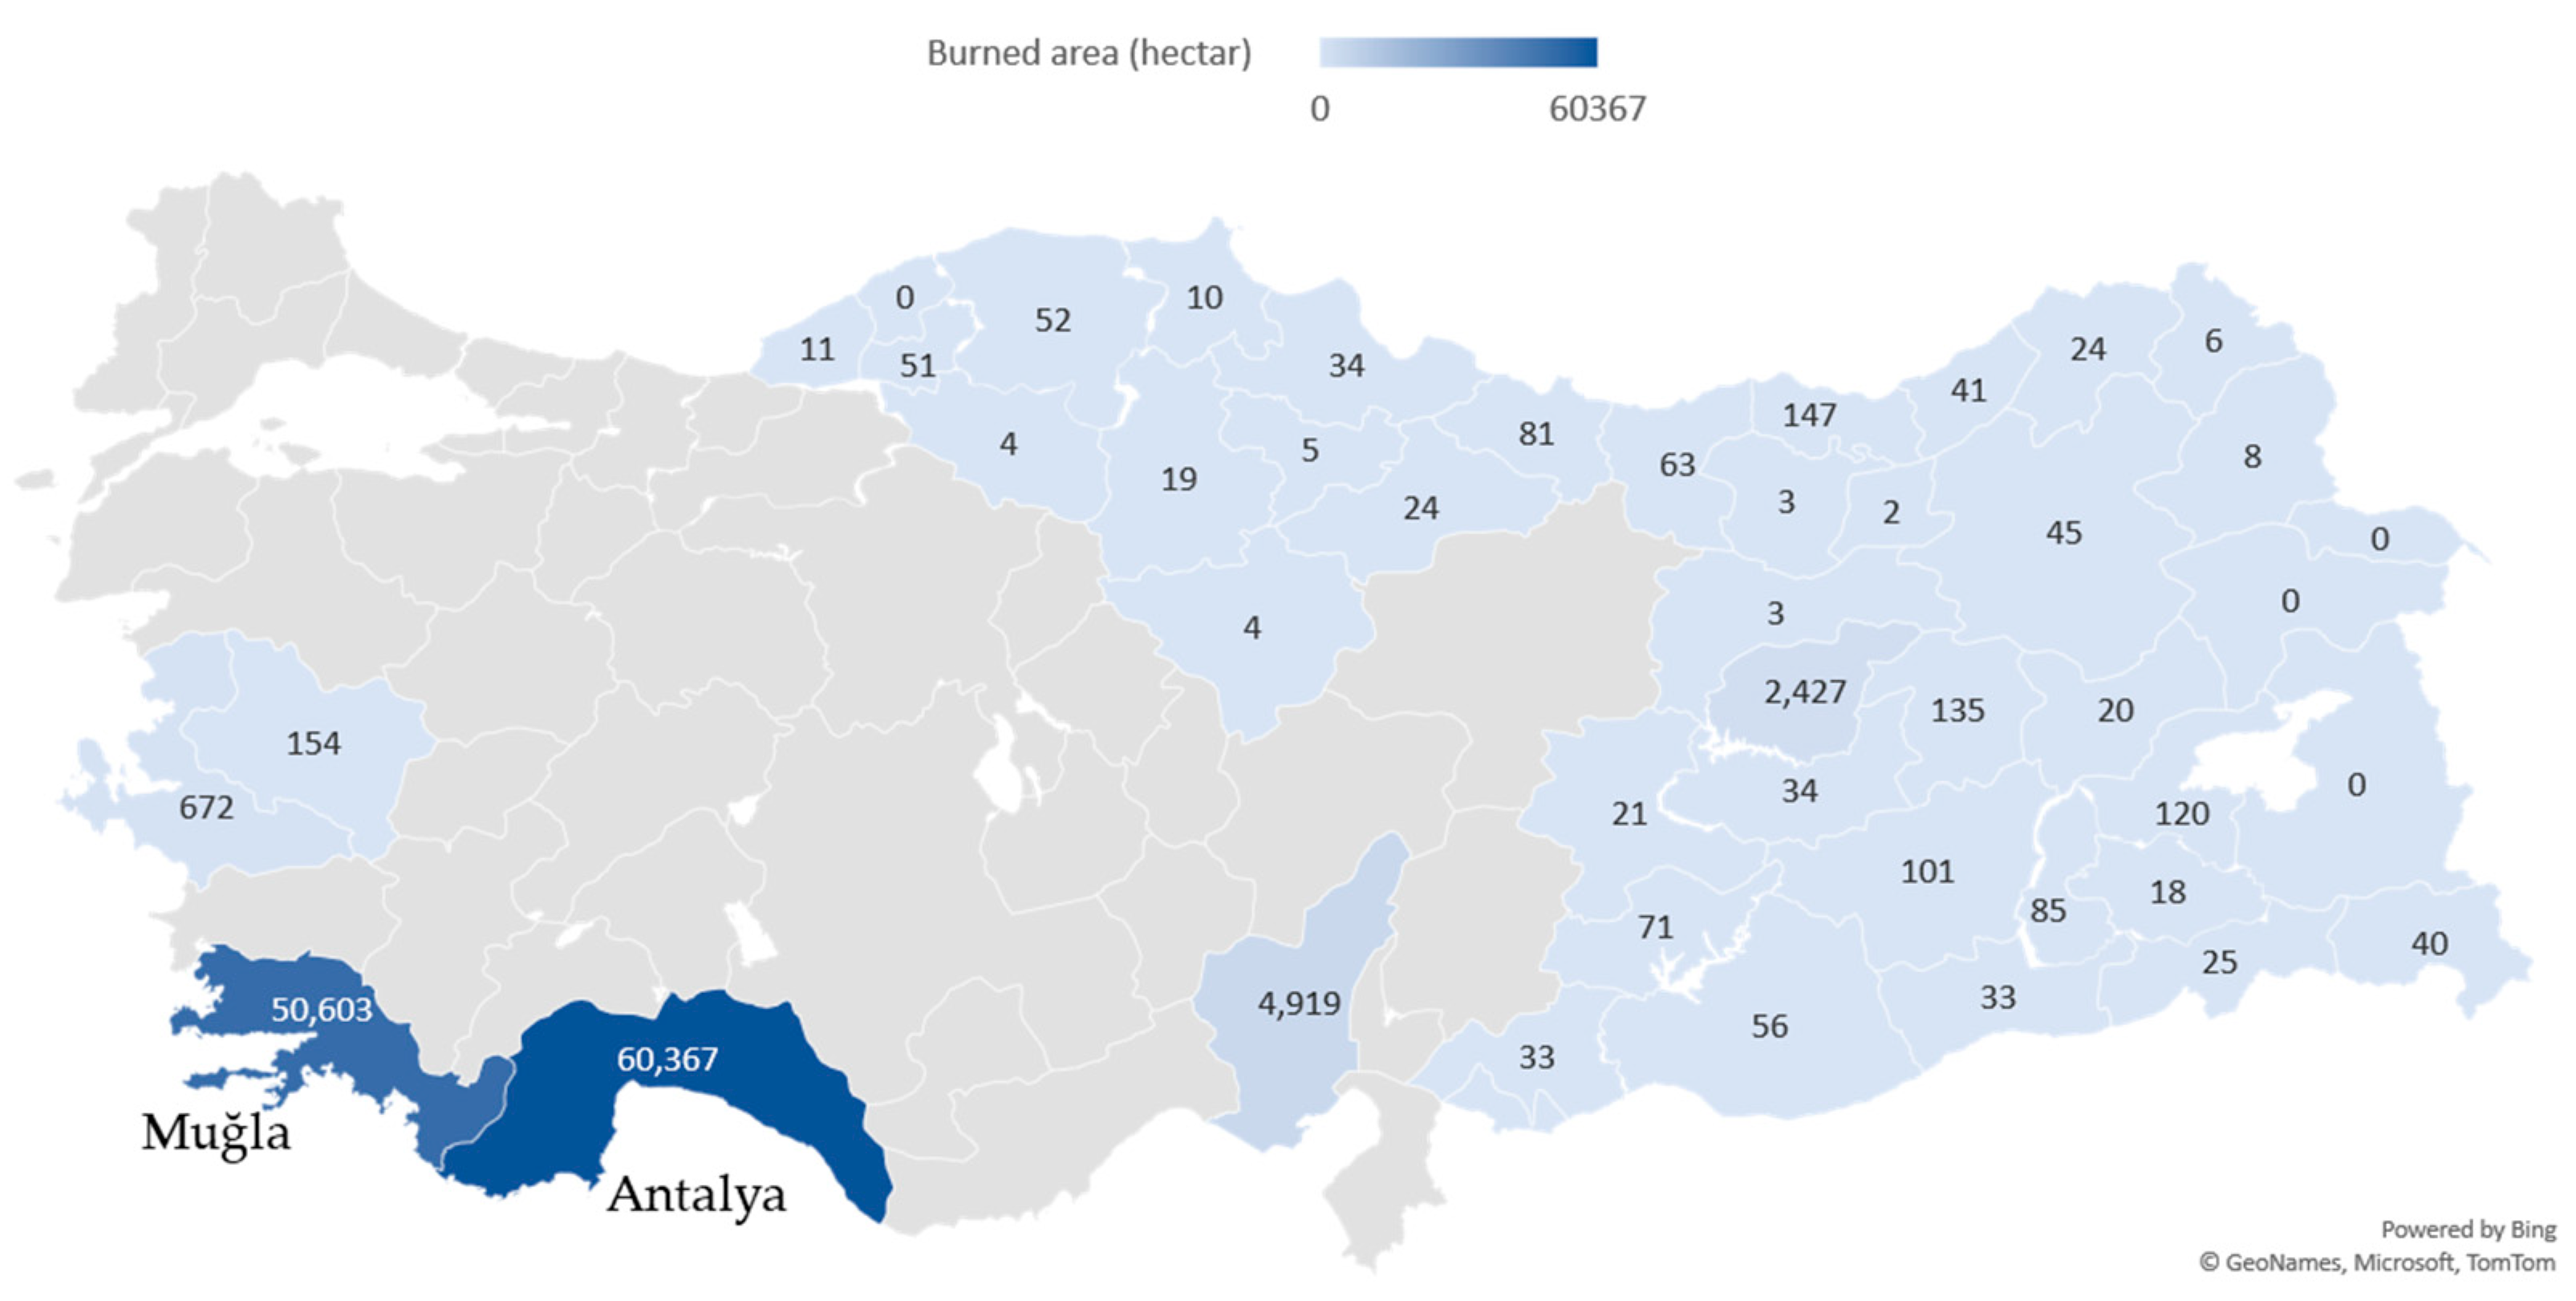
Figure 3 and
Figure 4 show the number of fires and the burned area in 2021 in Turkey, respectively.
As seen in
Figure 4 and
Figure 5, the highest number of fires and burned area occurred in Muğla and Antalya. According to a study that examined forest fire data between 1937 and 2003, Muğla regional directorate has the highest average number of forest fires, with an average of 268 forest fires occurring in the region each year [
3]. In addition, according to a study conducted in 2021, the province with the highest forest density in Turkey is Muğla with 68% [
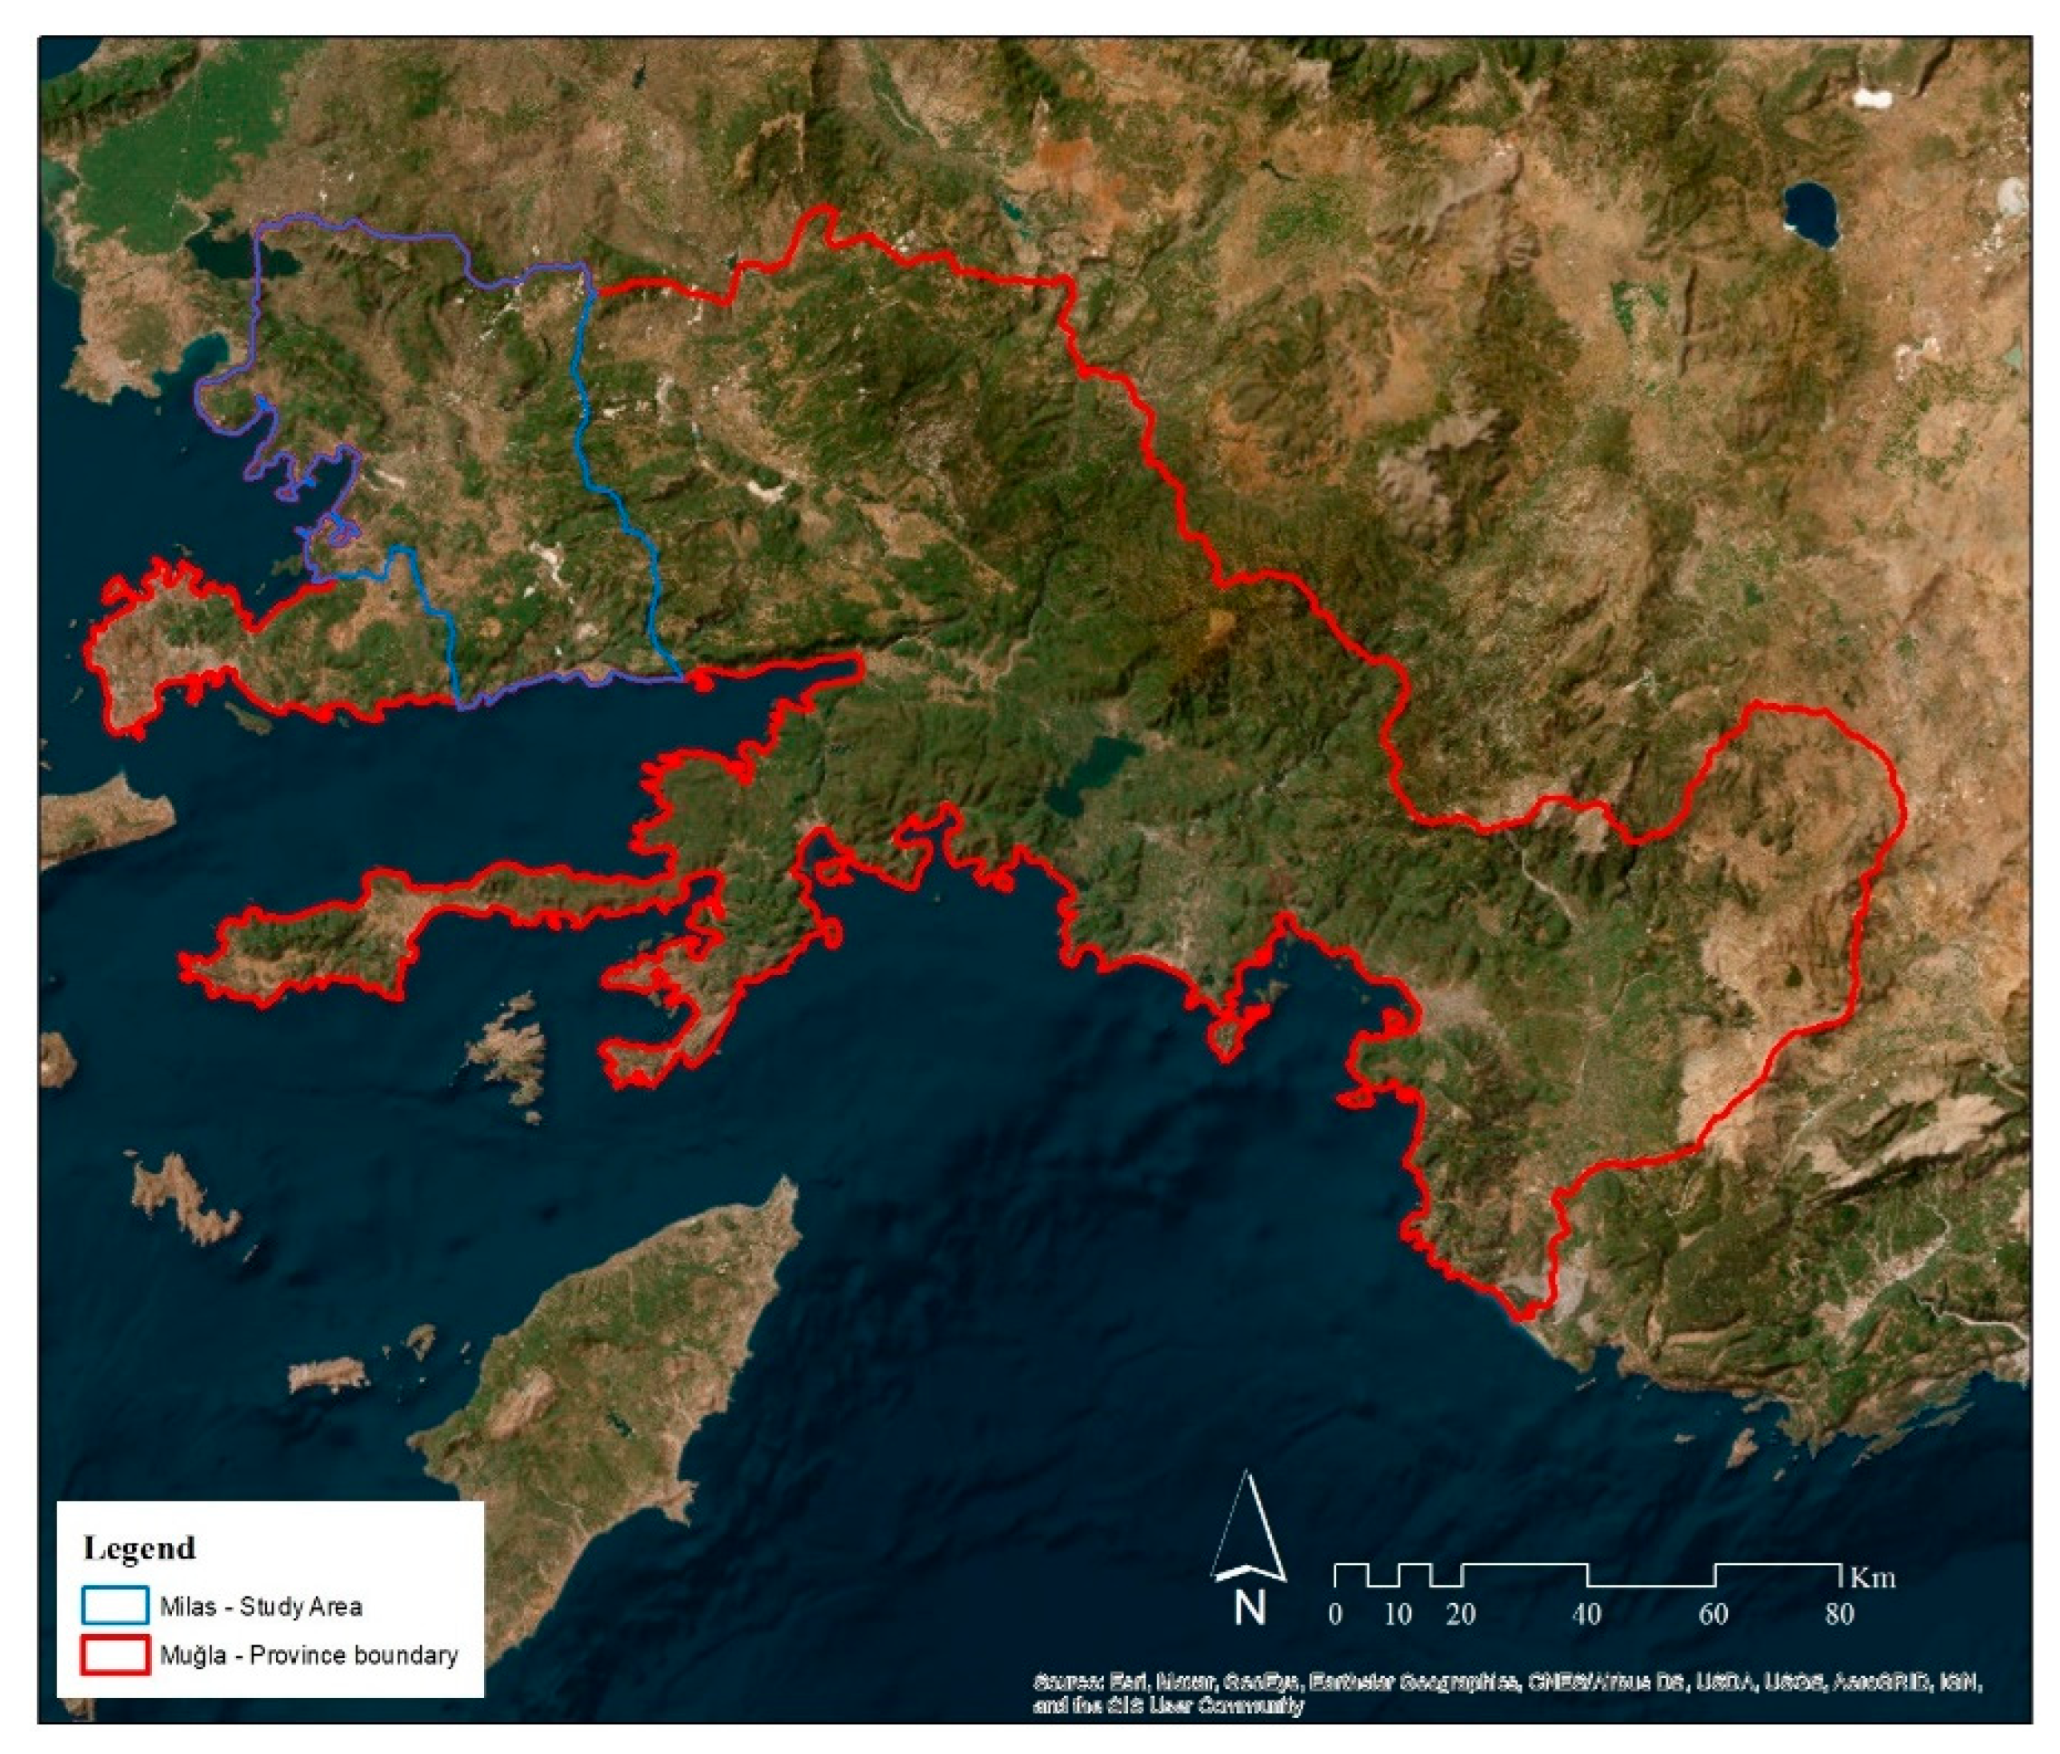
20]. Milas, on the other hand, is a district of the Muğla province located between 37°00′–37°30′ north latitudes and 27°30′–28°30′ east longitudes in southwestern Anatolia (
Figure 5).
The altitude ranges from sea level to 1200 m, and the area has a Mediterranean climate, with hot and dry summers and warm and rainy winters. During the summer, the average temperature ranges from 32° to 34°, sometimes reaching up to 40°. The area’s plant species include red pine (
Pinus brutia) (91.4%), black pine (
Pinus nigra) (2.1%), pine pine (
Pinus pinea) (6.4%), and deciduous plants (0.1%) (e.g., Juniperus (
Juniperus sp.), Walnut (
Junglans sp.), Eucalyptus (
Eucalyptus sp.). The fact that the existing tree species are sensitive to fire and the occurrence of an annual average of 49 forest fires and 294 ha of burned area in these fires between 2000 and 2020 has made the effective management of forest fires in the region particularly important [
21].
Milas district in southwestern Turkey is an important case study for this research due to its high frequency of forest fires, large forest area, and Mediterranean climate, which make it vulnerable to forest fires. The sensitivity of the existing tree species to fire further highlights the need for effective forest firefighting efforts. By examining the set-covering problem in Milas, an effective model for locating heliports and water sources can be developed to support initial and extended attacks on forest fires. The insights gained from this study can be applied to other areas with similar conditions to improve the effectiveness of forest firefighting efforts.
2.2. Data Selection
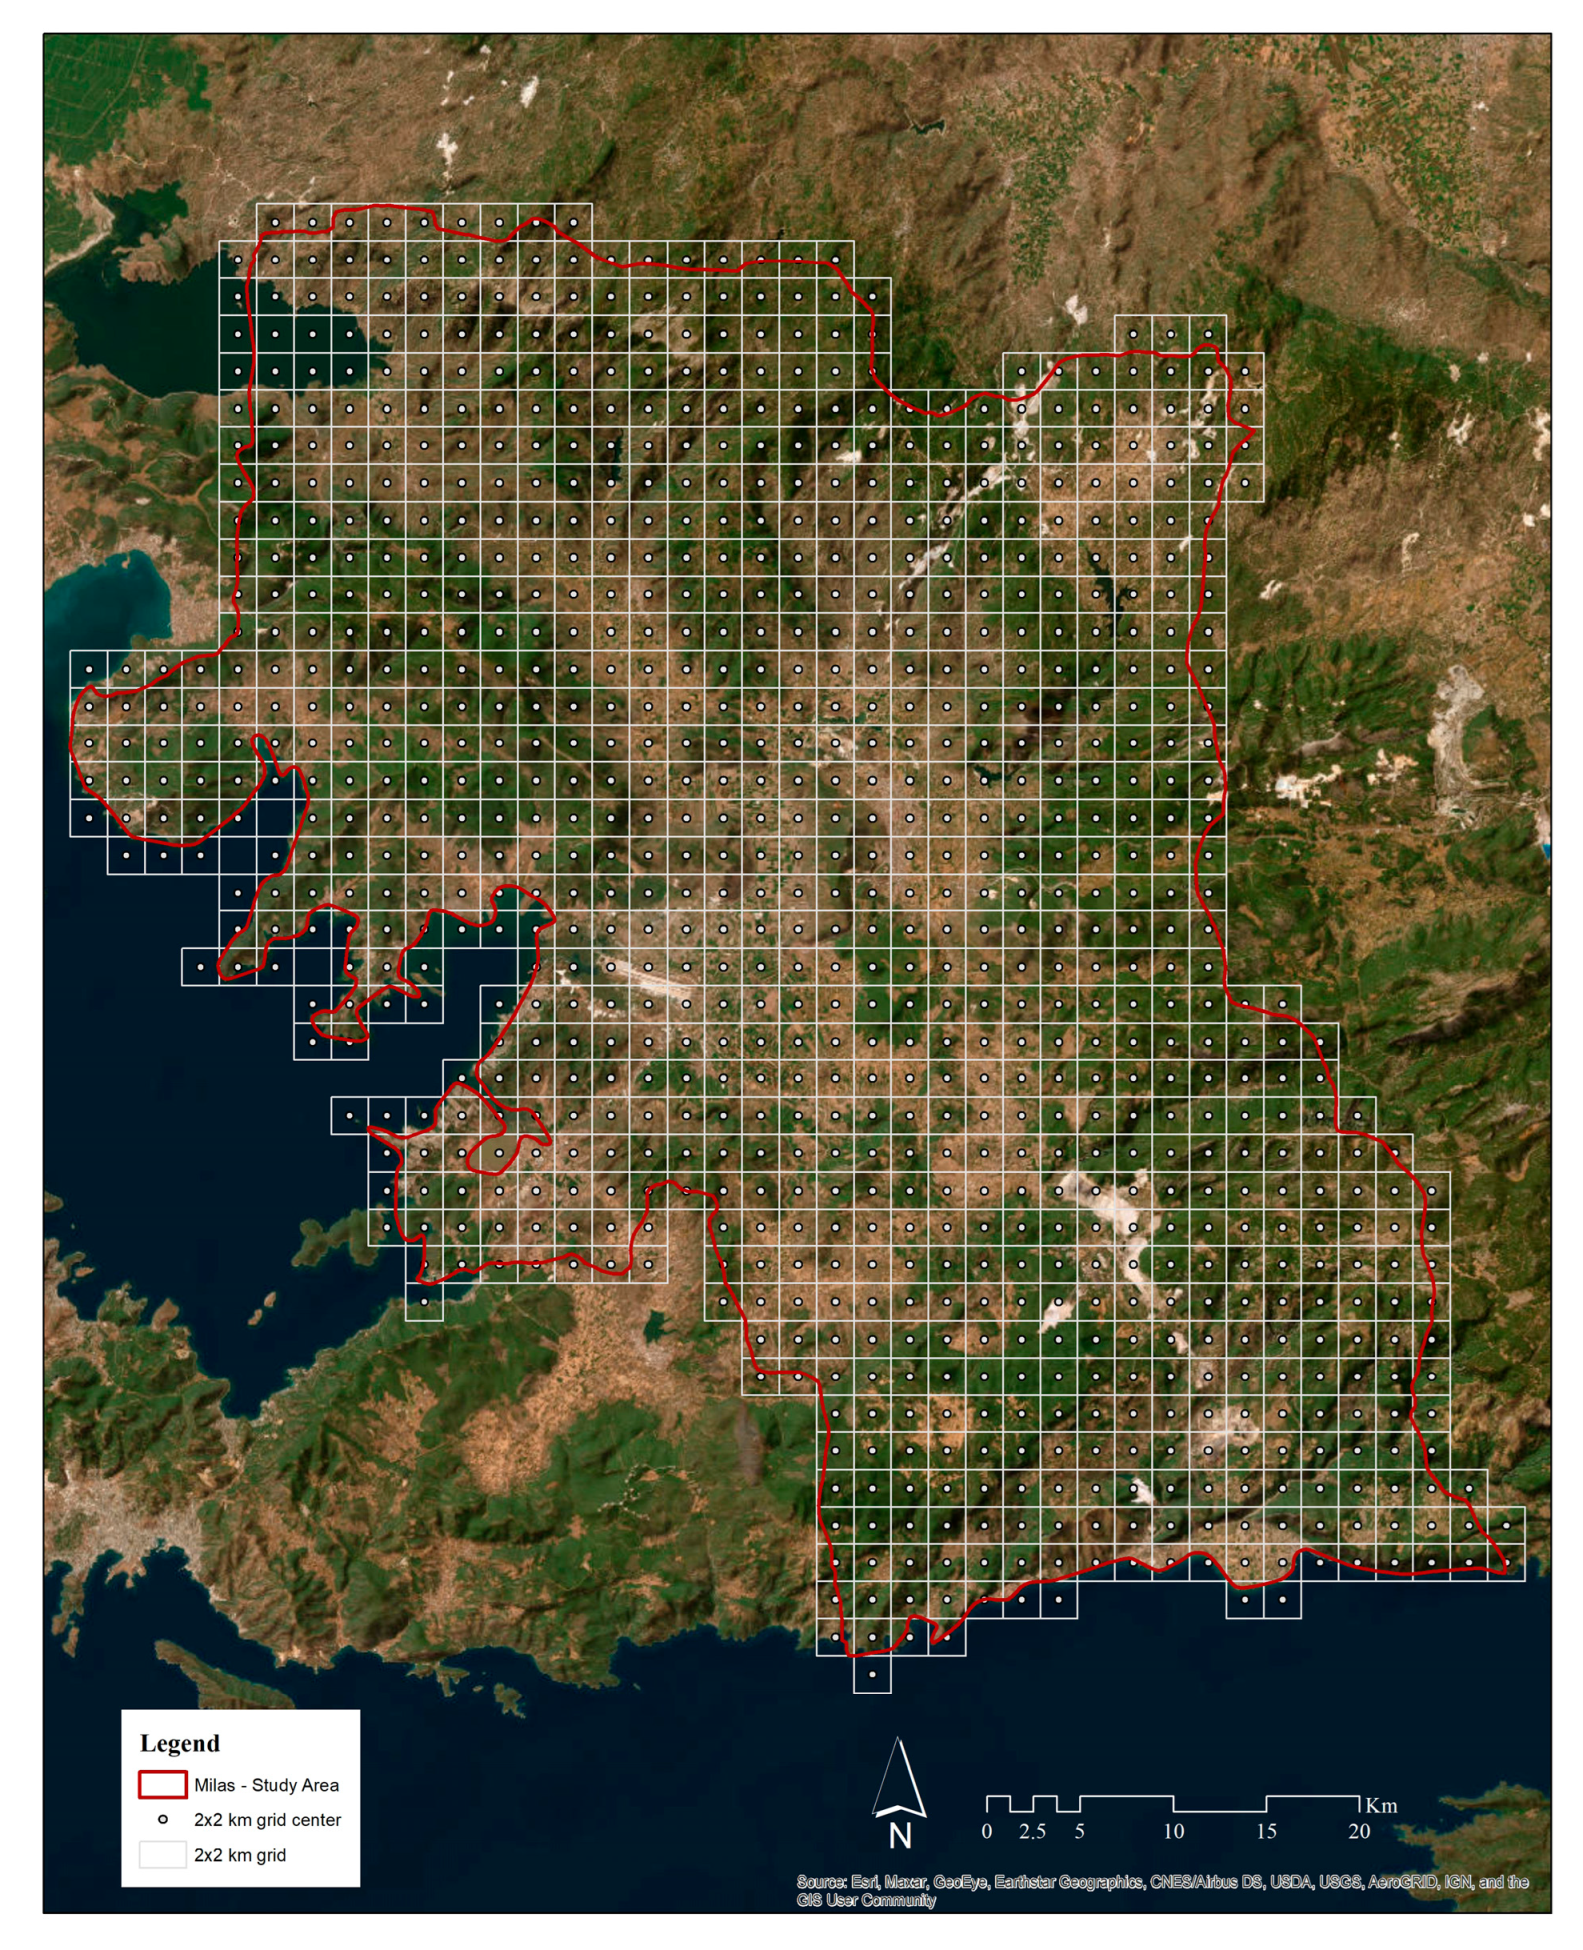
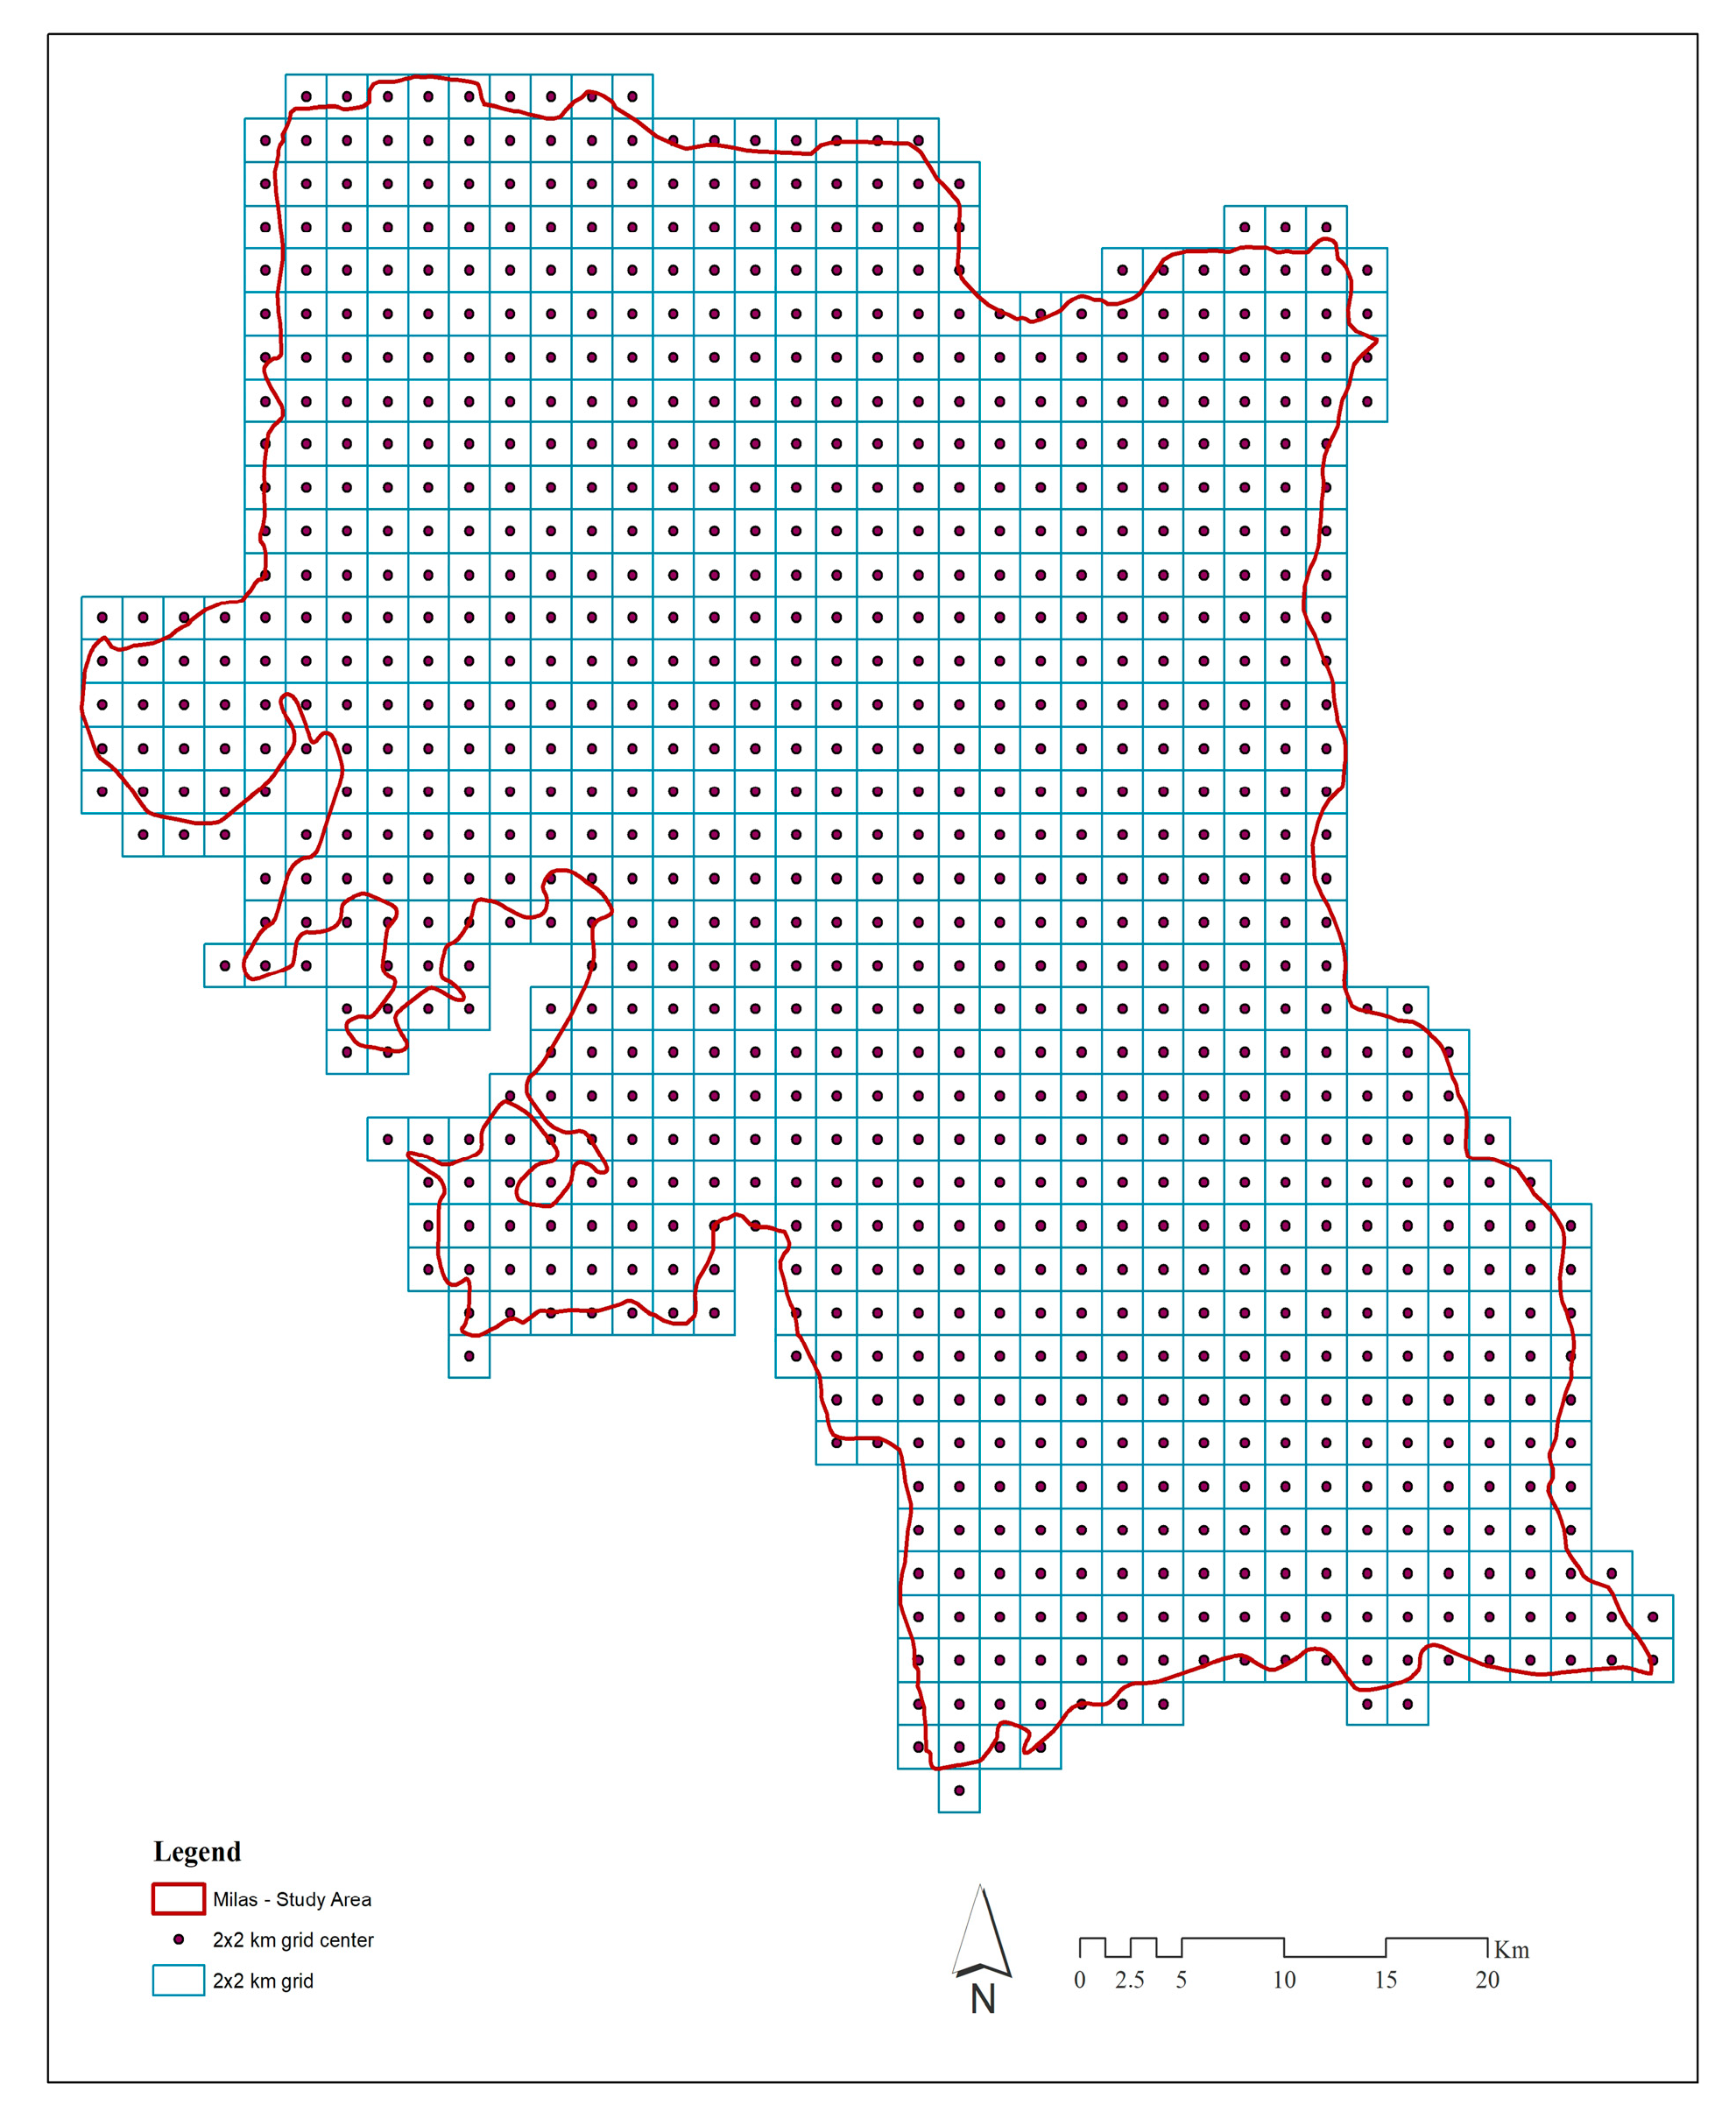
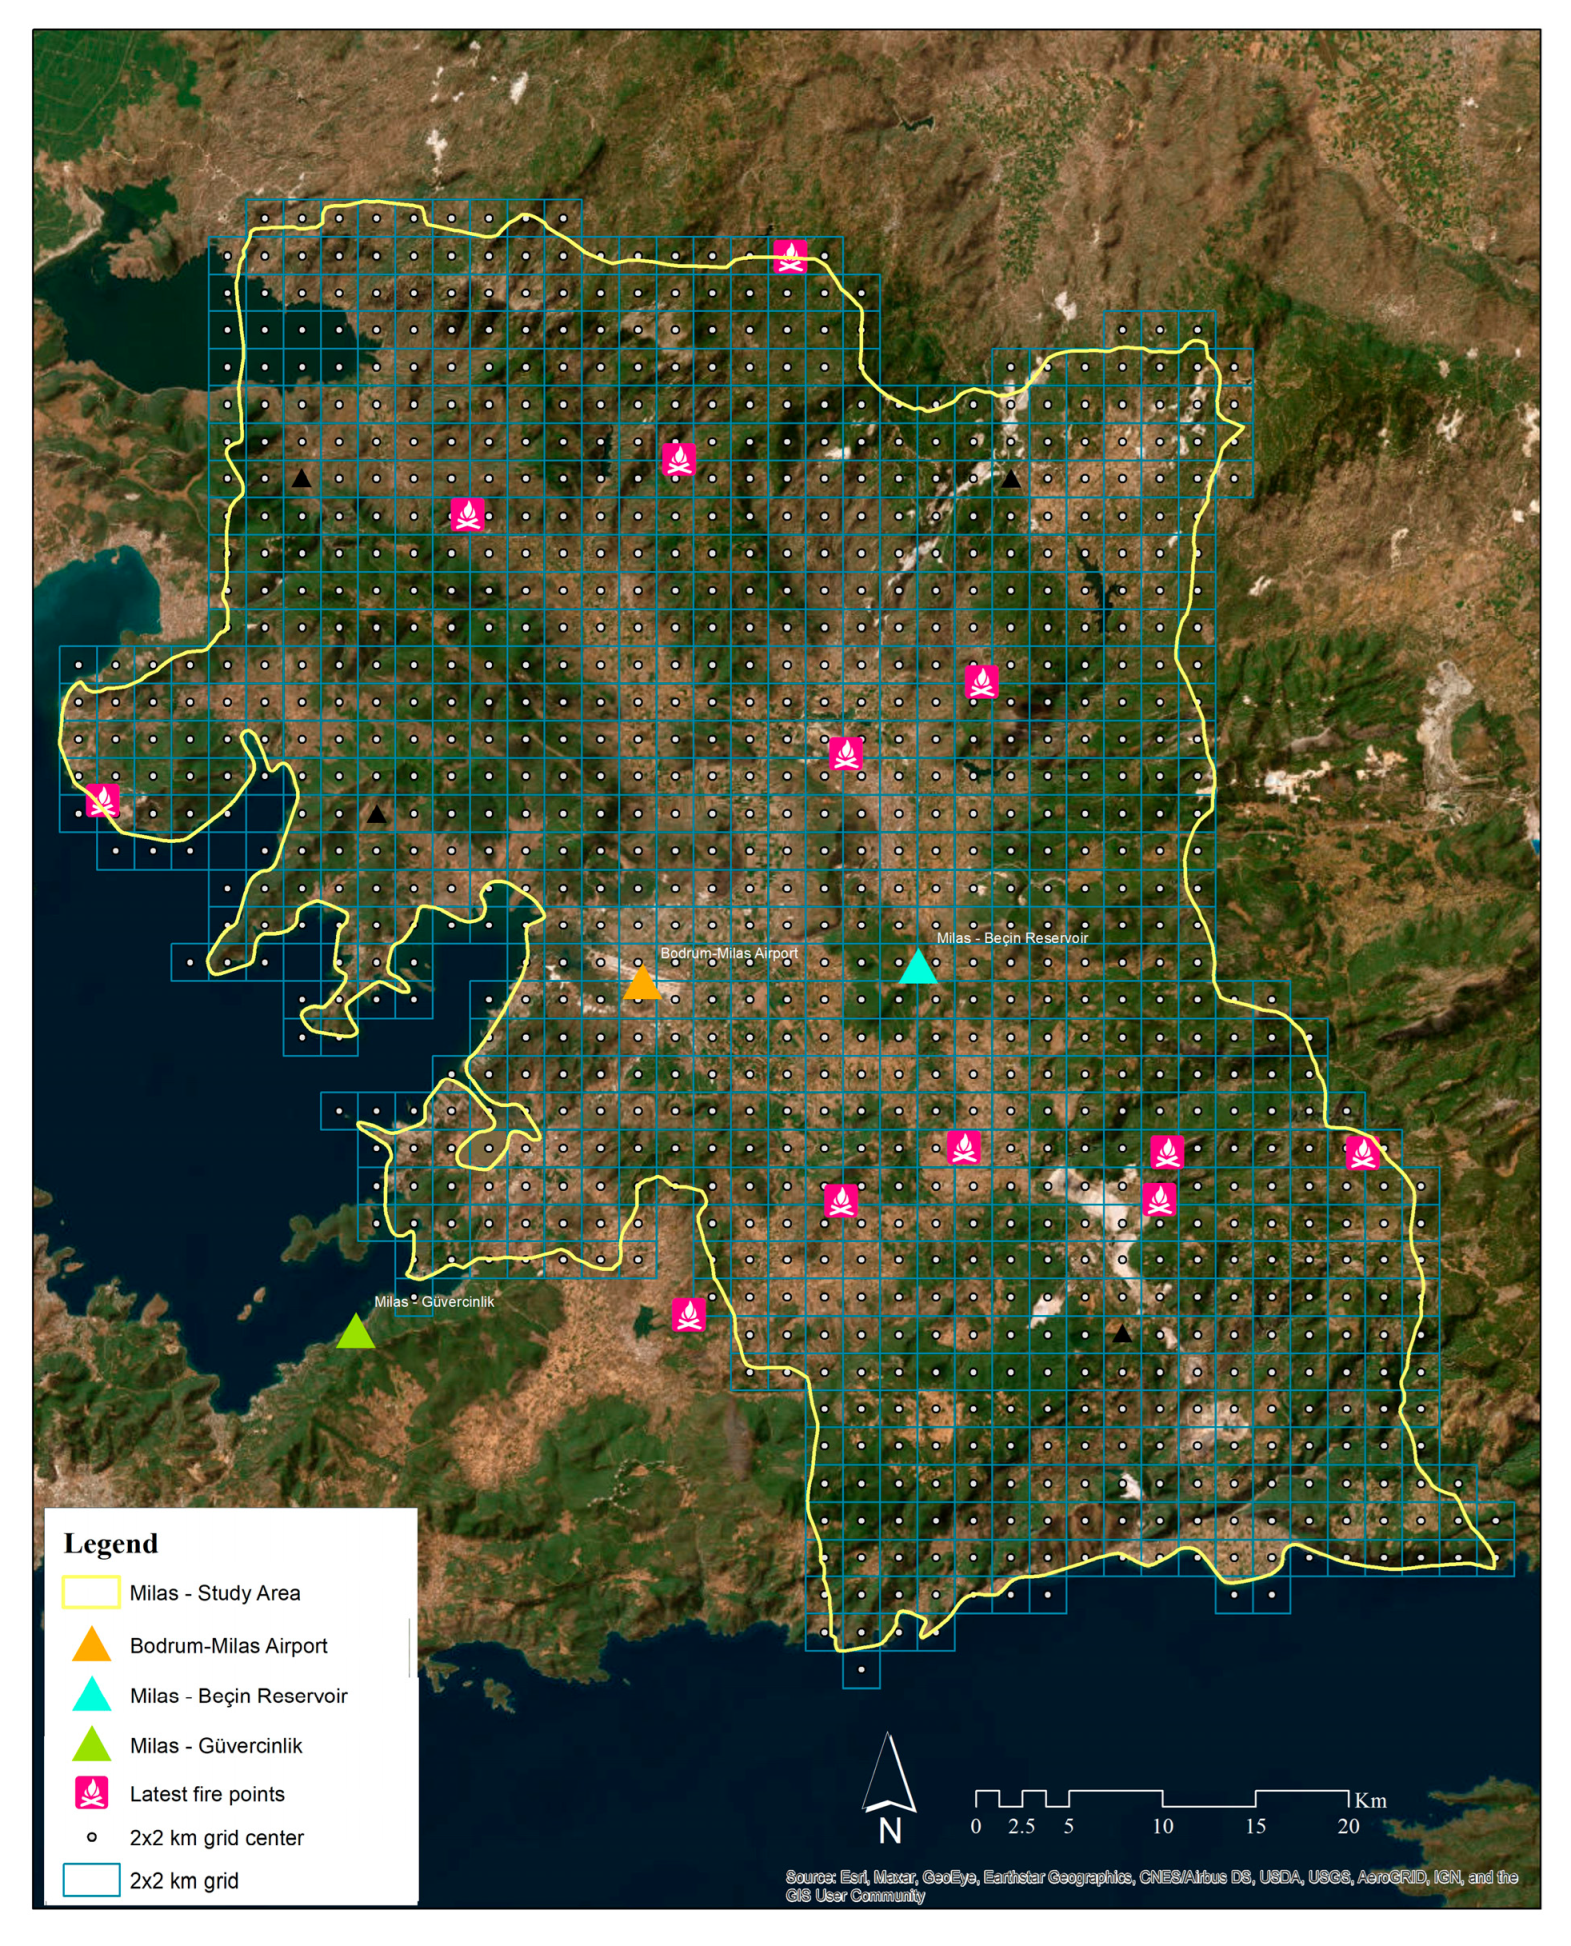
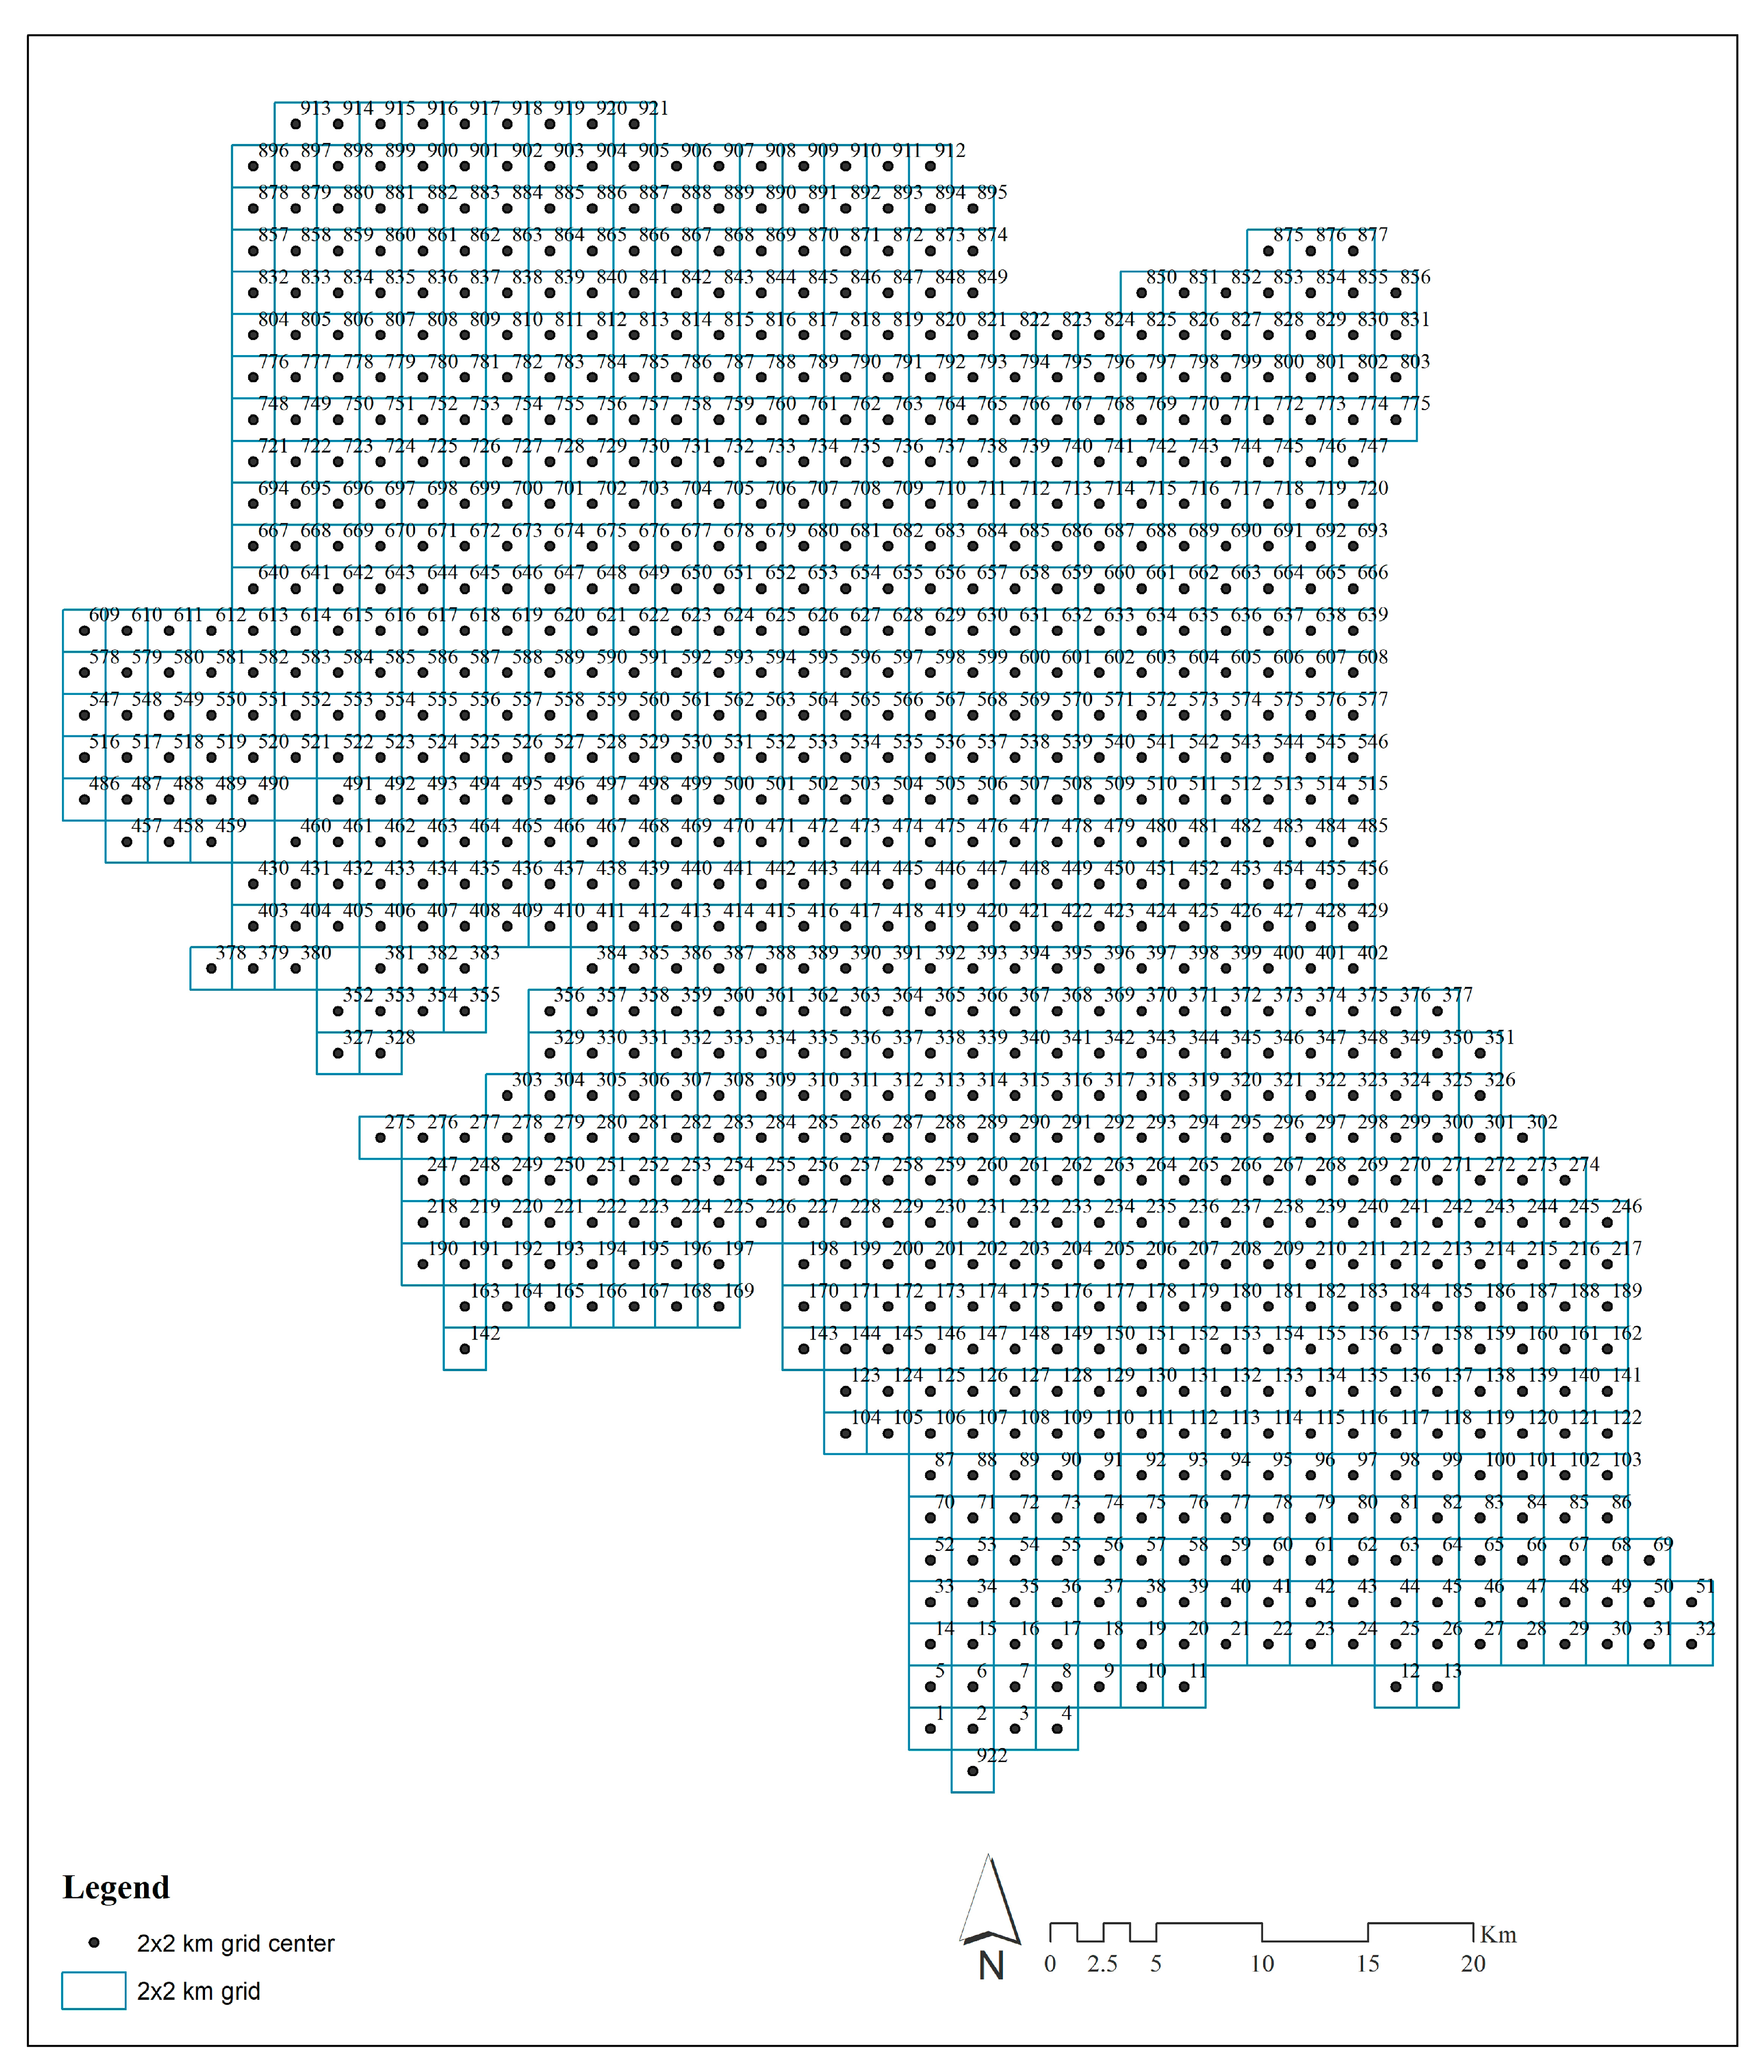
The entire region was divided into grids consisting of 2 × 2 km squares, and a total of 922 grids were included in the study and analyzed in ArcGIS 10.7 [
22]. For each grid, information such as forest density, average slope, elevation, suitability for settlement, and the presence of an airport was defined, while distances to roads, settlements, and water supply points were defined for each grid center.
Figure 6 and
Figure 7 show the generated grids and grid centers with a background and without a background, respectively. Note that the grid numbers visualized on the map can be found in
Figure A1.
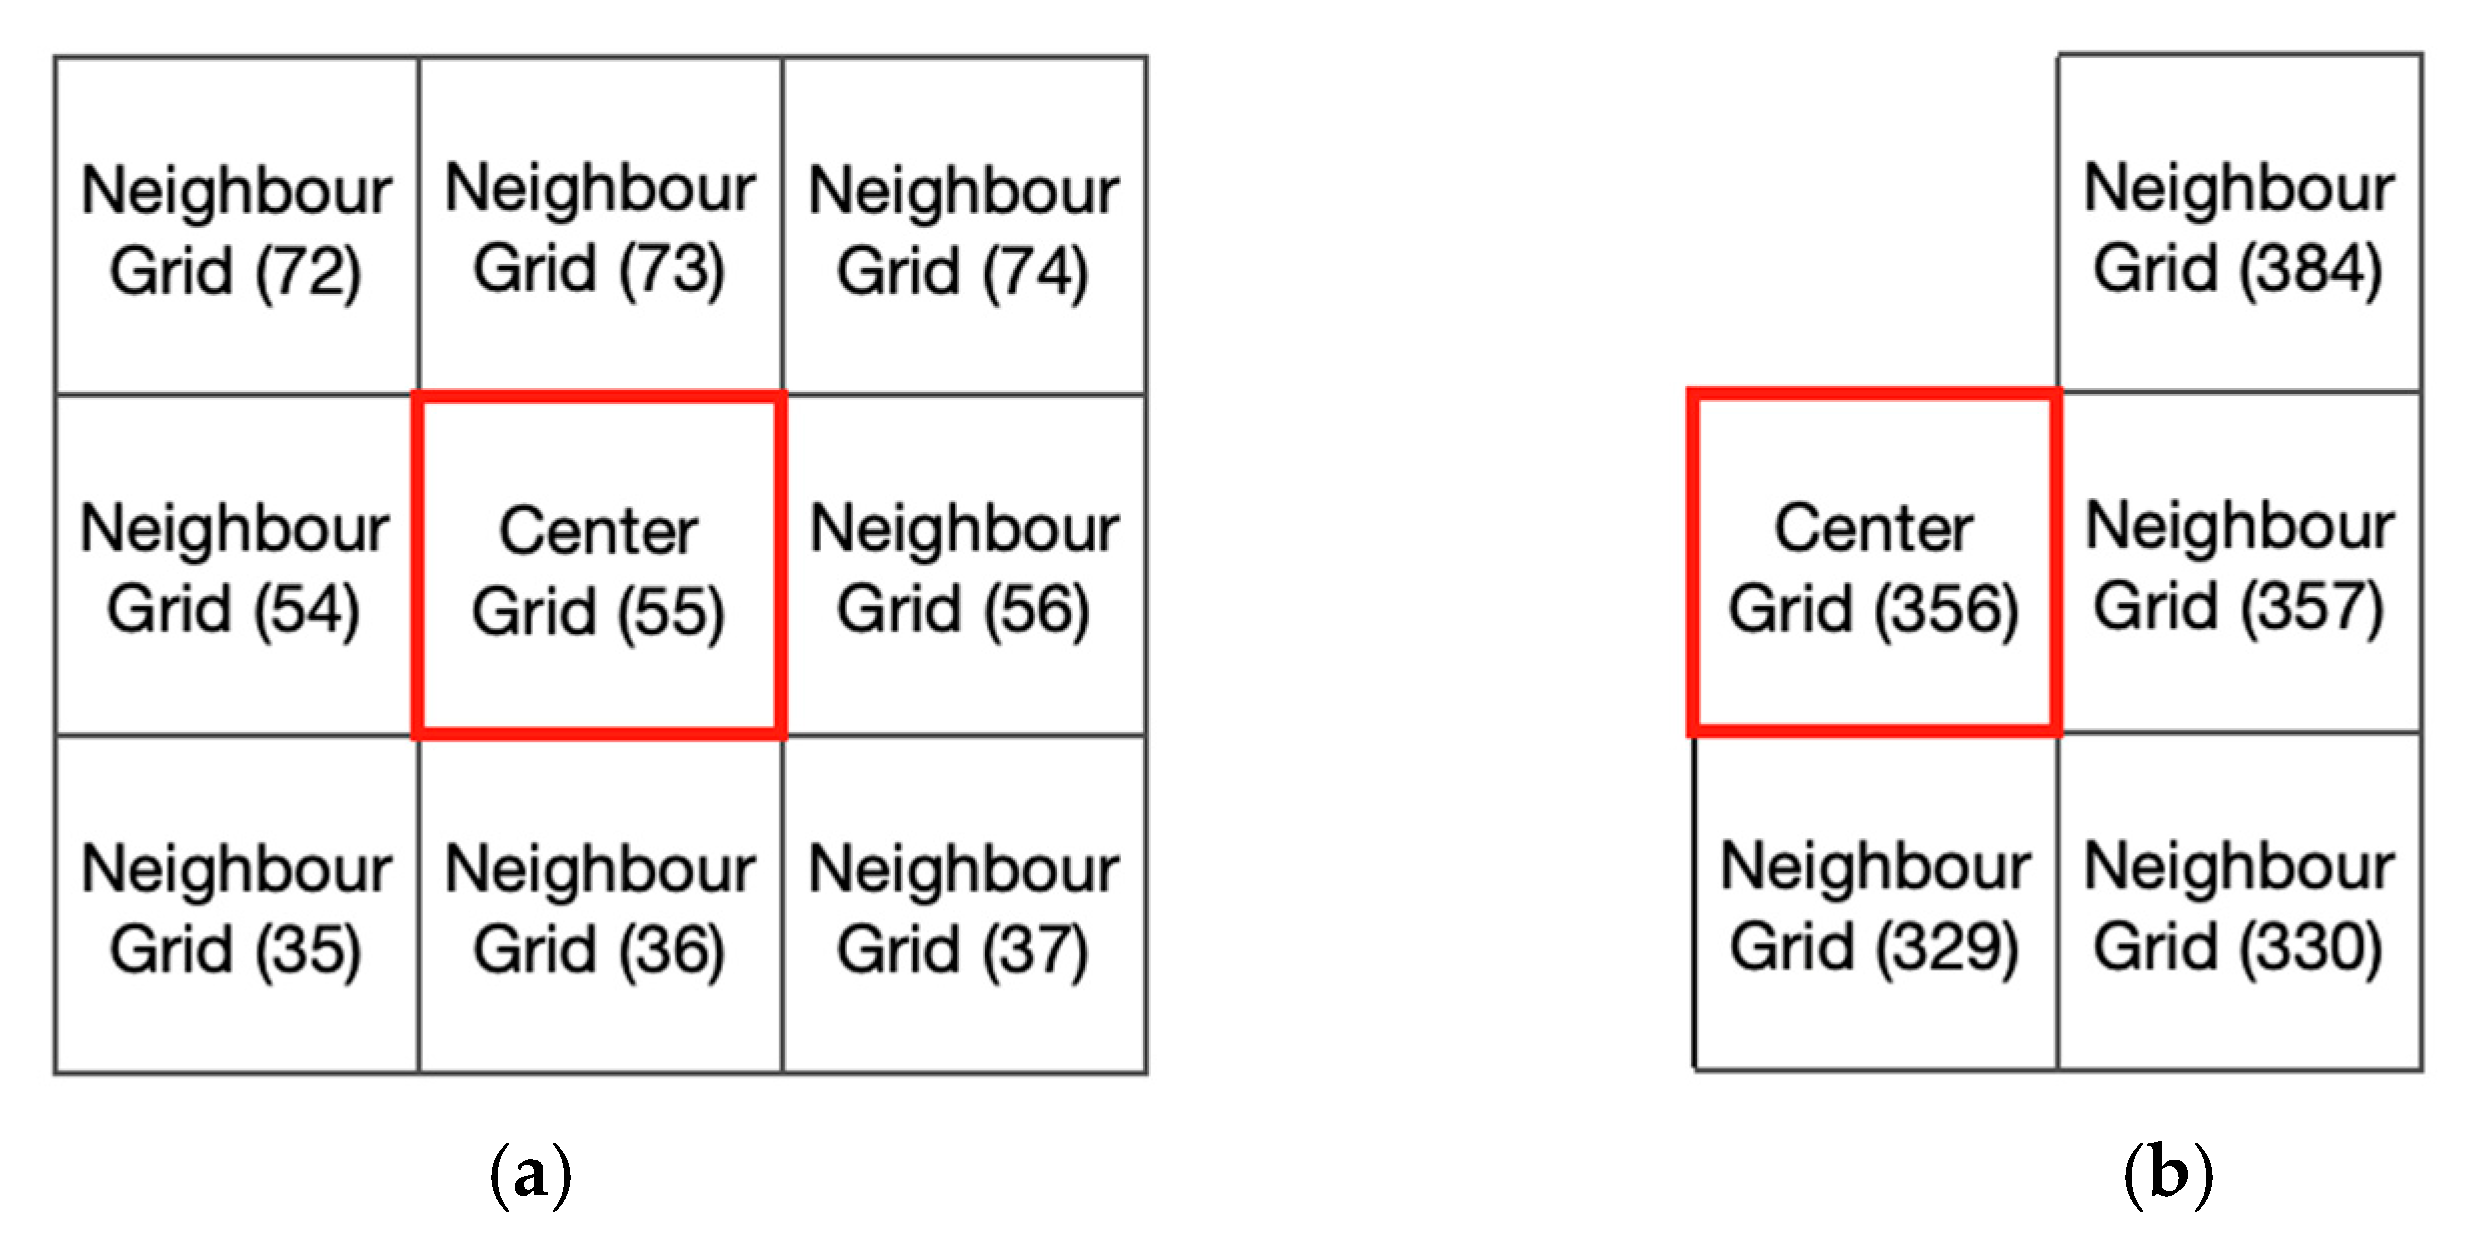
The forest density of each grid was reflected in the objective function as a weight coefficient. Therefore, when determining the minimum number of heliport locations to be established, the forest density of the relevant region was considered. Regions close to the heliports will have the advantage of IA in shorter times. Therefore, it would be logical to prioritize regions with high forest density when determining the locations of heliports. In addition, since the plant species in Milas consist mostly of red pine (
Pinus brutia) (91.4%), which is highly susceptible to forest fires, we assumed that the forest density of each grid fairly reflects the forest fire risk of that grid. The forest density of any region was calculated as the average forest density of each grid and its neighboring grids. This corresponds to the average density of nine grids and is assigned to the center grid as the weight parameter. This process was carried out for all grids, providing priority to regions with forest density over a larger area, rather than just the forest density in a single grid with an empty surrounding, when assigning heliports. First, the edge and corner neighboring relationships between grids were established. To calculate the forest density of the center grid, the arithmetic mean of both the edge and corner neighboring grid values were used. Both in regular grid distributions (which have four edges and four corners as shown in
Figure 8a) and irregular grid distributions shown in
Figure 8b, the number of grids was taken into account in the arithmetic mean calculation.
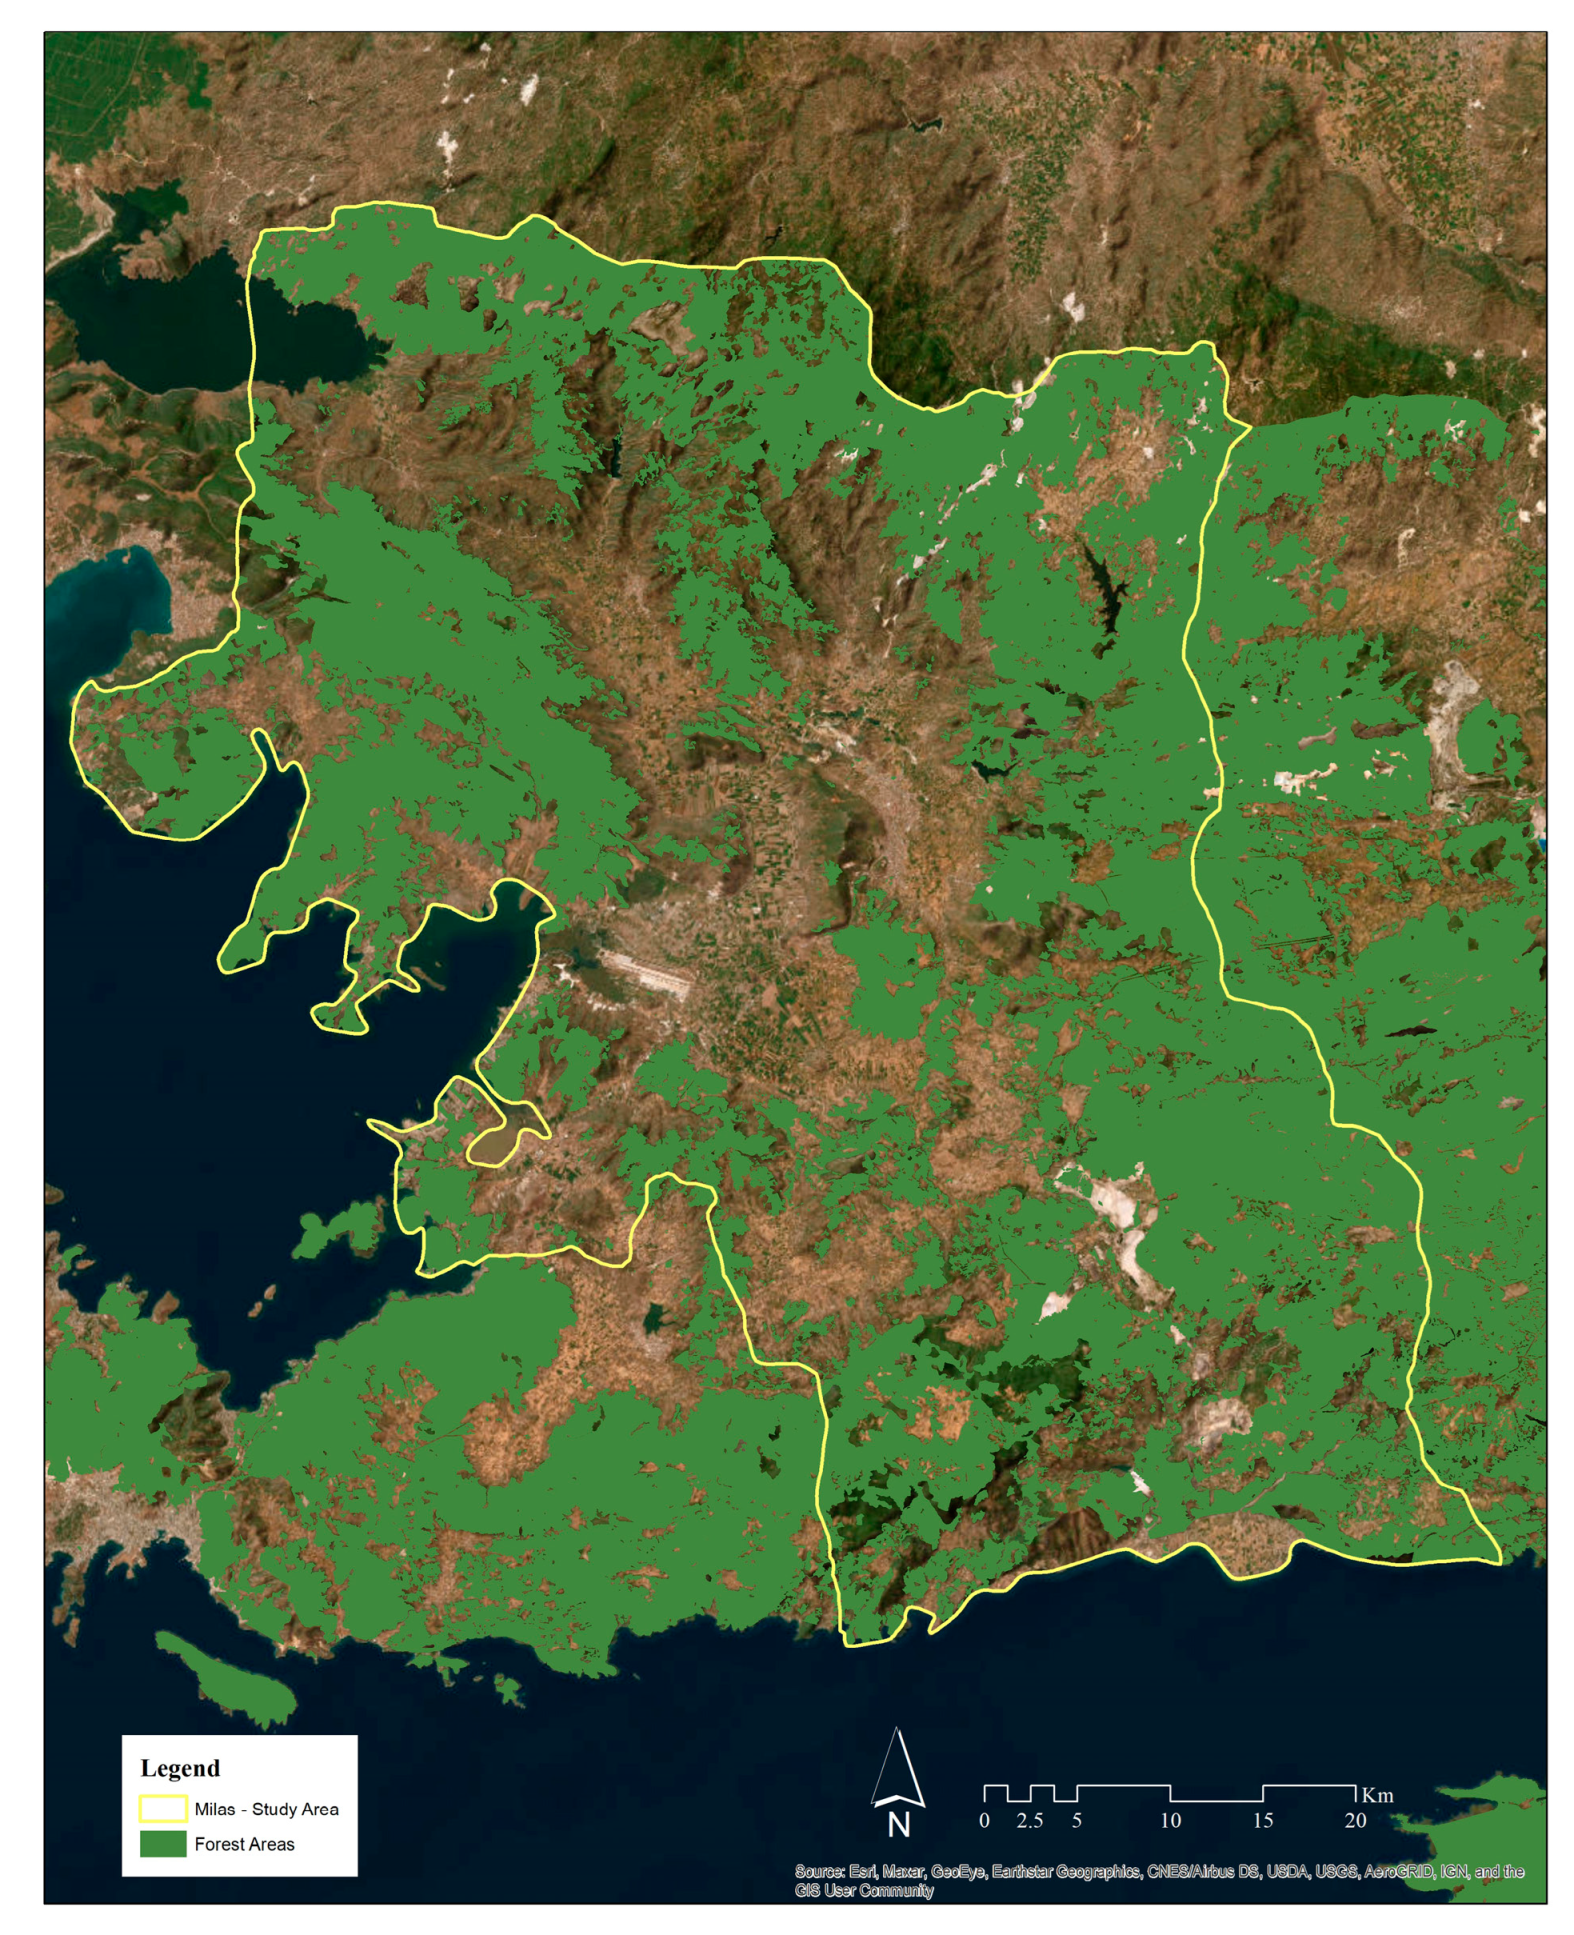
Figure 9 shows the forest areas, and
Figure 10 visualizes the fires in these areas in 2021.
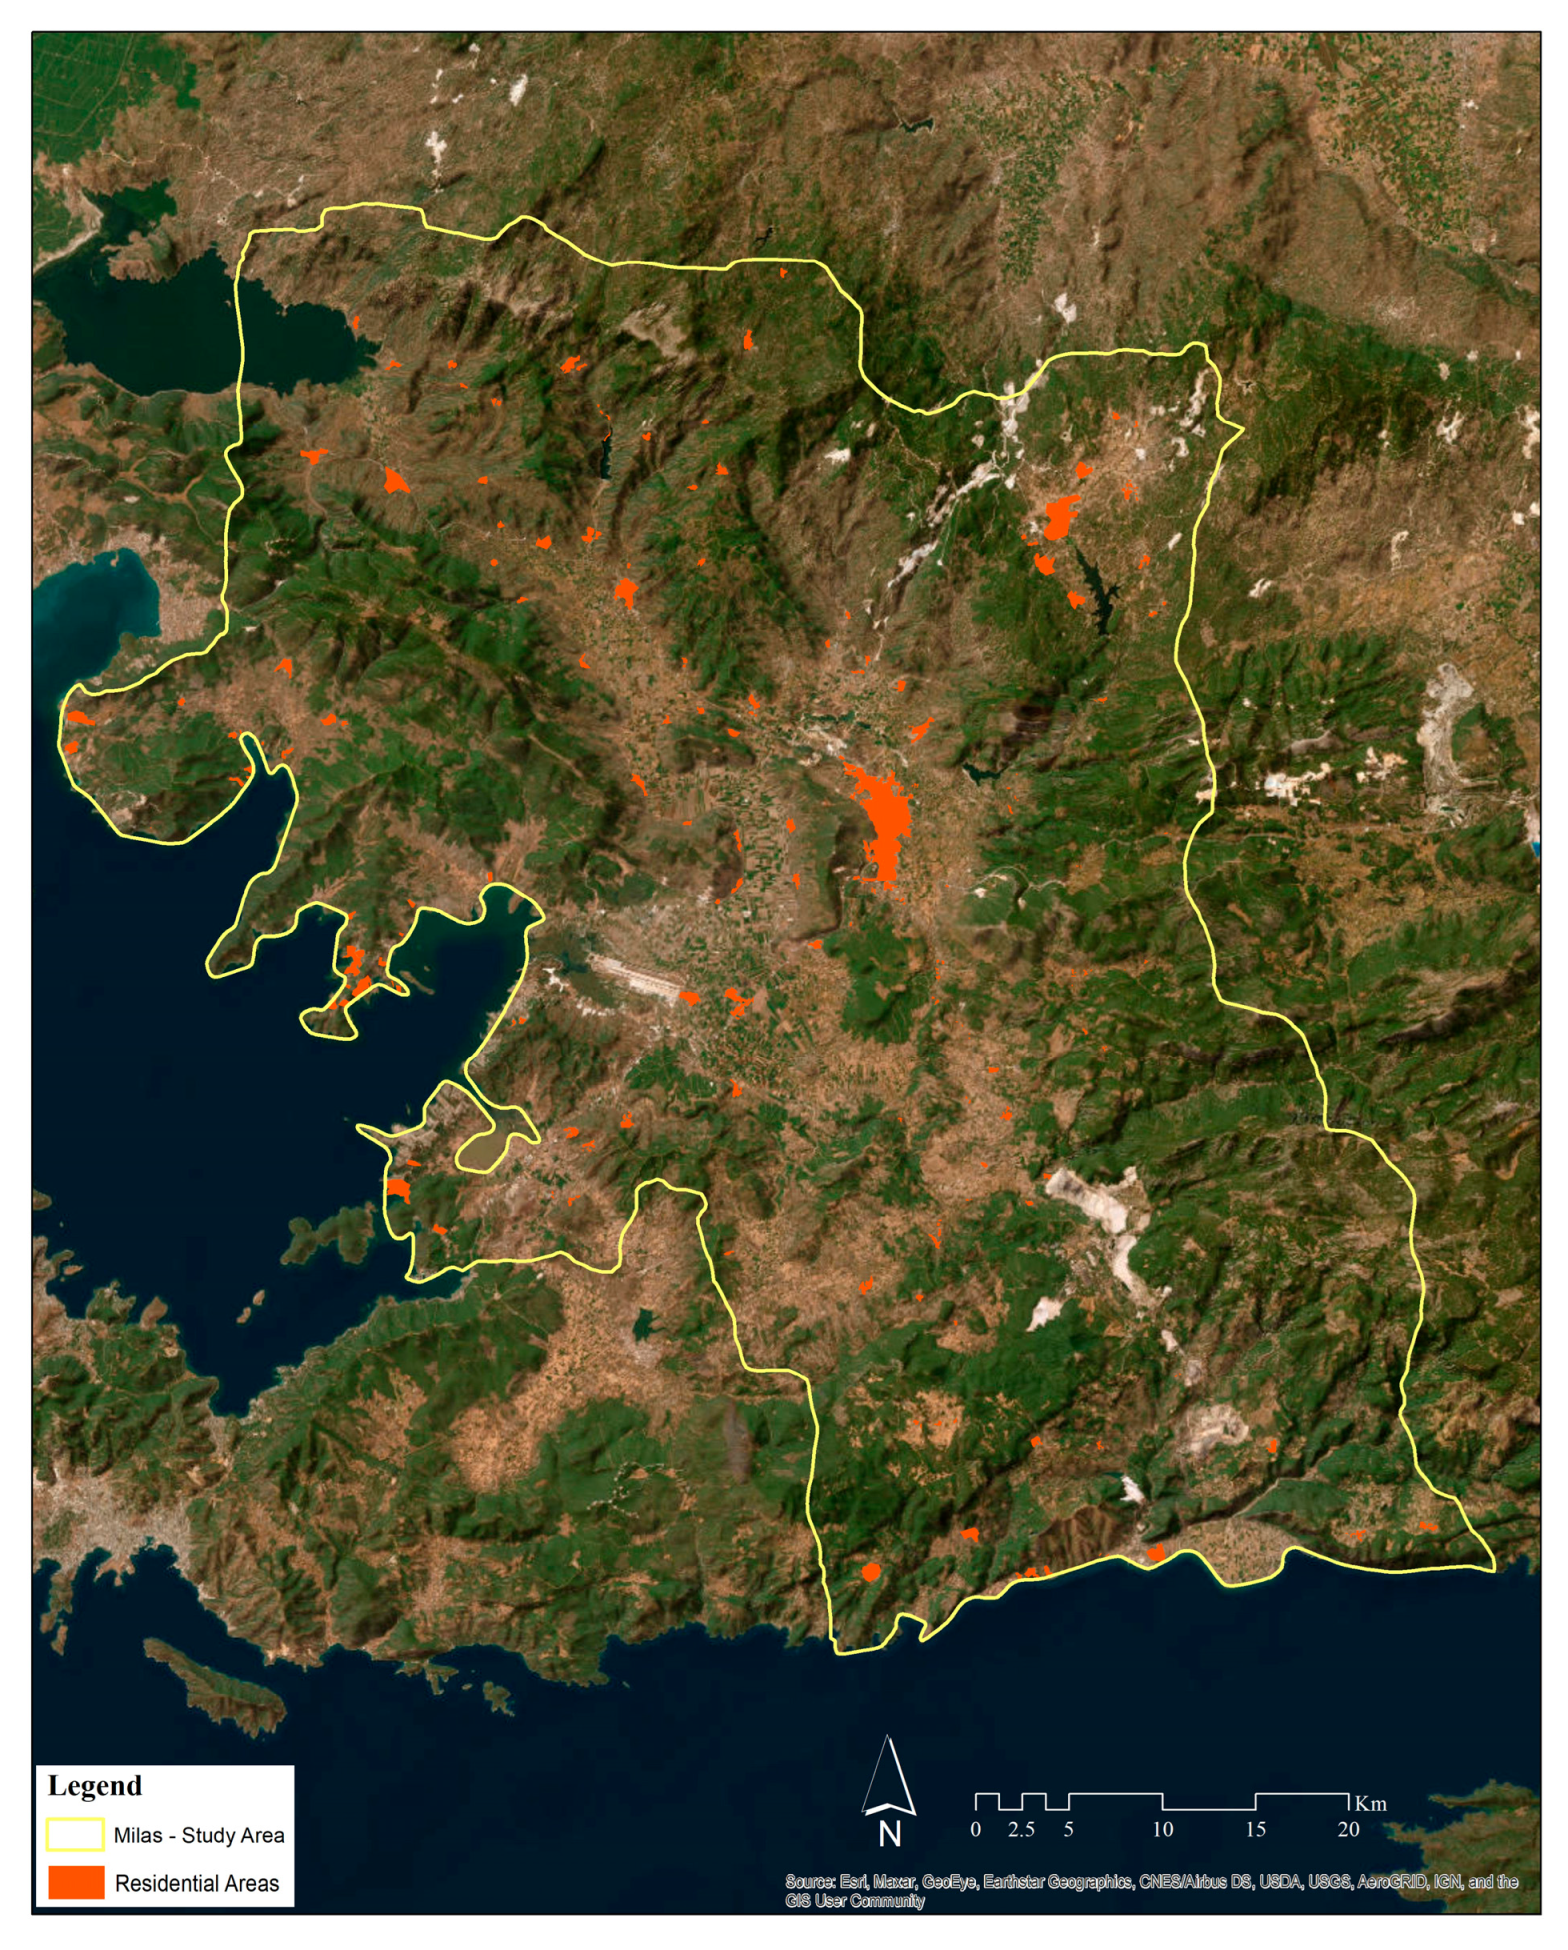
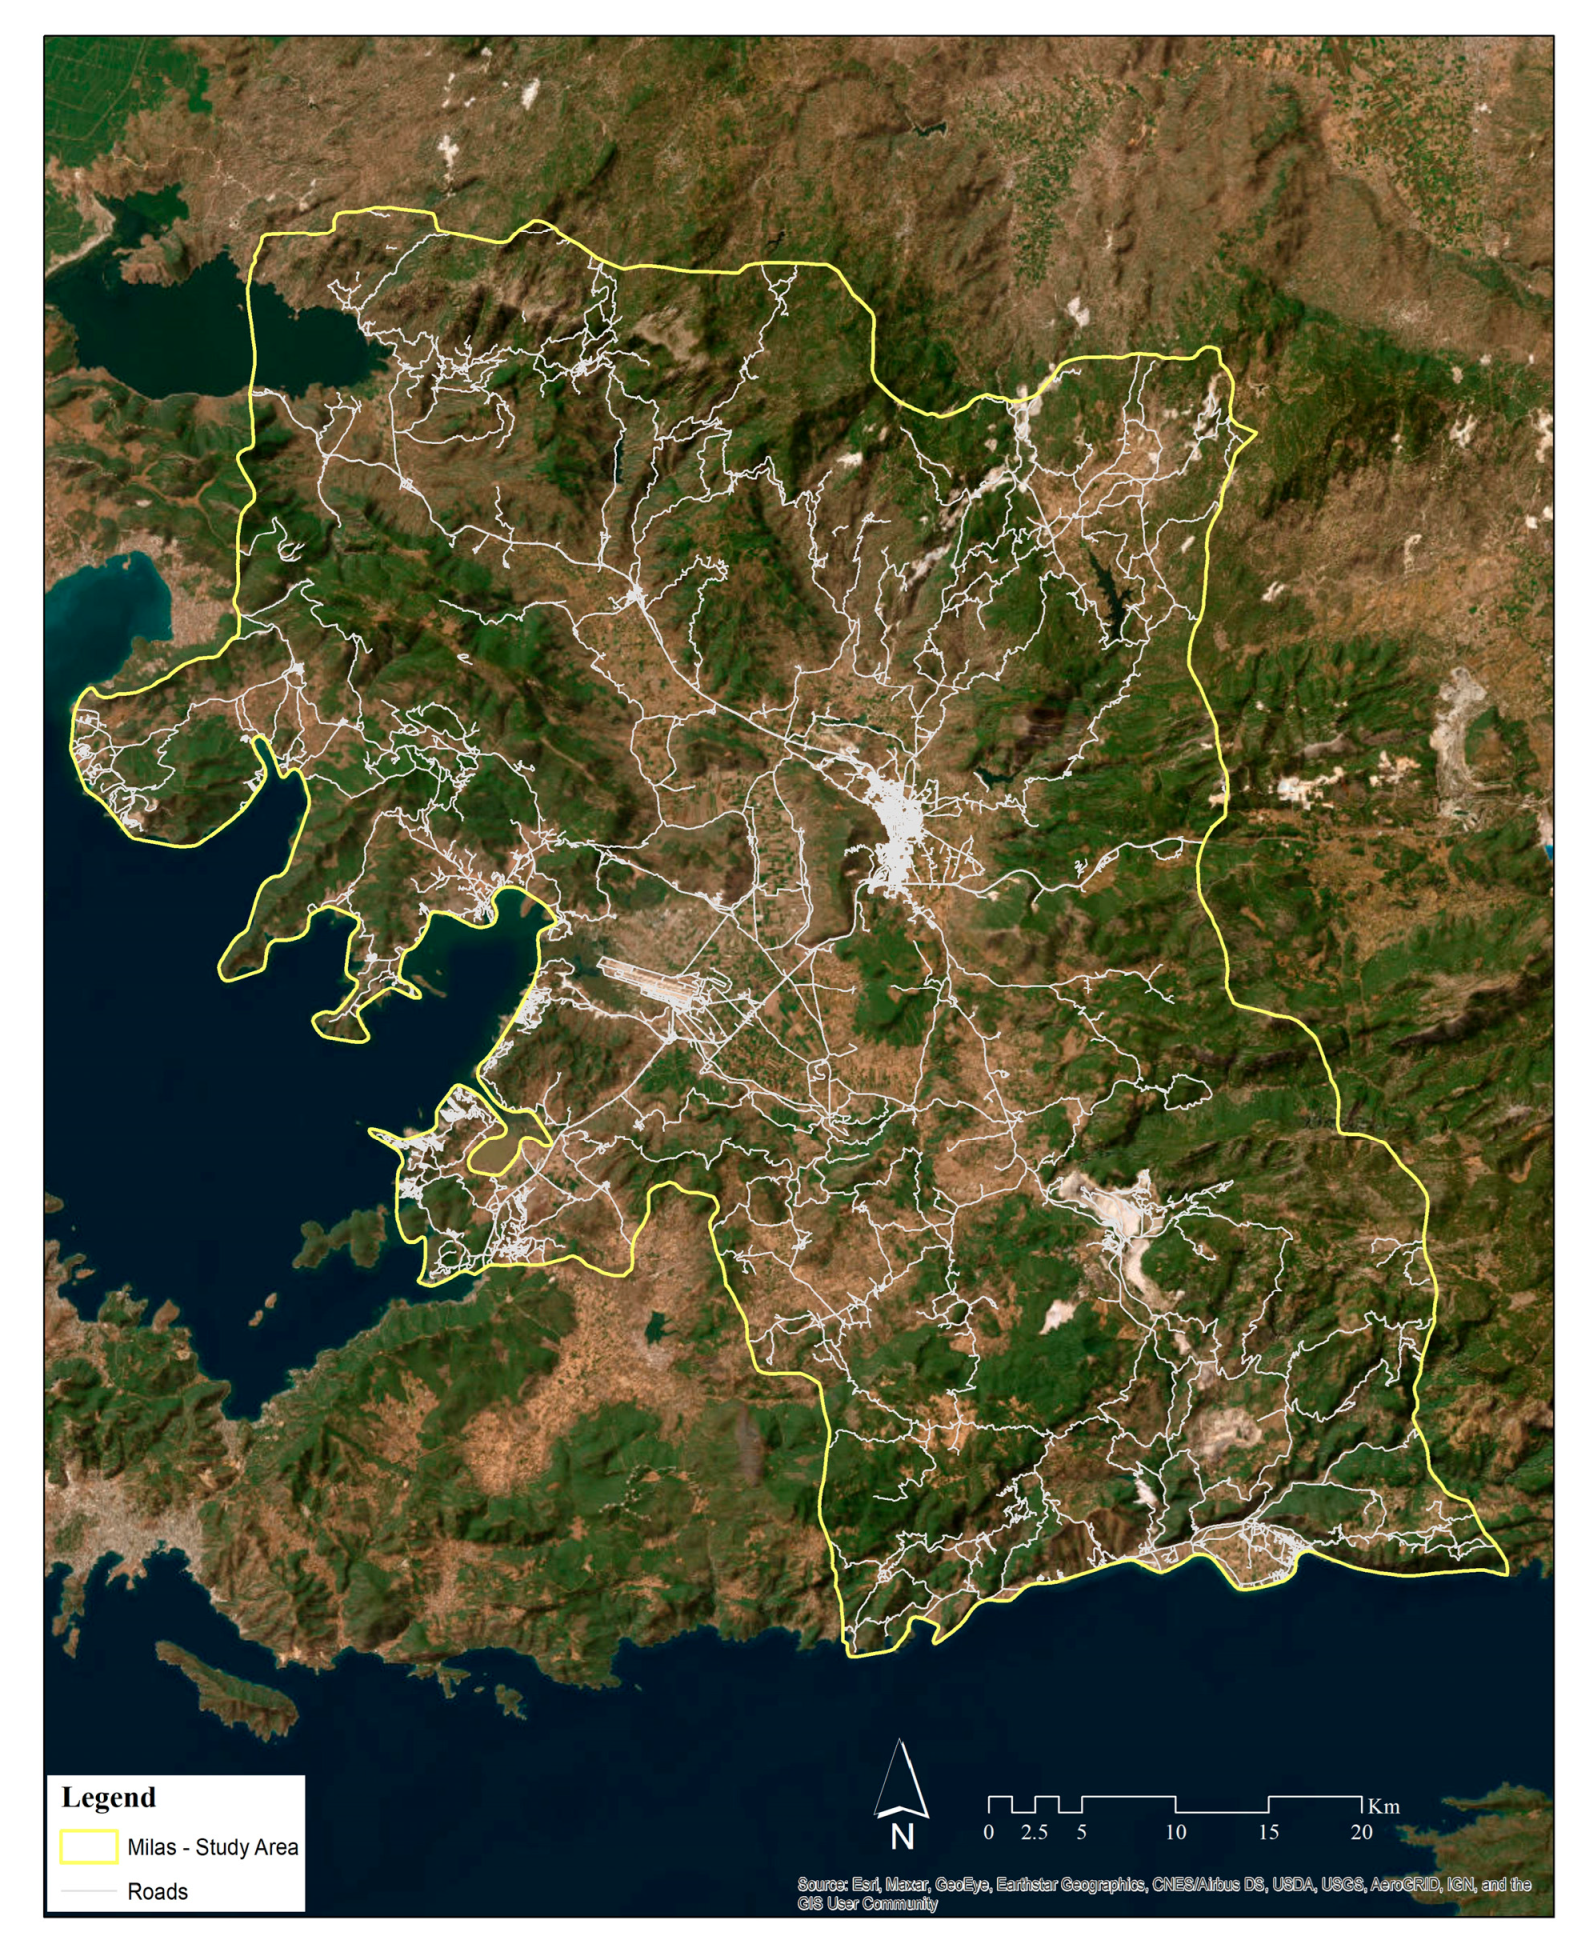
It has been emphasized in many studies that areas close to residential areas and roads are more sensitive to forest fires, and human activities in these regions are two of the main factors affecting forest [
23,
24,
25]. In addition, the distance of the heliport locations to residential areas and roads is important, as the relevant crews and other resources (such as fuel, water, etc.) should be able to easily reach the heliports. Therefore, we eliminated regions that were more than 5 km away from residential areas and more than 500 m from roads from being candidate regions.
Figure 11 and
Figure 12 visualize the residential areas and the roads, respectively.
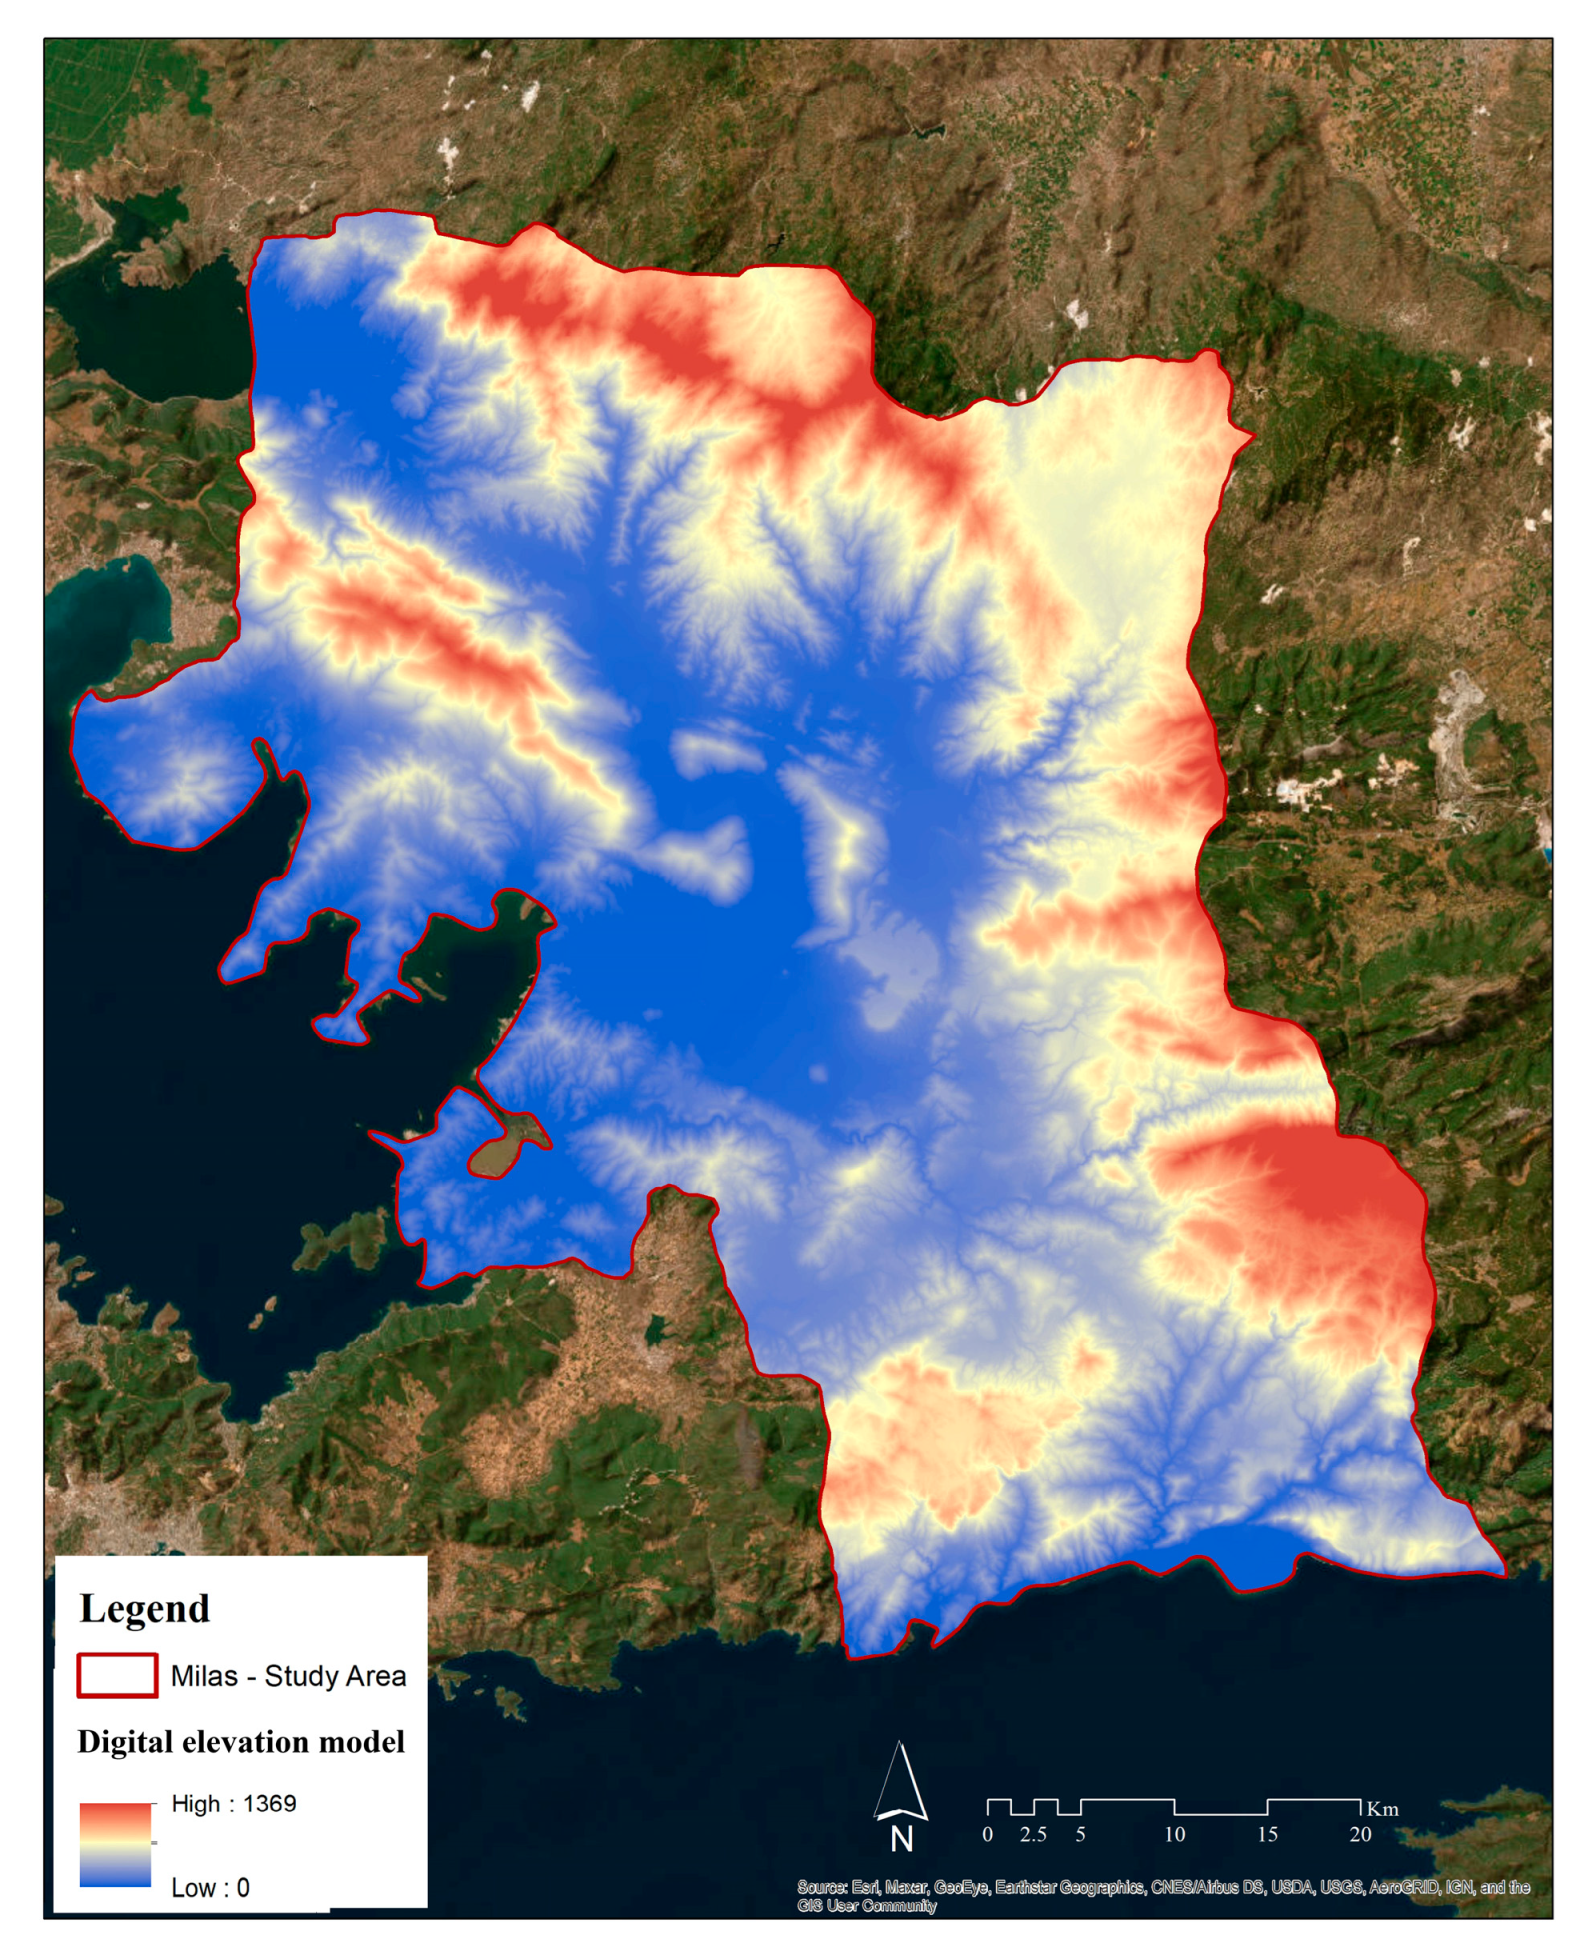
Although Turkey is relatively successful in combating forest fires among Mediterranean countries, the mountainous nature of the country’s forested regions makes it difficult to fight forest fires from the land [
26]. It has been observed that the rate of spread of forest fires in high sloping lands is lower than in flat lands [
21], and the risk of forest fires at low altitudes is considered higher than at high altitudes in many studies [
14,
27]. Therefore, regions with an altitude higher than 750 m were also eliminated because the highest risk is up to this altitude [
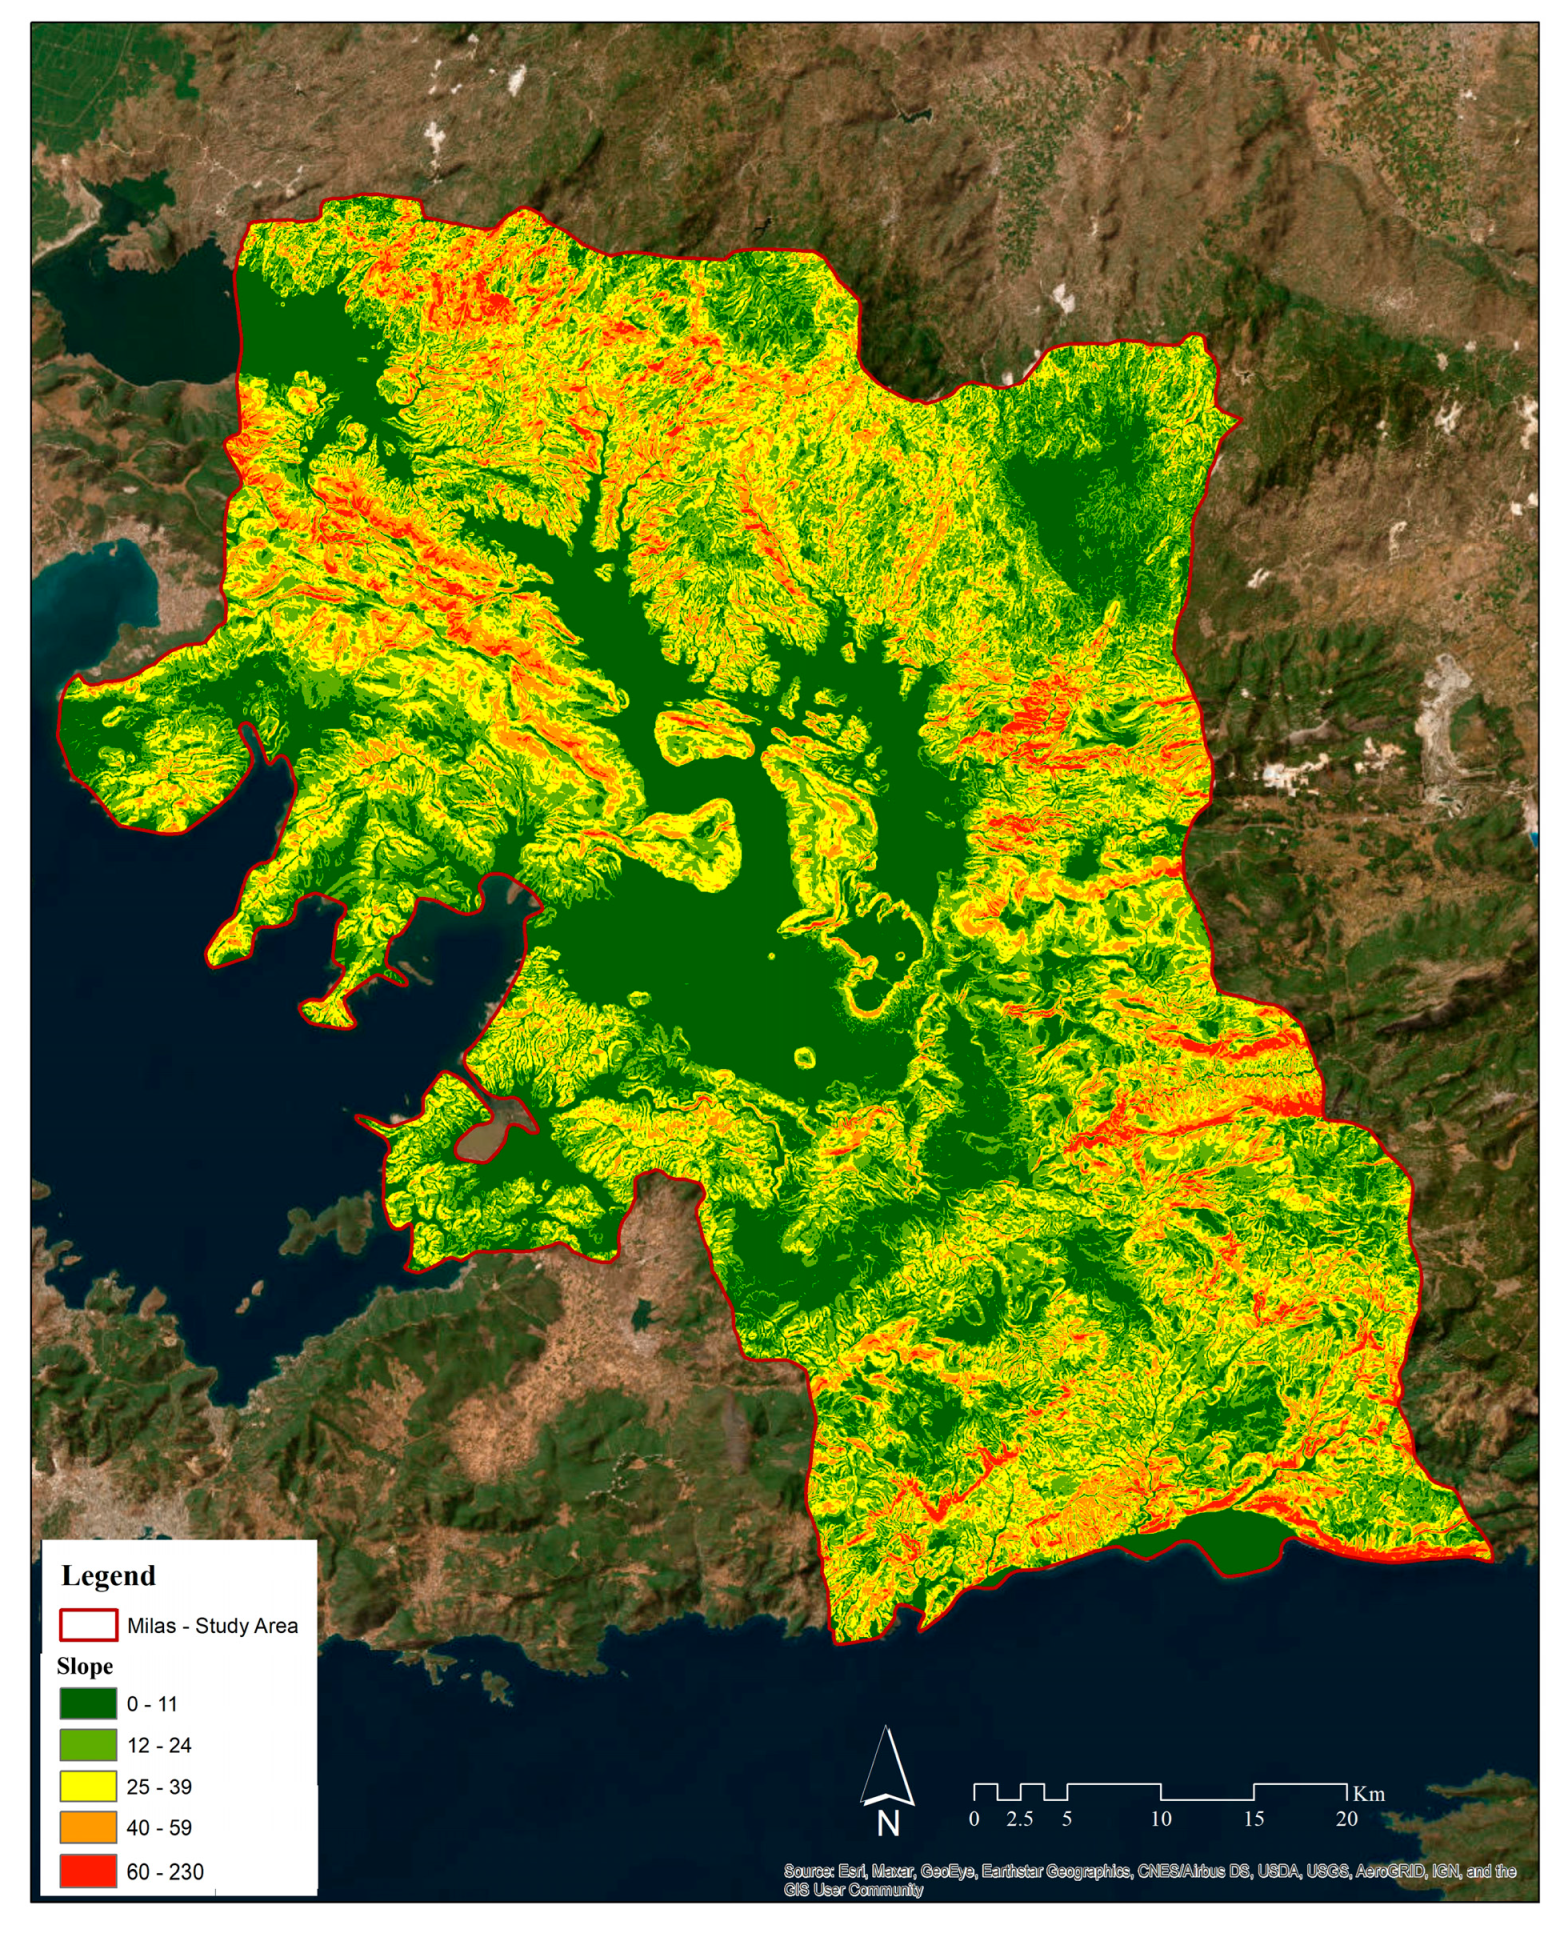
14]. There can be difficulties in transportation and construction in higher areas. In addition, regions with an average slope of more than 25% are not considered as candidate regions because it would be costly or impossible to build a heliport in these locations [
28].
Figure 13 and
Figure 14 show the elevations and slopes in the region, respectively.
Similarly, wetlands and areas with existing heliports (or airports) are not regarded as candidate regions. It should be noted that the range of services provided by the existing heliports/airports was considered when determining the location-allocation in the model. It is assumed that the heliports will be built at the exact center of each grid. Moreover, if trees need to be cut down to build a heliport area in a forested region, that area is no longer considered a candidate area. The requirement of having enough land (at least 1000 m
2) to build the heliport was added to the mathematical model.
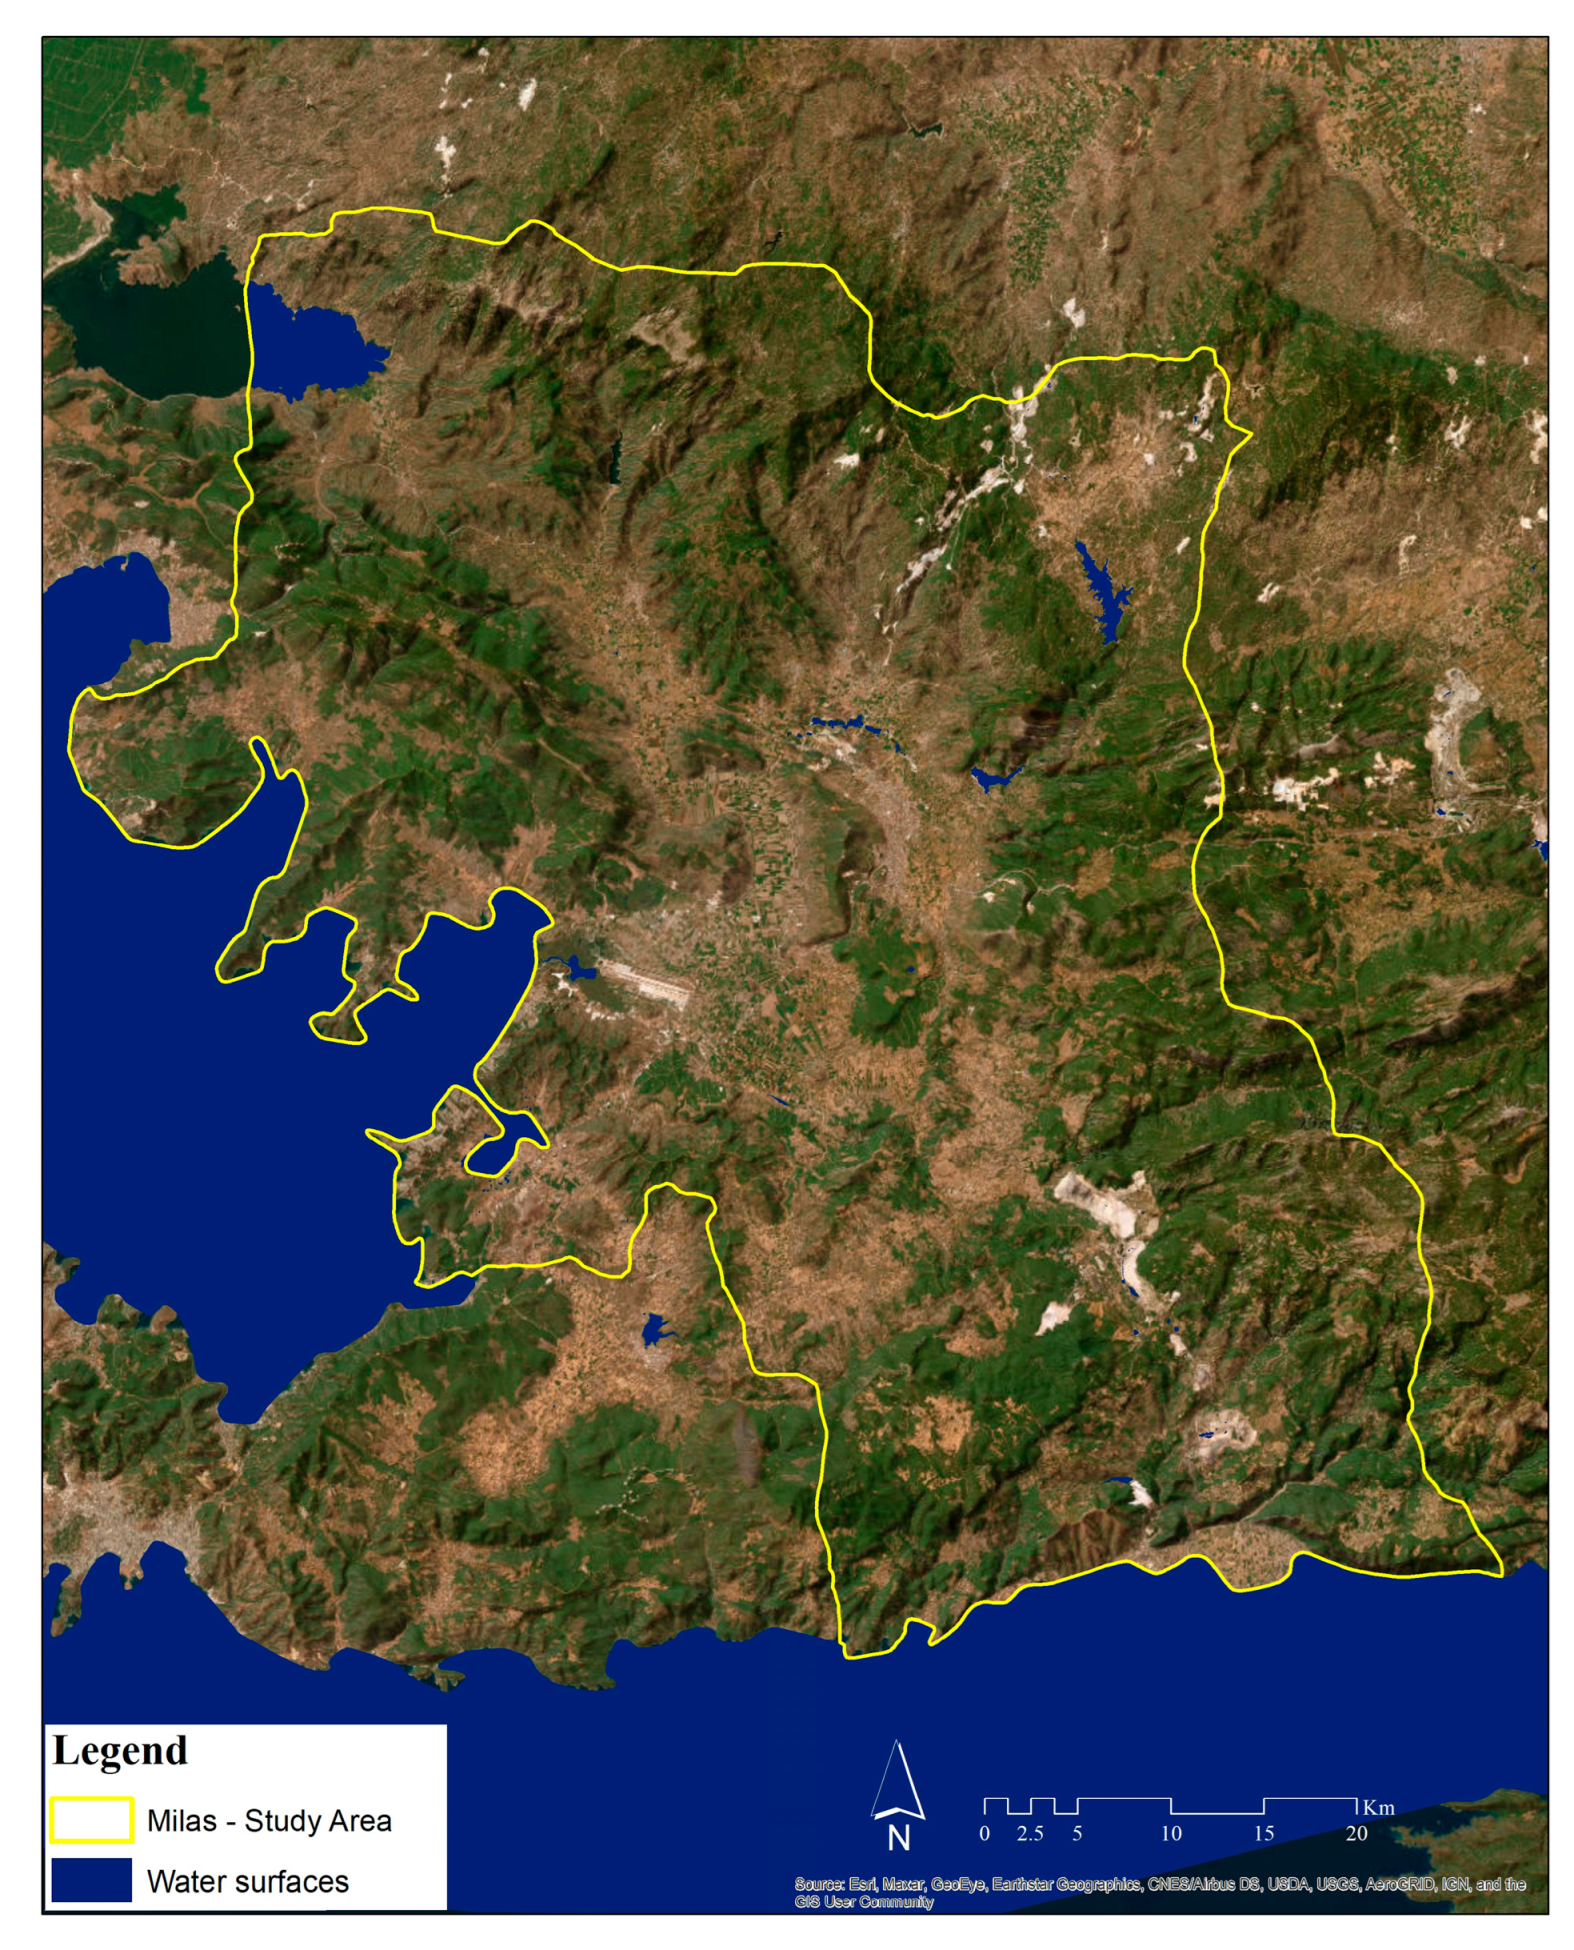
Figure 15 and
Figure 16 show the fire water supply points of GDF and natural water sources, respectively.
Note that in the second model, the current water sources in the region are considered when calculating the EA time coverages for helicopters. Additionally, some constraints are introduced in this model, such as the slope of the land (which must be less than 25%) and the amount of available land (at least 1000 m2).
2.3. Aerial Resources
Based on the official GDF website as of 2023, the firefighting fleet comprises 20 aircraft, 55 helicopters, and 8 unmanned aerial vehicles [
19]. In the Milas region, which is the subject of the study, there exist various types of aircraft and helicopters for firefighting purposes. These include amphibious aircraft, heavy and light category helicopters (including those equipped with night vision capabilities). The amphibious aircraft utilized in the region are CL-215s of Turkish origin, while the heavy class helicopters are CH-47s from the United States. The night vision helicopters from the light class category are Mi-8s from Moldova, while the regular light class helicopters are also Mi-8s from Russia. Note that the water-carrying capacity of the heavy category helicopter is 10 tons, while it is 2.5 tons for light category helicopters [
29].
2.4. Mathematical Model
In this study, a multi-objective approach is considered in mathematical modelling. In the first model, the goal is to provide IA coverage for the entire region within reasonable times with the minimum number of heliports. The objectives of first model are the minimization of the number of heliports and the minimization of IA time coverage. These two objectives have significant tradeoffs; therefore, the epsilon constraint method is used to scalarize the multiple objectives. This is a technique used for multi-objective optimization, which helps decision makers understand the tradeoffs between different objectives. By setting constraints on one objective, such as minimization of IA time coverage, the method can then optimize the other objectives. This provides decision makers with greater control over the outcomes and allows them to make more informed choices [
30]. The set-covering problem is adapted to provide the same IA duration to the entire region. In the second model, a similar approach is applied to provide EA for the entire region within reasonable times with the minimum number of water sources. Both models were solved using the CPLEX solver in The General Algebraic Modeling Language (GAMS), which is a high-level programming language for linear and quadratic problems [
31,
32]. The solution time of the first and second models was less than 1 min. A computer with an Intel Core i-7 4.6 GHz processor (Santa Clara, CA, USA) and 64 GB RAM was used to run the model. Sets, parameters, decision variables, and objectives of the first and second models are presented as follows.
Sets
Parameters
distance parameter between ith and jth regions (converted to minutes).
forest density of the ith region (normalized between 0 and 1)
describes the candidate regions for heliports (takes 1 if the regions is in the candidate list, 0 otherwise).
describes the existing airports and heliports (takes 1 if the region has an airport or heliport, 0 otherwise).
describes the candidate regions for pools (takes 1 if the regions is in the candidate list, 0 otherwise).
describes the existing water sources (takes 1 if the region has a water source, 0 otherwise).
IA time (min.)
EA time (min.)
epsilon value for the first model
epsilon value for the second model
Decision variables
if a heliport will be built to the jth candidate region it takes 1, 0 otherwise.
if a water source (pool) will be built to the jth candidate region it takes 1, 0 otherwise.
The first model (heliport coverage):
The second model (water source coverage):
Equations (1)–(4) include the constraints and objective function of the first model. Equation (1) ensures heliport covering of the entire region considering the IA time (k1) and the candidate regions. Equation 2 ensures the IA time (k1) will be lower than and equal to the value, which is determined at 30-s intervals in this case. Equation (3) ensures that must be 1 in the regions which already have an airport or heliport. Equation (4) is the objective function of the first model, which minimizes the number of heliports to be built by giving priority to forest-dense areas. Equations (5)–(8) consist of the constraints and objective function of the second model. Equation (5) ensures the water sources cover the entire region considering the EA time (k2) and the candidate regions. Equation (6) assures the EA time (k2) will be lower than or equal to the value, which is determined at 10-s decrements in this case. Equation (7) ensures that must be 1 in the regions which already have available water sources. Equation (8) is the objective function that minimizes the number of water sources (pools) to be built.
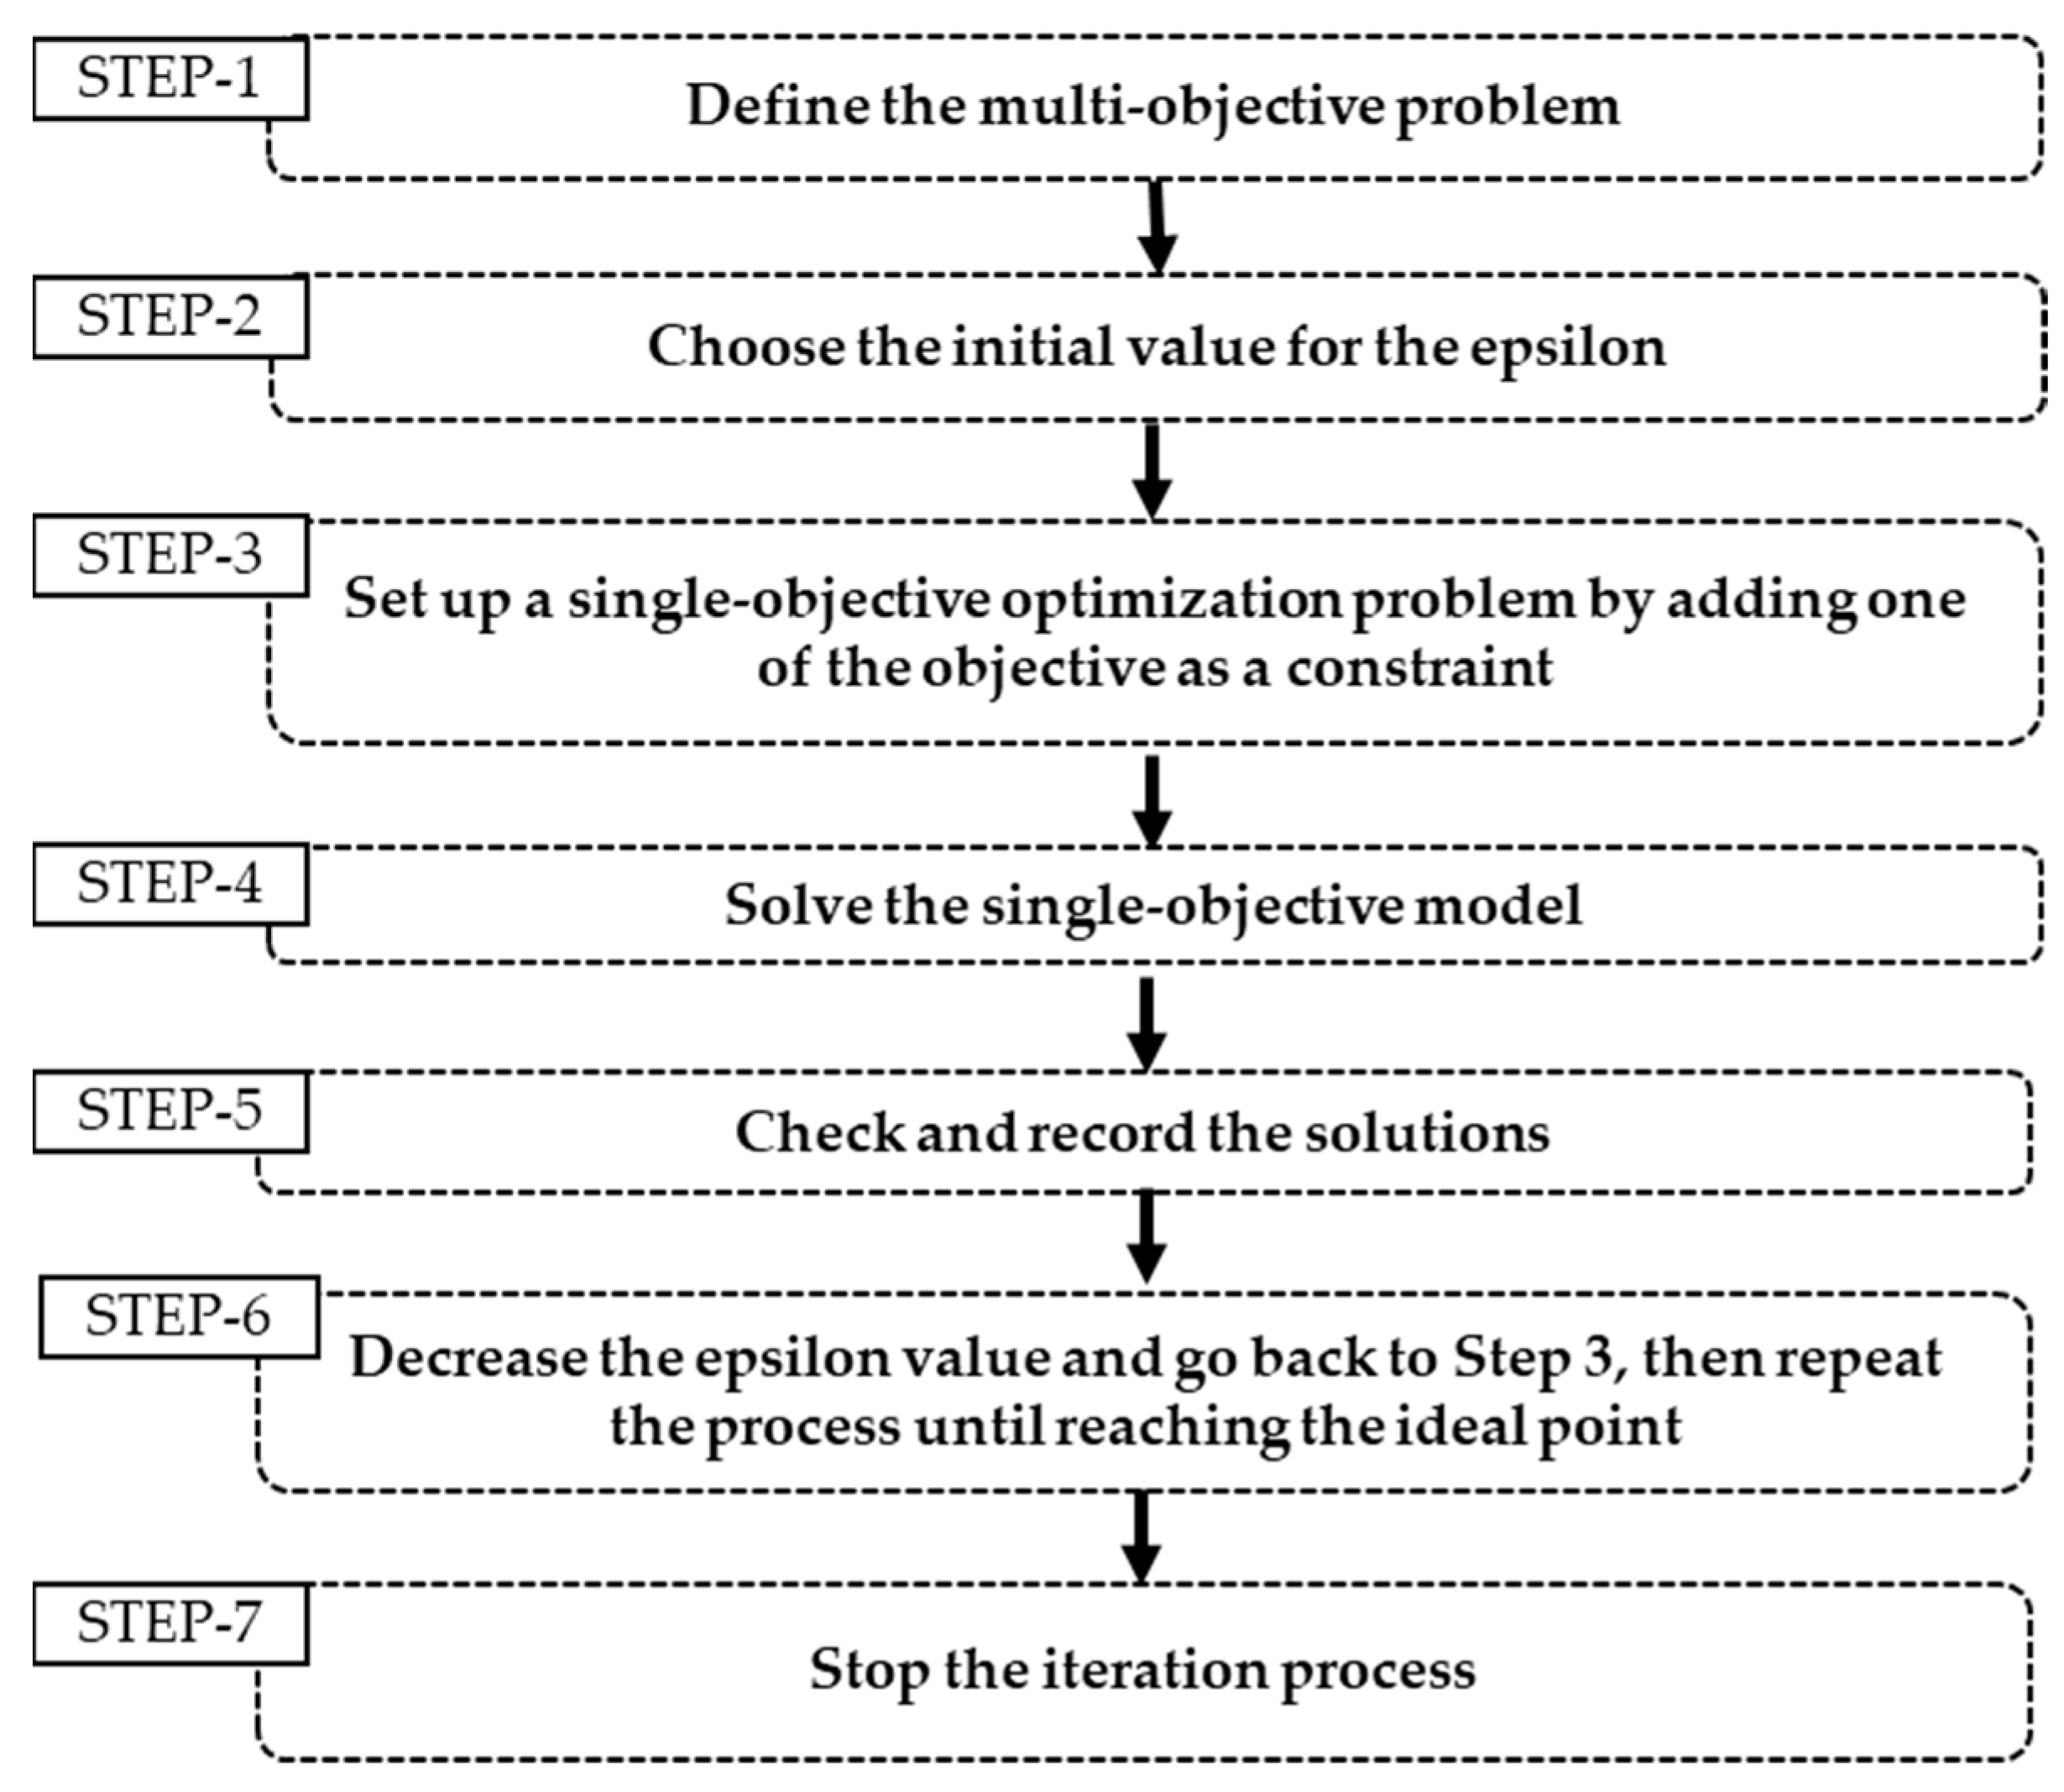
The flowchart for solving the optimization models using the epsilon method is given in
Figure 17. In Step 1, the decision variables, objective functions, and constraints of the multi-objective problem are defined. In Step 2, initial values for the epsilons, denoted by ε1 and ε2, are chosen. In our case, they are equal to the IA and EA coverage times in real conditions for the first and second models, respectively. In Step 3, a single-objective optimization problem is set up by adding one of the objectives as a constraint to the original problem. In our case, IA and EA coverage times must be lower or equal to the epsilon values for the first and second models, respectively. In Step 4, the single-objective problem is solved using the CPLEX solver. Step 5 involves checking the results and recording each solution. In Step 6, the epsilon values are decreased by 30 and 10 s for the first and second models, respectively, then the process goes back to Step 3 and is repeated until the epsilon values reach the ideal points. In our case, the ideal points are indicated as the optimum results of the minimization of IA and EA coverage times for the first and second models, respectively. In Step 7, the iteration process is ended after reaching the last epsilon value.
4. Discussion and Conclusions
In this study, we aimed to optimize the locations of heliports and water sources for responding to forest fires in a heavily forested region in the Milas district of Muğla, Turkey. We developed a multi-objective optimization model for the strategic allocation of heliports and water sources to minimize the response times for forest fires in a forest-fire-prone region. The set-covering problem was used to determine the minimum number of heliports required to cover the region within specified response times. The forest density was integrated as weights in the mathematical model along with other conditions related to the study area such as proximity to roads, settlement areas, slope, wetlands, altitude, etc. In the first model, different IA time coverages were considered to determine tradeoffs between IA time coverages and the number of heliports. Recommendations for further EA coverage and additional water sources were provided based on the evaluation of existing water sources in the second model. As a result, optimal heliport and water source locations for both IA and EA coverages were determined using mathematical modeling. The potential savings of the proposed model were quantified and validated in simulations by comparing it with the current locations of heliports/airports and water sources based on historical fire data.
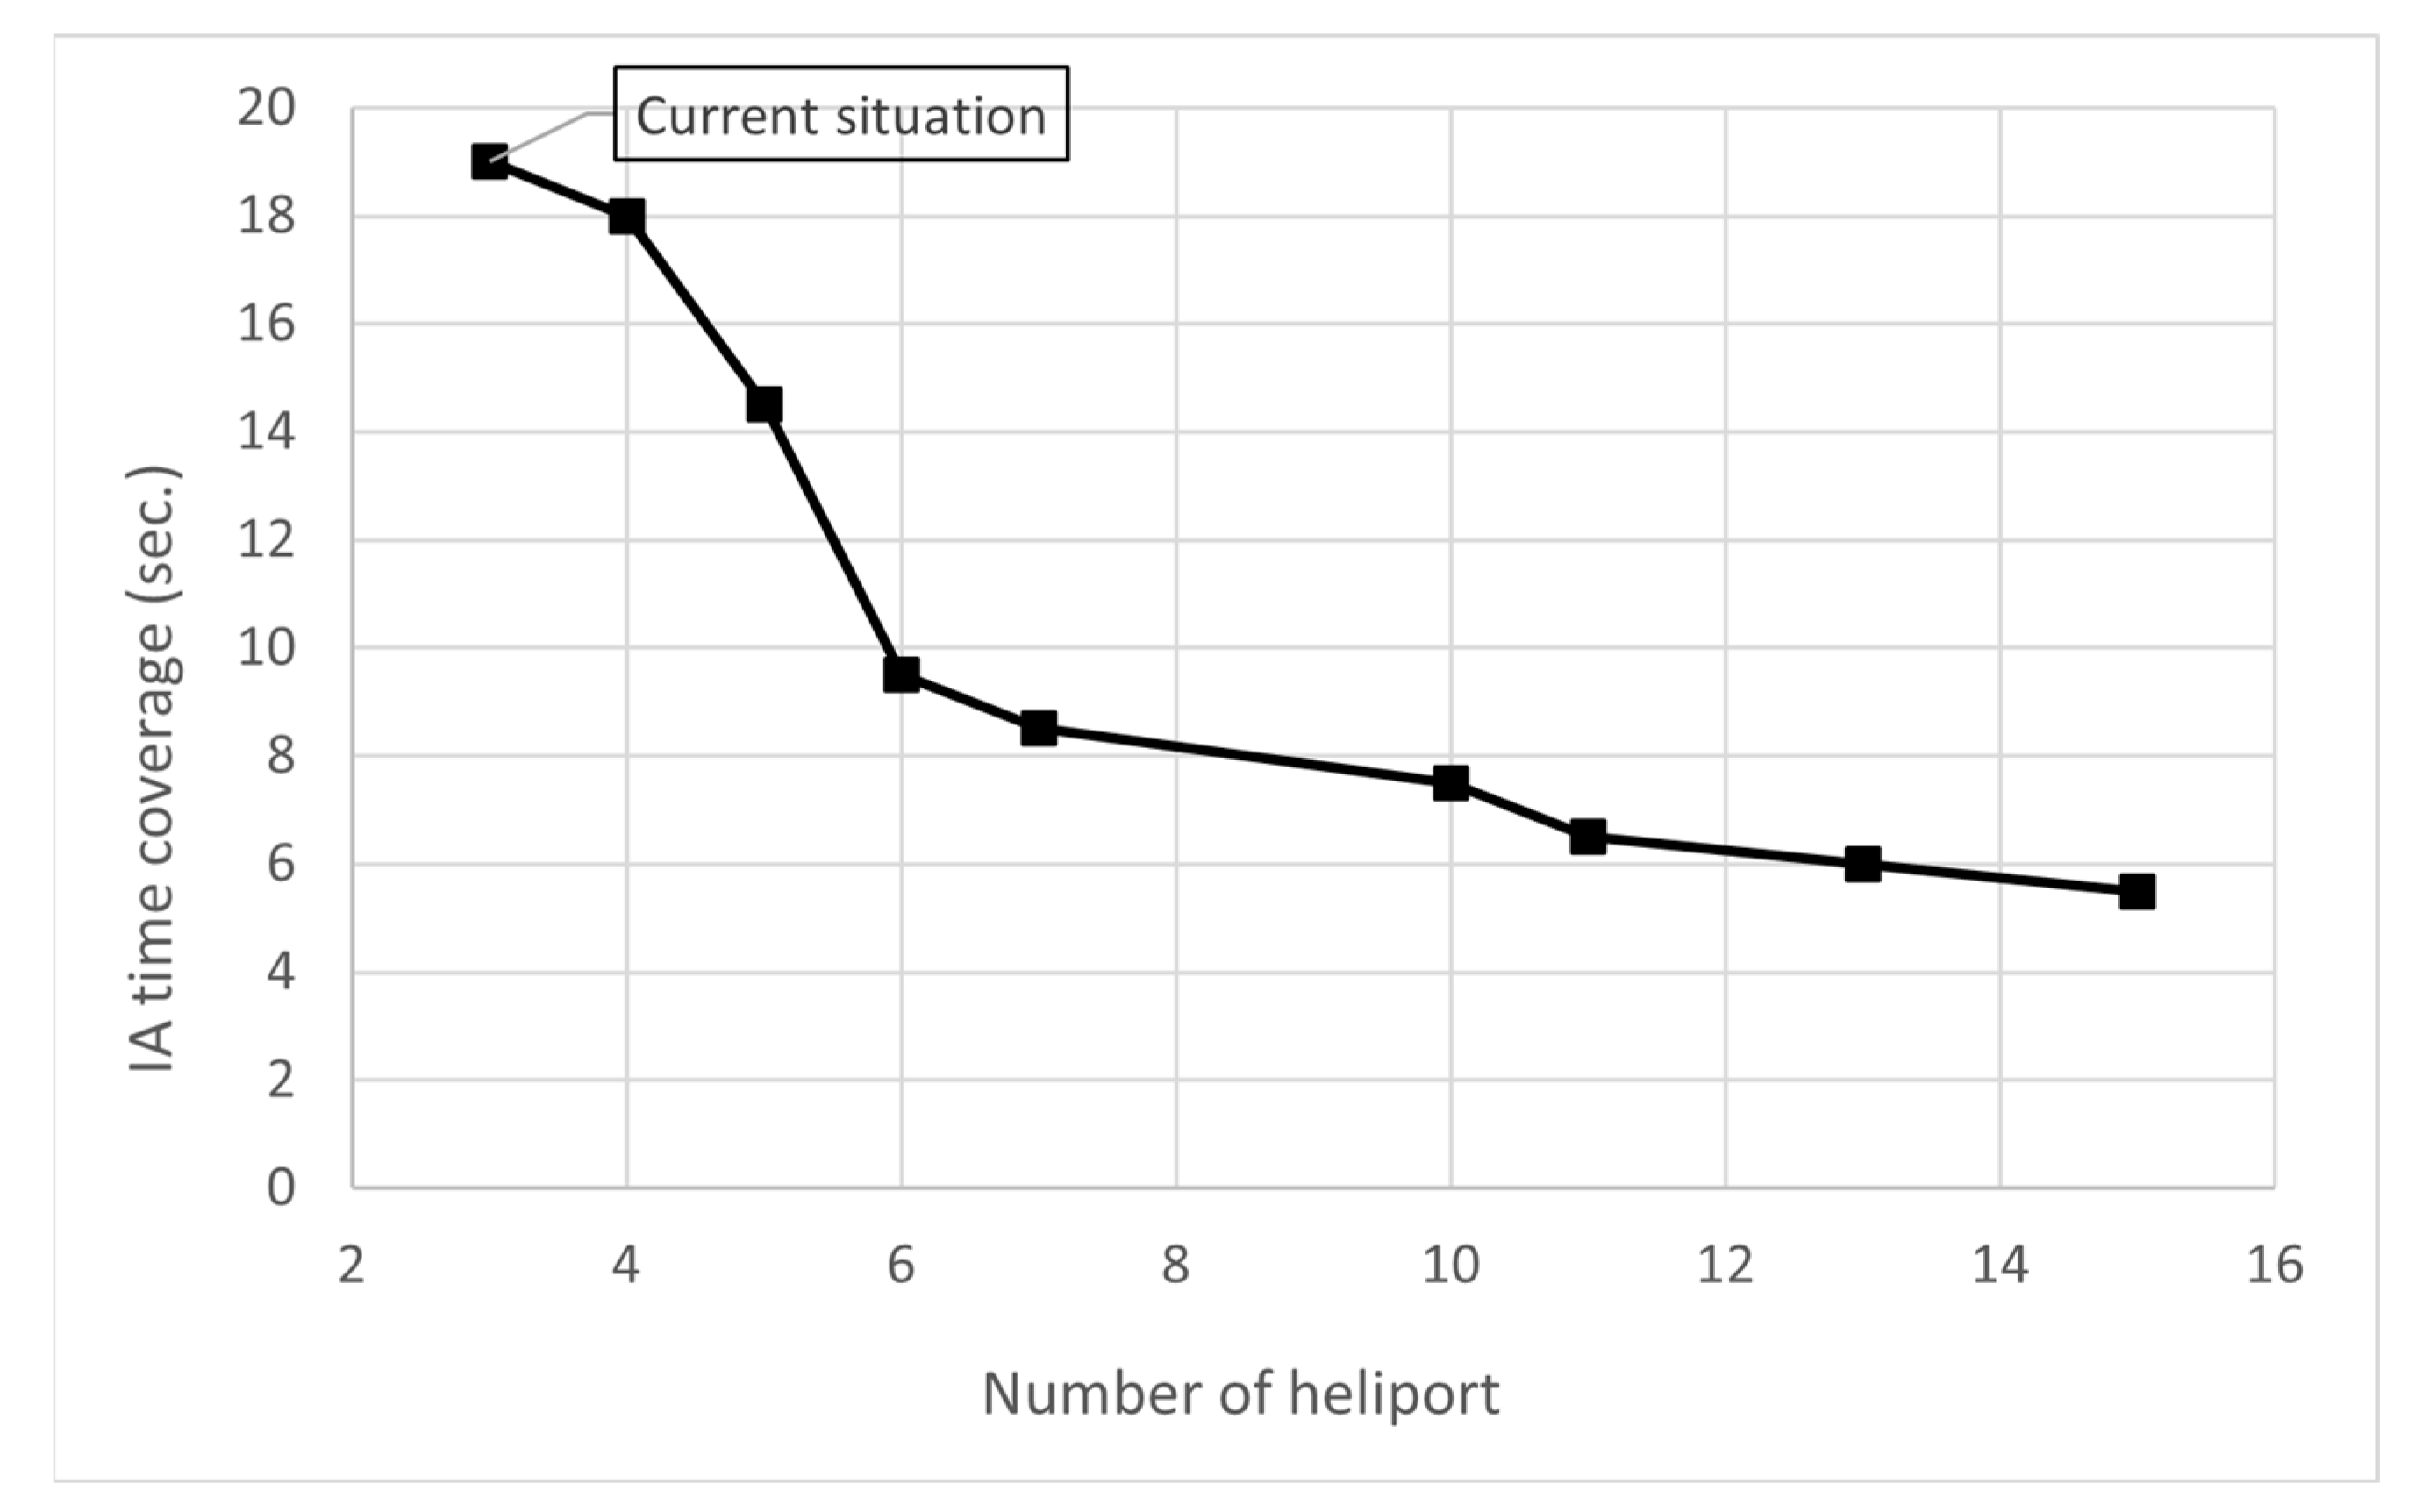
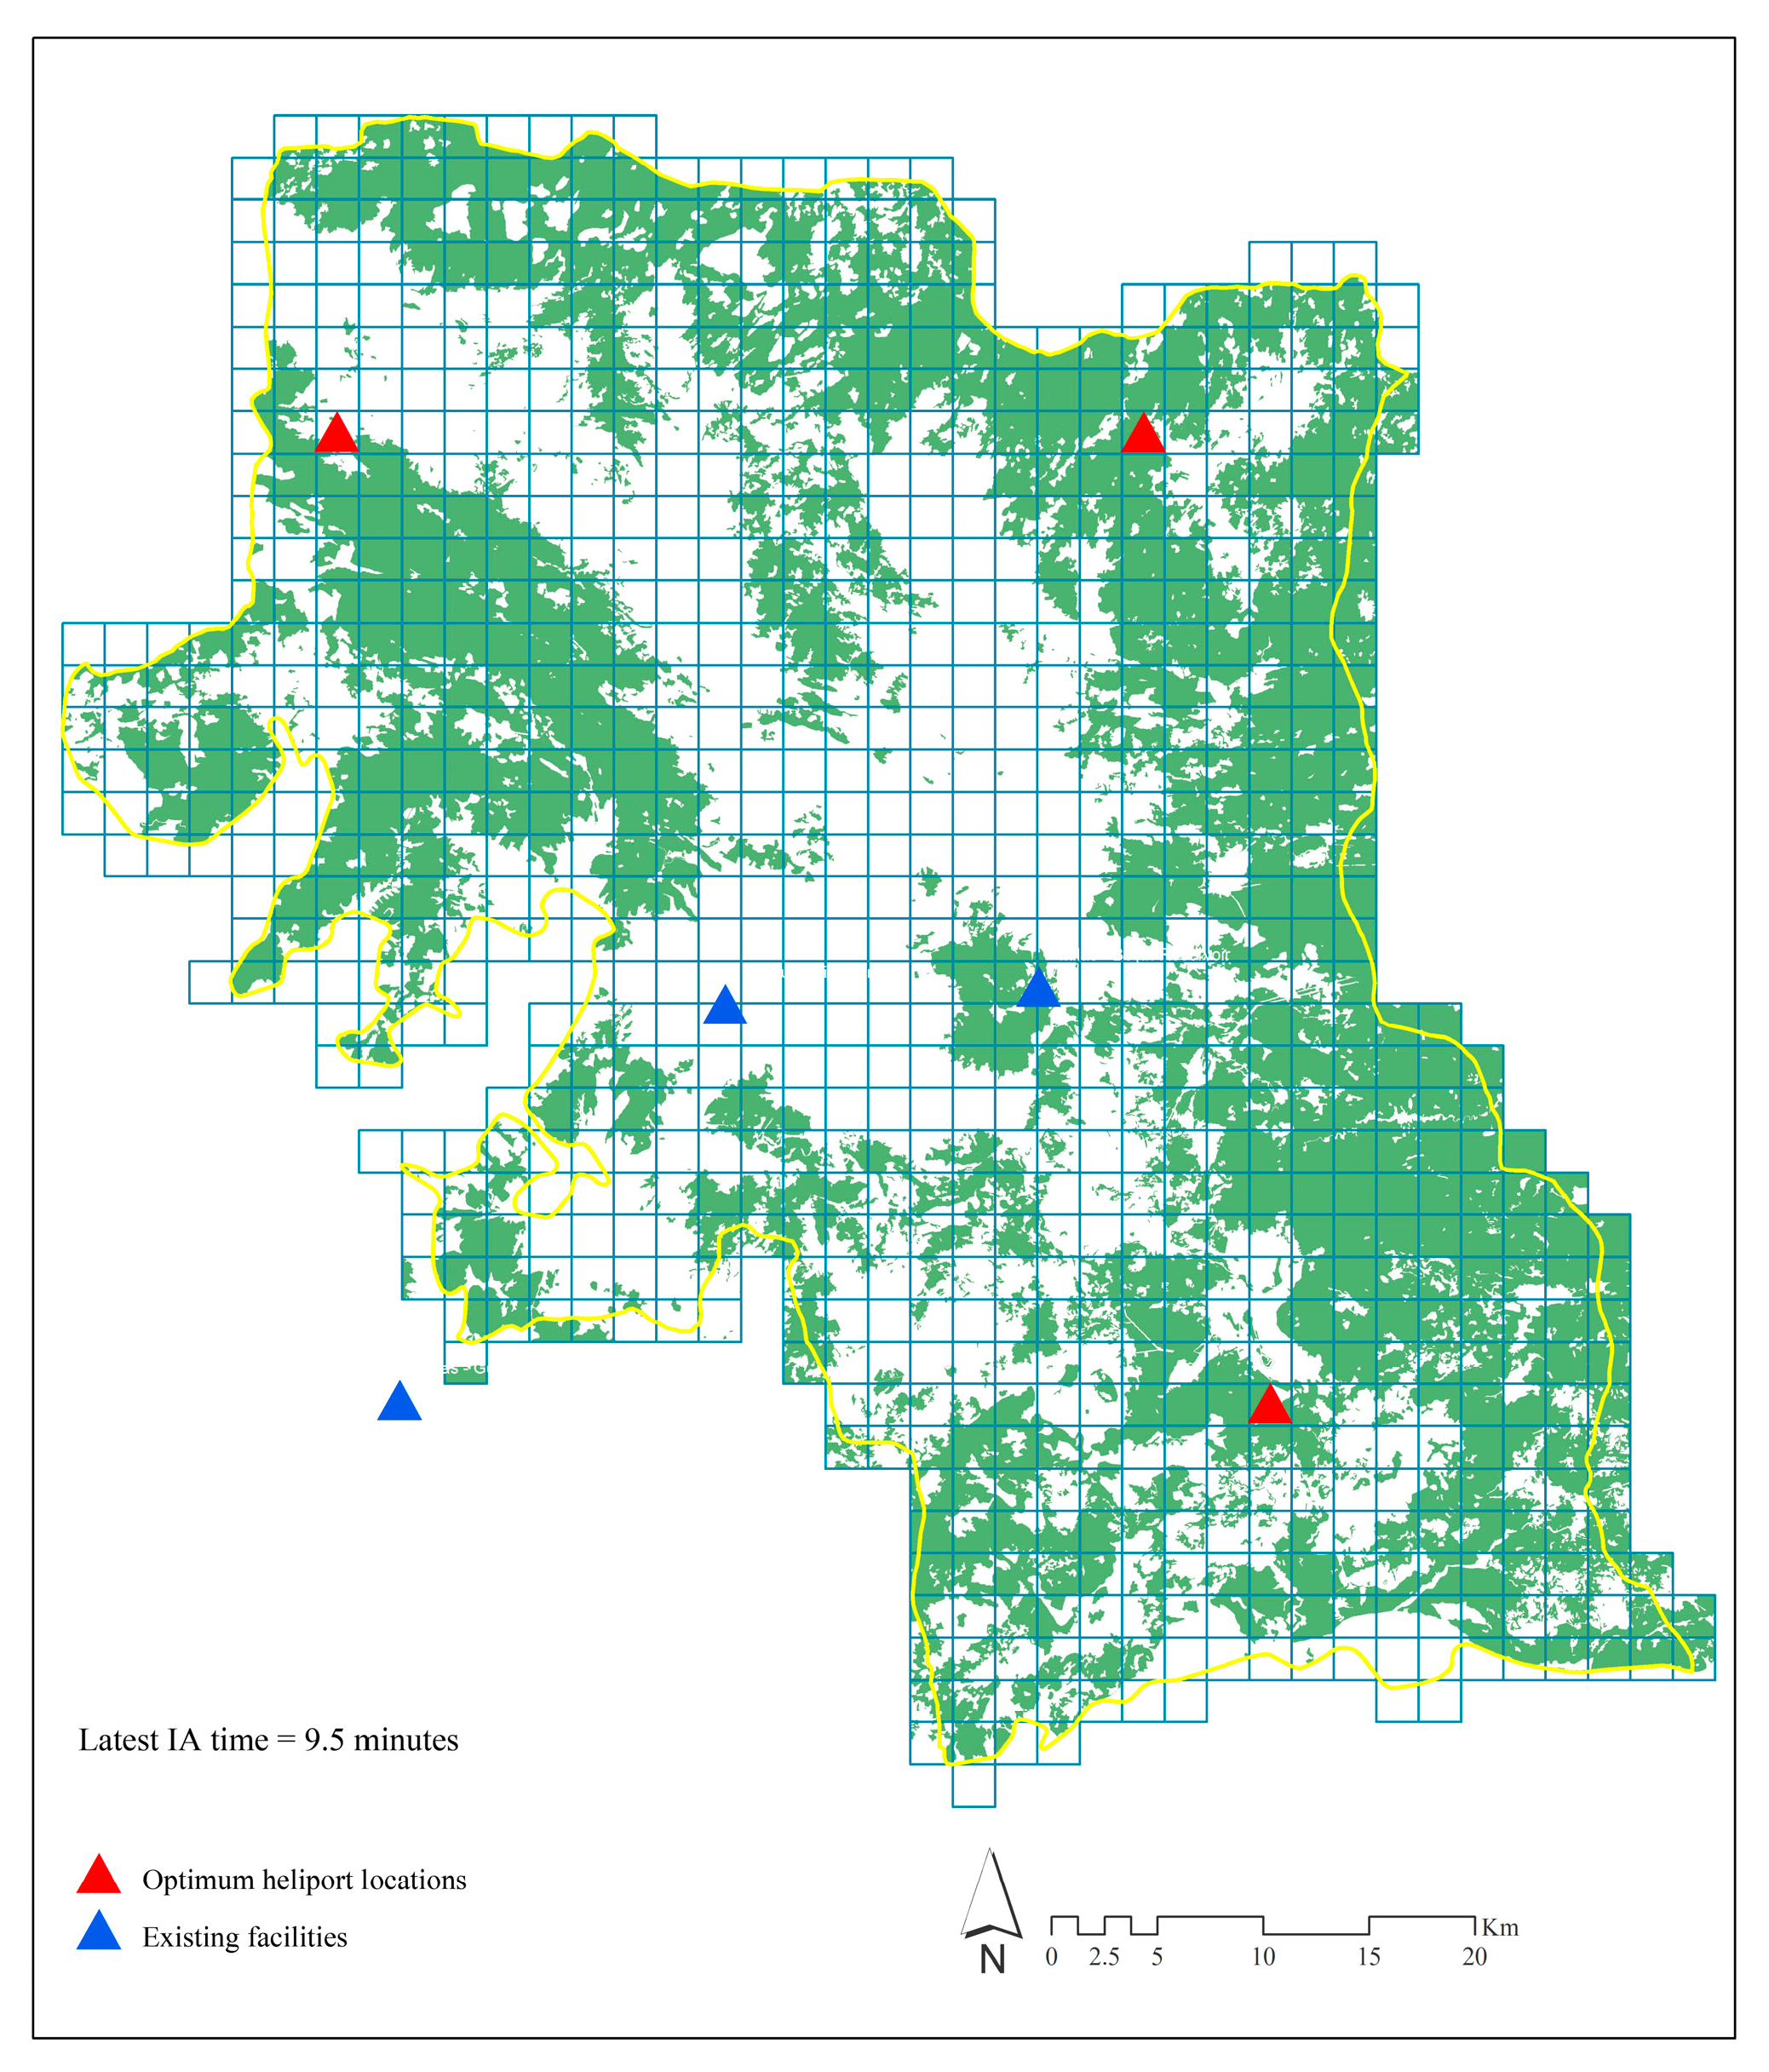
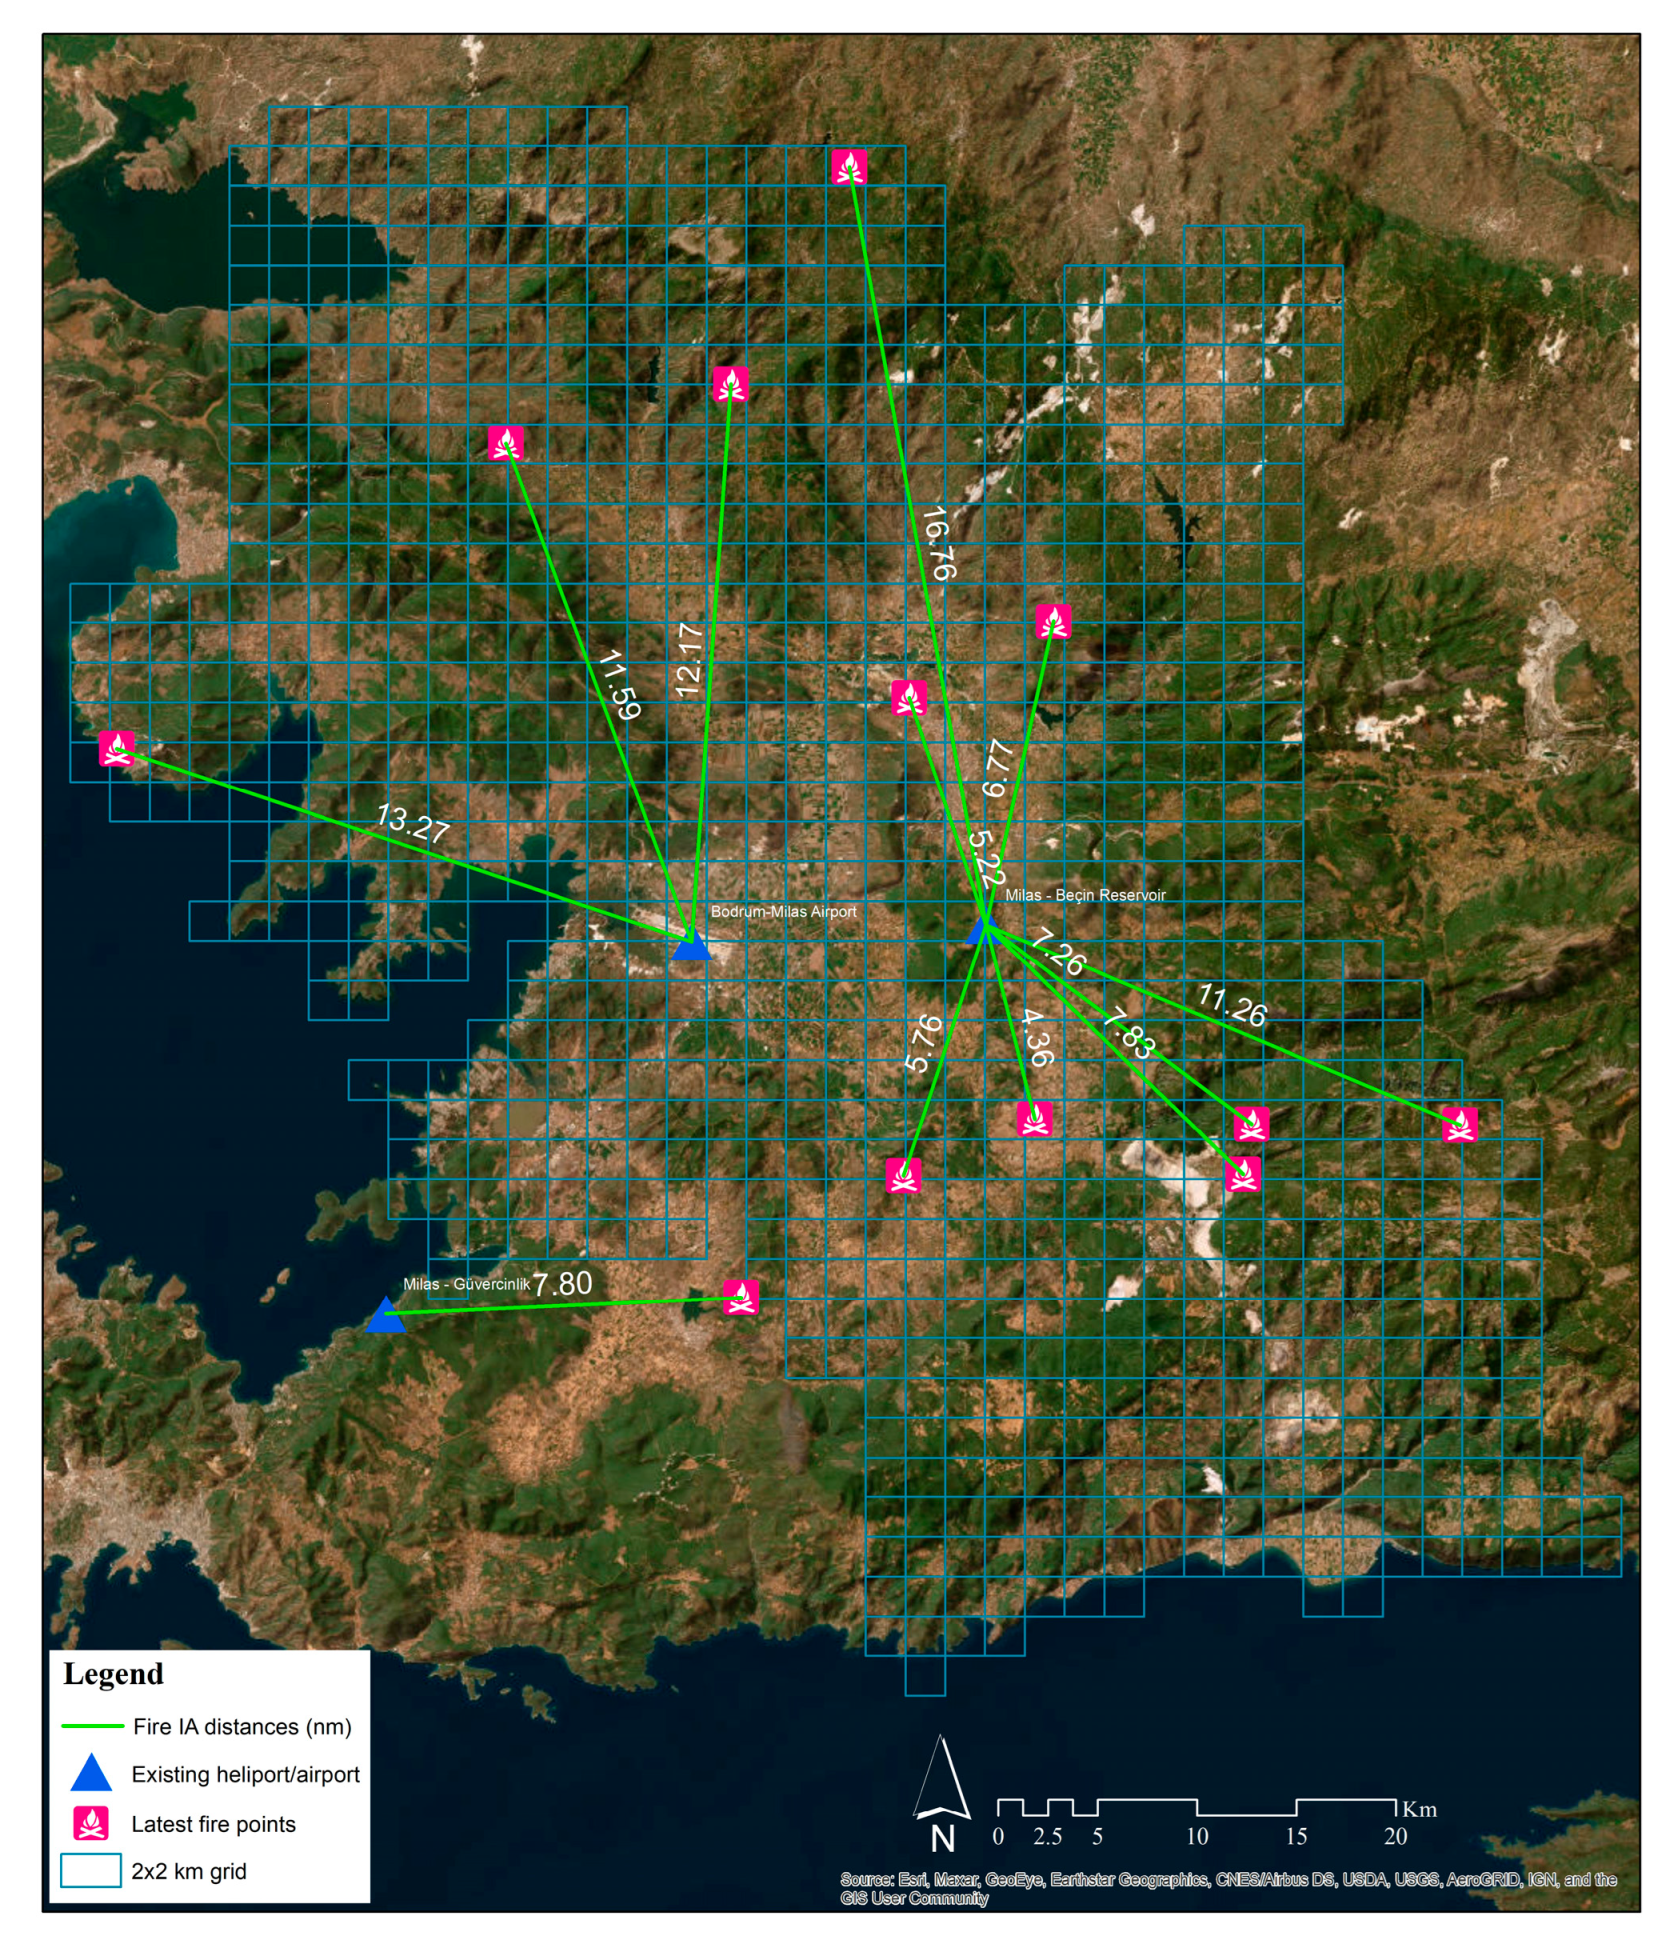
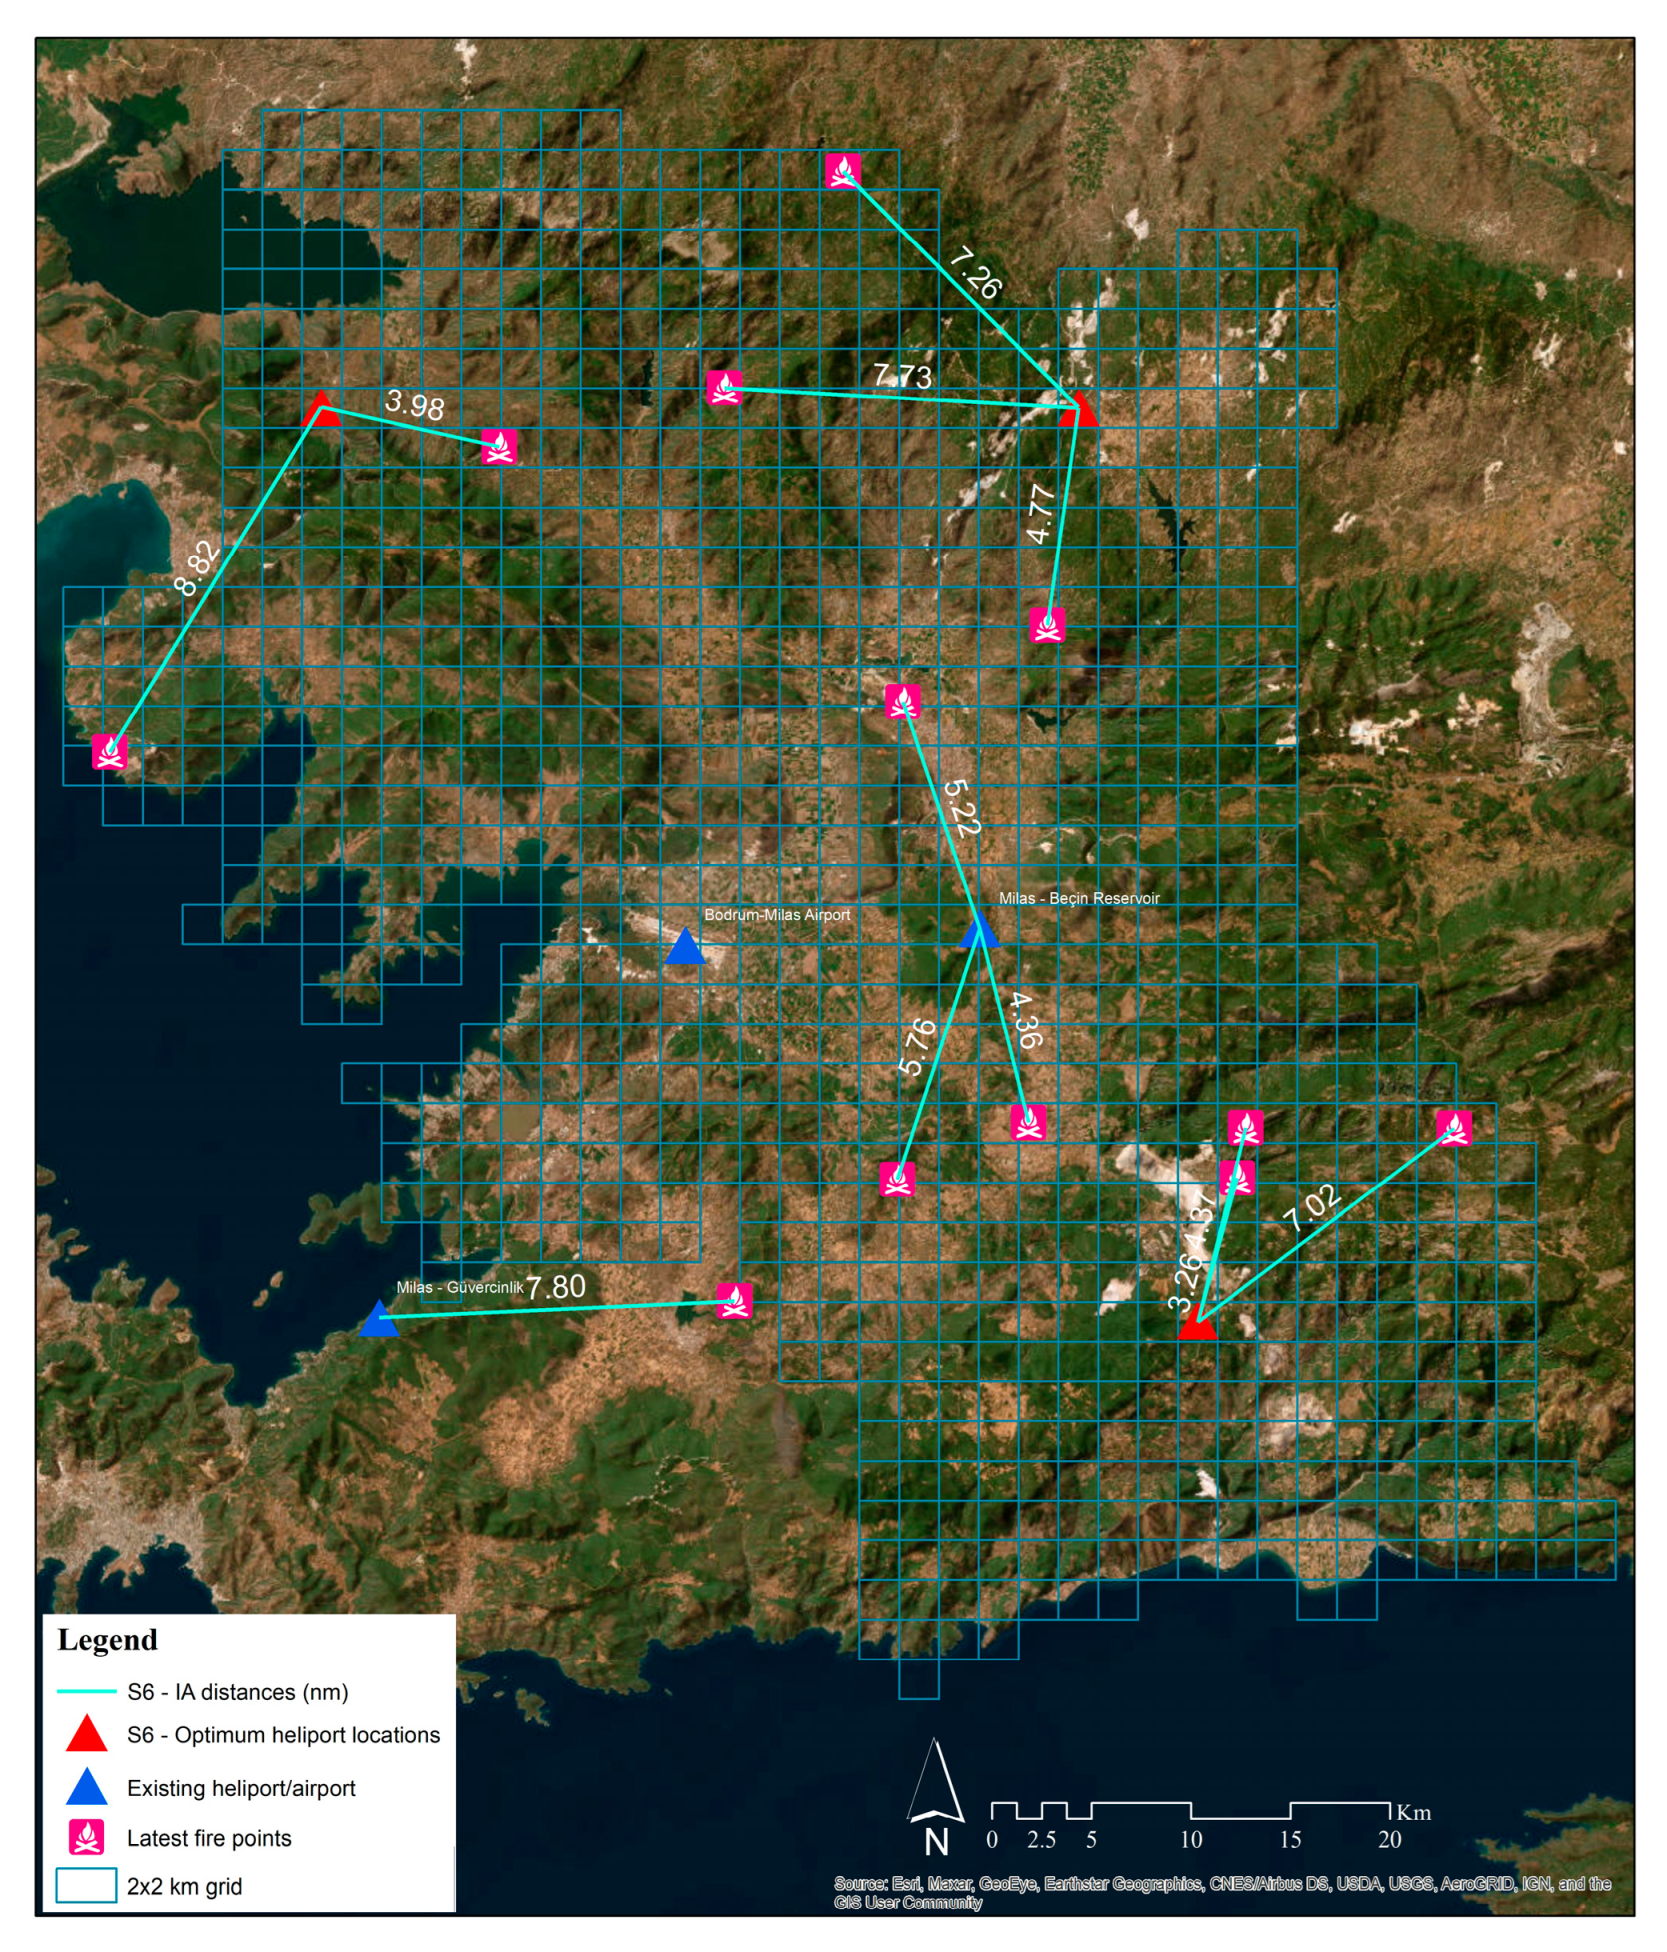
We performed a multi-objective programming approach using the epsilon constraint method to scalarize the objectives. IA time coverages were reduced in 30-s intervals when minimizing the number of heliports, and solutions were obtained for IA time coverage up to 5.5 min. There are two heliports and one airport serving forest fires in the current situation, and the IA time coverage is 19 min. We suggest that with the addition of three extra heliports, IA time coverage can be reduced by 50% to 9.5 min, while a total of 12 additional heliports could further reduce IA time coverage to 5.5 min. Since building a heliport incurs both preparation and sustainability costs, the most efficient solution s6 can be the best alternative for the decision makers. Additionally, we attempted to find the optimal locations for water sources in the second model.
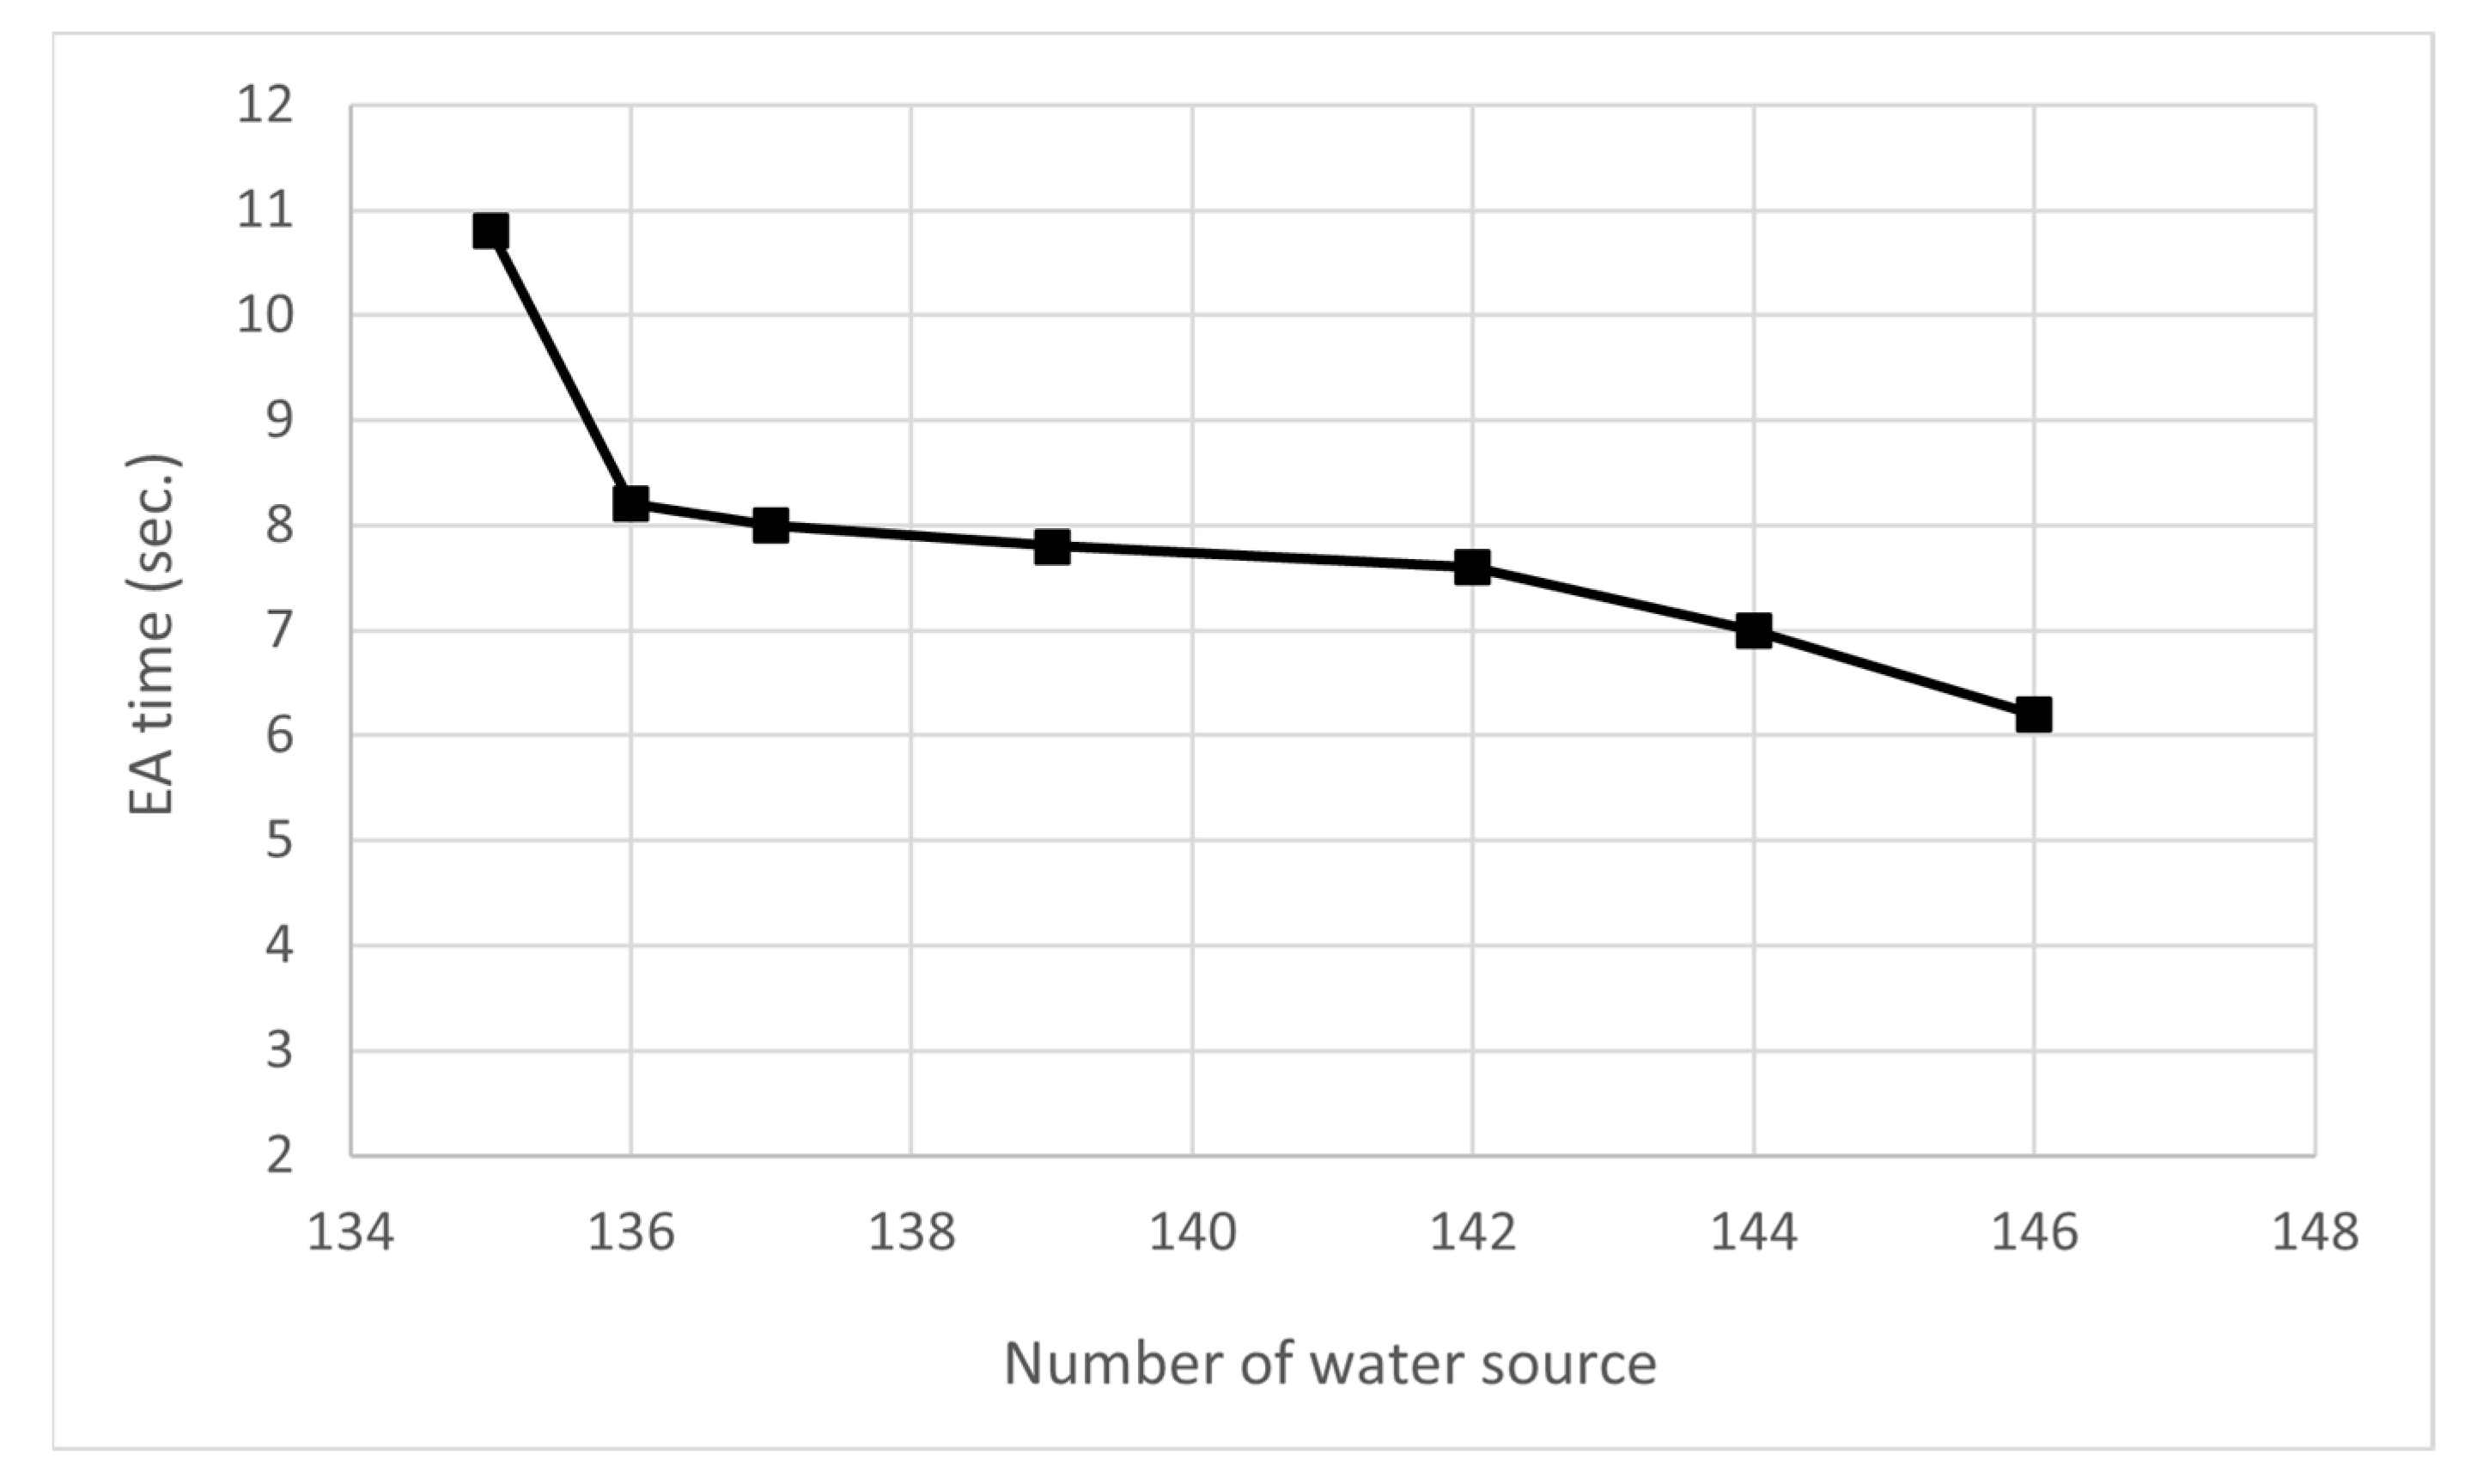
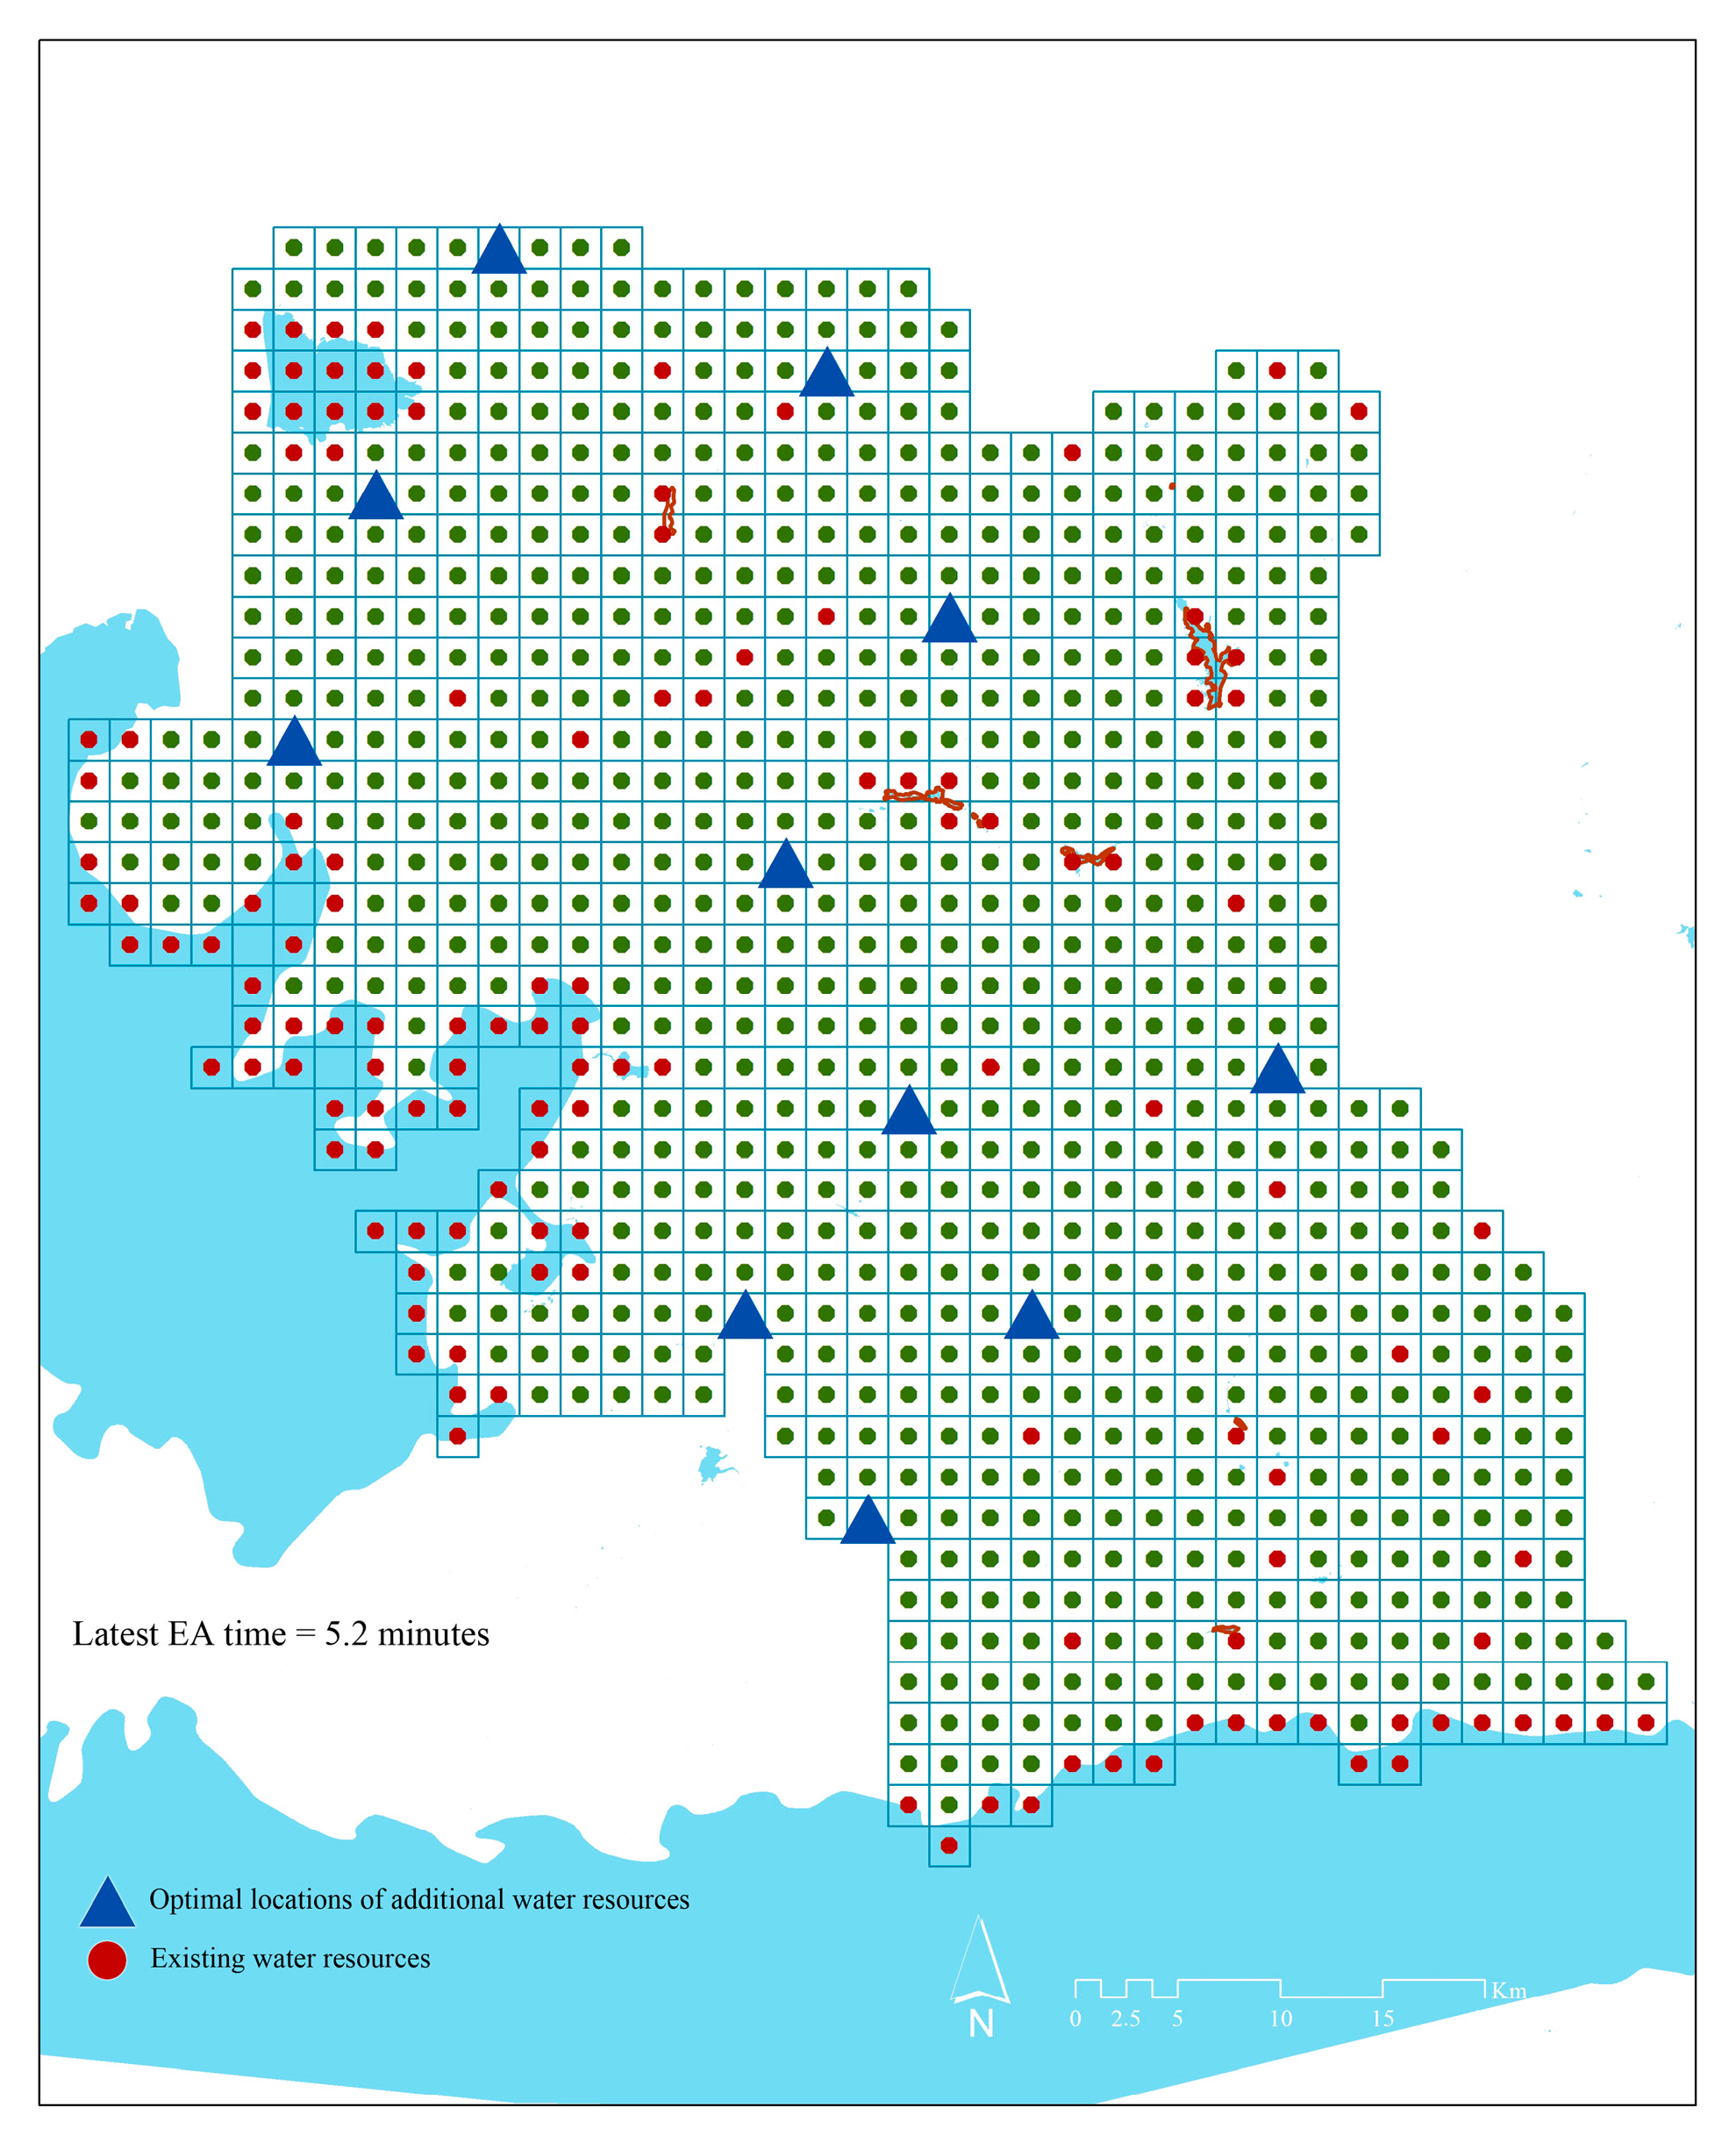
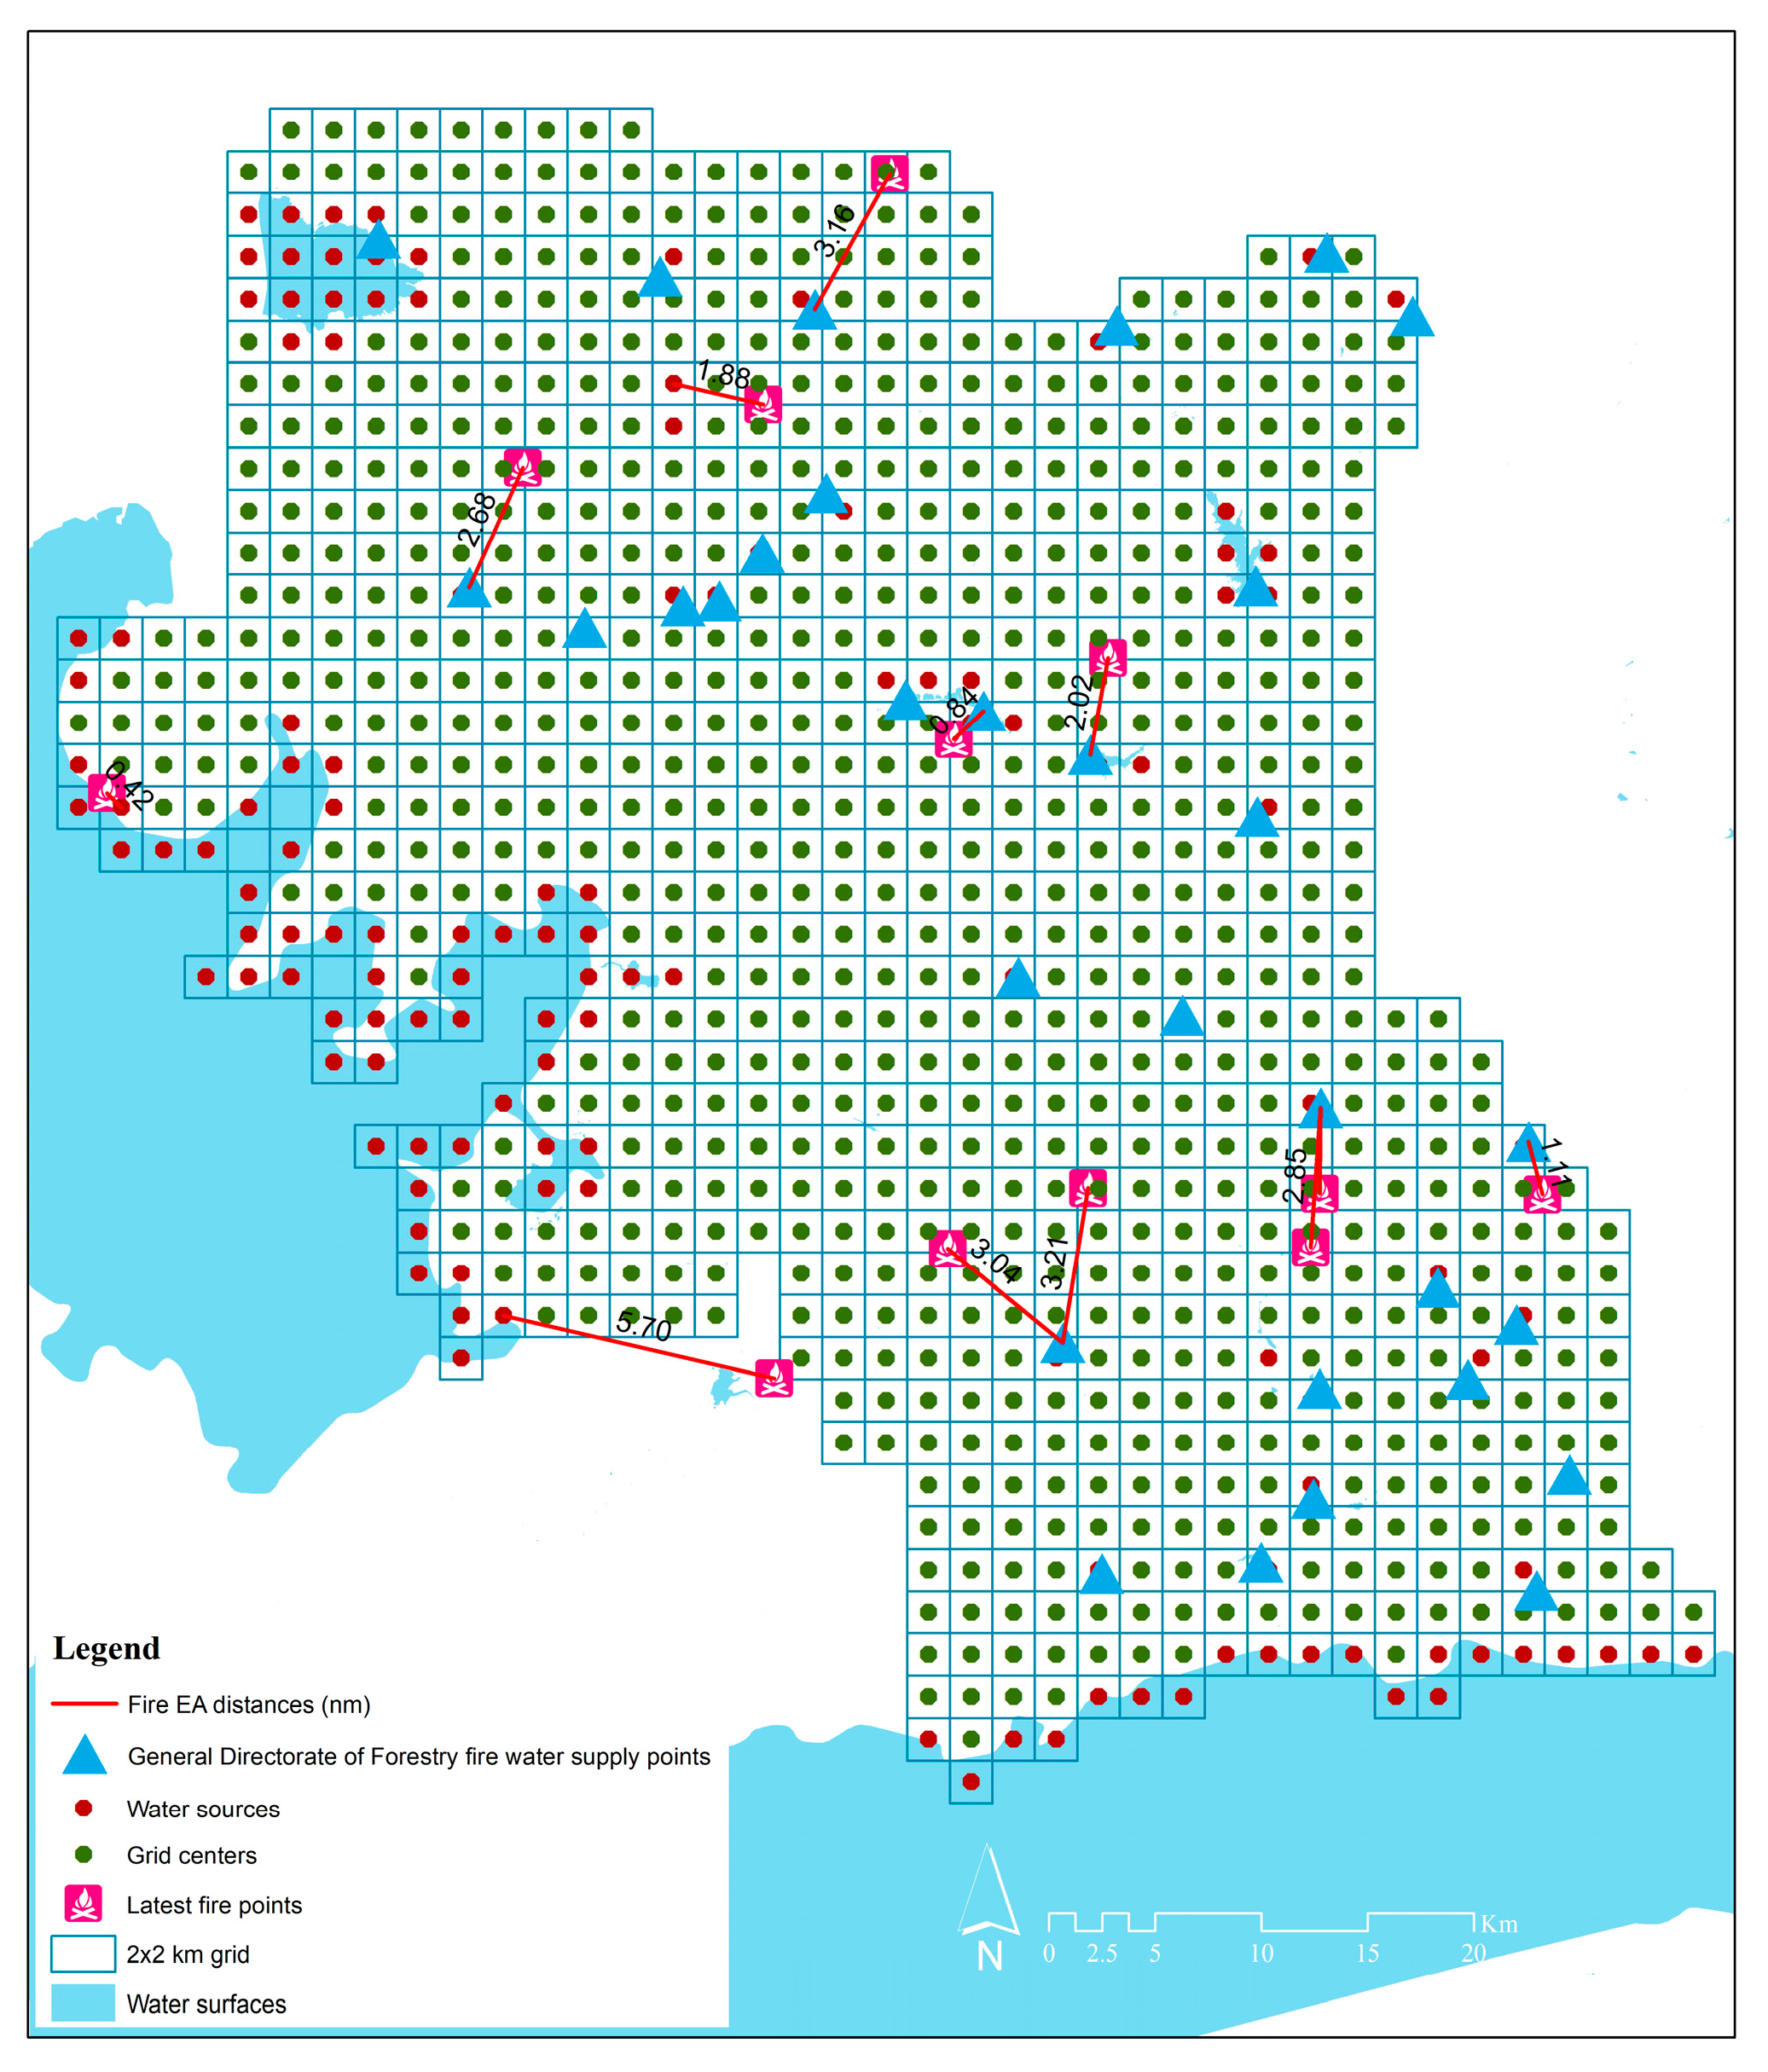
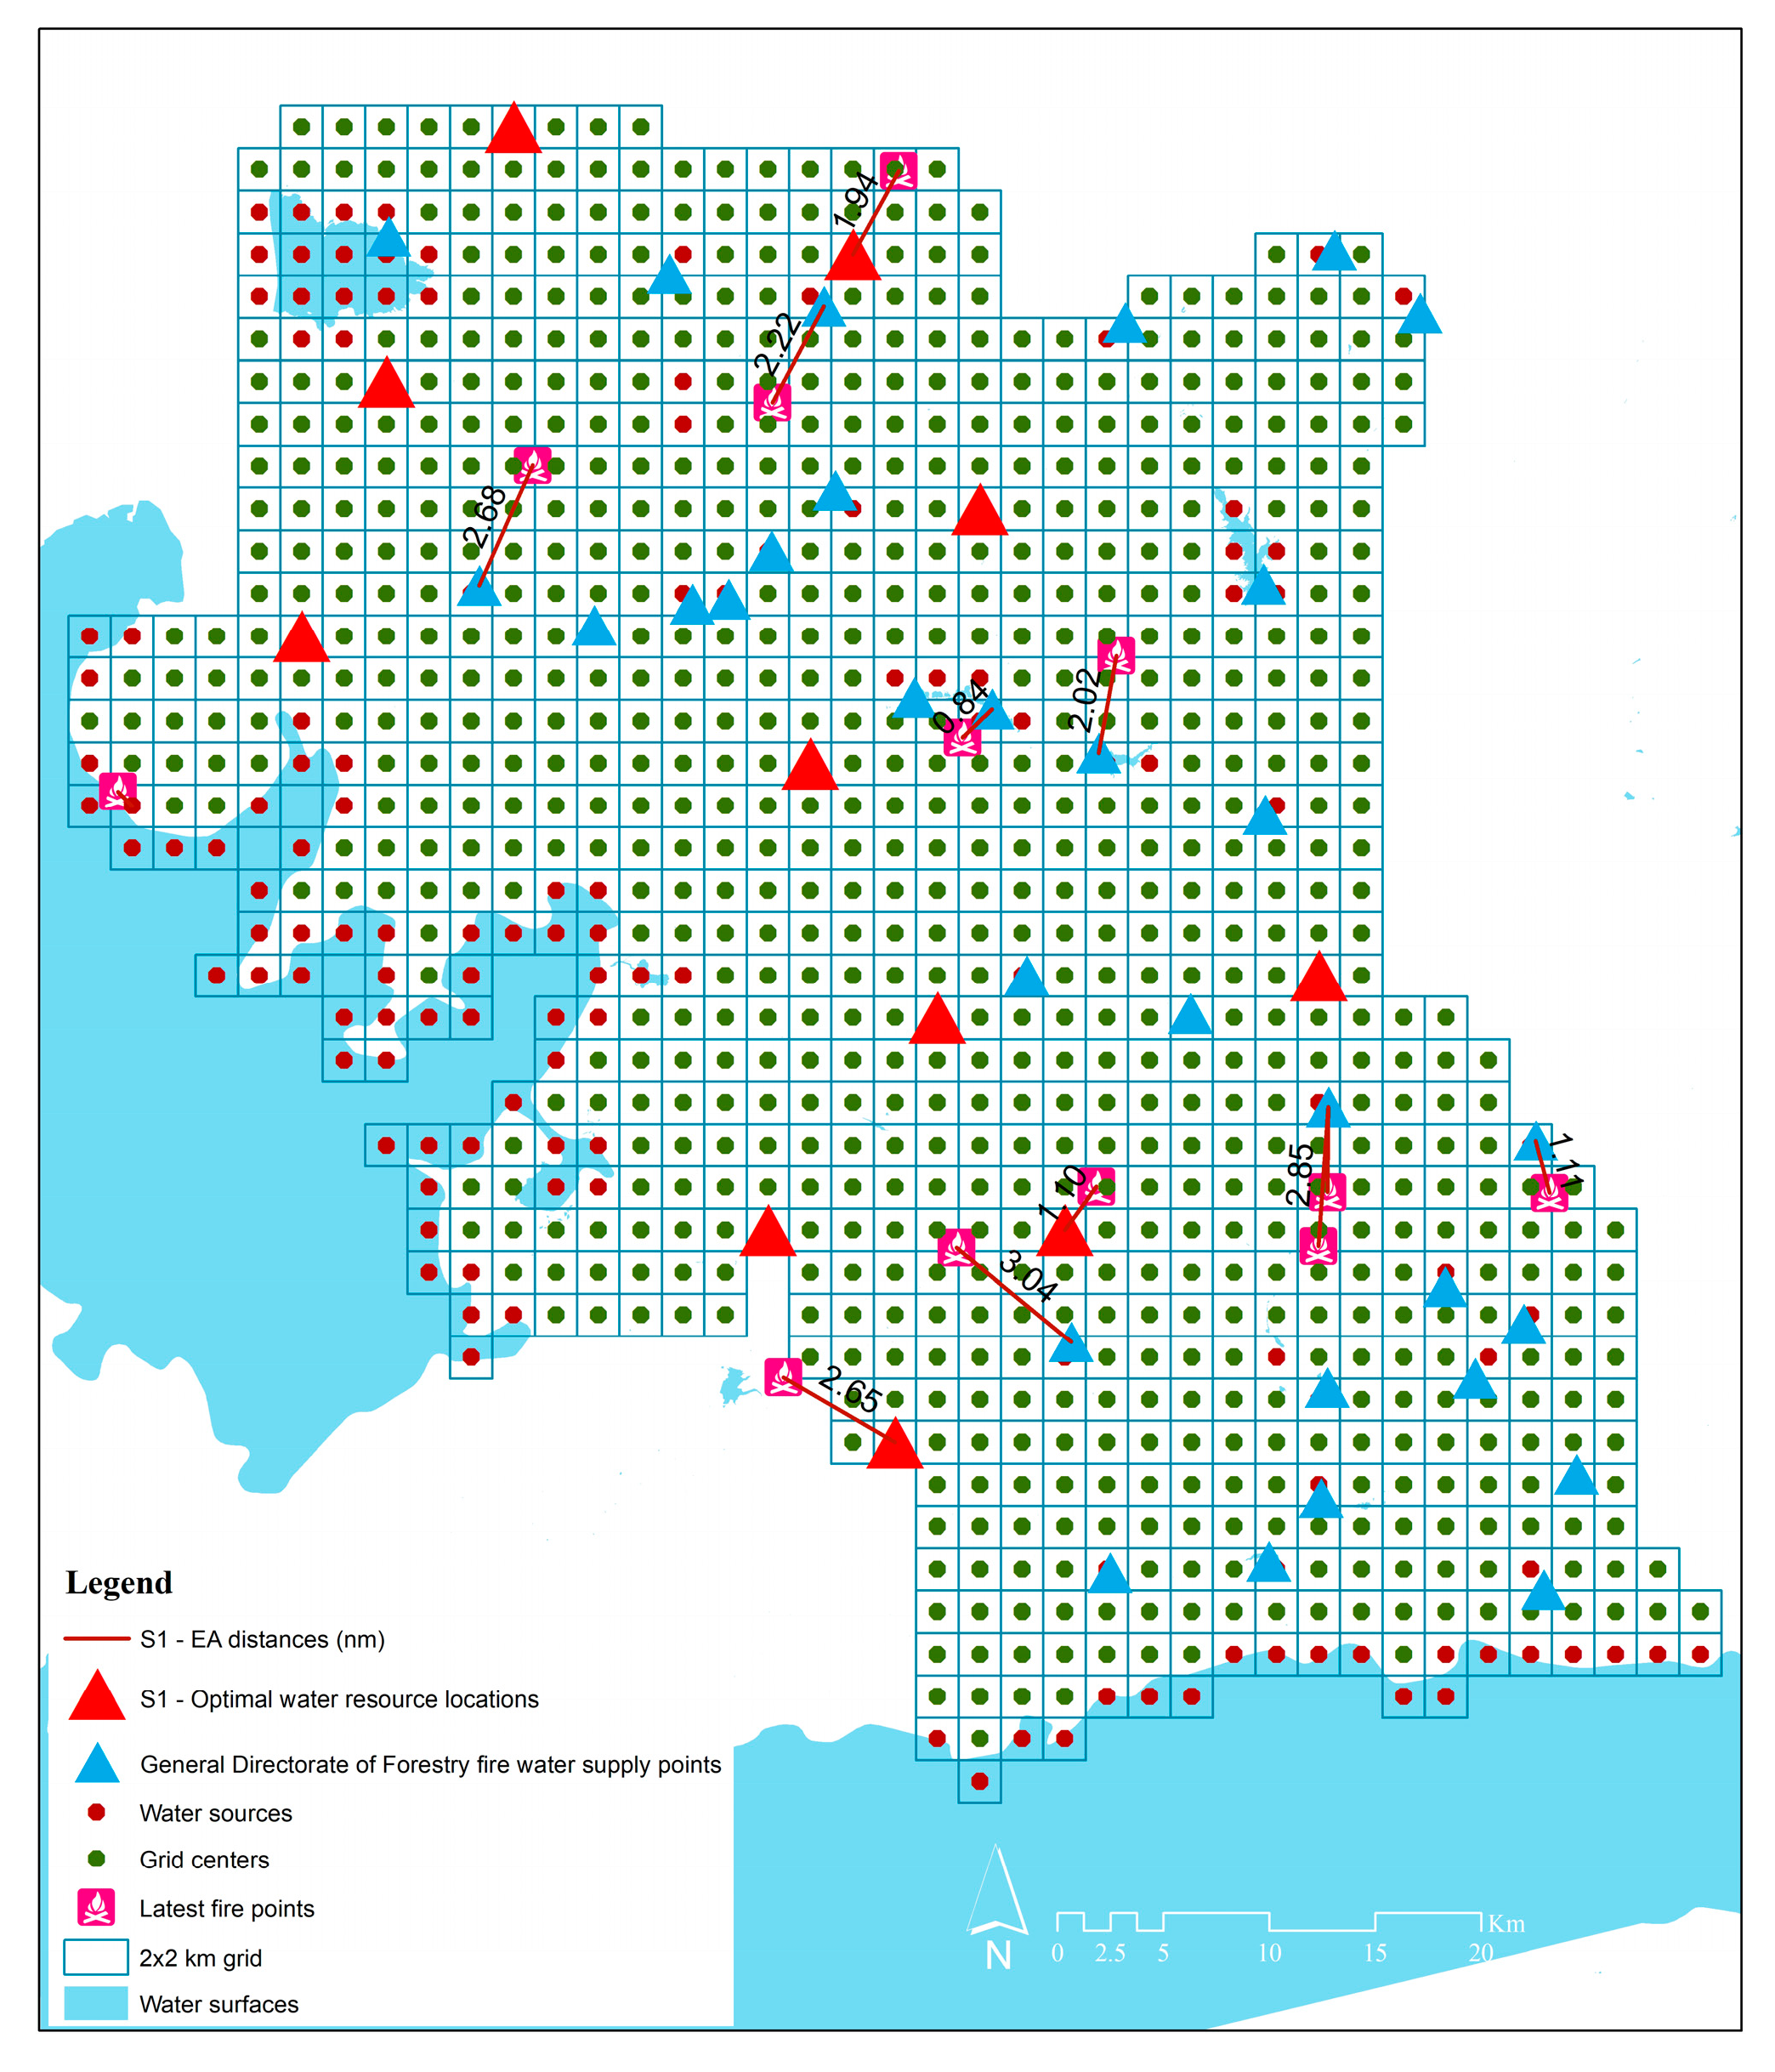
In the second model, EA time coverages were reduced in 10-s intervals when minimizing the number of water sources. The model considered existing water sources such as fire water supply points of GDF and natural water sources, and six Pareto optimal solutions were obtained. These solutions illustrated the tradeoff between EA coverage and the number of water sources. The solution with the highest average improvement per water source involved adding only one more water source, and it reduced the EA time coverage to 8.2 from 10.8, which is the coverage of the current situation. On the other hand, the solution that resulted in the highest total improvement involved adding 11 more resources, which resulted in 6.2 min of EA time coverage. Since the cost of building a pool was considered relatively low, making the latter solution was more feasible for decision makers.
We also tested the performance of our model in simulations by using real data from the latest fires and found that the model was able to significantly reduce the IA and EA times compared to the current situation. The addition of only three heliports reduced the highest IA distance from 16.76 nm to 8.69 nm. On the other hand, adding twelve heliports resulted in an average IA time reduction of 56.8% compared to the current situation (from 6.88 to 2.97 min). Reducing IA is curial for extinguishing forest fires while they are still at the beginning. The extensive utilization of the recommended heliport locations in simulations is a noteworthy observation. According to the simulation results, the recommended heliports were used to respond to 91.6% of the 12 fires in s1. Additionally, the utilization rate was also high in s8, where even with the recommendation of only one additional heliport, it was used to respond to 33.3% of the fires.
Although IA is performed one time, EA is performed several times when fighting a forest fire. The addition of only one water source reduced the highest EA distance from 3.2 nm to 2.7 nm, while an additional eleven water sources resulted in an average EA time reduction of 35% compared to the current situation. Therefore, even small improvements in EA are significant when considering its cumulative effect. Considering an average of 7 to 10 EA sorties based on historical fires, our solutions may provide additional EA time of up to 11 min (
Table 7), which corresponds to approximately three more sorties for the same durations given in
Table 8. When considering the water-carrying capacities of heavy category helicopters as 10 tons, the model solutions may provide up to 31.7 tons of additional drops considering the 10 sorties scenario.
It is also worth noting the substantial utilization of the recommended water sources in simulations. The simulation results indicate that the recommended water sources were utilized to respond to 41.6% of the 12 fires in s2. Despite the lower utilization rate in the other scenarios, given the abundance of available water sources, the usage rates of the recommended water sources can still be considered significant.
Our solutions can also be interpreted in terms of the costs associated with both IA and EA strategies. Considering the cost of helicopter flights even 1 min of saving for both IA and EA may provide significant financial gains. Taking into account tenders in 2020 and 2021, each minute of a firefighting helicopter flight corresponds to an average cost (at least) of approximately 400 to 500 Turkish lira (equivalent to approximately 20 to 25 euros at the current exchange rate) [
33]. It should be noted that these figures are not exact and may vary between tenders. These average values are presented for indicative purposes and do not precisely reflect formal values. Similar costs may be seen from a similar study carried out in Italy [
4].
Table 9 and
Table 10 show the average expected cost savings of model solutions in historical fires simulated for the IA and EA times, respectively. (Note that the calculations are based on the EUR 25 per minute).
Table 9 and
Table 10 indicate that cost savings may be provided up to EUR 97 and EUR 275 for IA and EAs. This indicates the overall cost savings may be provided up to EUR 372 for only a single fire. This number can be further increased depending on the number of EAs. In addition, as reducing the number of minutes flown will also reduce maintenance and crew costs, the savings could be even higher. Considering the 2793 fires in 2021, this saving may reach up to millions of euros, and it may prevent damage to natural life, casualties, or property damage. These gains can enable the recovery of heliport and pool costs in a short period. Overall, our model provides a useful tool for decision makers in forest-fire-prone regions to strategically allocate resources and improve response times for emergencies as well as to achieve cost savings.
5. Limitations and Future Work
By enhancing the risk analysis for the weights of heliport location-allocation, the study can provide a more comprehensive understanding of the factors that contribute to fire risk rather than relying solely on forest density as a risk indicator. In addition, the data selection process may be enhanced by considering additional spatial data such as plant types, population density, humidity, drought indexes, annual temperatures, etc. [
14,
25]. This can lead to more accurate predictions and better decision making in terms of heliport allocation. In addition, expanding the area of observation can also provide a more comprehensive view of the problem, as the impact of neighboring facilities on fire risk and management can be significant.
Another issue is that helicopter performances are uncertain. These uncertainties depend on pilot performances, helicopter types, wind conditions, or flight levels [
34]. Examining the uncertainties associated with helicopter performance and developing a stochastic mathematical model can also provide a more realistic picture of the problem. By incorporating uncertainties into the model, the study can account for the variability associated with real-world situations and provide more accurate predictions. In addition, it was assumed in the current model that a helicopter would be available at the designated heliports for each fire. However, in the event of multiple fires, it is possible that the resources may not be immediately available at the intended heliport due to allocation to other fires. Additionally, some fires may require the deployment of multiple helicopters, which is not currently accounted for in the model. The current model minimizes IA and EA coverage for responding to a single fire, but it may not adequately address the demands of large-scale fires that require additional resources. To address these limitations, demand capacity constraints will be incorporated into the model in future stages. This will allow for the determination of not only the optimal location of the heliport but also the necessary number of helicopters that should be stationed at each heliport. In addition, the regions where forest fires are concentrated can vary seasonally. This may require the concentration of aerial resources in areas where demand is high during the relevant periods. By reflecting these uncertainties in the capacity–demand constraints to be developed, this problem can be prevented. By accounting for these additional factors, the model can more accurately assess the resource needs for responding to large-scale forest fires and ensure that the optimal allocation of resources is achieved.
In the present study, the preparation times of crews were not considered. However, it is noteworthy that the preparation of the crew for the fire may entail a substantial amount of time. This constitutes an additional issue that necessitates further investigation to enhance the overall effectiveness of fire management strategies.
Validation of model results using UAV can also help to ensure that the model is accurate and reliable. UAVs can provide a more detailed view of the area, which can help to validate the predictions made by the model [
35]. During the validation process, it is crucial to consider property rights in the identified optimal areas. In the event that investigations reveal procedural or insurmountable obstacles to establishing a heliport in a particular area, alternative plans should be explored. Generating alternative plans after validation studies can help to ensure that the model recommendations are applicable and feasible in real-world situations. By easily modifying the mathematical model, alternative solutions can be obtained quickly, which can provide a more dynamic validation process. This can help to ensure that the model is accurate and reliable and that the recommendations are feasible in real-world situations.
Overall, the proposed future work can enhance the study by providing a more comprehensive understanding of the factors that contribute to fire risk and by accounting for uncertainties and limitations associated with the current study. This can help to provide more accurate predictions and better decision making in terms of resource allocation.


