Article

Probabilistic Failure Risk of Aeroengine Life-Limited Parts Considering the Random Load Interference Effect

1
Aircraft/Engine Integrated System Safety Beijing Key Laboratory, Beihang University, Beijing 100191, China
2
Tianmushan Laboratory, Hangzhou 310023, China
3
Administrative Department, Civil Aviation University of China, Tianjin 300300, China
4
Airworthiness Certification Center, CAAC, Beijing 100102, China
*
Author to whom correspondence should be addressed.
Aerospace 2023, 10(3), 301; https://doi.org/10.3390/aerospace10030301
Submission received: 13 February 2023 / Revised: 8 March 2023 / Accepted: 14 March 2023 / Published: 17 March 2023
(This article belongs to the Section Aeronautics)

Abstract

:
Probabilistic failure risk analysis of aeroengine life-limited parts is of great significance for flight safety. Current probabilistic failure risk analysis uses equal amplitude load calculations for conservative estimation, avoiding inclusion of the interference effect analyzing random loads due to its massive computational complexity and leading to reduced analysis accuracy. Here, an efficient algorithm is established to solve this computational problem, and an analytical framework is established to consider the interference effect of variable amplitude load. The corresponding probabilistic failure risk analysis is performed for the centrifugal compressor disk. The results show that considering the interference effect of random variable amplitude loads causes a significant decrease in the risk of failure, and the efficient algorithm has advantages over the Monte Carlo sampling method in accuracy and efficiency when considering load interference. This work provides a reference for exploring the probabilistic damage tolerance method under complex loads and supports the optimal design of life-limited parts.

1. Introduction

Failure of aeroengine life-limited parts leads to catastrophic consequences, so it is important to ensure the flight safety of aeroengine life-limited parts. The Federal Aviation Administration (FAA) proposed in AC 33.14-1 that factors such as material defects and stresses applied during operation should be taken into account to realize probabilistic failure risk analysis of life-limited parts [1]. Based on the above requirements, a probabilistic failure risk analysis framework is proposed here. The framework considers the randomness of initial defect distribution, applied load, material properties, and nondestructive examination, and the corresponding probabilistic failure risk is obtained through sampling calculation [2]. Engine safety is improved by reducing the probability of failure below a specific design target risk value during the design process (component event rate is always set at 10 9 ) [1].
Using sensitivity analysis of the factors of failure probability, it can be seen that the randomness of defect size and of stress characteristics have the greatest influence on the risk of failure for the centrifugal compressor impeller [3]. Of these, defect size characteristics can be determined in industry [4], whereas the characterization and analysis of stresses require improvement. Traditional probabilistic failure risk analysis simplifies the load spectrum into a constant amplitude load calculation for conservative estimation to avoid the massive computation caused by the interference effect of analyzing random loads. When multidimensional random variables, including stress uncertainty, need to be considered, the probabilistic life evaluation method first samples different stress values for equal amplitude load calculation and then weighs the results according to the occurrence probability of different stress values to obtain the failure probability [5,6,7]. However, due to the randomness of flight state and operation, the stress of the engine fluctuates under different cycles, and it is not practical to use the simplification of a constant amplitude load. At the same time, the load interference effect retards crack growth rate [8,9], and ignoring the load interference effect will cause a loss of accuracy in failure risk. Therefore, it is necessary to change the load characterization method to reflect random load sequences and to use a corresponding computational model to analyze the load interference effect.
When considering the random load interference effect, analysis efficiency is greatly reduced due to the need to include the influence of a preceding load on a subsequent load. Original acceleration methods, such as the life approximation function [10], numerical integration [11,12], importance sampling [13], and first/second order reliability [14], are all based on the assumption that the applied load is constant over the whole life cycle. Therefore, these acceleration methods cannot be applied to the analysis of life-limited parts considering load interference. Juan et al. [15] achieved an efficient calculation of variable amplitude load by transforming the variable amplitude load spectrum (without considering the interference effect) into a constant amplitude load spectrum. However, if the load interference effect is considered, the integral equation of this method cannot be simplified, and thus the analytical efficiency cannot be improved. Therefore, the original algorithm needs to be improved to adapt to the load interference problem.
To solve these problems, this paper changes the load characterization method, selects a calculation model considering load interference, and develops a new acceleration algorithm for the analysis of failure probability to realize an analysis that considers the random variable amplitude load interference effect. The sections of this paper are as follows: the probabilistic failure risk analysis method considering load interference effect is described in Section 2; the computational model and inputs are introduced in Section 3; the results and analysis are illustrated in Section 4; and the conclusions are summarized in Section 5.

2. The Probabilistic Failure Risk Analysis Method Considering Load Interference Effect

This section describes the processing procedures and mathematical principles of the failure risk analysis method considering load interference effect and does not involve the calculation process of a specific case. A specific computational example will be given in Section 3.
The probabilistic failure risk analysis method considering load interference effect consists of three parts: construction and processing of random load sequences, fast calculation method for crack length distribution evolution, and failure risk calculation for the whole disk. These parts are here presented in three respective sections.

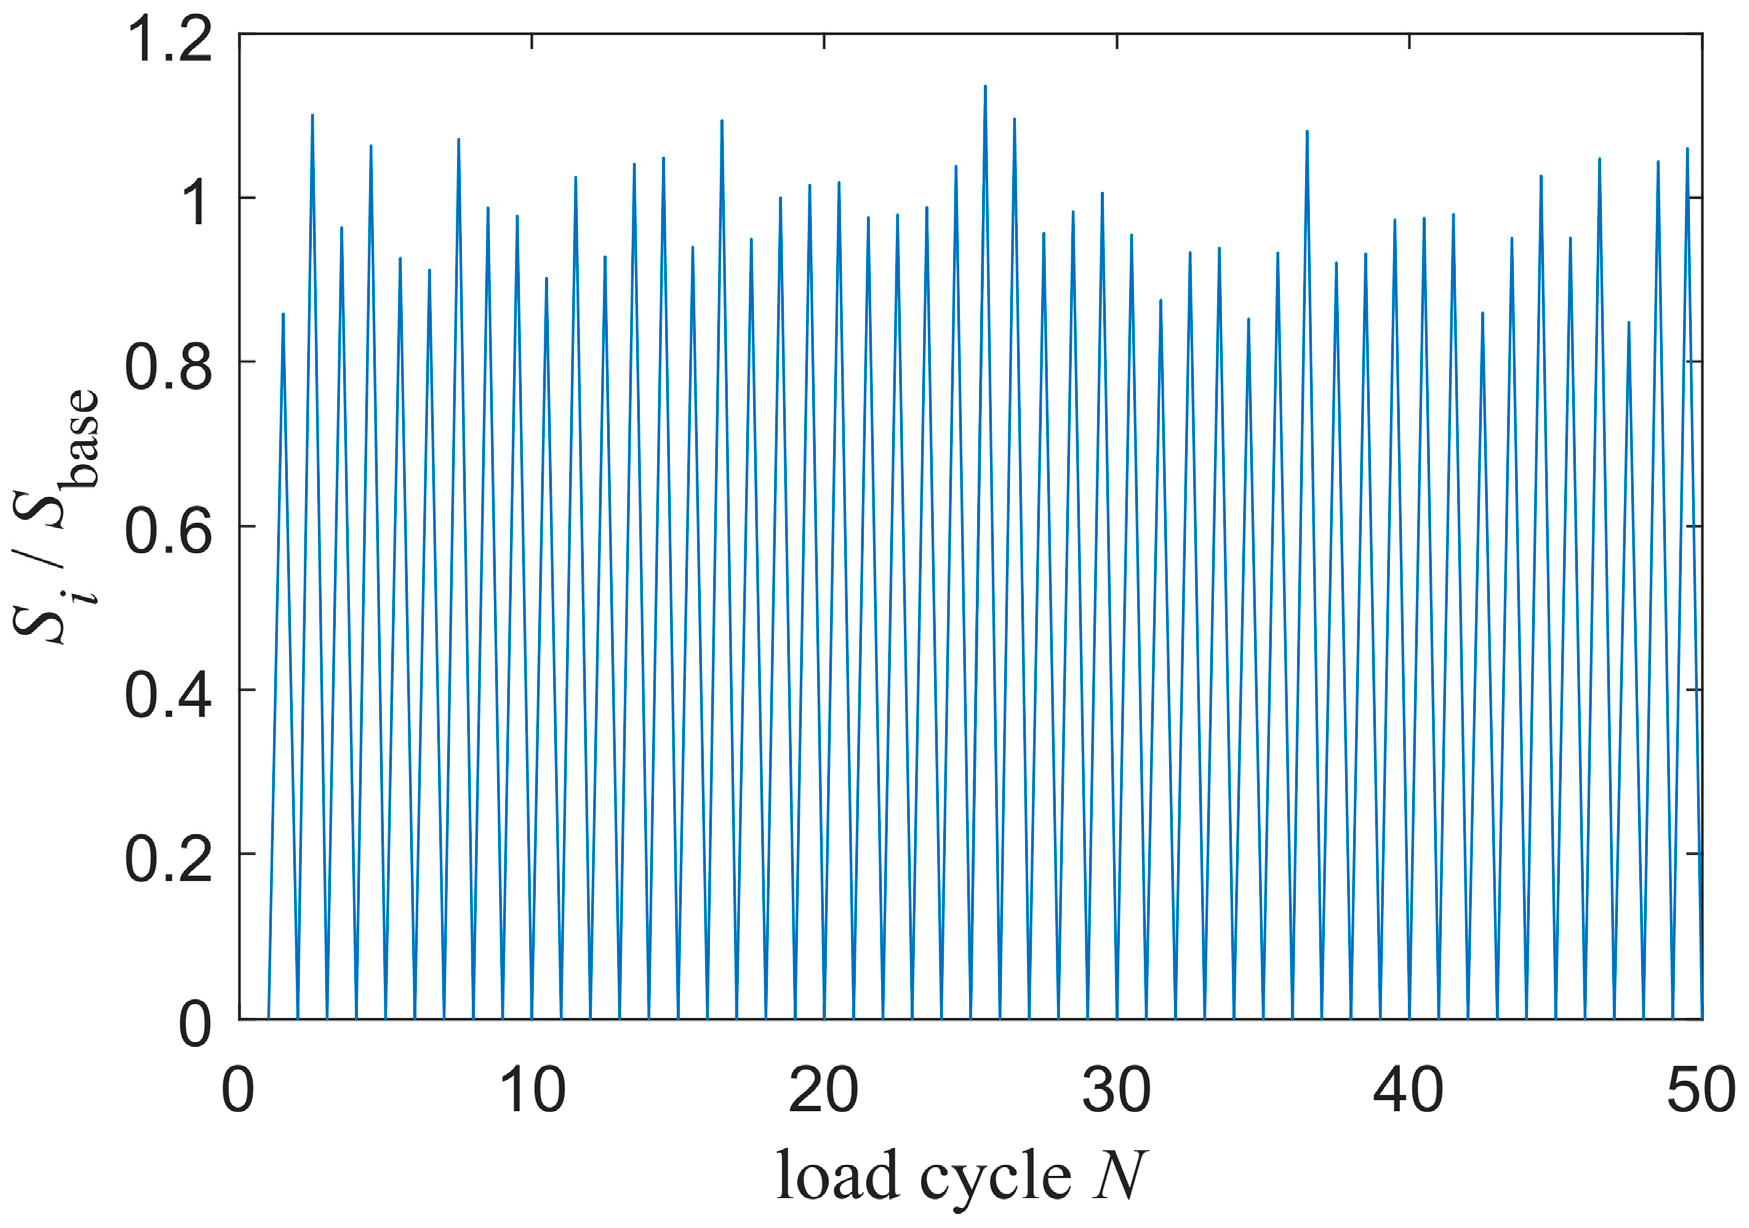
2.1. Construction and Processing of Random Load Sequences

Before conducting probabilistic failure risk analysis considering random load interference effect, finite element analysis of the typical working environment of aeroengine life-limited parts under a typical flight cycle needs to be conducted to obtain the corresponding stress contours for these life-limited parts. Zone division according to geometric continuity, stress similarity, and near-surface zone refinement [16] and the base stress s base of each zone need to be obtained.
The number of cycles in the whole life cycle was set as N max . The stress scatter coefficient was set as X , and the corresponding stress distribution was constructed. Sampling was carried out to obtain the stress scatter coefficient X i under the i -th sampling. The i -th corresponding load value s i is
s i = X i × s base .
By combining the load values according to the sampling sequence, the random variable amplitude load ( s 1 , s 2 , , s N max ) of life-limited parts during the whole life cycle can be obtained. In this model, it was assumed that the stress value was unloaded to 0 after each loading.
The calculation of failure risk involves the analysis of crack propagation in the area with initial cracks (i.e., anomalies). The Wheeler load interference model [17] was chosen to calculate the crack length a :
d a d N = C p C K i n K i = G s i π a i
where K i ,   s i , and a i are the stress intensity factor, stress value, and crack length at the i -th cycle, respectively; G is the geometric correction coefficient, which is related to the geometric shape of the crack region and other factors; C and n are constant and only related to the environmental and material properties; C p is the crack tip plastic zone correction factor, which is obtained from Equation (3):
C p = 1 if a OL + r OL a i + r i r i a OL + r OL a i m if a OL + r OL < a i + r i
where r i is the length of the plastic zone under the i -th cyclic loading, calculated by Equation (4) [18]. a OL and r OL are the crack length and plastic zone size, respectively, when the historical maximum plastic zone is generated, as shown in Figure 1. m is the coefficient of the Wheeler model.
r i = 1 α π K i σ ys 2
where α is the constraint coefficient, the plane strain condition is adopted and then α = 3 , and σ ys is the yield strength of the material. The crack extension process was assumed to be an elastic-perfectly plastic material response process. This assumption accords with the response process of the component materials of life-limiting parts under high temperature [19].

2.2. Fast Calculation Method for Crack Length Distribution Evolution

Theorem 1.
There are two initial crack lengths:  a 1 , a 1  and  a 1 > a 1 . Θ i ( a 1 )  expresses the crack length of  a 1  after load sequences  s 1 , s 2 , , s i . For any crack growth process, as long as  Θ j ( a 1 ) > Θ i ( a 1 )  holds for any  j > i , it must hold that  Θ i ( a 1 ) > Θ i ( a 1 ) .
Proof of Theorem 1.
As shown in Figure 2, the load sequences s 1 , s 2 , are grouped, where the load sequence of the first group is s 1 , s 2 , , s t 1 , and the load sequence of the k -th group ( k 2 ) is ( s t k 1 + 1 , s t k 1 + 2 , , s t k ) . First, it can be proven by mathematical induction that there is a certain grouping method to ensure that for any j ( s t 1 , s t 2 , , s t N ) , Θ j ( a 1 )   >   Θ j ( a 1 ) is established. The first group s 1 , s 2 , , s t 1 is divided by selecting t 1 such that Θ t 1 a 1 = a 1 . At this time, Θ t 1 a 1   >   Θ 0 a 1 = a 1 = Θ t 1 a 1 is established. Suppose there exists a division of the k -th group such that Θ k 1 ( a 1 ) > Θ k ( a 1 ) holds. Then, the ( k   + 1 ) -th group s t k + 1 , s t k + 2 , , s t k + 1 is divided by selecting t k + 1 such that Θ t k + 1 a 1 = Θ t k ( a 1 ) . At this time, Θ t k + 1 a 1   >   Θ t k a 1 = Θ t k + 1 a 1 . Therefore, mathematical induction has been proven. Second, for other elements inside any k -th group, i ( s t k 1 + 1 , s t k 1 ) , Θ i a 1   >   Θ t k 1 a 1 =   Θ t k a 1   >   Θ i a 1 . Therefore, Θ i ( a 1 )   >   Θ i ( a 1 ) is valid for any k group. It follows that Θ i ( a 1 )   >   Θ i ( a 1 ) for all load sequences i ( s 1 , s 2 , ) . The proof of Theorem 1 is completed. □
Because Θ j ( a 1 ) > Θ i ( a 1 ) holds for any j > i in the Wheeler load interference model, according to Theorem 1 Θ k ( a 1 ) > Θ i ( a 1 ) for any i . For the initial crack interval ( a 1 l , a 1 r ) , a 1     ( a 1 l , a 1 r ) , Θ N a 1     ( Θ N ( a 1 l ) , Θ N a 1 r ) , and then
a 1 l a 1 r f a 1 d a 1 = Θ N ( a 1 l ) Θ N a 1 r f Θ N a 1 d Θ N a 1
where f ( · ) is the probability density function of crack occurrence. According to Equation (5), for any two initial crack lengths, the probability within the interval formed before and after crack growth remains unchanged.
Based on this, the method shown in Figure 3 can be used to capture the crack distribution evolution process. First, the initial defect distribution f ( a 1 ) can be discretized into several groups by dividing the range of a 1 into intervals with equal spacing. Each group containing the initial crack length a 1 l , a 1 r corresponding to the endpoints of the interval is obtained, and the occurrence probability a 1 l a 1 r f a 1 d a 1 within the interval is obtained. Subsequently, the value Θ N a 1 l , Θ N a 1 r of each group’s interval endpoint after crack growth is calculated. Finally, by matching Θ N a 1 l , Θ N a 1 r with a 1 l a 1 r f a 1 d a 1 in each group, the probability distribution f ( Θ N ( a 1 ) ) at the end of crack growth can be obtained.
Using the above method, fast acquisition of the probability distribution at the end of crack growth can be achieved, avoiding millions of Monte Carlo samplings of the defect distribution.

2.3. Failure Risk Calculation for the Whole Disk

According to generalized stress intensity factor interference theory [20], failure of the disk is defined as the stress intensity factor K exceeding the fracture toughness K c . The relationship between K c and critical length a critical is shown in Equation (6), where s takes the reference stress s base . a critical is calculated using Equation (6) and defined as failure when Θ N a 1 a critical :
K c = sG π a critical .
After obtaining the probability distribution f ( Θ N ( a 1 ) ) at the end of crack growth, the failure probability P f , z of a single zone can be calculated using Equation (7) as follows:
P f , z = a critical + f Θ N a 1 d Θ N a 1 .
The risk of the disk can be obtained by weighing the risk of all zones according to the probability of defect occurrence:
P f , disk = z = 1 Z max P occur , z × P f , z
where P occur , z is the probability of occurrence of defects in each zone, which is usually related to the volume or mass of each zone, and Z max is the total number of zones.
The probabilistic failure risk analysis method considering load interference effect presented above was realized by coding through Matlab 2016b. The validity of the program adopted in this paper passed the test of the recognized test case in the appendix of reference [1].

3. Computational Model and Inputs

In this section, a specific probabilistic failure risk analysis considering the random load interference effect is carried out using a life-limited part as an example. This section is divided into two parts. Section 3.1 introduces the analysis of finite elements and the characterization of random loads to provide a source of loads for the load interference analysis. Section 3.2 introduces the material defect data required for the load interference analysis.

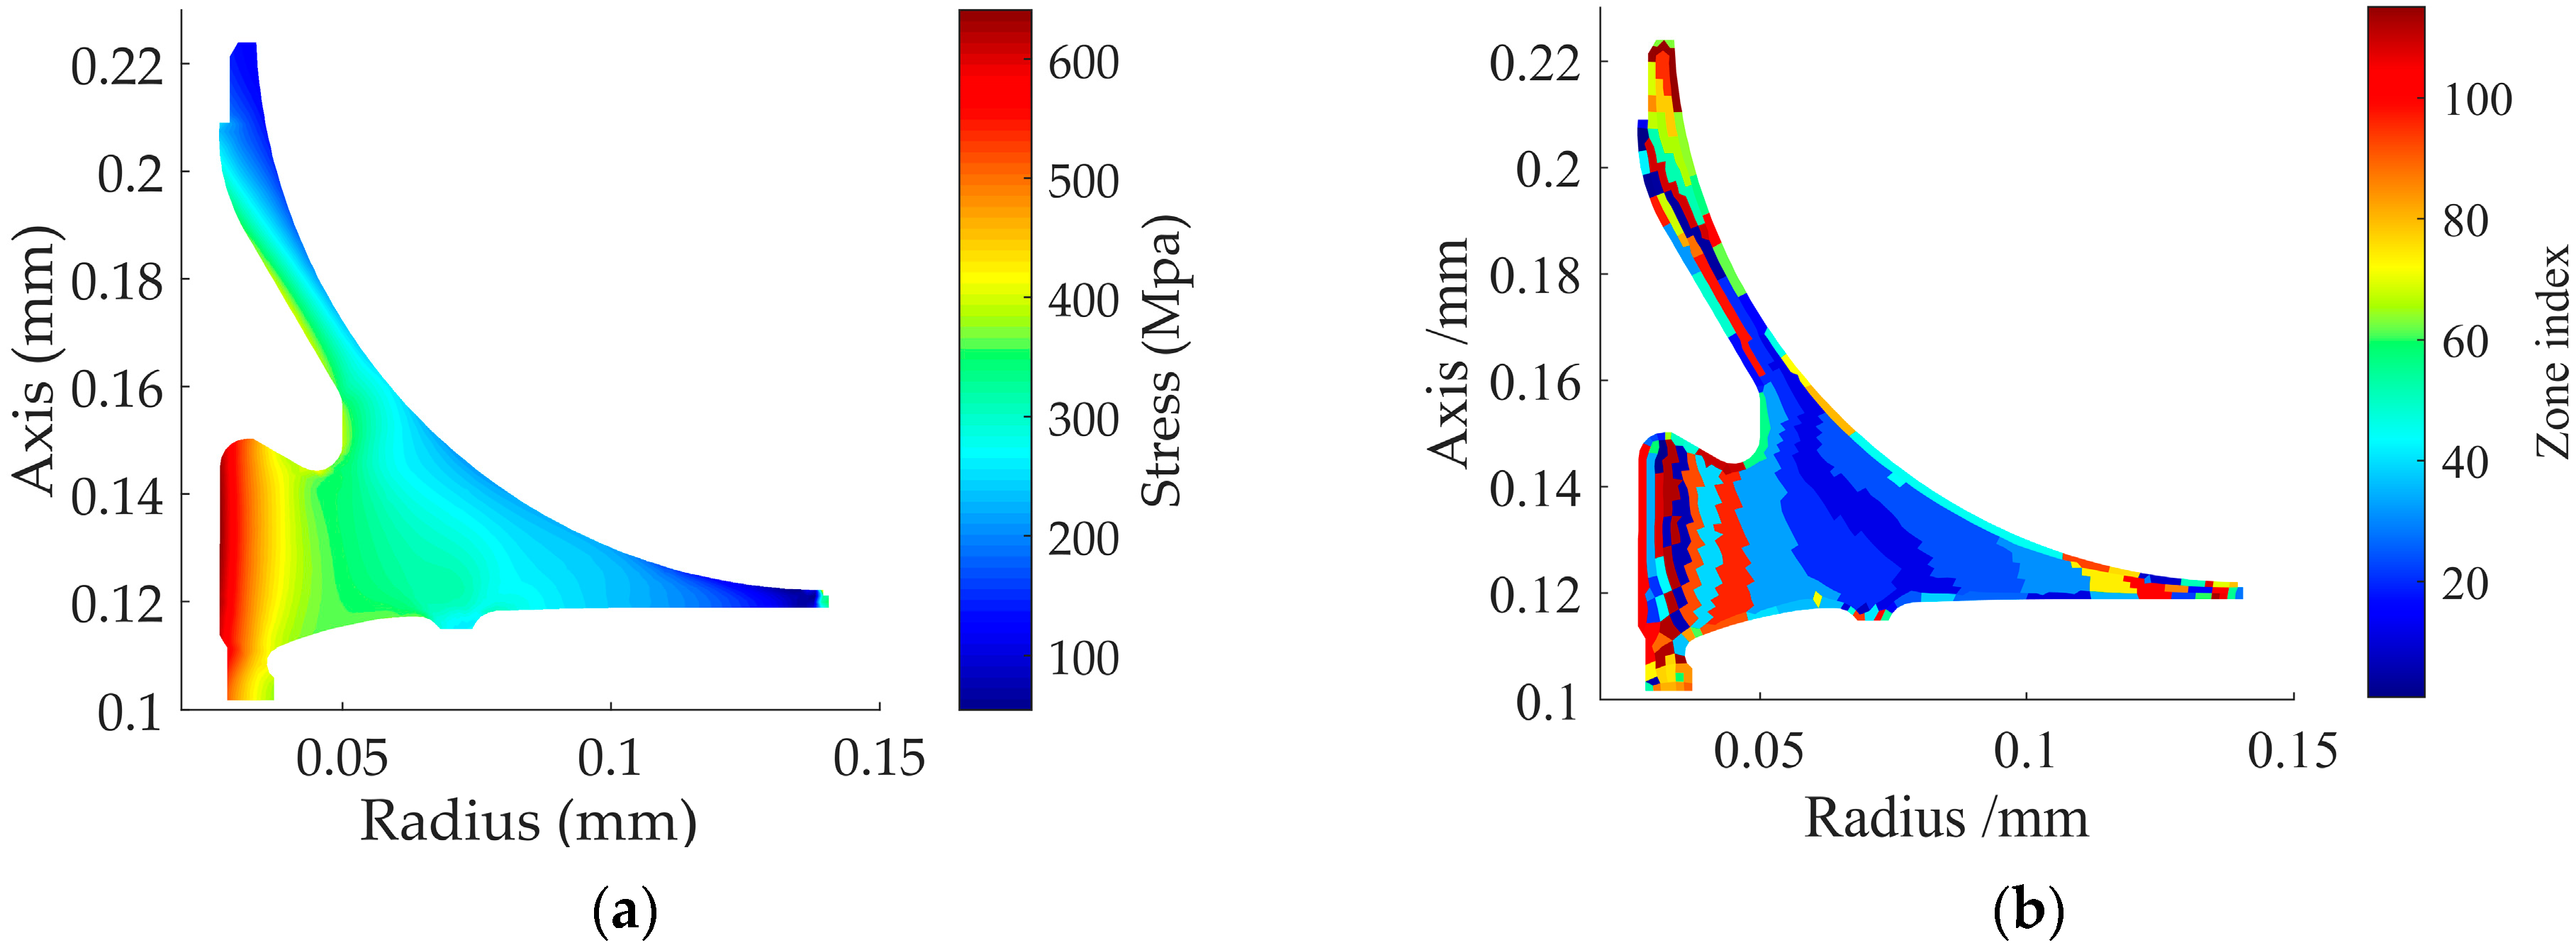
3.1. Analysis of Finite Elements and Characterization of Random Loads

The centrifugal compressor impeller was selected as the analysis object. A 1/10 sector of a three-dimensional compressor impeller model is shown in Figure 4a. Given that the model is assumed to be a hollow rotary body, the radial–axial section is used to represent the state of the entire disk for zone division, random load characterization, and failure risk analysis. The size of the radial–axial section and mesh division results of this model are shown in Figure 4b.
Through analysis of a secondary air system [21], corresponding typical flight conditions can be obtained, as shown in Table 1. The material used in this paper is Ti-6AL-4 V, and its properties are shown in Table 2. It was assumed that the material is isotropic and homogeneous everywhere in the disk. According to the above conditions, thermoelastic finite element analysis was performed using the one way fluid-structure interaction method [22], and the stress contour of the radial–axial section of the disk under typical flight condition was obtained, as shown in Figure 5a.
The stress contour of the radial–axial section of the disk, obtained through this secondary air system analysis and thermoelastic analysis, is only used as input for the failure risk analysis, and so these processes are not described in detail in this paper. This paper focuses on the geometry and boundary conditions of the disk as well as other inputs to the failure risk assessment model. In fact, the method described in Section 2 is suitable for any input with known stress distribution, and there are no excessive restrictions on sources.
After obtaining the stress contour of the radial–axial section of the disk, according to the zone division method described in reference [16], the radial–axial section of disk was zoned according to geometric continuity, stress similarity, and near-surface zone refinement, and the zone division results are shown in Figure 5b. After zoning the disk, the maximum stress of each zone was selected as the reference stress of each zone.
Having obtained the reference stress of each zone, the number of cycles N max was set to 20 , 000 and the stress scatter coefficient X obeyed X ~ U ( 1 , 0.066 2 ) . X i was sampled, and the corresponding load sequences s 1 , s 2 , , s 20 , 000 of a single zone were obtained through Equation (1). The normalized representation ( S i / S base ) of the first 50 random variable amplitude load sequences is shown in Figure 6.

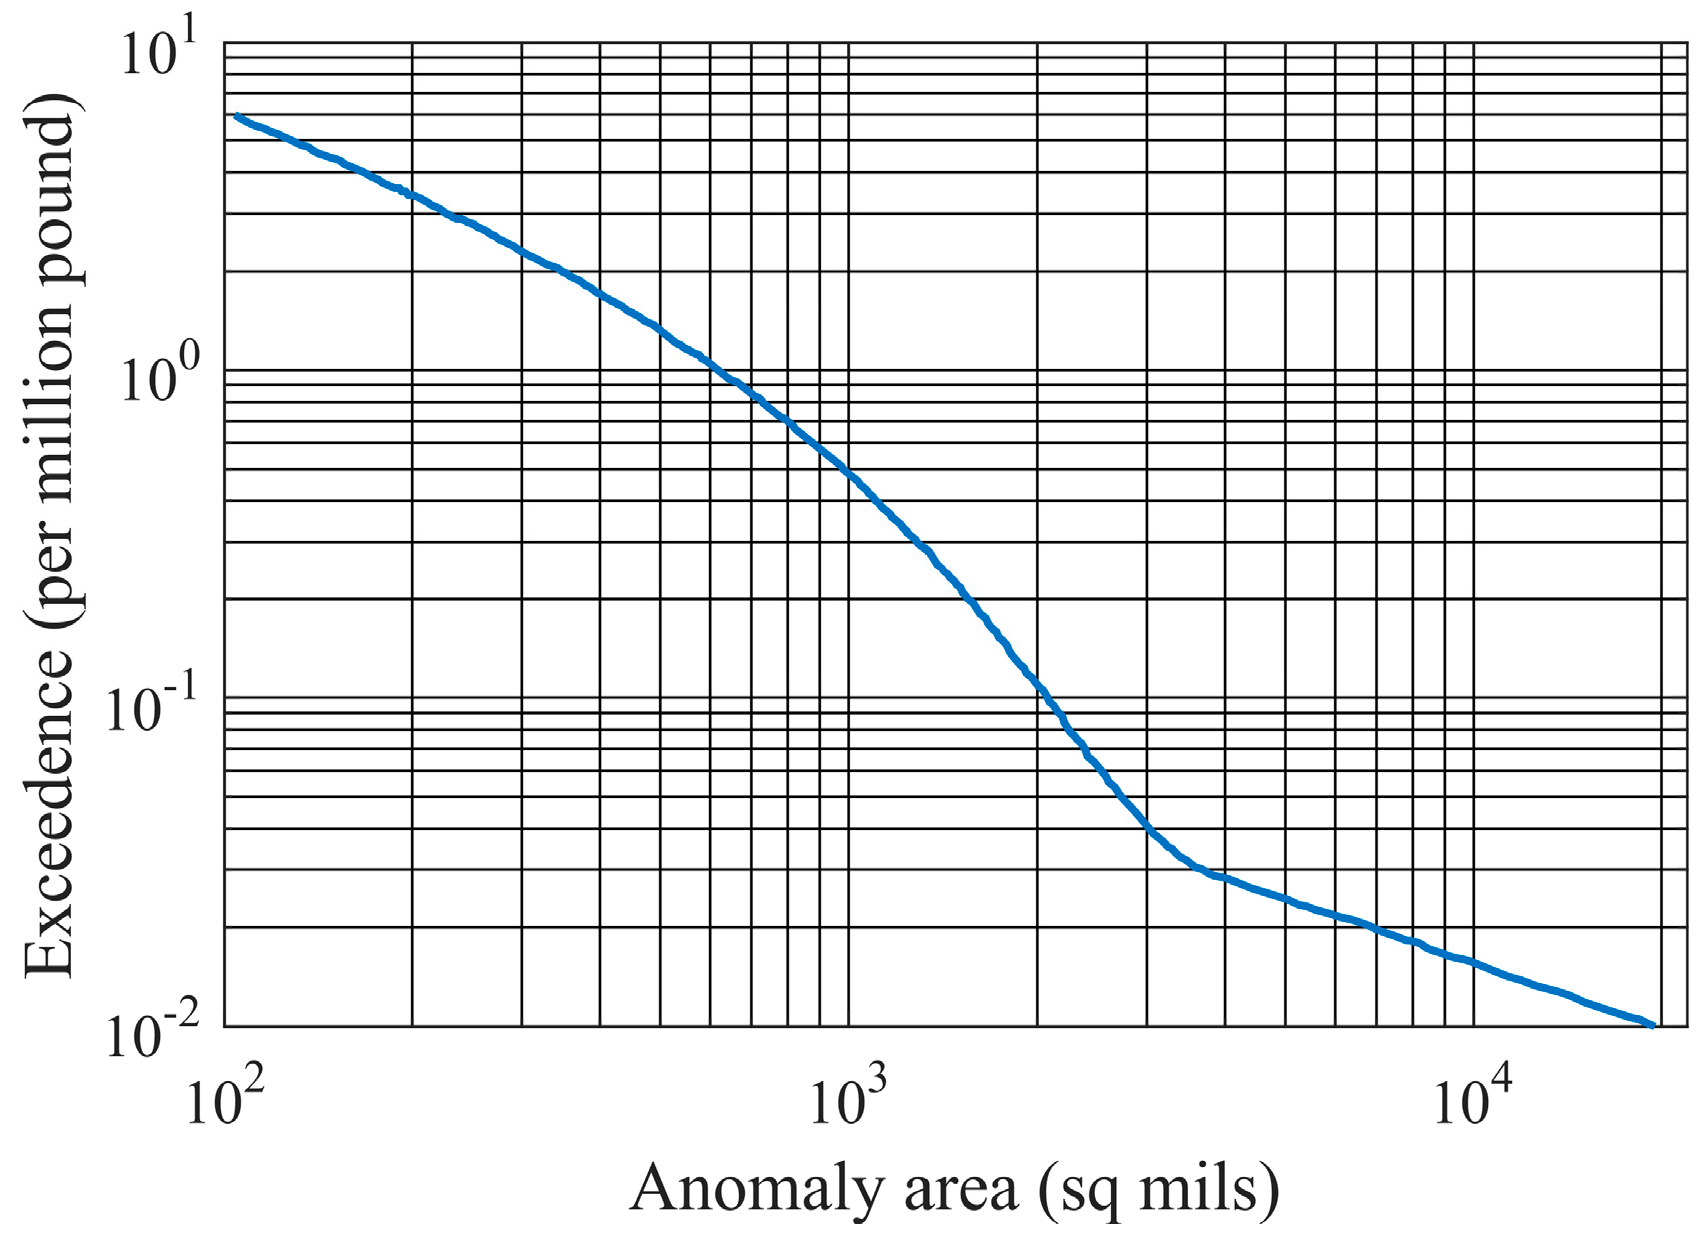
3.2. Initial Crack Distribution Acquisition

Initial defect distribution is described as the frequency of occurrence of an initial defect of a certain size within a unit mass (or volume) of material [4]. The hard alpha inclusion distribution from the triple vacuum arc remelt (VAR) process or, the cold hearth melt plus VAR processes in the Reference [1] was selected as the input, as shown in Figure 7. The horizontal coordinate indicates defect size, and the vertical coordinate indicates the frequency of defects per million pounds of material that exceed the size given in the corresponding horizontal coordinate. Assuming that the defect is circular, the area data in the vertical coordinate is converted into defect length, and the corresponding defect size distribution can be obtained. It is worth noting that the probability of a disk containing hard alpha defects is generally very low. Therefore, if defects are present in the disk, the number of defects does not exceed 1.
In general, the structurally safe life of a crack is composed of its initiation and stable propagation. However, defects introduced during the processing and manufacturing stage may accelerate the crack process. Thus, the initiation life of a crack is generally assumed to be zero based on conservative security assumptions, and the initial crack length is considered to be the same as the initial defect length [11]. The transcendental curve distribution can be transformed into a cumulative distribution function (CDF) using Equation (9) [24]:
CDF ( a ) = exc a exc a min exc a max exc a min
where exc ( a ) is the number of cracks with size equal to or greater than a million pounds of titanium, and a min and a max are the minimum and maximum values of the initial crack length, respectively. For the method described in this paper, the initial anomaly distribution data can be used directly on a volumetric basis by multiplying the density of the material.

4. Results and Discussion

This section analyzes the results of the above failure risk analysis method considering the interference effect of random loads. By comparing the simulation results with those of a constant amplitude load, the influence of load interference on failure risk is clarified. By comparing the crack length distribution evolution method with Monte Carlo sampling, the accuracy and efficiency of the crack length distribution evolution method are clarified.

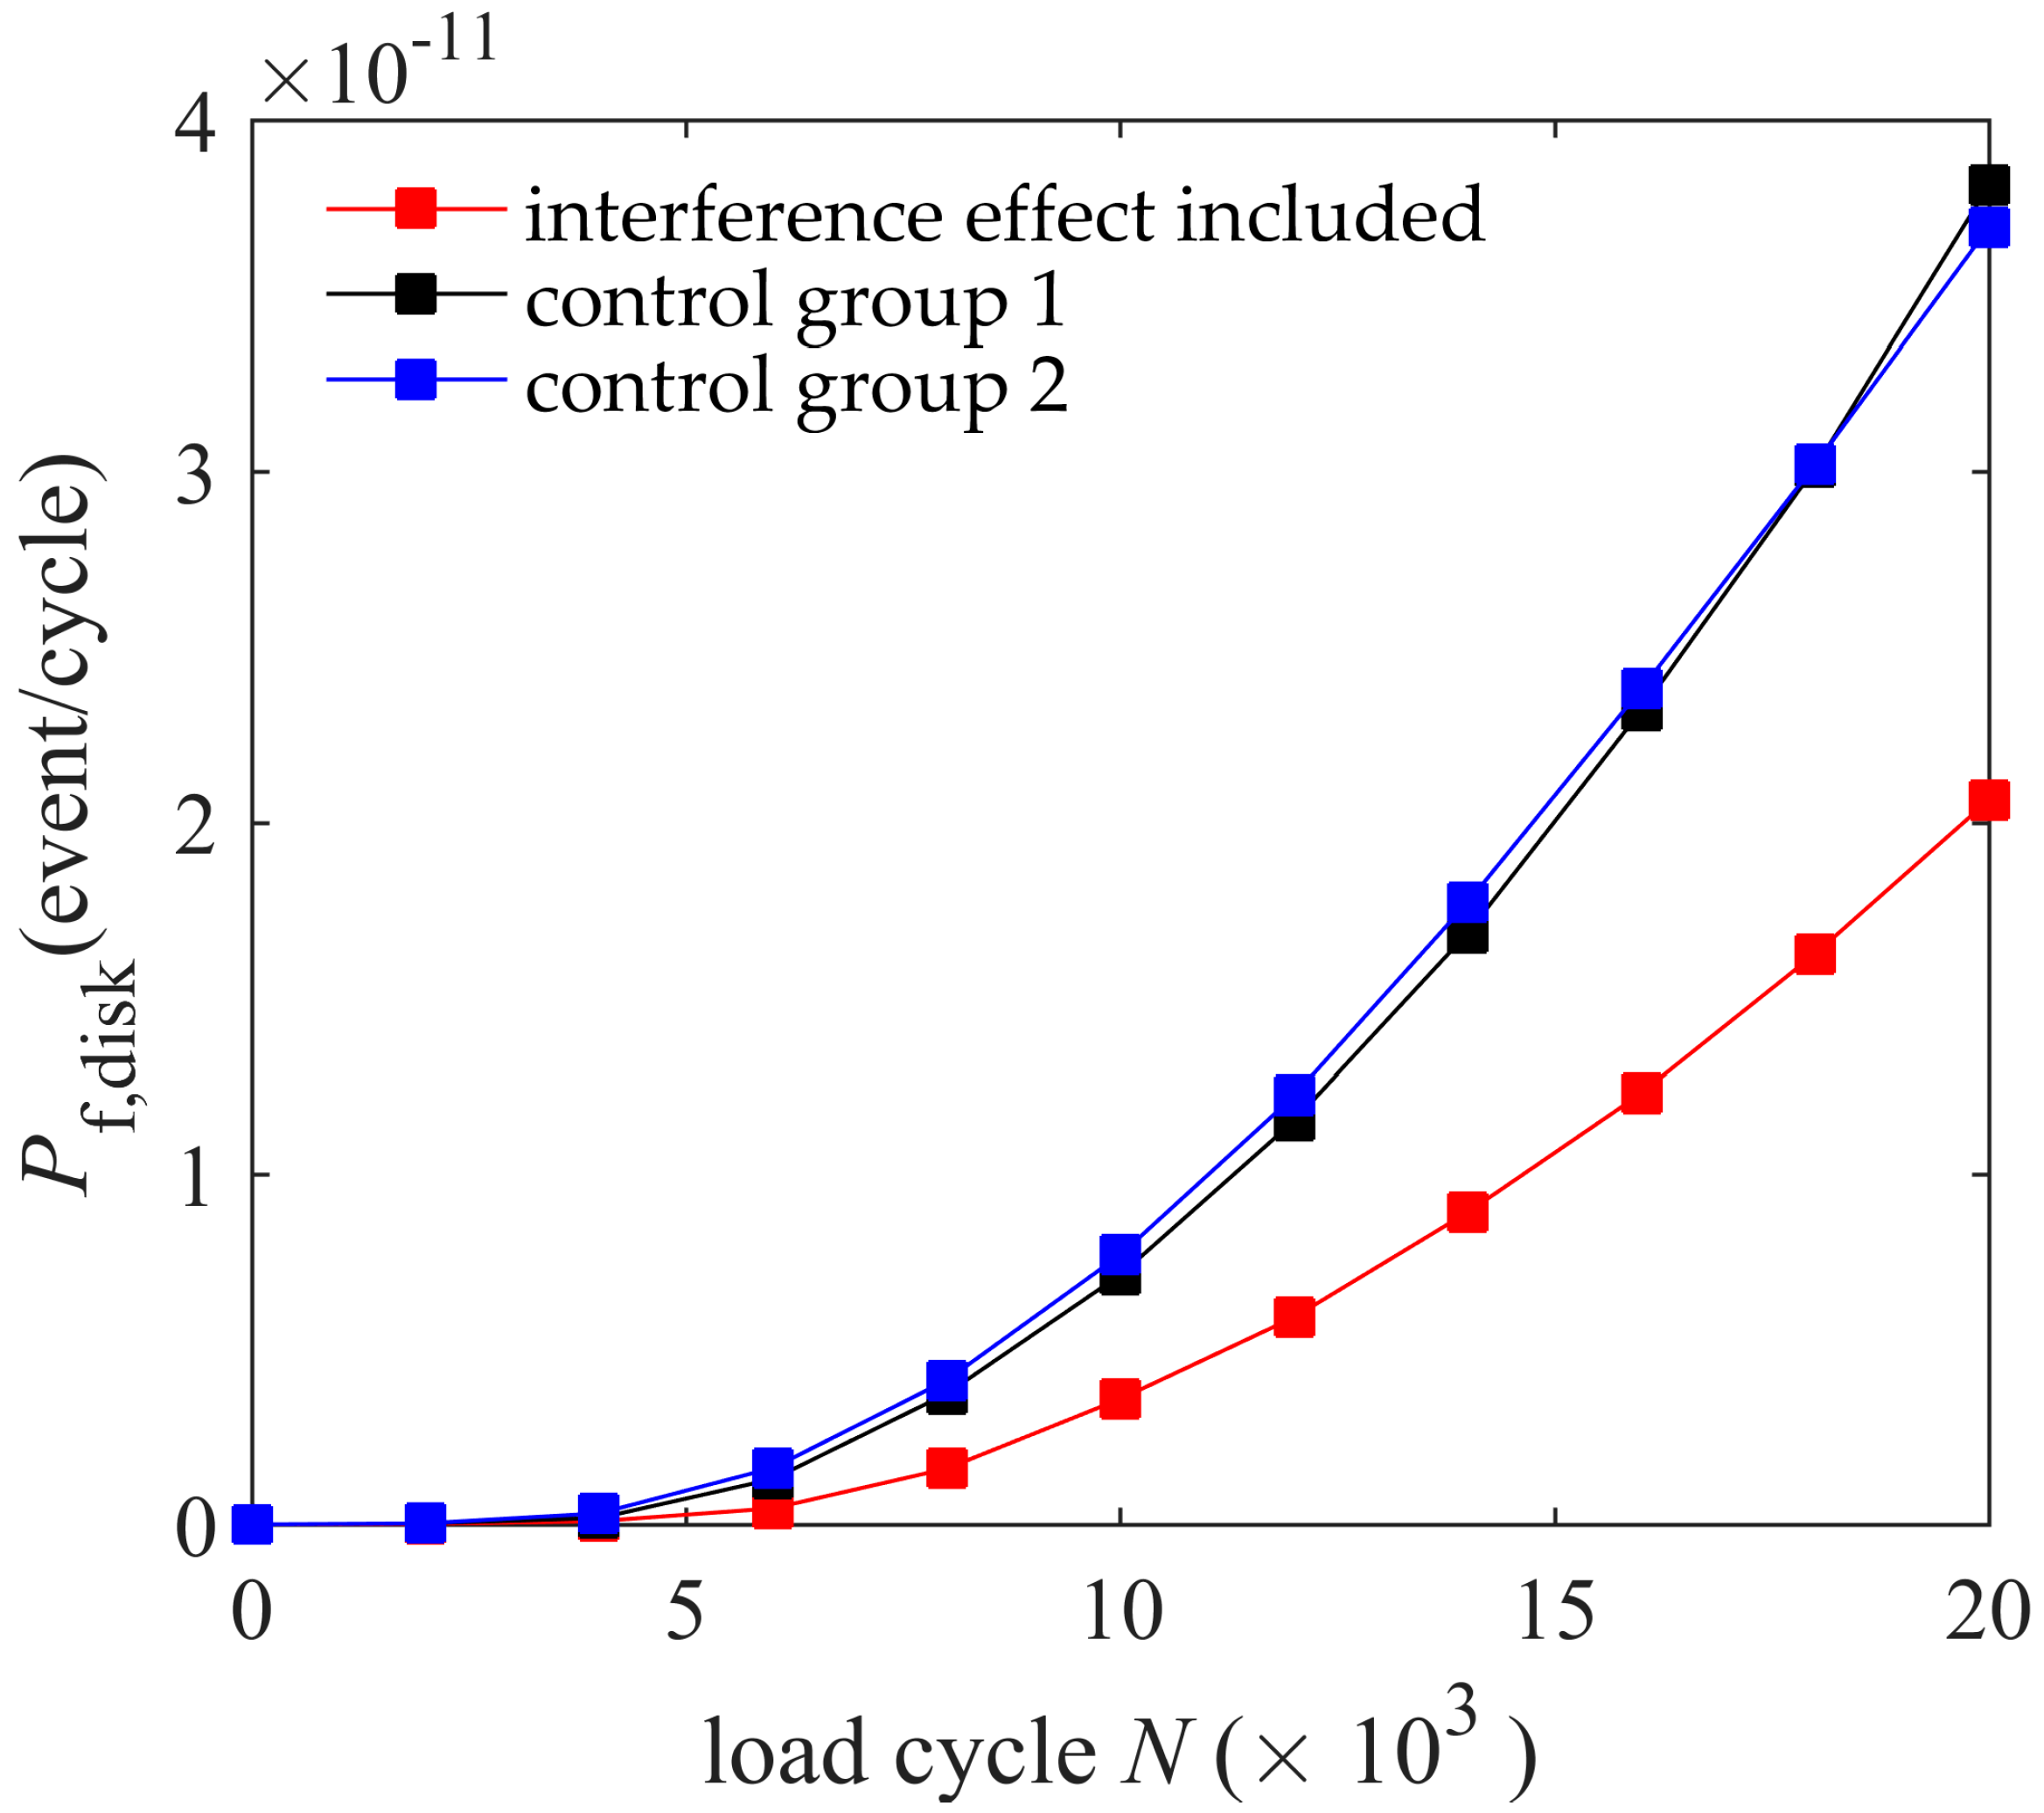
4.1. Effect of Considering Load Interference

For comparison, two other analyses were performed. The first control group did not consider the load dispersion, and for each zone, only s base was used for the constant amplitude load calculation. The second control group adopted the traditional method: the same distribution as in Section 3.1 was sampled to obtain different stress values for a constant amplitude load calculation, and the results were then weighed according to the occurrence probability of the different stress values to obtain the failure probability of a single zone. The crack growth history for the two kinds of constant amplitude load analysis was calculated using Equation (2) under the condition C p = 1 . In the process, the numerical integration method in references [11,12] was adopted to improve computational efficiency.
The disk failure risk with different cycles is shown in Figure 8. The X-axis represents the number of cycles experienced by the disk, and the Y-axis represents the probability of failure. The failure risk of the various methods increases with increasing N , regardless of whether the load interference effect is considered.
The P f of the load interference group, control group 1, and control group 2 are 2.062 × 10 11   event / cycle ,   3.814 × 10 11   event / cycle   and   3.694 × 10 11 event / cycle , respectively, at N = 20 , 000 cycles. The failure risk when considering the load interference effect is 54% of the analyzed risk under base stress. It is thus shown that the failure risk is reduced when the interference effect of random loads is considered. When the variable amplitude load interference effect is considered, C p in Equation (2) is not always equal to 1, causing a lower crack growth rate than that of the equal amplitude load calculation, which in turn leads to a lower failure risk.
The distribution of the stress scatter coefficient X was changed to obey U ( 1 , 0.033 2 ) and U ( 1 , 0.050 2 ) , and the results obtained after repeating the above analysis are shown in Figure 9. Comparing Figure 8 and Figure 9 shows that when the variance of X decreases, the reduction in failure risk caused by load interference decreases compared with control group 1 and control group 2. Because the stress difference obtained by sampling is small, the interference effect becomes weak and the risk is reduced.
At N = 20 , 000 cycles and a variance of 0.050, the failure risk considering load interference is 63% of the risk of analysis under base stress. At N = 20 , 000 cycles and a variance of 0.033, the failure risk considering load interference is 73% of the risk of analysis under base stress. These results show that even under the condition of small variance, considering the effect of load interference still causes a significant decrease in risk value.

4.2. Comparison of Different Calculation Methods

To verify the accuracy and efficiency of the method of crack length distribution evolution described in Section 2.2, a series of Monte Carlo samplings (MCSs) were carried out with different sample numbers 10 3 ,   10 4 ,   10 5 for comparison under the condition of X ~ U ( 1 , 0.050 2 ) . Using the crack length distribution evolution method, 500 groups were divided to ensure sufficient accuracy. Each method involved 10 repeated calculations. The disk failure risk results at 20,000 flight cycles are shown in Figure 10, and the statistical analysis of these results is shown in Table 3.
By comparing the maximum deviation and variance of different samples in Table 3, it can be seen that, for Monte Carlo sampling, the higher the number of samples, the higher the precision and the longer the computation time. The crack length distribution evolution method can achieve higher accuracy than 10 5 Monte Carlo sampling. At the same time, the computational efficiency is approximately 215 times higher than that of the Monte Carlo sampling. The crack length distribution evolution method has probabilistic information in each group. In turn, accuracy can be guaranteed even with a small number of calculations.
In addition, the results of the crack length distribution evolution method vary with different calculation numbers, which is caused by the variation in random load sequences from one calculation to another. Although the random loads were different for each simulation, the deviation in disk failure risk was less than 0.35% when sampling with a specific stress scatter coefficient distribution. In contrast, the results of the MCS method vary not only due to load sampling but also due to defect distribution sampling such that the variety of failure risk values using MCS is greater than that using the crack length distribution evolution method.

5. Conclusions

Current probabilistic failure risk analysis systems cannot analyze the interference effect of random loads with guaranteed accuracy and efficiency. Therefore, this paper established an analysis method for life-limited parts considering the interference effect of random variable amplitude loads by changing the load characterization method, selecting a calculation model considering load interference, and developing a new acceleration algorithm for the analysis of failure probability. Probabilistic failure risk analysis of the compressor disk considering the interference effect was thereby executed. By comparing the simulation results considering random load interference with those of a constant amplitude load, the influence of the load interference effect on failure risk was clarified. By comparing the crack length distribution evolution method with the Monte Carlo sampling method, the accuracy and efficiency of the crack length distribution evolution method were clarified. The main conclusions are as follows:
  • Compared with the traditional constant amplitude load analysis in failure risk estimation, considering the interference effects of random variable amplitude loads will significantly reduce failure risk. This decreasing degree of failure risk will increase with an increase in the variance of the stress scatter coefficient X . The reason for this phenomenon is that the load interference effect hinders crack propagation;
  • Compared with the Monte Carlo sampling method, the crack length distribution evolution method can achieve the same accuracy with a smaller number of calculations. The crack length distribution evolution method offers probabilistic information in each group
In conclusion, failure analysis considering the random load interference effect can obtain more accurate failure risk prediction and provide new insights into aeroengine safety design.

Author Contributions

Conceptualization, G.L. and S.H.; data curation, S.H. and J.L.; formal analysis, S.H. and W.L.; investigation, G.Z. and B.Z.; methodology, S.H. and W.L.; project administration, S.D. and G.Z.; resources, G.L. and J.L.; software, S.H. and J.L.; supervision, G.L. and S.D.; validation, S.H. and B.Z.; visualization, S.H. and G.L.; writing—original draft, G.L. and S.H.; writing—review and editing, G.L. and S.H. All authors have read and agreed to the published version of the manuscript.

Funding

The work was funded by the National Science and Technology Major Project of China, grant number J2019-VIII-0001-0162. This work was also funded by the National Nature Science Foundation of China, grant number U2233213.

Data Availability Statement

Not applicable.

Conflicts of Interest

The authors declare no conflict of interest.

References

  1. Federal Aviation Administration, United States Department of Transportation. AC 33.14-1—Damage Tolerance for High Energy Turbine Engine Rotors. Available online: https://www.faa.gov/regulations_policies/advisory_circulars/index.cfm/go/document.information/documentID/22920 (accessed on 8 January 2001).
  2. Millwater, H.R.; Fitch, S.H.; Wu, Y.-T.; Riha, D.S.; Enright, M.P.; Leverant, G.R.; McClung, R.C.; Kuhlman, C.J.; Chell, G.G.; Lee, Y.-D. A probabilistically-based damage tolerance analysis computer program for hard alpha anomalies in titanium rotors. In Proceedings of the Turbo Expo: Power for Land, Sea, and Air, Munich, Germany, 8–11 May 2000; p. V004T003A062. [Google Scholar]
  3. Enright, M.; Wu, Y.-T. Probabilistic fatigue life sensitivity analysis of titanium rotors. In Proceedings of the 41st Structures, Structural Dynamics, and Materials Conference and Exhibit, Atlanta, GA, USA, 3–6 April 2000; p. 1647. [Google Scholar]
  4. American Institute of Aeronautics & Astr. The development of anomaly distributions for aircraft engine titanium disk alloys. In Proceedings of the 38th AIAA/ASME/ASCE/AHS/ASC Structures, Structural Dynamics, and Materials Conference, Kissimmee, FL, USA, 7–10 April 1997; pp. 2543–2553. [Google Scholar]
  5. Wu, Y.; Millwater, H.; Enright, M. Efficient and accurate methods for probabilistic analysis of titanium rotors. In Proceedings of the Proceedings, 8th ASCE Specialty Conference on Probabilistic Mechanics and Structural Reliability, Notre Dame, Indiana, 24–26 July 2000; pp. 24–26. [Google Scholar]
  6. Mao, J.; Hu, D.; Li, D.; Wang, R.; Song, J. Novel adaptive surrogate model based on LRPIM for probabilistic analysis of turbine disc. Aerosp. Sci. Technol. 2017, 70, 76–87. [Google Scholar] [CrossRef]
  7. Song, L.-K.; Bai, G.-C.; Fei, C.-W. Dynamic surrogate modeling approach for probabilistic creep-fatigue life evaluation of turbine disks. Aerosp. Sci. Technol. 2019, 95, 105439. [Google Scholar] [CrossRef]
  8. Sahu, V.K.; Kumar, J.K.S.A.; Mohanty, J.R.; Verma, B.B.; Ray, P.K. Effect of low-temperature overload on fatigue crack growth retardation and prediction of post overload fatigue life. Aerosp. Sci. Technol. 2014, 33, 100–106. [Google Scholar] [CrossRef]
  9. Sarkheil, S.; Foumani, M.S. Numerical and experimental study on the optimization of overload parameters for the increase of fatigue life. Aerosp. Sci. Technol. 2014, 35, 80–86. [Google Scholar] [CrossRef]
  10. Wu, Y.-T.; Enright, M.; Millwater, H. Probabilistic methods for design assessment of reliability with inspection. AIAA J. 2002, 40, 937–946. [Google Scholar] [CrossRef]
  11. Junbo, L.; Shuiting, D.; Guo, L. Influence of Random Variable Dimension on the Fast Numerical Integration Method of Aero Engine Rotor Disk Failure Risk Analysis. In Proceedings of the ASME International Mechanical Engineering Congress and Exposition, Online, 16–19 November 2020; p. V014T014A039. [Google Scholar]
  12. Li, G.; Liu, J.; Zhou, H.; Zuo, L.; Ding, S. Efficient numerical integration algorithm of probabilistic risk assessment for aero-engine rotors considering in-service inspection uncertainties. Aerospace 2022, 9, 525. [Google Scholar] [CrossRef]
  13. Huyse, L.; Enright, M. Efficient statistical analysis of failure risk in engine rotor disks using importance sampling techniques. In Proceedings of the 44th AIAA/ASME/ASCE/AHS/ASC Structures, Structural Dynamics, and Materials Conference, Norfolk, VA, USA, 7–10 April 2003; p. 1838. [Google Scholar]
  14. Der Kiureghian, A. First-and second-order reliability methods. In Engineering Design Reliability Handbook; CRC Press: Boca Raton, FL, USA, 2005; Volume 14. [Google Scholar]
  15. Ocampo, J.; Millwater, H.; Crosby, N.; Gamble, B.; Hurst, C.; Reyer, M.; Mottaghi, S.; Nuss, M. An ultrafast crack growth lifing model to support digital twin, virtual testing, and probabilistic damage tolerance applications. In Proceedings of the ICAF 2019–Structural Integrity in the Age of Additive Manufacturing: Proceedings of the 30th Symposium of the International Committee on Aeronautical Fatigue, Krakow, Poland, 2–7 June 2019; pp. 145–158. [Google Scholar]
  16. Ding, S.; Wang, Z.; Qiu, T.; Zhang, G.; Li, G.; Zhou, Y. Probabilistic failure risk assessment for aeroengine disks considering a transient process. Aerosp. Sci. Technol. 2018, 78, 696–707. [Google Scholar] [CrossRef]
  17. Wheeler, O.E. Spectrum loading and crack growth. J. Basic Eng. 1972, 94, 3. [Google Scholar] [CrossRef]
  18. Irwin, G. Linear fracture mechanics, fracture transition, and fracture control. Eng. Fract. Mech. 1968, 1, 241–257. [Google Scholar] [CrossRef]
  19. Majorell, A.; Srivatsa, S.; Picu, R. Mechanical behavior of Ti–6Al–4V at high and moderate temperatures—Part I: Experimental results. Mater. Sci. Eng. A 2002, 326, 297–305. [Google Scholar] [CrossRef]
  20. Gao, Z.; Xiong, J. Fatigue Reliability; Beihang University Press: Beijing, China, 2000; pp. 363–391. [Google Scholar]
  21. Liu, C.; Liu, H.; Li, Y.; Che, W.; Ding, S. Modularized simulation modeling of air system with fast transients. J. Aerosp. Power 2015, 30, 1826–1833. [Google Scholar]
  22. Belytschko, T. Fluid-structure interaction. Comput. Struct. 1980, 12, 459–469. [Google Scholar] [CrossRef]
  23. Skinn, D.A.; Gallagher, J.P.; Berens, A.P.; Huber, P.D.; Smith, J. Damage Tolerant Design Handbook; Air Force Materiel Command Wright Patterson AFB: Wright-Patterson Air Force Base, OH, USA, 1994; Volume 2, Chapters 5 and 6. [Google Scholar]
  24. Yang, L.; Ding, S.; Wang, Z.; Li, G. Efficient Probabilistic Risk Assessment for Aeroengine Turbine Disks Using Probability Density Evolution. Aiaa J. 2017, 55, 2755–2761. [Google Scholar] [CrossRef]
Figure 1. The plastic zone ahead of the crack tip.
Aerospace 10 00301 g001
Figure 2. Evolution of different initial cracks.
Aerospace 10 00301 g002
Figure 3. Sketch map of crack length distribution evolution.
Aerospace 10 00301 g003
Figure 4. Geometric and mesh characteristics of centrifugal compressor impeller: (a) 1/10 sector of compressor disk; (b) radial–axial cross section size and mesh division results.
Aerospace 10 00301 g004
Figure 5. Finite element analysis and zone division: (a) stress contour; (b) zone division.
Aerospace 10 00301 g005
Figure 6. Normalized representation of random load sequences.
Aerospace 10 00301 g006
Figure 7. Initial anomaly distribution.
Aerospace 10 00301 g007
Figure 8. Disk failure risk with different load cycles.
Aerospace 10 00301 g008
Figure 9. Failure risk results under different stress scatter coefficient distributions: (a) failure risk when X ~ U ( 1 , 0.050 2 ) ; (b) failure risk when X ~ U ( 1 , 0.033 2 ) .
Aerospace 10 00301 g009
Figure 10. Failure risk results using different methods and different numbers of calculations.
Aerospace 10 00301 g010
Table 1. Boundary conditions of finite element analysis.
Boundary ConditionValue
Rotate speed39,500 r/min
Mass flow8.125 ×   10 4 Kg/s
Inlet temperature288.15 K
Outlet pressure398,440 Pa
Outlet temperature462.56 K
Table 2. Material properties of Ti-6AL-4 V [23].
ParameterValue
E 110 Gpa
ν 0.3
λ 7.955 W/(mk)
α 8.6 × 10 6 /°C
ρ 4620   Kg / m 3
σ ys 900 Mpa
C 9.25 × 10 13 m/cycle
m 3.87
K c 64.5   Mpa m
Table 3. Statistical results after repeated calculations by different methods.
MethodAverage Failure RiskMaximum
Deviation
VarianceTime Cost
( t / t fast method )
Fast method 2.062 × 10 11 7.095 × 10 14 1.625 × 10 27 1
10 3 MCSs 2.063 × 10 11 1.803 × 10 12 7.669 × 10 25 2.1
10 4 MCSs 2.072 × 10 11 8.539 × 10 13 1.531 × 10 25 21.1
10 5 MCSs 2.059 × 10 11 3.152 × 10 13 3.576 × 10 26 215.4
Disclaimer/Publisher’s Note: The statements, opinions and data contained in all publications are solely those of the individual author(s) and contributor(s) and not of MDPI and/or the editor(s). MDPI and/or the editor(s) disclaim responsibility for any injury to people or property resulting from any ideas, methods, instructions or products referred to in the content.

