1. Introduction
Over the past 40 years, air traffic has grown 10-fold, and air cargo has grown 14-fold [
1]. Despite numerous crises in the 21st century, air traffic has been growing continuously [
2]. Therefore, the climate responsibility of the aviation sector is even more important than ever before. The overall goal of halving the carbon emissions by the year 2050 relative to 2000 was set by the aviation industry [
3]. In order to meet the European Union (EU) Green Deal main objectives [
4], an overall willingness from all parties to take new paths and design bold concepts must be present.
For reaching the goals, the aircraft technology roadmap to 2050 engages in several contributing opportunities [
3]. In addition to focusing on the improvement of known technologies, the roadmap foresees the increased use of new-generation technologies from 2030 onward. The EU-funded project FUTPRINT50 focuses on the possible technologies for commercial hybrid-electric aircraft for the years 2035–2040 [
5]. As part of the project and contributions to the FUTPRINT50 Aircraft Design Challenge [
5], the authors of this paper designed the hybrid regional aircraft HAIQU (Hydrogen Aircraft desIgned for Quick commUting).
This aircraft design provides capacity for 50 passengers and combines the advantages of battery and fuel-cell technology in a hybrid combination. Therefore, the motivations for HAIQU are to achieve zero emissions during the whole flight mission and to bring regional aviation one step closer to a modern environment as well as to encourage future aircraft designs. Using liquid hydrogen to approach net zero emissions is based on the production method of liquid hydrogen [
6]. Depending on the method of production, hydrogen is labeled with different colors depending on the method of production [
6,
7].
Indeed, green hydrogen is the only climate-neutral type [
7,
8]. However, the amount of renewable energy required to produce green hydrogen in large quantities is enormous [
9]. To ensure the efficiency and effectiveness of the aircraft design, various methods are utilized during the design process, which are outlined in
Section 2. The trade-off studies and their results are summarized in
Section 3. Finally, in
Section 4, the advantages and disadvantages of the aircraft design are discussed to provide a comprehensive understanding of the design’s strengths and limitations.
2. Materials and Methods
In the following sections, the classical aircraft design methods build the base of the familiar design process. Moreover, the unconventional design methods for the hybrid-propulsion technologies are described in detail. As this aircraft design is part of the F
utP
rI
nt50 Aircraft Design Challenge, the guidelines [
5] that were predefined by the challenge committee had to be strictly followed in order to ensure comparability between the different design proposals. Hereby, the main requirements were defined in the top level aircraft requirements (TLAR) [
5] and elaborated by Eisenhut et al. [
10], and these are listed in
Table 1. The aim of the design process is to achieve the TLAR under the lowest possible direct operating costs (DOC).
Using a reference aircraft facilitates the design process and improves accuracy [
11]. Therefore, a market analysis with the goal of finding a proper aircraft was conducted. The regional aviation sector led to aircraft such as the Dash 8 and ATR 42. For the following design process, the concept refers to only one reference aircraft that fit the given TLAR the best. In this case, the ATR 42-600 [
12] formed the most promising foundation and was, thus, selected as the reference aircraft.
A basic comparability of the ATR 42 and ATR 72 can be generally assumed under certain conditions, since the ATR 72 is merely an extended ATR 42 with an increased maximum seat capacity from 48 to 78 seats [
13]. In addition, the wingspan and engine power are increased from the ATR 42 to the ATR 72 [
13]. In the typical cases, the ATR 42-600 was used for reference values. However, if no reference values for the ATR 42-600 were available, relative values from the ATR 72 were used, which are still legitimate due to the scaled relationship between the two aircraft.
2.1. Design Iteration Code
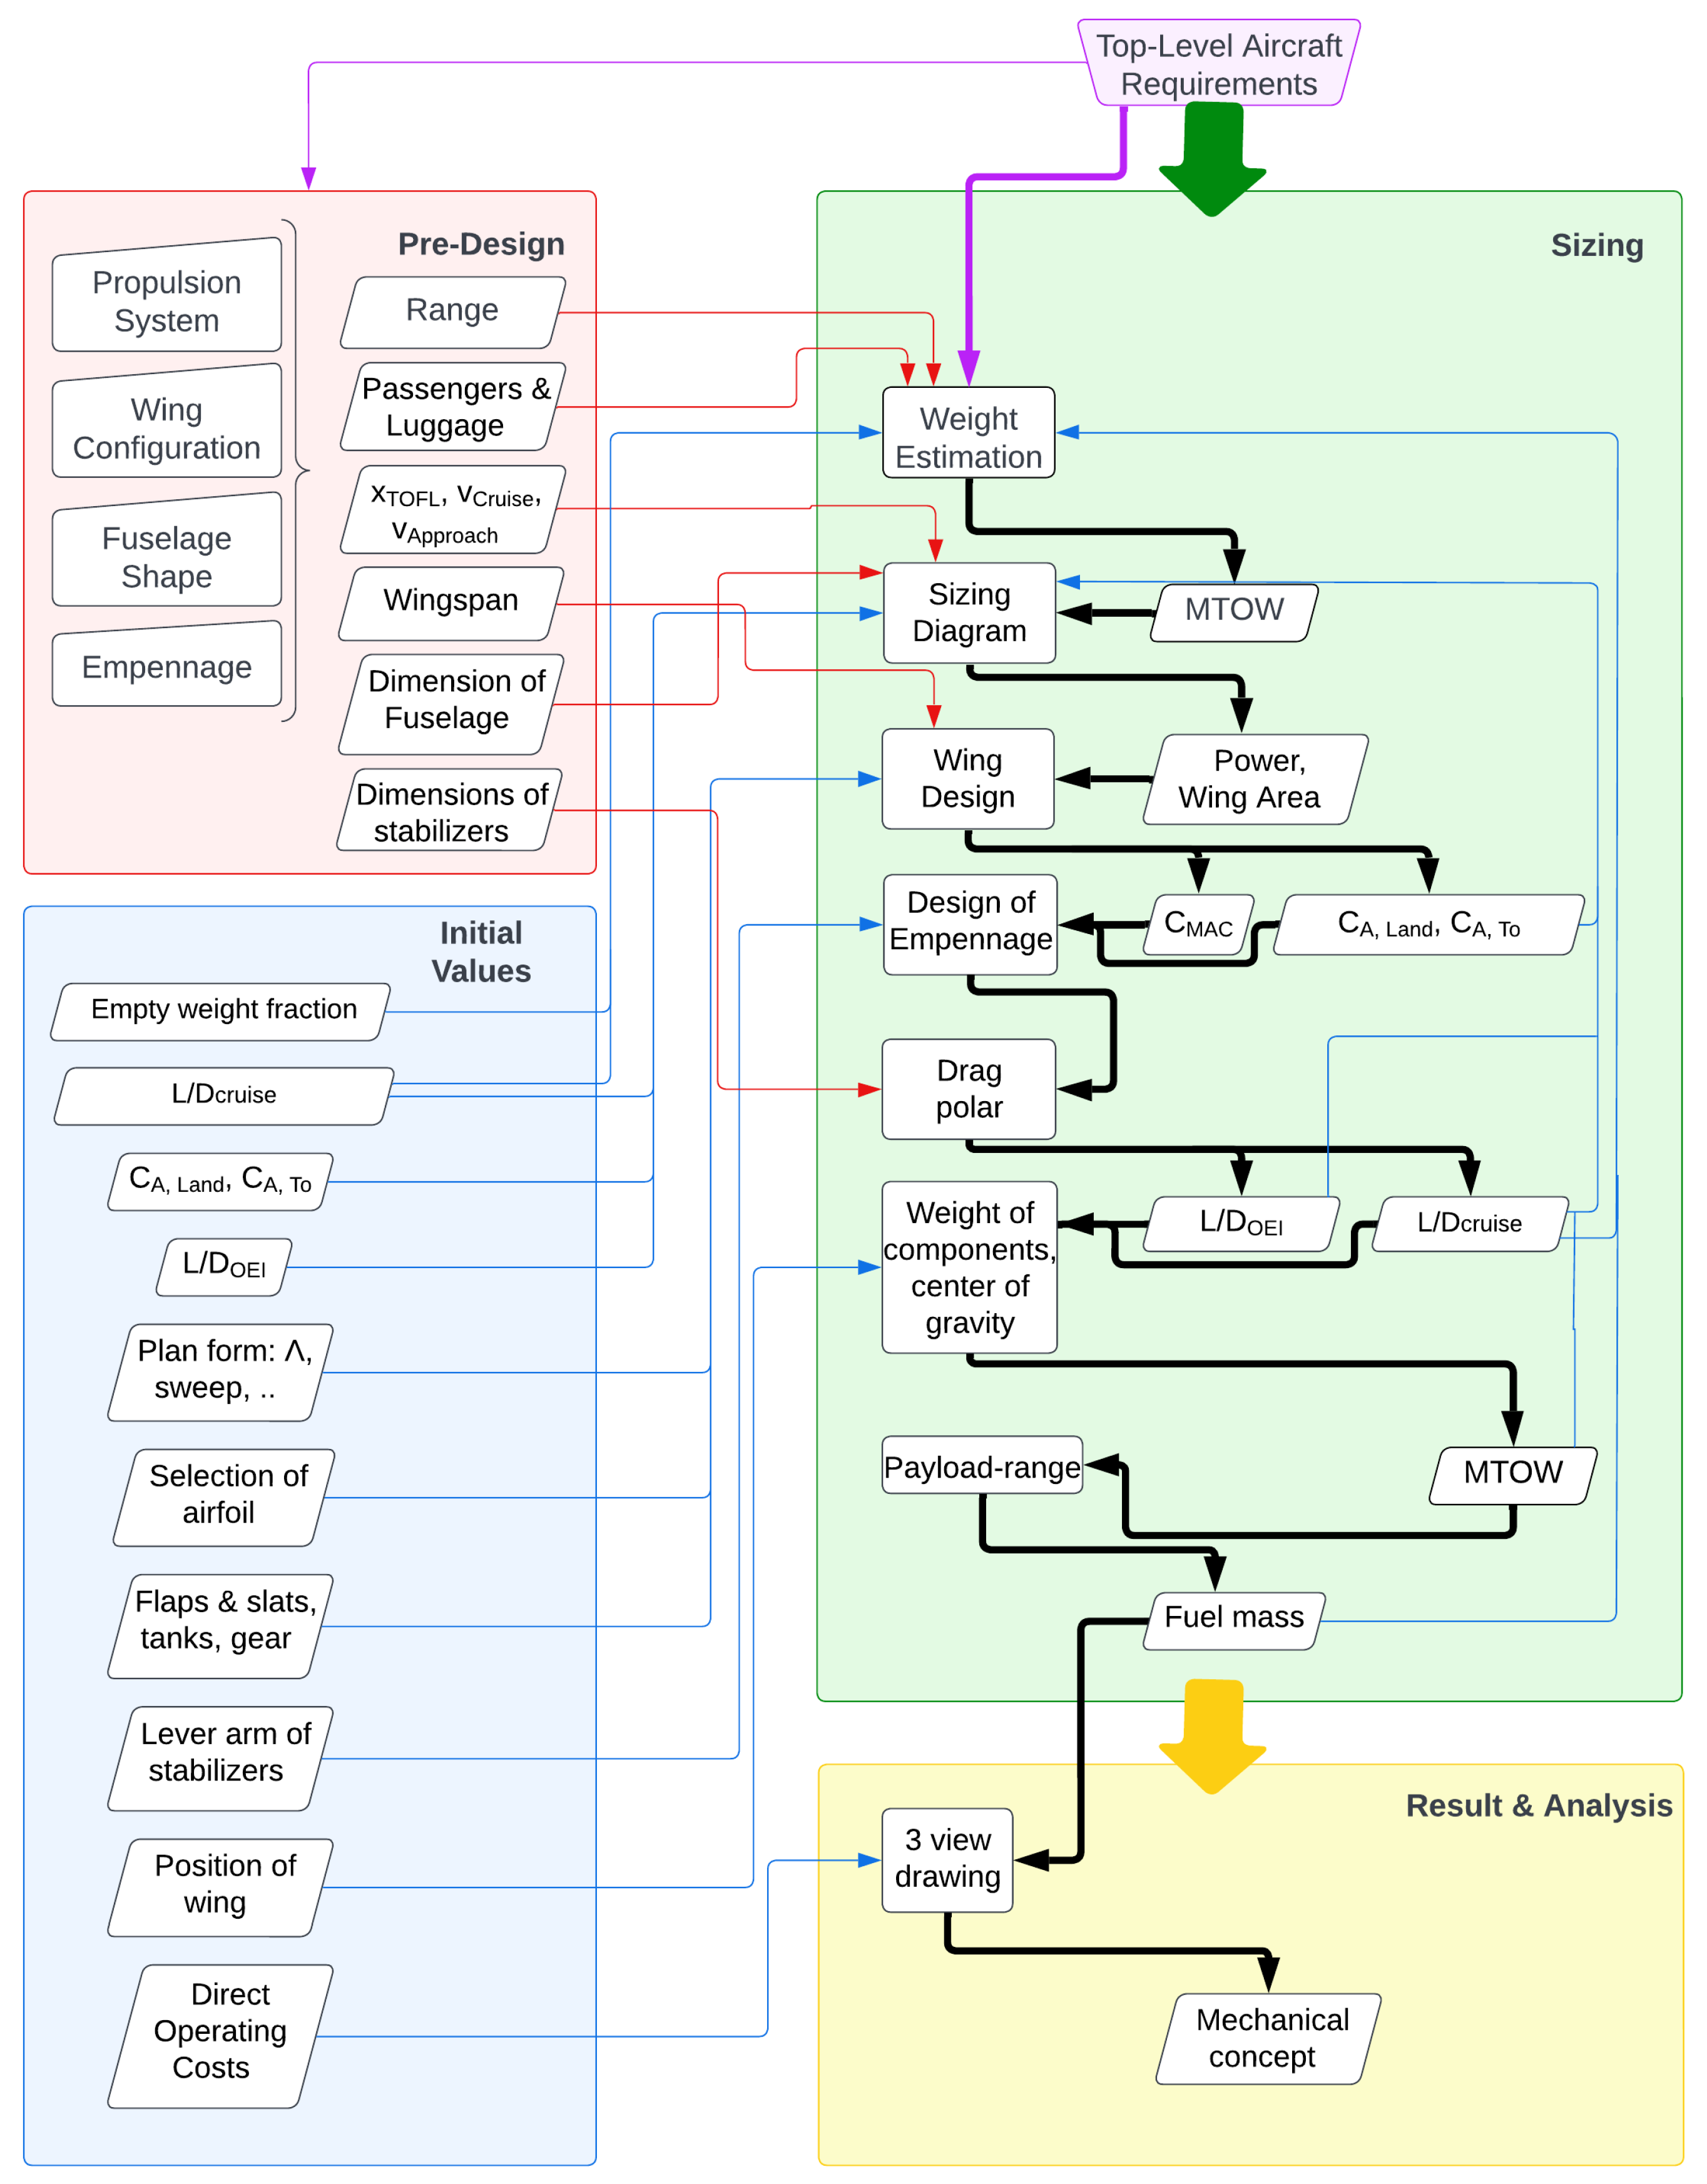
The design process is described in
Figure 1. In a first step, assumptions about the propulsion system, the wing configuration, the fuselage shape and the empennage were applied in the pre-design (red box). With these assumptions, preliminary values were defined for the range, passenger and luggage weight, runway take-off length, cruise and landing speed and wingspan. Having these pre-design values, as well as the initial values (blue box) set, the sizing process (green box) began with the weight estimation according to Roskam [
14].
In the next step, the sizing diagram was used to identify the design point and, thus, the power and wing area. This calculated wing area was used to size the wing, resulting in the required aerodynamic lift coefficients and . Further, the lift coefficient was used to obtain the drag-polar and, thus, the lift-to-drag ratio. This ratio was, in turn, used to derive the weight of the aircraft components and, thus, the center of gravity. With the calculated maximum takeoff mass, the payload-range diagram was created, which then led to the required fuel mass. Bringing the iteration to an end and moving on to the analysis (yellow box), a CAD model was adjusted, and the three-side view was drawn, bringing the mechanical concept to a final freeze.
Range Calculation for Hybrid-Electric Aircraft
Conventional fuel burning aircraft can be sized using the well-known Breguet equation, while battery electric aircraft can be sized using the modified Breguet Equation [
15]. It is possible to simplify the mission segments as “equivalent stationary horizontal flight phases” [
16]; however, for this application, a more detailed incremental time step approach was chosen. This allows the split between the energy sources to vary from one moment to the next. With this approach, the normal flightpath of an aircraft can be simulated in small time increments, calculating the required energy for each time step, splitting that energy between battery and fuel and deriving the resulting mass change from it. This allows for a very refined energy management strategy between the primary and secondary energy source.
The input parameters for the incremental calculation are the basic aircraft characteristics regarding mass, aerodynamics, efficiencies and specific energy. The output is fuel and energy used per flight segment. This incremental approach will also be used in
Section 3.1 to create the payload-range diagram for the aircraft.
2.2. Design Process of the Aircraft
To feed the design iteration code with information about new technologies, they must be thoroughly investigated. For each new component of the aircraft, a literature study was conducted to derive equations and reference values to apply to the design. The reference aircraft was used to calibrate the masses, empennage and sizing diagram.
2.2.1. Configuration Selection
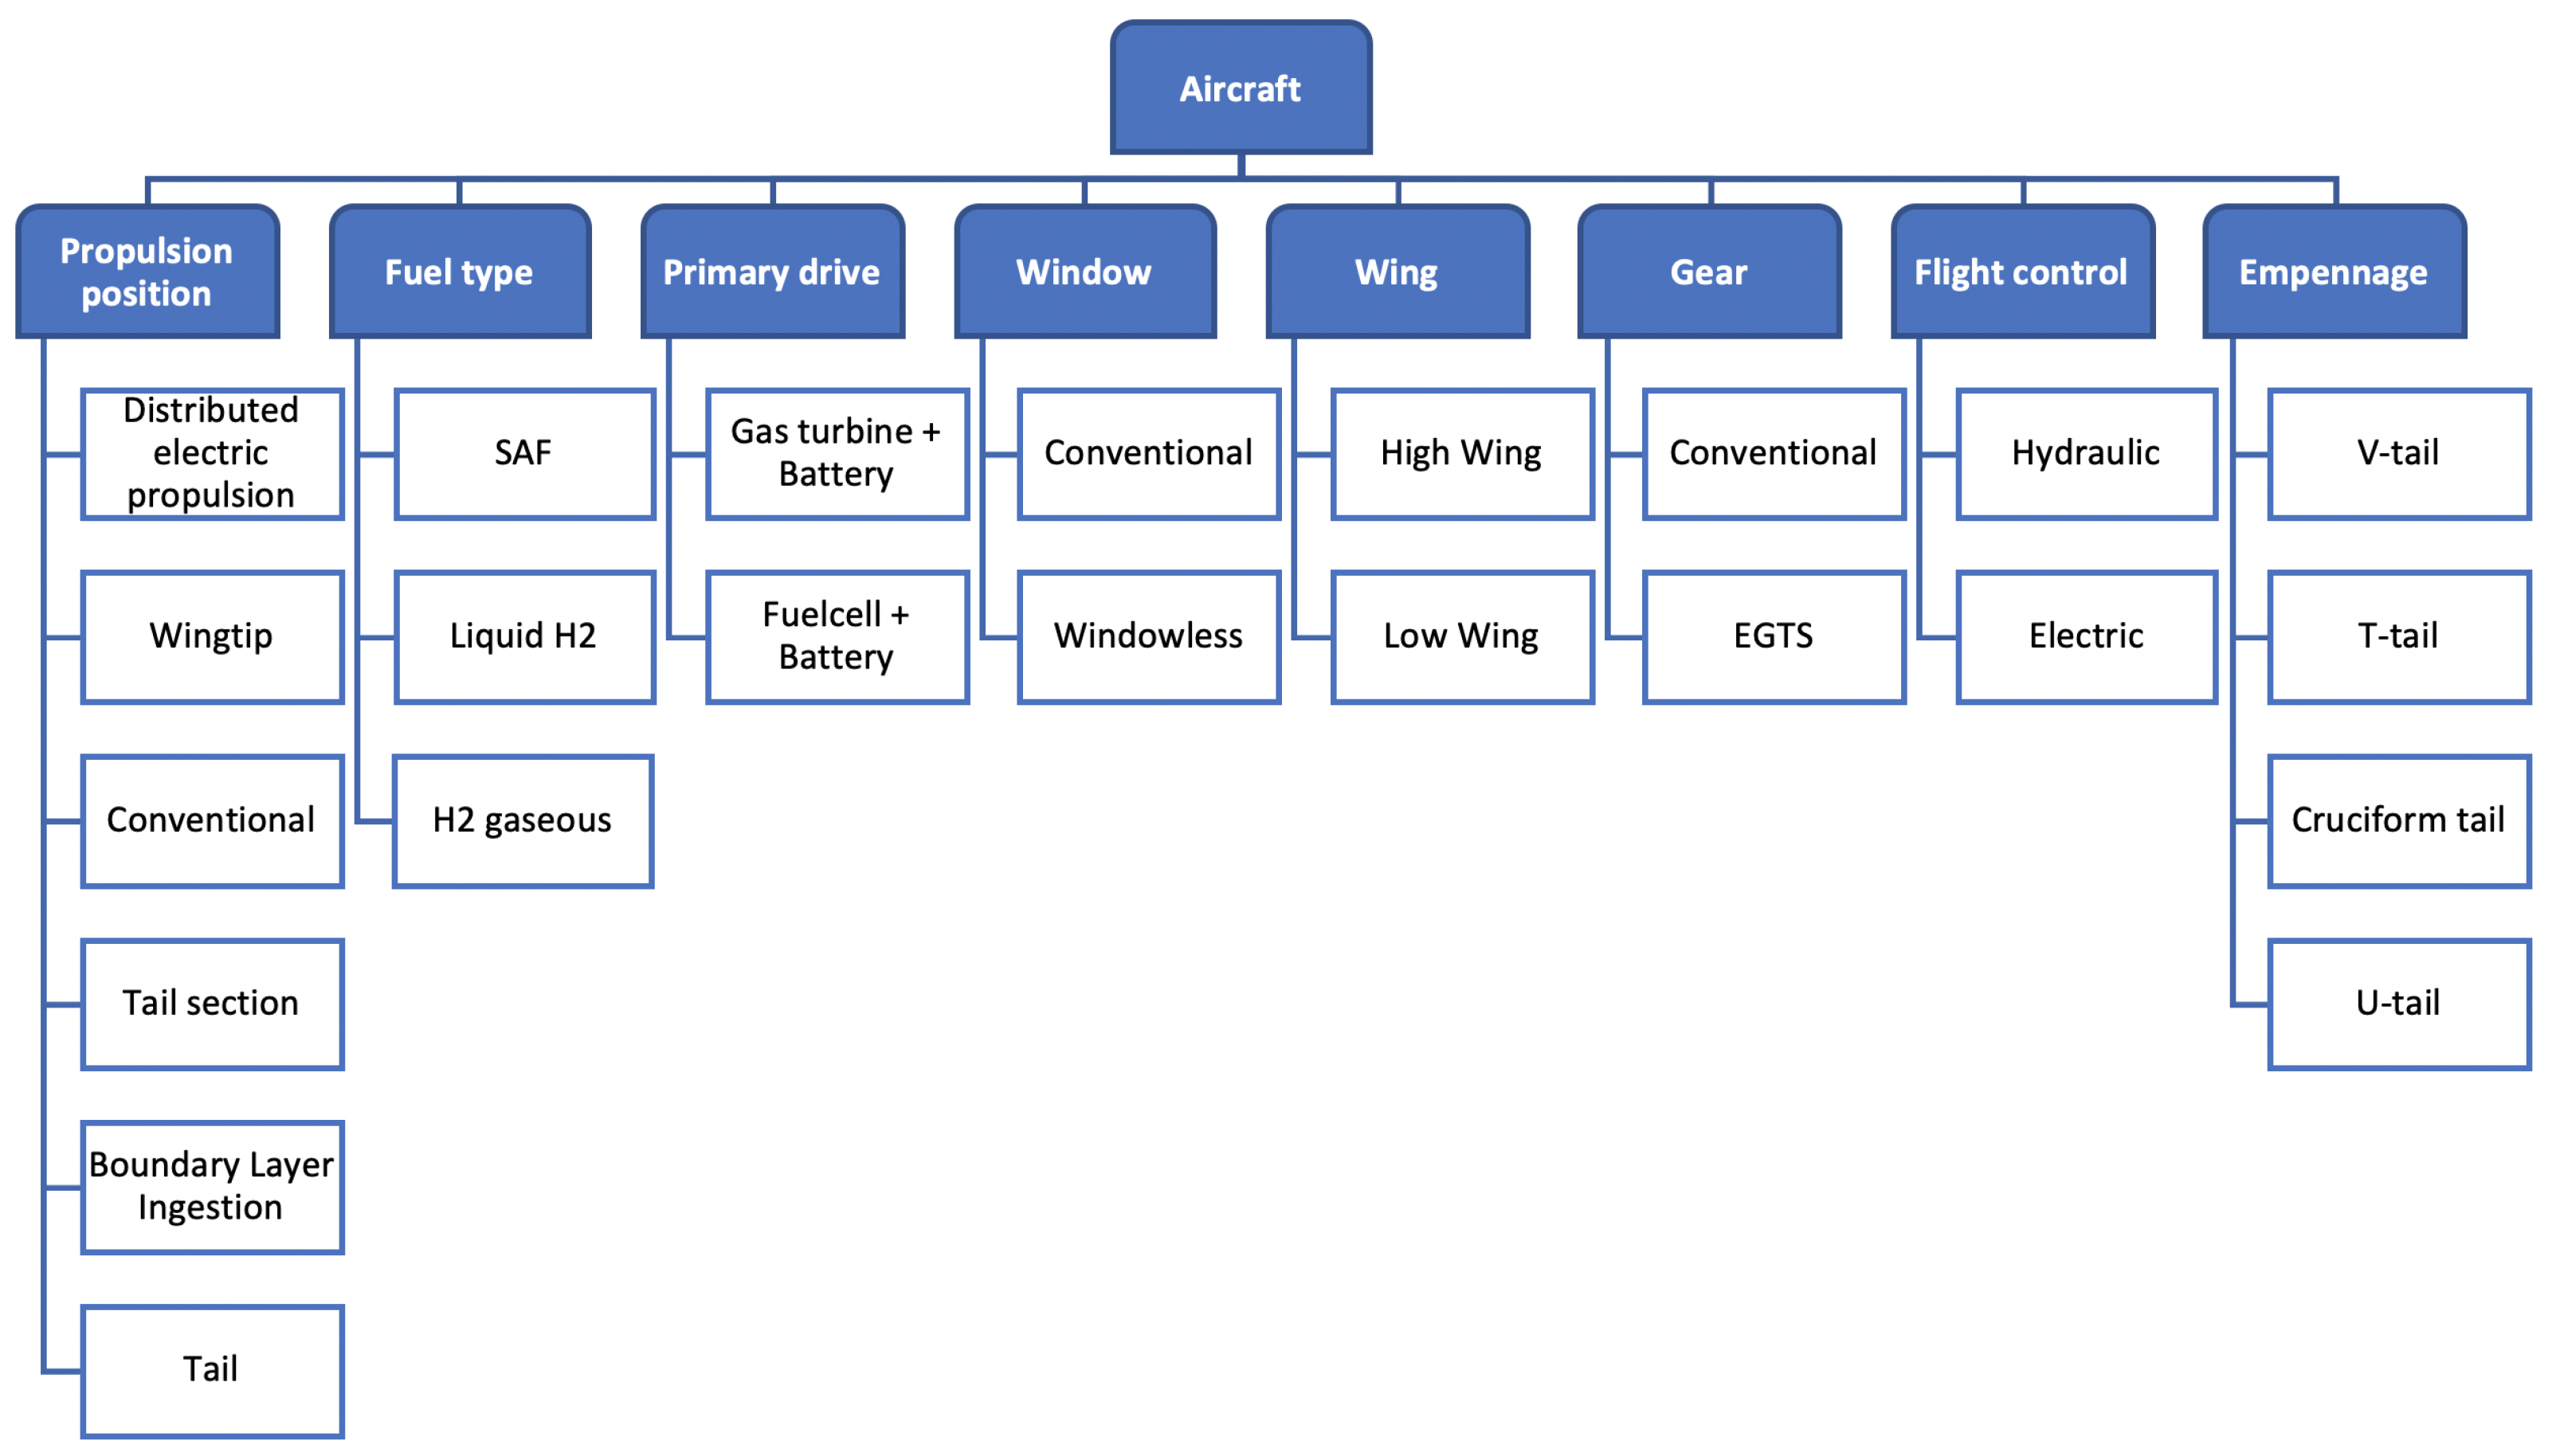
Through a preliminary evaluation process in compliance with the given TLAR [
5], some design possibilities were excluded. The remaining design possibilities are shown in
Figure 2. In this assessment, the design possibilities were evaluated by performance, environment and economics as well as operational aspects. Since the focus of this work lies in the basic design of the aircraft, no detailed analyses of the individual structures and aerodynamics were performed. Nevertheless, this work is based on scientific evidence by using estimation formulas for the design according to reliable sources [
11,
14,
17,
18]. The aim of the configuration selection is to identify a performing concept and to place the performance in relation to the reference aircraft. In the following sections, the reasoning behind every decision is explained.
2.2.2. Propeller and Wing Tip Propulsion
In the regional aircraft sector, the most prominent propulsion method is the propeller, while jets are more often used for longer ranges than the given TLAR for this design. The propeller has the advantage of possible higher efficiencies at low speed [
19] combined with lower complexity and easy conversion to an electric drivetrain when compared to jet engines [
20,
21]. With a small hybridization ratio, i.e., the ratio between electric power and total propulsive power, it is possible to use motor–generator units within a jet turbine.
With power electrification beyond 50%, the power has to be provided by an electric motor driving a propeller. Further, the electrification enables an almost free positioning of the propellers and motors. The current trends are the use of wingtip propulsion (WTP), boundary layer ingestion (BLI) and distributed electric propulsion (DEP) [
22,
23]. Research regarding BLI showed that the positive effects increased with speed, making the use at relatively low speeds of the aircraft less suitable. DEP showed promising results in an isolated setting; however, further analysis on aircraft level showed no effect or even negative effects for this application [
24].
The advantage of using WTP is the reduction of induced drag [
25]. Considering the WTP concept individually, it promises an improvement of up to 50% less induced drag during climb and 25% less during cruise [
26] regarding the wing and up to 15% less total drag on the aircraft level [
27]. Secondary effects are the decrease of the wingtip vortex intensity through the WTP [
26], which leads to a significant noise reduction [
24] as well as to a reduced wing bending moment, relieving the wing by mounting a mass with a long lever arm on the wing tip.
Concerning the aircraft, the reduction in induced drag is derived as an average of the values of Sinnige et al. [
28]. The reduction in drag is measured for a single engine per wing configuration. To account for a possible twin engine per wing architecture, the drag decrease value is assumed to be halved for that setup. In that case, the inside propeller is spinning in the same direction as the wing tip propeller, which could also help in the vortex reduction; however, this requires further investigations. In
Table 2, the chosen reference drag decrease values from Sinnige et al. [
28] for the single engine case are listed, as well as the assumed correction factor to account for a possible twin engine setup. These reference values are used to reduce the induced drag at the wing level for the calculation within the design code.
2.2.3. Wing Design
For the wing, the maximum lift coefficient
was calculated using Raymer [
18] sizing methods. For the wing area S, the wingspan b and the taper ratio
, the initial values were defined before the execution of the sizing iterations. In the following design process, S was obtained through the iterating mass estimation, while b and
were chosen values. With the lift coefficients of the selected airfoils at different positions from the reference aircraft, the maximum lift coefficient was obtained. In contrast to current generation aircraft, the wing is not used to store fuel and is, therefore, not subjected to passive stress relief.
The advantage of the WTP, in this case, is the mass of the motor, gearbox, DC/AC converter and propeller acting as a load reducing bending moment with a long lever arm. This can result in an increase of the local wing bending moment along the wingspan. The additional stress is compensated for by applying a factor to the wing mass since the maximum absolute bending moment occurs at MTOM. This factor is calculated as the ratio between the wing bending moment for an aircraft wing in a theoretical "standard" configuration (inboard engine and fuel in wing; usual estimations applicable) and the selected configuration (WTP and dry wing). The additional wing root bending moment can be reduced by increasing the wingspan and, therefore, increasing the lever arm of the WTP mass. This further improves the aircraft performance by reducing the weight.
2.2.4. Empennage
According to Raymer [
18], the empennage should typically be considered to be conventional. Nevertheless, unconventional tail configurations may have advantages in special use cases. The criteria related to structural connections, dimensions, mass and flow interactions must be considered when deciding on the type of empennage [
18].
Depending on the chosen propulsion concept, the yawing moment must be considered when designing the vertical tail plane (VTP). If the propulsion concept is not different from the reference aircraft, the empennage is dimensioned with a volume coefficient similar to the one of the reference aircraft. Since the configuration includes wingtip propellers, the volume coefficient of the VTP has to be increased to provide a sufficient yawing moment during wingtip engine failure. The increase is calibrated using the reference aircraft. First, the volume coefficient of the reference aircraft is determined. The ratio between the yawing moment created by the engine in the one engine inoperative (OEI) case and the volume coefficient of the VTP of the reference aircraft is calculated. This ratio is used to increase the conventionally calculated volume coefficient to account for the unconventional architecture.
2.2.5. Fuselage
New propulsion concepts do not necessarily require a new fuselage design. A comparison of aircraft with similar passenger capacities in terms of the number of seats can be useful as demonstrated in the chart provided by [
29]. Based on the integration of the fuel tanks and further system technologies, the dimensions of the fuselage could vary. A reasonable fuselage fineness ratio should be between 5.6 and 10 for regional aircraft, according to Roskam [
17].
There are multiple approaches to maximizing cabin space; however, it is essential to weigh the balance between passenger comfort and space utilization in the design process [
30]. With a market analysis, the current state of the art in cabin layout can be analyzed as well as new concepts, such as a windowless fuselage [
31]. Nevertheless, the urgency for a regional aircraft design preferring passenger comfort over the use of space is not relevant. The major change to the fuselage is the integration of the fuel tanks, which is covered in more detail in
Section 2.3.3.
2.2.6. Landing Gear and Electric Green Taxiing System
There are two main options for the integration of the main landing gear in reference to other high-wing aircraft [
12,
32]. The first option is the integration in a belly fairing—similar to the reference aircraft. The second option is the integration in the cowling of the turboprop engine as on the De Havilland Dash 8–400 [
32]. The integration in the cowling is challenging due to the propulsion choice of the relatively compact electric motor instead of a gas turbine. To reduce energy use and noise on the ground, we investigated alternative forms of taxiing.
At larger European airports, an aircraft spends 10–30% of its block time taxiing [
33]. The electric green taxiing system (EGTS) promises to be a great solution to increase efficiency during this phase. Electric motors have a relatively low noise output, and, locally, they emit no emissions [
34]. The technology readiness level (TRL) of onboard electric taxiing systems is between TRL 6 to 7 [
35]. With regenerative breaking during the taxiing phase, 15% of the energy could be recovered [
36], and the lifetime of the brake system would be increased [
37,
38]. The utilized dimensions for an electric taxiing system were calculated with the formulas from Heinrich et al. [
39].
2.2.7. Mass Calculation and Center of Gravity
The individual component masses were calculated by semi-empirical equations, which were derived by Torenbeek [
11]. To start the iterative calculations, first, assumptions were made with the existing data of the reference aircraft [
40]. The propulsion concept eliminates the conventional turboprops; therefore, the mass of the electric motors, including cabling, is calculated by linear scaling using the required power [
41]. Electric motors are scalable and adjustable within the required power [
42].
The mass of the fuel cell and batteries are calculated according to the methods in
Section 2.3.1 and
Section 2.3.4. In case the reference aircraft differs in the composite vs. total structure volume ratio, further mass reduction factors can be introduced [
43]. One method for calculating mass reduction factors is to reference existing data, such as the 20% structural mass savings achieved by Boeing through the use of 50% composite materials [
44]. However, there is inherent uncertainty in this extrapolation, and thus conservative values as calculated by Kolb-Geßmann [
45] were adopted and are presented in
Table 3.
The crew is considered to consist of two pilots and one cabin crew member, which were conservatively assumed at 85 kg each [
46]. According to Roskam [
14], the crew is an element of the operating mass empty (OME). Furthermore, the center of gravity (CoG) of the components can be determined with the methods of Torenbeek [
11]. Considering the aircraft at OME with the added max fuel mass, the maximum static margin can be determined.
2.3. Powertrain
New propulsion technologies require new calculation approaches. By scaling the confirmed values of previous work, the component architecture can be calculated as laid out in the following sections.
2.3.1. Fuel-Cell System
The sizing of the fuel-cell system was conducted based on the evaluation of the feasibility of dual use of liquid hydrogen in regional aircraft [
47]. The focus of the research of Hartmann et al. [
47] is an ATR 72, and thus the results of their baseline scenario are scaled down using the fuel-cell polarization curve for the baseline case in [
47]. The ATR 72 is the larger version of the reference aircraft; however, since the powertrain is only influenced by the required power for the aircraft and not other characteristics, e.g., the wingspan and fuselage length, it is viable to scale the powertrain from the ATR 72 to a smaller aircraft.
The linearized section is assumed to be applicable from a current density of 0.2 up to 1.4 A/cm2. Three different cases were investigated, and the resulting sizing of the fuel cell had to work for all of them. The first scenario is the maximum power during take-off. For this case, the highest current density is expected. The upper limit of 1.4 A/cm2 results in the smallest size of the fuel cell, while it is desirable to achieve a lower current density since that correlates linearly with higher efficiency. The second case is cruise flight. The segment is the longest of the whole mission; therefore, a high efficiency in this segment results in a high efficiency for the total flight. The third case is the descent phase.
Since the powertrain components utilize superconducting technologies, it is necessary to provide a minimum flow of hydrogen to keep the components within their operating window. This hydrogen will not be vented but instead used to power the aircraft during descent, with the excess power being used to charge the battery. In this case, the current density should not be lower than 0.2 A/cm2. The minimum flow is calculated in three steps:
Calculate the mass flow for the ATR 72 during cruise.
Divide the mass flow by the ATR 72 cruise power.
Calculate the mass flow of the aircraft by multiplying the result of step 2 with the aircraft’s cruise power.
Another limiting boundary condition for the fuel cell sizing is the maximum de-charge rate of the battery during take-off. For durability reasons, this is set as 2C. The mass of the fuel cell is calculated using the stack mass density given for the baseline scenario in [
47] using the calculated fuel cell area for the aircraft. The mass of the compressor and the humidifier are linearly scaled from the results for the ATR 72 using the fuel cell power. To account for structures, etc., we introduced a Balance of Plant (BoP) factor. This was set as 20% by Hartmann et al. [
47] and was used for the aircraft to add to the total mass. The reference values for the calculations are listed in
Table 4.
2.3.2. Thermal Management System
The thermal management system (TMS) consists of two different types of cooling loops. One loop uses the liquid hydrogen to absorb the heat from components, while the other uses a conventional cooling cycle [
47]. Since the difference between the temperature of the components and the surrounding air is small compared to other appliances, the airflow in the cooling inlet has to be higher to achieve sufficient cooling. To estimate the amount of thermal energy that must be removed from the system, the energy distribution between power used at the propellers and generated heat was taken from Hartmann et al. [
47] for the cruise flight segment.
The TMS load is defined as the ratio between heat energy displaced by the TMS and the electric energy provided by the fuel cell. To calculate the TMS load for the aircraft, first, the difference in fuel cell efficiency compared to the reference in Hartmann et al. [
47] was added/subtracted to the reference TMS load. These values are listed in
Table 5. The second step is multiplying the resulting number with the required propulsive power to result in the heat power distributed to the TMS for the aircraft. Conventional cooling systems consist of an air intake, a radiator and a nozzle to expel the air efficiently. Most applications have an additional fan fitted to keep the performance of the radiator high even if the airspeed is low, for example during the taxi phase.
The additional drag from the radiator can be reduced with the Meredith effect [
48]. Kellermann et al. [
49] concluded in their studies that the drag increased by 0.7% due to the radiator. Since the study was conducted for a 30% hybridized 180 seat aircraft, the drag can be scaled with the reference heat load and a reference MTOM. To calculate the additional drag for the aircraft, an increase in heat load and a decrease in MTOM result in a higher drag penalty. The reference values from Kellermann et al. [
49] are listed in
Table 6.
Chapman et al. [
50] conducted simulations on the transient behavior of fluid-based TMS. Their findings concluded that designing the TMS for the maximum system power as a steady state can result in oversized cooling systems. Their simple model was tested for a much smaller load and fluid mass compared to this aircraft; however, the results showed that maximum power for less than 2 min leads to a much smaller TMS size. Since the takeoff phase takes less than a minute for regional aircraft, the cruise power was used to size the TMS. The TMS fluid capacity should be sized to allow this simplification in follow up projects.
2.3.3. Fuel Tanks
Liquid hydrogen is stored at temperatures below 20 K for multiple hours within the aircraft’s tanks, resulting in the need for an insulated fuel tank. Compared to gaseous hydrogen, which is used in the automotive industry, the tank pressure is low, thereby, resulting in lower strength requirements. The wall thickness and resulting empty tank mass were derived from Silberhorn et al. [
51] for their tank concept in the rear of the aircraft and are listed in
Table 7. Their fuel tank mass was scaled cubic with the block energy. This was chosen because the tank volume, which is directly proportional to the stored energy, scales with the power of 3 with the radius. The resulting mass from the cubic scaling was further reduced since the mission range in the TLAR is only 14% of the aircraft used by Silberhorn et al. [
51], resulting in an estimated reduction of wall thickness of 60%.
2.3.4. Battery
The automotive and aviation industries are currently dominated by lithium-ion batteries; therefore, to establish the configuration of the battery, we considered six important factors: the Specific Energy, Specific Power, Cost, Life Span, Safety and Performance. Lithium cobalt oxide (
)—LCO; lithium nickel manganese cobalt oxide (
)—NMC; and lithium iron phosphate (
)—LFP batteries are the three most promising concepts for future batteries [
52].
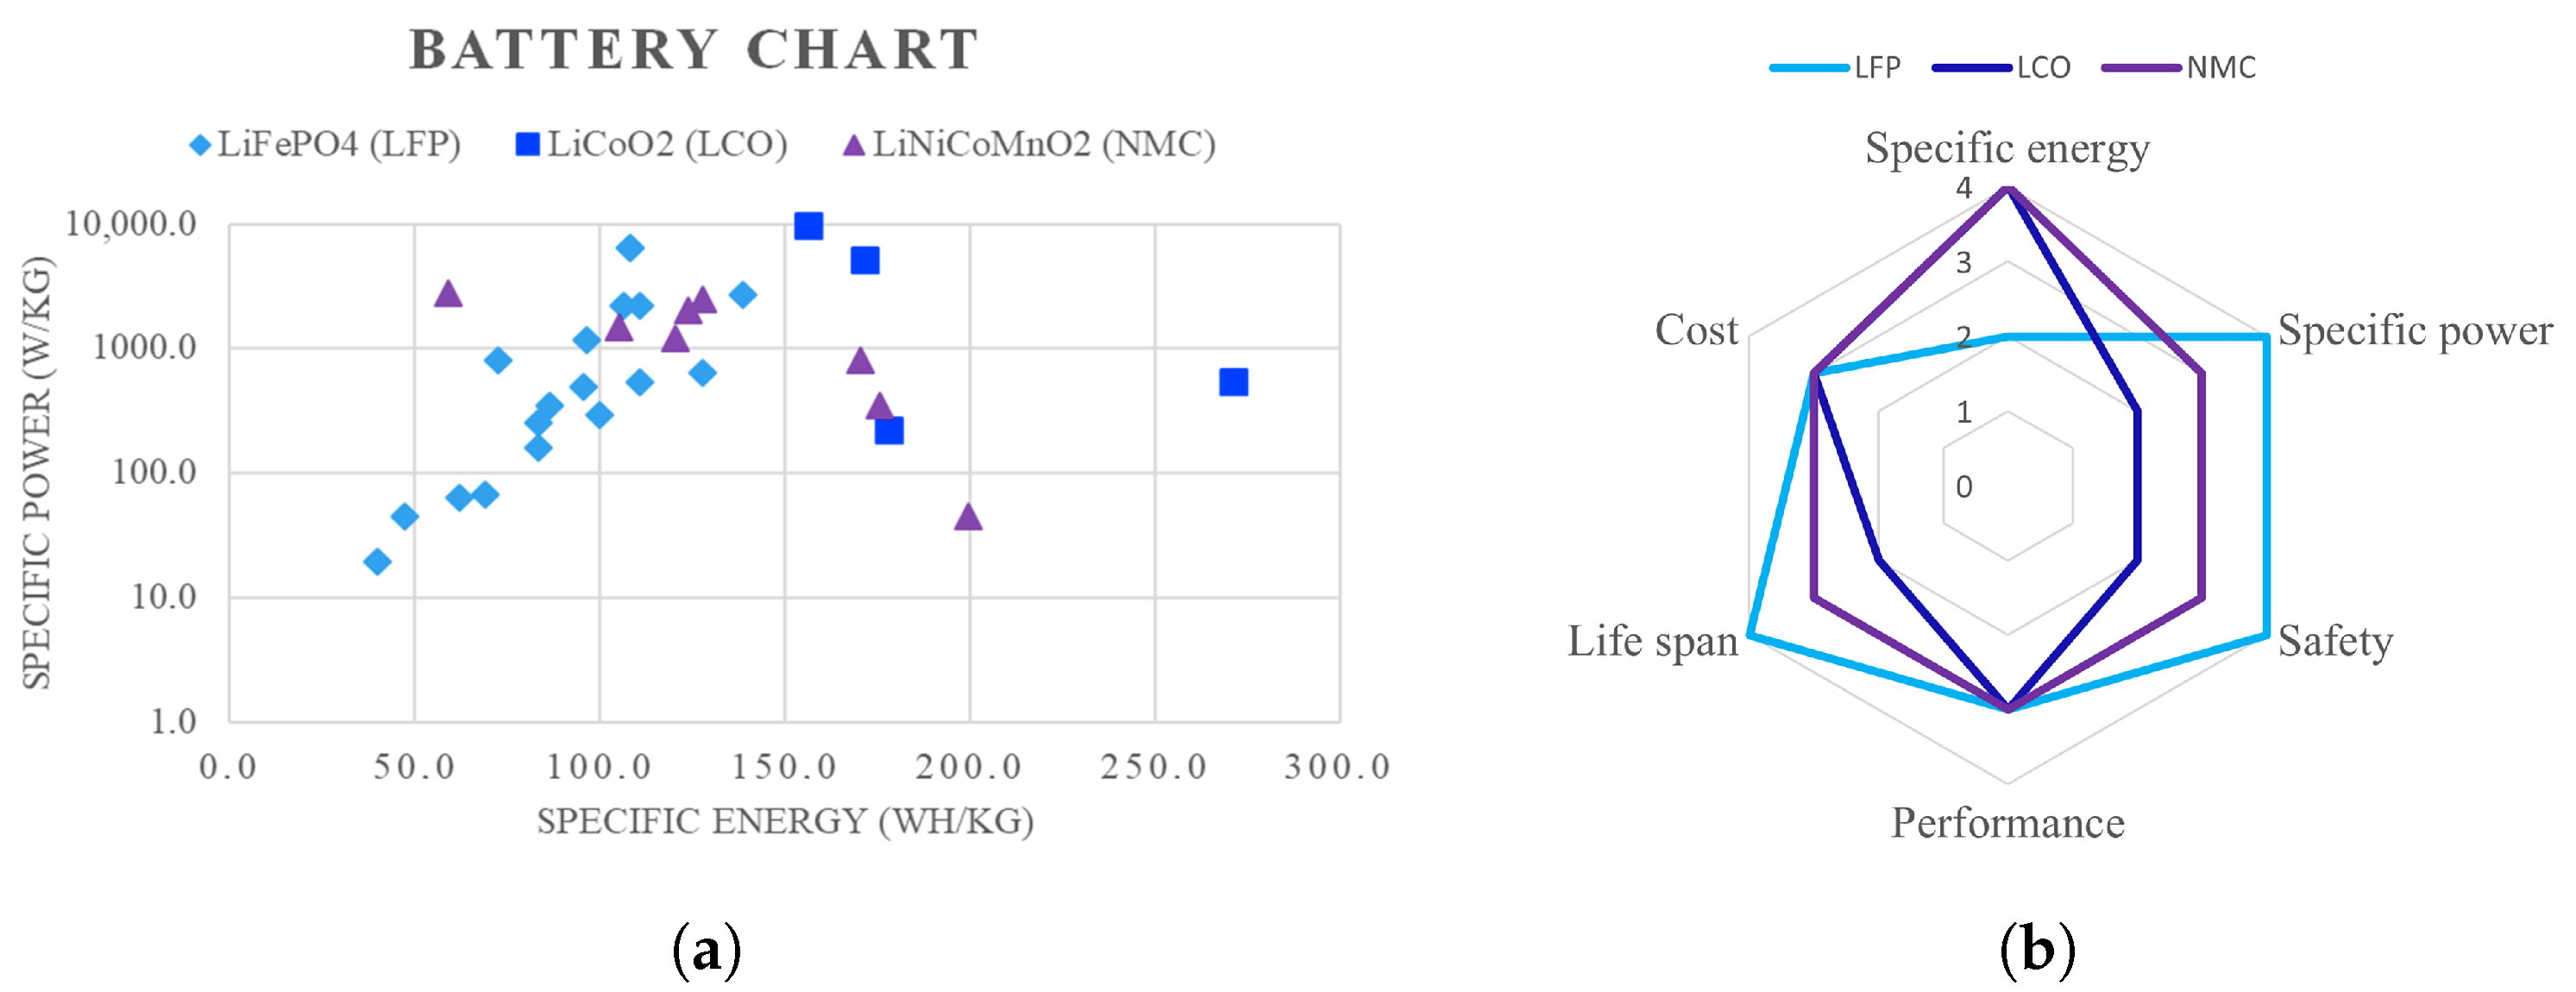
Figure 3 shows a comparison between the main variables investigated for the selection of the battery.
Figure 3a presents a comparison between the specific power and the specific energy of the three selected battery types. Those figures, in combination with the requirements for the aircraft powertrain, are used to decide on the battery chemistry. High power needs to be achieved, and high specific energy use is attenuated since the batteries will be used mainly at takeoff and not during the flight. For this reason, a LFP battery that meets those characteristics was chosen.
Figure 3a indicates specific powers up to 2000 W/kg with 140 Wh/kg for LFP batteries.
Figure 3b represents a radar chart that relates the aforementioned variables where LFP batteries stand out with respect to their life span, safety and specific power. LFP batteries have an ideal cycle life of 1000–2000 with a charge rate between 1 and C and discharge rate of between 1 and C and 3C. This means that the battery can provide between one and three times its capacity in energy output per hour [
53]. However, it is important to note that the discharge rate of LFP batteries is generally higher than the charge rate; however, they maintain better performance during their life cycle compared to the other batteries mentioned [
54].
Figure 3.
(
a) Specific power vs. specific energy of Li-ion batteries distinguished by cell chemistry [
55]. (
b) Radar chart of LFP, LCO and NMC battery comparison [
56].
Figure 3.
(
a) Specific power vs. specific energy of Li-ion batteries distinguished by cell chemistry [
55]. (
b) Radar chart of LFP, LCO and NMC battery comparison [
56].
2.3.5. Superconducting Motors and Power Electronics
As mentioned in
Section 2.3.2, the hydrogen is used to cool the powertrain components. This enables the use of superconducting materials for the motors, inverters and cables. The efficiencies and masses for the cables and inverters were estimated using the values from Hartmann et al. [
47]. The superconducting motor mass can be estimated with the equation of Lukaczyk et al. [
42], while the efficiency was estimated at 98% [
47]. Power densities for high-temperature superconducting (HTS) motors producing 1 MW above 13 kW/kg are feasible according to Yoon et al. [
57] with their market readiness expected in the early 2030s [
58]. The total power of the aircraft is expected above the reference aircraft’s power at about 4000 kW. The selected power density for the motor is 15 kW/kg, resulting in a slightly heavier motor than the estimation equation according to Komiya et al. [
41] would predict.
2.4. Impacts on the Turnaround Process
One of the key elements of a competitive aircraft is the turnaround process. Compared to the current generation of regional aircraft, there are three major changes:
Liquid hydrogen is used instead of jet fuel.
The refueling vehicle is connected to the back of the aircraft instead of the wings.
The battery may have to be recharged.
Mangold et al. [
59] investigated possible solutions to refuel hydrogen aircraft. They concluded that the safety level can be as high as it is today for kerosene. To calculate the total time for the turnaround process, fixed values were used for segments where no fuel is transferred into the aircraft, and a flow rate was used to calculate the time for the actual refueling. For this aircraft, a single fuel line case with purging was assumed with the variables taken from Mangold et al. [
59] as listed in
Table 8.
The other areas that we considered for the turnaround process were the passengers, baggage and battery recharging. For all of those segments, the equipment positioning and removal time was taken from Mangold et al. [
59]. For the passengers, the boarding and de-boarding rates for a Type I door were taken from Airbus [
60]. The cleaning rate can be estimated as 3 seats/min according to Fuchte [
61] with an estimation of two cleaners for this aircraft. The baggage is loaded at two separate locations in one compartment each as bulk cargo. The Boeing 737 utilizes the same cargo storage strategy allowing for their loading and unloading rates [
62].
Regarding the battery, the before-mentioned maximum rate of 2C for charging and discharging is applied for the energy transfer required on the ground. However, the strategy for the aircraft is to not have the charging time exceed the longest segment in the turnaround process, i.e., the passengers. This is managed by recharging the battery in flight to a level where the battery can reach the desired state of charge during the turnaround in the specified time frame. The selected values used to calculate the turnaround process are listed in
Table 9.
2.5. Cost Calculation
The costs are subject to different variables, such as depreciation, insurance, maintenance, fuel consumption, flight crew, cabin crew, landing fees and passenger services. These variables are grouped into direct operating costs (DOC) and indirect operating costs (IOC) [
63]. The IOC depend on the relation between the airline and the client and, thus, is difficult to estimate. For this reason, it was not calculated in the present study. This study focuses on the evaluation of aircraft design in economic terms through the cost per available seat kilometer (CASK) and the DOC. A number of methodologies exist to estimate the DOC with high reliability, e.g., ATA, NASA and AEA1989 [
64].
ATA is based on industrial statistics from the United States [
65], NASA uses an estimation methodology considering interest [
66] and AEA is a comparison methodology used in Europe [
67]. In this paper, studies were conducted based on the AEA1989 model. The comparison with the reference aircraft was performed considering a depreciation calculation based on the AEA Method 1989 over 14 years. For the year 2035, consequently, a reduction in hydrogen prices between 1.5 €/kg and 5.5 €/kg is projected [
68] as shown in
Table 10, while an increase of 10% for fossil fuels is estimated compared to the current price [
69].
On the other hand, Rethink Energy’s model establishes, however, that the cost of green
will fall to slightly over
$1/kg in 2035 as led by nations such as Brazil or Chile, generating the possibility of reaching even lower prices [
70,
71]. Consequently, achieving this price for green hydrogen reduces the level of emissions to zero, something that does not occur with blue hydrogen with 10%
emissions or the total release of gray hydrogen obtained only by steam methane reforming (SMR) or gasification [
68].
In contrast, electricity prices will remain constant given the continent’s transition to renewables. The implementation of these new environmentally friendly technologies affects the fee costs in the DOC. For the AEA method, it was necessary to add charges related to pollution and noise [
72]. Those charges are considered for this study, although they are currently not applied at every airport.
3. Results
The following sections present detailed results from the previous chapter’s analytical and empirical analysis. Trade-off studies, which are explained in the next section, provide the basis of the final design choice.
3.1. Payload Range Diagram and Design Point
As hydrogen was chosen as the main energy carrier, the shape of the payload range diagram is significantly different from typical diagrams. The high gravimetric energy density of the fuel leads to a very shallow middle section, making it impossible to place the TLAR mission on this section without breaking the maximum payload requirement. Therefore, the chosen design point is the required maximum payload of 5800 kg for a 400 km mission as shown in
Figure 4 with the blue line and dot. The TLAR mission can be achieved as shown by the red dot.
3.2. Trade-Off Wingspan
Several trade-off studies are performed with the design iteration code. More wingspan usually leads to better aerodynamic performance; therefore, the calculations were performed for wingspans starting from the ATR 42 at 24.6 m and reaching to the end of Airport Category C at 36 m. The grading criteria are the energy requirements for the 400 km mission since this is a major part of the grading criteria for the whole aircraft, i.e., the DOC. Even though the best aircraft performance is at a span of 36 m, the overhanging WTP tips reduce the available wingspan to about 32 m. To account for structural integrity, the maximum taper ratio was set to 0.25, which limits the wingspan to 28.5 m as can be seen in
Figure 5. Therefore, the wingspan of HAIQU was selected to be 28.5 m.
3.3. Result of the Propulsion System Sizing
During the aircraft design process, we observed that using only wingtip propellers would lead to immense yawing moments in the case of a single engine failure regarding the electric motor, thus, leading to an oversizing of the VTP. To mitigate this problem, two further propellers were placed in a conventional location on the wing close to the fuselage. To optimize the power split between the outer and inner propellers, a tradeoff study was conducted with the result being that a slightly more powerful WTP would be the optimum solution regarding the boundary conditions.
However, the design iteration code does not include effects regarding disc loading, blown wing area and similar; hence, the results of Nathaniel [
27] were used to define the power split to achieve a higher level of fidelity. They investigated the power distribution of an ATR 42–500 with WTP and conventional propellers. A power split of 50–50 between the WTP and the inbound propellers was identified to be the optimum as the split reduces the disc loading and, therefore, reduces the total required power by 5% compared to a configuration with one propulsor per wing. While the induced drag reduction decreases when using more than one engine per wing, the effects of the disc loading dominate in comparison, thereby, leading to better performance with four propellers.
3.4. Power Split between Battery and Fuel Cell
The battery concept of HAIQU is to keep the mass as low as possible and to use it as emergency backup while also increasing the lifetime of the battery. With the calculated mass flow for the descent, the minimum fuel cell power setting is 1050 kW, of which 420 kW are not used by the propulsion system or climate control. This overproduction is directly fed into the battery to recharge it at 2C to further reduce the turnaround time. This maximum charging power during descent, in turn, limits the fuel cell takeoff power to 3400 kW. The remaining 440 kW for the takeoff power are provided by the battery system.
With the given power density, the resulting battery mass would be 300 kg; however, the self-set requirement to have a large enough battery to fly at a constant altitude for 10 min (a single traffic pattern in case of fuel cell failure for example) demands a storage capacity of 206 kWh resulting in a battery mass of 1950 kg. The fuel cell has a resulting mass of 1020 kg with the compressor and humidifier weighing 410 kg. The cable, propeller, inverter and gearbox masses are listed as sums in chapter
Section 3.5.2. The results are listed in
Table 11 for a better overview.
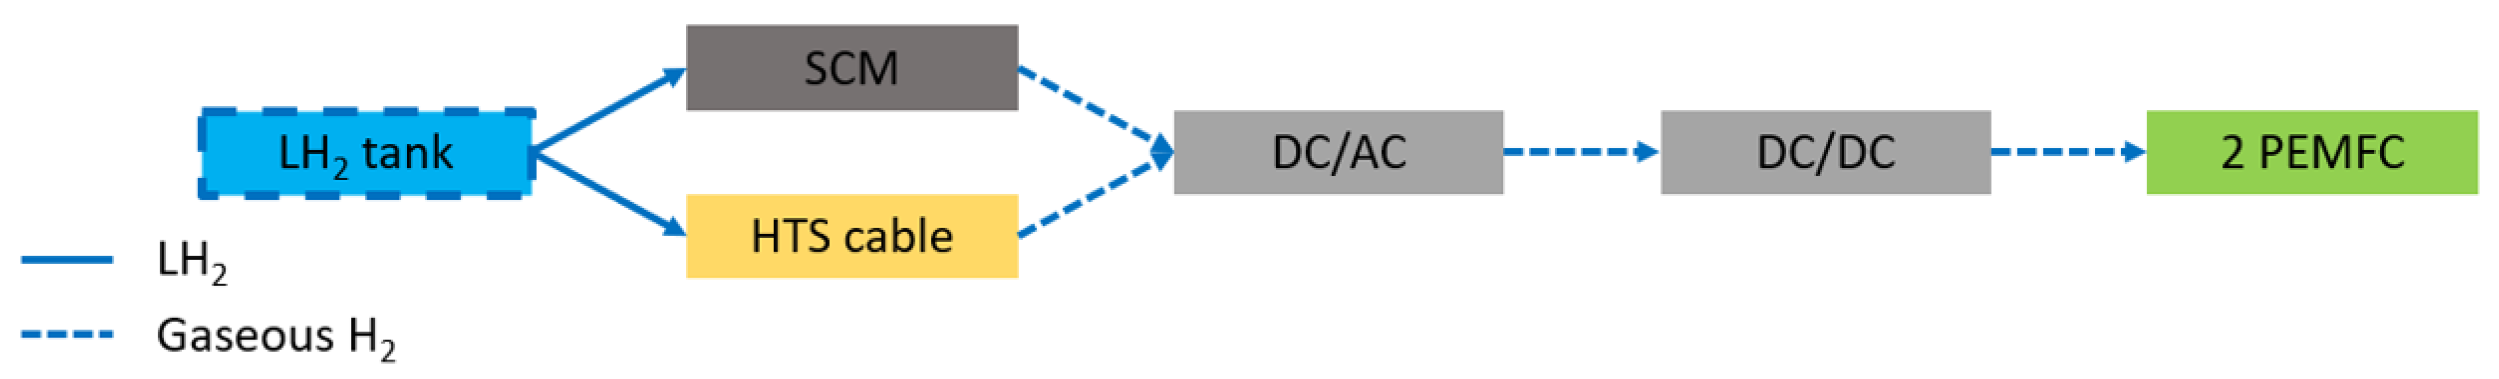
To increase safety through redundancy, two identical fuel cells in the back of the cabin and two identical batteries in the front of the cabin are used. The energy from both systems is transformed using a DC/DC converter each to achieve the best transport voltage for the superconducting cables. Those cables run from the DC/DC converters to the DC/AC converters located at the motors in the wing as can be seen in
Figure 6.
The motors need to provide a power of 900 kW each, resulting in a mass of 60 kg with the gearbox adding another 35 kg each. They are driving a six-bladed propeller with a diameter of 4 m running at low speed for lower noise emissions. Regarding the TMS, the hydrogen is pumped from the tanks through the HTS cables and in a separate line to the motors to supply the right temperature to both components. Both flows recombine at the DC/AC converters and merge back in the fuselage to cool the DC/DC converters before the gaseous hydrogen is heated to 85 °C using the fuel-cell system. This order is derived from Hartmann et al. [
47] and shown in
Figure 7 but with a few modifications to reduce the fuel line length.
For the cruise flight, a fuel consumption of 2.2 kg/min is achieved at a fuel cell efficiency of 55%. This results in fuel consumption for the whole 400 km flight mission of 172 kg. The electric green taxiing system complies with the requirements, and HAIQU fulfills the Flightpath 2050 goal of emission-free aircraft movements during the taxiing phase [
73], as the electric motors produce relatively low noise, and they emit no emissions locally [
34].
3.5. Resulting Aircraft Design—HAIQU
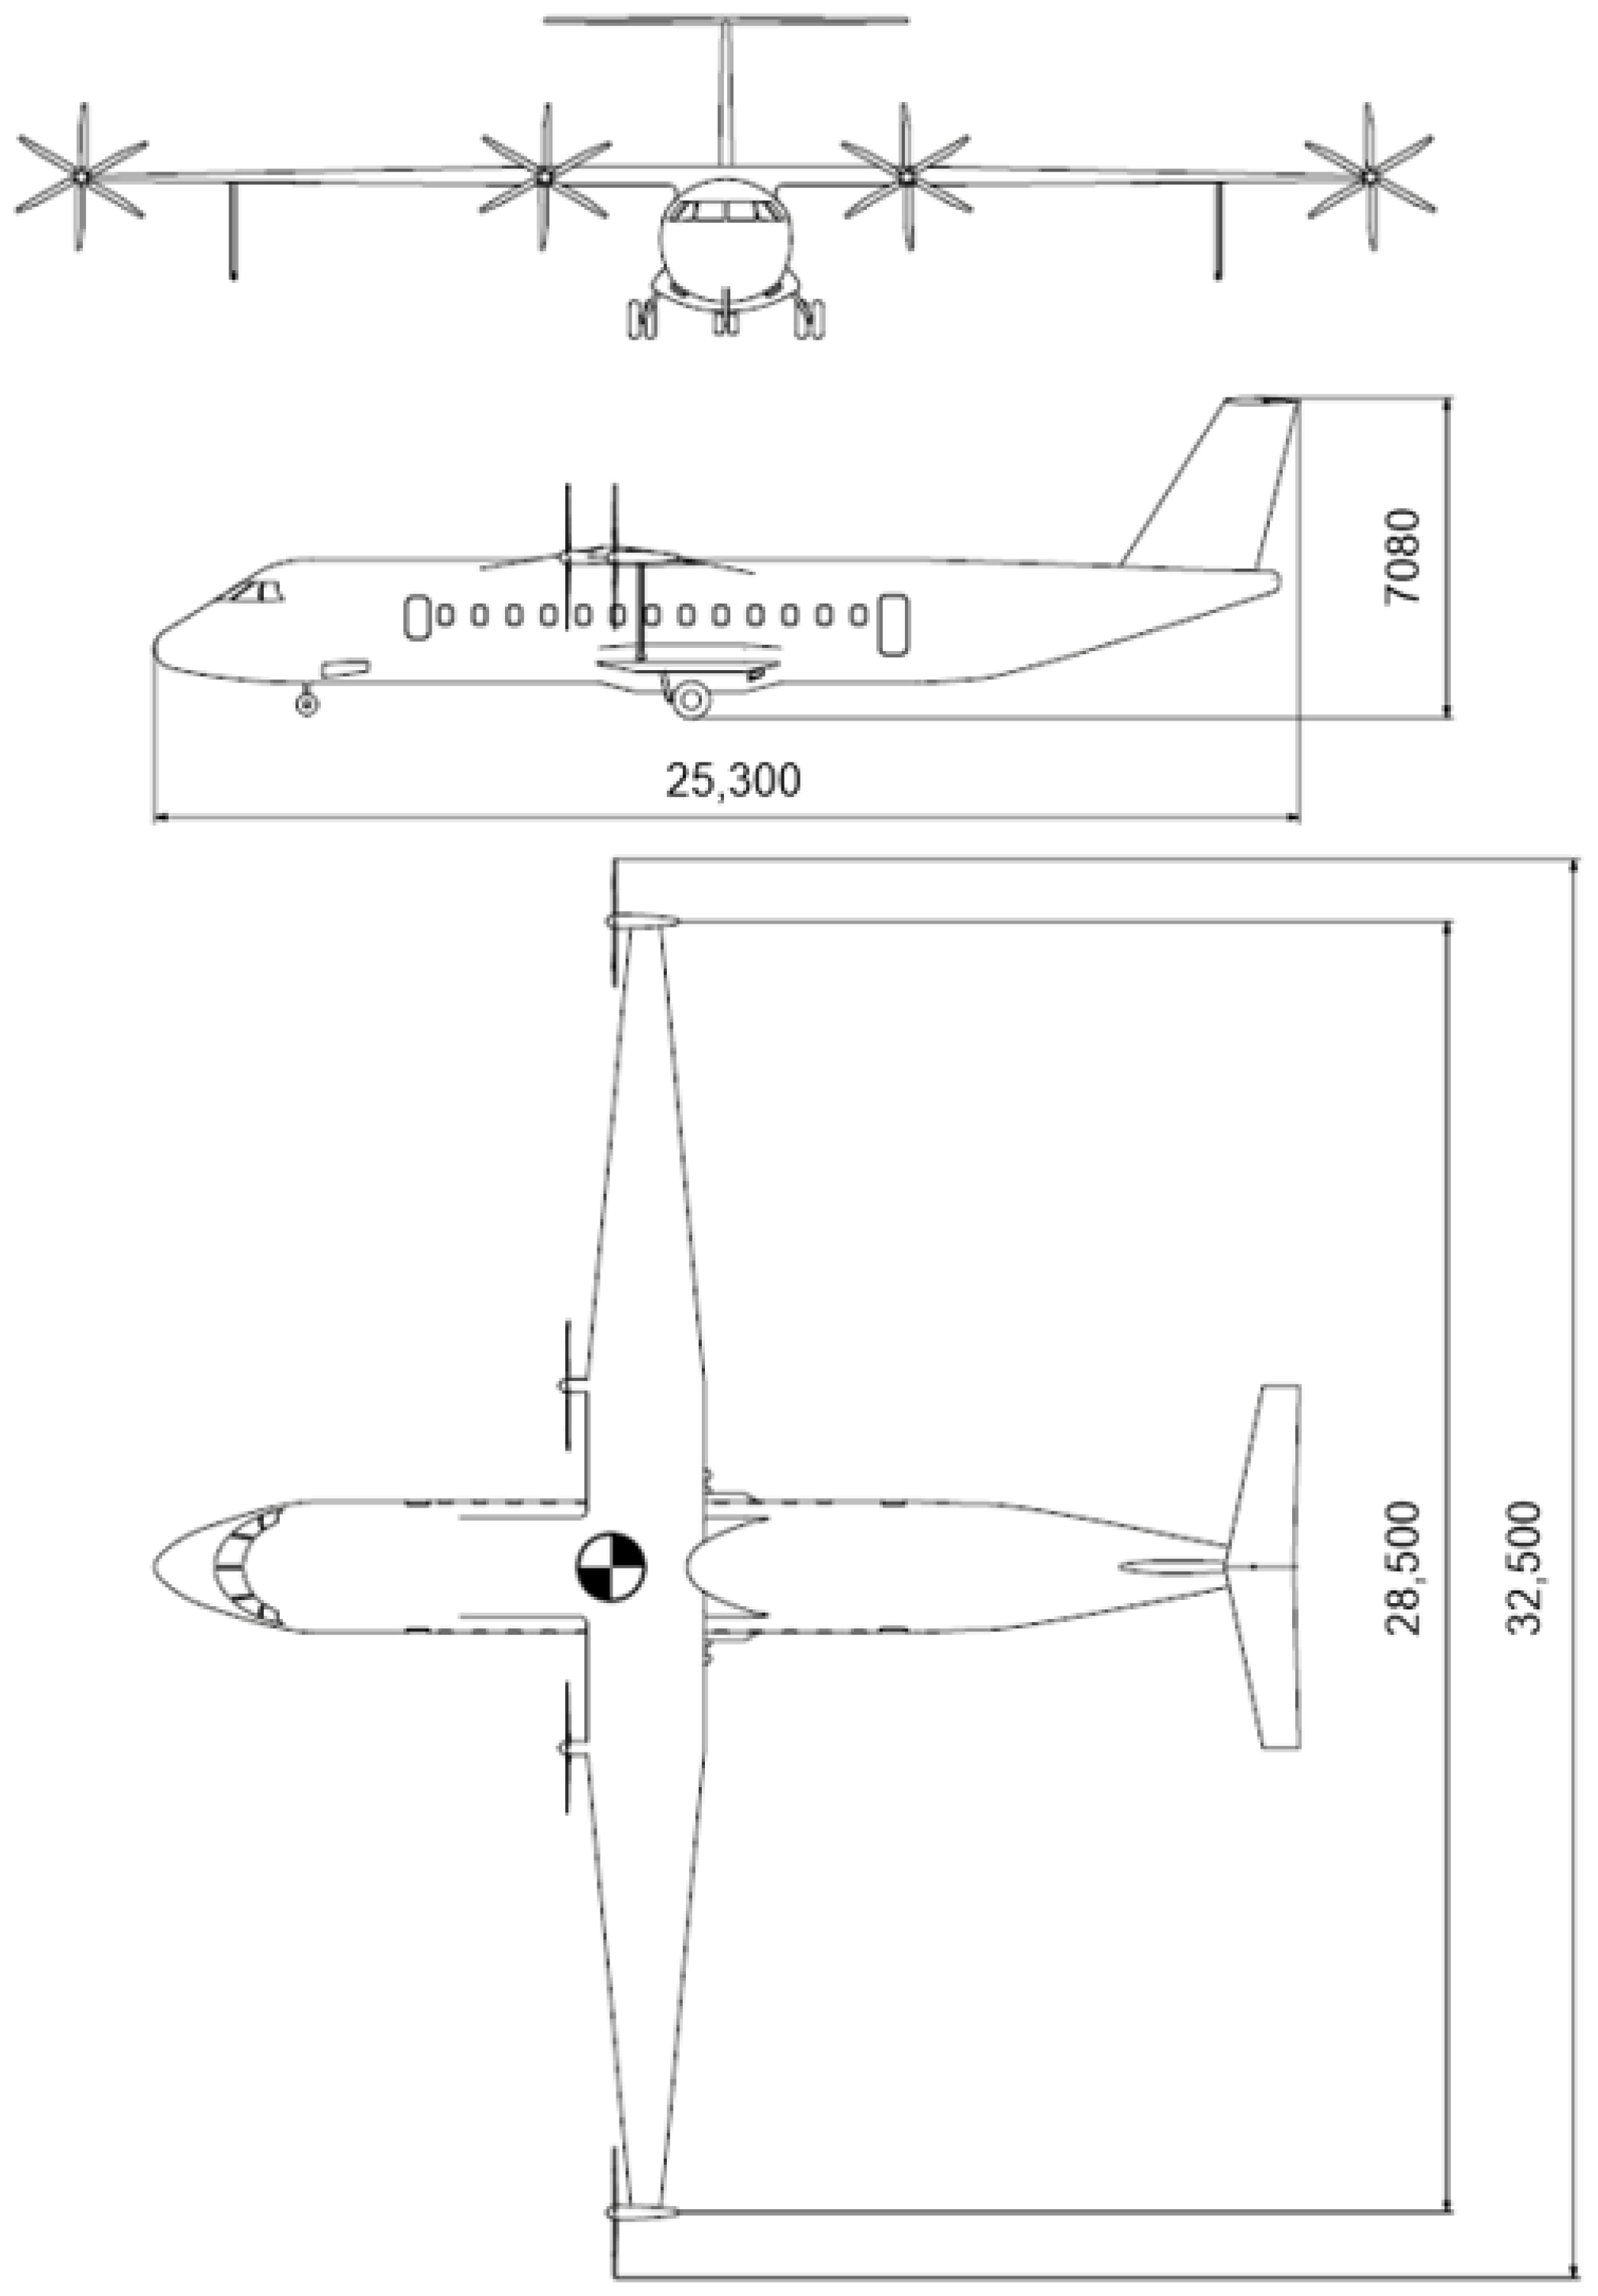
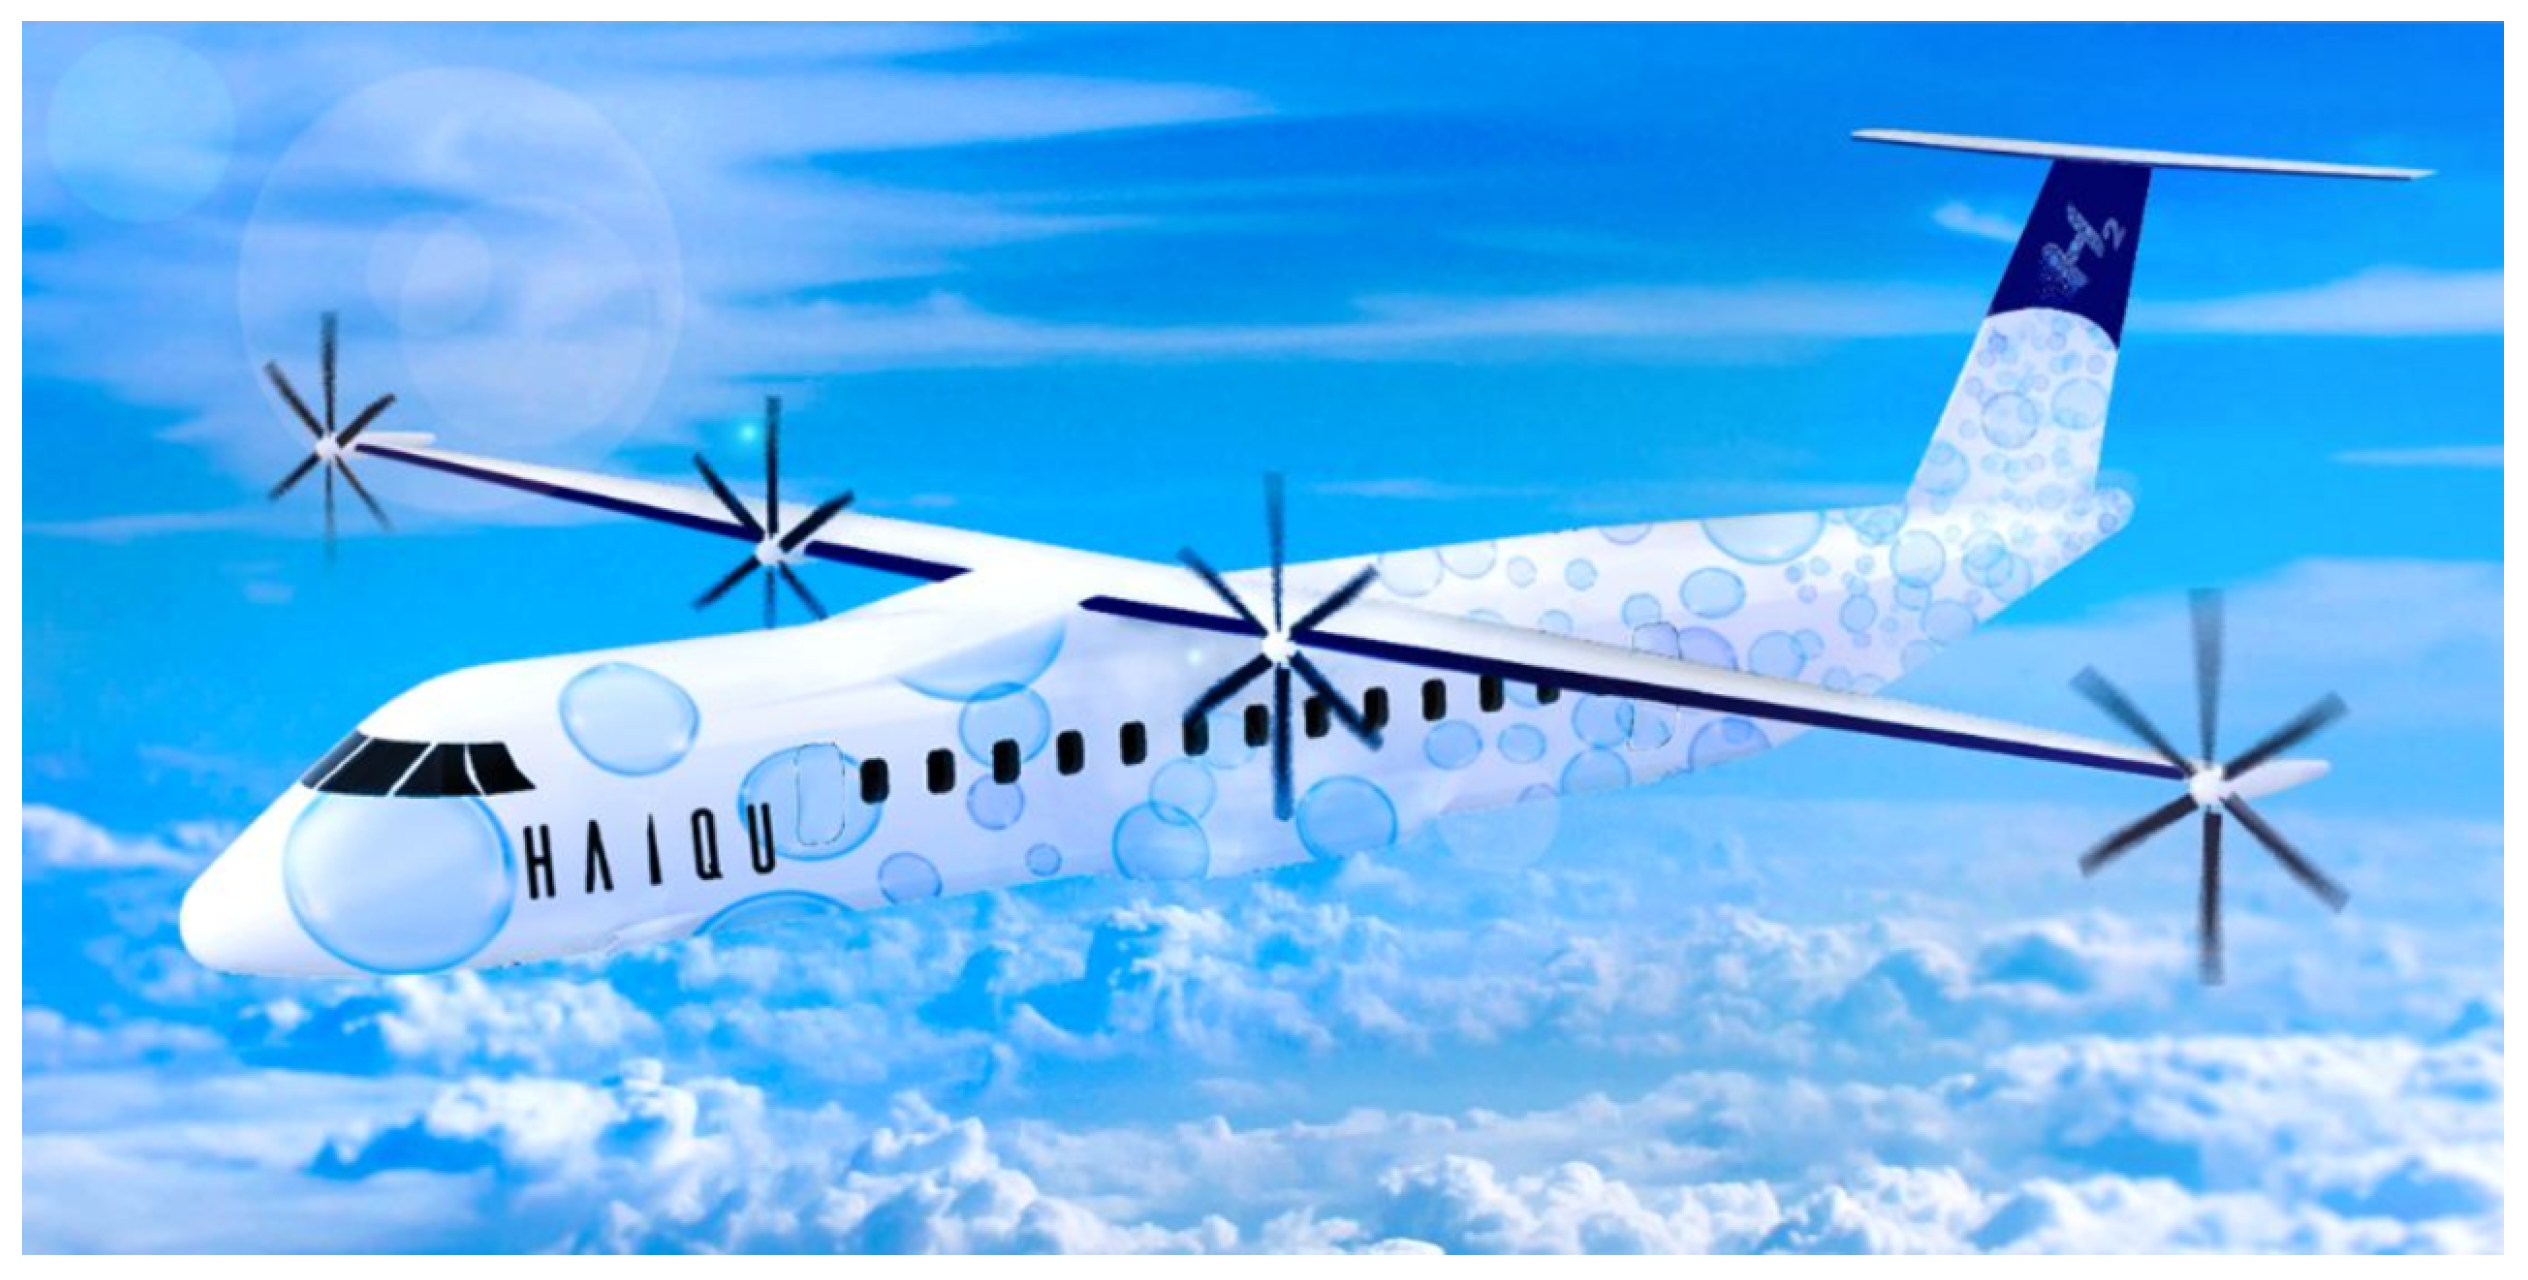
All the components mentioned in the previous chapter are part of the final design of HAIQU. In this section, the full aircraft will be shown and its performance characteristics described. In
Figure 8, the three-side view of the final aircraft design is shown, and
Figure 9 shows a rendering of the operating plane [
74].
3.5.1. Fuselage
In order to keep the main focus of HAIQU on the propulsion technology, the cabin should not present any noticeable change for the passengers and operators. This results in a seamless integration in today’s airport infrastructure for all non-fuel-related ground segments.
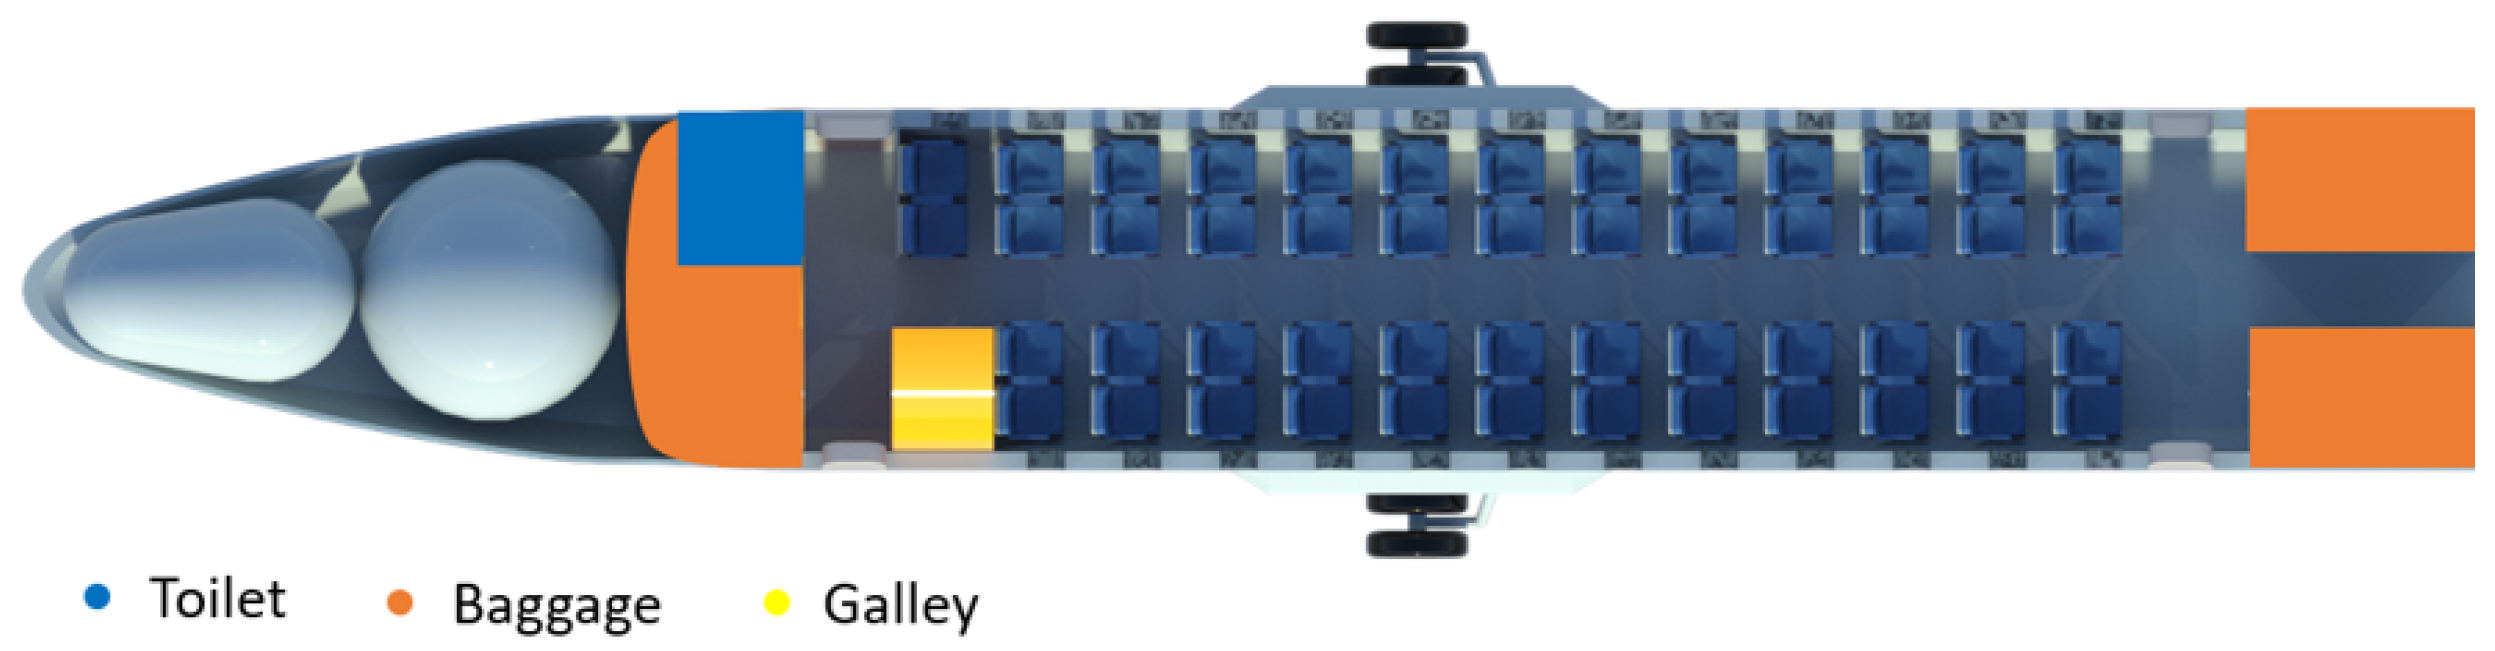
As shown in
Figure 10, the layout consists of a four abreast seat arrangement per row with a single row of two seats on one side at the back. Boarding is conducted in the rear while the baggage is loaded in the front on the left side and on the back on the right side. The rest of the cabin layout is conventional.
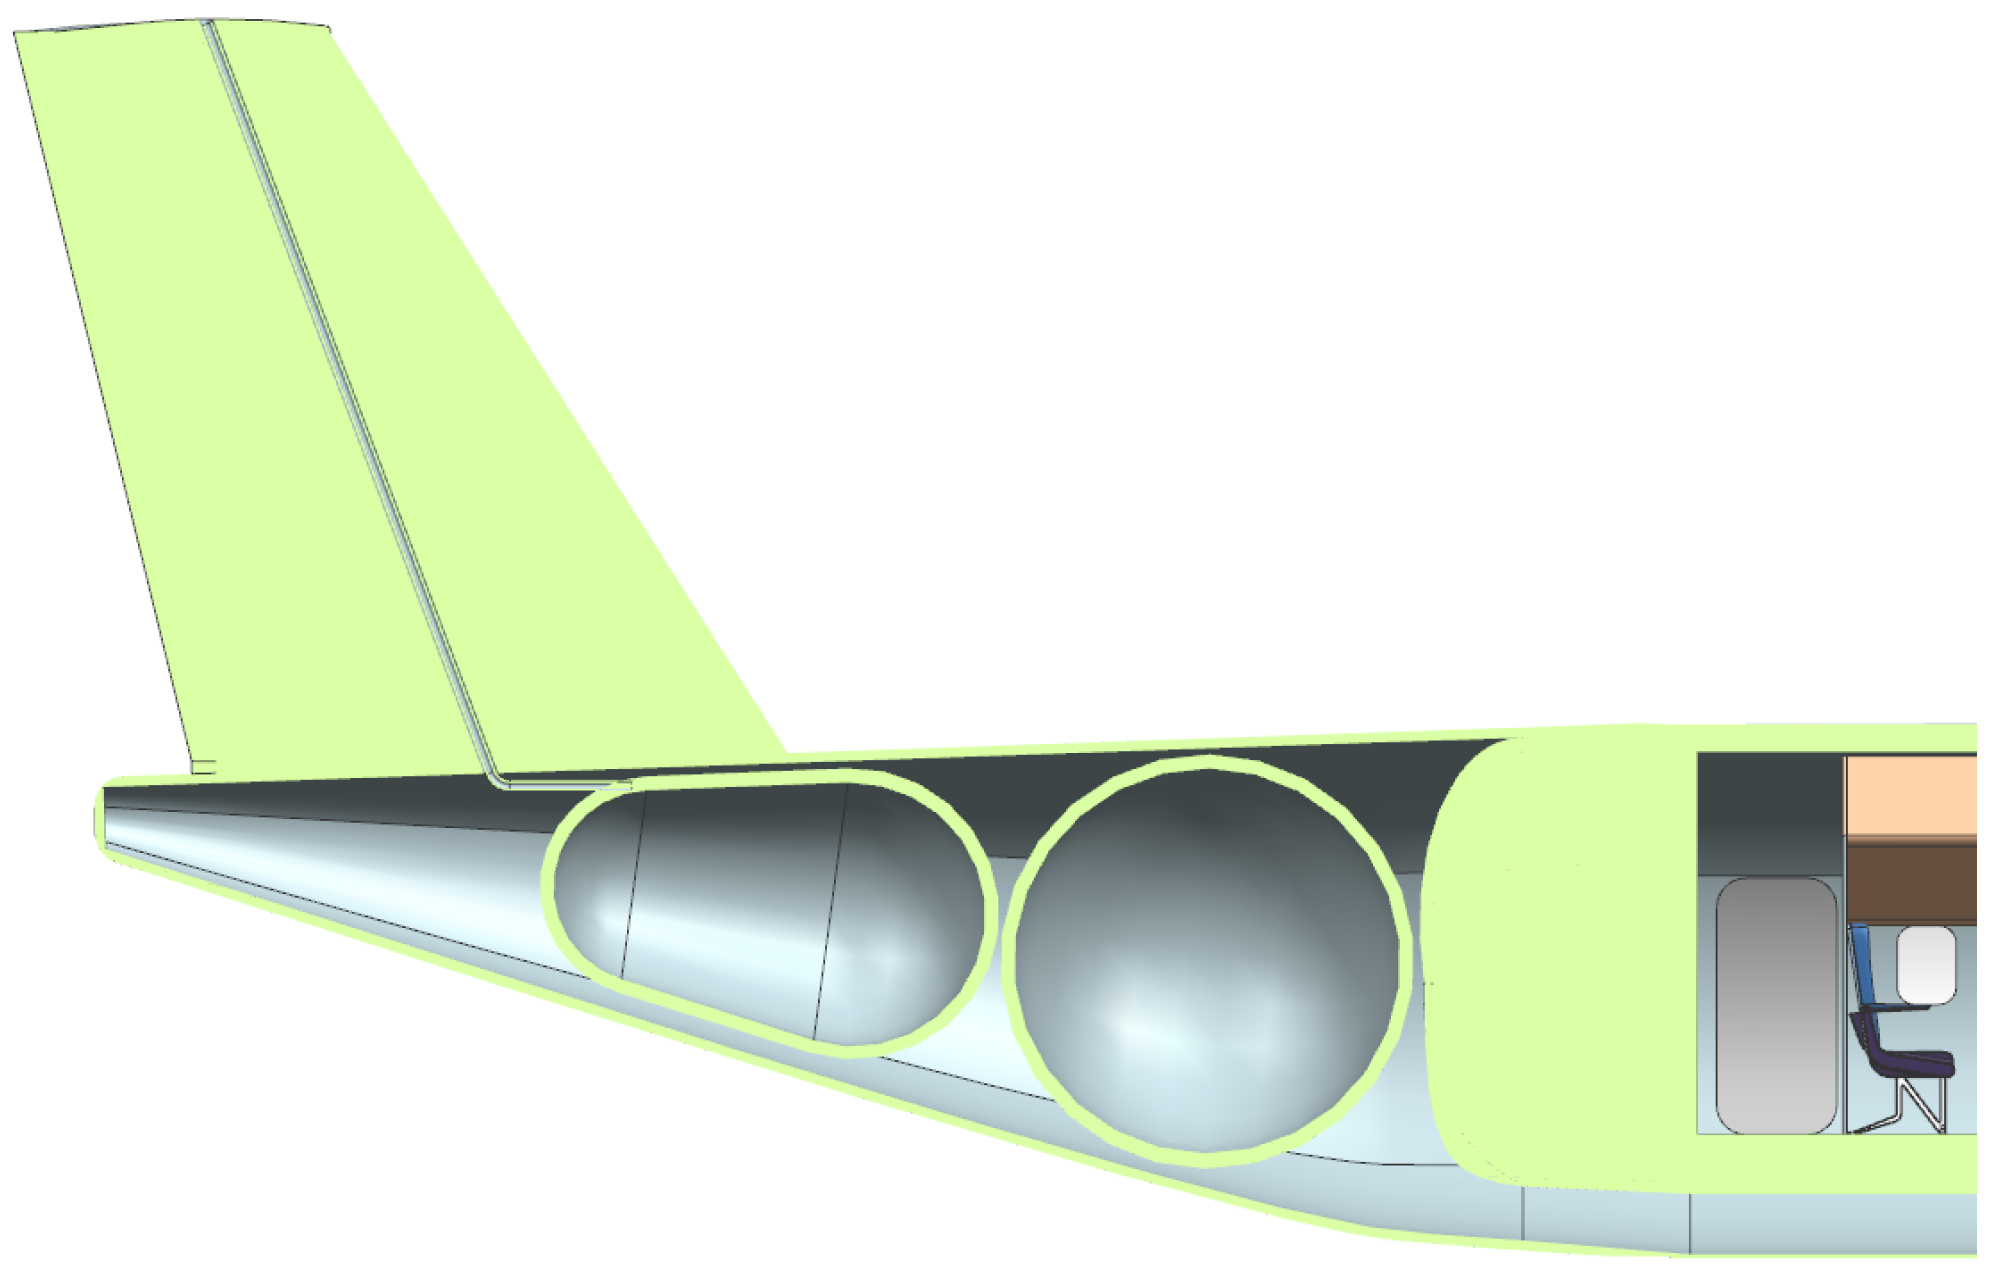
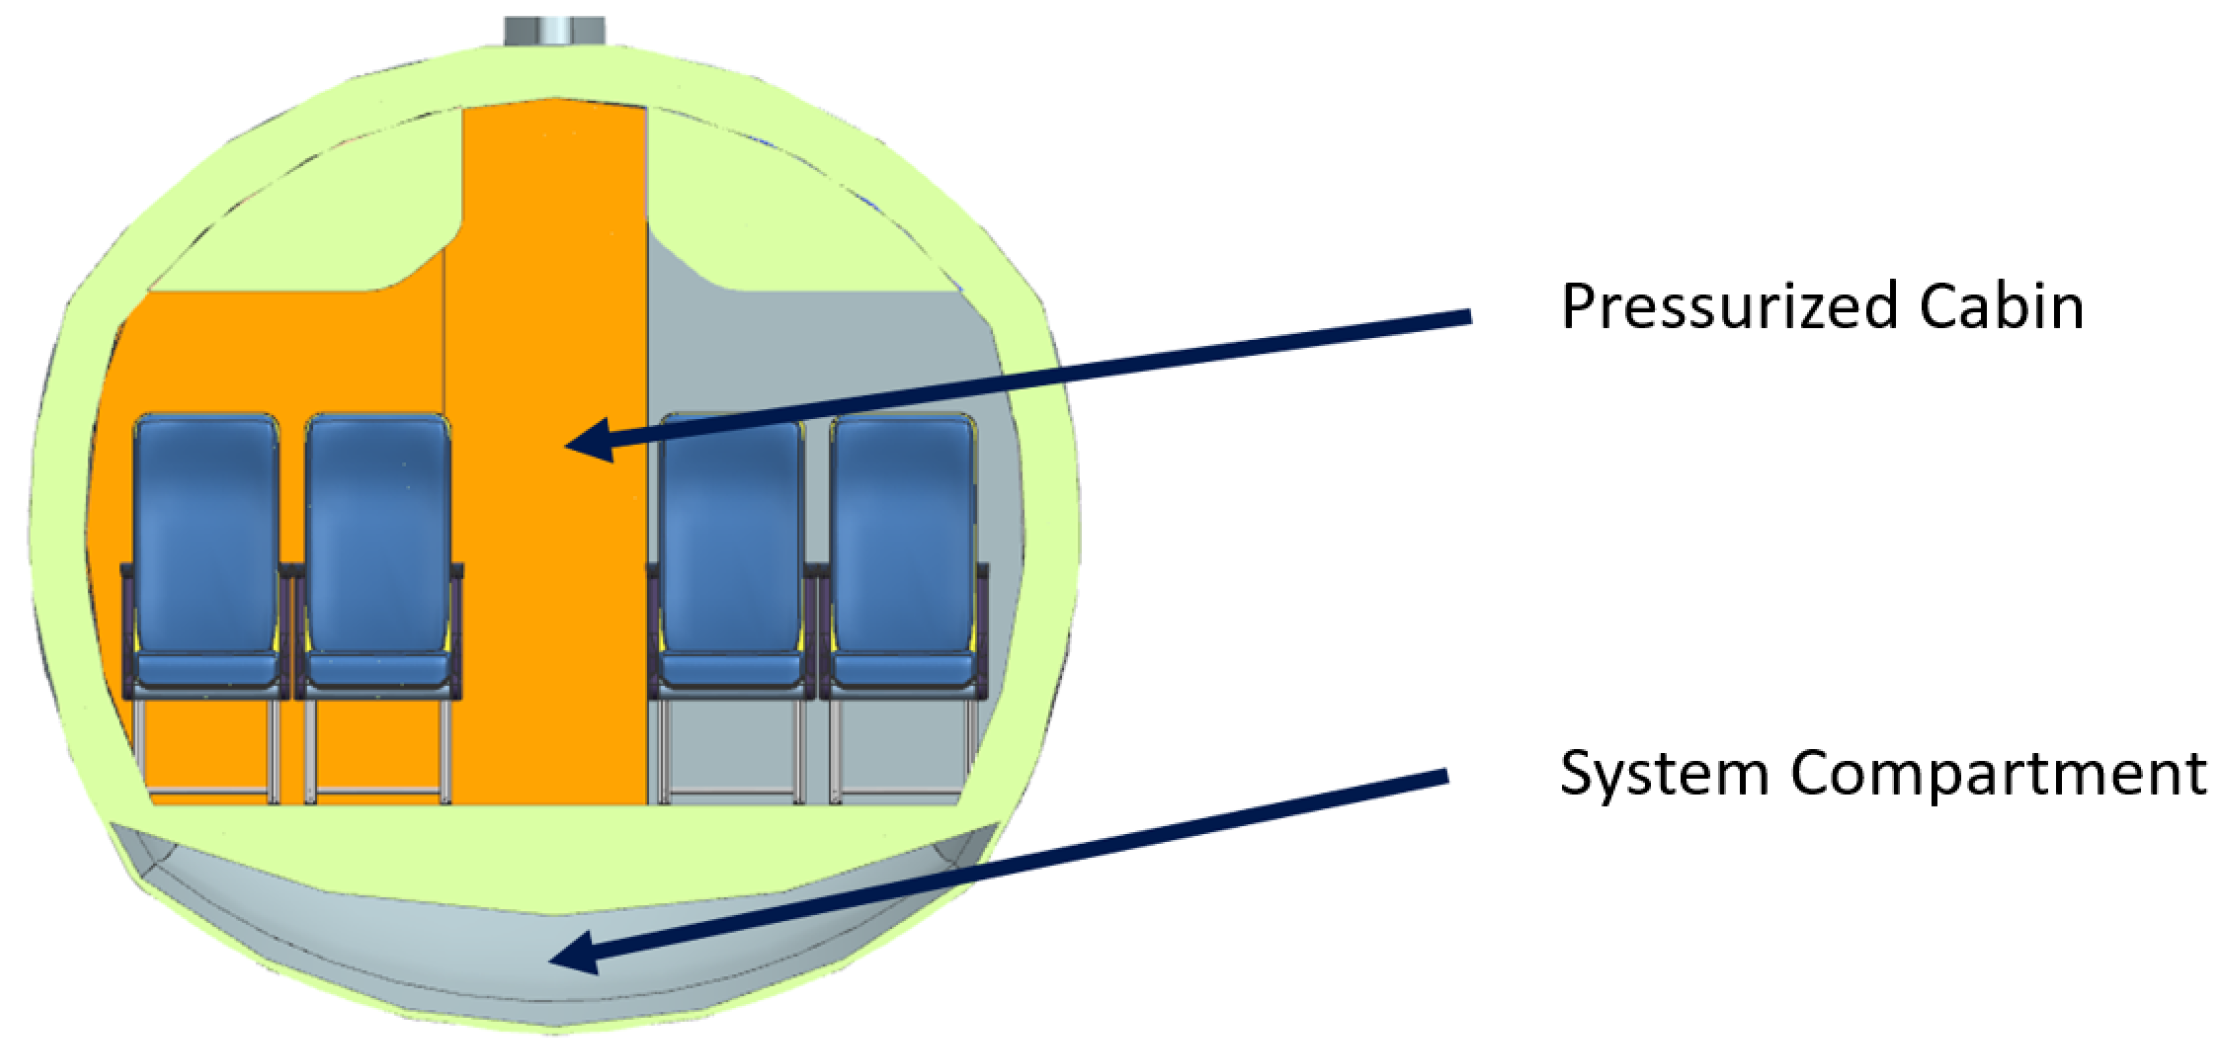
The fuel tanks showcased in
Figure 11 behind the cabin weigh a total of 300 kg. Concluding the design choices, the fineness ratio for the fuselage is 8.6. The cabin cross section is split into two parts, the upper, pressurized section is reserved for passengers and baggage, and the lower, unpressurized section is used for powertrain components, the TMS and the landing gear. This is shown in
Figure 12.
3.5.2. Masses and Center of Gravity
Compared to the reference aircraft, HAIQU has a higher MTOM due to the additional weight of the system masses of the hybrid powertrain. The resulting individual masses are listed in
Table 12. Regarding lightweight construction, HAIQU has a composite vs. total structure volume ratio of 54% leading to four-times higher [
43] usage of composite material in comparison with the reference aircraft. In case of the typical 400 km mission, the aircraft masses are listed in
Table 13.
Considering the tank position in the tail, the center of gravity (CoG) shift during the refueling process is important. The CoG is located at 23.8% mean aerodynamic chord (MAC) at the operating mass empty (OME) as shown in
Figure 8. Considering the ferry case as the most critical loading case, the CoG is located at 33% MAC.
3.5.3. Wing and Empennage
For the wing design, the classical configuration of high wing and T-tail was chosen. The shape of the main wing resulting from the design code is a two-shape design with a rectangular shape from the centerline towards the inboard motor and a trapezoid shape from there until the outboard motor as shown in
Figure 8. The wing features single segment Fowler flaps [
43] that stretch for 60% of the wingspan with a depth of 17%. As the wing profile, the proven parameters of the reference aircraft were selected leading to a NACA 43018 at the root and a NACA 43013 at the tip [
75]. The sizing resulted in an increased wingspan of 28.5 m and an aspect ratio of 15.
Retractable struts on the lower side of the wing are necessary for takeoff and landing in strong side winds to protect the WTPs. During the flight they are retracted and fully enclosed and covered inside the wing, so that no drag is added. In case of an emergency, the struts brake before the wing would be overstressed. The T-shaped empennage was chosen to reduce the wing-and propeller-wake interaction with the tail plane. Furthermore, the volume coefficient of the vertical tail area was set to a larger value than the reference aircraft to provide enough yawing moment during wingtip engine failure.
3.5.4. Cost Results
Given the high fluctuation of fuel costs due to geopolitical variables, the highest price was taken. This affects the projection as at the beginning of this project the price of the
was three-times lower than the stipulated price.
,
and Noise costs were charged to the reference aircraft based on the methodology of Johanning and Scholz [
72].
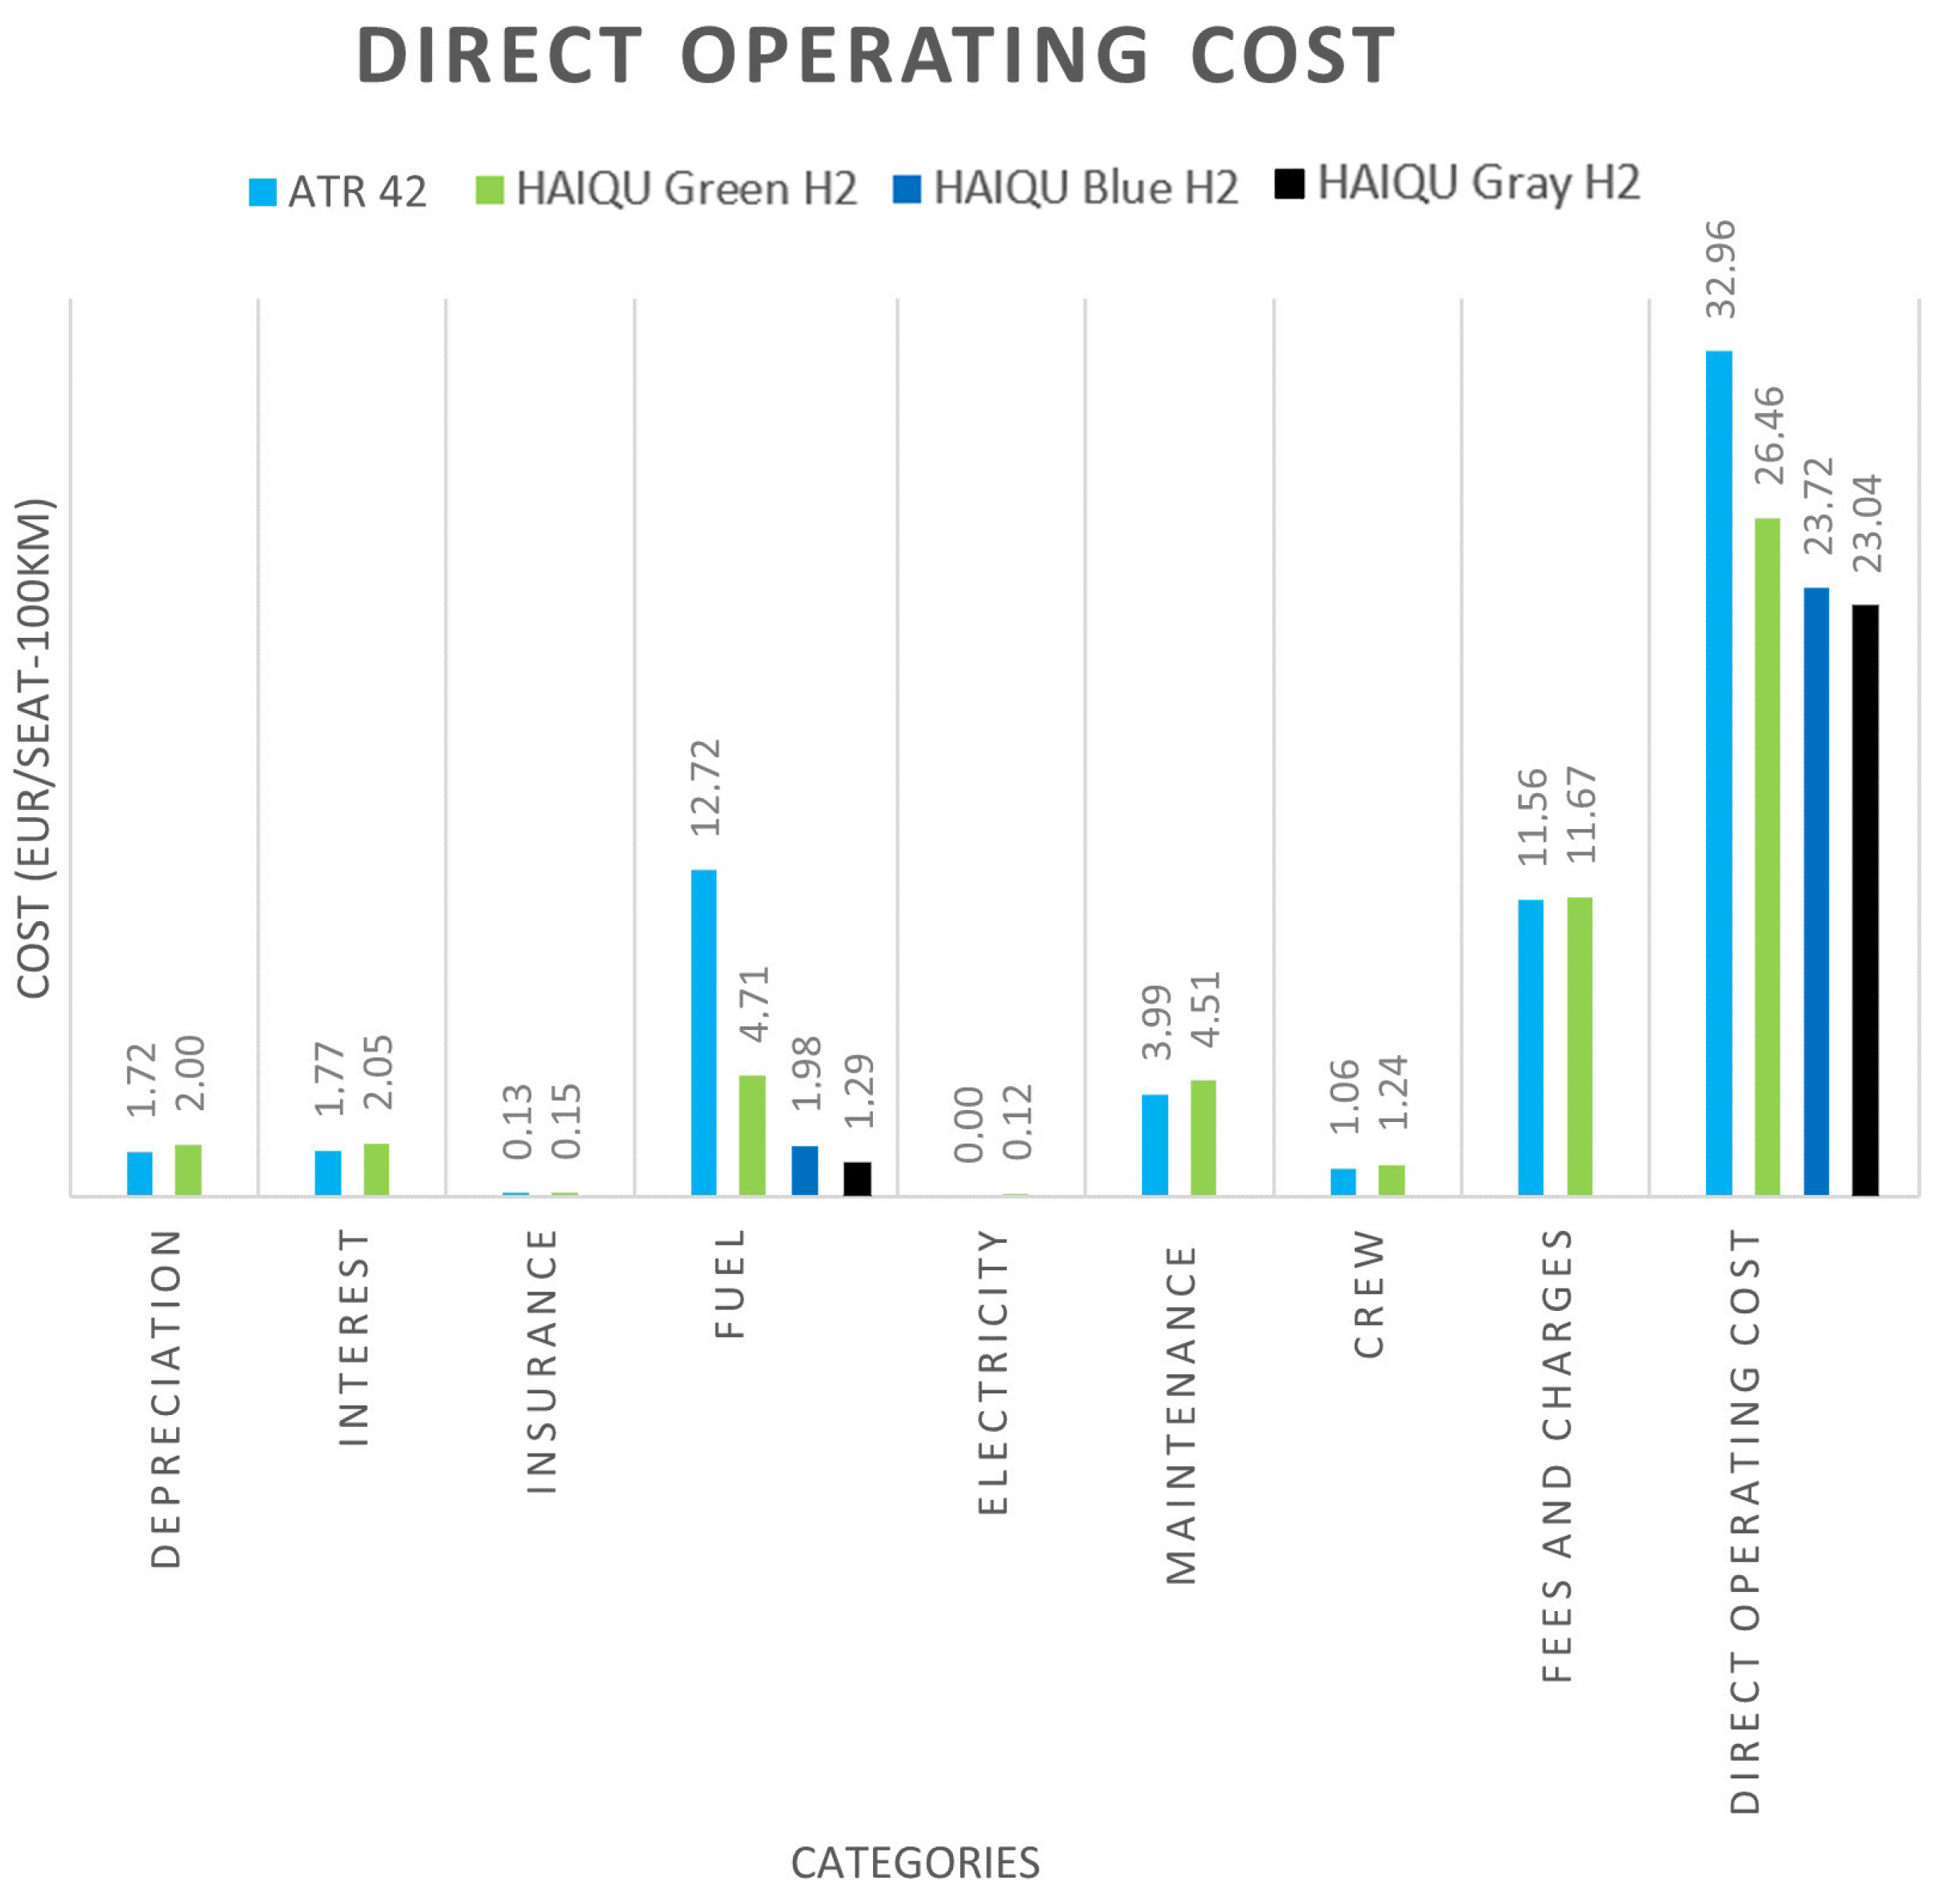
This new methodology includes the additional cost applied in the form of tax for pollution and noise at airports from 2000. The results for the benchmark mission are shown in
Figure 13. These prices are reflected mainly in the reference aircraft. Pollution and noise charges represent 0.2% and 0.02%, respectively, of the total DOC.
The costs were divided into their respective categories, and the unit EUR/Seat-100 km represents the costs in Euros per seat per 100 km. These results indicate a total cost saving of approximately 19% on the total DOC only taking into consideration the prices for green hydrogen. On the design route, this implies a saving of 2 million euros per year per aircraft. However, hydrogen prices can have a significant impact on the cost of the mission depending on the type of hydrogen to be used, i.e., blue or gray hydrogen as can be seen in
Figure 13. For example, using blue hydrogen produces a 25% savings in DOC and approximately 28% in the case of using gray hydrogen, actions that nevertheless would not nullify polluting emissions due to the way in which these fuels are obtained.
Additionally, although the variable that most influences operating costs in a positive way is fuel, in this study, a negative performance was observed in other variables, such as depreciation, interest, crew, maintenance and taxes, where there is a slight increase in prices.
3.6. Turnaround Process
As discussed in
Section 2.4, the passengers are the critical path for the turnaround. Both refueling and baggage take less time, while the battery recharging takes the exact same time as the passengers. Specifically for the refueling, a total time of 9 min was achieved, while a maximum time of 21 s was required for actual hydrogen flow.
Table 14 lists the total times for all considered turnaround segments.
3.7. Performance Data
Evaluating the payload-range diagram in
Figure 4, it is clear that the range TLAR are proven to be fulfilled. The aircraft can fly both the design mission of 800 km with a payload of 5300 kg as well as a maximum payload mission of 400 km. The rest of the TLAR are confirmed in
Table 15. Now, the performance characteristics of HAIQU can be compared with the reference aircraft. It must be kept in mind that other criteria than the DOC specified for HAIQU may were used in the design of the reference aircraft. In
Table 15, the performance characteristics of the reference aircraft [
12] are displayed.
HAIQU exceeds the in the TLAR required climb rate at sea level, improving the take-off performance about 30% compared to the reference aircraft. The glide ratio is not ground breaking, which can be attributed to the short take-off distance requirement and the resulting wing design trade-off. At this point, it should be stated again that HAIQU is designed with the aim of fulfilling the specified TLAR of
Table 1. This is why the target missions for HAIQU and the reference aircraft may differ and cannot always be compared directly. With a fuel flow of 132 kg/h during cruise, the lost mass in flight is much lower than for similar kerosene aircraft, such as the reference aircraft.
However, it has to be said that this flow of pure hydrogen is combined with oxygen from the air, which results in a production of several tons of water, which is released in fluid form at low temperatures. The total required energy amounts to 2360 kWh for the DOC benchmark mission, which is less than 1/3 of the required energy of the reference aircraft, leading to the significant cost reduction discussed in
Section 3.5.4.
4. Discussion
The decrease in DOC shows a great deal of promise for a more environmentally friendly hydrogen-powered and more economical new aircraft. Recent press releases by Embraer [
78] and Airbus [
79] indicated that the near future of aviation is moving jointly towards fuel-cell powered aircraft for the regional market. Big players, such as Airbus, being part of the movement, aim at aircraft larger than 50 seats.
However, there are many challenges ahead that need to be overcome before the first hydrogen-powered regional aircraft can enter service. Regarding the fuel, there is currently no infrastructure at airports for storing hydrogen and refueling aircraft. There is also no sufficient production for blue or green hydrogen as of now, including the means of distribution from production facilities to consumers. Regarding the technical side, many technologies are still evolving and will need multiple years to achieve market readiness. Right now, no 1 MW superconducting electric motors for the aviation industry exist in the market, and fuel cells are still being tested.
The true impact of the thermal management system on aircraft performance has to be evaluated. From a legal point of view, procedures and criteria for the certification, production, maintenance and operation of hydrogen aircraft have to be developed. In order to be able to make more precise statements concerning the actual effects of these new technologies utilized in the proposed aircraft, more detailed studies using CFD and FEM may be considered for future investigations.

 ,
, 


