

Study on Characteristics and Invulnerability of Airspace Sector Network Using Complex Network Theory
College of Air Traffic Management, Civil Aviation Flight University of China, Guanghan 618307, China
*
Author to whom correspondence should be addressed.
Aerospace 2023, 10(3), 225; https://doi.org/10.3390/aerospace10030225
Submission received: 3 December 2022
/
Revised: 22 February 2023
/
Accepted: 23 February 2023
/
Published: 25 February 2023
(This article belongs to the Special Issue Advances in Air Traffic and Airspace Control and Management)
Abstract
:The air traffic control (ATC) network’s airspace sector is a crucial component of air traffic management. The increasing demand for air transportation services has made limited airspace a significant challenge to sustainable and efficient air transport operations. To address the issue of traffic congestion and flight delays, improving the operational efficiency of ATC has been identified as a key strategy. A clear understanding of the characteristics of airspace sectors, which are the building blocks of ATC, is essential for optimizing air traffic management. In this research, a novel approach using complex network theory was applied to examine the features and invulnerability of the airspace sector network. We developed a model of the airspace sector network by treating air traffic control sectors as network nodes and the flow of air traffic between these sectors as edges. Network characteristics were analyzed using several metrics including degree, intensity, average path length, betweenness centrality, and clustering coefficient. The static invulnerability of the airspace sector network was evaluated through simulation, and the network efficiency and the size of the connected component were used to assess its invulnerability. A study was conducted in North China based on the ATC sector network. The findings of the study revealed that the sector network did not exhibit the traits of a small-world network model, characterized by short average path lengths and high clustering coefficients. The evaluation of network invulnerability showed that the network’s invulnerability varied depending on the attack strategy used. It was discovered that attacking sectors with high betweenness resulted in the most significant harm to network invulnerability, and betweenness centrality was considered to be a useful indicator for identifying critical sectors that require optimization.
1. Introduction
The growing demand for air transportation is leading to an increasing number of flight delays, which are caused by a variety of factors such as traffic congestion, incidents, adverse weather conditions, and military activities. One of the main causes of air traffic congestion is the disconnect between strategic decision making, such as capacity planning, and tactical decision making by air traffic control. In addition, traffic congestion can compound issues such as elevated fuel consumption, degradation of infrastructure, and air pollution [1]. Air traffic controllers are responsible for the safe and efficient operation of aircraft in controlled airspace [2]. Civilian aircraft must operate within specified airspace and adhere to instructions and dispatch issued by air traffic control agencies. The sectors, as the basic unit of control over airspace, play a crucial role in ensuring the safe, efficient, and orderly movement of aircraft [3]. Many researchers have placed emphasis on addressing the issue of air traffic congestion. Typically, they approach the problem from a strategic level by analyzing the airport or route network, aiming to enhance the overall efficiency of air transportation operations. This paper, however, takes a different approach by focusing on the tactical level. We focused on addressing real-time challenges arising from unpredictable events such as weather conditions and military activities, investigated the significance of different sectors in the overall airspace operating environment, and tested the invulnerability of sector networks against various forms of attacks.
Firstly, in most circumstances, the sector is a crucial airspace resource, despite the existence of sectorless or flight-centric systems. The sector network differs from the airport network or air route network, as it divides the entire airspace into smaller, manageable areas for the purpose of ensuring safe and efficient air traffic control. In each sector, a team of air traffic controllers is responsible for providing flight control services to the aircraft operating within that sector, thereby ensuring the safe and orderly movement of air traffic flow within the sector [4]. The capacity of the sector network, which is determined by various factors such as sector size and the proficiency of controllers, is a crucial indicator of the overall operational efficiency and capacity of the airspace system. In emergencies, including both man-made incidents and natural disasters such as severe weather and equipment failures, the sector network’s capacity may experience a significant drop or even failure. In such scenarios, the affected sector’s ATC must swiftly adjust the status of relevant flights, including flight altitude, path, and speed, and coordinate the traffic flow entering and exiting the sector to ensure the safe operation of flights. Due to the complexity of air traffic control mechanisms, a lack of transparency and coordination across different control segments, even when air traffic control effectively handles emergency situations, may still result in reduced sector capacity or functional disruptions, leading to widespread air traffic congestion and significant flight delays [5]. As a result, enhancing the operational efficiency and resilience of the airspace sector network is crucial to avoid traffic congestion and minimize flight delays. A well-designed sector network is vital for ensuring safe and efficient airspace operations. Furthermore, proper airspace sector planning can relieve the workload for air traffic controllers, reduce the likelihood of incidents caused by human factors and alleviate the operational burden on a single sector, and enhance the overall operational efficiency.
Graph theory has been widely applied in the design of transportation networks, including subway systems [6], urban highways [7,8], and high-speed rails [9], and has proven to be an effective tool for examining problems related to aviation operations [2,10,11,12]. Thus, in this study, the airspace sector network was analyzed using complex network theory, which is based on graph theory. In 2000, Amaral introduced the concept of complex network theory into the aviation field and demonstrated that the global airport network follows the characteristics of a small-world network model [13]. Despite its potential, the application of complex network theory in the civil aviation field has been limited, mainly focused on airport networks. In 2012, Cai transformed waypoints into network nodes and flight flows between these nodes into edges to construct the China Air Route Network Structure (CARN) and analyzed its network characteristics [14]. In 2013, Murad Hossain’s research on the robustness of the Australian Airports Network (AAN) showed that it could be classified as a scale-free small-world network and that its structure is resilient to the random removal of airports (such as in an airport shutdown scenario) and flight paths (such as in the case of airway unavailability due to bad weather) [15]. Albert first explored the invulnerability of complex networks by proposing an intentional attack model and conducting numerical simulations of such attacks [16]. In recent years, invulnerability has become a major research direction in complex network theory. Invulnerability is often linked to robustness, which refers to a network’s ability to maintain overall performance even when nodes or edges are deliberately or randomly attacked [17]. As complex network theory continues to advance, new and effective attack strategies are being applied in the aviation field. Qian established a Multi-Airport Region model to analyze the robustness of different configurations of airport groups [18]. Başpınar compared the resilience of airport networks in the United States and Europe to investigate the relationship between network structure and the spread of failure and network recovery [19]. In contrast to previous researchers, the sector network is also different from other complex networks, such as airport networks and airline networks in China, from an application perspective. While the airport and airline networks primarily serve as a guide for strategic adjustment in the air transportation market, resource allocation, and air transportation capacity improvement, sector networks are more crucial in ensuring safe and efficient daily operations from a tactical standpoint. To the authors’ knowledge, there have been few studies conducted on the sector network. Given the vital role of airspace sector networks in the overall airspace system, this study focuses on this subject.
A review of the literature indicates that previous studies that have applied complex network theory have primarily focused on airport networks and air route networks. The research on airspace sectors has mainly centered on the evaluation of individual sector capacity and operational optimization [20,21]. However, there have been few studies on the structural characteristics and invulnerability of the airspace sector network from an ATC perspective. Understanding the topological characteristics and complexity of the airspace sector network is essential for identifying critical sectors and enhancing network resilience [22]. Hence, complex network theory is seen as a promising approach to investigating the bottlenecks in the airspace sector network and the spread of traffic congestion at the system level.
In this study, research was carried out to examine the airspace in the North China region. A sector network was created using historical air traffic flow data from selected airspace sectors. From the perspective of ATC operations and complex network theory, topological indices were employed to analyze the topological properties of the sector network. The study also evaluated the network’s vulnerabilities under various attack scenarios by using invulnerability measurement indices such as network global efficiency and the relative size of the connected component. As a result, critical sectors were identified in each attack scenario. To summarize, the main contributions of this study are:
- This paper expands the research horizon of aviation networks by incorporating complex network theory into ATC sectors, offering a complementary viewpoint to existing studies on aviation networks and route networks.
- The invulnerability of various sectors under different attack strategies is evaluated, and critical sectors are identified by considering the network’s global efficiency and the relative size of its connected component.
- This research provides a perspective on alleviating air traffic congestion and improving airspace efficiency by improving the sector structure in air traffic control systems. Additionally, this research method also provides a reference for analysis in other complex network engineering projects.
The organization of the remaining part of the paper is outlined as follows. In Section 2, the modeling method for sector networks, a list of selected topological indices, and the invulnerability of sector networks are introduced. Section 3 details the construction of sector networks, data acquisition, and the analysis of sector network characteristics. The analysis of network invulnerability and a discussion of the results are presented in Section 4. Finally, Section 5 concludes this study.
2. Methods of Modeling and Topological Property Measurement
2.1. Modeling of Airspace Sector Network
All flight operations within an airspace sector are directly overseen and managed by air traffic controllers. Established protocols facilitate the transfer of control from one sector to another as aircraft cross designated control points. From a complex network theory perspective, the sector network is represented as a graph composed of a set of nodes and a set of edges . In this study, the sector network was constructed based on the following guidelines:
An airspace sector can be viewed as a node, and the connections between sectors are determined by the flow of air traffic between them. If two sectors, and , have air traffic flowing between them, an undirected edge linking and is established. The adjacency matrix is used to represent the spatial sector network containing sectors. If a direct air traffic flow exists between sector and sector , the corresponding element in the adjacency matrix is given by . Conversely, if there is no direct flow, the element is set to . In order to simplify the complexity of the three-dimensional airspace structure, this study compresses both high-altitude and low-altitude sectors onto a single two-dimensional plane. The resulting sector network is then described in Section 3.
2.2. Modeling of Airspace Sector Network
In this study, five commonly used topological characteristic indices were employed to describe the general structural properties of the airspace sector network. The selected indices are defined as follows:
- The degree of a node, denoted as , reflects the node’s significance in the network and is defined as the number of edges connected to it. In the context of the airspace sector network, the degree of sector represents the number of sectors that are geographically adjacent and have a direct air traffic connection with sector [23]. This study expands the research scope of aviation networks by applying complex network theory to ATC sectors, providing a complementary perspective to previous studies on aviation and route networks.
- Intensity, as expressed in Equation (1):where represents the set of sectors adjacent to sector , represents the total number of flights between sector and sector that receive ATC services within sector , and represents the overall traffic volume of sector . This last metric is considered one of the key indicators in the study of air traffic congestion [24].
- Average path length, as expressed in Equation (2):where refers to the total number of sectors in the network, and is the shortest path length between sector and sector . From an ATC perspective, represents the number of air traffic control services received by a flight traveling between sector and sector , with a value of for adjacent sectors. A smaller value of indicates that flights traverse fewer sectors and therefore require fewer control transfers. Consequently, a smaller value of suggests that the airspace sector network is better established and has higher operational efficiency [12].
- Betweenness centrality, as expressed in Equation (3):where betweenness centrality of a node , denoted as , measures the number of times node is crossed by the shortest paths in the network. This is calculated as the sum of the number of shortest paths between every pair of nodes (, ) in the network () that pass through node i () divided by the total number of shortest paths between and (). A sector with high betweenness is likely to serve as a junction for multiple shortest paths and be a structural center in the sector network [25]. In the event of a failure in such a sector, multiple shortest paths would be impacted, causing the network structure to become weaker. Hence, it is crucial to pay special attention to sectors with high betweenness when evaluating the invulnerability of the airspace sector network.
- Clustering coefficient, as expressed in Equation (4) for local clustering coefficient of node and Equation (5) for network average clustering coefficient:where the clustering coefficient of node in the airspace sector network is calculated by considering the number of neighbor nodes () and the number of edges formed by these neighbors (). This coefficient measures the connectivity between a node’s neighbors in the network [26]. In terms of air traffic control operations, represents the connection between flight routes and the coordination between controllers. A higher value of suggests that sector has better connections with neighboring sectors, leading to better collaboration between controllers. The overall connectivity of the airspace sector network can be determined by the average clustering coefficient (), which represents the tightness of connections between sectors. A higher means that the sectors in the airspace network are better connected, which can facilitate joint decision making in dealing with air traffic congestion [27].
2.3. Modeling of Airspace Sector Network
Invulnerability is a crucial characteristic of complex networks [28]. The robustness of a network can be evaluated by simulating attacks by removing nodes or edges in a predetermined pattern and measuring the changes in network performance. The analysis of the invulnerability of the system can provide insights for developing countermeasures to improve the robustness against disturbances, which ultimately aims to reduce flight delays, alleviate air traffic congestion, and minimize emissions. In this study, the network’s global efficiency and the relative size of the connected component were used to measure the network’s performance and evaluate the invulnerability of the sector network.
- The global efficiency of the network is a measure of its connectivity, which is represented as the average of the inverse of the distances between sectors [29]. It is expressed in Equation (6).where represents the number of connected sectors in the network, and represents the shortest path length between sector and sector . If there is no direct flight flow between two sectors, then is set to . The value of ranges from 0 to 1 and represents the connectivity and compactness of nodes in the network. A higher value of indicates better connectivity, with a shorter average length between nodes. When is close to 1, the average distance between nodes in the sector network is short and the network connectivity is well established. On the other hand, when is close to 0, most sectors are disconnected from each other and the network structure is loose, with isolated nodes.
- The relative size of the connected component is a metric that measures the proportion of nodes that remain connected after a set of nodes or edges have been removed from the network. This is expressed as a ratio of the number of nodes in the remaining connected component to the total number of nodes in the original network, as shown in Equation (7).where represents the number of sectors of the connected component when the air space sector network is affected by an attack, represents the total number of sectors in the airspace sector network before the attack, and reflects the integrity of the network after being attacked with a value ranging from 0 to 1 [30]. When is close to 1, the sector network is similar to the complete network. The number of isolated airspace sectors in the network is small, and the airspace available for air traffic control is large. When is close to 0, the distribution of the sector is scattered, and the airspace available for air traffic control is small.
3. Analysis of Sector Network Characteristics
3.1. Construction of Airspace Sector Network
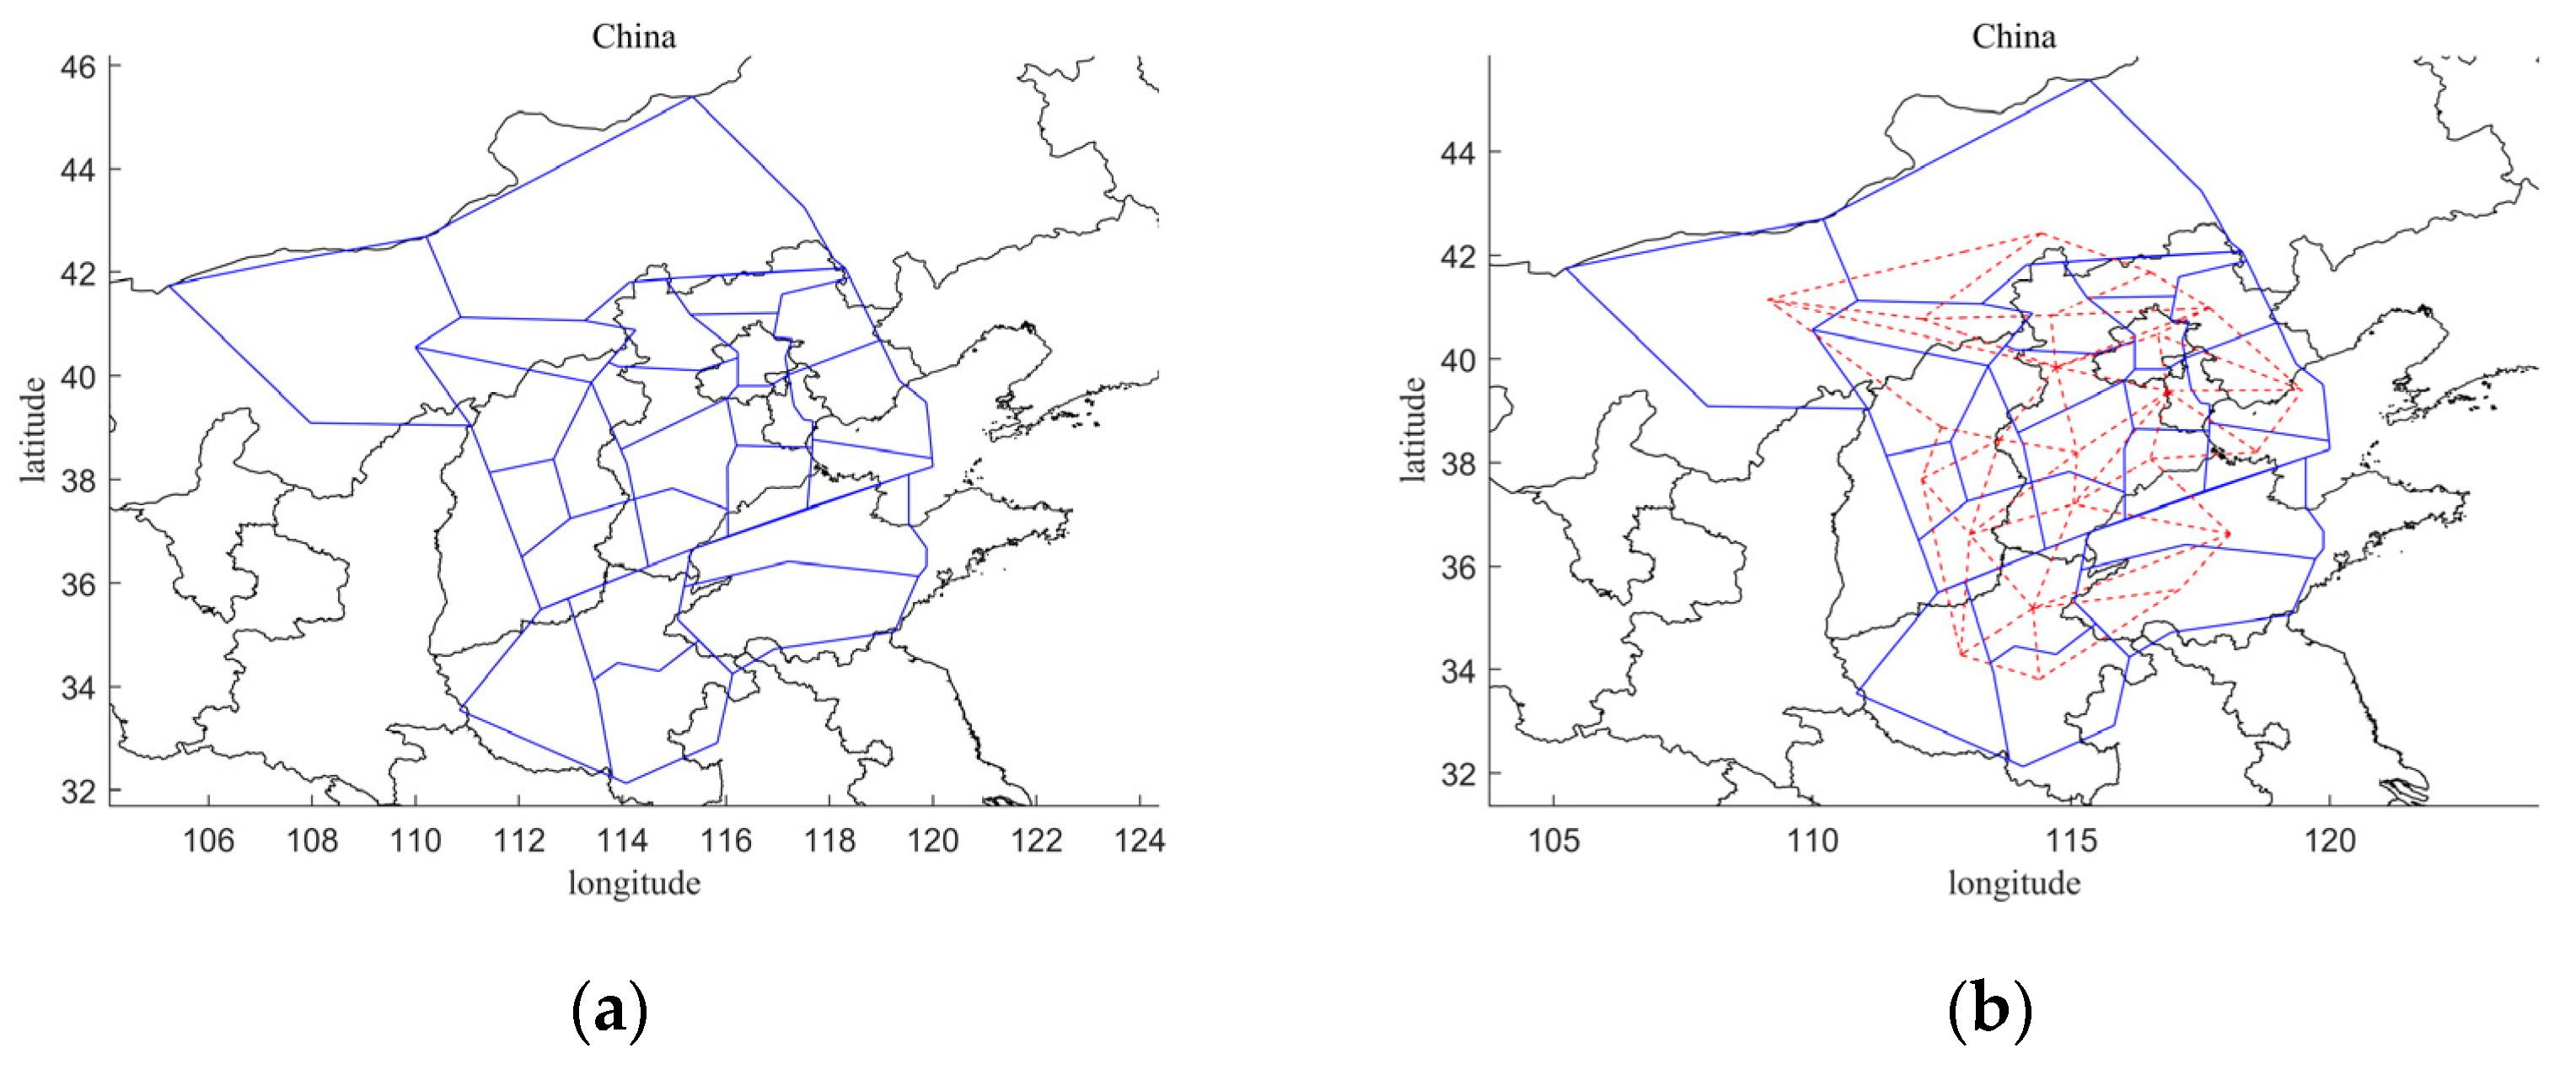
An empirical study was conducted on the airspace under the jurisdiction of the North China Air Traffic Management Bureau (ATMB), covering five regions in China including Beijing, Tianjin, Hebei, Shanxi, and Inner Mongolia. The study was prompted by the recent full operation of the highly active Beijing Daxing Airport, which has transformed the selected airspace into one of the busiest air transport regions globally. Given its unique location and high air traffic volume, the North China airspace was chosen as a case study to provide valuable insights for other regions with similar airspace characteristics. The sector structure of the airspace was created using Matlab software based on geographic coordinates, as illustrated in Figure 1a.
When transforming the real sector network into a complex network model, it is important to adopt features that accurately reflect the daily sector operations. Different applications may use different network models, each with specific properties. For instance, the power network typically employs a weighted network due to the varying levels of importance between power and transmission stations, with weighted nodes providing a more accurate representation of the power network’s characteristics [31]. In air transportation, the bidirectional nature of air routes often calls for the use of unweighted and undirected graphs. For example, in an airport network, airports are connected by routes that act as nodes, each with the same weight as the airport [32]. Similarly, in the sector network studied in this research, each sector is connected by two-way routes with comparable characteristics, apart from traffic flow and capacity. It is difficult to accurately measure human-performance-related factors, so only the intensity of the node was used to measure traffic flow, while sector capacity was omitted. When abstracting the route as a network edge, the routes connecting different sectors share similar characteristics, similar to the airport network. Thus, the sector network edge is not weighted. In conclusion, an unweighted and undirected graph was chosen to best reflect the topological characteristics of the sector network.
To build the model of the airspace sector network, actual air traffic data was collected from flight plan messages (FPL). Six hours of historical FPL data (from 10:00 to 16:00 local time) from a randomly selected day in 2018 were analyzed to determine the direct flight connections between sectors, resulting in the creation of an adjacency matrix . The model of the airspace sector network was constructed by following the rules outlined in Section 2.1, using both geographic information and historical data. As shown in Figure 1b, the diagram of the airspace sector network in North China was created by combining the geographic coordinates of each sector and the actual traffic connections between them. If there was a direct flight connection between two sectors, they were defined as connected, with , while if there was no direct flight connection, they were defined as not connected, with , regardless of any geographic connections. Since the sector operation is bidirectional, meaning there are flights between sectors A and B in both directions, , otherwise . No additional traffic was considered based on aircraft type or flight importance. Thus, the constructed North China airspace sector network is an unweighted and undirected network with a 01 matrix adjacency.
3.2. Topological Properties of Sector Network
In order to analyze the structural features of the sector network, a set of topological indices were adopted. These indices reflect the operational conditions, transfer of control, efficiency of controller communication, and overall structural characteristics of the airspace. The indices were calculated using collected traffic data and aeronautical information from the North China sector network, based on the definitions of degree, intensity, betweenness, and clustering coefficient. The results for 23 sectors in the North China sector network are displayed in Table 1.
The Beijing 01 sector has the highest degree, as it is situated at the geographical center of the controlled airspace in North China. This sector is connected to multiple air routes and controllers must communicate with many different sectors to transfer the control of flights, resulting in a heavy workload. The operational status of the Beijing 01 sector significantly impacts the traffic control strategies employed by controllers. For instance, in the event of congestion in downstream sectors, controllers in the Beijing 01 sector may slow down the incoming traffic flow and redirect controlled flights to holding patterns to avoid further traffic buildup. However, if flights are unable to leave the Beijing 01 sector efficiently, congestion could occur in this sector as well. On the other hand, sectors with lower degrees, such as Hohhot 02, Taiyuan 01, Taiyuan 03, Beijing 07, Beijing 08, Beijing 12, and Beijing 14, which are located at the regional borders of North China, are likely to have less impact on the entire network and require less workload from controllers, as they have fewer direct connections with other sectors.
The Beijing 01 sector exhibits the highest betweenness in the North China sector network, owing to its central location. This sector serves as a hub connecting multiple shortest air routes, which in turn can affect the efficiency and effectiveness of information exchange between different network sectors. Given its critical role in the operation of the entire sector network, special attention should be paid to such pivotal sectors when assessing the network’s invulnerability. These topological characteristics underscore the importance of the Beijing 01 sector in maintaining the sector network’s robustness.
The Beijing 02 sector, which includes the Beijing Capital Airport, has the highest air traffic volume among all control sectors in China. During peak hours (10:00–16:00), it handles more than 1900 flights with an average hourly traffic flow of 300 flights. This puts a significant workload on air traffic controllers in the sector, and congestion can result in flight delays.
3.3. Analysis of Network Structural Characteristics
According to the topological analysis, the North China sector network consists of 23 nodes and 53 undirected edges. In Section 2.2, we use the clustering coefficient and average path length metrics to evaluate the overall structural properties of the network.
The North China sector network has an average clustering coefficient () of 0.465, which means that there is a 46.5% chance of direct connections between adjacent sectors. However, this value suggests a relatively low level of clustering in the sector network, meaning that connections between sectors are dispersed and not conducive to coordinated collaboration between controllers. Consequently, congestion in one sector could potentially lead to widespread flight delays across the entire sector network.
Using the Warshall–Floyd algorithm [33], the average path length of the North China sector network was determined to be . This value indicates that, on average, each flight in the North China sector network passes through three sectors or receives control services from three controllers. The lower number of transfers required during flight progress indicates that the traffic control in this network is more efficient and streamlined. This is due to the network’s compact and well-established structure, as evidenced by the small value of parameter . In summary, the North China sector network has a small clustering coefficient and average shortest path length, which sets it apart from the small-world network model that features a small average path length and large clustering coefficient [34].
Furthermore, the sector network’s structural characteristics were examined using metrics such as degree, intensity, and betweenness. These measures allowed for the assessment of the node’s importance, local traffic density, and centrality, respectively, providing insights into the network’s structure.
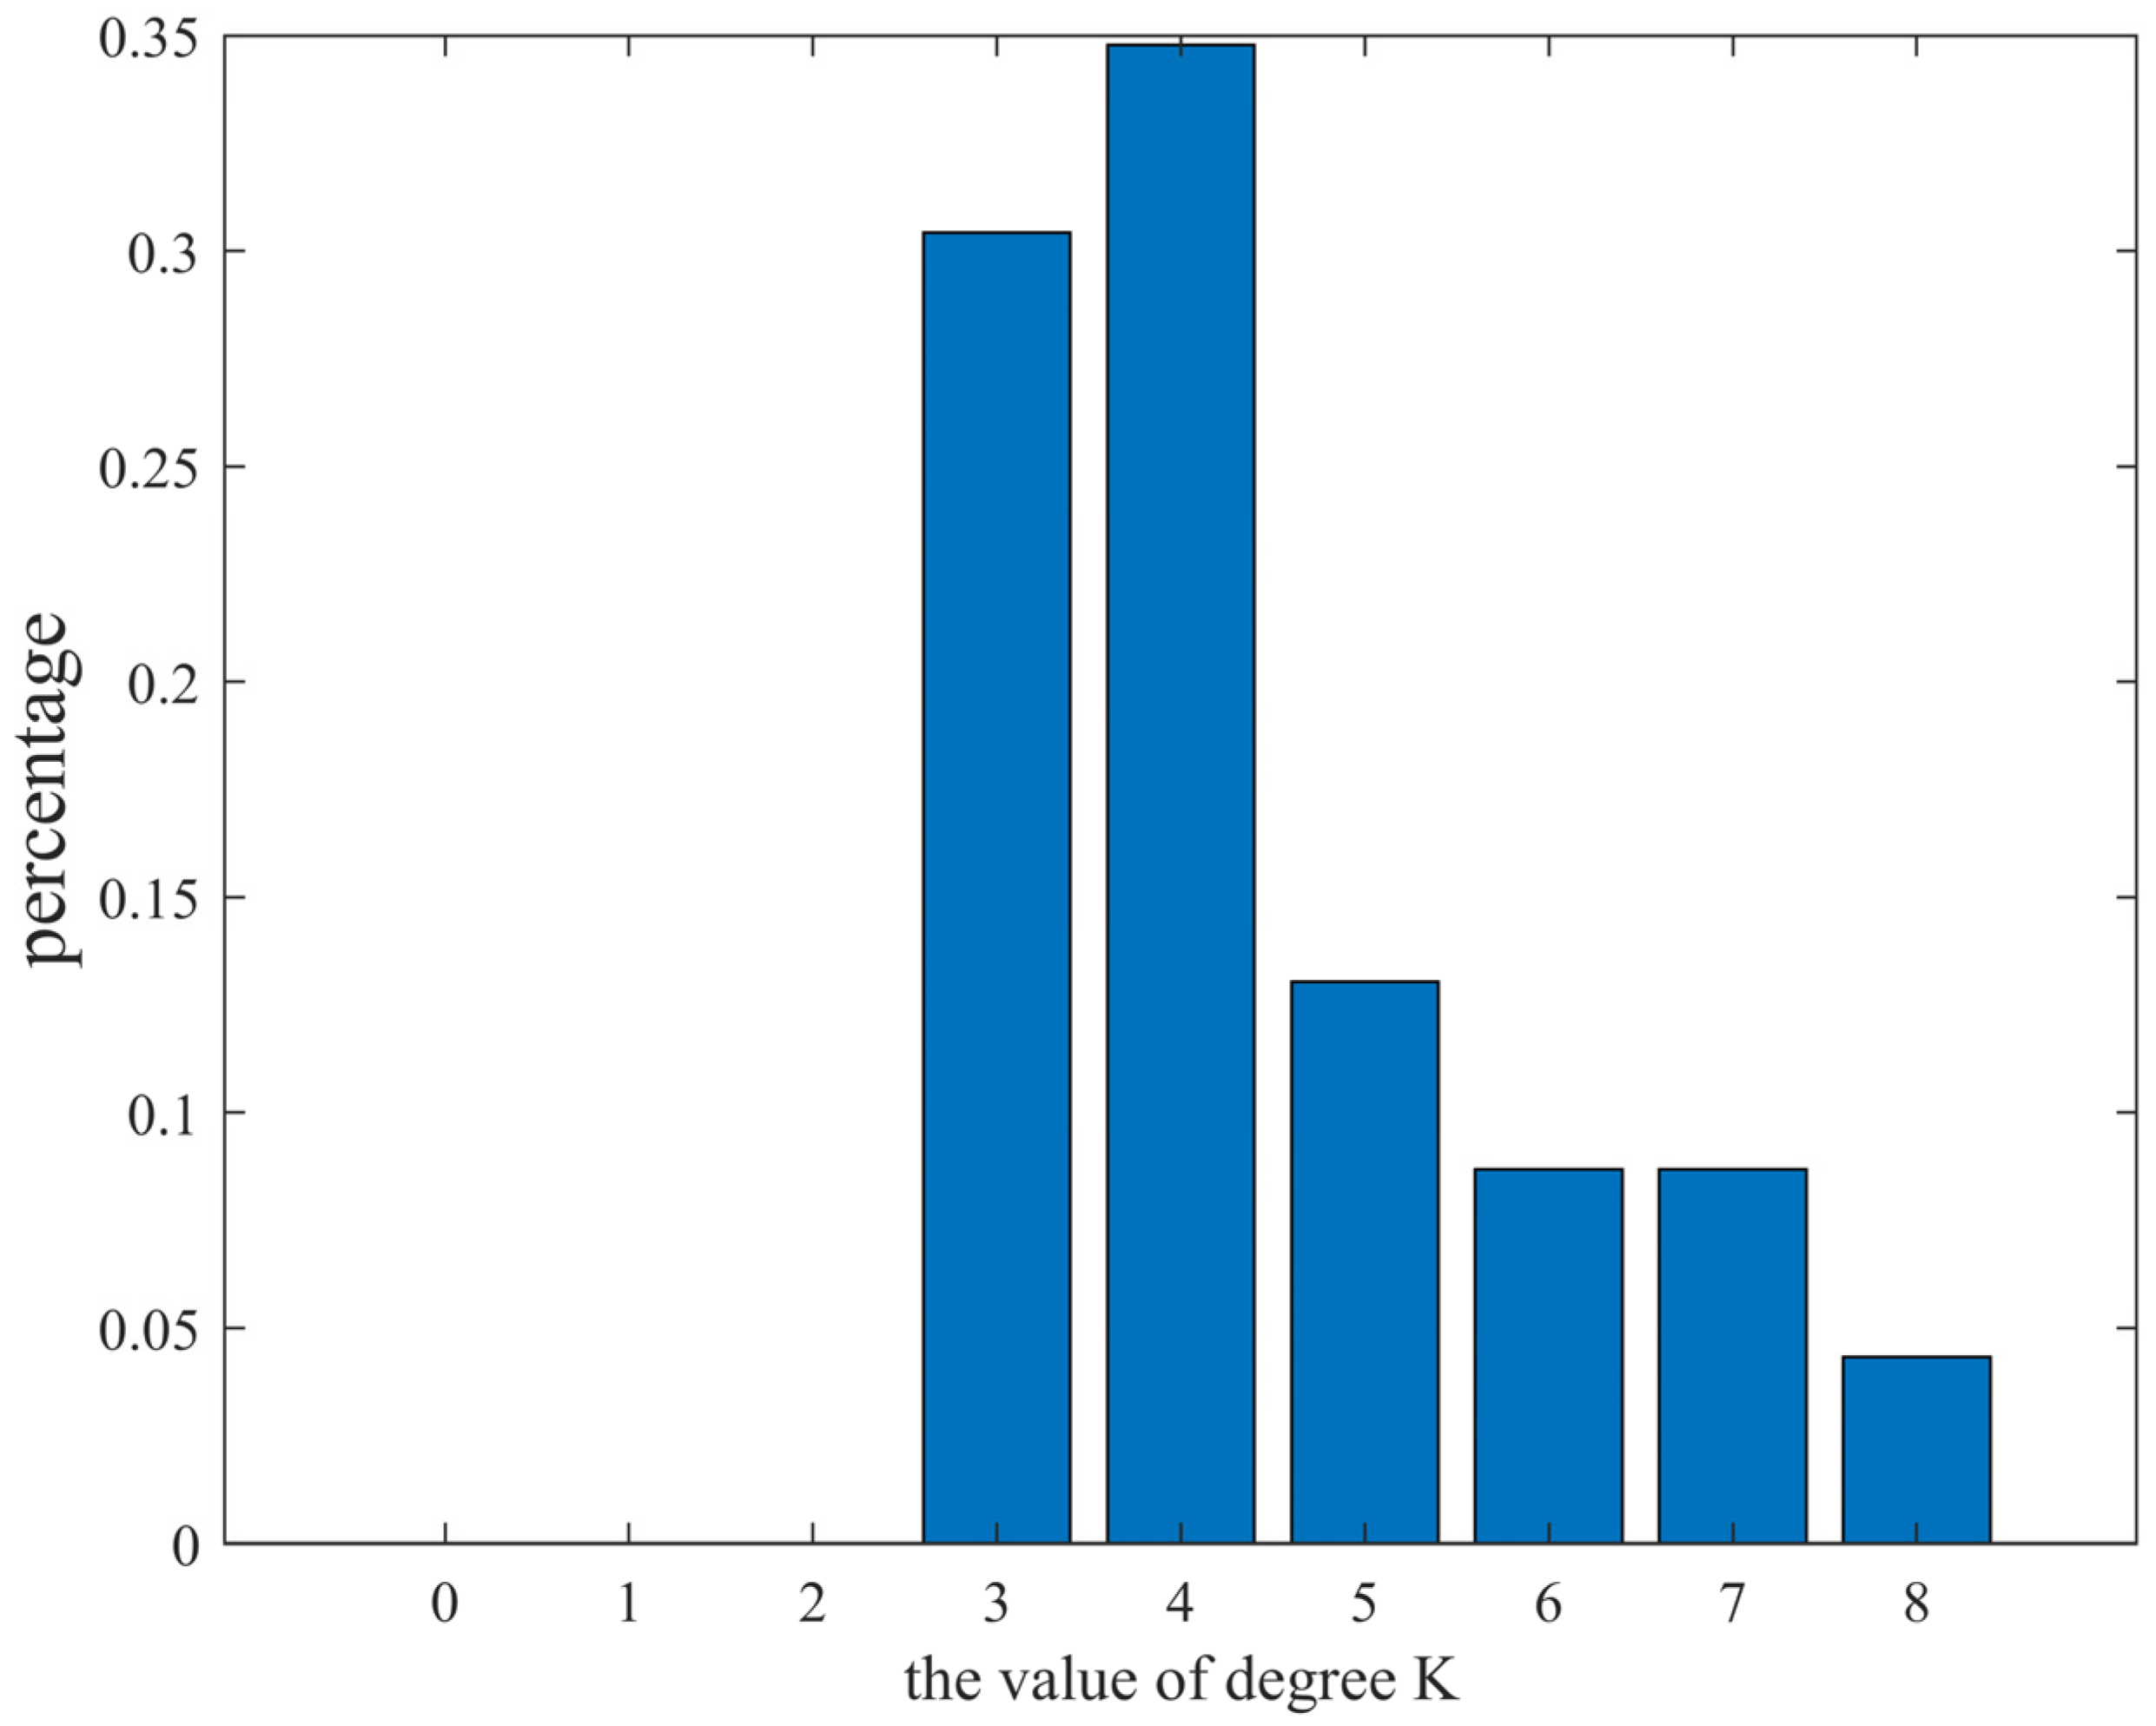
The division of sectors within the network was determined by geographic constraints, limiting the number of adjacent sectors each sector can have. As a result, the degree of each sector is not infinitely large, and those located at the network boundary exhibit relatively smaller degrees. As depicted in Figure 2, sectors with a degree of 4 make up the largest proportion, with 95% of degree values falling between 3 and 7. The average degree of the network is 4.43, signifying that, on average, a sector is directly connected to four neighboring sectors in the network.
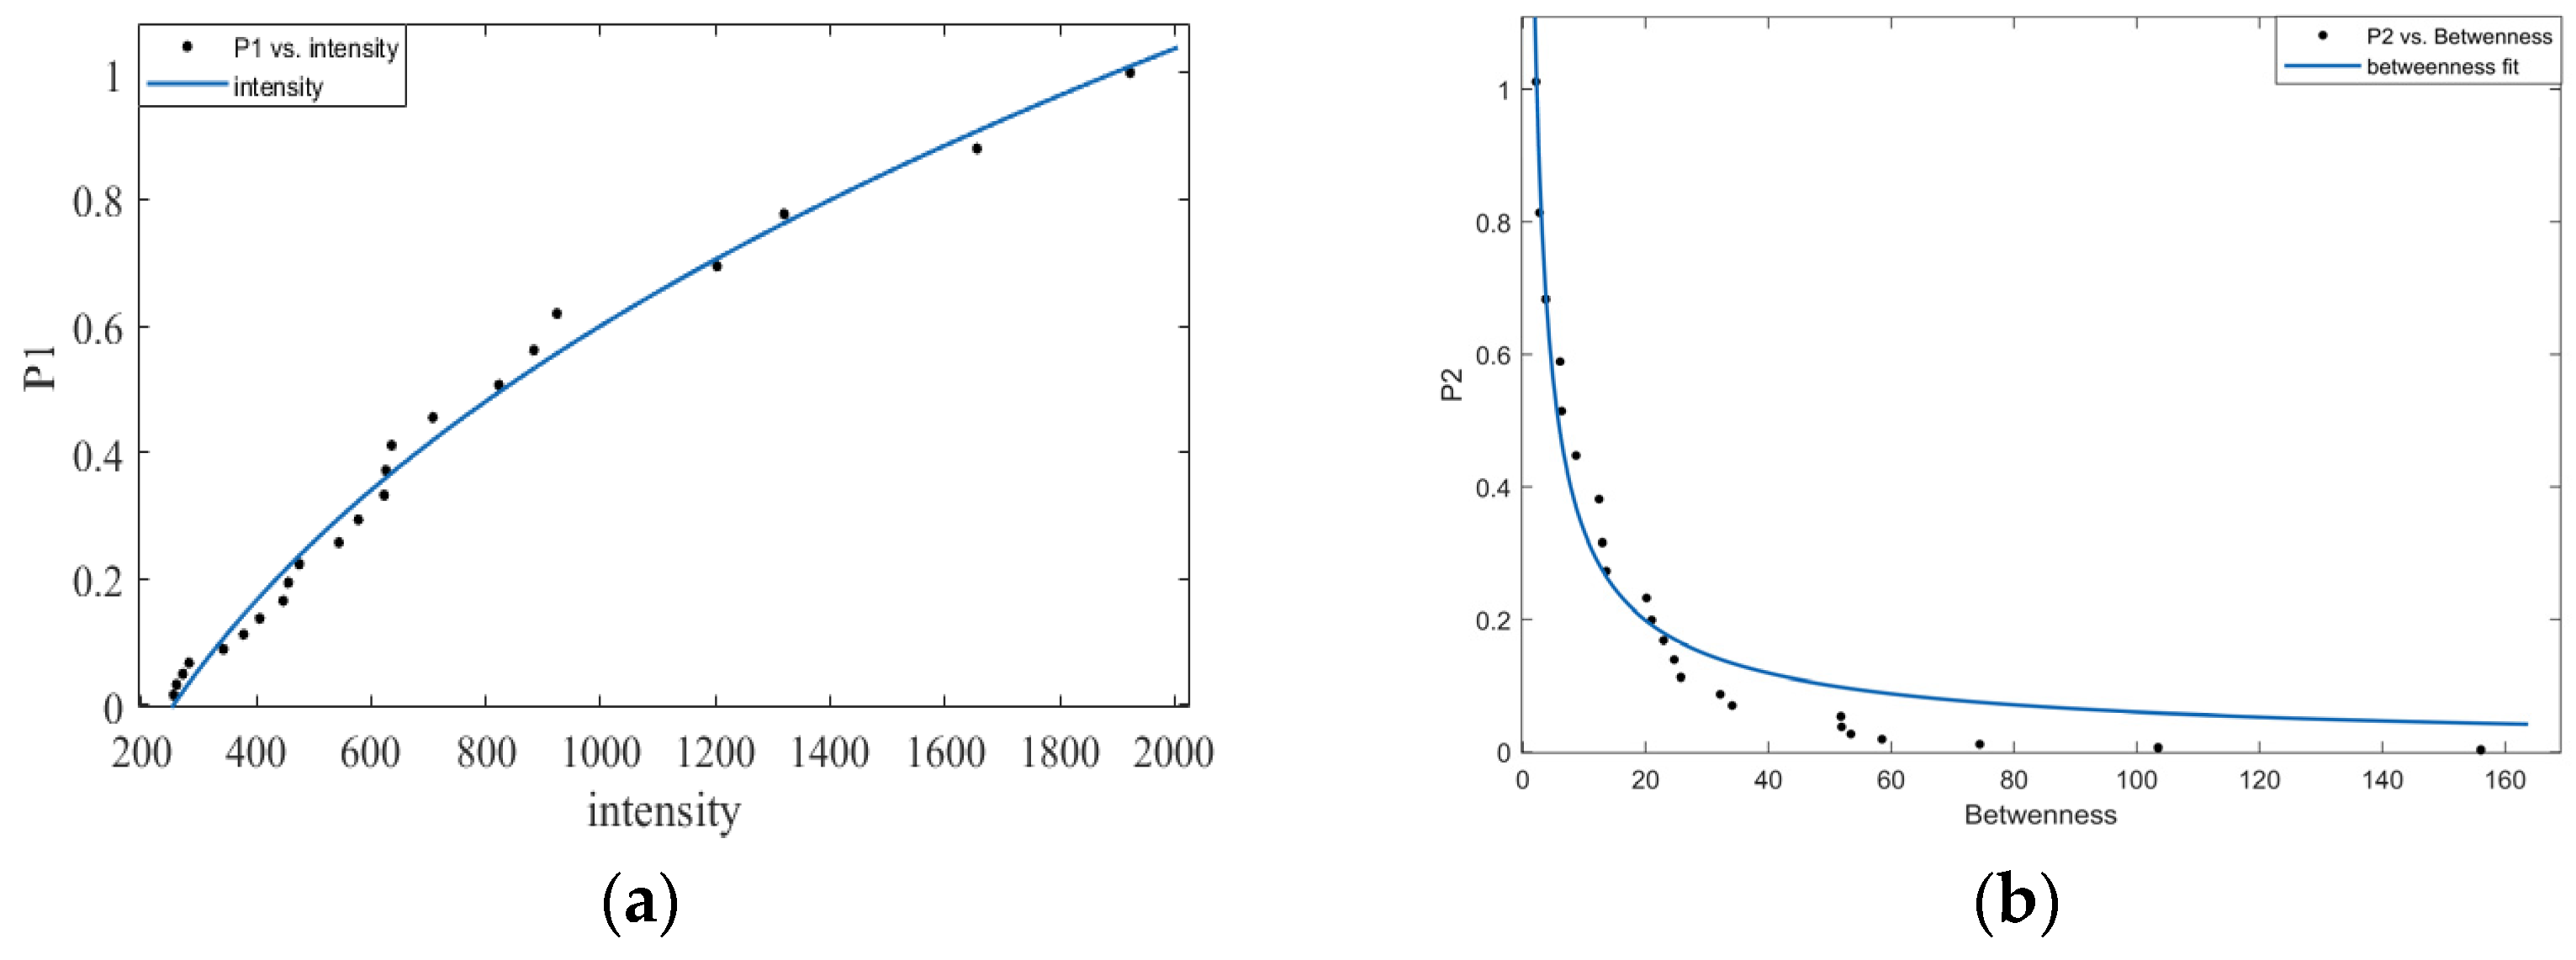
The intensity metric represents the local traffic density of each sector. By analyzing the traffic flow in each sector of the North China airspace over a six-hour period, the corresponding intensity of each sector was calculated. Sectors with higher traffic flow exhibit larger intensity values. Figure 3a displays the cumulative distribution of sector intensity in the North China sector network. This cumulative distribution conforms to a power-law distribution, the function of which is computed in Equation (8). Within the six-hour peak period studied, the majority of sectors experienced flight volumes ranging from 300 to 600. The highest intensity recorded was over 1900, while the lowest was around 200, resulting in a range that is approximately nine times greater. This large range highlights significant variations in the levels of activity among different sectors.
Sectors with high betweenness are typically situated at the intersection of multiple shortest paths. The cumulative distribution of sector betweenness in the network is illustrated in Figure 3b and also adheres to a power-law distribution, the function of which is calculated in Equation (9).
The intensity values exhibit a significant range, with the maximum intensity exceeding 1900 and the minimum intensity falling below 260. Such a broad range implies substantial variations in traffic volume and workload for controllers across different sectors. Therefore, optimizing the division and management of sectors is crucial in reducing controller workload in busy sectors. Most sectors with low betweenness are located at the periphery of the network and have minimal impact on the overall sector network. However, they can play a crucial role in connecting central areas and creating positive impacts on the economic development of remote regions. The highest betweenness value among all sectors is over 150, while the lowest is 2.17. This broad range of betweenness further underscores the differences in the influence of various sectors on the network structure.
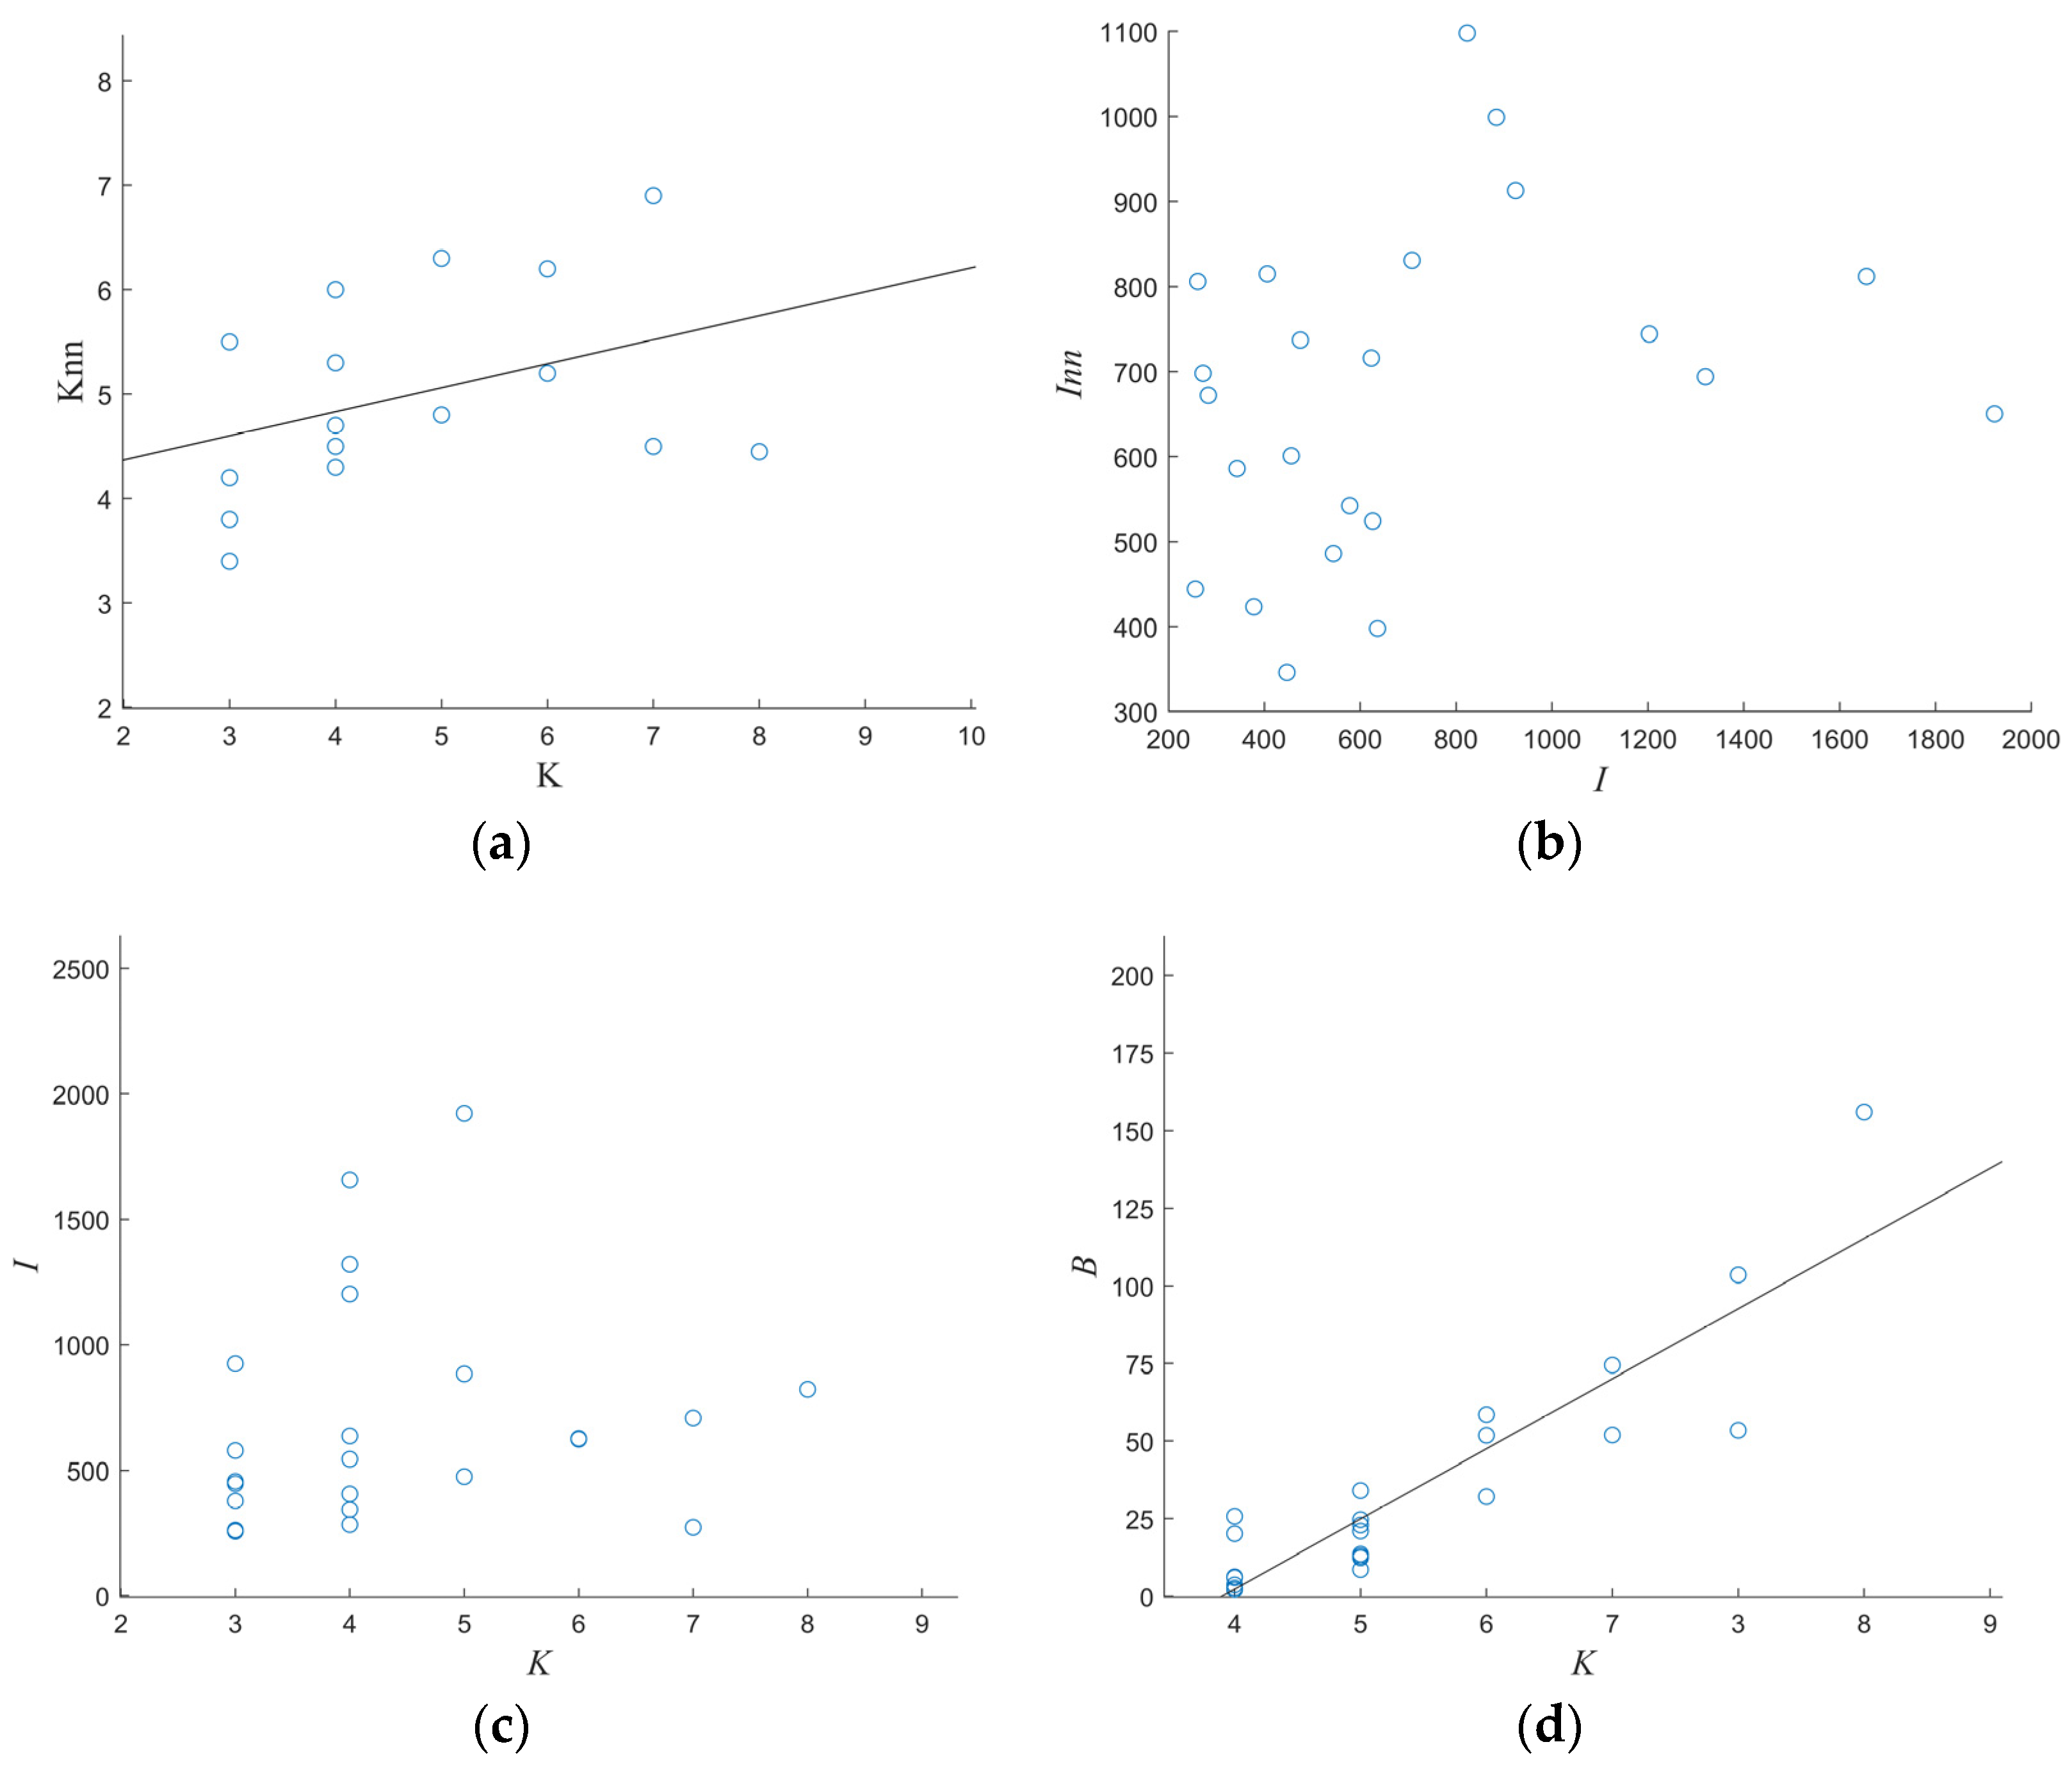
The structural features of the North China sector network were further analyzed through correlation analysis, which investigated the relationship between different indices and suggests connection preferences of sectors. In complex network theory, connection preference refers to nodes with the same attributes being more likely to connect with each other. The correlation between different characteristic indices of the network is presented in Figure 4, including intensity (), average nearest neighbor intensity (), degree (), average nearest neighbor degree (), betweenness centrality () of a sector node, and clustering coefficient () of node . These correlations reflect how changes in one characteristic index of a node can impact other indices and how new nodes may connect to the network following certain rules expressed by these indices.
By conducting correlation analyses on the topological property indices of the North China sector network, several characteristics of the network can be identified and summarized.
Nodes with higher degrees tend to connect with other high-degree nodes, resulting in a positive correlation between node degree and the average degree of its nearest neighbors. This suggests a potential homogeneity in the network.
There is no clear correlation between the intensity of a sector and the average intensity of its nearest neighbors, indicating that a sector with high intensity may have neighbors with lower intensity. Moreover, adjacent sectors to a busy sector may be relatively less occupied. These findings imply the potential to optimize the use of unoccupied sectors surrounding busy ones to efficiently manage airspace resources. Interestingly, the distribution of in the network differs from that of , as depicted in Figure 4a,b.
Figure 4c reveals that there is no clear correlation between the degree and intensity of nodes, as the intensity distribution varies widely among nodes with the same degree. This finding challenges the notion of network homogeneity in the North China sector. Furthermore, the number of flights and adjacent sectors do not appear to have a direct relationship, and the level of busyness in a sector is not necessarily indicative of its importance to the network structure.
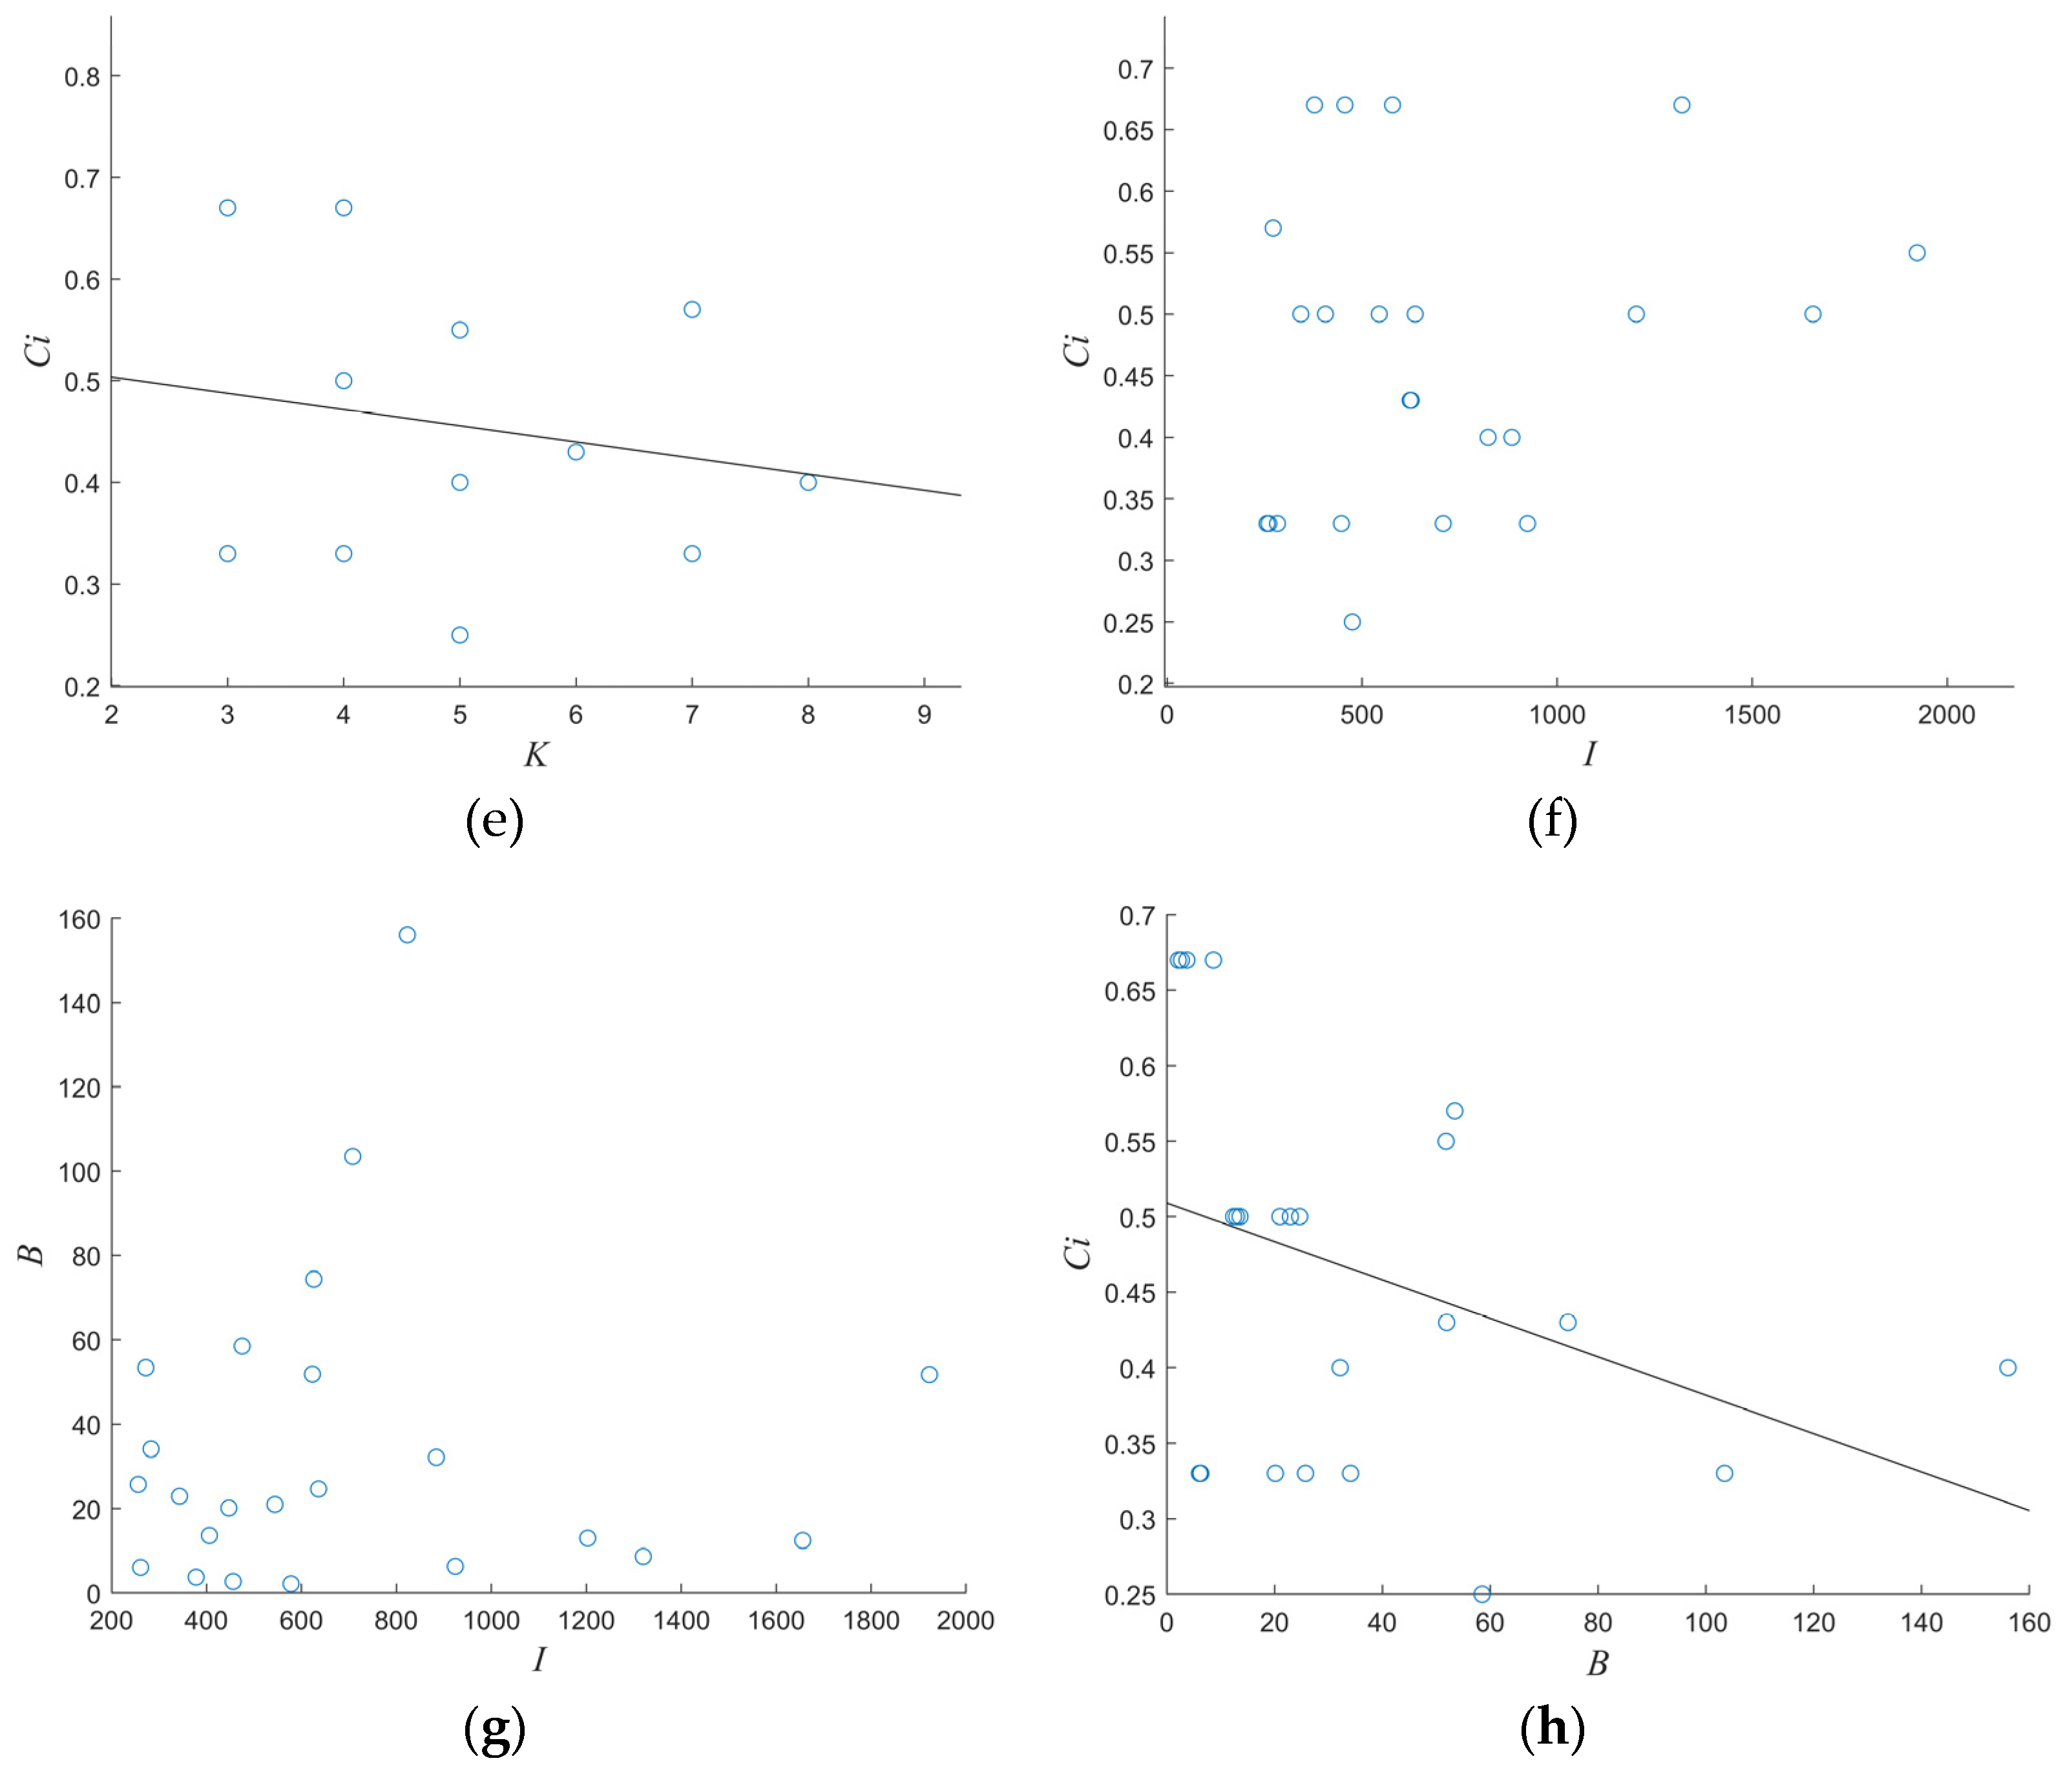
Figure 4d shows a positive correlation between node degree and betweenness, with a high correlation coefficient (). Sectors with large degrees are likely to be situated at the center of the sector network, connected to many neighboring sectors, whereas sectors with small degrees are typically located at the periphery of the sector network, with few connected neighboring sectors. In the North China sector network, the sector with the largest and smallest degrees, Beijing 01 and Beijing 14, respectively, also have the largest and smallest betweenness values.
Although the limited number of network nodes in Figure 4e results in a less-than-ideal degree of fit, a negative correlation can still be observed between node degree and clustering coefficient. This negative correlation implies that sectors with large degrees are often traversed by only a few air routes, and there are relatively few direct connections between their neighboring sectors.
Figure 4f,g do not indicate any significant correlations between intensity and either clustering coefficient or betweenness. These findings align with the understanding that a sector’s busyness and controller workload are not directly associated with the connectivity of neighboring sectors. While a sector’s intensity is related to the total number of flights passing through it, this measure is not tied to the structural characteristics of the North China sector network.
Figure 4h shows a negative correlation between clustering coefficient and betweenness, suggesting that there may be fewer flights between neighboring sectors located at the structural center of the network. Although the size of the sector network introduces some degree of error in fitting the curve to the graph, the overall trend can still be discerned from the figure.
By analyzing the sector network characteristics from the perspective of actual ATC operations, several interesting observations can be made. Firstly, the regulatory sector network does not exhibit the scale-free network configuration, but its strength and clustering coefficient exhibit the characteristics of a scale-free network. This is a unique feature of the ATC sector network when compared to other civil aviation networks, such as the China airport network and China route network, which is related to the partition of sector nodes and the number of nodes in the network. Secondly, the study finds that neighboring sectors of high intensity or busy sectors may not necessarily experience the same intensity or busyness, indicating that there may be unoccupied sectors around busy ones that can be utilized to improve the overall sector network capacity. However, the increase in the number of neighbor sectors with increasing sector degree in the North China sector network leads to a decrease in the probability of these sectors being geographically adjacent to each other, resulting in a drop in the probability of direct flight connections between those sectors. This structural feature may pose challenges for ATC communication and cooperation in resolving flight congestion problems. Overall, these findings highlight the need for more efficient ATC strategies to optimize the utilization of sector network resources and improve the overall sector network capacity.
4. Invulnerability of Sector Network
The capacity of a sector is subject to various factors, including severe weather, military operations, and air traffic control equipment. These factors can lead to a significant reduction in sector capacity or even operational failure, thereby altering the structural characteristics of the sector network. Therefore, it is crucial to develop a comprehensive understanding of the network’s resilience to such influential factors.
4.1. Attack Strategies
During the operation of the sector network, it is susceptible to damage from various factors, such as natural disasters, human errors, or equipment failures. Such damage may cause the failure of nodes or a portion of the network, leading to changes in the network structure and overall performance. It is therefore essential to develop a good understanding of the network’s invulnerability to these influential factors [35]. A common research approach to study the invulnerability of complex networks is to compare the changes in network invulnerability indices before and after the network is subjected to different attack strategies [36]. Static invulnerability analysis can be used to study the changes in the network structure and performance after an attack on a sector. In this study, the invulnerability of the North China sector network was explored using three attack strategies, and critical sectors and potential critical sectors were also analyzed.
This study used computer simulation to assess the invulnerability or resilience of a sector network by employing three different attack strategies: random attack (RA) and two types of intentional attack (IA). The RA strategy was utilized to simulate the effects of natural disasters and unintentional damages, which are characterized by their unpredictability and uncertainty. These strategies were previously employed in similar studies [16,37,38]. The RA strategy was used in the airspace sector network to model various scenarios, such as equipment failures caused by severe weather, natural disasters, and military exercises, which can lead to temporary closures of airports, waypoints, and sectors. In this simulation, the RA strategy involved selecting an increasing number of nodes at random from the network and attempting to attack them [39]. In contrast to natural disasters, intentional human destruction is typically more targeted and purposeful. Therefore, the IA strategies were employed in this study to simulate this type of destruction. IA is characterized by targeting network nodes that have the greatest impact on the network. This simulation involved attacking and removing network nodes in order of their importance to the network structure. The IA strategy was designed to attack nodes or connected edges based on predetermined rules aimed at changing the network’s strength, betweenness, and degree properties [40]. Degree and betweenness are critical indicators that accurately reflect the nodes’ influence on the network structure [41]. Hence, the magnitudes of these two indicators were used to determine the importance of nodes in the IA simulation. Two types of intentional attack strategies were adopted, as outlined in Table 2.
4.2. Results of Invulnerability Assessment
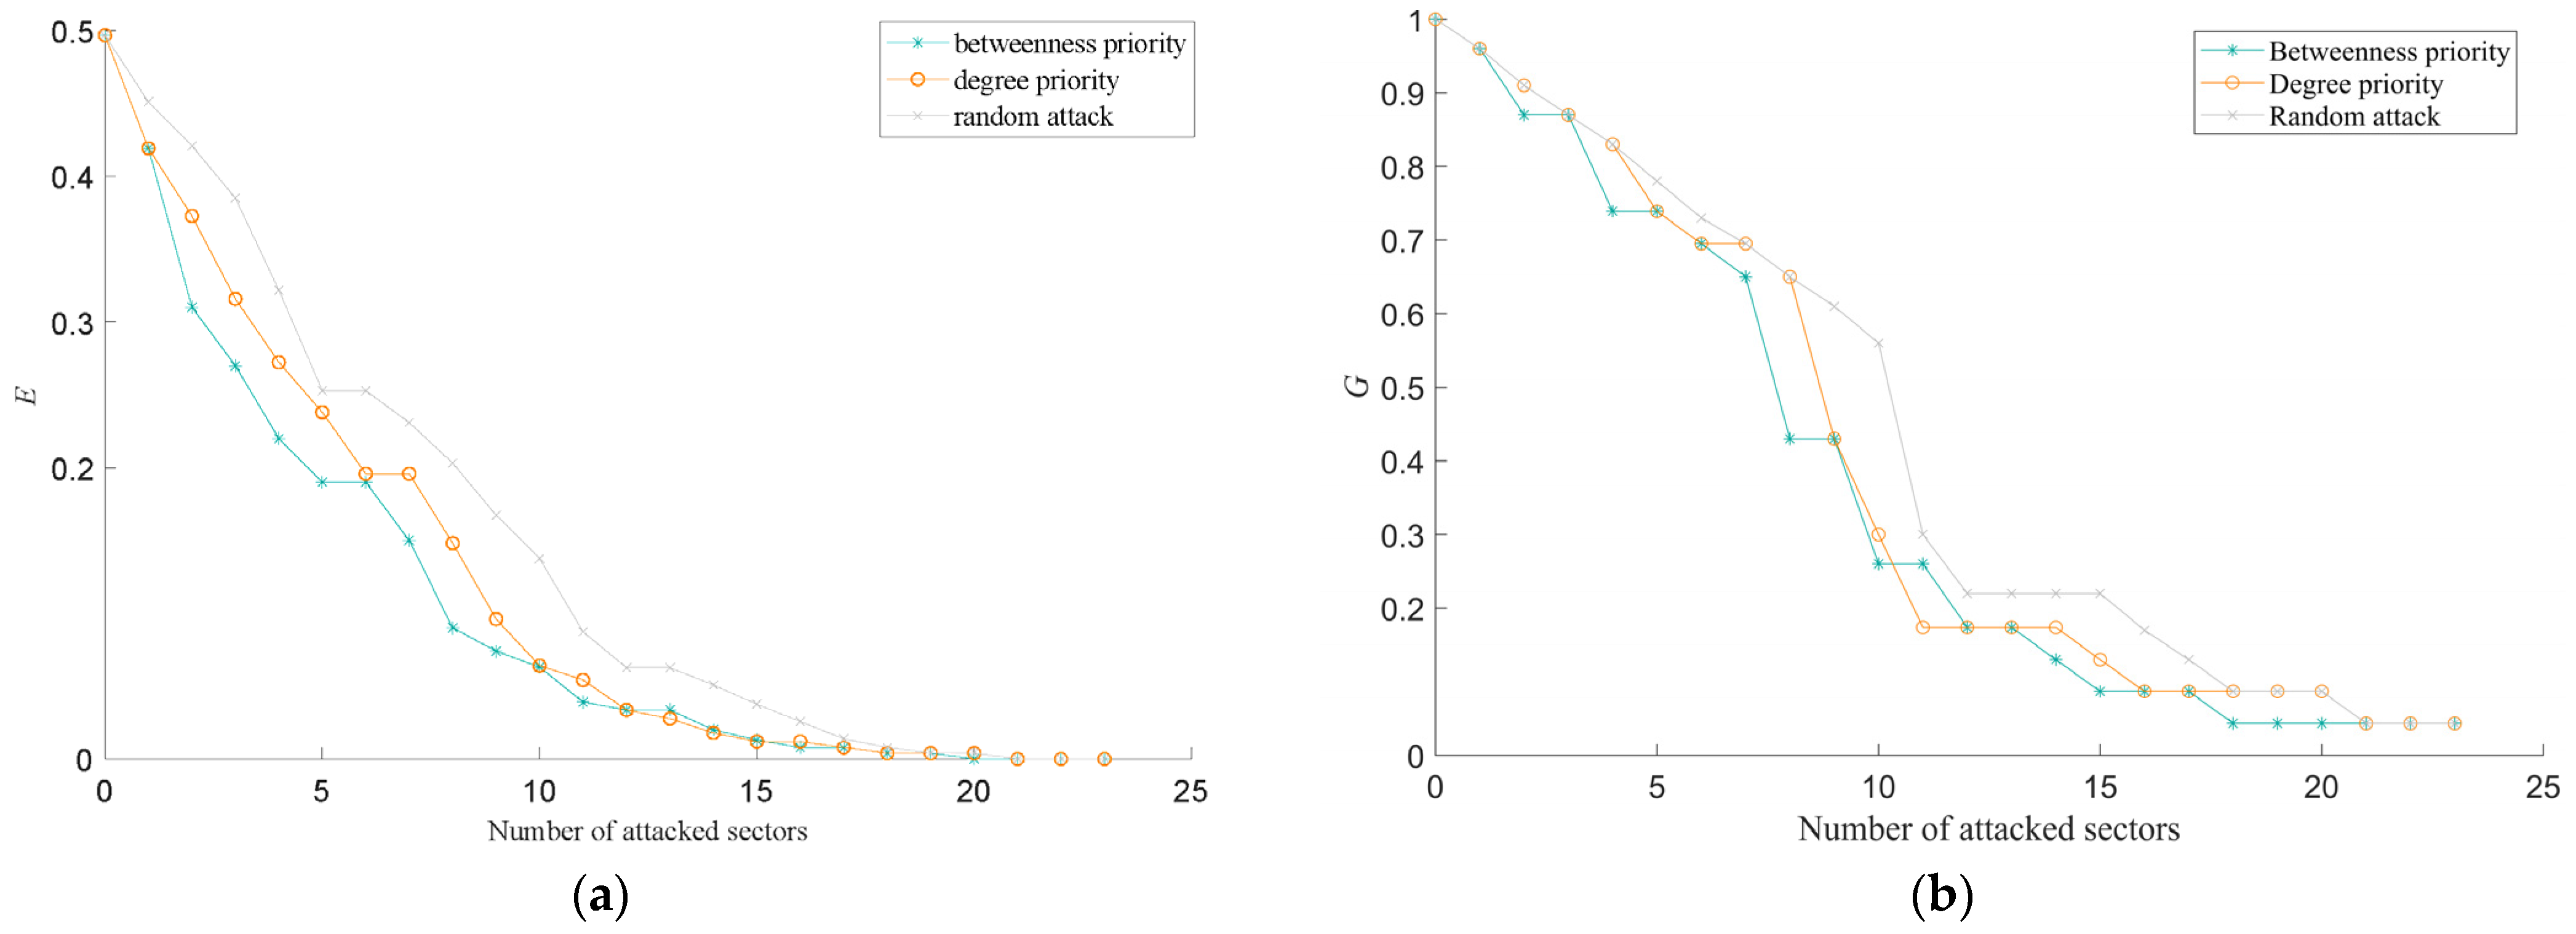
In Section 4.1, nodes were eliminated from the network using three attack strategies to simulate airspace sector closures. The network’s performance was assessed by measuring its global efficiency and the relative size of its connected components, as explained in Section 2.3. Figure 5 illustrates the impact of various attack strategies on the network’s performance. As the number of attacked sectors increased, the shortest path length between sectors increased, resulting in a drop in the network’s efficiency. This caused more airspace sectors to become isolated from the network, resulting in a decline in its integrity and stability. The trends observed in the two invulnerability measurement indices under different attack strategies indicate that the network’s function deteriorated progressively until it collapsed due to an increase in the total number of failed sectors.
In the simulation of RA, Matlab software was employed to randomly arrange the North China sector network’s sectors from 1 to 23 and eliminate an increasing number of sectors from the list to mimic the network’s static invulnerability when affected by unintentional human factors or natural disasters. Figure 5 demonstrates that when fewer sectors are removed from the network initially, the network efficiency and relative size of connected components decline gradually at a constant rate, while the network’s scale remains relatively unchanged. However, when the 10th sector is removed, the network’s efficiency and connectivity experience a considerable reduction, and the relative size of the connected component decreases significantly, leading to more isolated sectors and substantial damage to the network structure. As shown in the Table A1 and Table A2, attacking the 10th sector causes the network’s efficiency to decline to 0.17 and the number of sectors in the connected component to drop to 7, leading to the network’s collapse. These results demonstrate that the North China sector network is robust to random attacks.
The strategies of IA consist of degree priority attacks and betweenness priority attacks. For the simulation of degree priority attacks, the sectors in the North China sector network were sorted by degree and removed from the network in descending order to simulate the impact of intentional human destruction—a purposeful attack with clear targets on the network. As shown in Figure 5 and Table A1 and Table A2, with the removal of the first sector, the network efficiency drops significantly; network connectivity and efficiency are heavily impacted by the removed sector. When the first three sectors are removed, the relative size of the connected component of the network drops faster than the RA strategy, and aircraft in the network can bypass the failed sector and reach any other sector in the network. When the eighth sector is removed, the relative size of the connected component drops sharply, and the integrity of the network scale is destroyed. With the increase in the total number of attacked sectors, the network is divided into multiple parts, and each part has a certain connectivity and stability. This phenomenon can be reflected from the attacks between the 11th sector and the 14th sector; the network efficiency and the relative size of the connected component show minor changes, and the overall network structure is relatively stable in this stage of the attacks. When the 15th sector is removed, the network efficiency drops to 0.0119, the relative size of the connected component is 0.13, and the maximum number of connected airspace sectors is 3. In that case, the sector network can be considered as completely collapsed. The IA strategy based on degree priority is very destructive to the network structure of the North China sector network.
Betweenness is another metric that indicates a node’s importance to the network structure. To simulate the damage caused by intentional attacks on the network, betweenness priority attacks were used. The results obtained from this attack strategy, as shown in Figure 5 and Table A1 and Table A2 of Appendix A, are generally similar to those from degree priority attacks. At the outset, the network’s efficiency drops significantly, and the relative size of connected components declines sharply after the first four sectors are removed. The network structure rapidly decomposes, and both network connectivity and overall integrity suffer severe damage. In the intermediate stage, the two curves’ downward trends slow down, and the overall network structure temporarily maintains stability. Subsequently, the two measurement indices continue to decrease as the total number of attacked sectors increases. When the 14th sector is removed, the relative size of the connected component drops below 0.13, causing the network to collapse. The betweenness priority attack strategy also exhibits a potent destructive effect on the North China sector network’s structure.
In conclusion, by analyzing the changes in static invulnerability metrics for the North China sector network under three different attack strategies, we can conclude that the two IA strategies are more destructive to the network than RA. Under the IAs, network efficiency drops rapidly from the beginning, the relative size of connected components also quickly enters a state of sharp decline, and the network enters a state of collapse faster. Both indices indicate that the destructive impact from the IAs is faster and more severe than the impact of RA. Overall, the North China sector network is more resilient to RA than IA. Since the degree of a node is positively correlated with its betweenness, sectors with high degrees usually exhibit high betweenness as well. The destructive impacts of the two types of IA strategies are roughly similar to those of the North China sector network. However, the IA strategy with betweenness priority is generally more effective at damaging the network. Therefore, betweenness could be considered a key indicator of the static invulnerability of the airspace sector network.
4.3. Impact of Attacks on Critical Sectors
Critical sectors play a vital role in the structure of the airspace network, and targeting them can lead to significant damage to the network. Identifying critical sectors is essential for research on network invulnerability. Section 4.2 highlights the significance of betweenness as an indicator of network invulnerability, which can be used to determine the critical sectors of the network. This study ranked sectors in decreasing order of betweenness to identify the critical sectors. To simplify the analysis, we selected the top four sectors with the highest betweenness as representative critical sectors, namely, Beijing 01, Beijing 04, Beijing 03, and Taiyuan 02. If an attack occurs on these critical sectors, it can result in changes to the network structure and performance, leading to variations in the characteristic indices of adjacent sectors [42]. Consequently, the betweenness of certain adjacent sectors may significantly increase due to the network’s structural changes, causing a large number of flights to preferentially pass through them. These sectors with increased betweenness become potential critical sectors [43]. Identifying potential critical sectors is crucial in mitigating the negative effects of “cascading failure” [44].
In air traffic control operations, the failure of a single airspace sector is more likely than the failure of multiple critical sectors simultaneously. Therefore, the simulation only focused on attacking one critical sector at a time. Table 3 displays the simulation results of attacks on the four identified critical sectors with high betweenness. When each critical sector is attacked individually, the network’s efficiency significantly decreases. However, since only one sector is attacked at a time without creating isolated nodes, the attacks on single critical sectors have no impact on the integrity of the sector network. During each of the four attacks, one potential critical sector was identified based on the significant change in betweenness [43]. Table 3 indicates that the betweenness change rates of the Beijing 05 sector and Taiyuan 01 sector increased dramatically when the Beijing 03 sector and Taiyuan 02 sector failed, respectively. The betweenness of the Taiyuan 01 sector increased from 20.15 (shown in Table 3) to 220.62, which is more than ten times the original betweenness. Without proactive measures during an attack, flight traffic in these two sectors could surge, leading to traffic congestion and further damage to other sectors in the North China sector network. Therefore, it is essential to analyze traffic changes and implement flow control measures to prevent potential issues [45].
5. Conclusions
From the perspective of complex network theory, an empirical study was developed to analyze the characteristics and invulnerability of an airspace sector network. The airspace sectors under the jurisdiction of the North China sector network were selected for empirical study. The findings of this paper are threefold:
- The study reveals that the airspace sector network in North China exhibits a compact and well-established structure, as indicated by its small average path length and clustering coefficient. However, the connections between adjacent sectors are scattered, posing challenges for efficient air traffic control coordination and collaboration. The sector degree distribution is relatively even, and the workload of controllers in different sectors varies significantly, as evidenced by the power-law distribution of intensity and betweenness. Therefore, optimizing sector management to balance controller workload is crucial for efficient air traffic control.
- We evaluated the invulnerability of the airspace sector network by analyzing two key measurement indices: network global efficiency and the relative size of connected components. The results indicate that the sector network is more resilient to random attacks but less so to intentional attacks. In the case of intentional attacks, degree and betweenness are crucial indices that can help identify critical sectors and potential critical sectors. Since betweenness has a higher impact than degree in intentional attacks, it was chosen as the primary critical index to analyze the effect of critical sectors and identify potential critical sectors. Critical sectors play a pivotal role in the overall invulnerability of the sector network. If critical sectors are targeted, it could significantly increase the flight traffic of potential critical sectors, leading to traffic congestion and further damage to other sectors.
- This study utilized complex network theory to investigate the airspace network, specifically analyzing the ATC sector network in North China using historical air traffic data. The study obtained a comprehensive understanding of the topological characteristics and invulnerability of the sector network from the perspective of air traffic control. This provides insights for alleviating air traffic congestion and lays the foundation for future planning of sector selection in airspace.
Compared to other networks, such as road or railway networks, when a sector fails in ATC operations, aircraft can divert to another sector. From a network modeling perspective, the failure of one node can affect the degree of its neighboring nodes, making the overall network a dynamic system. However, this study only analyzed the sector network as a static system using traditional attack strategies based on degree or betweenness centrality. Thus, it failed to simulate the dynamic failure process of the network or the reasons for the damage to the airspace. Recently proposed complex networking methods [46,47,48] may help discover the characteristics and strategies to improve the airspace sector network as a dynamic system. As the sector network in the North China region has a small number of nodes, its characteristics in various complex network features, especially the scale-free property, are not apparent. Therefore, future research should expand the sample size and adopt new methods to further analyze the sector network. It is also important to compare the invulnerability of the airspace sector network with other similar complex networks, such as road and railway networks. Additionally, it is crucial to analyze the dynamic invulnerability of the sector network and the problem of “cascade failure”.
Author Contributions
Conceptualization, H.L. and S.Z.; methodology, S.Z.; software, S.Z.; validation, J.K., H.L., and S.Z.; formal analysis, J.K.; investigation, H.L.; resources, J.K.; data curation, S.Z.; writing—original draft preparation, S.Z.; writing—review and editing, H.L.; visualization, J.K.; supervision, H.L.; project administration, H.L.; funding acquisition, J.K. All authors have read and agreed to the published version of the manuscript.
Funding
This study was co-supported by The Key Research and Development Plan of Sichuan Province in 2022 (2022YFG0210) and The Fundamental Research Funds for the Central Universities in 2022 (ZHMH2022-009).
Data Availability Statement
The data used to support the findings of this study are available from the corresponding author upon request.
Conflicts of Interest
The authors declare that there is no conflict of interest regarding the publication of this paper.
Appendix A

Table A1.
The network efficiency of sector network under different attack strategies.
| Sector Code | Degree Priority | Betweenness Priority | Random Attack |
|---|---|---|---|
| 0 | 0.4969 | 0.4969 | 0.4969 |
| 1 | 0.4193 | 0.4193 | 0.4510 |
| 2 | 0.3728 | 0.3102 | 0.4210 |
| 3 | 0.3159 | 0.2700 | 0.3851 |
| 4 | 0.2724 | 0.2200 | 0.3219 |
| 5 | 0.238 | 0.1900 | 0.2529 |
| 6 | 0.1958 | 0.1900 | 0.2529 |
| 7 | 0.1958 | 0.1500 | 0.2309 |
| 8 | 0.1481 | 0.0900 | 0.2031 |
| 9 | 0.0960 | 0.0740 | 0.1673 |
| 10 | 0.0640 | 0.0630 | 0.1376 |
| 11 | 0.0542 | 0.0390 | 0.0873 |
| 12 | 0.0336 | 0.0336 | 0.0626 |
| 13 | 0.0277 | 0.0336 | 0.0626 |
| 14 | 0.0178 | 0.0200 | 0.0507 |
| 15 | 0.0119 | 0.013 | 0.0375 |
| 16 | 0.0119 | 0.0079 | 0.0257 |
| 17 | 0.0079 | 0.0079 | 0.0138 |
| 18 | 0.0040 | 0.0040 | 0.0079 |
| 19 | 0.0040 | 0.0040 | 0.0040 |
| 20 | 0.0040 | 0 | 0.0040 |
| 21 | 0 | 0 | 0 |
| 22 | 0 | 0 | 0 |
| 23 | 0 | 0 | 0 |
Table A2.
The relative size of connected components of sector network under different attack strategies.
Table A2.
The relative size of connected components of sector network under different attack strategies.
| Sector Coding | Degree Priority | Betweenness Priority | Random Attack |
|---|---|---|---|
| 0 | 1 | 1 | 1 |
| 1 | 0.96 | 0.96 | 0.96 |
| 2 | 0.91 | 0.87 | 0.91 |
| 3 | 0.87 | 0.87 | 0.87 |
| 4 | 0.83 | 0.739 | 0.83 |
| 5 | 0.739 | 0.739 | 0.78 |
| 6 | 0.695 | 0.695 | 0.73 |
| 7 | 0.695 | 0.65 | 0.695 |
| 8 | 0.65 | 0.43 | 0.65 |
| 9 | 0.43 | 0.43 | 0.61 |
| 10 | 0.3 | 0.26 | 0.56 |
| 11 | 0.174 | 0.26 | 0.3 |
| 12 | 0.174 | 0.174 | 0.22 |
| 13 | 0.174 | 0.174 | 0.22 |
| 14 | 0.174 | 0.13 | 0.22 |
| 15 | 0.13 | 0.087 | 0.22 |
| 16 | 0.087 | 0.087 | 0.17 |
| 17 | 0.087 | 0.087 | 0.13 |
| 18 | 0.087 | 0.04348 | 0.087 |
| 19 | 0.087 | 0.04348 | 0.087 |
| 20 | 0.087 | 0.04348 | 0.087 |
| 21 | 0.04348 | 0.04348 | 0.04348 |
| 22 | 0.04348 | 0.04348 | 0.04348 |
| 23 | 0.04348 | 0.04348 | 0.04348 |
References
- Çolak, S.; Lima, A.; González, M.C. Understanding congested travel in urban areas. Nat. Commun. 2016, 7, 10793. [Google Scholar] [CrossRef] [Green Version]
- Brittain, M.; Wei, P. Autonomous air traffic controller: A deep multi-agent reinforcement learning approach. arXiv 2019, arXiv:1905.01303. [Google Scholar]
- Rehman, A. Machine learning based air traffic control strategy. Int. J. Mach. Learn. Cybern. 2021, 12, 2151–2161. [Google Scholar] [CrossRef]
- Ren, G.; Lu, C.; Zhu, J.; Liu, X. Analyzing the topological characteristic and key nodes of Chinese air sector network. Int. J. Mod. Phys. B 2019, 33, 1950100. [Google Scholar] [CrossRef]
- Isufaj, R.; Omeri, M.; Piera, M.A.; Saez Valls, J.; Verdonk Gallego, C.E. From Single Aircraft to Communities: A Neutral Interpretation of Air Traffic Complexity Dynamics. Aerospace 2022, 9, 613. [Google Scholar] [CrossRef]
- Angeloudis, P.; Fisk, D. Large subway systems as complex networks. Phys. A Stat. Mech. Its Appl. 2006, 367, 553–558. [Google Scholar] [CrossRef]
- Porta, S.; Crucitti, P.; Latora, V. The network analysis of urban streets: A primal approach. Environ. Plan. B Plan. Des. 2006, 33, 705–725. [Google Scholar] [CrossRef] [Green Version]
- Sharifi, A. Resilient urban forms: A review of literature on streets and street networks. Build. Environ. 2019, 147, 171–187. [Google Scholar] [CrossRef]
- Sen, P.; Dasgupta, S.; Chatterjee, A.; Sreeram, P.; Mukherjee, G.; Manna, S. Small-world properties of the Indian railway network. Phys. Rev. E 2003, 67, 036106. [Google Scholar] [CrossRef] [PubMed] [Green Version]
- Bombelli, A.; Santos, B.F.; Tavasszy, L. Analysis of the air cargo transport network using a complex network theory perspective. Transp. Res. Part E Logist. Transp. Rev. 2020, 138, 101959. [Google Scholar] [CrossRef]
- Lordan, O.; Sallan, J.M.; Simo, P. Study of the topology and robustness of airline route networks from the complex network approach: A survey and research agenda. J. Transp. Geogr. 2014, 37, 112–120. [Google Scholar] [CrossRef]
- Zanin, M.; Lillo, F. Modelling the air transport with complex networks: A short review. Eur. Phys. J. Spec. Top. 2013, 215, 5–21. [Google Scholar] [CrossRef] [Green Version]
- Amaral, L.A.N.; Scala, A.; Barthelemy, M.; Stanley, H.E. Classes of small-world networks. Proc. Natl. Acad. Sci. USA 2000, 97, 11149–11152. [Google Scholar] [CrossRef] [Green Version]
- Kaiquan, C.; Jun, Z.; Wenbo, D.; Xianbin, C. Analysis of the Chinese air route network as a complex network. Chin. Phys. B 2012, 21, 028903. [Google Scholar]
- Hossain, M.; Alam, S.; Rees, T.; Abbass, H. Australian airport network robustness analysis: A complex network approach. In Proceedings of the 36th Australasian Transport Research Forum (ATRF), Brisbane, Australia, 2–4 October 2013. [Google Scholar]
- Albert, R.; Jeong, H.; Barabási, A.-L. Error and attack tolerance of complex networks. Nature 2000, 406, 378–382. [Google Scholar] [CrossRef] [Green Version]
- Janssen, M.A.; Schoon, M.L.; Ke, W.; Börner, K. Scholarly networks on resilience, vulnerability and adaptation within the human dimensions of global environmental change. Glob. Environ. Chang. 2006, 16, 240–252. [Google Scholar] [CrossRef] [Green Version]
- Qian, B.; Zhang, N. Topology and Robustness of Weighted Air Transport Networks in Multi-Airport Region. Sustainability 2022, 14, 6832. [Google Scholar] [CrossRef]
- Başpınar, B.; Gopalakrishnan, K.; Koyuncu, E.; Balakrishnan, H. An empirical study of the resilience of the US and European air transportation networks. J. Air Transp. Manag. 2023, 106, 102303. [Google Scholar] [CrossRef]
- Chicco, G.; Mancarella, P. Matrix modelling of small-scale trigeneration systems and application to operational optimization. Energy 2009, 34, 261–273. [Google Scholar] [CrossRef]
- Sergeeva, M.; Delahaye, D.; Mancel, C.; Vidosavljevic, A. Dynamic airspace configuration by genetic algorithm. J. Traffic Transp. Eng. (Engl. Ed.) 2017, 4, 300–314. [Google Scholar] [CrossRef]
- Zhang, X.; Miller-Hooks, E.; Denny, K. Assessing the role of network topology in transportation network resilience. J. Transp. Geogr. 2015, 46, 35–45. [Google Scholar] [CrossRef] [Green Version]
- Bin, J.; Claramunt, C. Topological analysis of urban street networks. Environ. Plan. B Plan. Des. 2004, 31, 151–162. [Google Scholar]
- Barrat, A.; Barthelemy, M.; Pastor-Satorras, R.; Vespignani, A. The architecture of complex weighted networks. Proc. Natl. Acad. Sci. USA 2004, 101, 3747–3752. [Google Scholar] [CrossRef] [PubMed] [Green Version]
- Mahyar, H.; Hasheminezhad, R.; Ghalebi, E.; Nazemian, A.; Grosu, R.; Movaghar, A.; Rabiee, H.R. Compressive sensing of high betweenness centrality nodes in networks. Phys. A Stat. Mech. Its Appl. 2018, 497, 166–184. [Google Scholar] [CrossRef]
- Said, A.; Abbasi, R.A.; Maqbool, O.; Daud, A.; Aljohani, N.R. CC-GA: A clustering coefficient based genetic algorithm for detecting communities in social networks. Appl. Soft Comput. 2018, 63, 59–70. [Google Scholar] [CrossRef]
- Berahmand, K.; Bouyer, A.; Samadi, N. A new centrality measure based on the negative and positive effects of clustering coefficient for identifying influential spreaders in complex networks. Chaos Solitons Fractals 2018, 110, 41–54. [Google Scholar] [CrossRef]
- Roy, S.; Xue, M.; Sridhar, B. Vulnerability metrics for the airspace system. In Proceedings of the 2017 FAA/Eurocontrol Air Traffic Management Research and Development Seminar, Seattle, WA, USA, 29 June 2017. [Google Scholar]
- Hébert-Dufresne, L.; Allard, A.; Young, J.-G.; Dubé, L.J. Global efficiency of local immunization on complex networks. Sci. Rep. 2013, 3, 1–8. [Google Scholar] [CrossRef] [PubMed] [Green Version]
- Veremyev, A.; Prokopyev, O.A.; Boginski, V.; Pasiliao, E.L. Finding maximum subgraphs with relatively large vertex connectivity. Eur. J. Oper. Res. 2014, 239, 349–362. [Google Scholar] [CrossRef]
- Saleh, M.; Esa, Y.; Mohamed, A. Applications of Complex Network Analysis in Electric Power Systems. Energies 2018, 11, 1381. [Google Scholar] [CrossRef] [Green Version]
- Du, W.B.; Liang, B.Y.; Hong, C.; Lordan, O. Analysis of the Chinese provincial air transportation network. Phys. A Stat. Mech. Its Appl. 2016, 465, 579–586. [Google Scholar] [CrossRef] [Green Version]
- Wang, I.L.; Johnson, E.L.; Sokol, J.S. A multiple pairs shortest path algorithm. Transp. Sci. 2005, 39, 465–476. [Google Scholar]
- Zaidi, F. Small world networks and clustered small world networks with random connectivity. Soc. Netw. Anal. Min. 2013, 3, 51–63. [Google Scholar] [CrossRef] [Green Version]
- Yazdani, A.; Otoo, R.A.; Jeffrey, P. Resilience enhancing expansion strategies for water distribution systems: A network theory approach. Environ. Model. Softw. 2011, 26, 1574–1582. [Google Scholar] [CrossRef]
- Nie, T.; Guo, Z.; Zhao, K.; Lu, Z.-M. New attack strategies for complex networks. Phys. A Stat. Mech. Its Appl. 2015, 424, 248–253. [Google Scholar] [CrossRef]
- Cohen, R.; Havlin, S. Complex Networks: Structure, Robustness and Function; Cambridge University Press: Cambridge, UK, 2010. [Google Scholar]
- Zanin, M.; Sun, X.; Wandelt, S. Studying the topology of transportation systems through complex networks: Handle with care. J. Adv. Transp. 2018, 2018, 3156137. [Google Scholar] [CrossRef] [Green Version]
- Xia, Y.; Hill, D.J. Attack vulnerability of complex communication networks. IEEE Trans. Circuits Syst. II Express Briefs 2008, 55, 65–69. [Google Scholar] [CrossRef]
- Perea, F.; Puerto, J. Revisiting a game theoretic framework for the robust railway network design against intentional attacks. Eur. J. Oper. Res. 2013, 226, 286–292. [Google Scholar] [CrossRef] [Green Version]
- Cook, A.; Blom, H.A.; Lillo, F.; Mantegna, R.N.; Micciche, S.; Rivas, D.; Zanin, M. Applying complexity science to air traffic management. J. Air Transp. Manag. 2015, 42, 149–158. [Google Scholar] [CrossRef] [Green Version]
- Muñiz, A.S.G.; Raya, A.M.; Carvajal, C.R. Key sectors: A new proposal from network theory. Reg. Stud. 2008, 42, 1013–1030. [Google Scholar] [CrossRef] [Green Version]
- Boccaletti, S.; Buldú, J.; Criado, R.; Flores, J.; Latora, V.; Pello, J.; Romance, M. Multiscale vulnerability of complex networks. Chaos Interdiscip. J. Nonlinear Sci. 2007, 17, 043110. [Google Scholar] [CrossRef] [Green Version]
- Ash, J.; Newth, D. Optimizing complex networks for resilience against cascading failure. Phys. A Stat. Mech. Its Appl. 2007, 380, 673–683. [Google Scholar] [CrossRef]
- Dobson, I.; Carreras, B.A.; Lynch, V.E.; Newman, D.E. Complex systems analysis of series of blackouts: Cascading failure, critical points, and self-organization. Chaos Interdiscip. J. Nonlinear Sci. 2007, 17, 026103. [Google Scholar] [CrossRef] [PubMed]
- Bellingeri, M.; Bevacqua, D.; Scotognella, F.; Cassi, D. The heterogeneity in link weights may decrease the robustness of real-world complex weighted networks. Sci. Rep. 2019, 9, 10692. [Google Scholar] [CrossRef] [PubMed] [Green Version]
- Bellingeri, M.; Bevacqua, D.; Scotognella, F.; Alfieri, R.; Cassi, D. A comparative analysis of link removal strategies in real complex weighted networks. Sci. Rep. 2020, 10, 3911. [Google Scholar] [CrossRef] [Green Version]
- Wandelt, S.; Lin, W.; Sun, X.; Zanin, M. From Random Failures to Targeted Attacks in Network Dismantling. Reliab. Eng. Syst. Saf. 2021, 218, 108146. [Google Scholar] [CrossRef]
Figure 1.
(a) Structure of North-China-Controlled Airspace Sector; (b) Constructed Network of North-China-Controlled Airspace Sector.
Figure 1.
(a) Structure of North-China-Controlled Airspace Sector; (b) Constructed Network of North-China-Controlled Airspace Sector.

Figure 2.
Histogram of Sector Degree.

Figure 3.
(a) Cumulative distribution of intensity; (b) cumulative distribution of betweenness.

Figure 4.
Correlation analysis of the degree, intensity, agglomeration coefficient, intermediate number, and other topological property indices of the North China airspace sector network. (a) Degree–average nearest neighbor degree (); (b) intensity–average nearest neighbor intensity; (c) degree–intensity; (d) degree–betweenness (); (e) degree–clustering coefficient (); (f) intensity–clustering coefficient; (g) intensity–betweenness; (h) betweenness–clustering coefficient ().


Figure 5.
(a) Trends of network global efficiency under different attack strategies; (b) trends of relative size of connected components under different attack strategies.
Figure 5.
(a) Trends of network global efficiency under different attack strategies; (b) trends of relative size of connected components under different attack strategies.

Table 1.
Indicators of statistical characteristics of North China sector network.
| No. | Sector | Degree | Intensity | Betweenness | Clustering Coefficient |
|---|---|---|---|---|---|
| 1 | Hohhot01 | 4 | 283 | 34.08 | 0.33 |
| 2 | Hohhot02 | 3 | 261 | 6.07 | 0.33 |
| 3 | Taiyuan01 | 3 | 447 | 20.15 | 0.33 |
| 4 | Taiyuan02 | 5 | 475 | 58.50 | 0.25 |
| 5 | Taiyuan03 | 3 | 256 | 25.75 | 0.33 |
| 6 | Taiyuan04 | 7 | 272 | 53.43 | 0.57 |
| 7 | Beijing01 | 8 | 823 | 156.03 | 0.4 |
| 8 | Beijing02 | 5 | 1923 | 51.81 | 0.55 |
| 9 | Beijing03 | 6 | 626 | 74.43 | 0.43 |
| 10 | Beijing04 | 7 | 708 | 103.47 | 0.33 |
| 11 | Beijing05 | 4 | 343 | 22.93 | 0.5 |
| 12 | Beijing06 | 4 | 406 | 13.59 | 0.5 |
| 13 | Beijing07 | 3 | 378 | 3.74 | 0.67 |
| 14 | Beijing08 | 3 | 924 | 6.33 | 0.33 |
| 15 | Beijing09 | 5 | 884 | 32.16 | 0.4 |
| 16 | Beijing10 | 4 | 636 | 24.66 | 0.5 |
| 17 | Beijing11 | 6 | 623 | 51.92 | 0.43 |
| 18 | Beijing12 | 3 | 456 | 2.72 | 0.67 |
| 19 | Beijing13 | 4 | 544 | 20.99 | 0.5 |
| 20 | Beijing14 | 3 | 578 | 2.16 | 0.67 |
| 21 | Beijing15 | 4 | 1203 | 12.96 | 0.5 |
| 22 | Beijing16 | 4 | 1656 | 12.42 | 0.5 |
| 23 | Beijing17 | 4 | 1320 | 8.67 | 0.67 |
Table 2.
Intentional attack strategies.
| Type of Intentional Attack | Description |
|---|---|
| Degree priority | Sort the network nodes by degree from high to low, and sequentially remove the nodes and associated edges from the network. |
| Betweenness priority | Sort the network nodes by betweenness from high to low, and sequentially remove the nodes and associated edges from the network. |
Table 3.
Impact of attacks on critical sectors in North China sector network.
| Critical Sector | Network Efficiency | Potential Critical Sector | Betweenness | Betweenness Change Rate (%) |
|---|---|---|---|---|
| Beijing01 | 0.4454 | Hohhot01 | 54.42 | 159.7 |
| Beijing04 | 0.435 | Beijing02 | 81.67 | 157.62 |
| Beijing03 | 0.4437 | Beijing05 | 46.78 | 204.01 |
| Taiyuan02 | 0.4193 | Taiyuan01 | 220.62 | 1094.89 |
Disclaimer/Publisher’s Note: The statements, opinions and data contained in all publications are solely those of the individual author(s) and contributor(s) and not of MDPI and/or the editor(s). MDPI and/or the editor(s) disclaim responsibility for any injury to people or property resulting from any ideas, methods, instructions or products referred to in the content. |
© 2023 by the authors. Licensee MDPI, Basel, Switzerland. This article is an open access article distributed under the terms and conditions of the Creative Commons Attribution (CC BY) license (https://creativecommons.org/licenses/by/4.0/).
Share and Cite
MDPI and ACS Style
Liang, H.; Zhang, S.; Kong, J. Study on Characteristics and Invulnerability of Airspace Sector Network Using Complex Network Theory. Aerospace 2023, 10, 225. https://doi.org/10.3390/aerospace10030225
AMA Style
Liang H, Zhang S, Kong J. Study on Characteristics and Invulnerability of Airspace Sector Network Using Complex Network Theory. Aerospace. 2023; 10(3):225. https://doi.org/10.3390/aerospace10030225
Chicago/Turabian StyleLiang, Haijun, Shiyu Zhang, and Jianguo Kong. 2023. "Study on Characteristics and Invulnerability of Airspace Sector Network Using Complex Network Theory" Aerospace 10, no. 3: 225. https://doi.org/10.3390/aerospace10030225
Note that from the first issue of 2016, this journal uses article numbers instead of page numbers. See further details here.