

The Introduction of Sustainable Aviation Fuels—A Discussion of Challenges, Options and Alternatives

German Aerospace Center (DLR), Institute of Air Transport and Airport Research, Linder Höhe, 51147 Cologne, Germany
Aerospace 2023, 10(3), 218; https://doi.org/10.3390/aerospace10030218
Submission received: 18 January 2023
/
Revised: 20 February 2023
/
Accepted: 22 February 2023
/
Published: 25 February 2023
(This article belongs to the Special Issue Selected Papers from the 4th International Aviation Management Conference)
Abstract
:The aviation industry is challenged to reduce its climate impact. The introduction of sustainable aviation fuels (SAF) is, among other policy instruments such as the European Emissions Trading Scheme, an option favored by policymakers in Europe to achieve this objective. These fuels feature substantially reduced carbon life-cycle emissions in comparison to fossil fuels. In Europe, a mandatory quota for the use of sustainable fuels will most likely be introduced, starting in the year 2025. The introduction of a blending mandate by governments and the European Commission is associated with a range of challenges. The purpose of this paper is to discuss the economics of climate change mitigation in aviation and the role SAFs can play. The economic issues associated with the introduction of SAFs are analyzed, with a particular focus on the European Commission’s proposal for a blending mandate. Several suggestions for improvement are discussed. Furthermore, alternatives to SAFs are presented and evaluated.
1. Introduction
The global community is challenged to limit the impacts of climate change to a tolerable level. With the Paris Agreement concluded in 2015, it is the legally binding aim to limit the average global temperature increase “to below 2 °C above pre-industrial levels” [1]. Promising strategies have been developed in various sectors of the economy to reduce CO2 emissions, e.g., by scaling up renewable energies or the direct use of electricity in ground transport. As a global trend, the share of renewable energies has increased to more than 28% in 2021, with a particularly strong in increase in (geographical) Europe, where renewables exceed 40% of electricity production [2]. As another policy, various countries have enacted laws that will prohibit the registration of new passenger cars with internal combustion engine [3]. These strategies are considered to achieve CO2 emissions reductions at relatively low costs [4]. The aviation industry is particularly challenged, as it is a hard-to-abate sector, where the replacement of the energy carrier by a low-carbon alternative is particularly difficult. Jet fuel, as a mixture of different hydrocarbons, features optimal characteristics in terms of performance, energy density and operability [5]. However, it releases CO2, which was removed from the biosphere millions of years ago and safely stored underground. Other energy carriers either feature an energy density which is too low (e.g., batteries, extensively analyzed in [6]) or, like hydrogen, would require a complete change of the aviation system, including fuel and airport infrastructure as well as the expensive and time-consuming development and certification of new aircraft technology [7]. Hence, the introduction of sustainable drop-in hydrocarbon aviation fuels (SAF) from non-fossil origins is considered by many stakeholders as a viable strategy to decarbonize aviation in the short to medium term. Moreover, SAF has the potential to reduce the non-CO2 effects of aviation, which have recently received a lot of attention, also due to their inclusion in the EU ETS monitoring, report and verification from 2025 onwards [8]. Ref. [9] estimates that the total climate impact of aviation can be up to four times the effect of CO2 alone. Therefore, it is of utmost importance to consider this particular aspect in order to reduce the climate impact of aviation. Ref. [10] shows that with targeted use of a 50% SAF blend for the 2% of flights responsible for the most highly warming contrails reduces total energy forcing caused by aviation by 6%. As an additional benefit, SAF with low aromatics and low Sulphur content can improve local air quality [11].
This paper discusses the economic challenges of introducing SAF, such as the economic efficiency of this decarbonization strategy, societal and political implications and the potential impacts of regulatory instruments designed to promote the market uptake of these fuels. Furthermore, the topic of SAF availability is covered. The discussion is carried out against the background of the European policy objective of a mandatory blending quota to be introduced by 2025 [12]. The purpose is to provide a comprehensive, multi-disciplinary analysis, combining economic literature, with the results of traffic forecasting and chemical engineering literature in order to conduct a holistic assessment of SAF usage in Europe.
The structure of the paper is as follows: to set the scene, the theory and practice of the reduction of carbon emissions in the aviation sector is discussed, which has led to the regulatory pressure for the introduction of sustainable aviation fuels in Europe. Subsequently, the plans of the European Commission for a blending mandate are briefly outlined. This is followed by an analysis of the economic and competitive impacts of a blending mandate and a discussion of the potential alternatives. The paper concludes with a discussion of the alternatives for the reduction of climate impact in aviation and a summary of the main findings.
2. Reducing Carbon Emissions in Aviation in Theory and Practice
Climate change, which is primarily caused by CO2 emissions, is a classic example of a negative externality that has been known to economists at least since the work of Pigou [13]. Negative externalities lead to market failure if they are not considered in the price setting process. One approach to re-instate economic efficiency is to place a uniform price on CO2 emissions, aligning private and social costs of emissions. Pigou proposed environmental taxes that would cover externalities. Another approach is assigning property rights to the atmosphere as “dump” for carbon emissions, following the property rights theory of Coase [14]. The right to release carbon dioxide emissions is then securitized in tradable units, also called permits or allowances. Under economically optimal conditions, the total number of allowances in such a cap-and-trade scheme is limited to a quantity where marginal damage costs equal marginal abatement costs. With this a socially efficient level of emissions is achieved [15]. Putting a price tag on emissions will send a price signal to emitters, who then have the choice of either reducing emissions (if this is cheaper than the price of an allowance) or to continuing to emit (if abatement costs are higher than the value of allowances). The two approaches (taxes vs. cap-and-trade) feature similarities and differences, which are widely discussed in the economic literature (e.g., [16,17]).
As straightforward as it looks on paper, implementation of such a first-best solution to reinstate economic efficiency, in reality, is rather difficult. Even within most jurisdictions, carbon emissions are not priced uniformly—in Germany, for example, there is a mix of taxes, carbon prices and emissions trading. Aviation is part of the EU-ETS, where CO2 prices are above EUR 90/CO2 in 2022 [18], while in the newly introduced national emission trading scheme fossil fuels used for heating and ground transport have an initial price of EUR 25/CO2 [19]. This leads to unequal pricing for each ton of carbon, depending on the sector in which CO2 is emitted. The situation of unequal CO2 pricing across different sectors is not uncommon, as an analysis of the OECD shows. For instance, in the Netherlands carbon pricing ranges from zero to more than EUR 350 with only 34.8% of total emissions priced above EUR 60/CO2, depending on the sector [20]. In Spain, as another example, OECD reports that only 27.8% of greenhouse gas emissions are priced above EUR 60, with an overall span of zero to EUR 250 [21].
In the aviation domain, the international dimension complicates a practical implementation of a uniform carbon price even more. While in Europe, carbon emissions of flights within the European Economic Area are strictly regulated in a cap-and-trade scheme (EU ETS), the majority of emissions in aviation remain virtually unregulated. Doubts are raised as to whether CORSIA, the global carbon offsetting and reduction scheme for international aviation, meets the criteria of economic efficiency in climate protection towards achievement of the objectives outlined in the Paris Agreement ([22,23]; [24]). The scheme does neither strive to reduce emissions below the baseline of the year 2019/2020 nor are the offsets perceived to effectively contribute to the removal of CO2 from the atmosphere. The complexity of assessing the quality of offsets is, for instance, explained in [25].
As the existing instruments can be considered as insufficient to effectively reduce the climate impact of aviation, pressure from the European society and politics on the aviation sector has intensified in recent years. This development has become an obvious business risk to the growth of the aviation industry, as sustainable travel options and the reduction of air trips for business and private purposes have become widespread topics in society. Various NGOs and initiatives try to convince the public to minimize the use of air transport [26] or to shift their modal choice to rail [27]. The latest step by policymakers in the European Union to implement stricter rules for aviation’s impact on the climate was published in December 2022, when the European Commission, the European Parliament and the Council agreed to end free allocation and a further reduction of allowances, as well as the establishment of a monitoring system for the non-CO2 effects of aviation [8].
One topic in the focus of public attention is the potential of SAF to reduce the climate impact of aviation. Life cycle CO2 emissions of SAF depend on the feedstock and conversion pathway. An overview is provided in Table 1. While some production processes, under consideration of full lifecycle emissions and the uncertainty concerning parameters (such as land use change), can result in higher emissions than the fossil baseline [28], a wide range of biomass feedstocks and conversion processes can reduce carbon dioxide equivalents. Power-to-liquid fuels, which use renewable electricity to capture CO2 from the atmosphere and produce green hydrogen as a feedstock, also achieve a substantial life cycle CO2 reduction, although not being completely carbon neutral due to fossil resources being used in the value chain.
Given the high potential for emissions reductions compared to fossil fuel, legislators on national and European level have started drafting regulations prescribing the use of SAF in future by mandatory quota regulations [12].
3. The European Commission’s Proposal for a SAF Blending Mandate
3.1. Outline
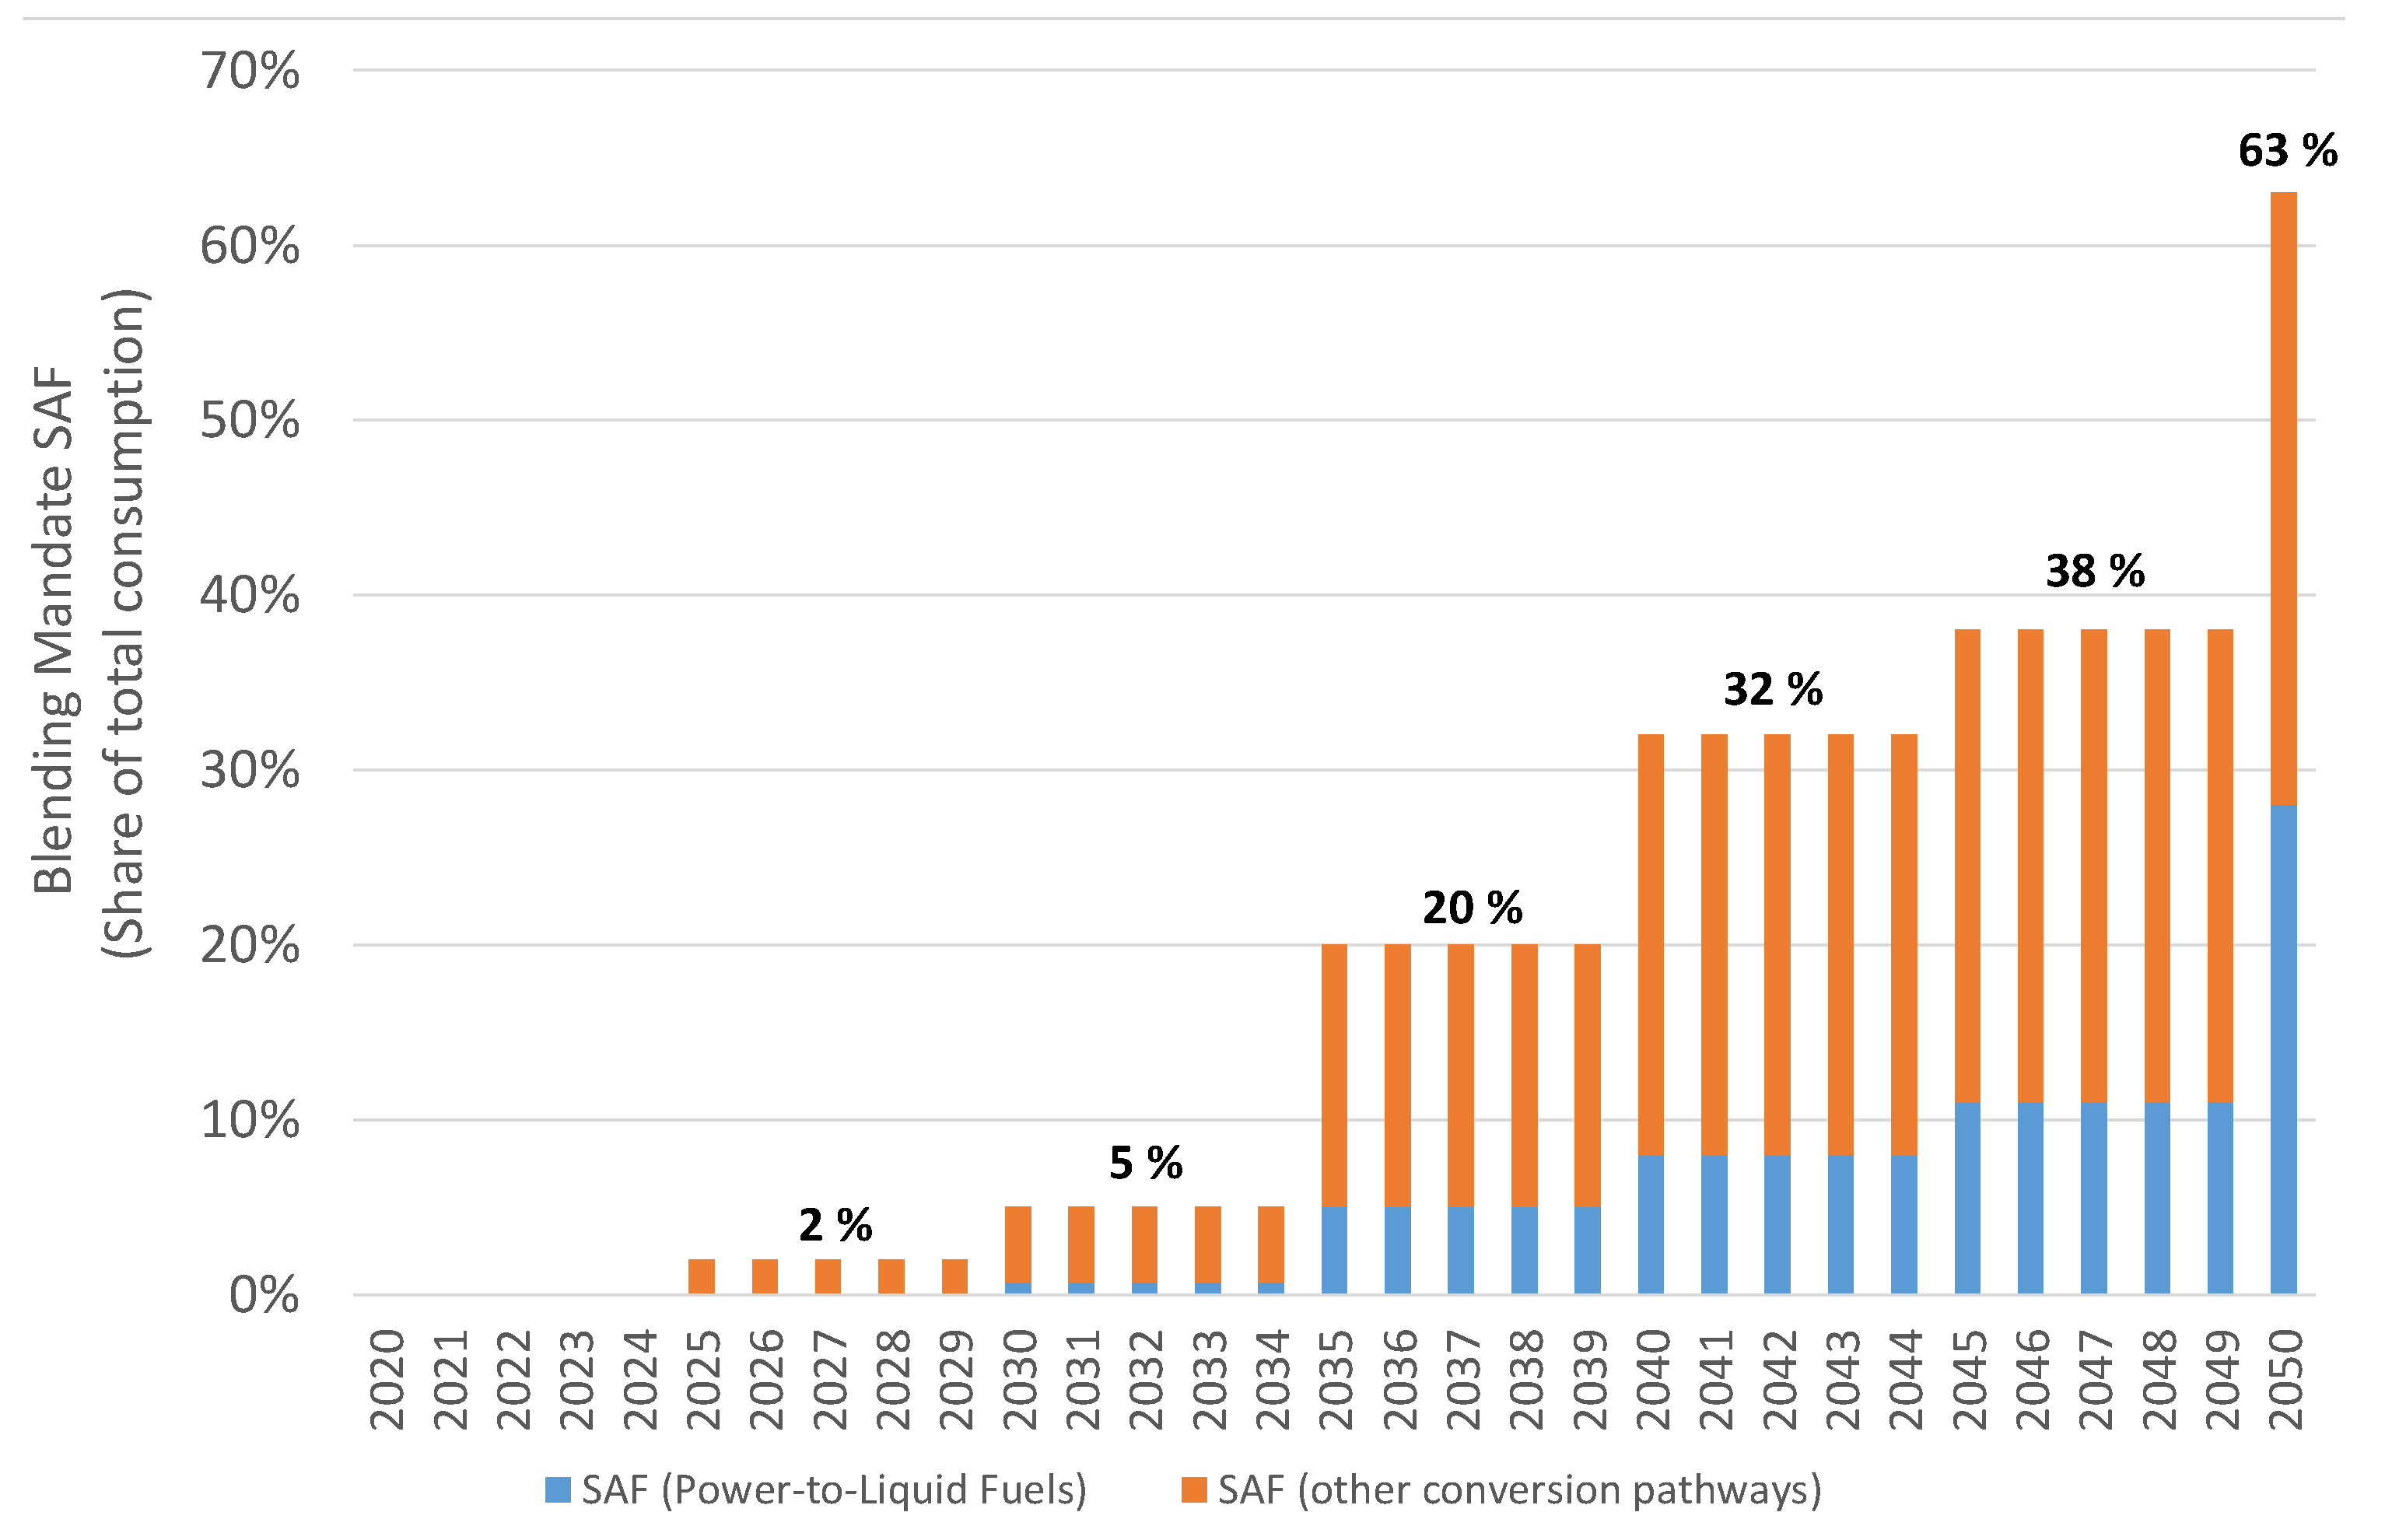
In July 2021, the European Commission published its proposal ReFuelEU Aviation [12] for the introduction of a SAF blending mandate as part of the “Fit for 55 package” under the European Green Deal. With this step, the introduction of SAF in Europe is about to be harmonized, as various European governments had previously introduced mandatory SAF quotas on a national level. The European Commission’s proposal stipulates that a growing share of SAF, from initially 2% in the year 2025 up to 63% in the year 2050, must be used by all aircraft operators taking off from any airport within the European Economic Area with more than one million passengers or 100,000 tons of freight. In order to promote the production and use of power-to-liquid fuels, which are currently less technologically advanced than the production of fuels from biomass, a sub-quota is intended to gradually increase from 0.7% of total aviation fuel consumption in 2030 to 28% in 2050.
The proposal does not include provisions aimed at bridging the cost differential between fossil fuels and SAF, a major concern of airlines who fear that the cost differential will severely impact their competitiveness. The ambitious blending quota also poses technological challenges to the upscaling of SAF production.
In order to estimate total energy demand of aviation in Europe, a forecasting model has been applied, which is extensively described in [30,31]. The model includes a module for forecasting passenger demand and flight movements based on developments such as GDP/capita, population, fuel prices and airport capacity constraints. The traffic forecast in combination with the base year aircraft fleet is then processed by a fleet module. This module considers aircraft retirements and available aircraft types with their entry-into-service and end-of-production dates in order to model the number of flight movements by aircraft type and airport pair. With this list, a flight performance tool calculates fuel consumption for each combination of aircraft type and airport pair. As a result, the fuel demand for each airport can be summarized.
3.2. Discussion of SAF Availability
The proposed blending mandate with a mandatory SAF quota of up to 63% in the year 2050 leads to the question of whether SAF will become available in sufficient quantities over time.
SAF can only be used if it is produced with certified conversion processes. Currently, seven conversion pathways (plus two co-processing pathways) are certified as shown in Table 2. Further processes, which would extend feedstock availability and/or increase the flexibility for conversion pathways are about to be certified in the near future. Among these are for instance methanol-to-jet and hydrothermal liquefaction.
Currently, conversion pathways relying on biomass are most advanced, with the HEFA (hydroprocessed esters and fatty acids) process estimated to be at a TRL of 9 [34]. Several high-capacity projects using the HEFA are about to be implemented. For instance, Austrian energy company OMV expects to increase SAF production capacity from used cooking oil at their refinery in Vienna to 700,000 t per year [35]. However, used cooking oil as a feedstock is limited in availability and the current high demand as feedstock for SAF has already led to a price increase from EUR 500/t in 2018 to EUR 1120/t in the first half of 2022 [36]. This leads to the curious fact that used cooking oil is 60% more expensive than jet fuel. Used cooking oil is already being used today for the production of biodiesel, so a new competition for usage either in ground transport or aviation is observed, as supply will remain limited. Other readily available feedstocks include vegetable oils, which are in direct competition for use as food or as feedstock for SAF. Vegetable oils also are highly disputed when it comes to sustainability issues, as for instance tropical rainforests are cleared for palm oil plantations. Moreover, as with any agricultural product, yields and prices are highly fluctuating, as the price for sunflower oil has been in a range between USD 730 and USD 2361 per ton from 2020 to 2022 [37]. Another conversion pathway that has a high degree of technological maturity is the Fischer–Tropsch process (estimated at a TRL of 6–8 by [34]), in which carbonaceous feedstocks such as woody biomass are gasified and liquid hydrocarbon fuels can be produced via the intermediate step of syngas generation.
Estimations of biomass available for jet fuel production have a wide range of uncertainty, as harvest yields are dependent on weather conditions, competing usage has to be considered and the scale up of production facilities is uncertain. Ref. [38] suggest that the maximum SAF production for Europe in the year 2030 will be 3.4 million tons and it is estimated that there is a sufficient resource base of biomass and flue gases to theoretically produce 12.2 million tons a year of SAF in Europe.
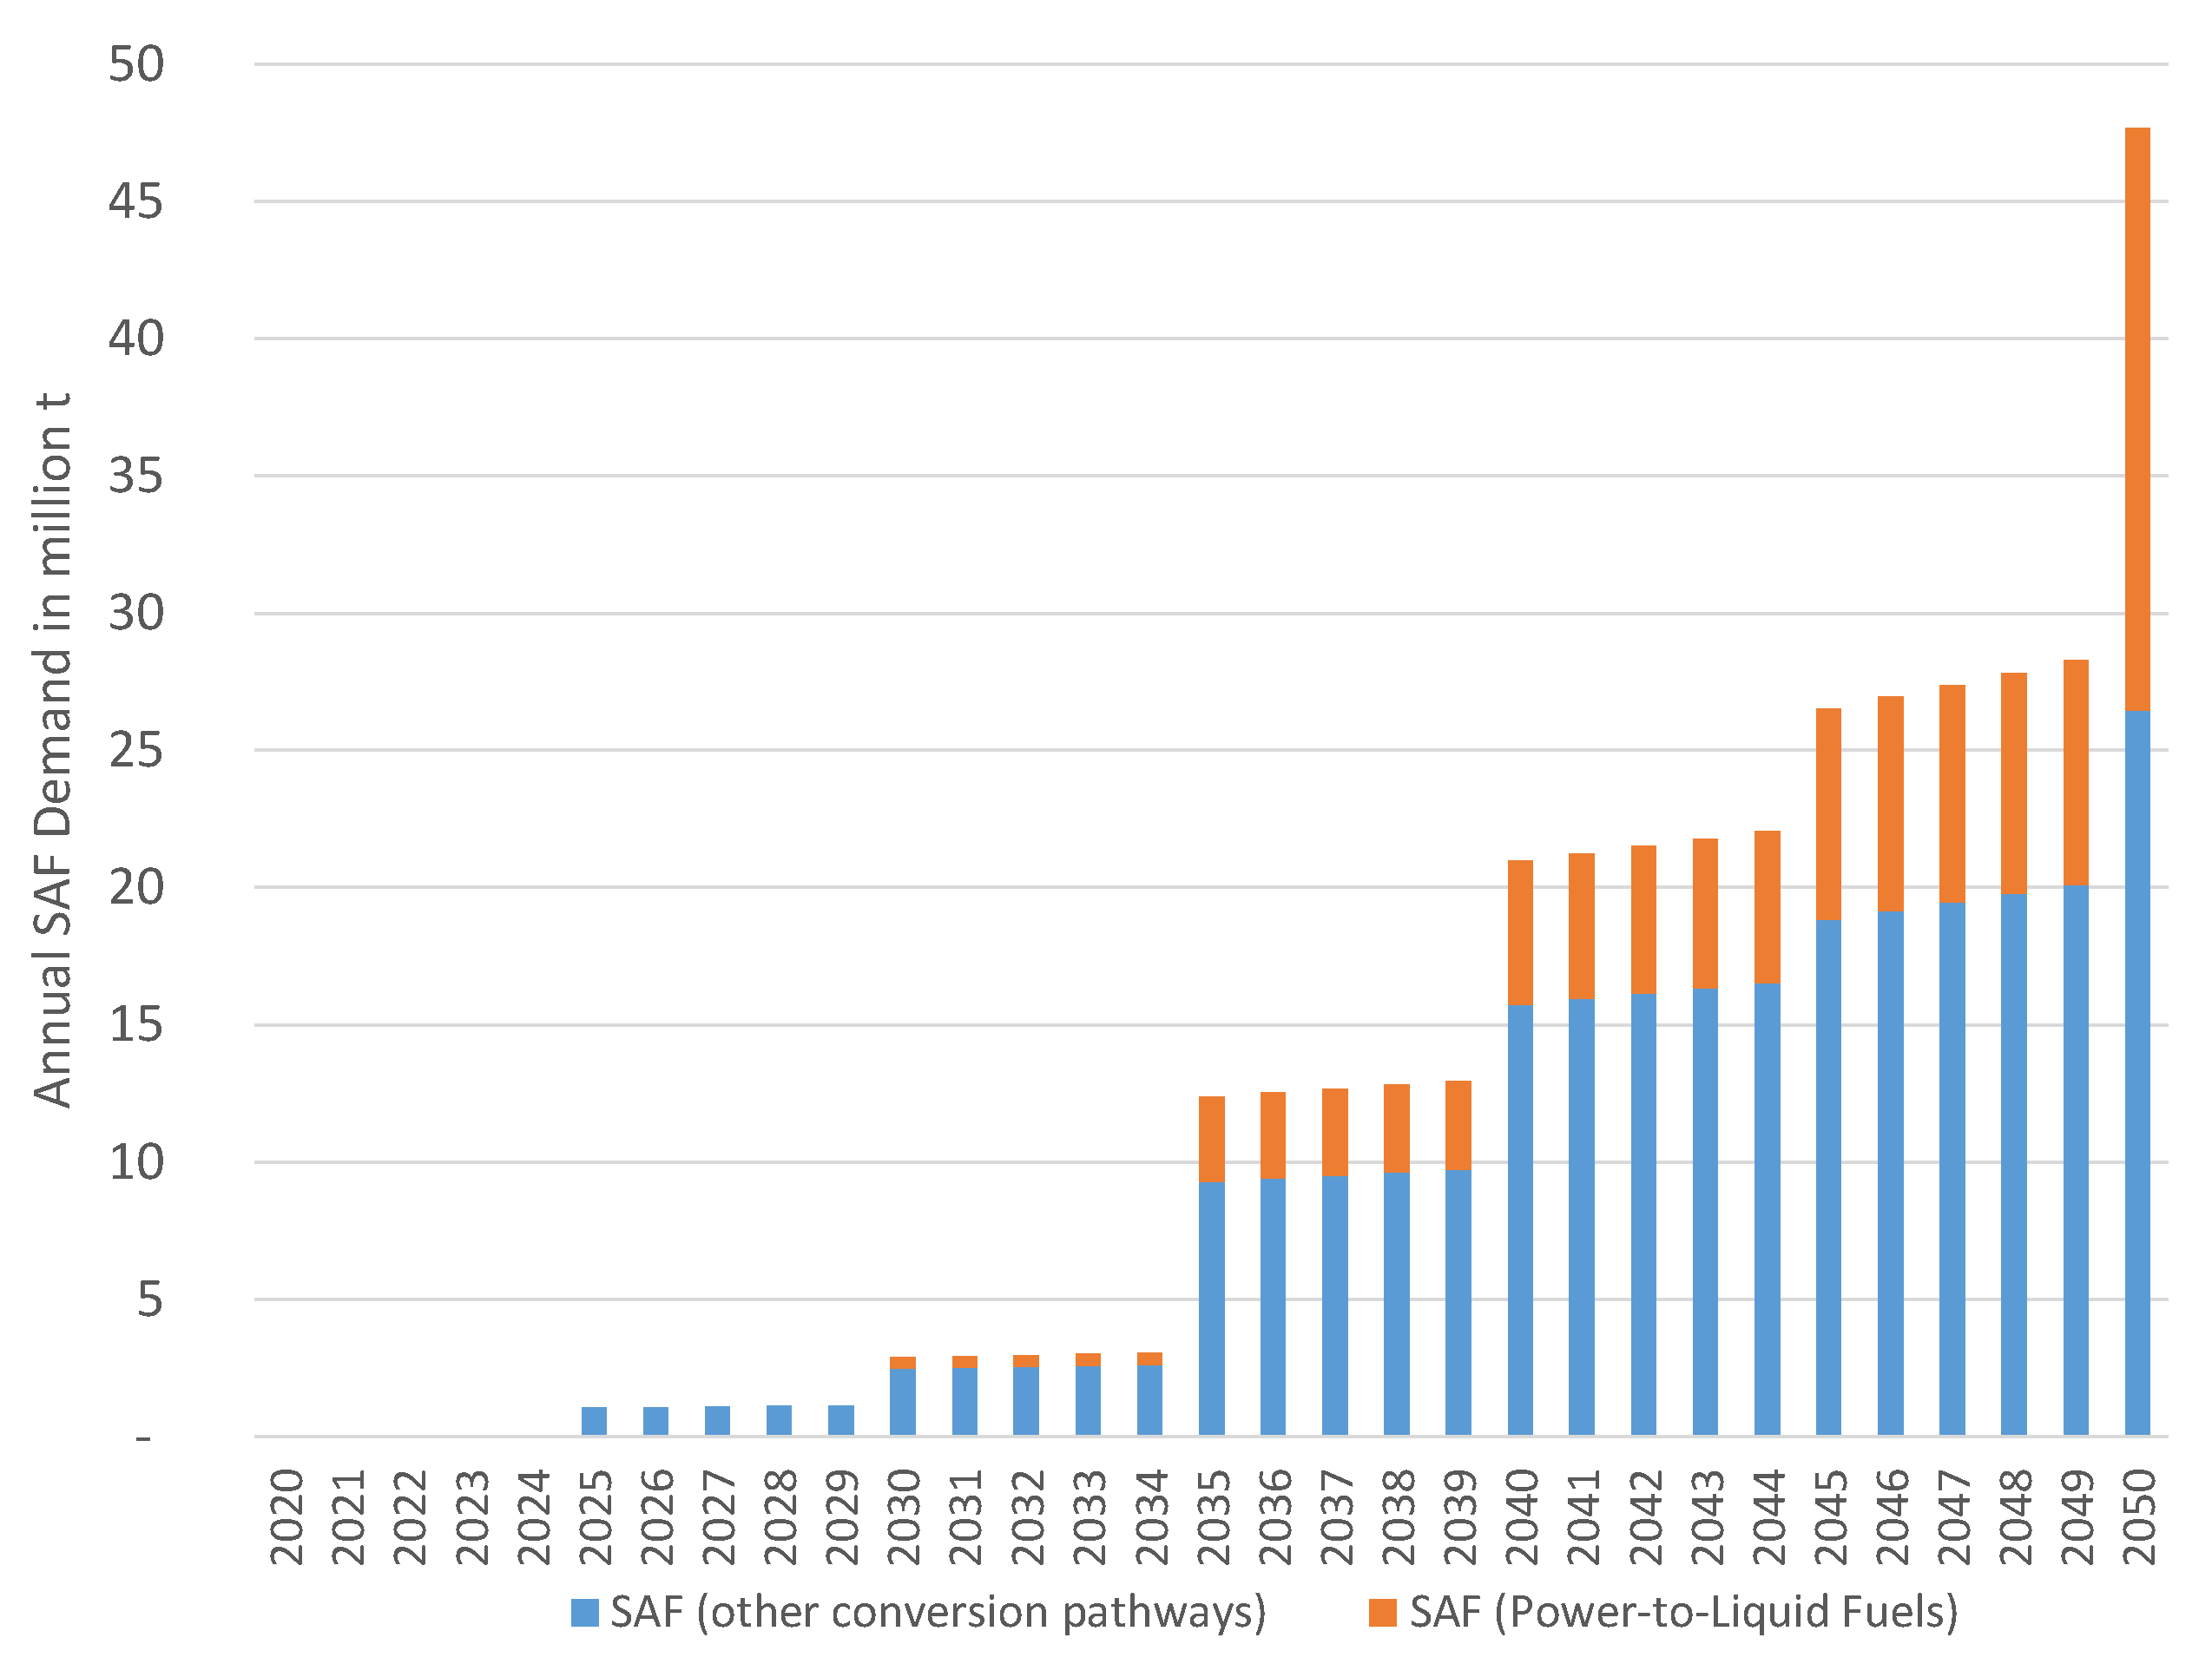
Moreover, 3.4 million t of SAF are likely to be sufficient to meet the blending quota until 2034, but very likely not after that when the quota will increase steeply, with a potential SAF demand estimated at 47 million tons in 2050. Other studies on biomass availability draw a more optimistic picture. For instance, ref. [39] have estimated the mobilizable potential of biomass in Germany. Agricultural by-products, such as animal manure or cereal straw have a potential in a range of 11.1 to 26.2 million tons, forestry by-products range from -0.8 to 10.9 million tons. However, it has to be noted that the conversion rates of feedstock to SAF from biomass is relatively low. Depending on the type of feedstock, on average only 0.1 to 0.2 kg of jet fuel can be produced from each kg of biomass [40]. If all the biomass that is not yet used for other purposes were used for the production of aviation fuel, there could be an average production potential of more than 2 million tons of SAF from biogenic sources in Germany alone. However, also in a global perspective, biomass availability remains critical, as shown by [41], where most of the scenarios under consideration yield only fractions of the fuel required by the aviation system.
It is therefore likely that the lion’s share of SAF production must be covered by power-to-liquid fuels, which would exceed the mandatory sub-quota in the long run. This, in turn, will require a massive scale-up of renewable electricity generation. As of 2021, renewable electricity sources provided 34.2% of electricity demand in the EU [42], while at the same time an exit from fossil electricity generation is an objective of the EU and its Member States. This is likely to result in competition for electricity from renewable sources, which is required to replace particularly lignite and coal in the near future. SAF produced by the power-to-liquid process requires further infrastructures, such as electrolyzers and direct air capture facilities. While for the former, also political strategies by the EU and its Member States exist [43] to scale up green hydrogen production capacities, it is still unclear if the latter can be scaled up at reasonable timescales and costs.
In any case, power-to-liquid fuels will be very energy-intensive. It is estimated that 42 kWh of electricity is required to produce one kilogram of power-to-liquid fuel [44], which contains, in the end, only 12 kWh of useable energy. This shows the relatively low conversion efficiency of the overall process, which is a strong argument against the widespread deployment of power-to-liquid fuels as long as electricity from renewable sources is not abundant.
If European SAF production from biomass could be extended to around 12 million tons per year as estimated by [38], 35 million tons of SAF from the power-to-liquid pathway will be required in the year 2050. In turn, this would result in 1470 TWh of renewable energy being required as input. This equals half of the total electricity generation in the European Union in 2020 [42]. The impact assessment of the ReFuelEU Aviation policy package [45] arrives at similar figures in relation to biofuel availability with feedstocks from the EU (12–13.5 million tons), but considers also biofuel imports (4–4.5 million tons). Since the impact assessment assumes a lower overall jet fuel demand in the EU in 2050, a requirement of up to 13 million tons of power-to-liquid fuels is estimated.
Regardless of the exact overall future jet fuel demand in Europe, these figures illustrate the challenge the industry is facing if the targeted SAF quotas are to be met.
3.3. Economic and Competitive Impacts
A mandate to use sustainable aviation fuels at rising quantities over time is likely to increase costs for airlines and, in case a shift on end-users is possible, ultimately for passengers and the shippers of air cargo.
Most forecasts estimate that SAF will be substantially more expensive than fossil fuel, even in the long run and when considering carbon pricing for conventional jet fuel. Cost estimations for biomass-based SAF range from USD 1–2/liter [40], costs for SAF produced with the power-to-liquid pathway are estimated in the order of USD 2–3/liter [44]. SAF price forecasts depend on a variety of assumptions concerning feedstock and electricity prices as well as assumptions on process efficiencies and the achievement of economies of scale. The SAF price estimations compare to less than 1 US-$/liter of conventional jet fuel in early 2023, plus 25 cents for carbon allowances for traffic within the European Economic Area.
Table 3 shows the relative share of fuel costs in total costs for selected European airlines prior to the COVID-19 pandemic. On average, fuel costs account for 21–34% of airline total costs. Hence, a doubling of fuel costs would ceteris paribus lead to a total cost increase in the same order of magnitude on average. Long-haul flights are potentially impacted more severely, as the share of fuel costs in these operations is typically higher than for short-haul flights.
Long-term cost impacts of SAF usage will at least partly be offset by more fuel-efficient aircraft and cost reductions for carbon allowances, which are mandatory for flights within the European Economic Area. Airlines will very likely have to pass on the additional costs to passengers and shippers of air cargo, as profitability in the industry is generally relatively low. However, one also has to note that the process of cost increases will occur gradually over a very long time span until 2050, so it is likely that both airlines and passengers can adapt accordingly without a severe supply or demand shock.
With a relatively high share of SAF likely to come from the power-to-liquid production pathway, enormous investments in renewable electricity generation will be required, in addition to the investments for the components of fuel production, such as electrolyzers, syngas processing, syncrude refining and potentially also CO2 direct air capture.
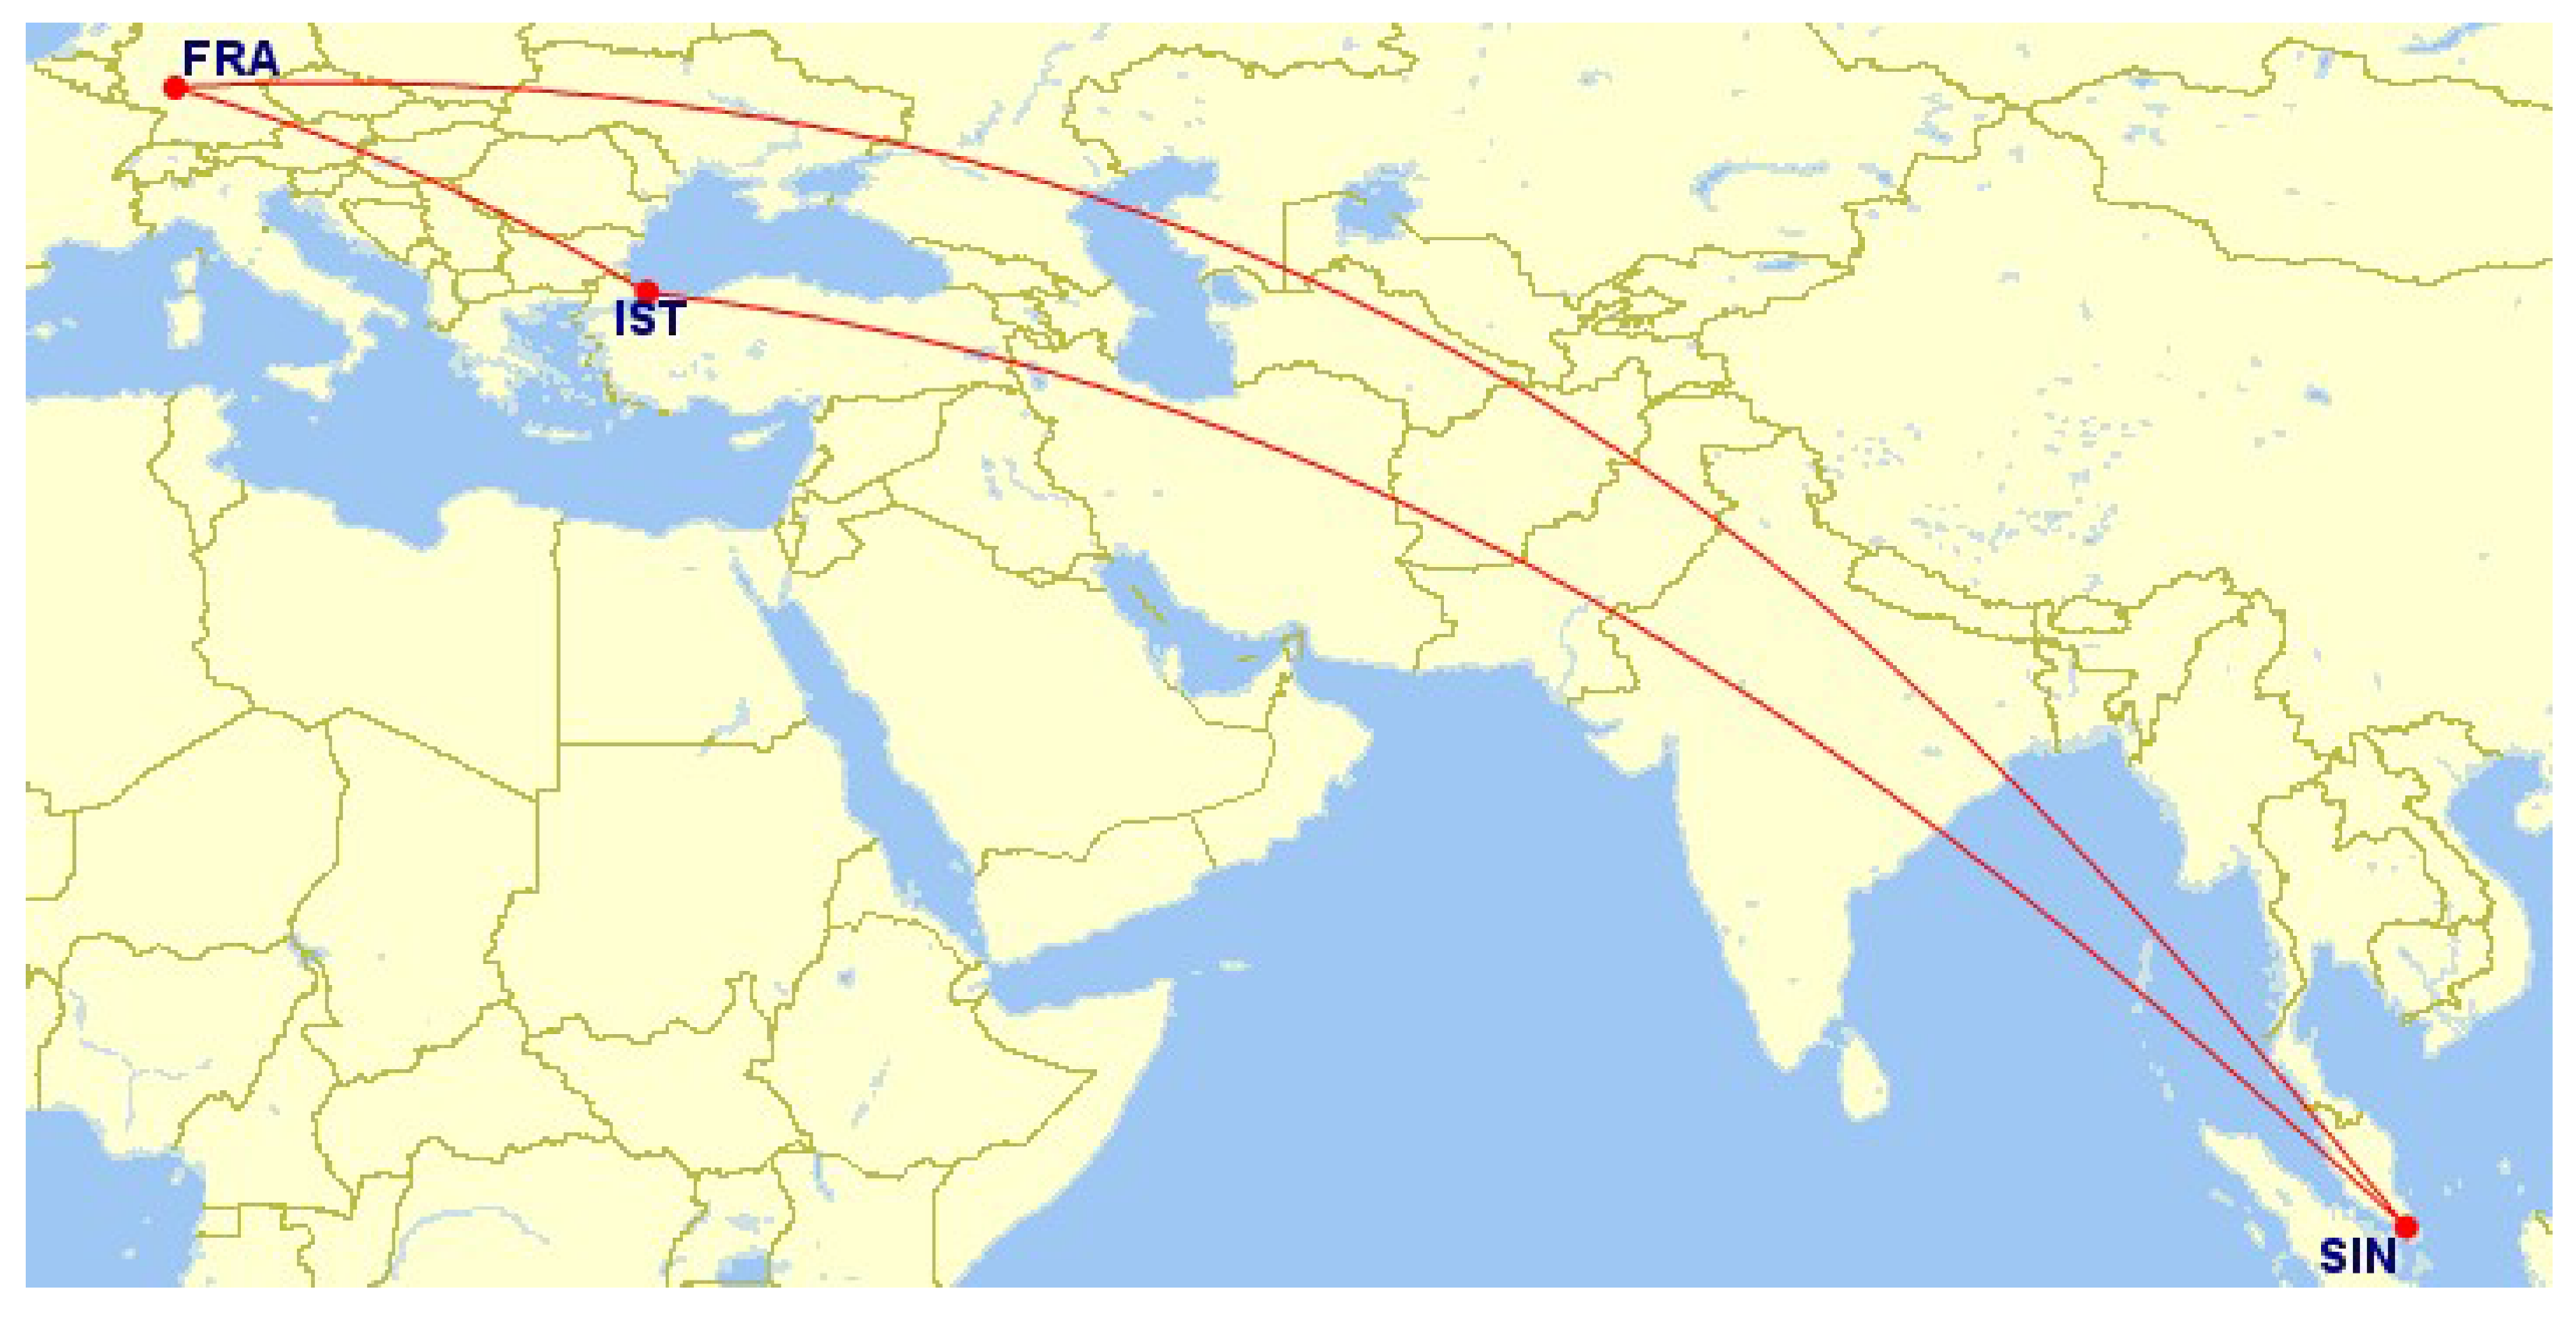
From a competitive point of view, European airlines fear a disadvantage predominantly in long-haul travel. Non-stop flights, e.g., from Europe to East Asia will be subject to the blending mandate for the full flight distance, affecting the European network airlines with direct services as well as the airlines from third-countries in the region, such as Korean Air, JAL, ANA, Singapore Airlines, Thai Airways and others. As an example, for an origin-destination itinerary from Frankfurt to Singapore (Figure 3), the full flight distance of a non-stop flight offered by Lufthansa or Singapore Airlines would be subject to the blending mandate, as the flight originates in the EU. In comparison, only 20% of the flight distance would be subject to the EU blending mandate for an itinerary Frankfurt-Istanbul-Singapore, as the longer flight segment from Istanbul to Singapore is not covered by EU legislation.
However, it should be noted that IATA, as the main industry organization, has committed to up to 65% SAF deployment by 2050 as part of its ‘Net Zero Strategy’ published at its annual general meeting in 2021 [51]. Hence, if airlines took this voluntary commitment seriously, competitive distortions would be minimal. All major network airlines competing in long-haul markets globally are members of IATA and should subscribe to this voluntary commitment.
In addition to the issue of long-haul itineraries and the competition with hubs and airlines outside the scope of the EU blending mandate, intra-EU holiday traffic (and destinations) could be affected by traffic flows to be shifted to non-EU locations. For instance, holiday traffic to Spain, Italy and Greece could be diverted to Tunisia or Turkey, where only the outbound segment is subject to the EU blending mandate, but not the return segment. This form of carbon leakage would undermine the effectiveness of the blending mandate. However, studies on the topic ([52,53]) conclude that the potential for a shift in demand and subsequent carbon leakage will be relatively small and the fears of industry stakeholders seem to be exaggerated. [54] argue that the potential shift of demand will be dependent on a wide range of factors, such as overall price level, brand perception and connection quality, which makes it difficult to assess the effects of passenger route and airline choice.
4. Further Design Options for the Introduction of SAF
4.1. Book-and-Claim Approach
A major issue with the proposal of the European Commission is that the SAF quota must be met at each European airport exceeding one million passengers or 100,000 tons of cargo. The uniform application of the blending mandate puts logistical challenges in the foreground, as SAF must be offered at the quota prescribed by the EU Regulation at each individual airport. This leads to potentially long transport distances from the SAF refineries, which is also associated with additional energy consumption and emissions. Alternatively, it is likely to be more efficient to concentrate SAF usage at airports close to the respective refineries. Under such a book-and-claim approach, airlines operating from airports with favorable access to SAF would exceed the quota, while airlines operating from airports with less favorable access would fall below the quota. Compensation could be achieved ex post via tradable certificates so that airlines that used a higher proportion of the more expensive fuel would be compensated. Such a scheme could also incentivize network airlines to invest in building larger SAF facilities at their hub, which could fulfil a large part of their network-wide SAF obligations. Such an approach is likely to be more efficient than the initial proposal of the European Commission, as it would reduce logistics costs and SAF transport emissions and incentivize larger SAF installations at major hubs. The use of SAF at major hubs with a high share of long-haul flights would achieve further benefits in the area of mitigation of non-CO2 effects [10].
4.2. Use of Aviation-Specific State Revenues for Subsidizing SAF Introduction
A key objective of the blending mandate is to create a market for SAF, which would otherwise not develop because of the cost differentials compared to fossil fuels. Private investment in SAF production is incentivized as there is no alternative for airlines but to purchase increasing quantities of SAF to meet the usage obligation. In this respect, it is not necessary to take additional accompanying measures to support the development of the SAF market. However, the aviation industry fears competitive distortions with a mandate prescribing the use of more expensive fuel. In order to reduce the cost impacts, various industry suggestions are discussed, which have in common the use of public funds to reduce the cost differential between SAF and fossil fuels. A main objective of the aviation industry is earmarking of public revenues (taxes, ETS auction revenues) from the aviation sector for the introduction of SAF. While limited earmarking is provided for in existing regulations, e.g., for revenues from the sale of ETS allowances, it does not exist by definition for tax revenues. There is no logical consequence that any taxes collected from aviation activities, such as air passenger duties, must be reallocated to the aviation sector. Such a recycling of revenues contravenes the “polluter pays principle” and also distorts the efficiency of resource allocation, as a higher price should signal the costly reduction of CO2 emissions in aviation and the resource consumption of SAF production. In case it is the political objective to reduce the costs of the introduction of SAF for the aviation industry, various instruments could be applied.
Contracts for differences are an efficient tool to create incentives for investments in technologies that are not yet competitive in terms of production costs. In such a contract, one party (typically a government branch) guarantees to take over the differential between production costs and market prices of SAF. The instrument is very well suited to overcome the initial obstacle for investments in SAF technology.
The historical experience with renewable energy projects such as wind and photovoltaic power generation has shown that production facilities constructed at an early stage will not be competitive in the medium to longer term. Between 2010 and 2020 the cost of photovoltaic installations has fallen by 81%, and that of wind power by more than 30% [55]. Nevertheless, such facilities must be built also at an early stage in order to achieve long-term learning curve effects. The advantage of contracts for difference is also the openness concerning technologies to be applied, as a tendering process could only prescribe a certain quantity of SAF with pre-defined life cycle carbon reductions as an objective, while tenderers can decide on their own which feedstock and production pathway is the most promising. In the end, the production pathways with the smallest difference between market price and production costs are determined in an order-of-merit approach.
Generally, it is likely that the price differential of the full quantity of SAF to be used in Europe cannot be covered by contracts for difference—if we assume a quantity of about 10 million tons annually in the year 2035 as shown in Figure 2, and an average price difference between SAF and fossil fuel of EUR 1500 per ton, public subsidies would amount to around EUR 15 billion annually. It is doubtful whether European governments would be willing to support the aviation sector by this scale. The majority of costs are likely to be ultimately borne by passengers and shippers of air cargo, which would be perfectly in line with the polluter-pays principle.
Another conceivable instrument would be a fossil fuel surcharge, which would be redistributed to subsidize SAF price differentials. Such an instrument could be constructed in analogy to the feed-in tariff in the German electricity sector, which was in force from 2000 to 2022. With this instrument, electricity consumers pay a surcharge that encourages investment in renewable energy production. With the help of the renewable energy surcharge, the share of electricity generated from renewable sources in Germany has grown over time to over 45% in 2020 [56]. A positive aspect of the surcharge is that the cost burden is theoretically evenly distributed over all users, while also competitive elements could be integrated, such as competitive tendering for subsidies to bring the most efficient SAF production pathways into the market. A central challenge in defining such a surcharge is setting the right level of incentives for SAF producers: If the incentive payment is too low, it would be unattractive to build up production capacities. If the level is too high, windfall profits will be generated, the cost burden on users will be excessive, and incentives to become more efficient in the production of SAF will be too small. The level of such a surcharge will be dependent to a large extent on the price differential between SAF and fossil fuel and the intended SAF quota. Assuming a price differential of EUR 1500 per ton in 2035 and EUR 1000 per ton in 2050, the quotas outlined in Figure 1 and SAF demand as shown in Figure 2, the surcharge would amount to EUR 375 per ton of fossil fuel in 2035 and EUR 1700 per ton of fossil fuel in 2050. In 2050, almost EUR 50 billion would have to be re-distributed. In order to relieve users, the surcharge could be subsidized by the state if revenues from taxes or the auctioning of CO2 allowances were made available for the introduction of the SAF. Overall, however, these results make it clear that the financial burden will be significant, regardless of who ends up bearing the costs.
Additional flanking measures that could be introduced are also subsidies on investments for research and development or loan guarantees for SAF production facilities in order to reduce the CAPEX cost share. In the USA, tax credits have been successfully applied in order to increase the use of biofuels in ground transport. In August 2022, the United States Senate approved a blender’s tax credit of between USD 1.25 to USD 1.75 per gallon of SAF in order to support the market uptake of SAF [57]. It is intended that this instrument will support the “Sustainable Aviation Fuel Grand Challenge”, with milestones of 3 billion gallons in 2030 and 35 billion gallons in 2050.
5. Alternatives to SAF
Due to societal and political pressure, aviation is forced to reduce its climate impacts. It should be the objective to achieve this at the lowest possible costs to stakeholders and the society as a whole. Hence, alternatives to SAF should also be considered in the public debate.
Alternatives in aircraft and propulsion technology are very unlikely to provide an effective solution for the climate footprint of aviation. Conventional aircraft have become more energy efficient in the past, but demand growth has outpaced any technological improvements, further increasing the climate impact of aviation [58]. Currently, alternative propulsion technologies are debated. However, it is likely that their contribution will be relatively small. Electric flight is likely to be limited to smaller aircraft with short ranges, which do not substantially contribute to overall aviation emissions. The study [59] has estimated that aircraft with 19 seats and less account for 0.08% and aircraft with 20–100 seats account for 4.3% of total CO2 emissions of aviation in the year 2020.
Hydrogen is a promising option, and a variety of projects are trying to bring the technology to market maturity. Liquid hydrogen has a sufficient energy density to power larger aircraft over commercially relevant ranges [60]. Nevertheless, hydrogen is associated with a number of drawbacks: First, new aircraft will need to be developed and certified. This will take under realistic assumptions at least until 2035 and then it will take at least another decade until a meaningful share of the global fleet consists of hydrogen aircraft. Hence, this technology will not immediately contribute to a reduction of aviation’s climate impact. Secondly, costs for the construction of hydrogen fuel infrastructure will be substantial. Due to the energy density requirements, hydrogen in aviation will have to be provided in liquid form, which requires it to be cooled down to −253 °C, which is energy-consuming and stresses pipeline and fuel tank materials involved. As it is likely that long-haul aviation will still be powered by hydrocarbon fuels in the future, airports would be required to operate a dual fuel system, with hydrogen and jet fuel being available at the same time. Thirdly, due to the likely limited range of hydrogen aircraft, only a comparably small share of conventional fuel is likely to be replaced by hydrogen. Ceteris paribus, estimations by [61] suggest that until 2050, about 16% of aviation’s carbon emissions can be reduced with the introduction of hydrogen aircraft.
Finally, a potential solution to overcome the climate impact of aviation is negative emissions. This would mean that aircraft operators using fossil fuel would be required to remove the carbon they caused from the atmosphere. This could also take the non-CO2 effects into consideration. Ref. [9] have estimated using GWP20 as climate metric that the total climate impact of aviation is four times the effect of CO2 alone. Under these assumptions, climate neutrality could be achieved by removing 12.6 t of CO2 from the atmosphere for every ton of fossil jet fuel being burned. The question of whether SAF or the continued use of fossil fuels in combination with negative emissions (carbon capturing and storage) will be more efficient will then depend on the relative prices of SAF and fossil fuels as well as the cost of carbon capturing and storage. Optimistic scenarios assume that the capturing CO2 from the ambient air and storing it safely will cost less than USD 140 US/t [62], although the span of estimations is high and ranges up to USD 1000/t. A key challenge will also be the scalability and energy consumption, as well as the time scale of a solution involving negative emissions in the form of direct air capture and carbon storage. While humanity faces the impacts of climate change already today, most of the climate-friendly technologies will become available only in the long run.
The contribution of these different solutions has also been quantified in the EUROCONTROL Aviation Outlook 2050 [63]. The authors of this report conclude that the evolution of conventional aircraft technology will contribute 17%, electric and hydrogen aircraft 2%, better air traffic management 8%, SAF 41% and other measures (such as market-based measures and negative emission technologies) 32% to CO2 reduction in 2050. Similar results are provided by the Waypoint 2050 study of the Air Transport Action Group [64]. In the baseline scenario, aircraft and engine technology will contribute 10% to CO2 reduction in 2050, operations and infrastructure 9%, SAF 5–31% (depending on its share of use) and market-based measures 49–76%. This underlines the importance of SAF and also the long-term need for market-based measures as well as technologies outside the aviation system such as carbon capture and storage.
6. Conclusions
This paper discussed the economic challenges associated with the introduction of sustainable aviation fuels in light of the proposal of the European Commission for a blending mandate to be applicable at all major airports in the European Union. Although the cost of sustainable aviation fuels makes this approach to CO2 reduction not economically efficient in the short term, there are a number of arguments in favor of this strategy. The key issue the aviation industry is facing is pressure from society and politics to reduce CO2 emissions in the aviation sector itself. For the introduction of SAF, different regulatory instruments can be applied. In the EU, a blending mandate is stipulated, which will ultimately impose costs on aviation users (passengers and shippers of cargo), if no flanking measures of support are added. The aviation industry pushes for earmarking of government revenues to be channeled into SAF production so that the costs for users will be reduced. The overall costs of the transition to SAF for the aviation sector depend to a large extent on the cost differential between SAF and fossil fuel and the quota prescribed in the blending mandate. For the EU, the demand for SAF is expected to be in the order of 47 million tons in the year 2050. However, no matter which stakeholder, in the end, has to bear the costs, the transition to SAF will be expensive, especially in the initial phase, when learning curve effects and economies of scale are not yet realized.
Funding
This research received no external funding.
Institutional Review Board Statement
Not applicable.
Informed Consent Statement
Not applicable.
Data Availability Statement
No new data were created or analyzed in this study. Data sharing is not applicable to this article.
Conflicts of Interest
The authors declare no conflict of interest.
References
- United Nations. Paris Agreement. 2015. Available online: https://unfccc.int/sites/default/files/english_paris_agreement.pdf (accessed on 24 February 2023).
- Enerdata. World Energy & Climate Statistics—Yearbook 2022: Share of Renewables in Electricity Production. Available online: https://yearbook.enerdata.net/renewables/renewable-in-electricity-production-share.html (accessed on 16 January 2023).
- Burch, I.; Gilchrist, J. Survey of Global Activity to Phase Out Internal Combustion Engine Vehicles: March 2020 Revision. 2020. Available online: https://theclimatecenter.org/wp-content/uploads/2020/03/Survey-on-Global-Activities-to-Phase-Out-ICE-Vehicles-update-3.18.20-1.pdf (accessed on 16 January 2023).
- Gillingham, K.; Stock, J.H. The Cost of Reducing Greenhouse Gas Emissions. J. Econ. Perspect. 2018, 32, 53–72. [Google Scholar] [CrossRef] [Green Version]
- U.S. Department of Energy. Sustainable Aviation Fuel: Review of Technical Pathways. 2020. Available online: https://www.energy.gov/sites/prod/files/2020/09/f78/beto-sust-aviation-fuel-sep-2020.pdf (accessed on 24 February 2023).
- Viswanathan, V.; Epstein, A.H.; Chiang, Y.-M.; Takeuchi, E.; Bradley, M.; Langford, J.; Winter, M. The challenges and opportunities of battery-powered flight. Nature 2022, 601, 519–525. [Google Scholar] [CrossRef]
- Noland, J.K. Hydrogen Electric Airplanes: A disruptive technological path to clean up the aviation sector. IEEE Electrific. Mag. 2021, 9, 92–102. [Google Scholar] [CrossRef]
- European Commission. European Green Deal: New Rules Agreed on Applying the EU Emissions Trading System in the Aviation Sector: Press Release IP/22/7609. Available online: https://ec.europa.eu/commission/presscorner/detail/en/ip_22_7609 (accessed on 16 January 2023).
- Lee, D.S.; Fahey, D.W.; Skowron, A.; Allen, M.R.; Burkhardt, U.; Chen, Q.; Doherty, S.J.; Freeman, S.; Forster, P.M.; Fuglestvedt, J.; et al. The contribution of global aviation to anthropogenic climate forcing for 2000 to 2018. Atmos. Environ. 2021, 244, 117834. [Google Scholar] [CrossRef] [PubMed]
- Teoh, R.; Schumann, U.; Voigt, C.; Schripp, T.; Shapiro, M.; Engberg, Z.; Molloy, J.; Koudis, G.; Stettler, M.E.J. Targeted Use of Sustainable Aviation Fuel to Maximize Climate Benefits. Environ. Sci. Technol. 2022, 56, 17246–17255. [Google Scholar] [CrossRef]
- Braun-Unkhoff, M.; Riedel, U.; Wahl, C. About the emissions of alternative jet fuels. CEAS Aeronaut. J. 2017, 8, 167–180. [Google Scholar] [CrossRef] [Green Version]
- European Commission. Proposal for a Regulation of the European Parliament and of the Council on Ensuring a Level Playing Field for Sustainable Air Transport: COM(2021) 561 Final. 2021. Available online: https://eur-lex.europa.eu/resource.html?uri=cellar:00c59688-e577-11eb-a1a5-01aa75ed71a1.0001.02/DOC_1&format=PDF (accessed on 24 February 2023).
- Pigou, A.C. The Economics of Welfare; MacMillan: London, UK, 1920. [Google Scholar]
- Coase, R.H. The Problem of Social Cost. J. Law Econ. 2013, 56, 837–877. [Google Scholar] [CrossRef] [Green Version]
- Verbruggen, A. Pricing Carbon Emissions: Economic Reality and Utopia; Routledge Taylor & Francis Group: Abingdon, Oxon, UK; Routledge Taylor & Francis Group: New York, NY, USA, 2021; ISBN 1000415449. [Google Scholar]
- Weitzman, M.L. Prices vs. Quantities. Rev. Econ. Stud. 1974, 41, 477–491. [Google Scholar] [CrossRef]
- Stavins, R.N. The Future of US Carbon-Pricing Policy. Environ. Energy Policy Econ. 2020, 1, 8–64. [Google Scholar] [CrossRef]
- European Energy Exchange. EEX Emissions Market/Primary Market Auction: EUA & EUAA Auction Results 2022. 2022. Available online: https://public.eex-group.com/eex/eua-auction-report/emission-spot-primary-market-auction-report-2022-data.xlsx (accessed on 17 September 2022).
- Federal Government of Germany. CO2—Carbon Dioxide Has Its Price: Incentives for Fewer CO2—Carbon Dioxide Emissions. Available online: https://www.bundesregierung.de/breg-en/issues/climate-action/fewer-co2-emissions-1797122 (accessed on 17 September 2022).
- OECD. Pricing Greenhouse Gas Emissions Country Notes: Carbon Pricing in the Netherlands. 2022. Available online: https://www.oecd.org/tax/tax-policy/carbon-pricing-netherlands.pdf (accessed on 7 February 2023).
- OECD. Pricing Greenhouse Gas Emissions Country Notes: Carbon Pricing in Spain. 2022. Available online: https://www.oecd.org/tax/tax-policy/carbon-pricing-spain.pdf (accessed on 7 February 2023).
- Murphy, A. Why ICAO and Corsia Cannot Deliver on Climate: A Threat to Europe’s Climate Ambition. 2019. Available online: https://www.transportenvironment.org/wp-content/uploads/2021/07/2019_09_Corsia_assessement_final.pdf (accessed on 24 February 2023).
- Wozny, F.; Grimme, W.; Maertens, S.; Scheelhaase, J. CORSIA—A Feasible Second Best Solution? Appl. Sci. 2022, 12, 7054. [Google Scholar] [CrossRef]
- Schneider, L.; Wissner, N. Fit for Purpose? Key Issues for the First Review of CORSIA, Berlin. 2022. Available online: https://www.oeko.de/fileadmin/oekodoc/Key-issues-for-first-review-of-CORSIA.pdf (accessed on 24 February 2023).
- Broekhoff, D.; Spalding-Fecher, R. Assessing crediting scheme standards and practices for ensuring unit quality under the Paris agreement. Carbon Manag. 2021, 12, 635–648. [Google Scholar] [CrossRef]
- Stay Grounded. Positionspapier. Available online: https://stay-grounded.org/position-paper/position-paper-de/ (accessed on 18 January 2023).
- Robin Wood. Züge statt Flüge: Umweltorganisationen Fordern Sofortiges Aus für Kurzstreckenflüge. Press Release. Available online: https://www.robinwood.de/pressemitteilungen/z%C3%BCge-statt-fl%C3%BCge (accessed on 18 January 2023).
- Seber, G.; Escobar, N.; Valin, H.; Malina, R. Uncertainty in life cycle greenhouse gas emissions of sustainable aviation fuels from vegetable oils. Renew. Sustain. Energy Rev. 2022, 170, 112945. [Google Scholar] [CrossRef]
- ICAO. CORSIA Default Life Cycle Emissions Values for CORSIA Eligible Fuels. Available online: https://www.icao.int/environmental-protection/CORSIA/Documents/CORSIA_Eligible_Fuels/ICAO%20document%2006%20-%20Default%20Life%20Cycle%20Emissions%20-%20June%202022.pdf (accessed on 7 February 2023).
- Gelhausen, M.C. Airport Capacity Constraints and Strategies for Mitigation: A Global Perspective; Elsevier Science & Technology: Saint Louis, MO, USA, 2020; ISBN 9780128126578. [Google Scholar]
- Gelhausen, M.C.; Grimme, W.; Junior, A.; Lois, C.; Berster, P. Clean Sky 2 Technology Evaluator—Results of the First Air Transport System Level Assessments. Aerospace 2022, 9, 204. [Google Scholar] [CrossRef]
- Grimme, W. Luftverkehrsszenarien in BEniVer: 2. Statuskonferenz Energiewende im Verkehr. 2022. Available online: https://elib.dlr.de/187415/ (accessed on 24 February 2023).
- ICAO. Conversion Processes. Available online: https://www.icao.int/environmental-protection/GFAAF/Pages/Conversion-processes.aspx (accessed on 7 February 2023).
- Dahal, K.; Brynolf, S.; Xisto, C.; Hansson, J.; Grahn, M.; Grönstedt, T.; Lehtveer, M. Techno-economic review of alternative fuels and propulsion systems for the aviation sector. Renew. Sustain. Energy Rev. 2021, 151, 111564. [Google Scholar] [CrossRef]
- OMV. Sustainable Aviation Fuels—Wohin Geht Die Reise? Available online: https://www.omv.com/de/blog/sustainable-aviation-fuels-wohin-geht-die-reise (accessed on 6 January 2023).
- Matsuura, S. Waste Cooking Oil Prices Soar on Demand from Airline Industry. Available online: https://www.asahi.com/ajw/articles/14704414 (accessed on 6 January 2023).
- Ahrens, S. Monatlicher Preis für Sonnenblumenöl im Globalen Handel von Dezember 2019 bis Dezember 2022. Available online: https://de.statista.com/statistik/daten/studie/1296737/umfrage/monatlicher-preis-sonnenblumenoel/#:~:text=Monatlicher%20Preis%20f%C3%BCr%20Sonnenblumen%C3%B6l%20im%20globalen%20Handel%20bis%20Dezember%202022&text=Im%20Dezember%202022%20lag%20der,dem%20April%202022%20wieder%20gesunken. (accessed on 6 January 2023).
- O’Malley, J.; Pavlenko, N.; Searle, S. Estimating Sustainable Aviation Fuel Feedstock Availability to Meet Growing European Union Demand; Working Paper 2021-13. 2021. Available online: https://theicct.org/sites/default/files/publications/Sustainable-aviation-fuel-feedstock-eu-mar2021.pdf (accessed on 24 February 2023).
- Brosowski, A.; Krause, T.; Mantau, U.; Mahro, B.; Noke, A.; Richter, F.; Raussen, T.; Bischof, R.; Hering, T.; Blanke, C.; et al. How to measure the impact of biogenic residues, wastes and by-products: Development of a national resource monitoring based on the example of Germany. Biomass Bioenergy 2019, 127, 105275. [Google Scholar] [CrossRef]
- Wang, W.-C.; Tao, L. Bio-jet fuel conversion technologies. Renew. Sustain. Energy Rev. 2016, 53, 801–822. [Google Scholar] [CrossRef] [Green Version]
- Staples, M.D.; Malina, R.; Suresh, P.; Hileman, J.I.; Barrett, S.R. Aviation CO2 emissions reductions from the use of alternative jet fuels. Energy Policy 2018, 114, 342–354. [Google Scholar] [CrossRef]
- EUROSTAT. Electricity Production, Consumption and Market Overview. Available online: https://ec.europa.eu/eurostat/statistics-explained/index.php?title=Electricity_production,_consumption_and_market_overview (accessed on 24 February 2023).
- European Commission. A Hydrogen Strategy for a Climate-Neutral Europe: COM(2020) 301 Final. Available online: https://eur-lex.europa.eu/legal-content/EN/TXT/PDF/?uri=CELEX:52020DC0301&from=EN (accessed on 13 February 2023).
- Drünert, S.; Neuling, U.; Zitscher, T.; Kaltschmitt, M. Power-to-Liquid fuels for aviation—Processes, resources and supply potential under German conditions. Appl. Energy 2020, 277, 115578. [Google Scholar] [CrossRef]
- Giannelos, G.; Humphris-Bach, A.; Davies, A.; Baxter, B.; Cames, M.; Kasten, P.; Siskos, P.; Tsiropoulos, I.; Kalokyris, T.; Statharas, S. Study Supporting the Impact Assessment of the ReFuelEU Aviation Initiative: Final Report; Publications Office of the European Union: Luxembourg, 2021; ISBN 978-92-76-41016-4. [Google Scholar]
- Air France KLM Group. Universal Registration Document 2019 Including the Annual Financial Report. Available online: https://www.airfranceklm.com/sites/default/files/publications_en/document/universalregistrationdocument2019va.pdf (accessed on 6 February 2023).
- EasyJet plc. Annual Report and Accounts 2019: Resilient Focused Data Driven. Available online: https://corporate.easyjet.com/~/media/Files/E/Easyjet/pdf/investors/results-centre/2019/eas040-annual-report-2019-web.pdf (accessed on 6 February 2023).
- IAG. Full Year Results Announcement. Available online: https://www.iairgroup.com/~/media/Files/I/IAG/press-releases/english/2020/Full%20year%20results%20release%20for%20the%20year%20to%20December%2031%202019.pdf (accessed on 6 February 2023).
- Lufthansa Group. Annual Report 2019: Creating Sustainable Value. Available online: https://investor-relations.lufthansagroup.com/fileadmin/downloads/en/financial-reports/annual-reports/LH-AR-2019-e.pdf (accessed on 6 February 2023).
- Ryanair Holdings plc. Form 20-F. Available online: https://investor.ryanair.com/wp-content/uploads/2020/07/Ryanair-20-F-2020.pdf (accessed on 6 February 2023).
- IATA. Net-Zero Carbon Emissions by 2050. Press Release No: 66. Available online: https://www.iata.org/en/pressroom/pressroom-archive/2021-releases/2021-10-04-03/ (accessed on 24 February 2023).
- Adler, M.; Boonekamp, T.; Konijn, S. Aviation Fit for 55: Ticket Prices, Demand and Carbon Leakage. Research Report, Amsterdam. 2022. Available online: https://www.seo.nl/wp-content/uploads/2022/03/2022-16-Aviation-fit-for-55.pdf (accessed on 18 January 2023).
- Oxera. Assessment of the Impact of the Fit for 55 Policies on Airports: Prepared for ACI EUROPE. 2022. Available online: https://www.oxera.com/wp-content/uploads/2022/06/Impact-assessment-of-Fit-for-55-policies-on-the-aviation-sector_final_080622.pdf (accessed on 18 January 2023).
- Ehlers, T.; Kölker, K.; Lütjens, K. Auswirkungen der Fit-for-55-Instrumente auf die Preise in der Luftfahrt. Wirtschaftsdienst 2022, 102, 801–807. [Google Scholar] [CrossRef]
- International Renewable Energy Agency. Renewable Power Generation Costs in 2020. 2021. Available online: https://www.irena.org/publications/2021/Jun/Renewable-Power-Costs-in-2020 (accessed on 24 February 2023).
- Umweltbundesamt. Deutlich Weniger Erneuerbarer Strom im Jahr 2021: Nutzung von Biokraftstoffen sinkt Ebenfalls; Deutliches Plus nur bei Erneuerbarer Wärme. Press Release 50/2021. Available online: https://www.umweltbundesamt.de/presse/pressemitteilungen/deutlich-weniger-erneuerbarer-strom-im-jahr-2021 (accessed on 24 February 2023).
- United States Congress. Inflation Reduction Act of 2022: H.R.5376. 2022. Available online: https://www.congress.gov/bill/117th-congress/house-bill/5376/text (accessed on 24 February 2023).
- Kharina, A.; Rutherford, D. Fuel Efficiency Trends for New Commercial Jet Aircraft: 1960 to 2014: White Paper, Washington, DC. 2015. Available online: https://theicct.org/sites/default/files/publications/ICCT_Aircraft-FE-Trends_20150902.pdf (accessed on 16 January 2023).
- Clean Sky 2 Joint Undertaking. Clean Sky 2 Technology Evaluator First Global Assessment: Technical Report. 2021. Available online: https://www.clean-aviation.eu/sites/default/files/2021-09/TE-FGA-TR_en.pdf (accessed on 16 January 2023).
- Silberhorn, D.; Hartmann, J.; Dzikus, N.M.; Atanasov, G.; Zill, T.; Brand, U.; Gomez Trillos, J.C.; Oswald, M.; Vogt, T.; Wilken, D.; et al. The Air-Vehicle as a Complex System of Air Transport Energy Systems. In AIAA AVIATION 2020 FORUM, Proceedings of the AIAA Aviation 2020 Forum, Virtual Event, 15–19 June 2020; American Institute of Aeronautics and Astronautics: Reston, VA, USA, 2020; ISBN 978-1-62410-598-2. [Google Scholar]
- Grimme, W.; Braun, M. Estimation of potential hydrogen demand and CO2 mitigation in global passenger air transport by the year 2050. Transp. Res. Procedia 2022, 65, 24–33. [Google Scholar] [CrossRef]
- Fuss, S.; Lamb, W.F.; Callaghan, M.W.; Hilaire, J.; Creutzig, F.; Amann, T.; Beringer, T.; de Oliveira Garcia, W.; Hartmann, J.; Khanna, T.; et al. Negative emissions—Part 2: Costs, potentials and side effects. Environ. Res. Lett. 2018, 13, 63002. [Google Scholar] [CrossRef] [Green Version]
- EUROCONTROL. Aviation Outlook 2050: Main Report—STATFOR Doc 683 08/04/2022. 2022. Available online: https://www.eurocontrol.int/archive_download/all/node/13448 (accessed on 13 February 2023).
- Air Transport Action Group. Waypoint 2050: Balancing Growth in Connectivity with a Comprehensive Global Air Transport Response to the Climate Emergency: A Vision of Net-Zero Aviation by Mid-Century. Second Edition September 2021, Geneva. 2021. Available online: https://aviationbenefits.org/media/167417/w2050_v2021_27sept_full.pdf (accessed on 17 February 2023).
Figure 1.
Trajectory of the SAF blending quota as proposed by the European Commission. Source: Own figure based on data of [8].
Figure 1.
Trajectory of the SAF blending quota as proposed by the European Commission. Source: Own figure based on data of [8].

Figure 2.
Expected quantities of SAF to fulfil the blending quota as proposed by the European Commission. Source: [32].
Figure 2.
Expected quantities of SAF to fulfil the blending quota as proposed by the European Commission. Source: [32].

Figure 3.
Exemplary itinerary Frankfurt–Singapore/non-stop and with a transfer in Istanbul. Source: www.gcmap.com (accessed on 24 February 2023).
Figure 3.
Exemplary itinerary Frankfurt–Singapore/non-stop and with a transfer in Istanbul. Source: www.gcmap.com (accessed on 24 February 2023).


Table 1.
Life cycle CO2 reduction potential of SAF—Global default values for CORSIA eligible fuels.
| Feedstock | Conversion Pathway | Estimated Lifecycle CO2-eq Emissions (g/MJ Jet Fuel) | Lifecycle CO2 Reduction Potential vs. Fossil Fuel |
|---|---|---|---|
| Agricultural residues | FT | 7.7 | −90.8% |
| Forestry residues | FT | 8.3 | −90.1% |
| Municipal solid waste | FT | 5.2 | −93.8% |
| Poplar | FT | 20.8 | −75.1% |
| Miscanthus | FT | −2.2 | −102.6% |
| Switchgrass | FT | 15.7 | −81.2% |
| Tallow | HEFA | 22.5 | −73.1% |
| Used Cooking Oil | HEFA | 13.9 | −83.4% |
| Palm fatty acid distillate | HEFA | 20.7 | −75.2% |
| Corn Oil | HEFA | 17.2 | −79.4% |
| Soybean Oil | HEFA | 66.2 | −20.8% |
| Rapeseed Oil | HEFA | 73.4 | −12.2% |
| Camelina Oil | HEFA | 28.6 | −65.8% |
| Agricultural residues | ATJ (Isobutanol) | 29.3 | −65.0% |
| Forestry residues | ATJ (Isobutanol) | 23.8 | −71.5% |
| Sugarcane | ATJ (Isobutanol) | 33.1 | −60.4% |
| Corn grain | ATJ (Isobutanol) | 85.5 | 2.3% |
| Miscanthus | ATJ (Isobutanol) | 19.8 | −76.3% |
| Switchgrass | ATJ (Isobutanol) | 48.8 | −41.6% |
| Molasses | ATJ (Isobutanol) | 36.1 | −56.8% |
| Sugarcane | ATJ (Ethanol) | 32.8 | −60.8% |
| Corn Grain | ATJ (Ethanol) | 100.6 | 20.3% |
| Agricultural residues | ATJ (Ethanol) | 24.6–39.7 | −70.6%–−52.5% |
| Forestry residues | ATJ (Ethanol) | 24.9–40.0 | −70.2%–−52.2% |
| Miscanthus | ATJ (Ethanol) | 9.3–24.3 | −88.9%–−70.9% |
| Switchgrass | ATJ (Ethanol) | 33.7–48.7 | −59.7%–−41.7% |
| Waste gases | ATJ (Ethanol) | 29.4–42.4 | −64.8%–−49.8% |
| Sugarcane | SIP | 43.9 | −47.5% |
| Sugarbeet | SIP | 43.6 | −47.8% |
Source: [29].
Table 2.
Certified SAF Conversion Pathways.
| Conversion Process | Abbreviation | Possible Feedstocks | Maximum Blending Ratio by Volume |
|---|---|---|---|
| Fischer–Tropsch hydroprocessed synthesized paraffinic kerosene | FT-SPK | Coal, natural gas, biomass | 50% |
| Synthesized paraffinic kerosene from hydroprocessed esters and fatty acids | HEFA-SPK | Bio-oils, animal fat, recycled oils | 50% |
| Synthesized iso-paraffins from hydroprocessed fermented sugars | SIP | Biomass used for sugar production | 10% |
| Synthesized kerosene with aromatics derived by alkylation of light aromatics from non-petroleum sources | FT-SKA | Coal, natural gas, biomass | 50% |
| Alcohol to jet synthetic paraffinic kerosene | ATJ-SPK | Biomass from ethanol or isobutanol production | 50% |
| Catalytic hydrothermolysis jet fuel | CHJ | Triglycerides such as soybean oil, jatropha oil, camelina oil, carinata oil, and tung oil | 50% |
| Synthesized paraffinic kerosene from hydrocarbon-hydroprocessed esters and fatty acids | HC-HEFA-SPK | Algae | 10% |
| Co-hydroprocessing of esters and fatty acids in a conventional petroleum refinery | Co-processed HEFA | Fats, oils, and greases (FOG) co-processed with petroleum | 5% |
| Co-hydroprocessing of Fischer-Tropsch hydrocarbons in a conventional petroleumrefinery | Co-processed FT | Fischer–Tropsch hydrocarbons co-processed with petroleum | 5% |
Source: [33].
Table 3.
Fuel cost share/profitability for various European airlines/airline groups.
| Airline/Airline Group | Business Year | Total Costs in Millions | Fuel Costs in Millions | Fuel Cost Share (% of Total Costs) | Operating Profit Margin | Source |
|---|---|---|---|---|---|---|
| Air France KLM | 2019 | EUR 26,047 | EUR 5511 | 21.2% | 3.2% | [46] |
| easyJet | 2018/2019 | GBP 5984 | GBP 1416 | 23.7% | 6.7% | [47] |
| IAG | 2019 | GBP 22,221 | GBP 6021 | 27.1% | 13.9% | [48] |
| Lufthansa (Network Airlines) | 2019 | EUR 22,132 | EUR 5326 | 24.1% | 7.8% | [49] |
| Lufthansa (Eurowings) | 2019 | EUR 4655 | EUR 1054 | 22.6% | −4.0% | [49] |
| Ryanair | 2019/2020 | EUR 2762 | 34.2% | 13.3% | [50] |
Disclaimer/Publisher’s Note: The statements, opinions and data contained in all publications are solely those of the individual author(s) and contributor(s) and not of MDPI and/or the editor(s). MDPI and/or the editor(s) disclaim responsibility for any injury to people or property resulting from any ideas, methods, instructions or products referred to in the content. |
© 2023 by the author. Licensee MDPI, Basel, Switzerland. This article is an open access article distributed under the terms and conditions of the Creative Commons Attribution (CC BY) license (https://creativecommons.org/licenses/by/4.0/).
Share and Cite
MDPI and ACS Style
Grimme, W. The Introduction of Sustainable Aviation Fuels—A Discussion of Challenges, Options and Alternatives. Aerospace 2023, 10, 218. https://doi.org/10.3390/aerospace10030218
AMA Style
Grimme W. The Introduction of Sustainable Aviation Fuels—A Discussion of Challenges, Options and Alternatives. Aerospace. 2023; 10(3):218. https://doi.org/10.3390/aerospace10030218
Chicago/Turabian StyleGrimme, Wolfgang. 2023. "The Introduction of Sustainable Aviation Fuels—A Discussion of Challenges, Options and Alternatives" Aerospace 10, no. 3: 218. https://doi.org/10.3390/aerospace10030218
Note that from the first issue of 2016, this journal uses article numbers instead of page numbers. See further details here.