1. Introduction
In some regions of the world, adverse weather conditions such as thunderstorms and hailstorms (convective cells) are one of the biggest challenges in commercial aviation as they can have major impacts on air traffic control (ATC) and airlines in terms of safety and capacity [
1]. Climate change is intensifying the water cycle [
2], thus bringing more intense rainfall and associated flooding, as well as more intense drought in many regions. Current studies suggest that aviation contributes to between 2% and 3% of global warming in the long term through CO
2 and in the short term through methane and contrails [
3]. It is expected that climate change, through its impact on atmospheric processes, especially on short-lived and highly localized phenomena (thunderstorms, hailstorms, etc.), will also affect air traffic management activities. This phenomenon, also commonly known as thundercloud, is a main safety risk and can require circumnavigation, thus disrupting air traffic flow, increasing delays, and lowering cost-efficiency. At many major airports, capacity potential is already largely exhausted as global air traffic has continued to grow in recent years [
4]. Despite economic fluctuations and the influence of the COVID-19 pandemic, a recovery and further steady increase in flight movements is also predicted for the future [
5]. With narrow airspaces and the high density of movements, the probability of flight delays increases in adverse weather conditions.
For more than 9% of the first half of 2018, Munich airport was affected by thunderstorms around or close to the Alps [
6]. In 2019, EUROCONTROL reported that 21% of the delayed flights in Europe were caused by adverse meteorological conditions [
4]. Around 10% of all European departure flight delays result from adverse weather, varying between 2% at Charles de Gaulle in Paris and 20% in Istanbul [
7]. In Austria, 95% of regulated airport traffic delays were caused by weather in 2018 [
8]. In addition to reduced visibility [
9], snow, short-term de-icing operations, and other strong weather events sometimes make areas of airspace impassable. Unfortunate weather situations are also responsible for the complete closure of airports [
10]. The cost of a hub airport closure, for example, can exceed three million EUR per hour for all stakeholders combined [
11]. The enormous economic significance that adverse and extreme weather events can have on aviation is also becoming apparent.
An early and coordinated avoidance of adverse weather conditions can make en-route flights and approaches more efficient; however, there are currently no appropriate solutions that are operationally available for a guidance system that takes dynamic and convective weather into account. Consequently, ATC requires innovative solutions for avoiding emerging severe weather during flight. Adverse weather is often limited to regional areas; however, when blocking main flight routes, this can have a significant impact on overall air traffic. Thus, it is of utmost importance to support air traffic stakeholders both on board and on the ground. If appropriate nowcast and forecast weather data are available, the process of circumnavigation can be improved by implementing computer-based air traffic controller and pilot support systems. These systems support ATCOs with route information, altitude and speed advisories, and enhanced traffic displays with weather cells and affected aircraft visualizations. To avoid areas with flashes and hail, diversions should be designed in a way that pilots and ATCOs are able to choose their routes according to their training and experience. This paper describes the technical implementation of an air traffic controller support system for adverse weather situations in the vicinity of airports. In addition, an initial validation of the prototypical system and its results is described, which will be incorporated into the further development of the used arrival manager.
1.1. Current Situation
ATCOs are responsible for maintaining separations between aircraft. Today, spacing to severe weather is the responsibility of the pilot in the event of occurring convective cells. When adverse weather occurs on the aircraft’s planned or assigned route, the pilot decides whether to fly through it, fly over it, or avoid it to the left or right. In addition to the onboard weather radar, pilots can also use external live weather applications such as eWAS, which can transmit current weather data to the cockpit via a fast SatCom data link [
12].
The ATCO clears this avoidance maneuver and ensures that it does not result in critical separation infringements with other traffic. Center controllers, responsible for approach and lower and upper airspace, have no weather radar available for their sectors. The systems, visualizations, and procedures developed by the German Aerospace Center’s (DLR’s) Institute of Flight Guidance presented in this paper use available weather information to initiate four-dimensional route rescheduling and arrival sequencing. These tools provide appropriate rerouting advisories for ATCOs at an early stage using forecasts from 30 to 60 min in advance so that pilots do not have to avoid adverse weather situations at short notice. This relieves both the pilot and the ATCO and allows them to react in sufficient time in advance and at a reasonable distance so that rerouting trajectories stay safe and efficient [
13].
1.2. Related Work
Dealing with weather in ATC has multiple dimensions, such as accurate weather data, on-ground and on-board systems, visualizations of weather for pilots, ATCOs and supervisors, the determination of weather effects, the rerouting of aircraft, and the monitoring of weather-affected air traffic using deviations from standard routes.
To develop controller support systems for adverse weather conditions, in addition to meeting ATCOs’ requirements from these systems, it is also necessary to understand the factors influencing pilots’ decisions and their situational awareness when facing predicted or suddenly arising severe weather on their planned flight route [
14]. Air traffic management decision making in thunderstorm situations is affected by the uncertainty of such situations [
15,
16]. Studies have shown that pilots pursue different strategies when avoiding severe weather conditions in general [
17,
18], even with onboard support functionalities that highlight unobtrusive and important weather characteristics [
19,
20]. One of the outcomes of Ahlstrom’s validations was the discovery that there is still a lack of actual research on the needs of Terminal Maneuvering Area (TMA) ATCOs concerning weather information and support functions [
21]. Recent studies also show that air traffic controller support systems may reduce their workload in adverse weather conditions in the TMA [
22,
23]. The use of decision support tools along with input data considering current and forecasted weather for a user display was also proposed by Evans for the decision loop including impact analysis and mitigation plans [
24].
Although weather is one of the most important factors for aviation, ATCOs with no outside view have only selective information about the meteorological conditions in their sector, which they receive from the pilots. When available, they also use general weather information from the Internet, but this is not specifically adapted for aviation. So far, there is no integrated situation-sensitive weather view in their traffic situation display. In 2000, a detailed study on weather impact awareness with respect to the next five minutes that included 20 ATCOs showed that, in almost 40% of the used scenarios, the ATCOs were not fully able to identify the effects of weather on air traffic [
25]. Since that time, comprehensive systems such as weather radar have been further developed and are now available at many ATC centers; thus, the meteorological situational awareness of ATCOs should be much greater today. However, detailed studies considering new support systems are not available.
3. AMAN Air Traffic Controller Support
Arrival Manager (AMAN) systems have been developed and deployed in Europe over the course of the last 25 years. They are primarily designed to provide automated sequencing support for ATCOs handling traffic arriving at an airport by continuously calculating arrival sequences and times for flights while considering the locally defined landing rate, the required spacing for flights arriving to the runway, and other criteria. The AMAN has to generate flyable 4D trajectories with target times for all significant waypoints, including runway thresholds.
During the last twenty-five years, the DLR’s Institute of Flight Guidance in Braunschweig has developed arrival management systems for different kinds of scientific applications at various international airports. The latest version of DLR’s previously developed arrival manager tools “COMPAS” [
28] and “4D-Planner” [
29] is called the 4-dimensional Cooperative Arrival Manager (4D-CARMA). Both previous versions were the result of research projects in close cooperation with the Deutsche Flugsicherung GmbH (DFS). Considering different constraints, such as weight classes, runway separation criteria, or runway allocation, 4D-CARMA uses radar data and additional information, such as the flight plans of all arriving aircraft, for sequencing and trajectory calculation. AMANs are pure suggestion systems and have a planning horizon of around one hour. They ease ATCOs’ tasks by taking over the particularly difficult planning and optimization of approach sequences while considering all given constraints. This technical support in approach planning can have a clearly positive influence on the effectiveness of ATCOs’ work since approaching aircraft are integrated at an early stage, the required distances are precisely considered, throughput is slightly increased, and approach trajectories are more direct and thus shorter [
30]. This is especially true when the decision support systems are combined with speech recognition [
31]. In recent years, developments in Arrival Managers have gone in two main directions: On the one hand, the planning horizon has been systematically extended to several hundred miles, giving aircraft a precise target time for the threshold and, thus, a position in the landing sequence already in the en-route phase [
32]. On the other hand, attempts are being made to use machine learning (ML) methods to build pilot support systems that are based on trajectories that have actually been flown and can thus better represent the typical actions of controllers and pilots in certain situations than classic deterministic algorithms [
33,
34]. With the help of ML, attempts are also being made to support more environmentally friendly approach planning and thus further reduce the environmental impact of aviation [
35].
The first arrival managers already developed the systematic base for ATCO support, and this has not changed in principle. Accordingly, the tasks of an AMAN can be divided into different levels: “Sequence Planning” calculates optimal landing sequences based on airspace structure, current air traffic situations, and performance criteria for all aircraft in the airspace. “Trajectory Calculation” creates optimal 4D routes for every individual aircraft to fulfil the planned sequence. “Advisory Generation” deduces the required instructions from air traffic controller to pilot to follow the calculated trajectory, and “Conformance Monitoring” tracks if aircraft follow the planned trajectories. In order to support adverse weather avoidance, the assistant functionalities of an AMAN have to be adapted and new assistant functionalities need to be provided. The most important elements of an AMAN capable of supporting severe weather area diversions are conflict detection between routes and weather areas, alternate route finding, sequence calculation, and trajectory generation.
3.1. Diversion Route Finding
The AMAN 4D-CARMA used in SINOPTICA first creates an individual waypoint list for the 4D trajectory calculation for each aircraft, which consists of both physical navigation points, such as Very High Frequency Omnidirectional Radios (VORs) or Distance Measurement Equipment (DME) and virtual Aeronautical Information Publications (AIPs), or Flight Management System (FMS) waypoints with all their altitudes and speed constraints. Usually, this waypoint list is based on the defined standard approach routes and transitions of the airport and the approach direction. If a conflict between a trajectory and a polygon of severe weather has been detected, the waypoints located inside the polygon are first determined. Afterwards, the points directly in front of and behind the polygon are searched for.
The points inside the polygon are deleted from the waypoint list, and the points before and after it are set as the start and end points for the diversion. For the route, points to the right and left of the weather are now calculated in the direction of flight, which would allow for a triangular diversion (for example, waypoints IP [
] left or IP [
] right in
Figure 2). If it turns out that the waypoints in front of or behind the polygon are too close to it that an aircraft would have to fly a steep turn, these points are accordingly moved further away from the polygon along the route (from waypoint
to
in
Figure 2).
The next step is to determine the route lengths that involve a right- or left-side diversion. In addition, the moving direction and speed of the severe weather is considered when choosing the diversion’s direction. Subsequently, the newly determined waypoints are integrated into the current waypoint list and used for arrival sequencing and trajectory calculation.
3.2. Arrival Sequencing
For sequence planning, the shortest possible approach routes with the highest possible approach speeds are determined, as well as the longest routes with the lowest speeds. These result in an earliest and a latest landing time for each aircraft, and a target time window can thus be planned. The sequence is now determined by using the shortest possible approach times for each aircraft. If two aircraft fall below their weight class-dependent minimum separation, the succeeding aircraft is moved back in time until the minimum separation is reached on final and for touchdown. If an aircraft is shifted behind its latest possible landing time, it must be guided into a holding. This finally results in the landing times for the precise trajectory calculation.
3.3. Trajectory Generation
The basis of the trajectory calculation is flight performance data and a waypoint list with local constraints regarding speed and altitude limits. This trajectory must then be subjected to two screenings. Firstly, whether the trajectory for the aircraft is feasible is tested. This includes, for example, checking the radii of curves with respect to the approach speed planned there. Another test criterion is conflicts with other aircraft. A conflict test with polygons representing severe weather areas is a new addition. Conflict detection is implemented by comparing the planned trajectories and the current or predicted weather areas. If both conditions are met, the estimated landing time can be calculated from the new trajectory.
Several functions are available in 4D-CARMA for calculating descent and reduction rates, which are calculated on the basis of EUROCONTROL’s Base of Aircraft Data (BADA) [
36]. Therefore, the rates depend also on the current altitudes and speeds of aircraft. Thus, if the calibrated air speed (CAS) is reduced at the same time, the descent rate is reduced by almost 50% compared to a descent rate with a constant CAS to indicated air speed (IAS) ratio. However, there is also the possibility of using correction parameters for the BADA data resulting from simulations and flight tests.
Initiated by the planned target time, the trajectory is calculated backwards starting from the threshold into the air. The forward calculation always begins at the current position of the aircraft. It takes place for at least 25 s from the actual time because it is assumed that no AMAN-advised flight state changes are possible during this short period of time due to the operations of a pilot or controller. However, if advisories that are already displayed to the controller are known, it is assumed that these clearances are also given and executed at the scheduled time.
The reverse calculation is normally carried out from the Final Approach Fix (FAF) in the direction of the current aircraft position to the end point of the forward calculation. It receives the waypoint list until where the forward calculation has been performed as input, with all points between the Final Approach Fix (FAF) and the threshold being removed.
When calculating the trajectory coordinates, it is assumed that the current position and track (flight direction) are known. Furthermore, the 2D route of the aircraft is described with constraints through a list of predetermined waypoints . These constraints are the maximum and minimum values for the flight levels and CAS speeds to be maintained. The waypoint corresponds here to the current aircraft position, and the waypoint corresponds to the runway threshold. If the position of the aircraft now approaches the next waypoint on the route () by less than the predetermined distance of 2 NM, a track change to the next point () with a constant radius is started. Of course, this applies only if the flight to the next waypoint is connected with a significant change in direction. After validation trials with air traffic controllers in different projects, directional changes of more than 0.5 degrees are considered as a significant route change in DLR’s AMAN.
In both cases—the forward and the reverse calculation—an attempt is made to place an arc from the current position onto the following segment so that the end of the arc will track in the direction of the following waypoint or the segment that can be flown. If this is not possible, a direction change of a maximum of three degrees per second takes place per integration step until the new track runs directly to the next waypoint. At the end, the track is always flown to the next waypoint, but it can happen that the track then deviates somewhat from the segment between the last waypoint and the next waypoint. This deviation is not critical in most phases of the approach. In this way, however, it can always be ensured that deviations around severe weather areas always take place in a soft arc and thus enable a realistic flight path.
3.4. Dynamic Severe Weather Visualization on a Traffic Display
Since convective cells should be visualized on a 2D display, the current and forecasted cells can be represented by discrete sets of simple polygons. Each polygon of a set that is valid for some time period has an identification number that provides unique correlation between sets of cells. The polygons have to be displayed without covering essential traffic information, such as aircraft labels or additional flight plan information. For animation of actual weather development, two methods for comparison were implemented with different demands in terms of the level of detail for weather information. In addition to a linear extrapolation of the last weather development, this also includes a procedure based on a morphing algorithm which, in addition to the last meteorological measurement, also considers nowcasts in the animated presentation.
3.4.1. Algorithm for Advanced Weather Visualization
The mentioned polygons are simple, closed, and defined by the ordered set of its vertices consecutively linked by line segments without intersections that bound a connected interior area. Polygons with self-intersections, as well as polygons with holes, were not considered since they are not suitable for the representation of areas that aircraft should not fly through.
The main goal of the intended visualization is to perform a realistic interpolation of the transformation of a polygons’ set at the current time into a set of forecasted polygons at the time moment over the time period . The interpolation should have small time steps of less than five seconds in order to avoid gaps between consecutive visualization pictures and to follow the update rhythm of aircraft radar data.
Since convective cells move and can appear, disappear, merge together, or split into small parts over time, it is necessary and sufficient to develop approaches for performing the following main interpolations:
A transformation of one polygon into another polygon;
A transformation of one polygon into several polygons and vice versa;
A transformation of one polygon in simultaneous splitting and merging cases of this polygon.
The formulated task belongs to the class of 2D polygon morphing problems. This class is well studied, especially for complex shapes, because of their wide applicability in computer graphics and animation. Therefore, these solutions imply significant computational effort or are instead developed for some initial objects with properties irrelevant for the visualization of weather. A detailed overview of the related literature is out of the scope of this paper. An overview on the existing methods is given in [
37]. Here, we refer to works related to polygon morphing.
Approaches for polygon morphing consist of two main steps: the mapping of polygons by some characteristic or feature points and the specification of methods of interpolation or curves. The last step is more complicated because retaining some of the characteristic features of the considered objects during interpolation is often desirable. One of the main goals in defining interpolation methods is avoiding the local self-intersection of polygon boundaries.
There are many heuristics presented in the literature. Guaranteed intersection-free polygon morphing, described in [
38], relies on an analytical basis. However, the approach uses a significant number of interior points and exterior Steiner vertices that increase its complexity. The morphing of simple polygons with the same number of edges that are correspondingly parallel is explored in [
39]. Usually, morphing algorithms require user assistance to relate the morphing objects. Malkova introduced intuitive polygon morphing; however, the source and destination polygons must spatially overlap [
40]. Moreira dealt with the application of 2D polygonal morphing techniques to create spatiotemporal data representations of moving objects continuously over time [
41]. The movement of icebergs in the Antarctic seas was used as a case study and the data sources were sequences of satellite images capturing the position and shape of the icebergs on different dates. The authors applied a perception-based approach in [
42], in which the so-called feature points of the morphing objects were determined. The main challenges were the determination of feature points and correspondences between feature points. Since this work investigated the visualization of moving gaseous objects, rotations and similarities had an insignificant role compared to the solid objects in [
41].
Considering relatively small time-steps between consequent sets of convective cells compared to their movement speed and transformation, linear interpolation appears to be the best choice for the defined approximation requirements.
3.4.2. Moving and Morphing Algorithm Description
The first mentioned transformation of one polygon into another provides the basis for the two remaining types of transformations, as well as the subsequent morphing of the set of polygons at time into the set of polygons at time over the time period . Therefore, this should be primarily considered.
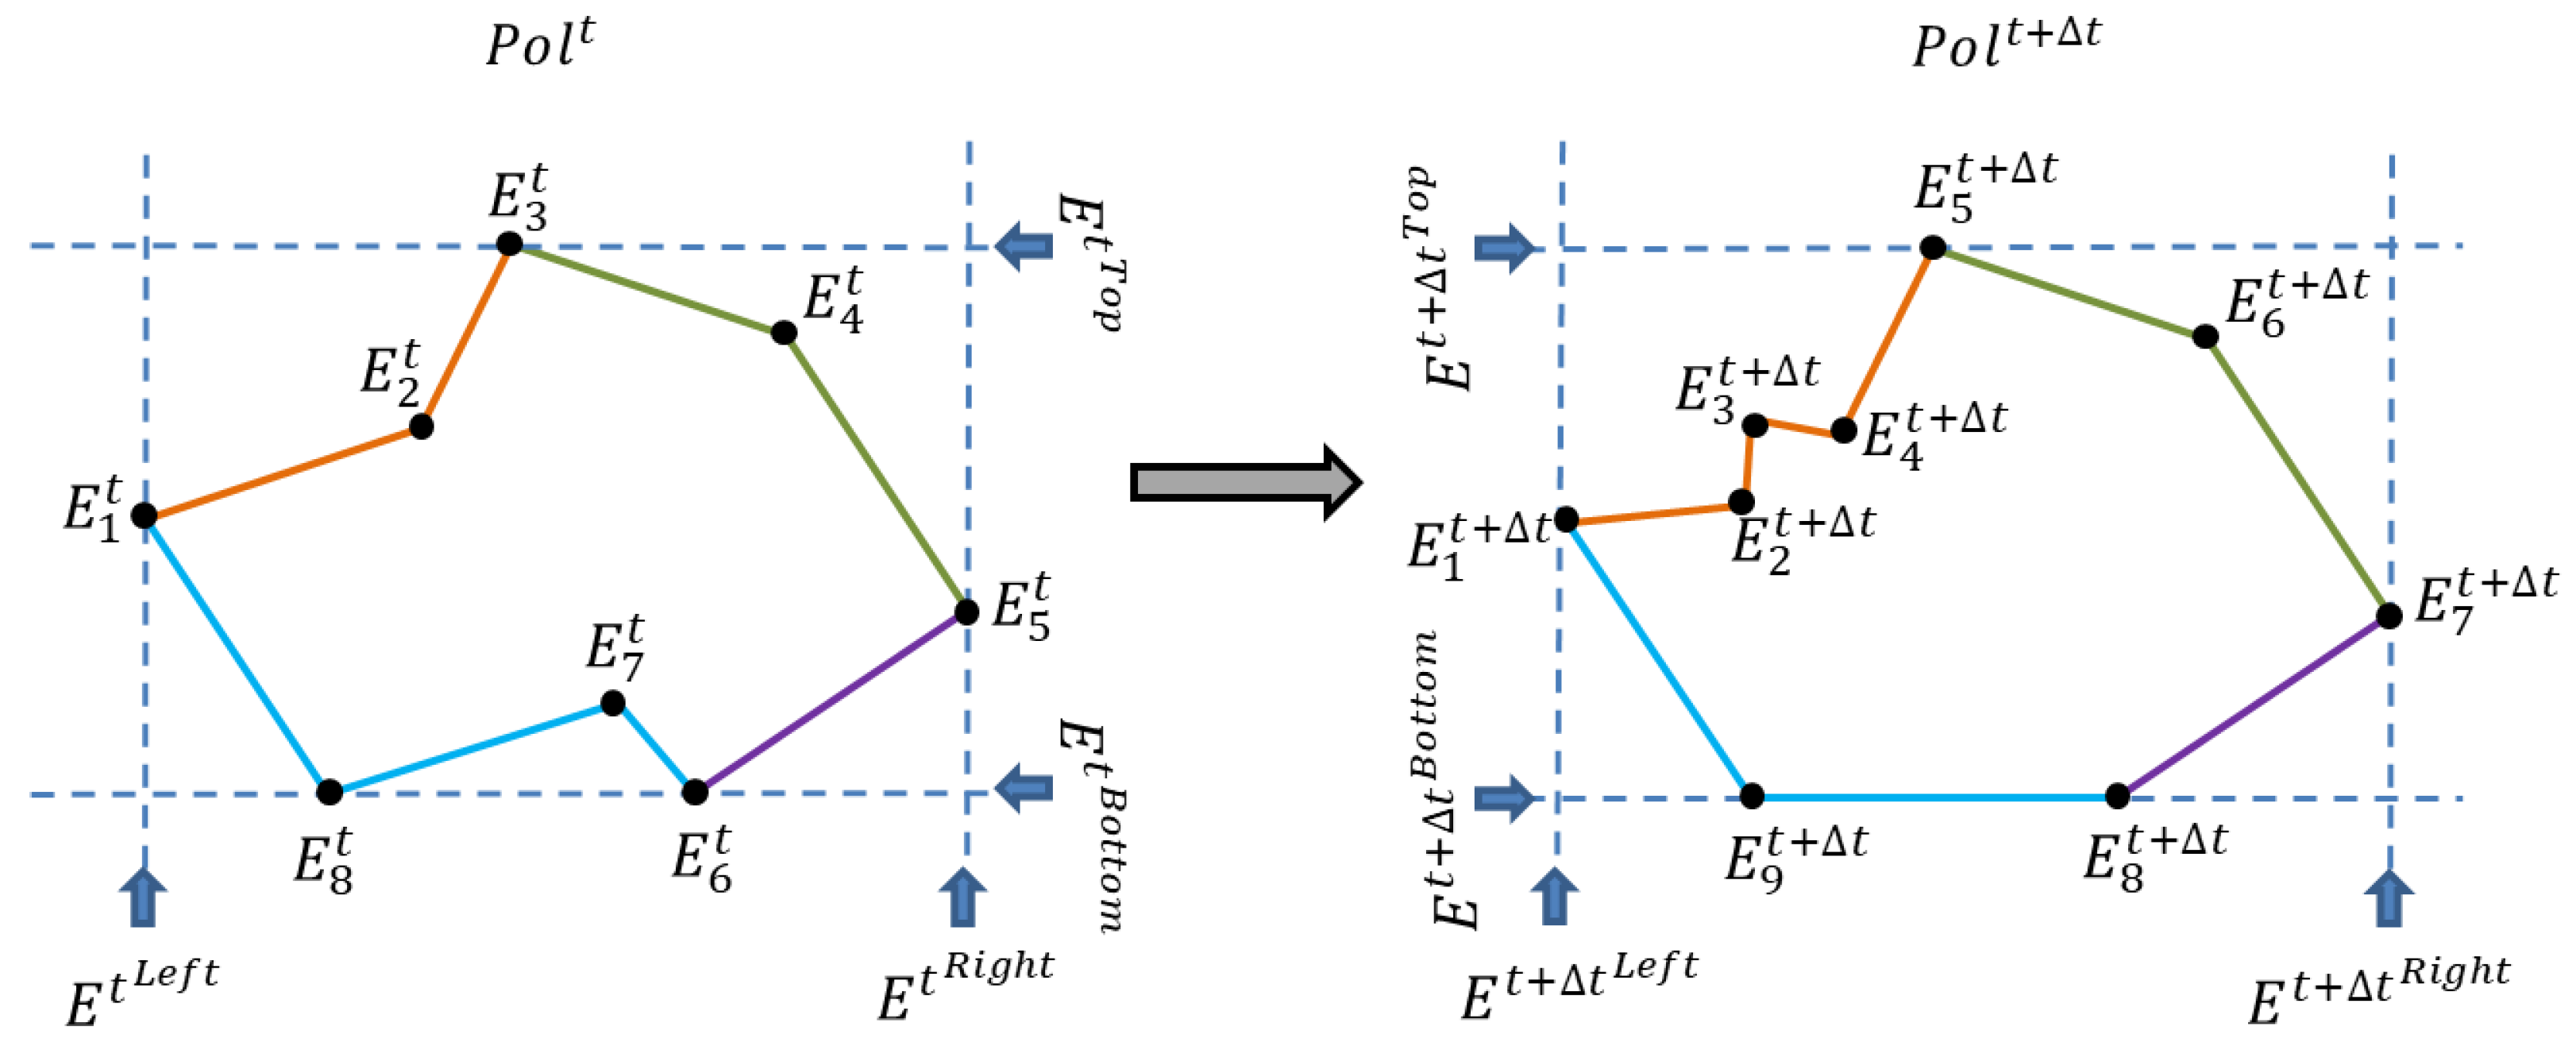
Decomposition of Polygon Boundaries
To morph one polygon into another, the boundaries of considered polygons are decomposed into four corresponding parts to obtain a more natural interpolation of the transformation that avoids significant turns and rotations of the boundary during interpolation. For this purpose, four sets of vertices with minimal and maximal abscissas and with minimal and maximal ordinates have to be found for the current and for the forecasted polygon. These sets can contain more than one point, and some sets can coincide. If the considered set consists of more than one point, the simplest solution is to take the first point from each set of vertices in the vertex index increase direction. Another option is to choose a point from this set, which provides balanced length for the boundary parts. Boundary parts obtained in this manner are illustrated in
Figure 3. Here,
and
are polygons at time moments
and
, respectively. The points
,
and
,
are the vertices and
are subsets of vertices with minimal or maximal first or second coordinates of the polygons
and
.
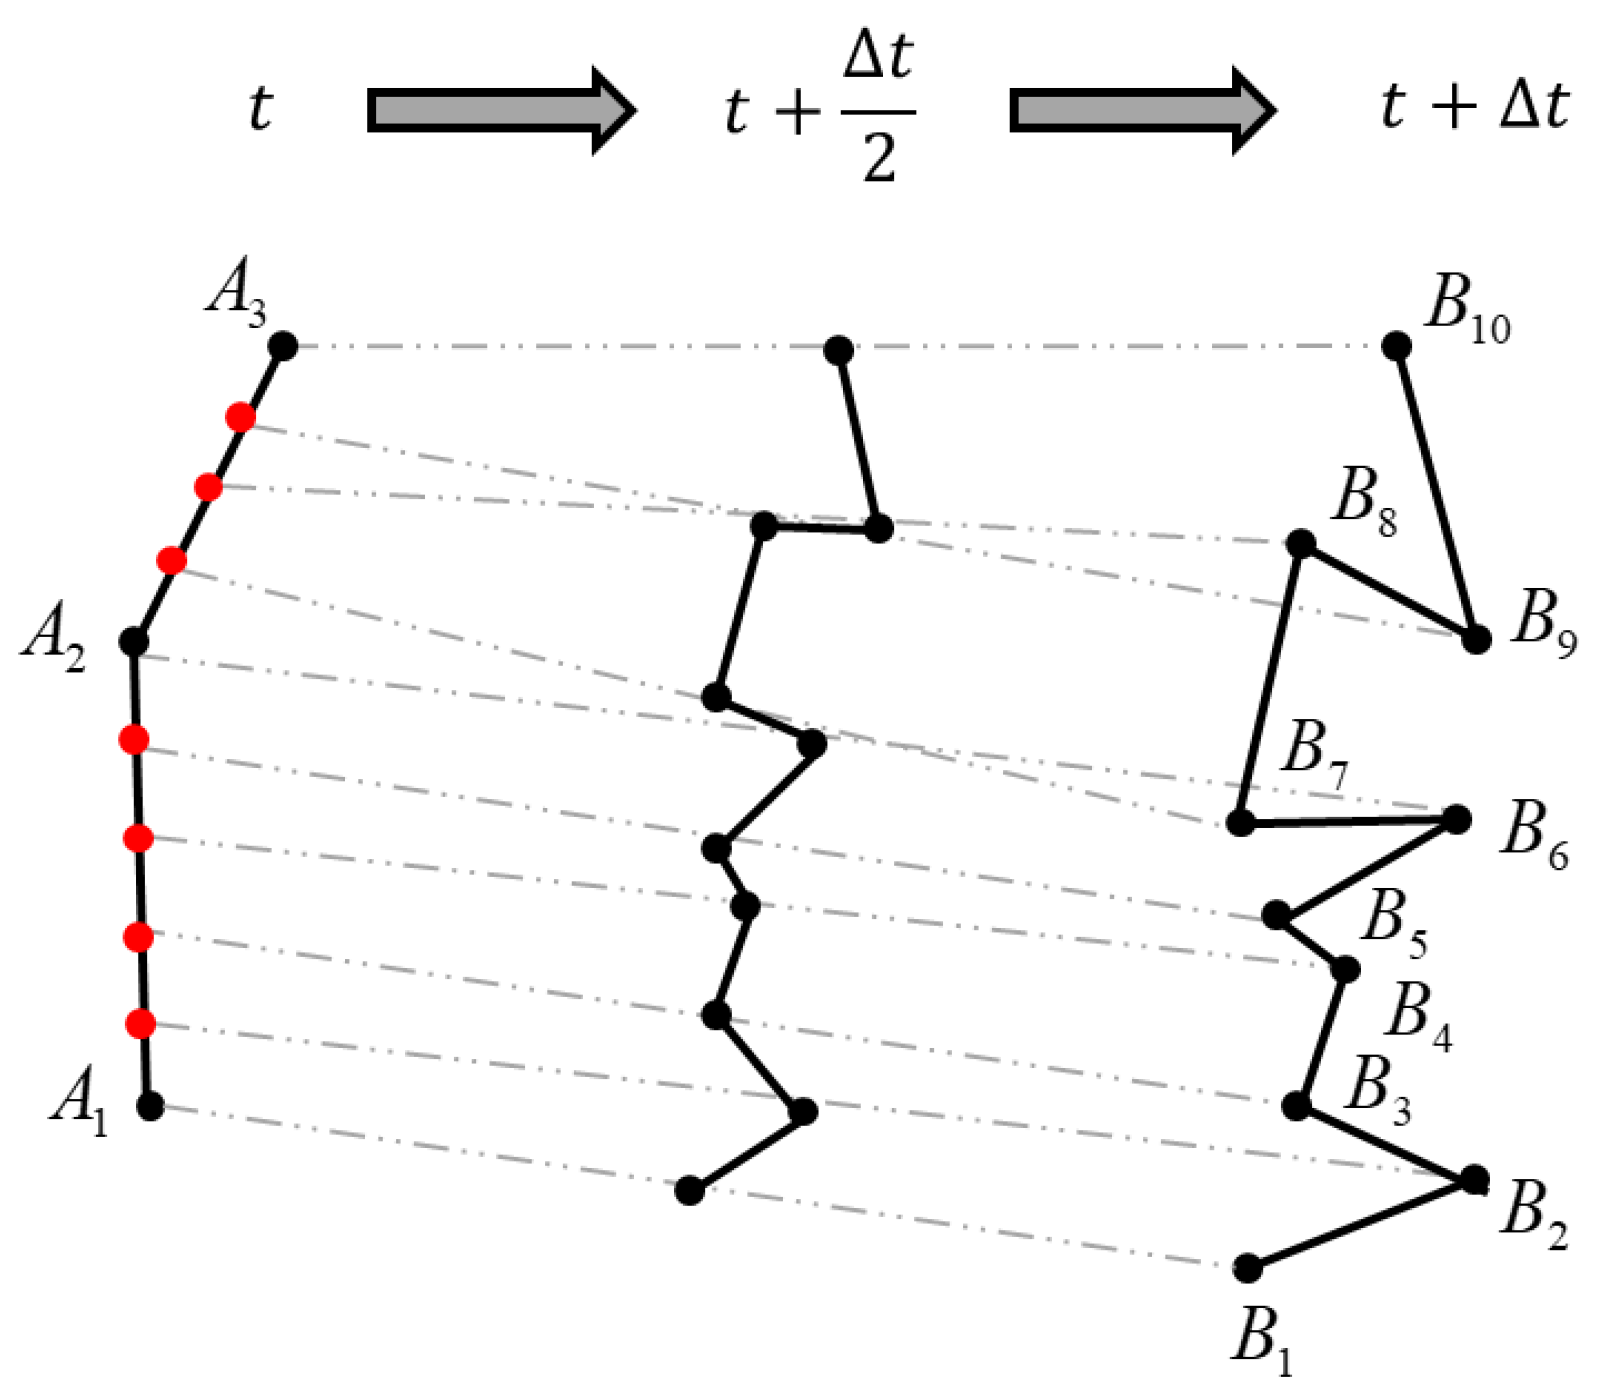
After boundary decomposition, morphing of the boundary parts is performed through the linear interpolation of the vertices in
discrete time steps of the duration
. To perform the interpolation, the boundary parts are balanced in order to establish one-to-one correspondence between them. This means that the boundary part with the smallest number of vertices receives additional points uniformly distributed along the edges so that, on each edge, the quotient number of additional points plus one additional point on the remaining number of edges in the vertex index increase direction is selected. The described approach is illustrated in
Figure 4. Here, the piecewise linear curve
is transformed into the piecewise linear curve
. The quotient of the division of ten by three is equal to three and the remainder is equal to one. Therefore, the edge
gets three plus one additional points, and three additional equidistant points are selected on the
edge. They are marked red in
Figure 4.
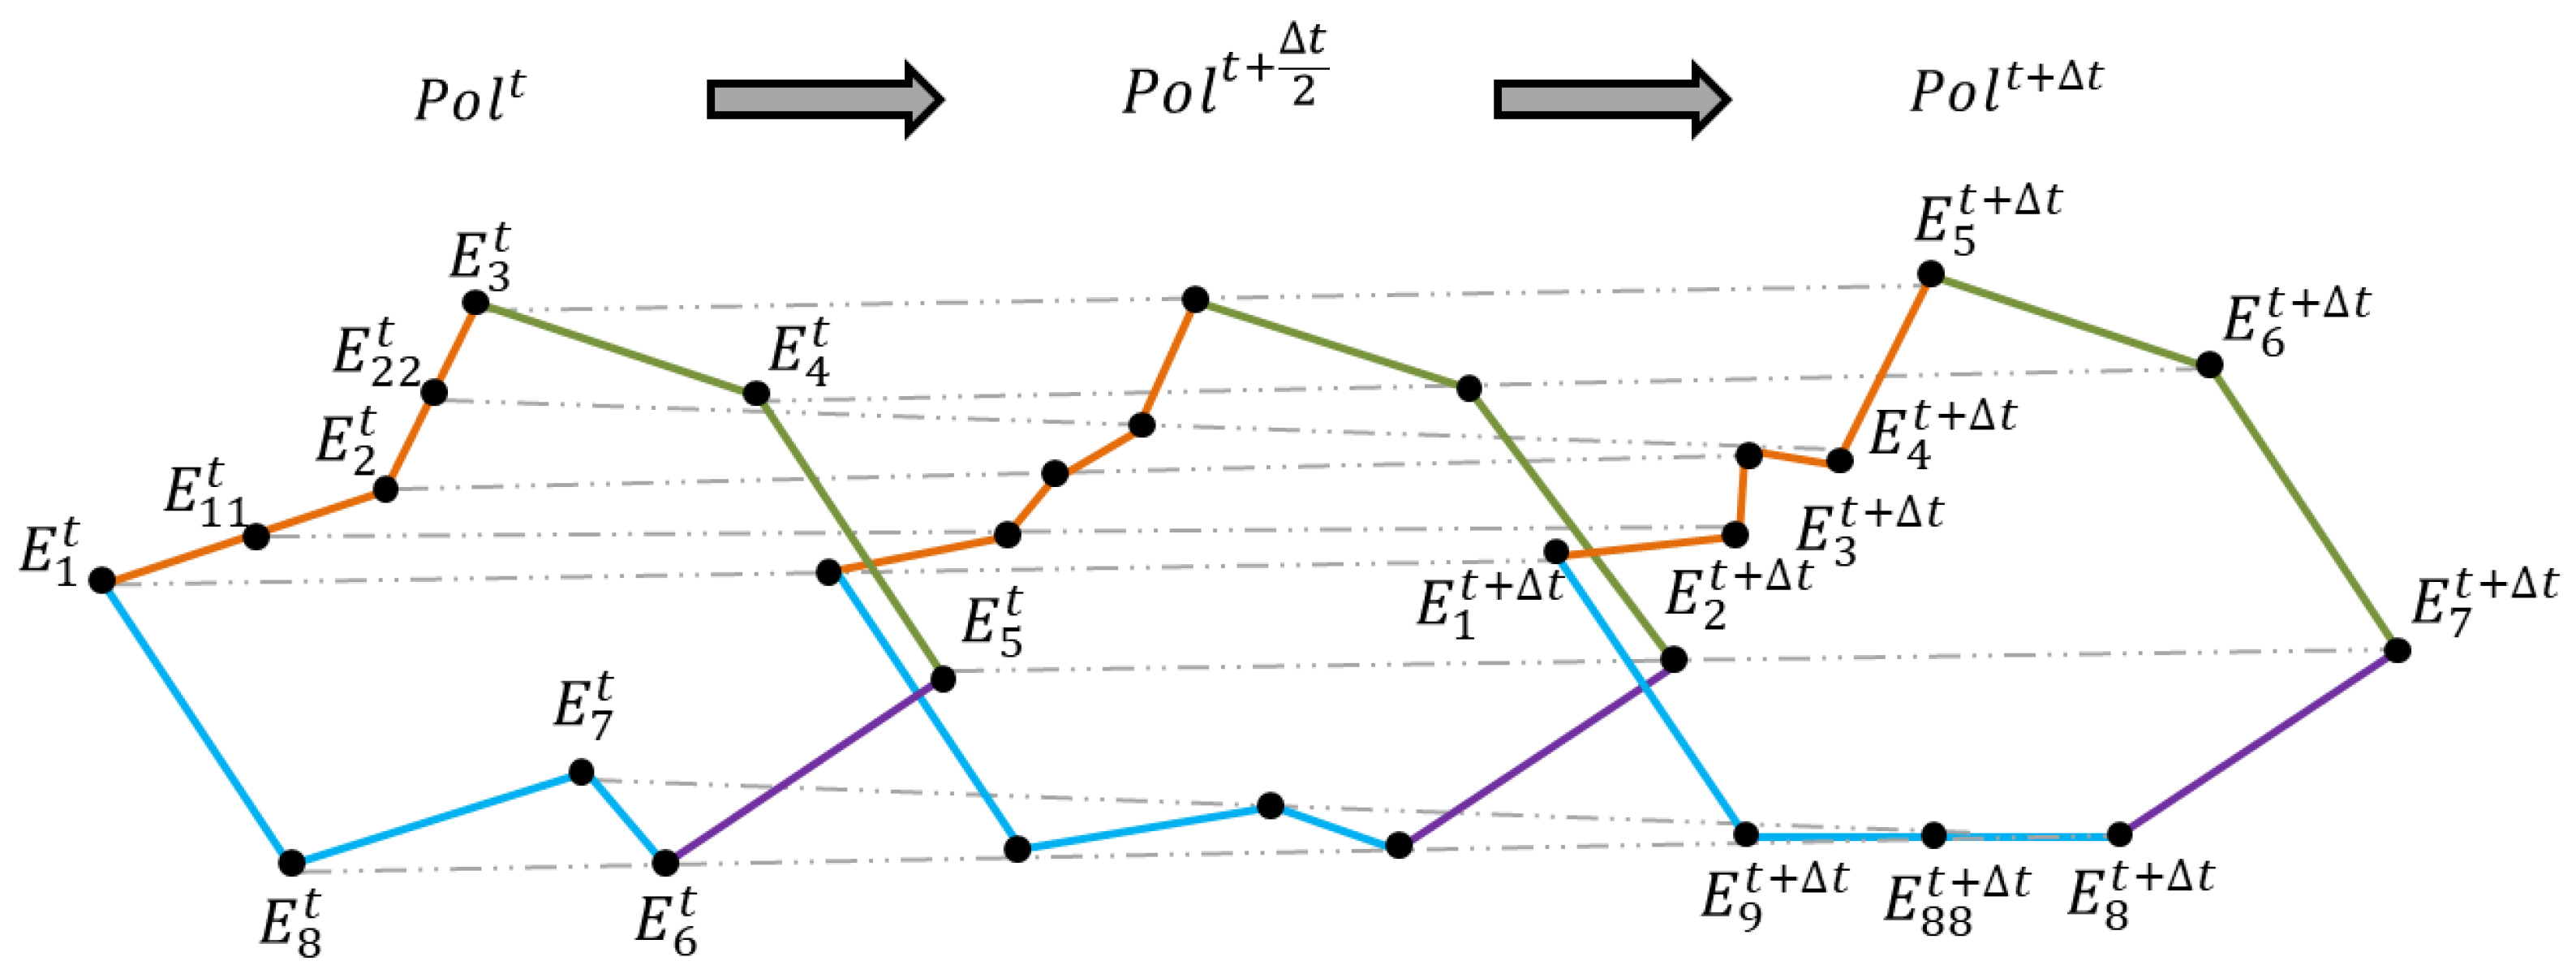
Moving and Morphing of a Single Polygon
The described approach provides an identical number of “vertices” on both linear curves to perform one-to-one linear interpolation in
discrete steps. The middle polyline in
Figure 4 illustrates the interpolated curve at the time moment
. Morphing of the polygon
into
is realized through interpolation of the transformation of four corresponding boundary parts in accordance with the approach visualized in
Figure 4. The interpolated polygon at time
is illustrated in
Figure 5.
The input data to perform interpolation represent the current and forecasted locations of cells, i.e., only the current situation and a forecasted result of transformation after time period are available. Although there is a correlation of identification numbers between sets of polygons reproducing current and forecasted situations, there is no information in the input data in a merging or splitting case, with part of a pre-image corresponding to a transformed polygon and vice versa. There is no way to exactly retrace the decomposition process for available input data.
In the case of an interpolation approach where the forecasted decomposed polygons are mapped to some parts of the current polygon, the free corridors appearing in the visualization may not reflect the real-life situation and can deviate from it significantly. Therefore, from a safety point of view, aircraft should not be directed through these corridors. Additionally, the time periods between the forecasts are relative short (up to ten minutes). Based on these facts, the mapping of polygons without decomposition of the current polygon in the splitting case and without decomposition of the forecasted polygon in the merging case can be taken as a reasonable approach for transformation. This approach is explained and illustrated in the next subsection.
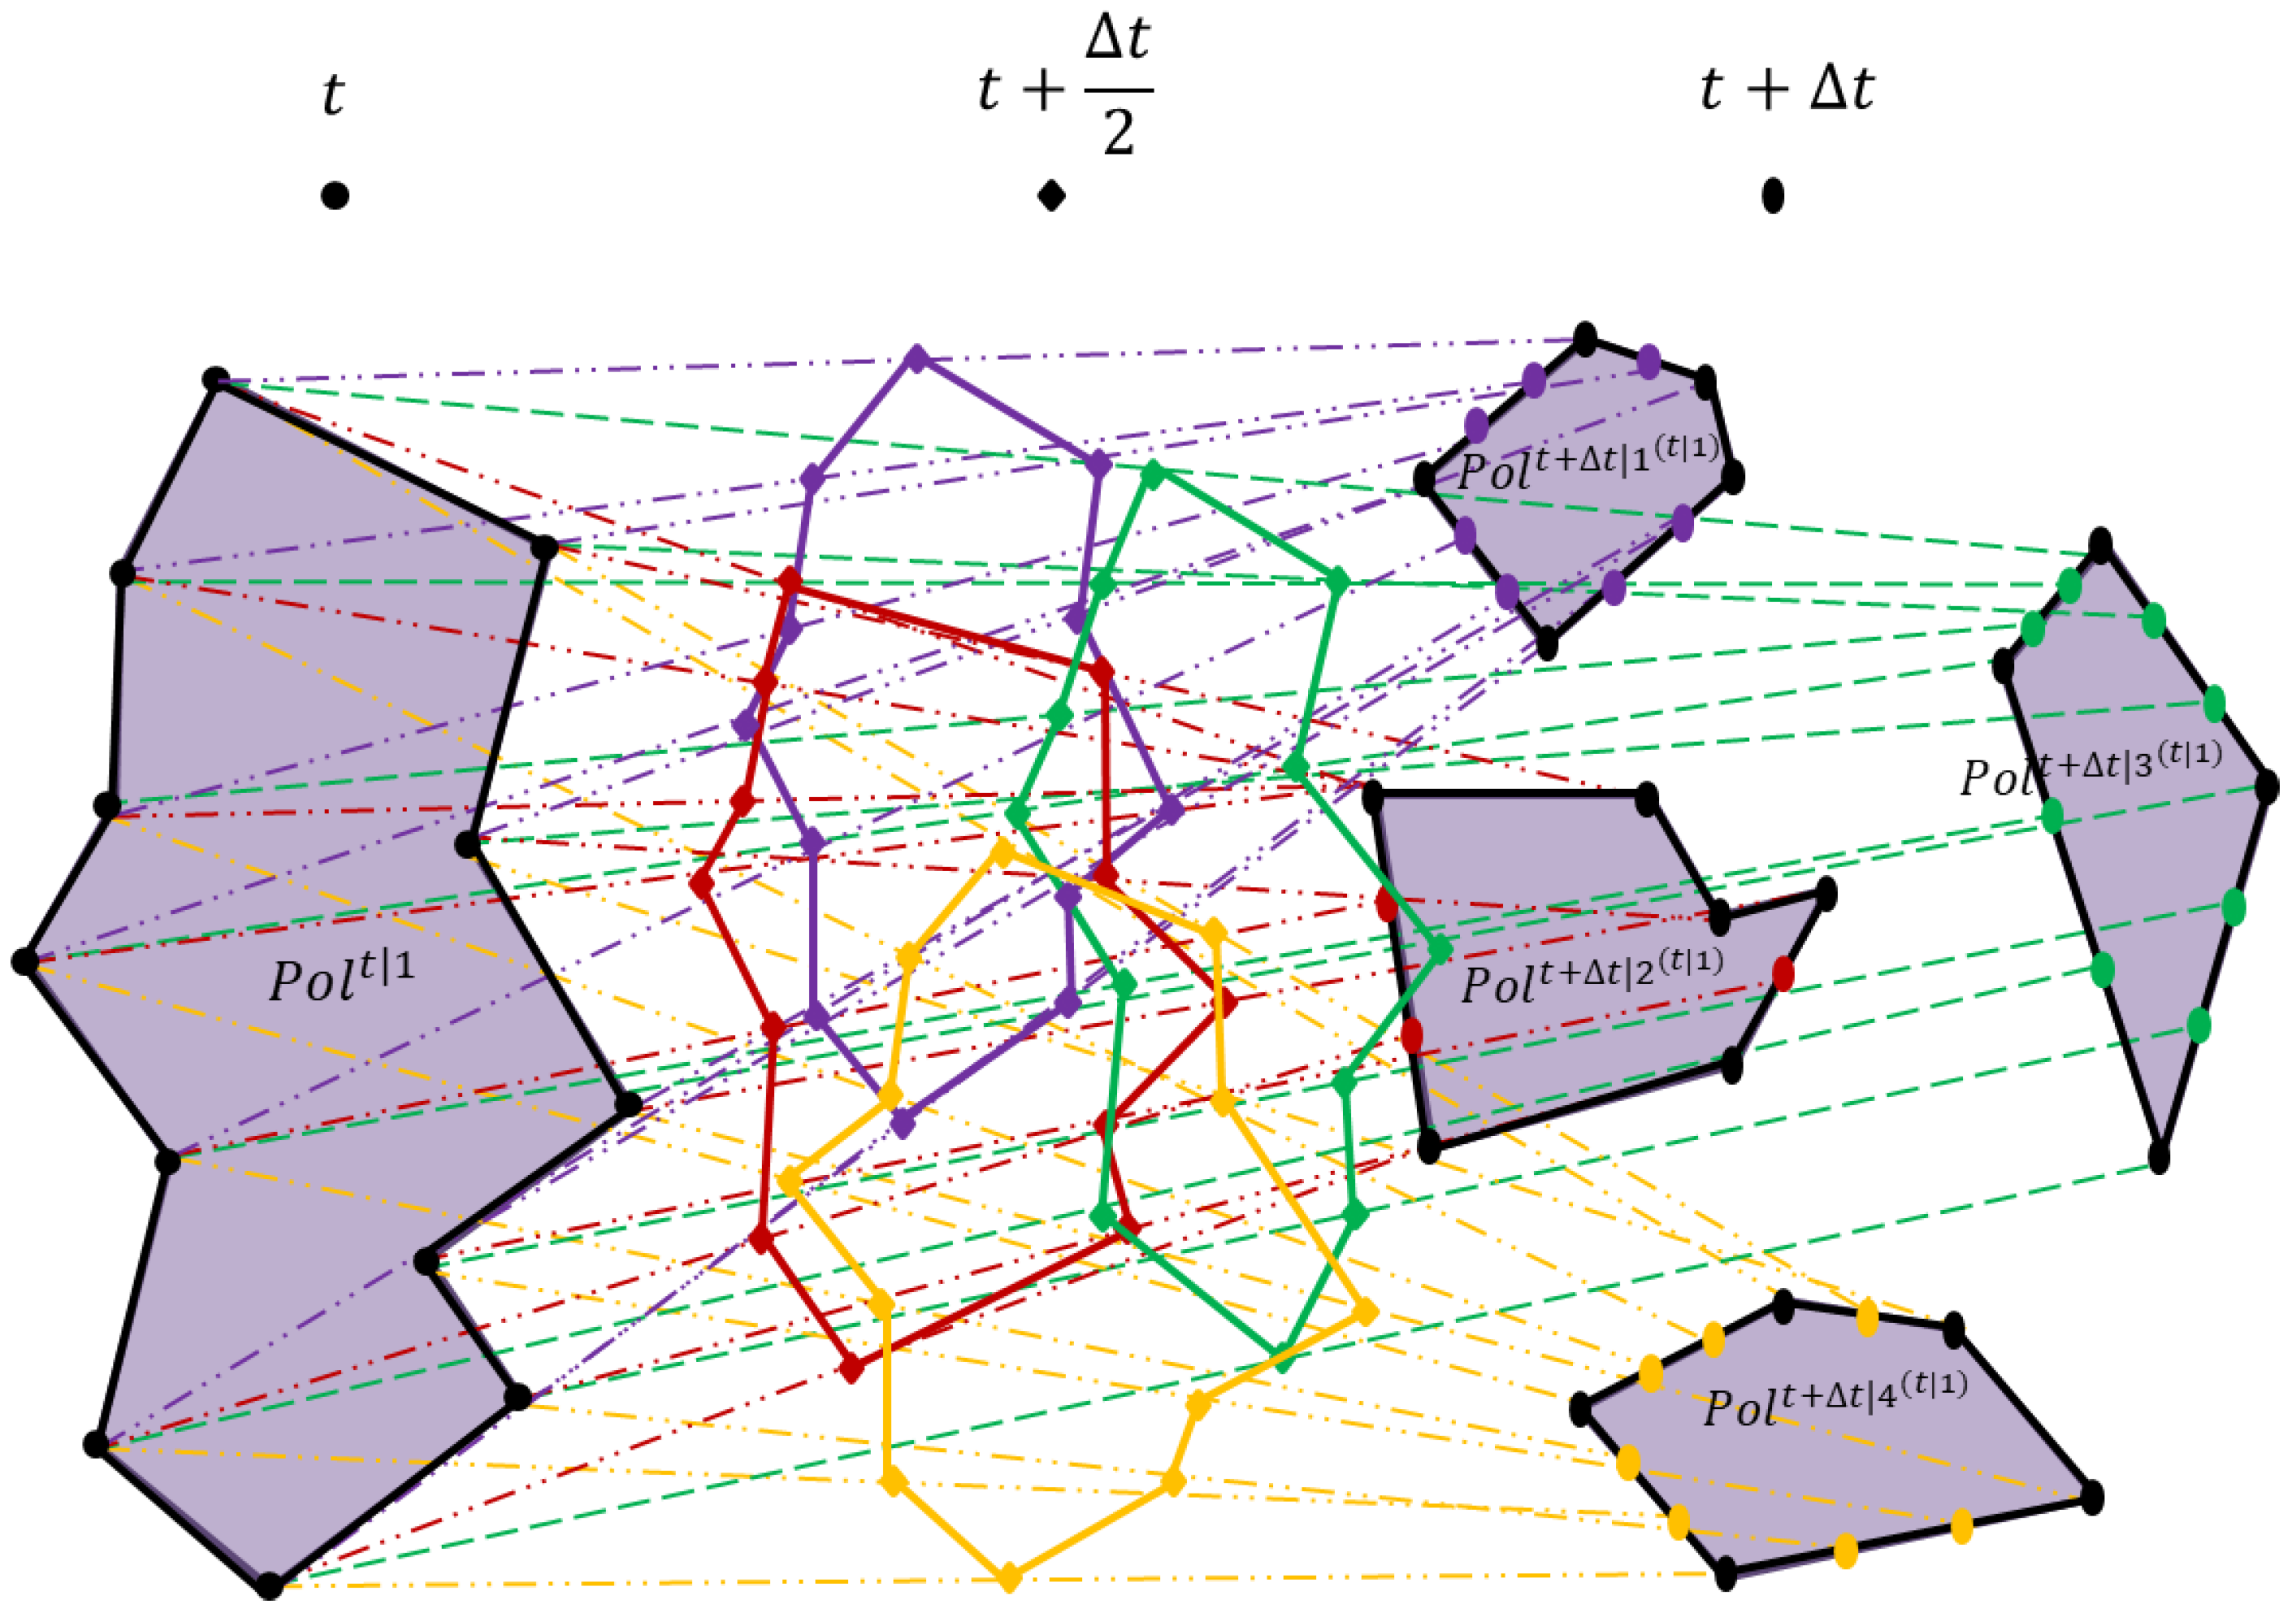
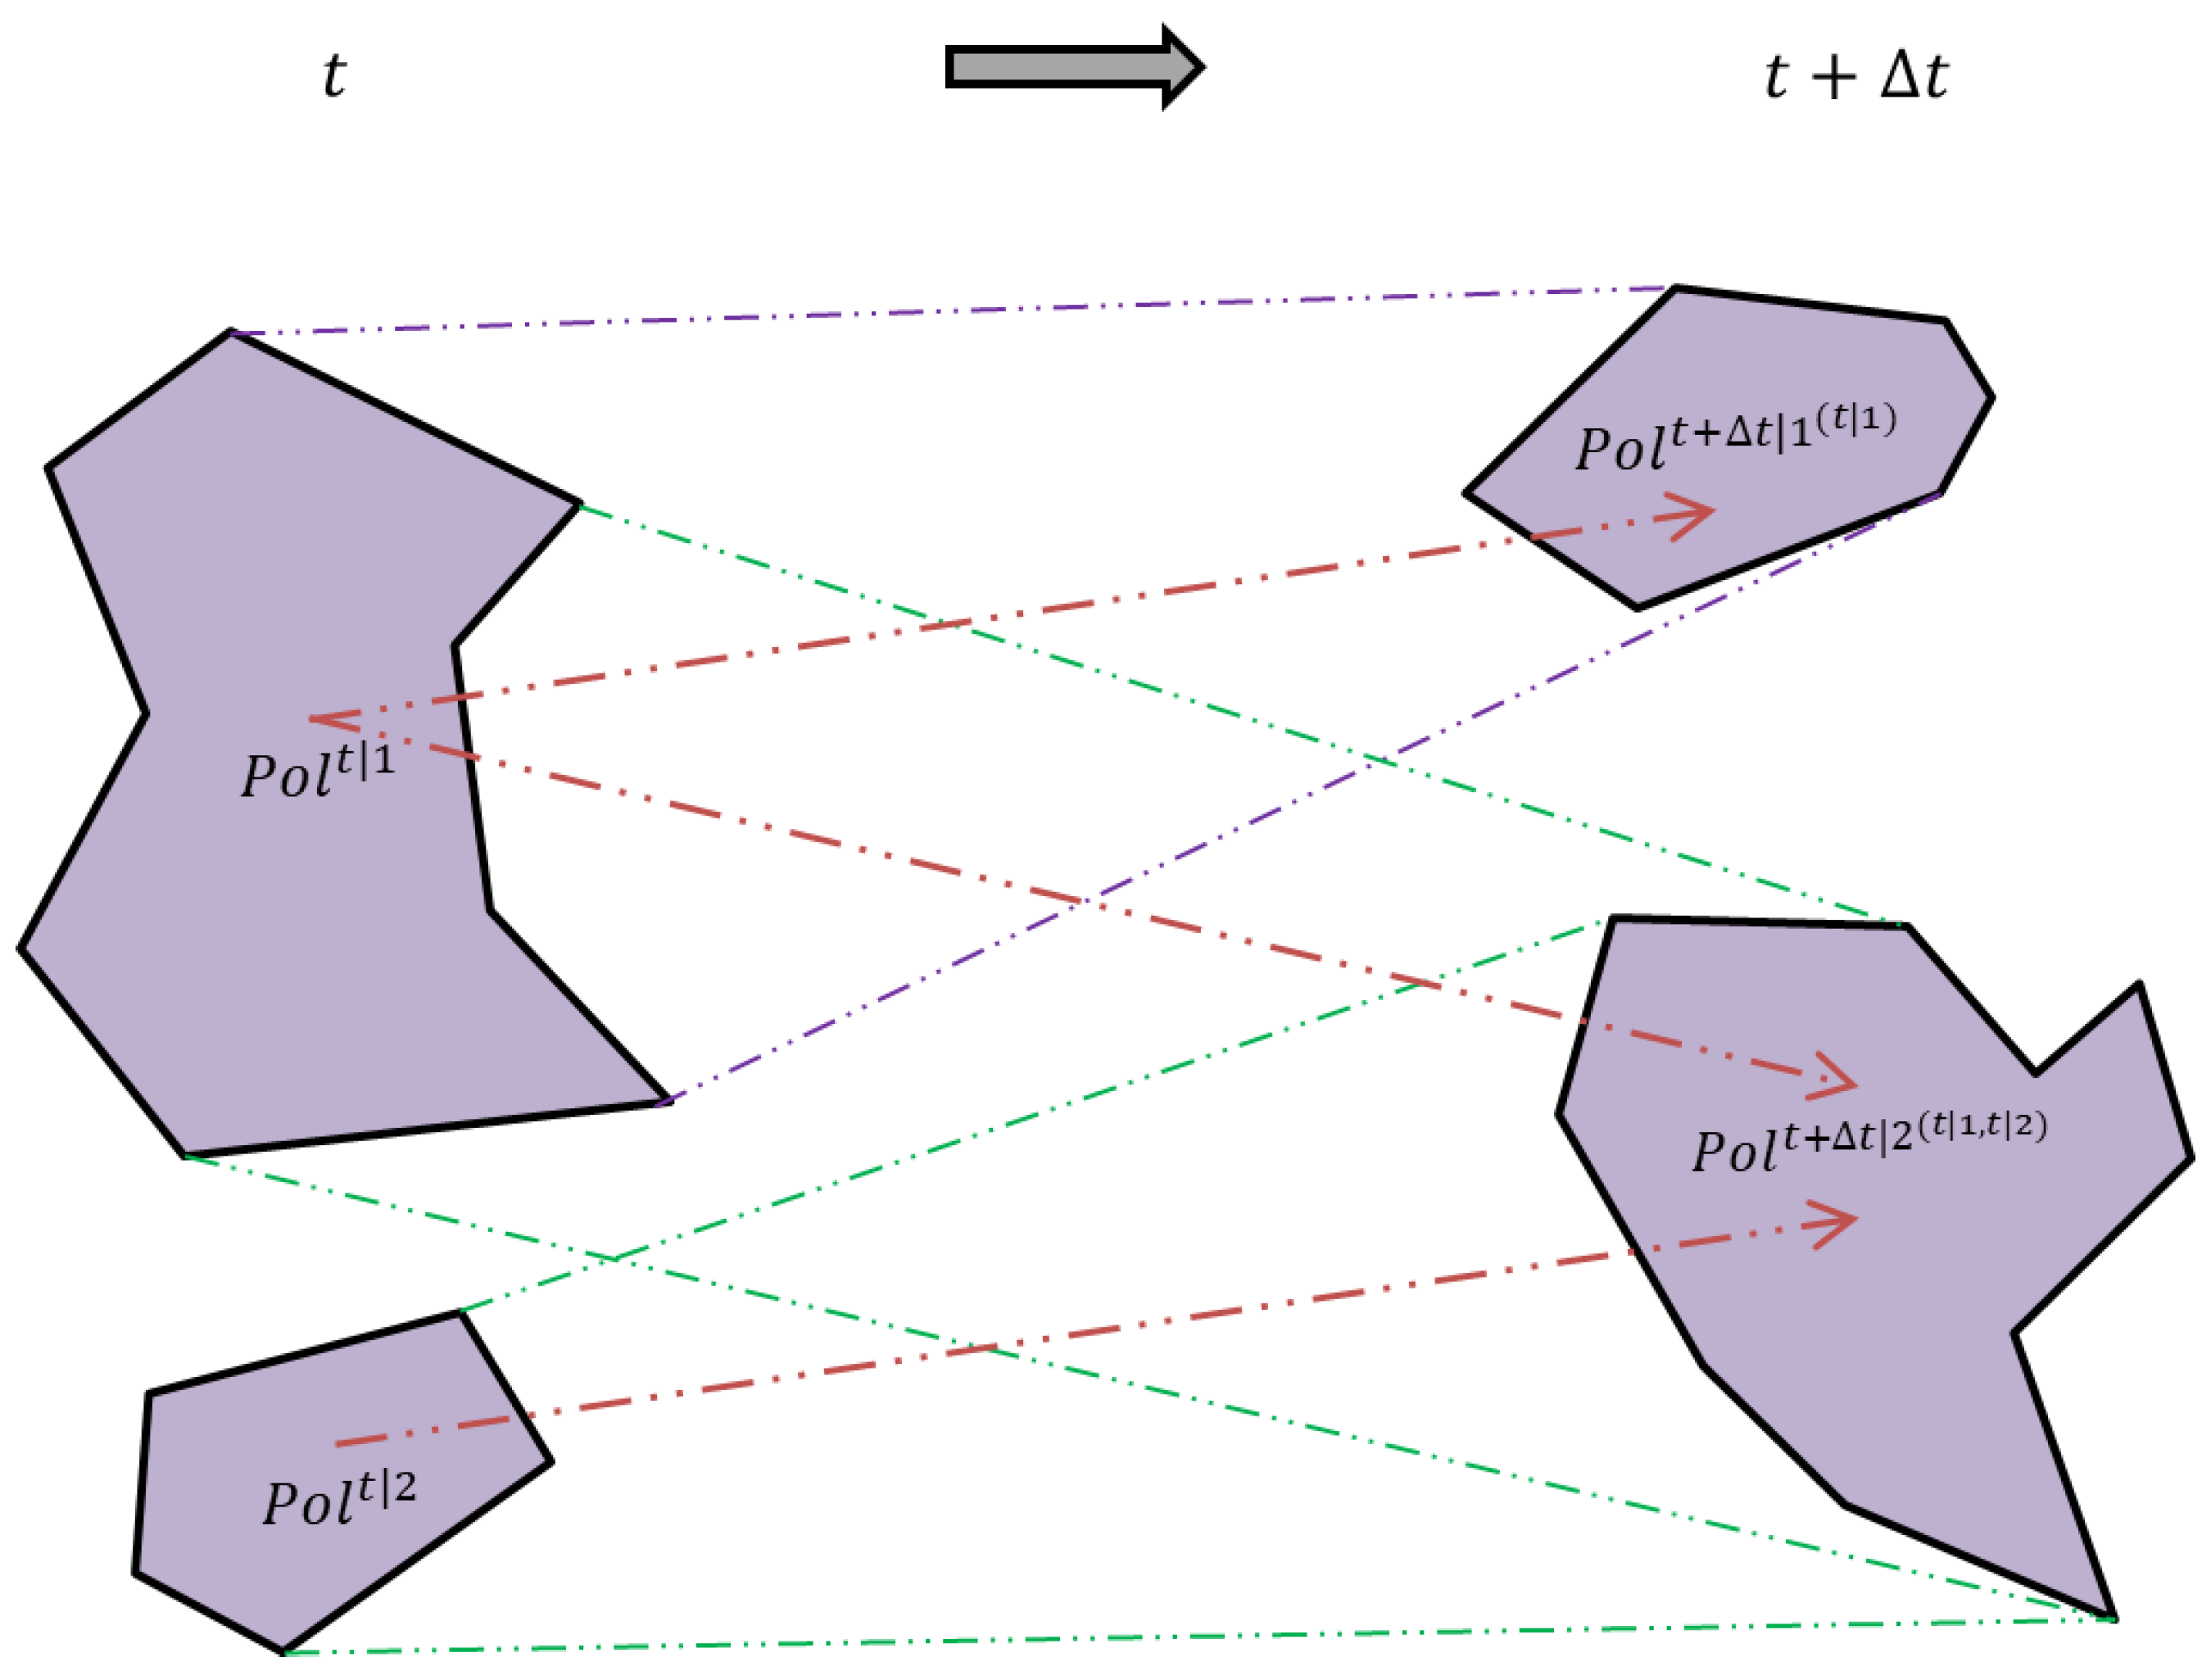
Moving and Morphing Polygons with Splitting and Merging
During the development of occluded fronts, the splitting and merging of individual convective areas always occurs, as well as a shift in the main precipitation areas within the front. For this reason, it is important that an animated presentation format on a traffic situation display can also reproduce these developments as realistically as possible. The mapping of polygons in the splitting case to perform the interpolation of their transformation is shown in
Figure 6. The polygon
at the current time t decomposes over the time period
in four parts, namely
, …,
, as illustrated in
Figure 6. However, the splitting contours are unknown and, as a consequence, the space between appearing parts is not safe. Therefore, as was mentioned in the previous subsection, the current polygon
is mapped to all four forecasted polygons
,…,
. The morphing of the polygon
into each forecasted polygon
,…,
is then performed simultaneously in the way described above.
Figure 6 shows interpolation lines, additional points, and the constellation of the polygons at the time period
. Colors correspond to the mapping of the polygons. An approach to transform one polygon into several polygons, and vice versa, is hereby developed.
The mapping of whole polygons can be also used to perform a transformation in the case of the simultaneous splitting and merging of the current and forecasted polygons, i.e., when a part of one polygon splits from the polygon and another part merges with some other polygon at the same time.
Figure 7 illustrates this mapping example without decomposition.
Consequently, the presented morphing approach is applicable for general interpolation of the transformation between two sets of closed polygons representing current and forecasted adverse weather areas over a short period of time.
5. Case Studies
In the framework of the SINOPTICA project, three different severe events were selected to be analyzed. These events were identified during the summer season, when temperatures are higher and a larger amount of energy is available for the triggering of thunderstorms and the development of deep convective systems. The selected events affected the major airports of the Po Valley in northern Italy, with Milano Malpensa (MXP) having 28.8 million passengers affected in 2019 and Bergamo Orio al Serio (BGY) having 13.9 million passengers affected:
11 May 2019 in MXP: A squall line hitting the Malpensa airport producing a large amount of hail. There was no landing for over 1 h at the airport and eight flights were diverted;
7 July 2019 in BGY: General instability affected the Po Valley with intense thunderstorms. Strong downbursts caused some diversions and huge flight delays;
6 August 2019 in MXP and BGY: High atmospheric instability with thunderstorms and hail hitting the Bergamo and Malpensa airports in the late afternoon. Several cancellations and diversions occurred during the event.
5.1. Synoptic Analysis
On 11 May 2019, the Po Valley was affected by strong convective activity that caused economic damage and seriously injured a person in the Lombardy region. The synoptic scenario at 500 hPa was characterized by a stretched trough extending from northern Europe to the Mediterranean basin. In the afternoon hours, the cold air mass at 500 hPa reached the Po Valley with values around −26 °C and the winds consequently shifted to the northwest [
46]. On the other hand, the strong south-westerly flow at low levels moved a large amount of water vapor from the Ligurian Sea to the inland, thus increasing convective instability. These meteorological factors produced favorable conditions for the triggering of convective cells over northern Italy. In this context, a squall line hit MXP, producing intense precipitation and a large amount of hail on aprons and runways. The intense thunderstorm also caused several floods in the city of Milan, where some underpasses and metro stations were closed. Instead, the strong downburst winds caused the felling of trees and billboards that required the intervention of firefighters.
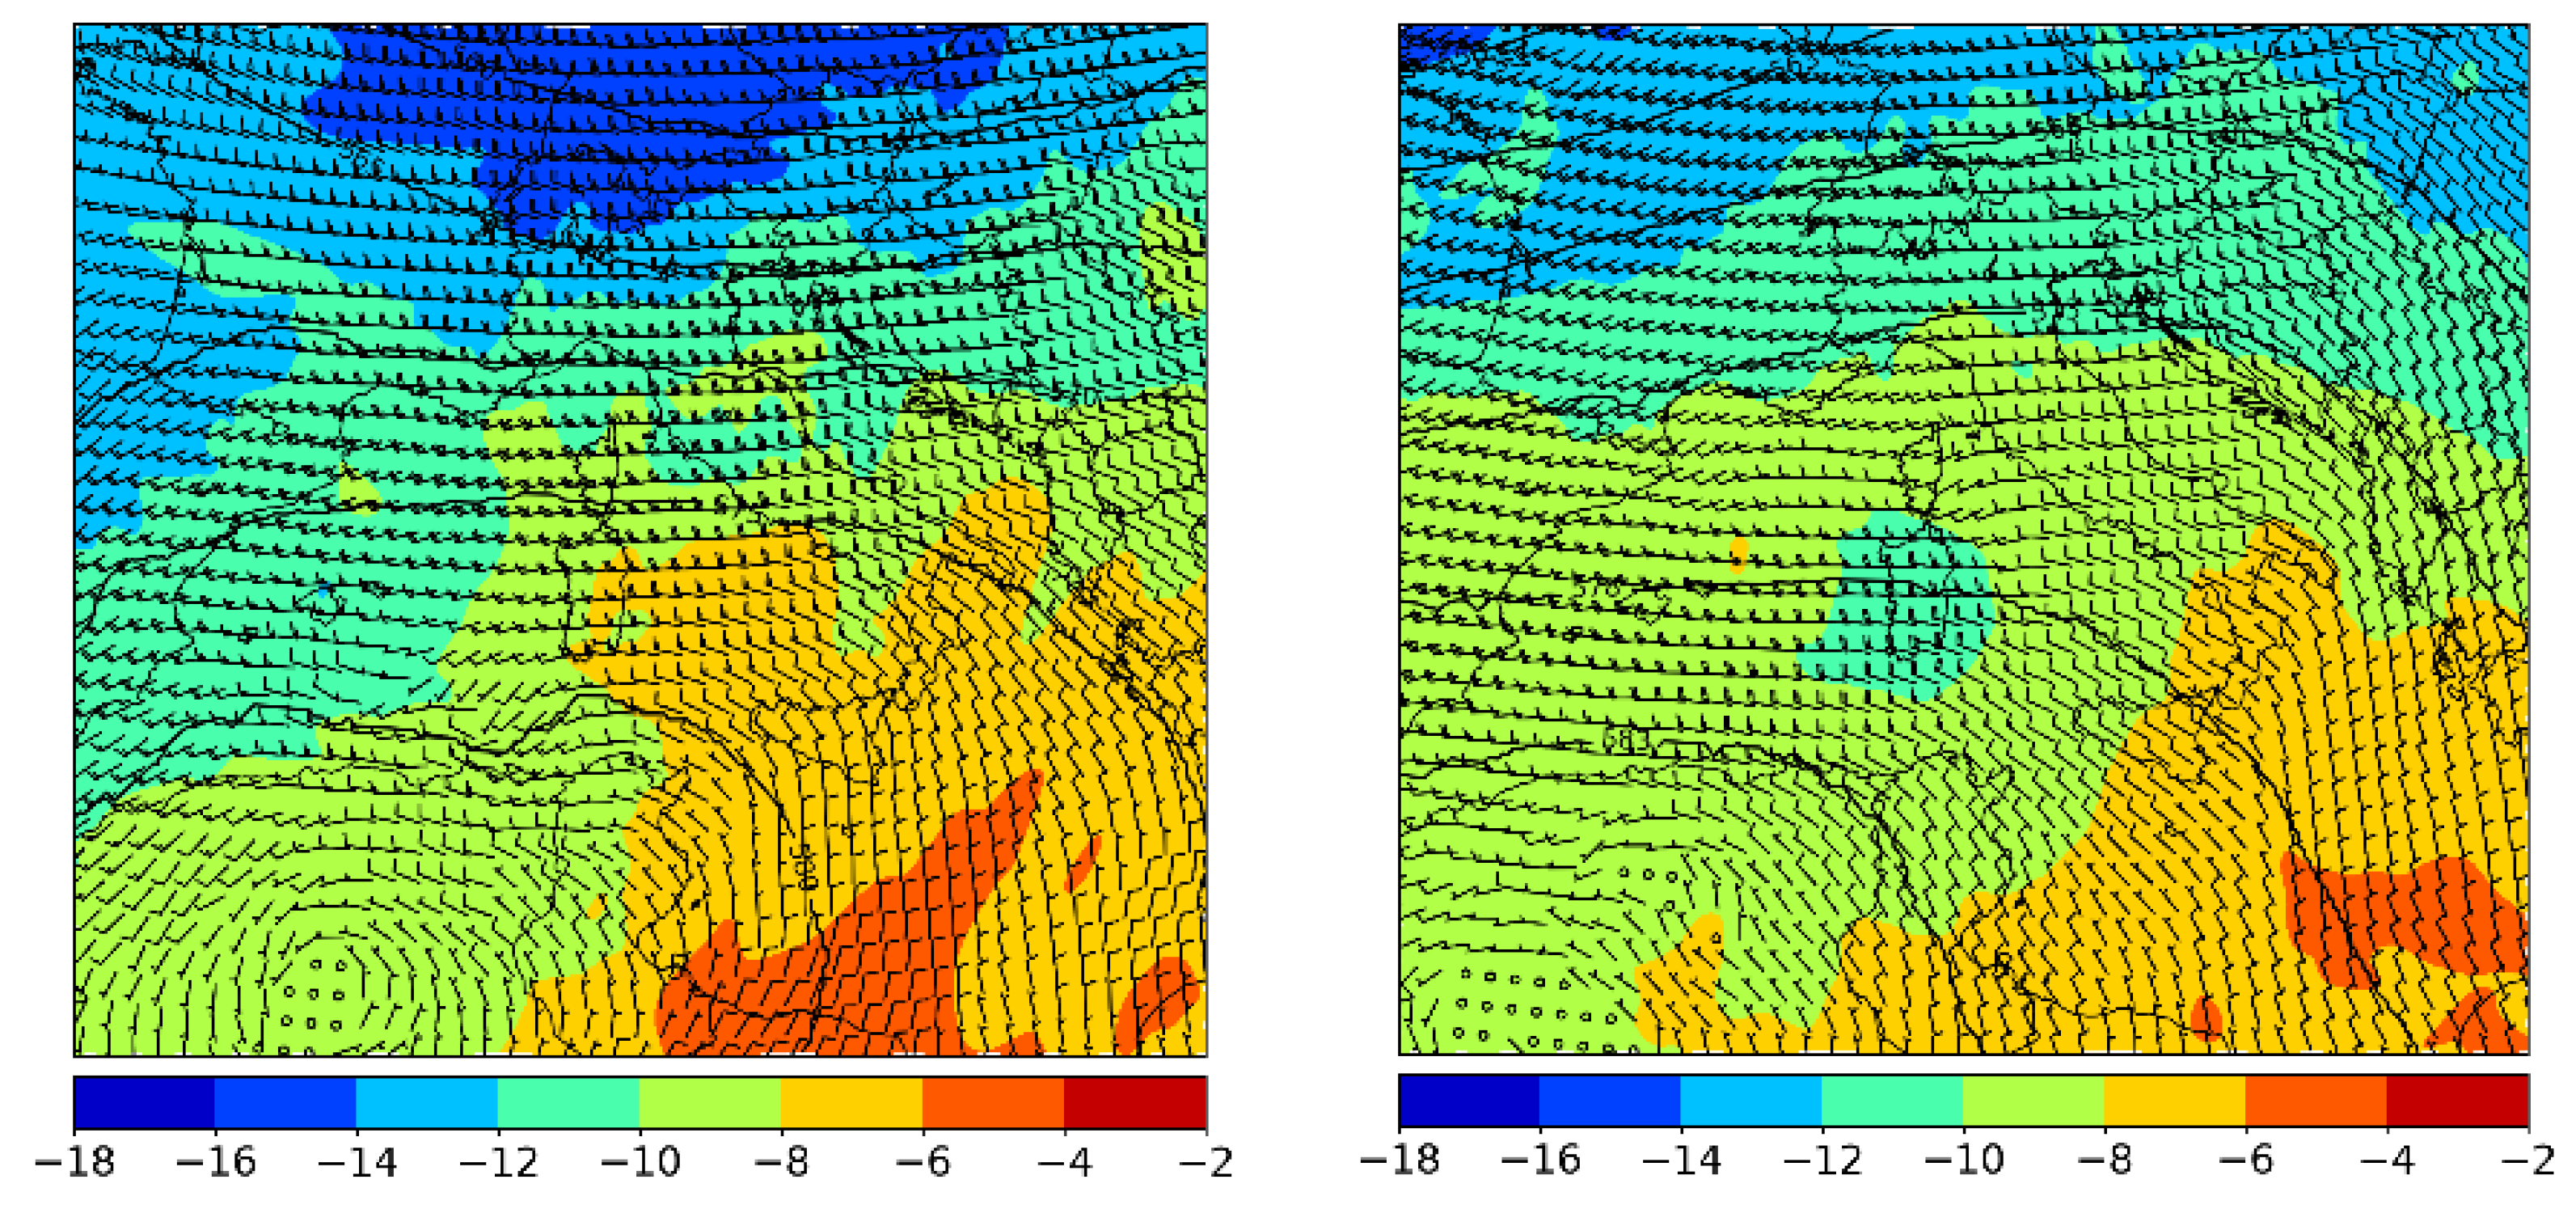
On 7 July 2019, the Po Valley was affected by precipitation with a prevalent character of thunderstorms, which was locally very intense and associated in various cases with hail and strong gusts of wind. From a synoptic point of view, in the north of Italy, an anticyclonic field of subtropical nature was retreating towards central-southern Italy under the pressure of more unstable North Atlantic currents at high altitude (
Figure 8, left panel). The huge energy reservoir in the lower layers of the atmosphere (humid heat conditions) that had accumulated in the previous days favored the triggering of the first thunderstorms over the Alps as early as midday of 7 July 2019. The intense westerlies moved the first storms towards the plain around 13:00 UTC, but a second group of organized cells hit the central and eastern Po Valley between the late afternoon and evening, producing various forms of damage: numerous garages, basements, roads, and underpasses were flooded, and some buildings were evacuated.
On 6 August 2019, an anticyclone circulation characterized the synoptic scenario over the Mediterranean basin and ensured atmospherically stable conditions and sunny weather over the southern regions of the Italian peninsula (
Figure 8, right panel). On the other hand, a deep trough located over the British Isles affected central Europe by touching the Alpine chain during the evening and causing a worsening of the weather conditions over the pre-Alps. In this area, the presence of cold air at 500 hPa, with values around −13 °C, increased the instability of the air column, thus promoting the development of convective cells. In addition, the high values of specific humidity, namely the content of water vapor, at 850 and 950 hPa, in combination with wind shear conditions, easterly wind at 950 hPa, and southerly wind at 850 hPa, produced a very unstable environment. From the early evening, some convective cells affected the Bergamo and Milan provinces with moderate rainfall. Later, the passage of moisture advection over the Alps between 18:00 UTC and 00:00 UTC provided further energy for the convection. Consequently, a more intense convective storm hit the central sector of the Po Valley and produced heavy precipitation, strong wind gusts, and small hail.
5.2. Traffic Analysis: Historical Traffic under Adverse Weather Conditions at Milano Malpensa and Bergamo Airports
In order to evaluate the influence of adverse weather conditions on air traffic in the extended TMA around MXP and BGY, located at ca. 77 km distance from each other, FlightRadar24 datasets from three different selected days with severe events—11 May 2019, 7 July 2019, and 6 August 2019—were analyzed.
In the case of MXP, there were two available days—7 July 2019 and 6 August 2019—without airport closure under disturbed weather conditions and one day—11 May 2019—when adverse weather conditions caused temporal closure of the airport. For BGY, there were two days—11 May 2019 and 7 July 2019—in the dataset where adverse weather did not lead to an airport closure and one day—6 August 2019—when the airport was temporarily closed. As the airports are located adjacent to each other, it is of interest to investigate the datasets in pairs in order to analyze the influence of the changing capacity of one airport on the second one. Therefore, the following pairs of data were considered:
On 7 July 2019, both airports operated under adverse weather conditions without closures;
On 6 August 2019, BGY was temporally closed; however, MXP was open all the time;
On 11 May 2019, MXP was closed for some period of time due to bad weather conditions, whereas BGY continued operations.
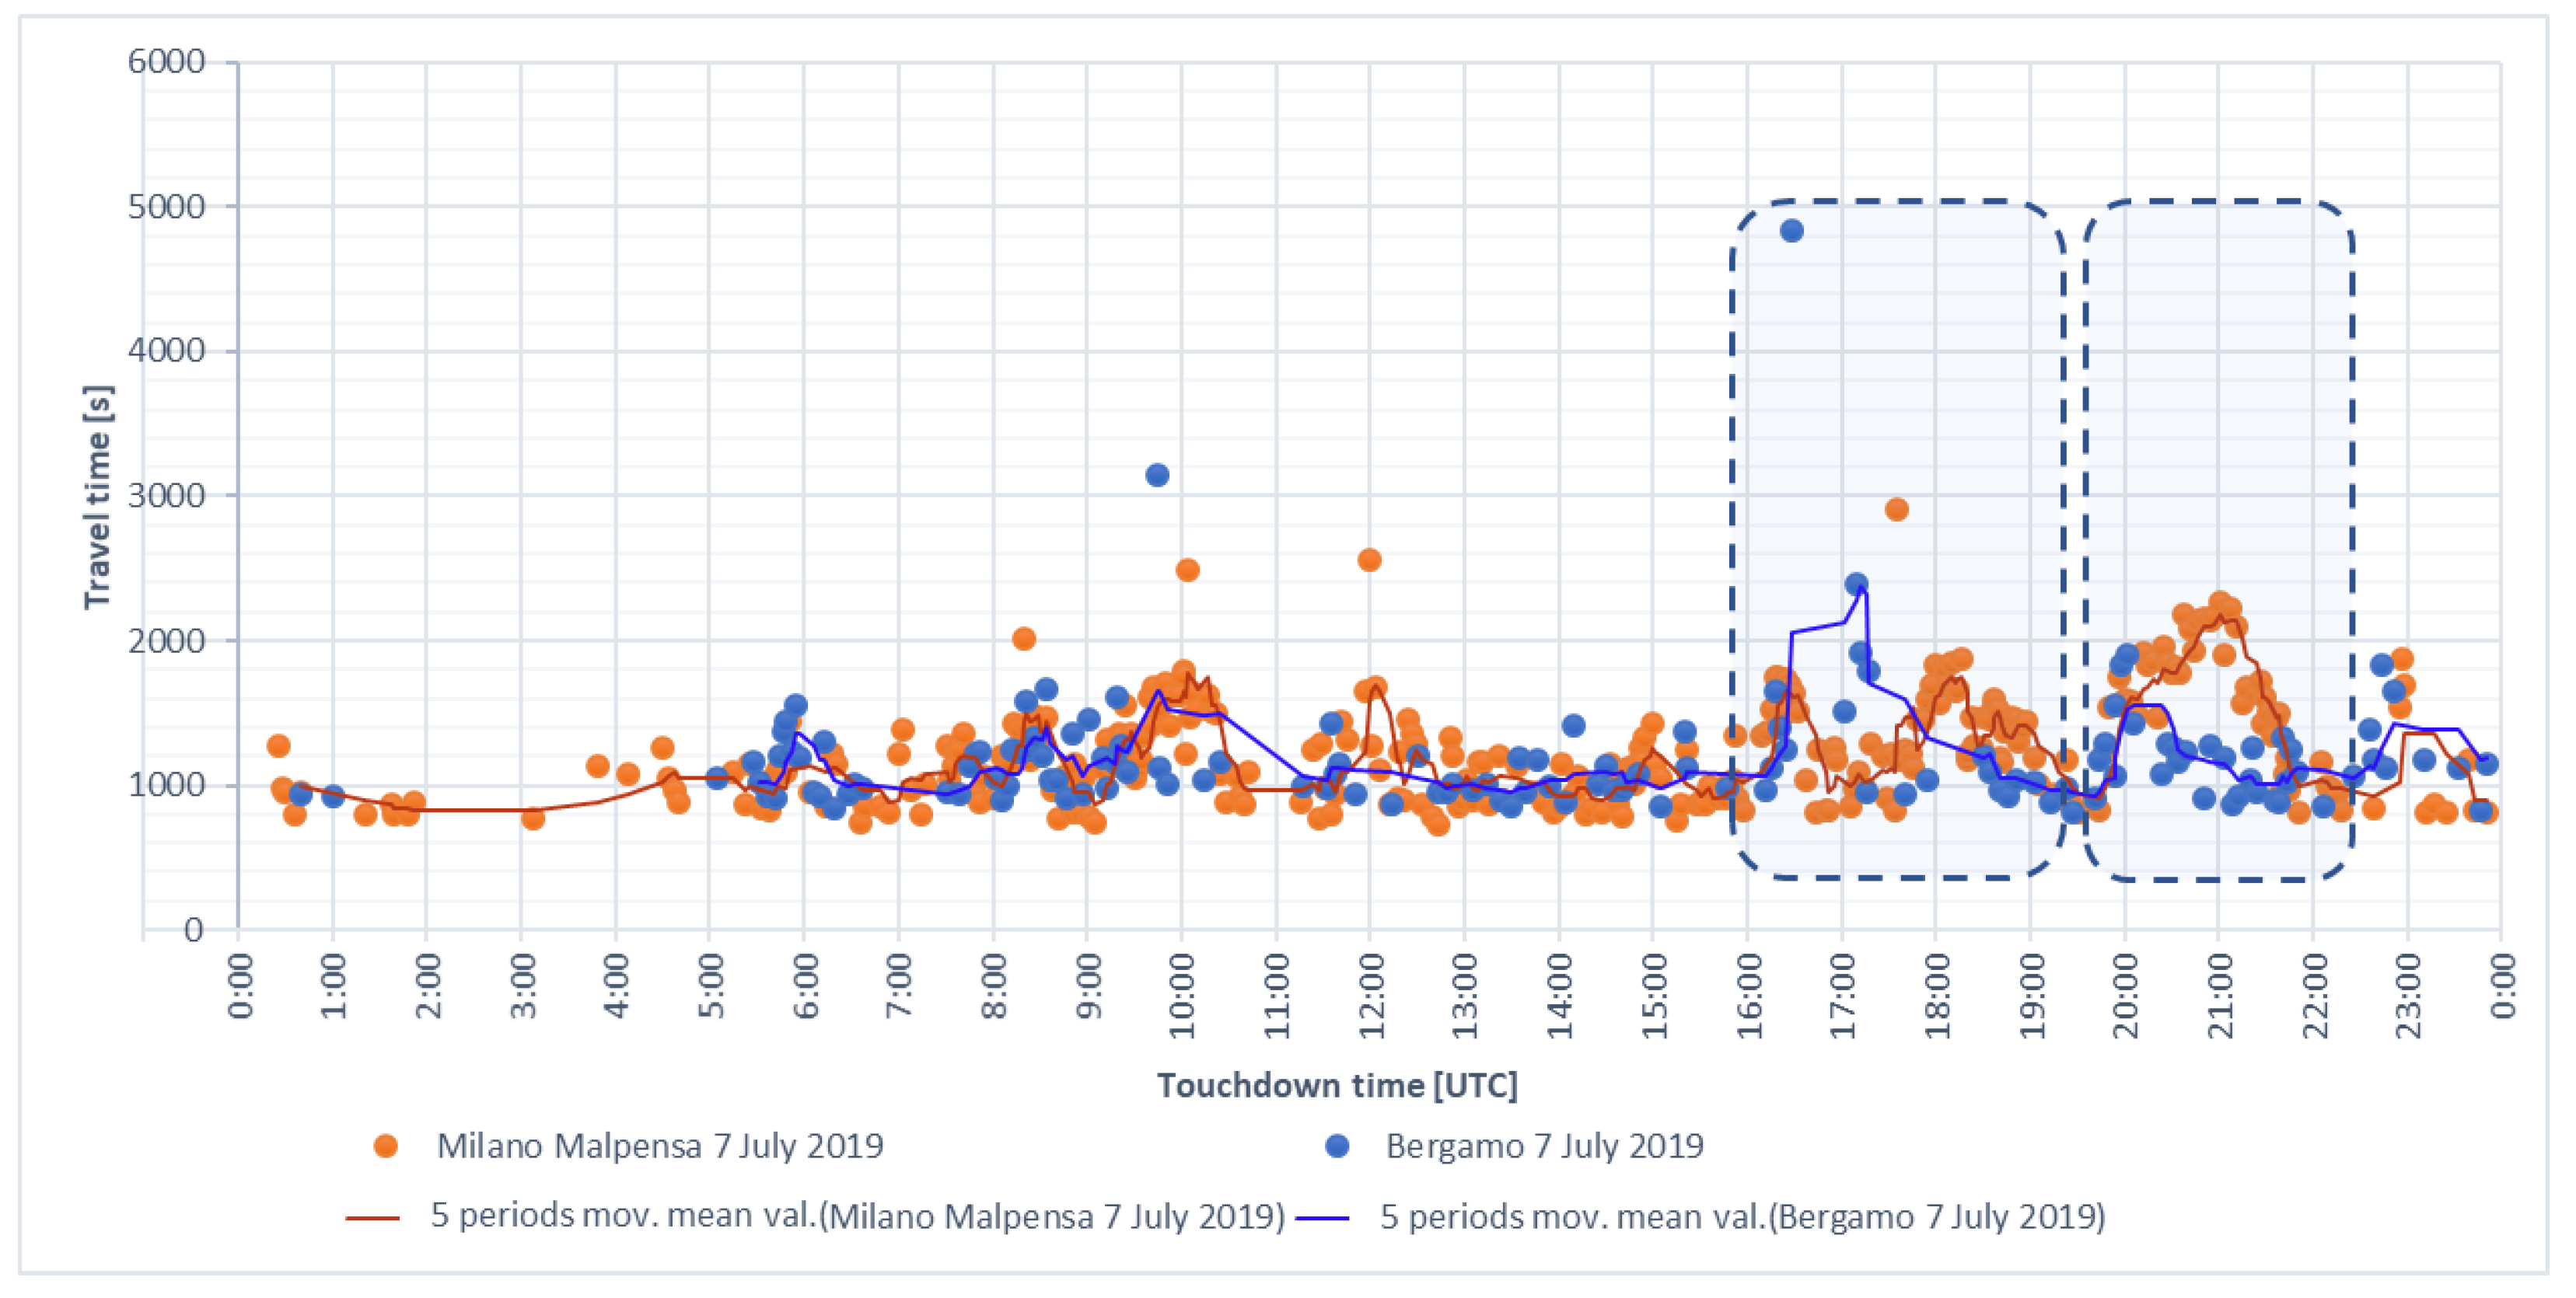
The first two datasets recorded on 7 July 2019 contain 322 arrivals at MXP and 144 arrivals at BGY. The travel time of arrivals in the extended TMA and touchdown time are illustrated in
Figure 9 in orange for MXP and in blue for BGY. In order to detect peak times while smoothing the influence of outliers, a moving mean value over five neighbor travel times was calculated. These mean values are shown as dark blue and dark orange lines in
Figure 9. In the case of MXP, the time until landing in the extended TMA varied between 693 and 2913 s with an average time of 1246 s and five peak periods, the most noticeable of which was between 19:30 UTC and 21:30 UTC (
Figure 9). The maximal and the average flown distances in the extended TMA were approximately 302 and 168 km, respectively, whereas the average flown distance at the mentioned peak period was equal to 225 km (i.e., 57 km longer than the average flown distance over the whole day).
In the same day, there were two outlier arrivals at BGY in terms of travel time in the extended TMA. Taking them into account, the time until landing varied between 817 and 4836 s, with an average travel time of 1186 s. The detectable peak period is between 16:15 UTC and 17:30 UTC (
Figure 9). The maximal and the average flown distances in the extended TMA are approximately 718 and 160 km, respectively. The average flown distance at the peak time amounts to 247 km with the outlier arrival and 194 km without it. Even without the outlier, the average flown distance during the peak period is 34 km longer than the corresponding value over the whole day.
Summing up, there are two possible coherent peaks at the considered airports that may have been caused by weather conditions. These peaks are pairwise-marked by the areas bounded by the dotted lines in
Figure 9.
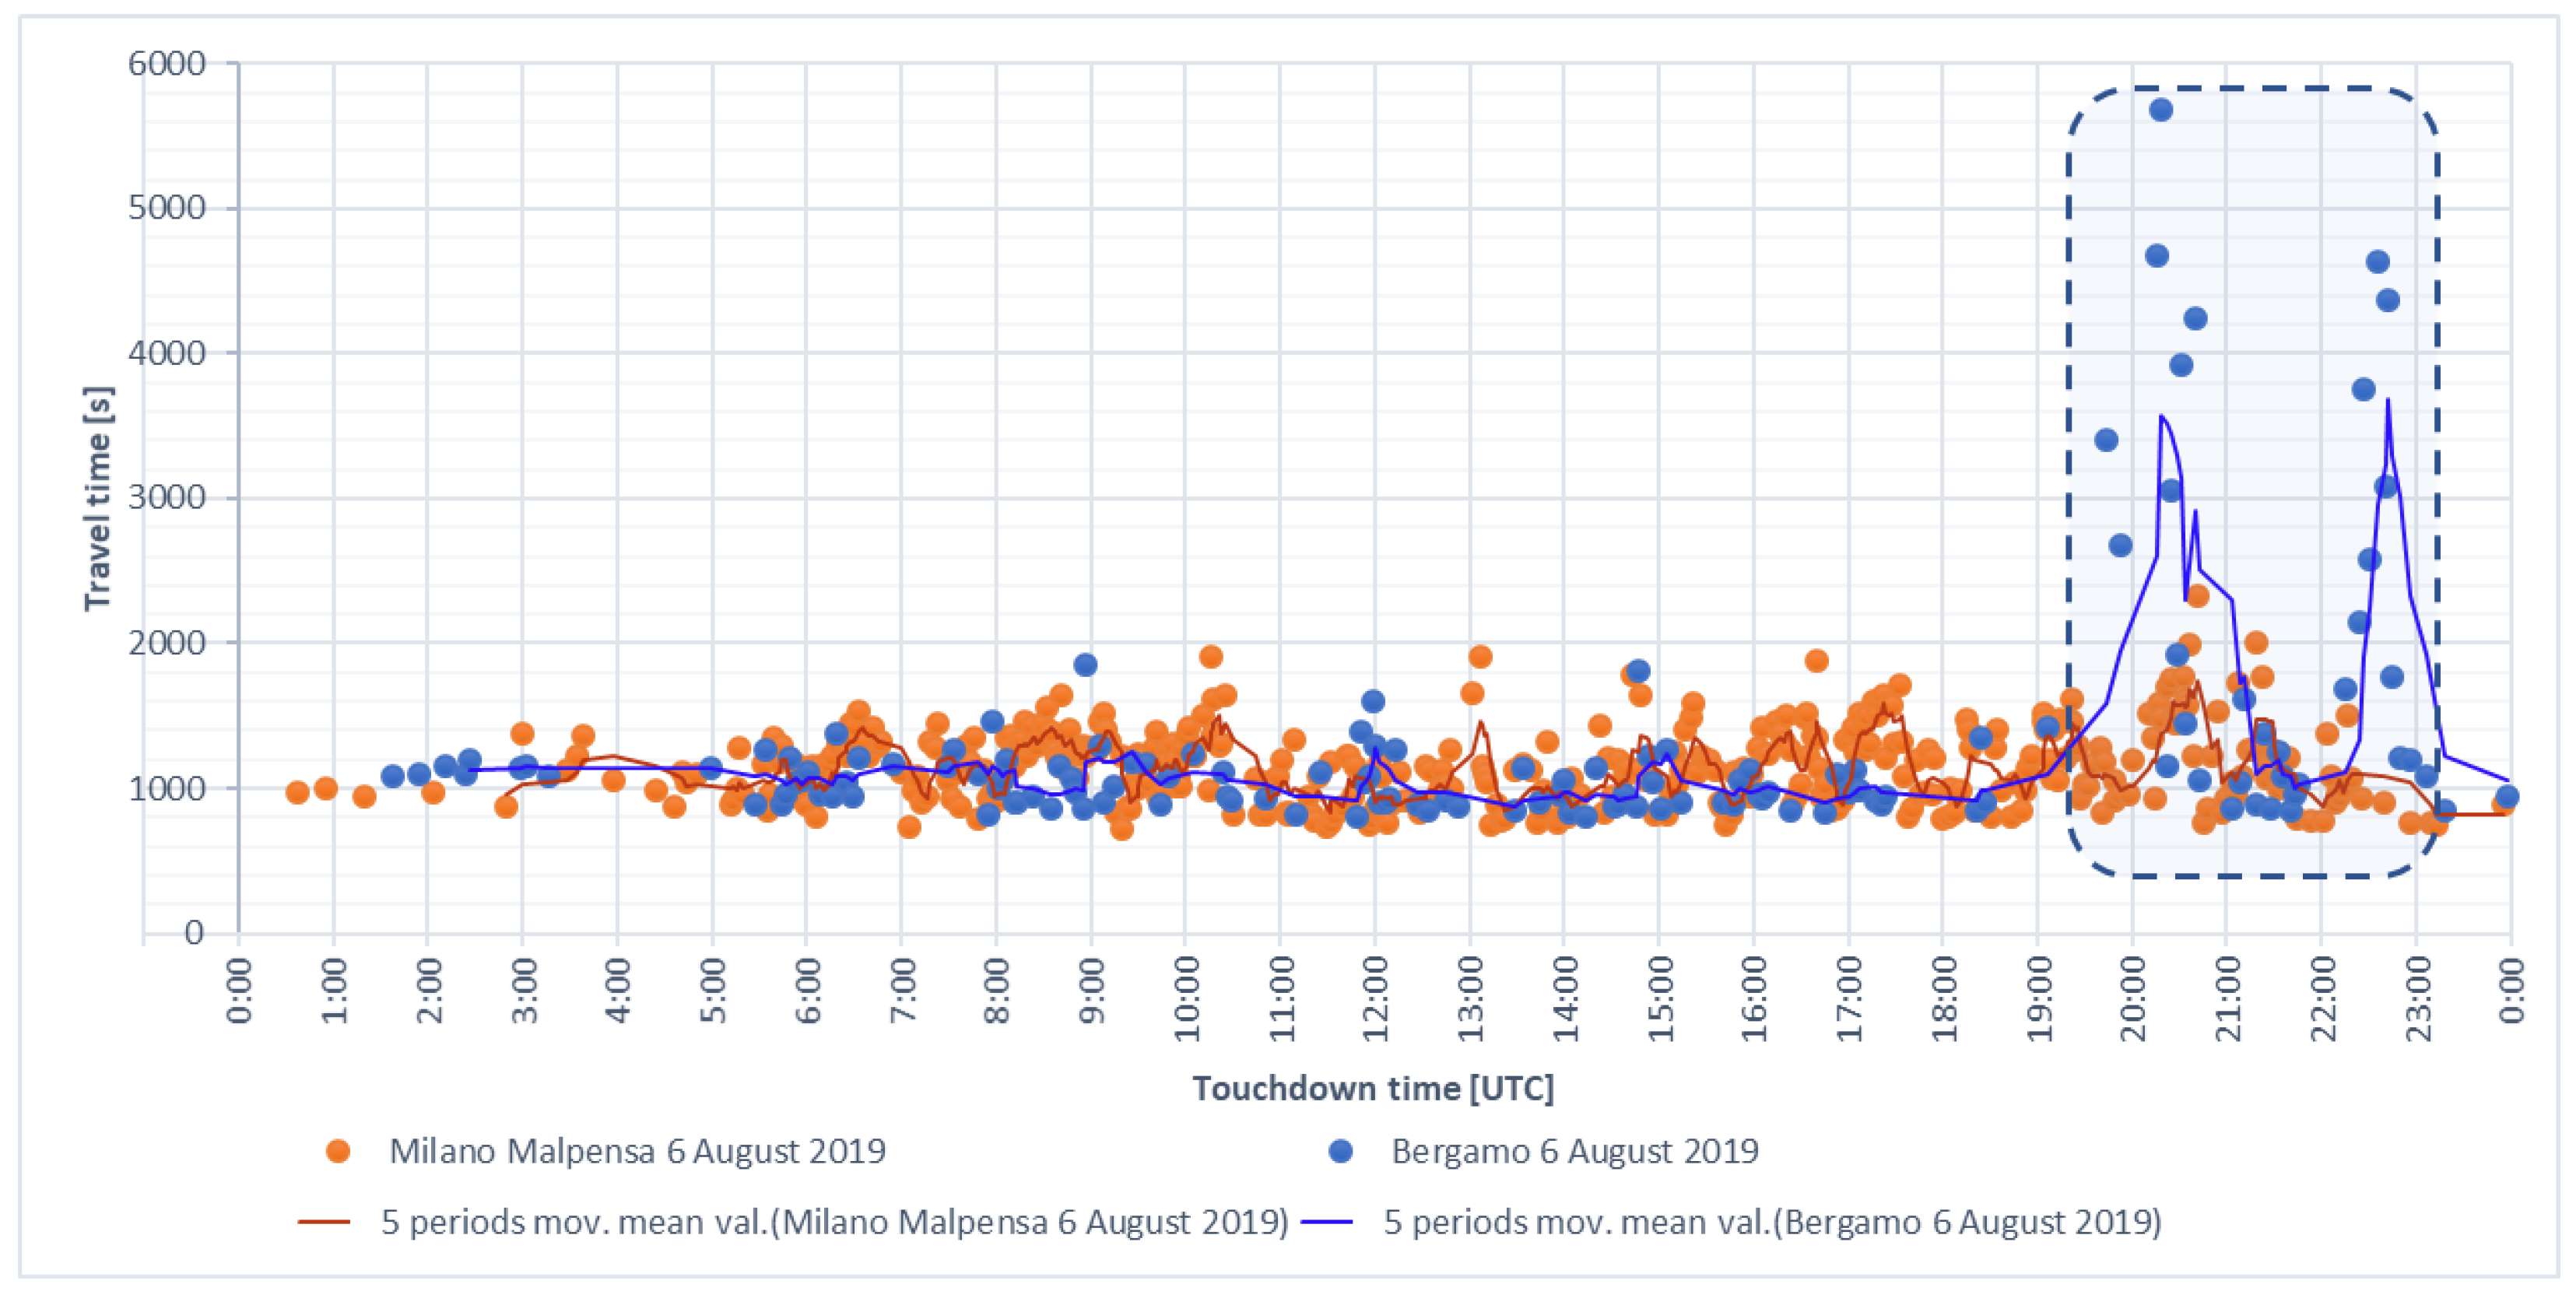
The second pair of datasets collected on 6 August 2019 contains 421 arrivals. It includes 99 more arrivals than the traffic scenario on 7 July 2019 for MXP and 144 arrivals for BGY. The travel time in the extended TMA and the touchdown time of arrivals are shown in
Figure 10. The time until landing in MXP’s extended TMA was between 715 and 2436 s, with an average travel time of 1161 s. The maximal and the average flown distances in the extended TMA were approximately 352 and 161 km, respectively. In spite of the fact that this scenario is larger than the previous one for MXP, it has lower values for maximal and average travel time and, as a consequence, average travel distance.
In the same day, the time until landing in the extended TMA around BGY was between 703 and 5679 s, with an average of 1332 s. There are two peaks with respect to travel time in the extended TMA between 19:30 UTC and 23:15 UTC, which are marked by the areas bounded by the dotted lines in
Figure 10. The maximal and the average flown distances in the extended TMA were approximately 739 and 185 km, respectively.
The average flown distance during peak time amounts to 310 km and is, through temporal closures of runways, at least 63 km greater than the corresponding average flown distance during the peak time on 7 July 2019, when BGY was not closed.
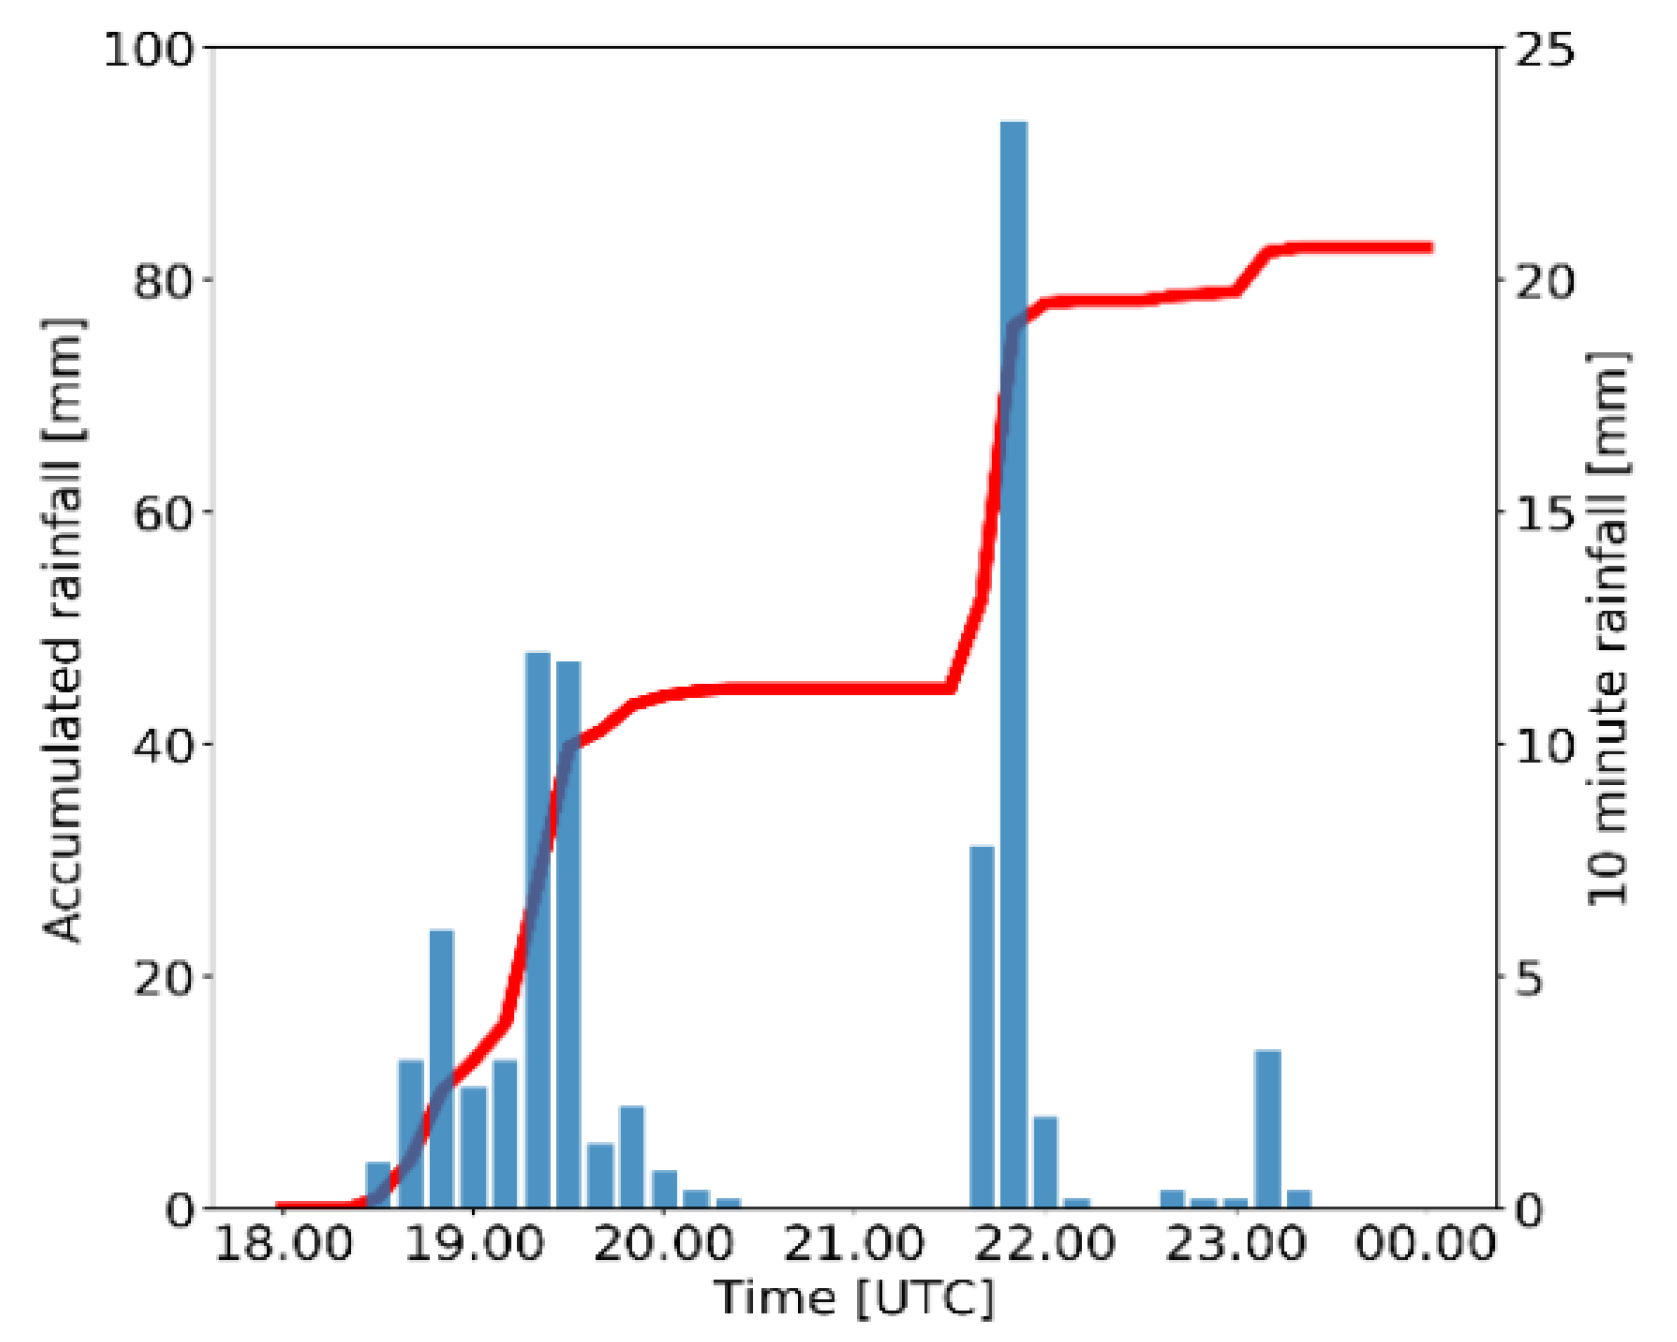
Figure 11 illustrates the accumulated rainfall per ten minutes on 6 August 2019 at BGY, which correlates with the peaks for travel time shown in
Figure 10. However, there are no significant peaks between 19:30 UTC and 23:15 UTC at the nearby MXP airport, as illustrated in orange in
Figure 10.
The last pair of datasets was recorded on 11 May 2019 and contains 233 arrivals to MXP and 122 arrivals to BGY. On this day, a squall line hit MXP between 14:00 UTC and 16:00 UTC causing intense precipitation and heavy hail formation [
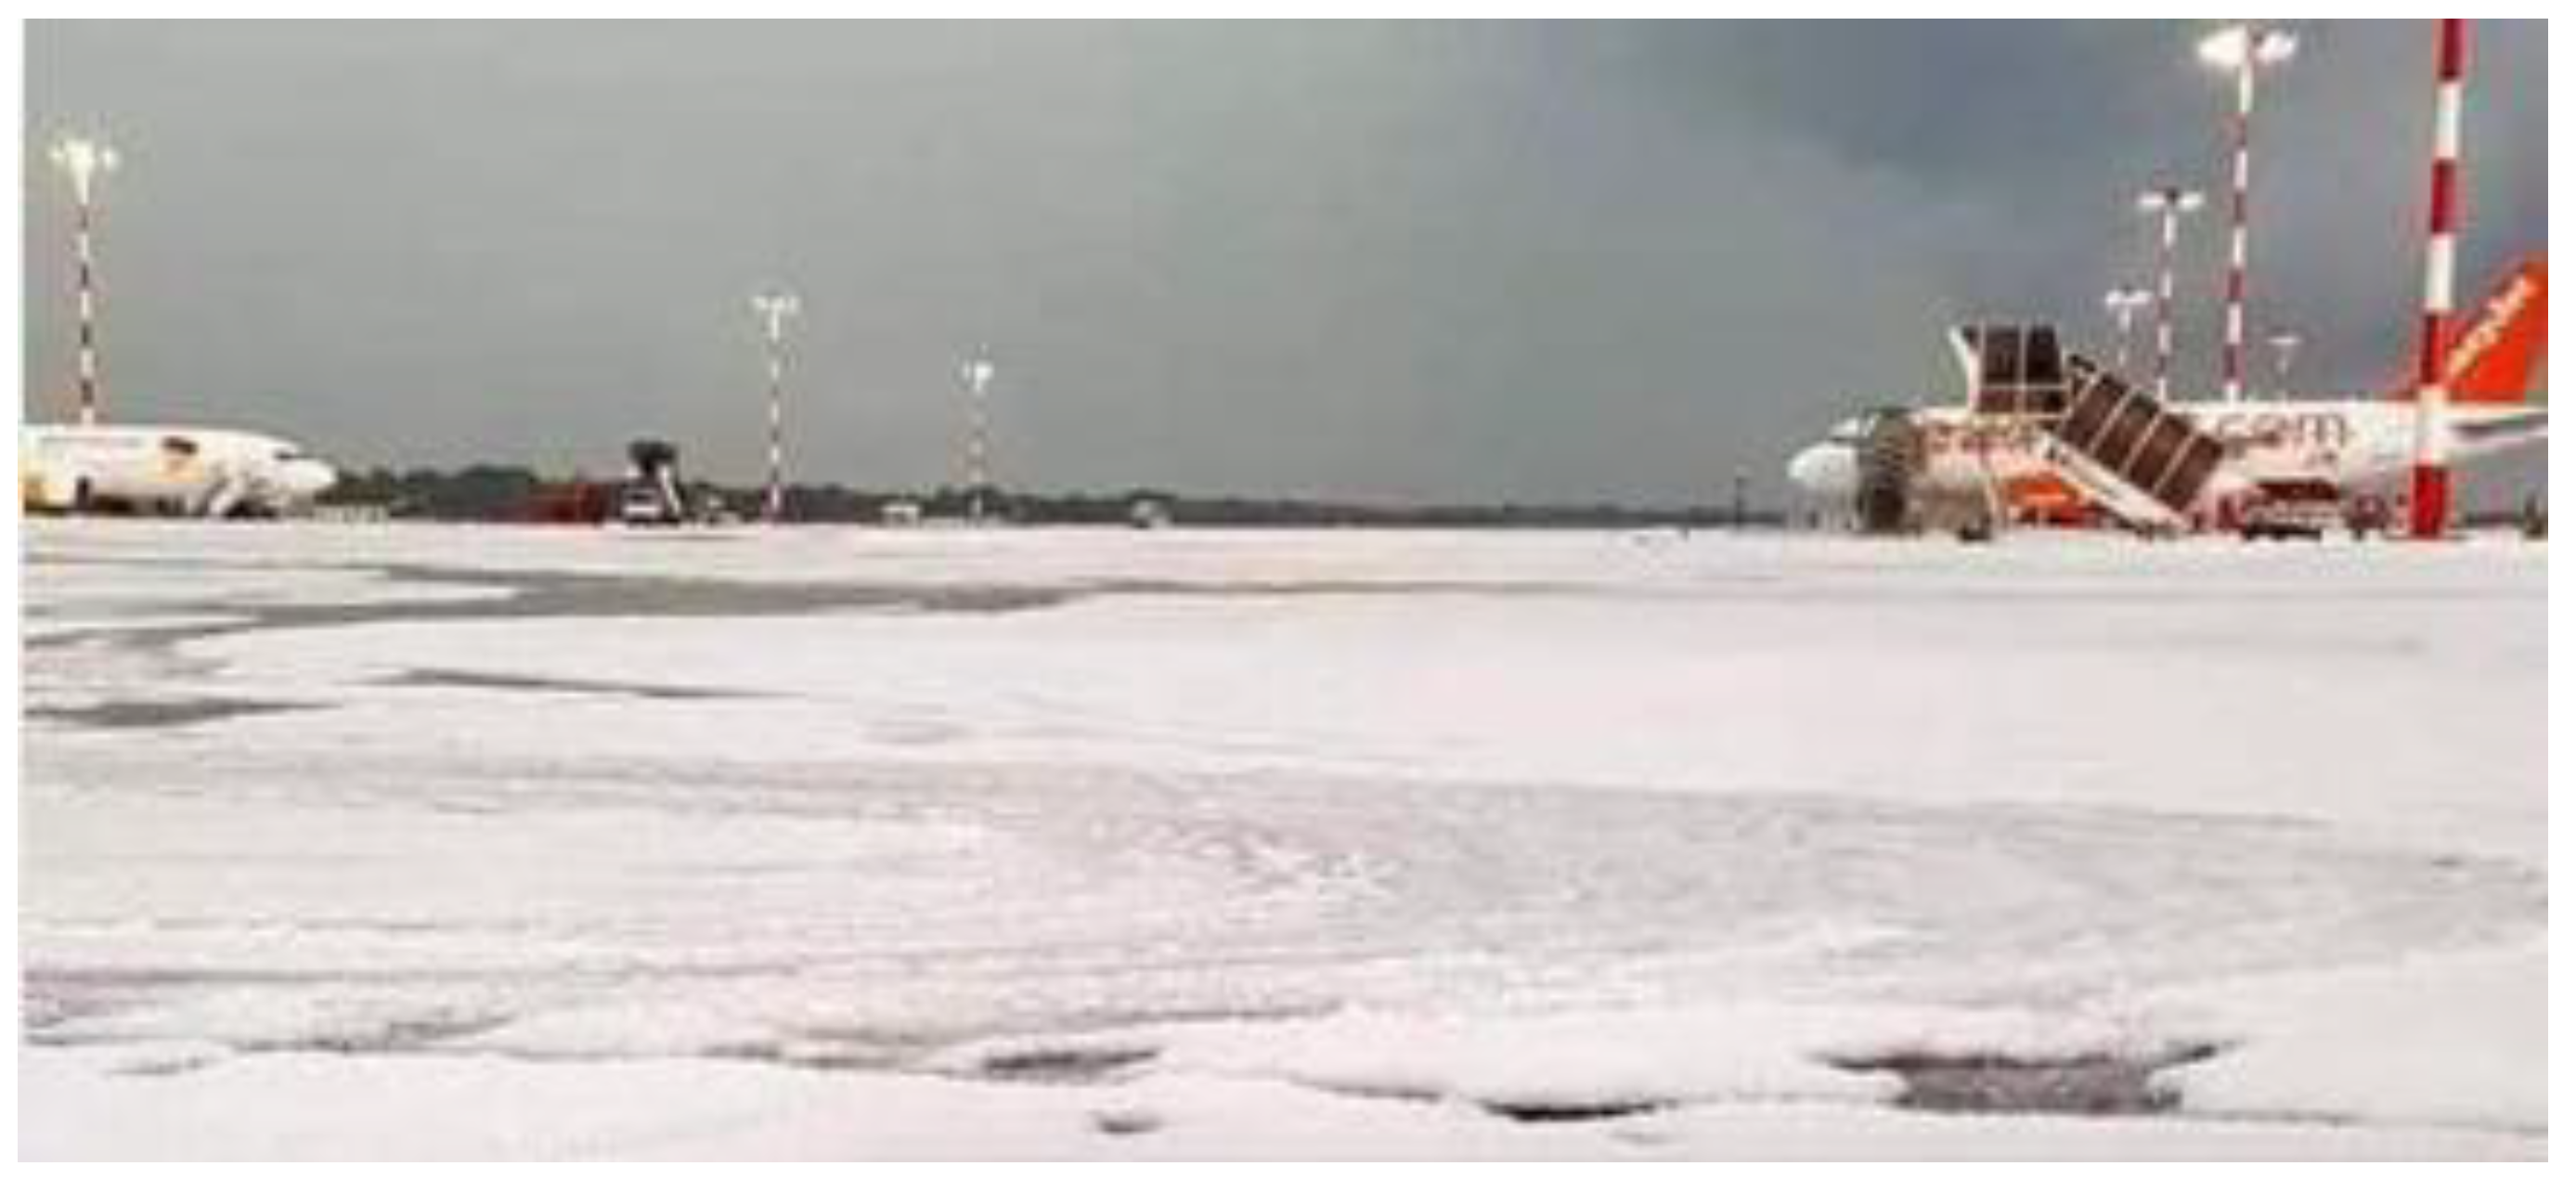
46]. These adverse weather conditions (
Figure 12) led to the airport’s closure for about 40 min and some flight delays. In addition, nine aircraft were diverted to other airports.
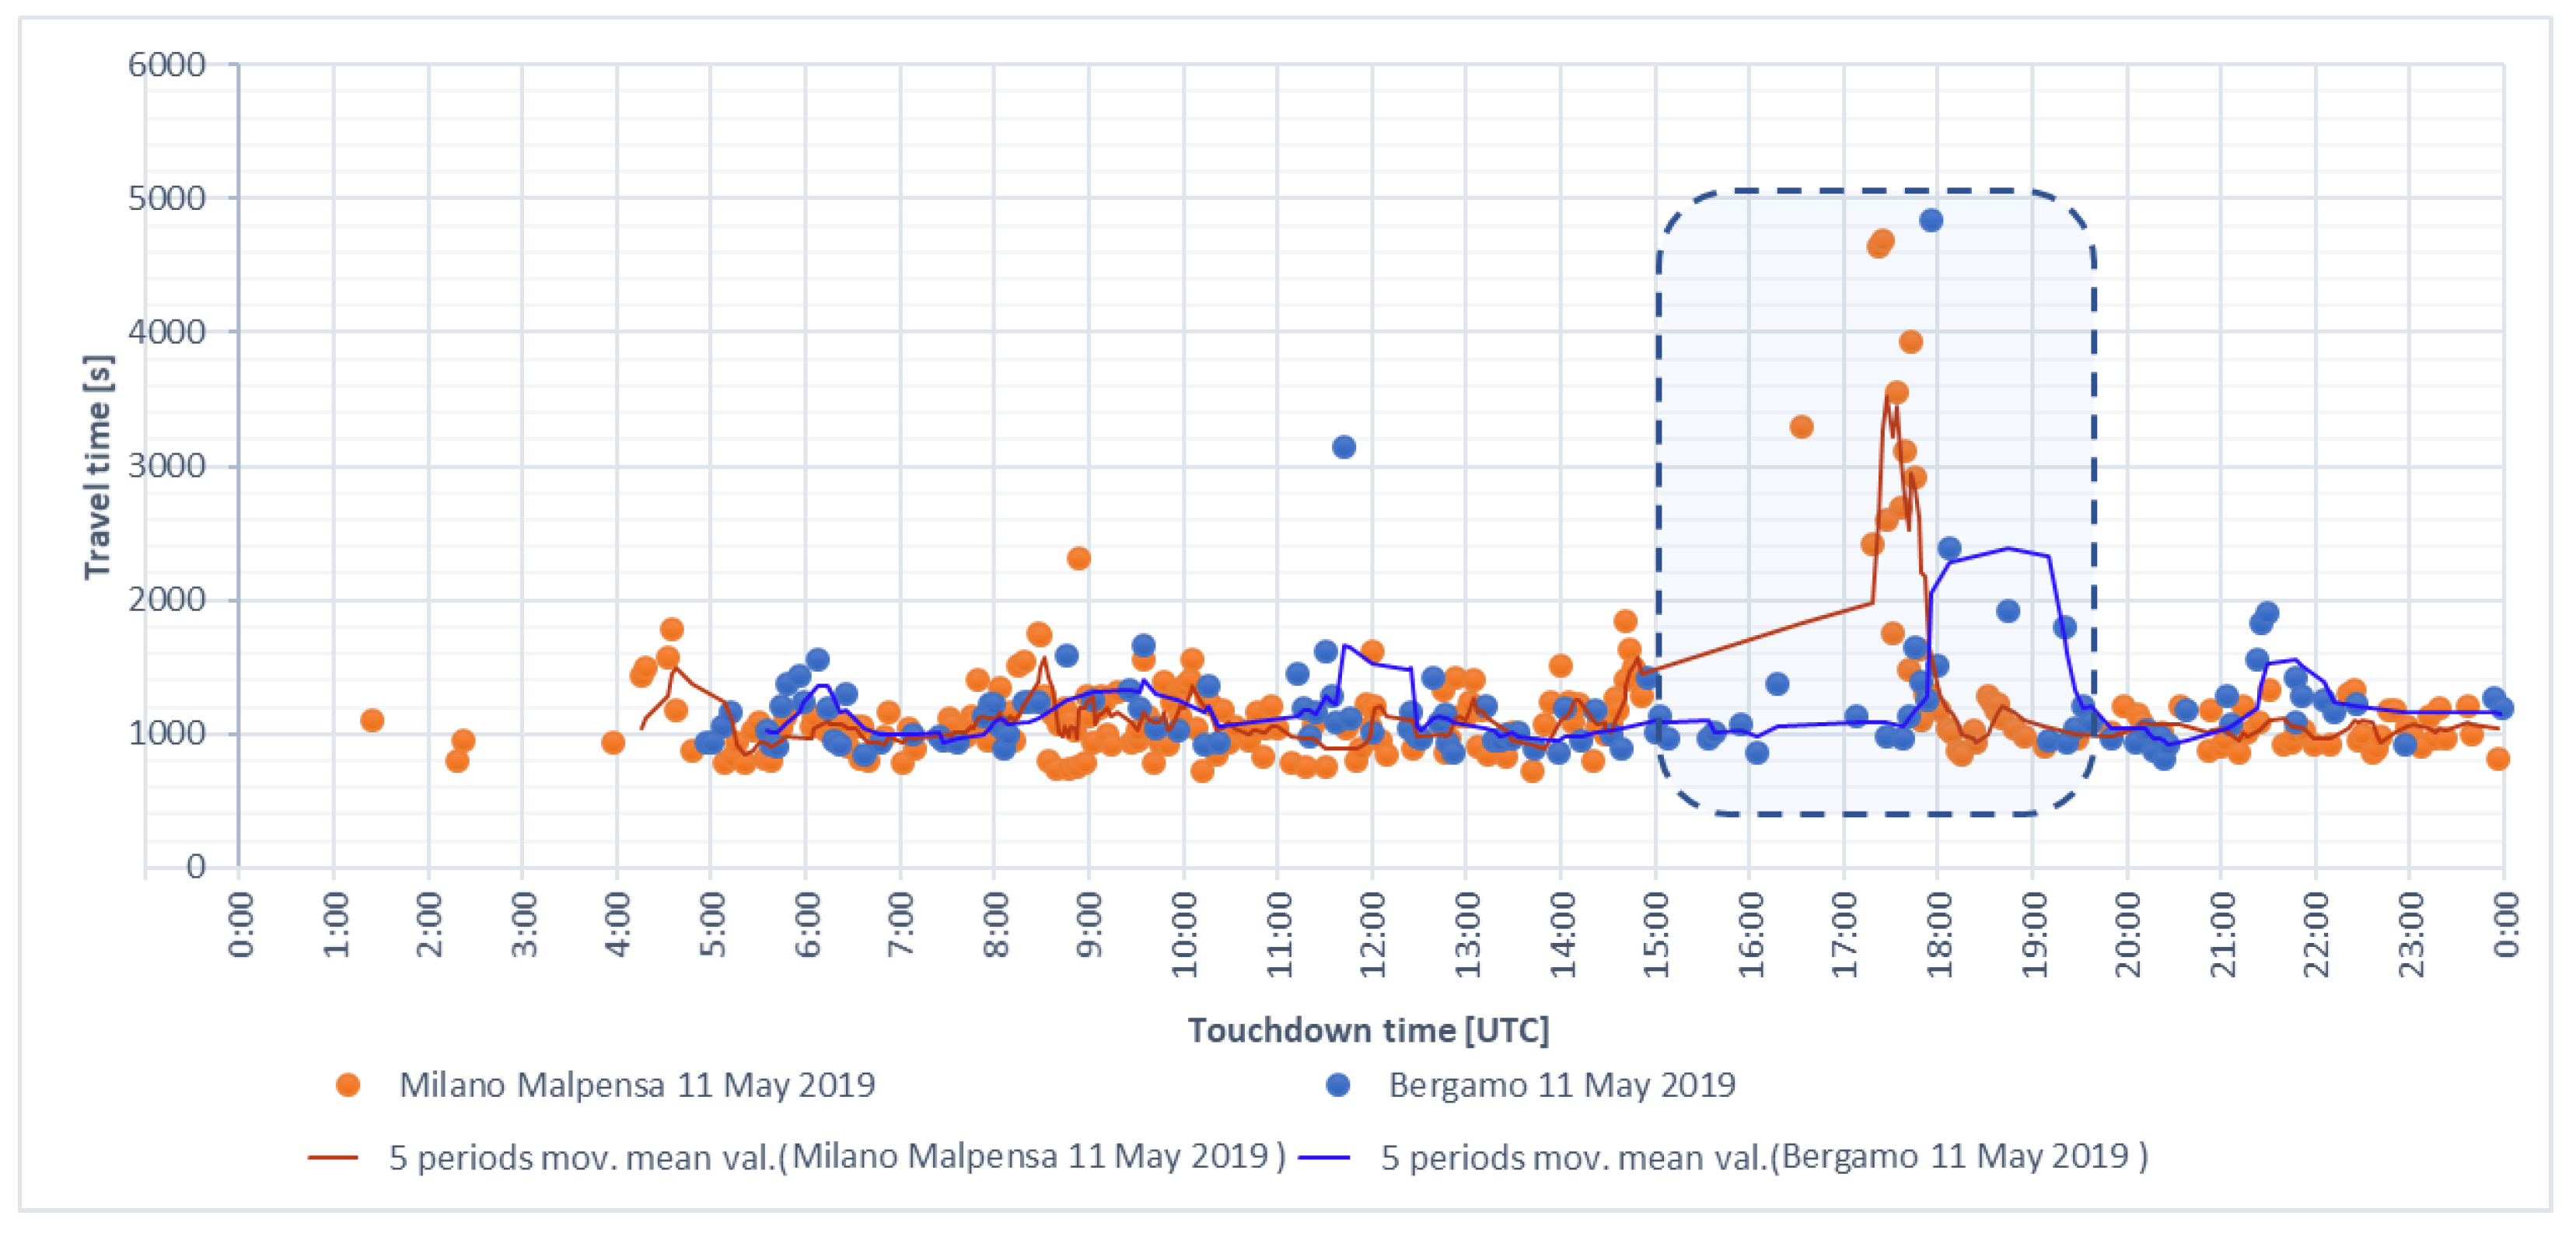
Figure 13 illustrates travel time at the extended MXP TMA, which was between 719 and 4693 s with an average of 1196 s. This distribution indicates that controllers had to guide many aircraft into holdings. According to
Figure 13, the airport was closed at around 16:00 UTC. The maximal and average flown distances in the extended TMA were approximately 676 and 165 km, respectively. The average flown distance during the peak time was equal to 349 km.
Historical traffic at BGY on 11 May 2019 indicated a time until landing in the extended TMA of between 782 and 2985 s, with an average travel time of 1197 s (
Figure 13). There was a peak period with respect to travel time between 17:30 UTC and 19:30 UTC, probably as a consequence of the weather conditions at MXP airport described above. The maximal and average flown distances at the BGY extended TMA were approximately 415 and 109 km, respectively, and the average flown distance during the peak period is equal to 215 km. Although the weather conditions at BGY did not cause a runway closure, one can notice the direct influence of the weather conditions at MXP on operations at BGY. Therefore, the historical dataset for MXP on 11 May 2019 was chosen to construct simulation traffic scenarios for investigation of the influence of adverse weather on arrival traffic.
Table 1 summarizes the mentioned parameters for the three considered case studies.
5.3. Traffic Scenario Definition
The simulations involved three traffic scenarios for the TMA at MXP, which were based on FlightRadar24 datasets of the three days (11 May 2019, 7 July 2019, and 6 August 2019). There were two days when weather conditions did not cause airport closure (7 July 2019 and 6 August 2019) at MXP, which were used as baseline scenarios, and one day with an airport closure for some period of time (11 May 2019), which was used as the disturbed scenario.
5.3.1. Scenarios
The real datasets contain 322, 421, and 233 Malpensa flights. They were manually prepared and then read with RouGe Software V1.11 from DLR (Braunschweig, Germany). All military flights, helicopters, departures, and parachutist transports were filtered. To validate the data visually, the datasets were converted to the Google Earth KML data format.
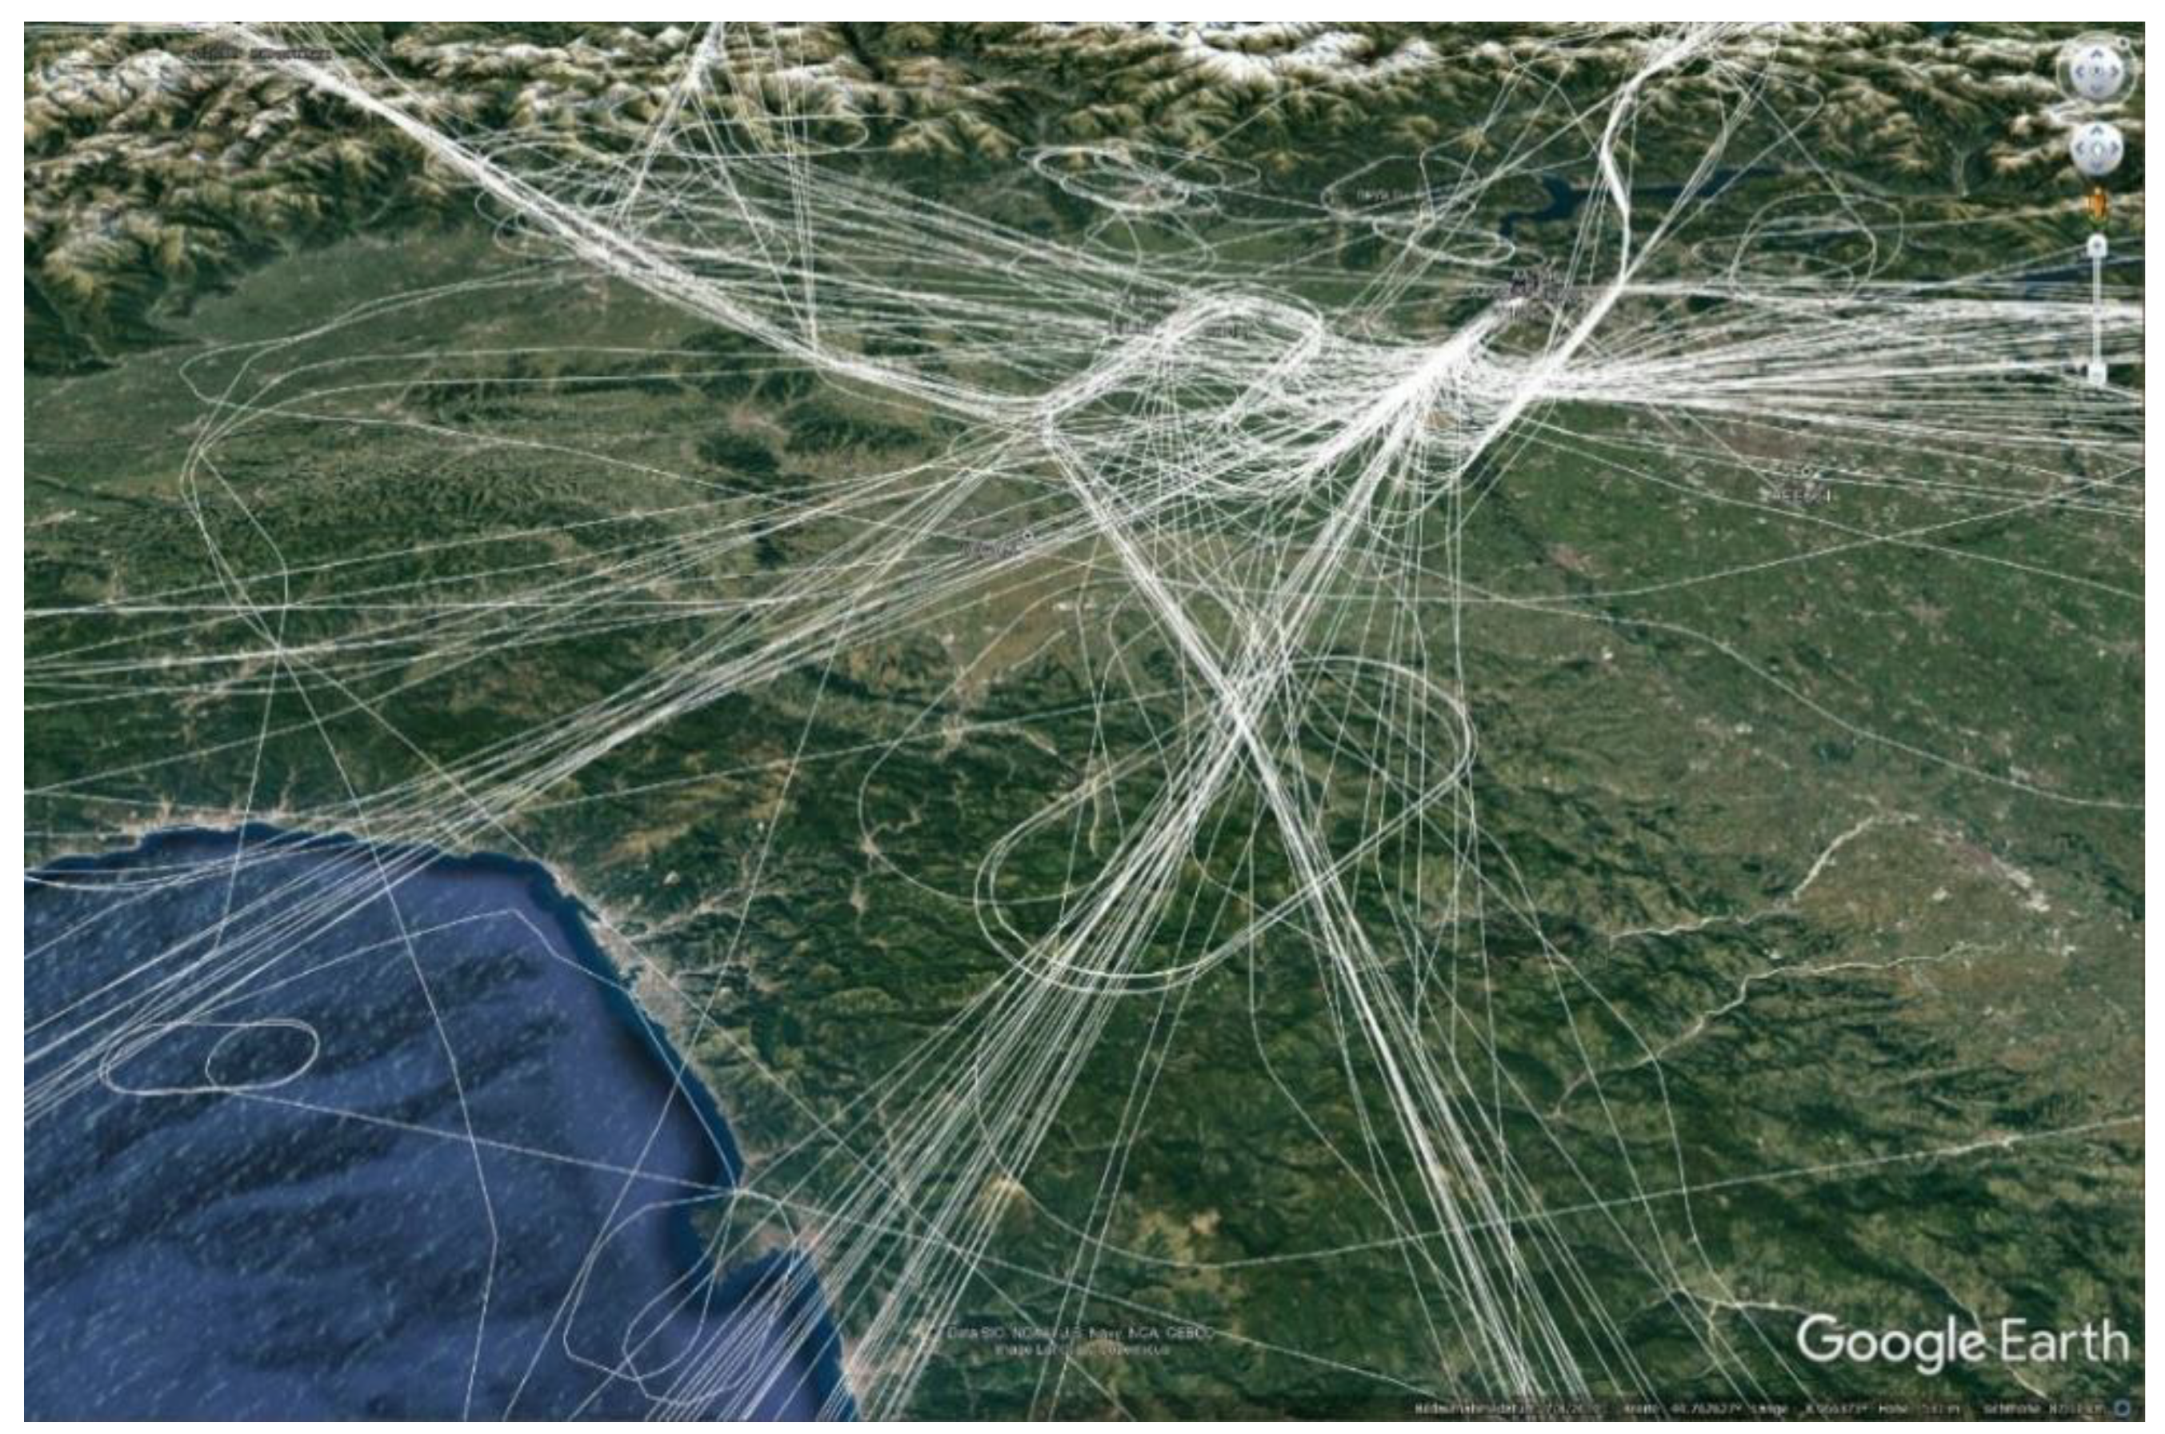
Figure 14 illustrates the flown trajectories on 11 May 2019 that occurred under adverse weather conditions. One can recognize that multiple holdings were flown due to thunderstorms at and around the TMA area.
Figure 15 shows the flown trajectories on 6 August 2019 under normal undisturbed weather conditions.
The FlightRadar24 data prepared as simulation scenarios contain the following information about callsign, aircraft type, weight category, position data plus time, speed, flight altitude, and heading.
The constructed simulation scenarios were each planned using an AMAN with no adverse weather as a baseline and weather forecasts from different forecast models for two different severe weather events. Flight paths, times, the number of clearances, and fuel consumption were used as key performance indicators (KPI) to compare these models. The considered traffic scenario is based on the dataset from 11 May 2019. Seven scenarios were planned using an AMAN and simulated:
Without MET information (baseline);
With MET data from the WRF-RUC, PhaSt, and RaNDeVIL models for the weather of 11 May 2019;
With MET data from the WRF-RUC, PhaSt, and RaNDeVIL models for the weather of 6 August 2019.
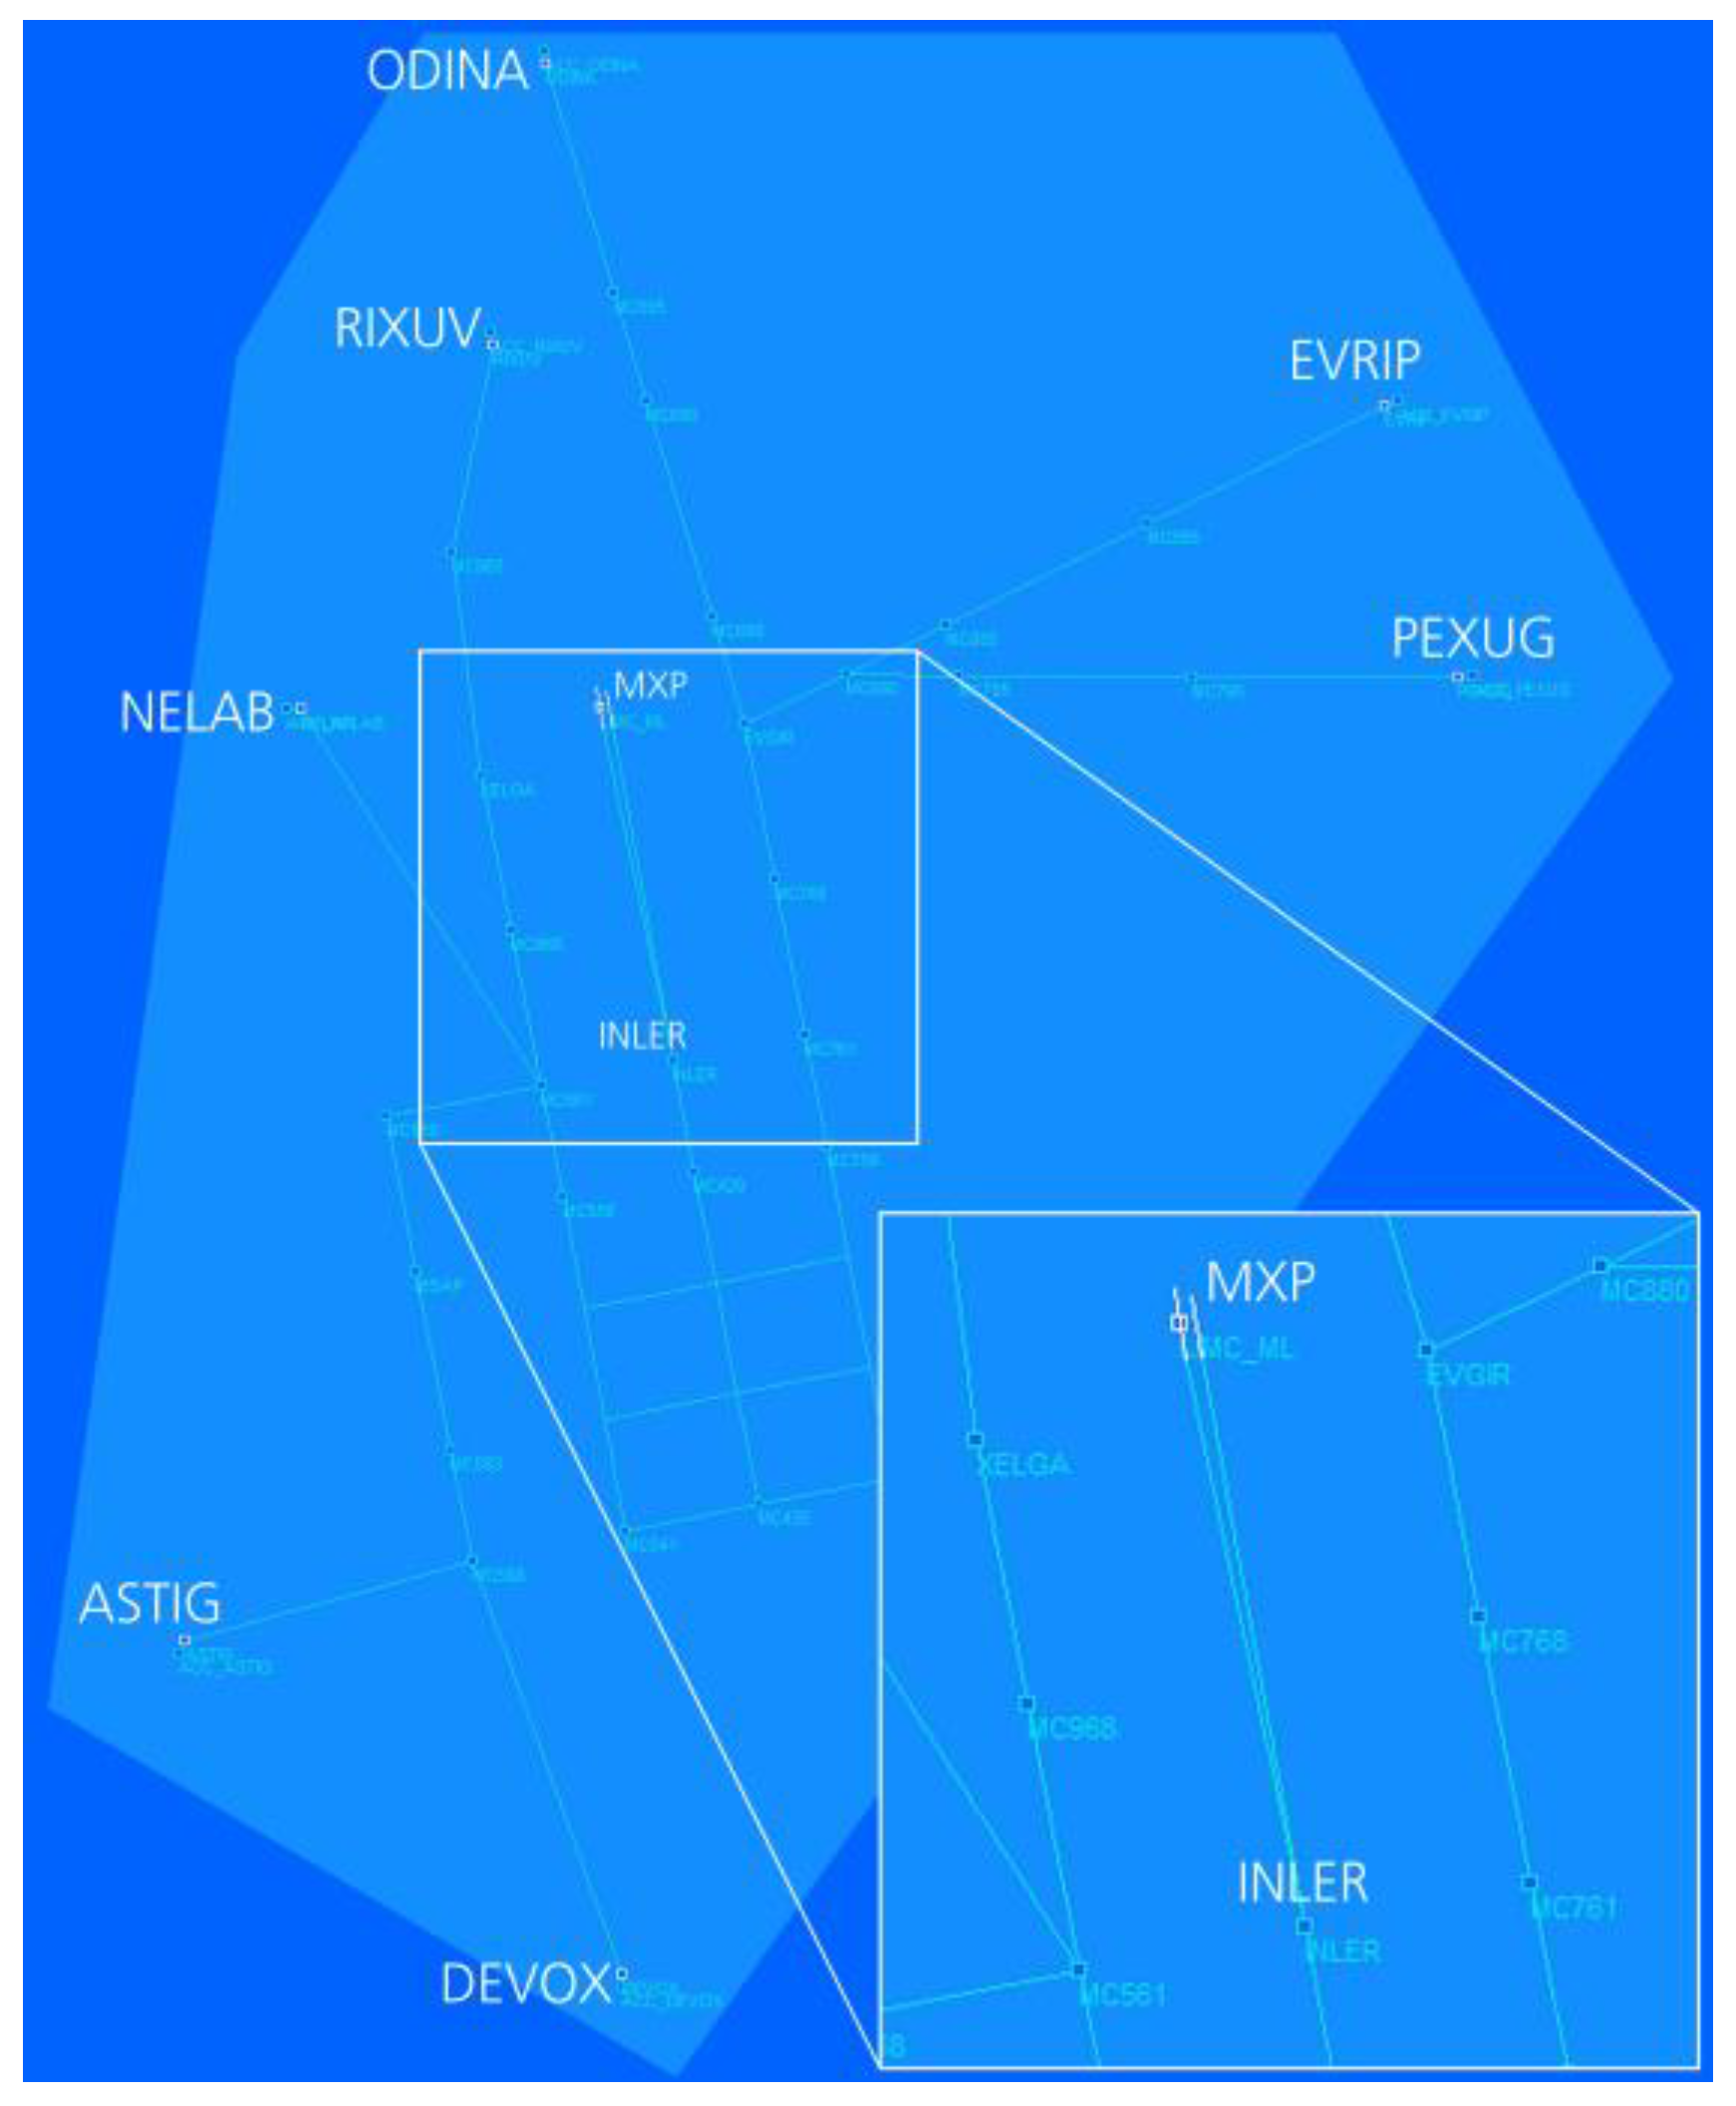
5.3.2. The Malpensa Airspace Implementation for the AMAN
For aircraft arrival planning and simulations, MXP airspace had to be implemented in DLR’s AMAN and the traffic simulation environment (
Figure 16). For this simulation, the airspace does not need all of the waypoints and sector boundaries of the real airspace; therefore, only waypoints relevant for arrivals have been inserted. Departure routes were not implemented, and this display thus looks less complex and simpler than usual radar images from MXP. For sequencing, all Standard Arrival Routes (STARs) with the related Flight Management System (FMS) waypoints were assigned as specified in the Aeronautical Information Publications (AIPs) of MXP [
54]. The waypoints are connected with constraints regarding maximum and minimum altitudes, as well as maximum and minimum speeds. These data are needed for the 4D trajectory calculation since it is not only speed but also flight altitudes that have an influence on flight times until touchdown.
MXP has two runways in the south–north direction: 35L and 35R. Because of the closeness of the Alps, landings are exclusively northbound. With seven Entry Fixes or Metering Fixes, the TMA has an average number of entry points that, while not covering all points of the compass equally, are a good compromise with respect to the Alps, other nearby airports, and restricted military areas in the vicinity of the airport. The Path Stretching Area (PSA) to the south of the airport is formed by a trombone to the east and a double-trombone to the west, which allows for an even distribution of approaches across the two runways. According to the AIP, it is not until the Initial Approach Fix (IAF) with the name INLER on Final that a decision is made as to which runway aircraft will be guided to; however, analysis of radar data has shown that controllers guide aircraft to the appropriate centerline much earlier. Runway switches on centerline or final are rather the exception.
STARs are assigned for each aircraft based on the respective approach direction and, from the north, are also based on utilization of the western and eastern trombones. Aircraft from the north are routed accordingly via the ODINA and RIXUV fixes, aircraft from the east are routed via EVRIP and PEXUG, aircraft from the southeast are also routed via PEXUG, aircraft from the south are routed via MEBUR, aircraft from the southwest are routed via DEVOX, aircraft from the west are routed via ASTIG, and aircraft from the northwest are routed via NELAB. During the selected days for the validation, all routes were active and used by approaches.
6. Discussion of Approach Planning Results under Severe Weather Conditions
For validation of the planning and display software, the described scenarios were calculated and the results were then presented to an international group of ATCOs. They evaluated the individual scheduling and trajectory results of the AMAN 4D-CARMA, as well as the entire approach of the support system.
6.1. Results of Diversion Calculations and Sequence Planning
For validation of the new support functions implemented in DLR’s AMAN, an evaluation was conducted with the AMAN that was linked to a traffic simulation and a questionnaire. The extended AMAN runs in 15 separate modules that communicate with each other via a Maria database. In addition, the DLR’s radar display RadarVision is used, which can display aircraft movements as well as additional information on flight plans and the generated trajectories. In addition to the 2D route, this includes the planned altitudes and speed profiles and, during a simulation, the current air situation in relation to the planned 4D trajectory. For traffic simulation, the AMAN was coupled with DLR’s ArrOS system. ArrOS enables precise movements along a trajectory and simulates cooperative controllers and pilots. A selection of screenshots from the simulation runs are used to illustrate the possibilities and results of the validation trials with 4D-CARMA. The following pictures are screenshots showing selected traffic and weather situations with different weather nowcast models.
Diversion route calculation has to consider different constraints in the TMA and the surrounding sectors. In the TMA, the routes are much more convergent, and the aircraft have to overfly more significant waypoints with specific constraints than in the adjacent sectors. As a result, the AMAN can plan larger-scale diversions in the sectors. In
Figure 17, the AMAN plans an early diversion and guides the aircraft EJU34CD on a more southern route than the STAR intends.
For traffic visualization on radar screens, a dark image is preferred by some air traffic controllers. In
Figure 18, a dark color scheme was selected with trajectories and a thunderstorm cell. In order to reduce the visual presence of the weather information, some controllers had suggested in the run-up to the SINOPTICA concept’s development that convective zones should only be displayed as bordered areas [
27]. RadarVision now allows controllers to choose between the two weather presentations of filled and bordered areas and also allows for switching between dark and light-colored traffic visualizations through keyboard input.
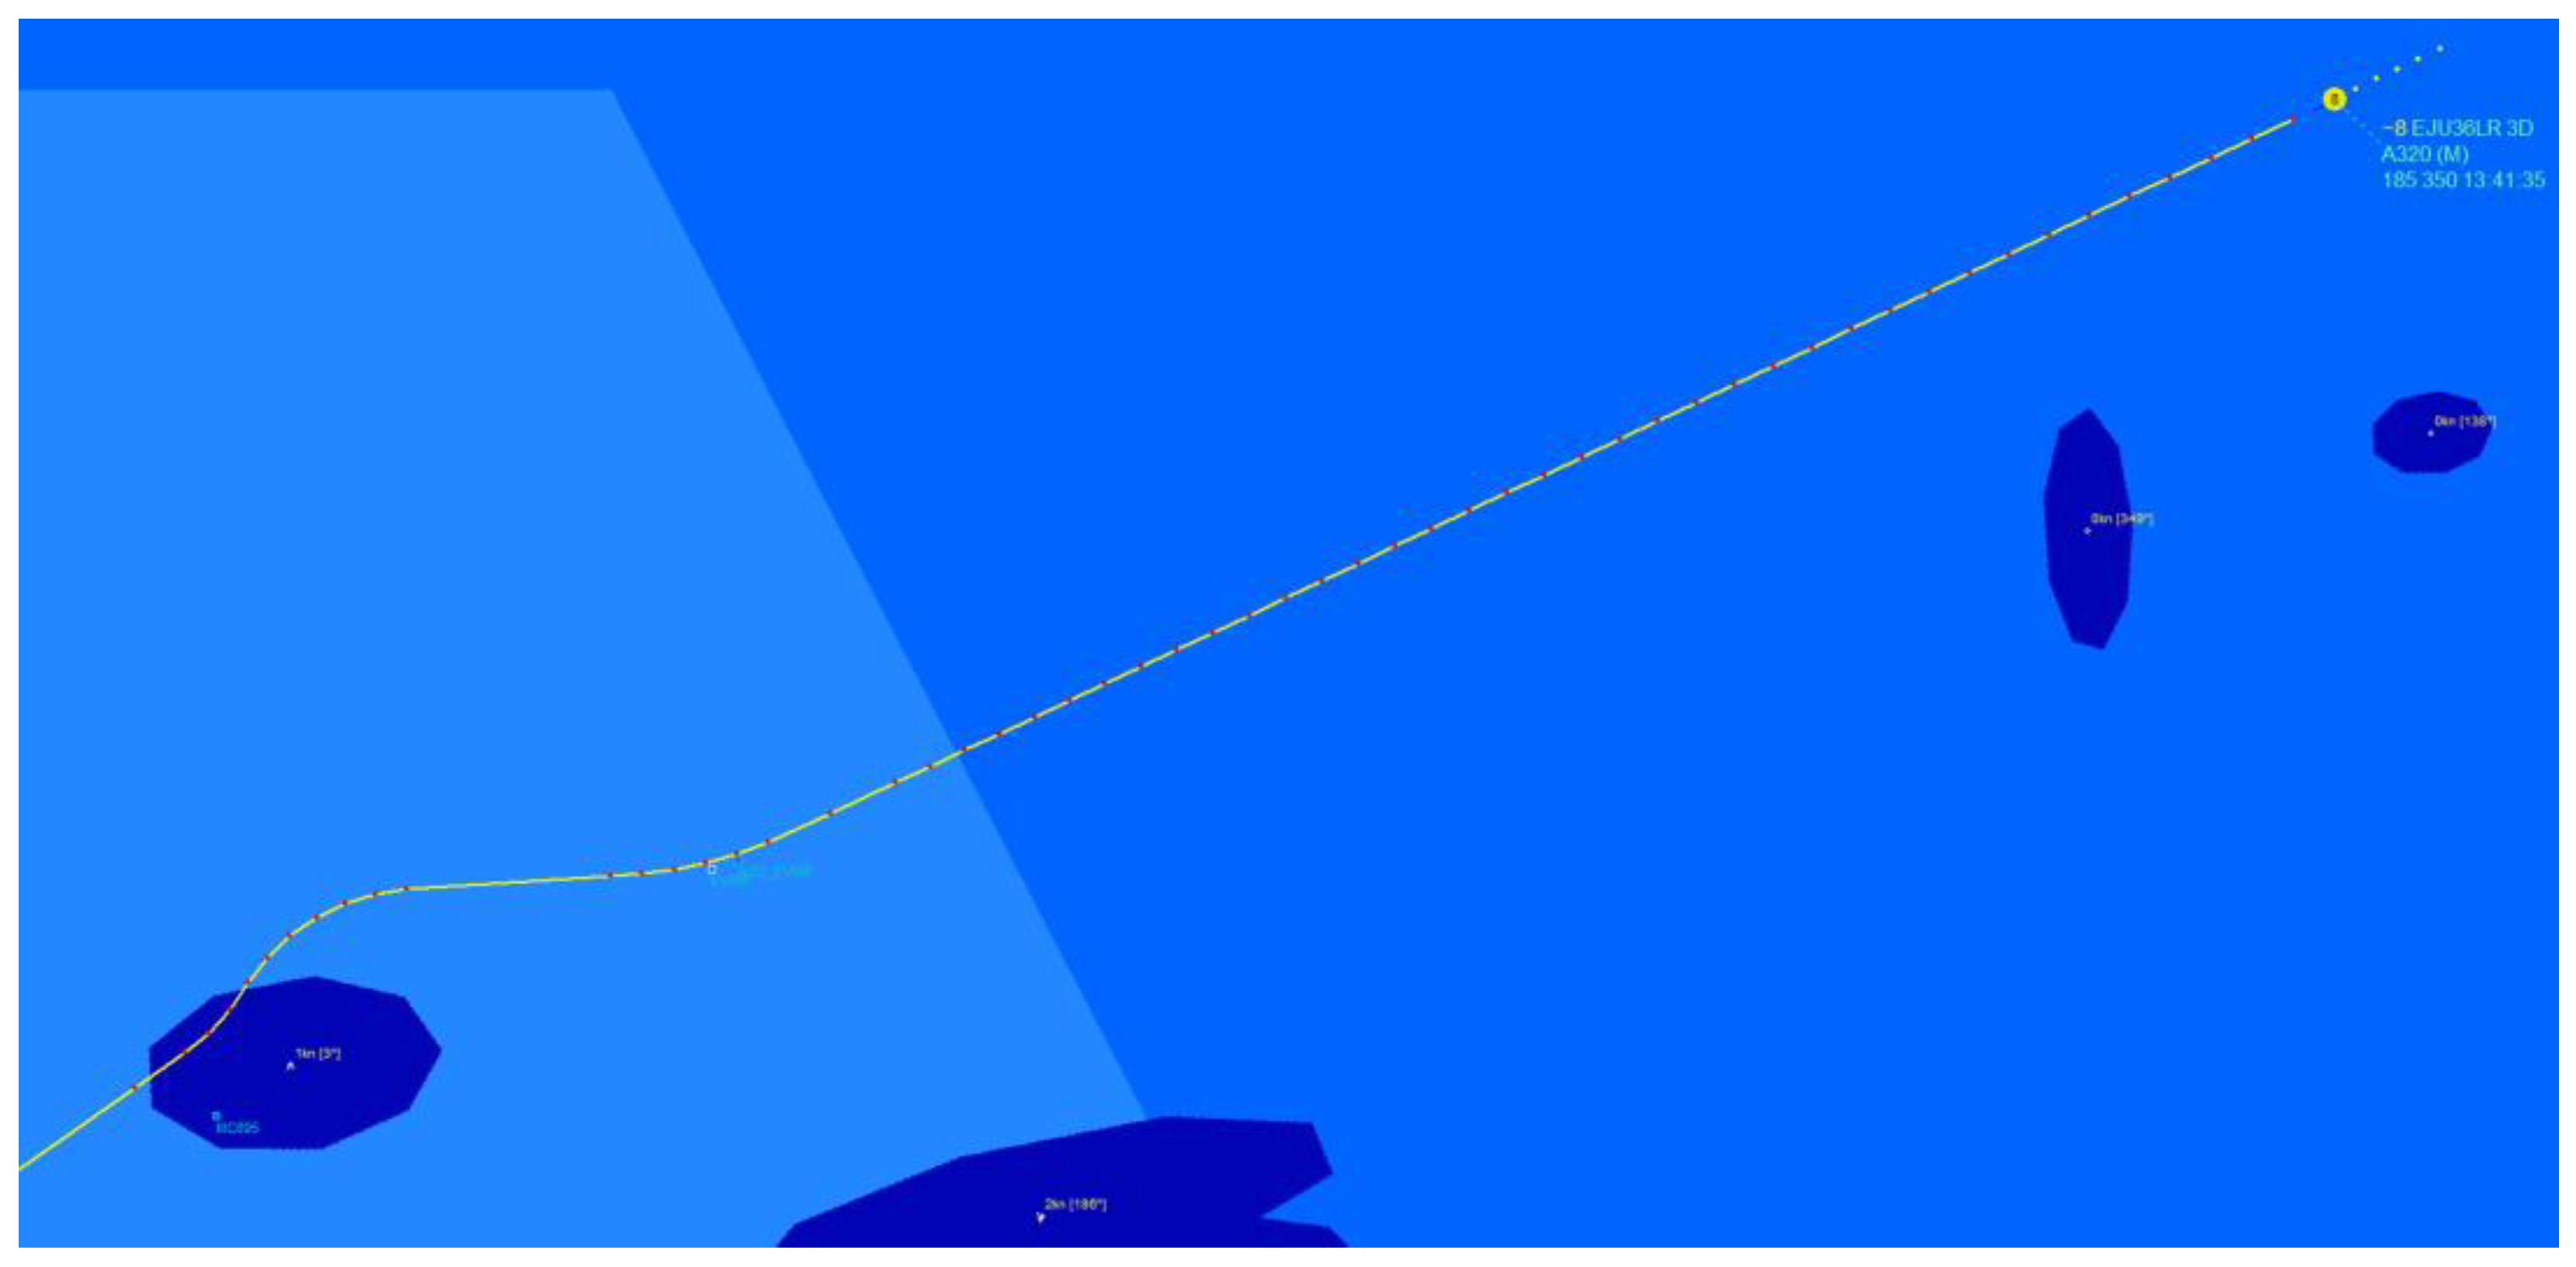
A particular challenge was route planning that required diversions around several convective zones moving at different speeds in different directions. In
Figure 19, an example of a diversion around four smaller convective areas is plotted for aircraft BEE156H arriving at Malpensa from the northwest. In weather situations of this type, the AMAN must decide independently whether it is more appropriate to fly through the loosely distributed convective zones or to fly completely around the entire affected area.
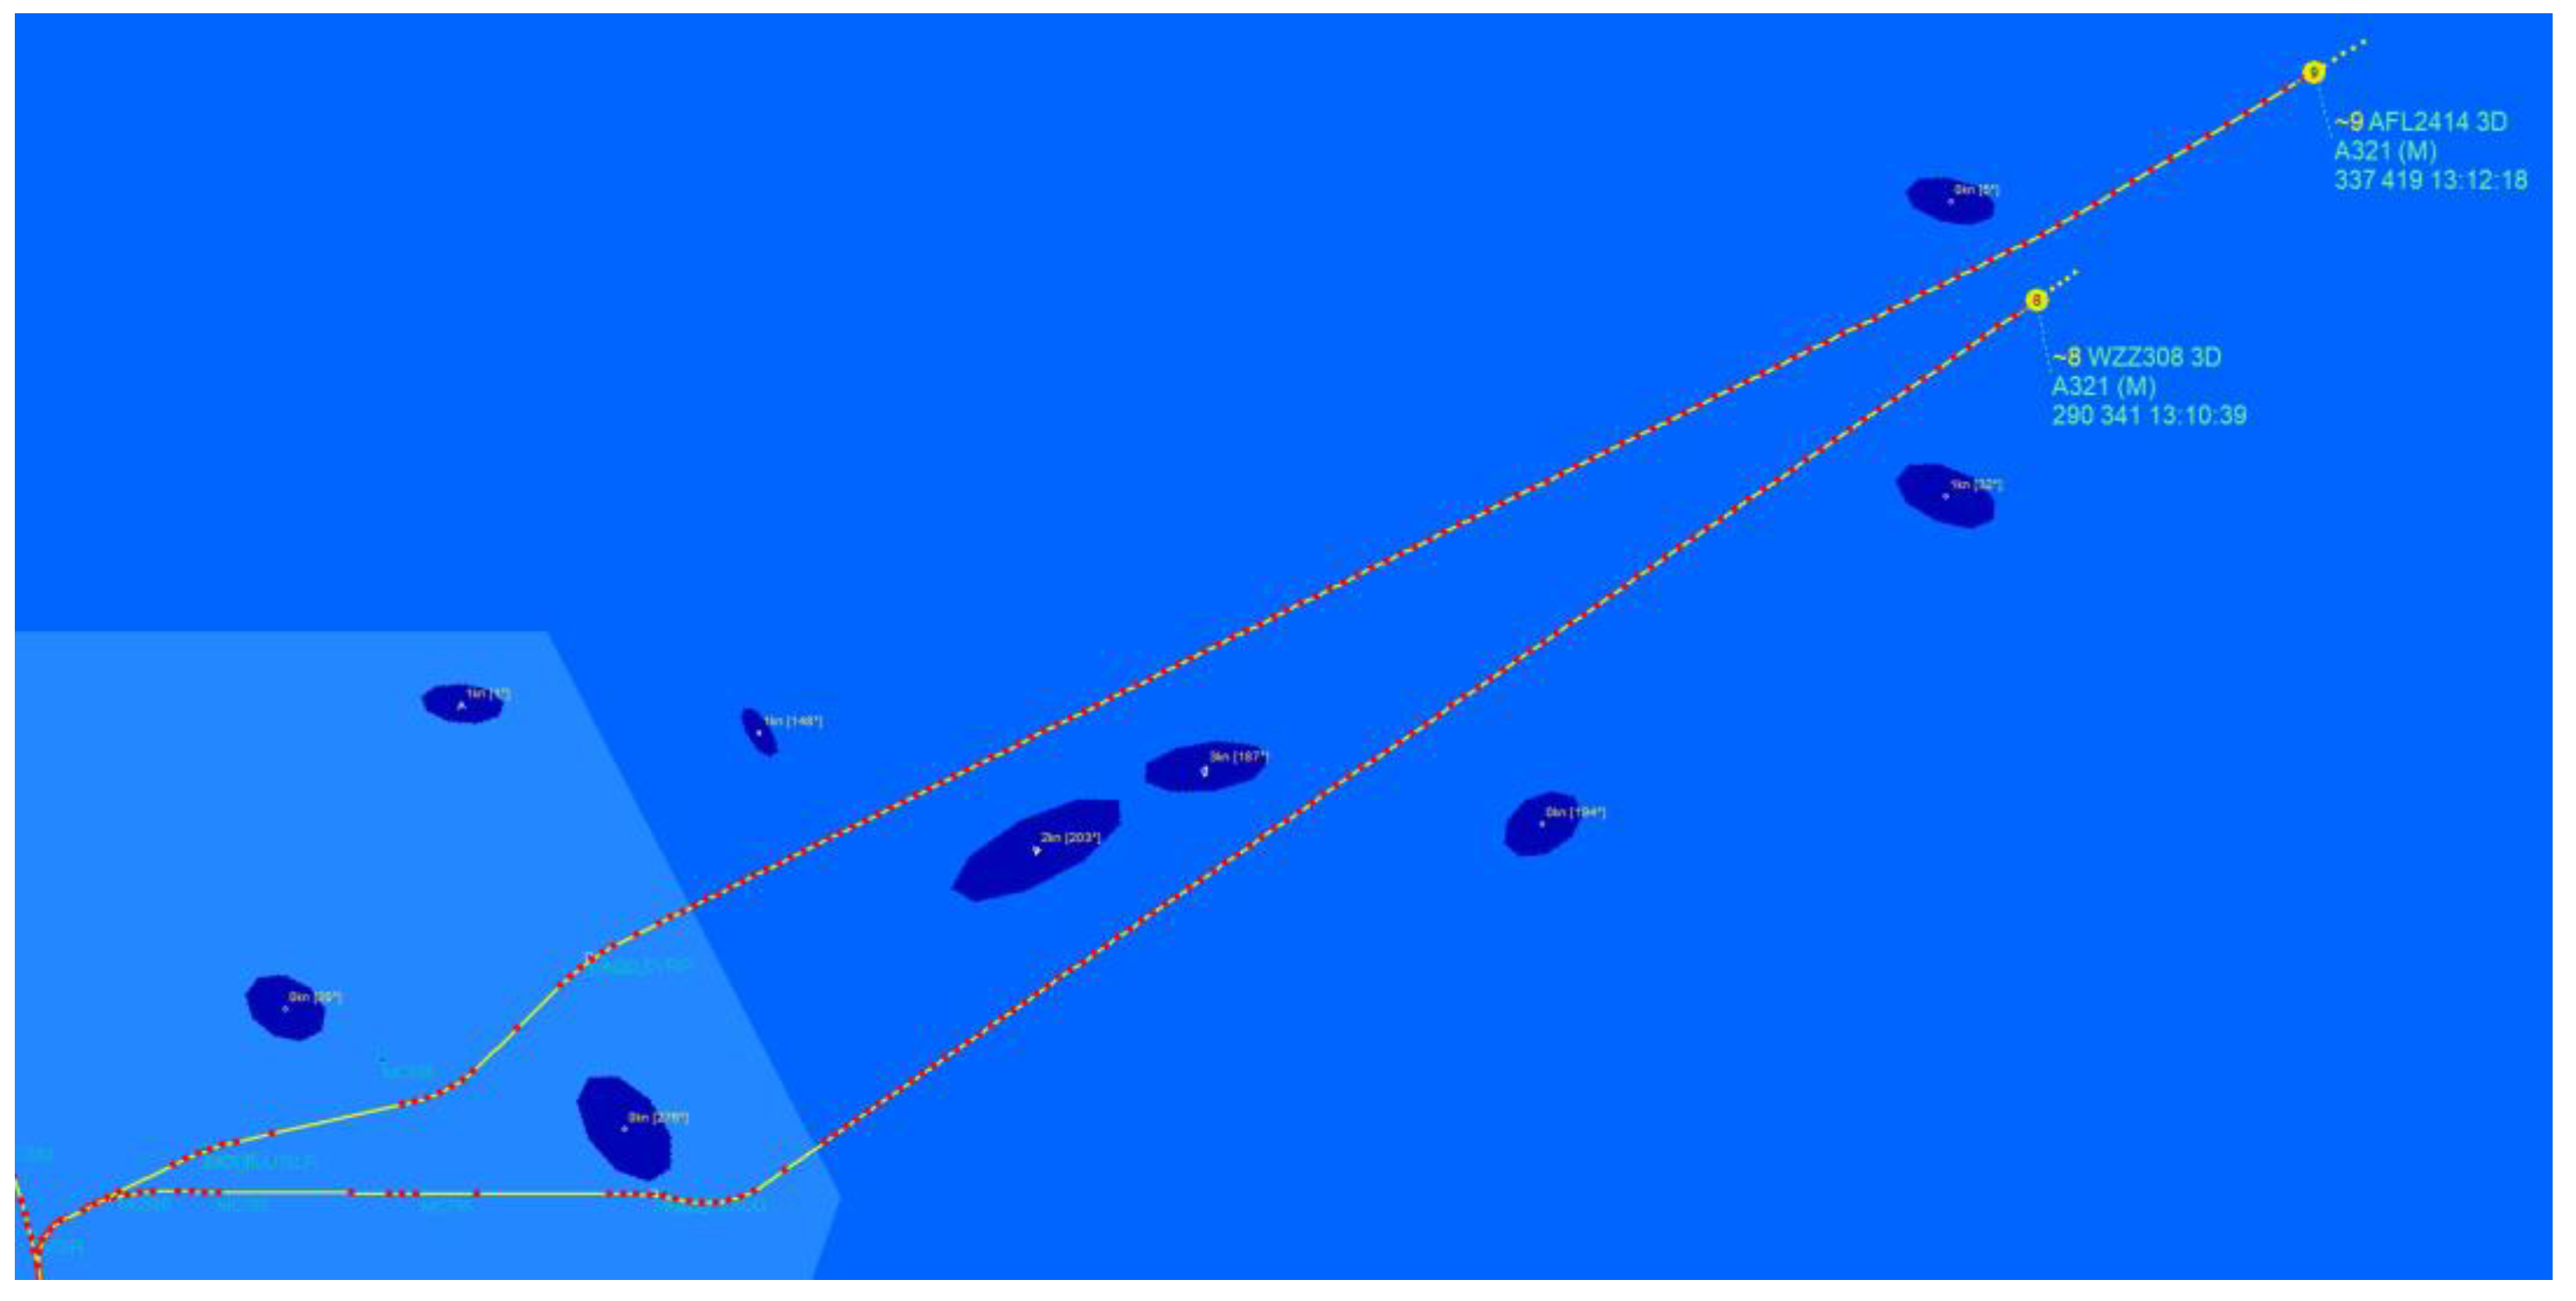
In
Figure 20, a 4D trajectory was planned with a diversion right through a convective area. However, following the weather forecast, this cell shifted to the southeast in the course of the following minutes so that, when the aircraft arrived, the route precisely avoided this area. If convective cells appear as a loose group, the AMAN tries to find a straight-line route through them. It can happen that routes approach each other for up to a few miles but are continued differently due to a small spatial and temporal distance (
Figure 21).
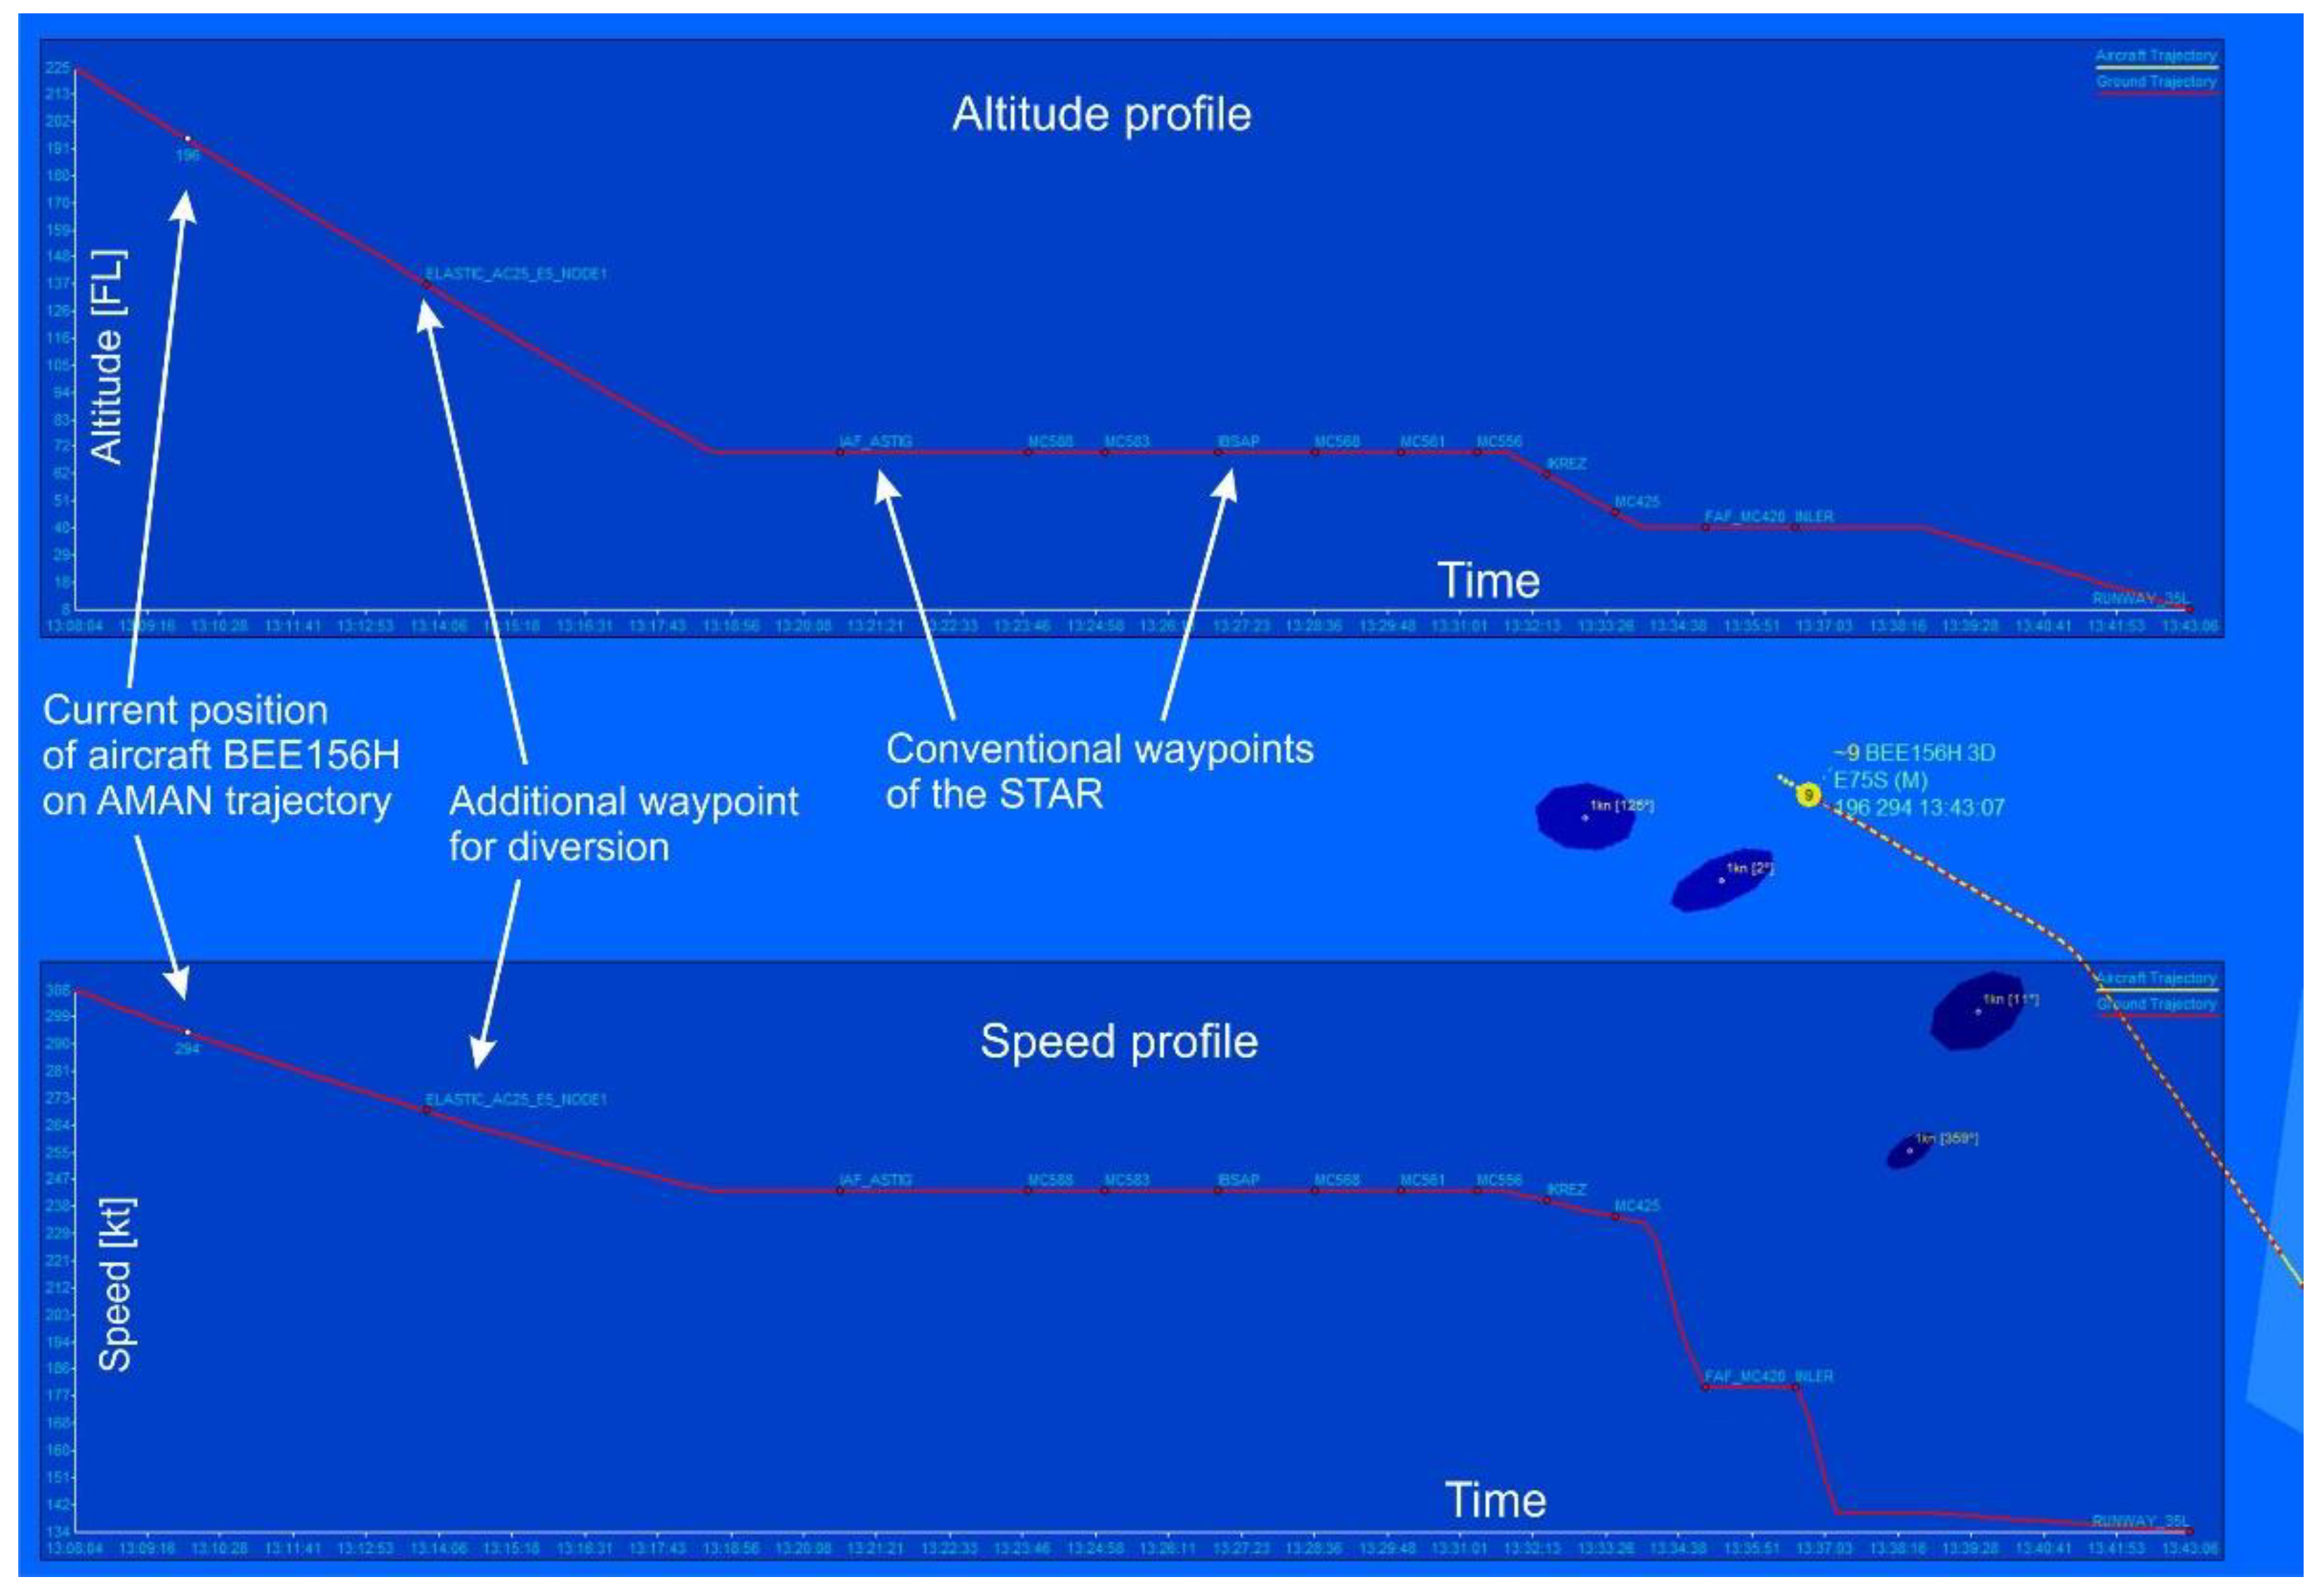
All routes calculated and displayed in this paper are 4D trajectories that include altitude, speed, and time in addition to position. They are always calculated on the basis of EUROCONTROL’s BADA 3.13 [
36] and are therefore realistic within the scope of technical possibilities. They should also therefore be able to be safely flown by the respective types of aircraft. BADA data for the respective aircraft types are also used for sequence calculation on the finals and the runways so that the distances between the aircraft follow the separations corresponding to their weight classes. This is also valid for the 4D trajectories calculated as diversion routes around severe weather areas. As an example, an aircraft approaching from the north and its speed and altitude profile are presented in
Figure 22. It can be seen from the altitude profile in the upper diagram that it is not possible for an aircraft to fly over or under a thunderstorm cell due to the descent that is usually already initiated at the distance of a few dozen miles from the airport.
Technically, 3D polyhedrons could be used for weather areas to specify the upper and lower boundary of convective cells; however, this does not bring any operational advantages in the context of approach planning. These visualizations indicate the strict dependence of AMAN-calculated 4D trajectories under the influence of local weather on the applied weather model and its assessment of meteorological severity for aviation.
6.2. Results of Controllers’ Validations
In the validation process at the end of the project, five active and former ATCOs from Austria, Germany, and Poland received an introduction to the aims and the results of the functional extended AMAN with severe weather guidance support. Afterwards, an AMAN demonstration was held consisting of six videos comprising different AMAN-planned trajectories that changed depending on weather dynamics, traffic dynamics, and the position of the aircraft. Additionally, two different kinds of weather presentations (filled and bordered areas) on radar displays and 4D trajectories with predicted speed and altitude profiles were introduced.
During the validations, the main idea of combining meteorological data, air traffic approach procedures, and the topography of Malpensa in an AMAN for arrival support was presented. The new approach with the adjustment of routes at early stages through the use of forecast data and the organization of air traffic around dynamic weather areas was explained. Five new supporting functionalities with routing, sequencing, weather animation, aircraft tagging in the form of labels, and guidance advisories were introduced and demonstrated. After the introduction, the controllers viewed and analyzed the videos demonstrating AMAN planning and its impact on live traffic.
The controllers then filled out a questionnaire with a total of 17 main questions and sub-questions on the technical assessment. Similar to the user requirements survey, 14 questions offered a seven-point response option that ranged between “strongly agree” and “strongly disagree”. Each question also had a comment field where additional comments and suggestions as well as explanations of the answers could be added. The controllers had no time constraints when completing the survey. The questionnaire consisted of 17 questions and sub-questions, 14 of which had graded response options and could be statistically analyzed:
In your opinion, can an AMAN be operationally improved by integrating adverse weather information?
In the entire TMA?
In arrival sectors?
On anything else?
In your opinion, can an AMAN be operationally improved by integrating adverse weather guidance support?
In the entire TMA?
In arrival sectors?
On anything else?
Would the concept proposed in SINOPTICA improve the situational awareness of the Flow Management Position (FMP) in adverse weather conditions?
Would the concept of the extended AMAN, proposed in SINOPTICA, lead to improved decision making?
Would the SINOPTICA extended AMAN help to decide more appropriate ATFCM measures? Would it lead to improved Flow Management?
Would the proposed enhancements help reduce the negative effects of adverse weather?
Are the graphical displays proposed clear and easy to interpret?
Would you feel comfortable using the visual aids on the radar display?
All in all, do you find the proposed SINOPTICA concept for extended Arrival Management useful?
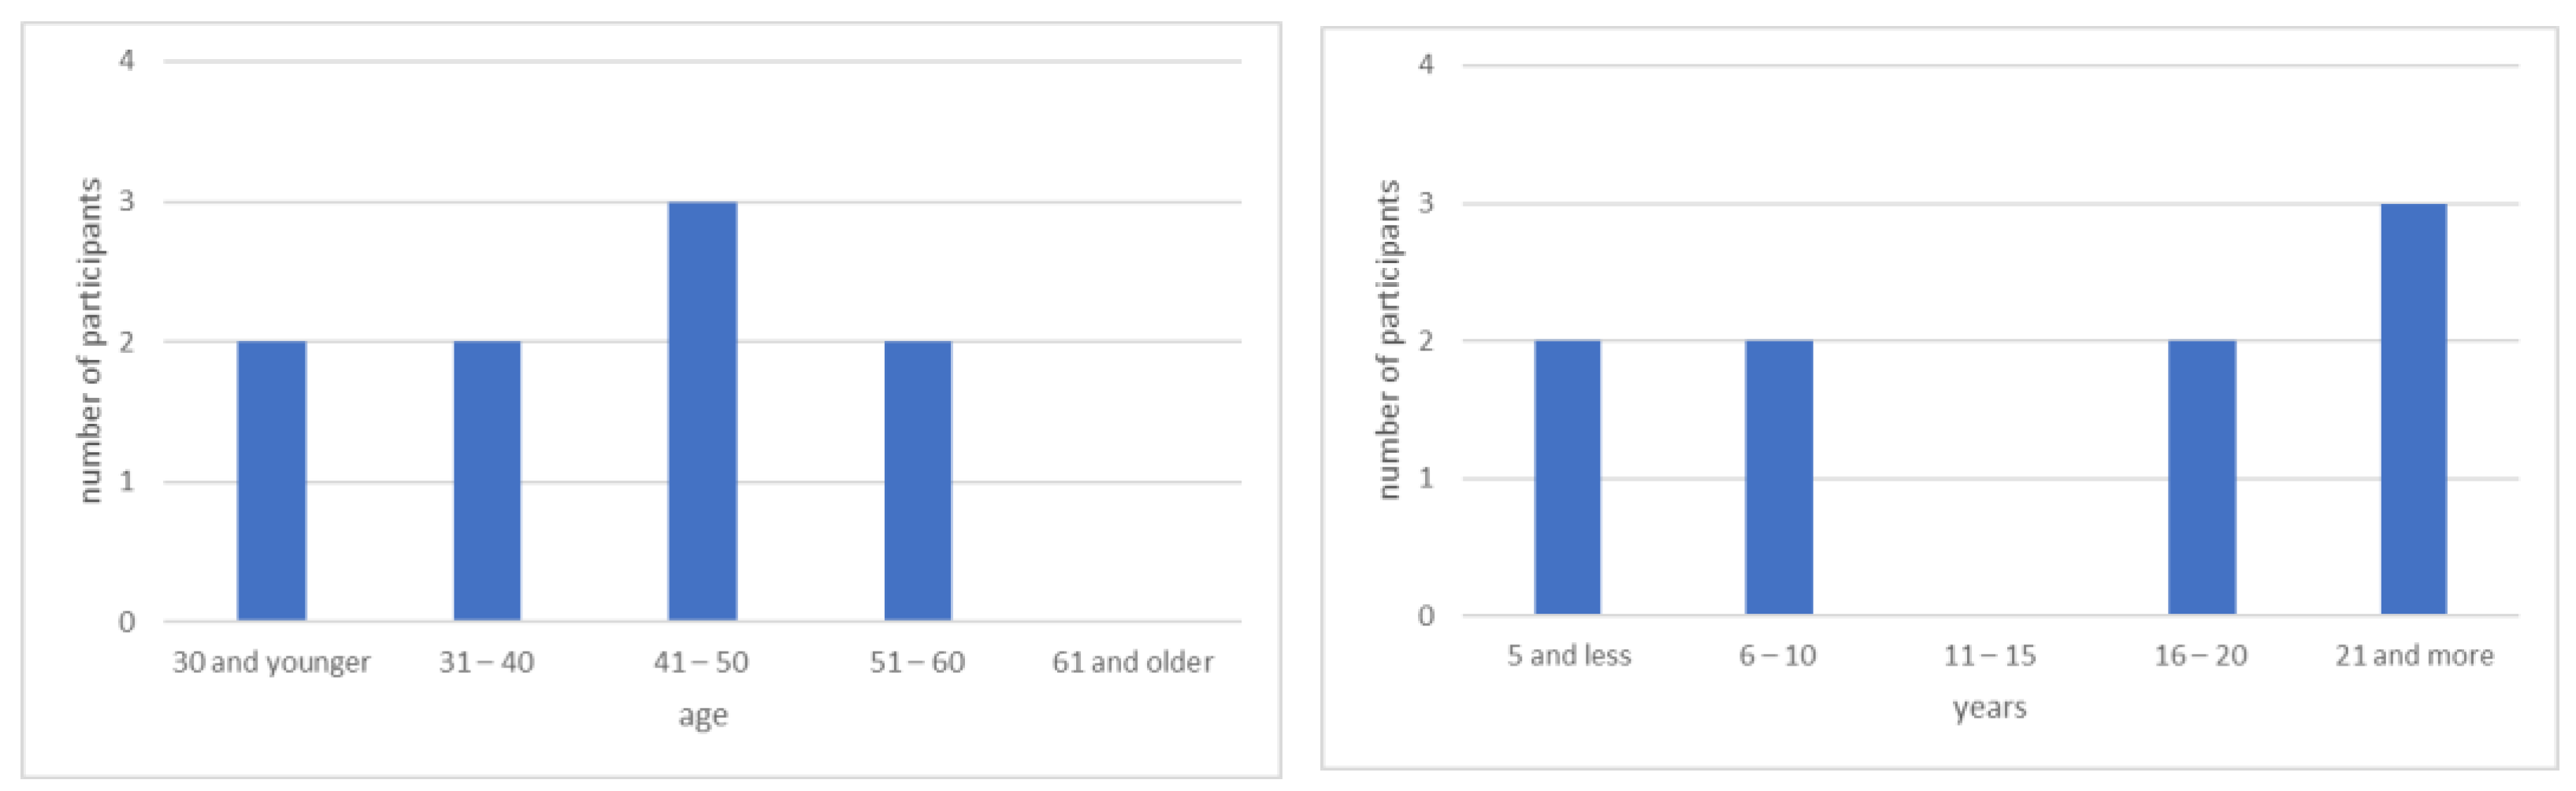
Analysis of the questionnaires showed that the controllers had professional experience ranging between 1 and 25 years, which thus covers a wide range of experience in the profession of air traffic control. It becomes clear that the newly developed support and visualization functions received clear overall approval from the controllers. Not all controllers were able to answer all the questions because their training and work experience did not give them sufficient knowledge of all the work positions where severe weather support could conceivably be provided (by their own appraisal). Particularly important for our controllers’ support system evaluation were the comments, suggestions, and criticisms of the participants. For this reason, a generous comment field was added to each question, which was also used by most participants. These comments were intended to further develop the system so that it could also be operationally used in the future. In addition to a general level of approval, this kind of open user feedback is also important to ensure that further developments do not neglect the needs and requirements of air traffic controllers.
Evaluation of the responses showed the overall comprehensive satisfaction of the involved controllers with the extended system and its newly developed functionalities (
Table 2). For the numbers in parentheses, the value 1 represents the answer “strongly disagree”, the value 4 represents “neutral”, and the value 7 represents “strongly agree”, with the other values in between assigned accordingly. The ATCOs exhibited high agreement with the notion that an AMAN can be operationally improved by integrating adverse weather information (6.4/7) and adverse weather guidance support (6/7). They also showed a high level of agreement with the concept that an extended AMAN would lead to improved decision making (6/7). Furthermore, they reported their agreement with the statement suggesting that they would feel comfortable using the visual aids on the radar display (6/7). All in all, they found the proposed concept for extended Arrival Management very useful (6/7).
In summary, the evaluation of the validation with controllers showed that they would very much like to use a system that supports them in approach planning and flying around severe weather areas, both from a planning and visual point of view, as it would make their daily work easier and thus also safer. It is noteworthy that they placed more emphasis on weather information than on planning support.
7. Conclusions
In this paper, the extension of an approach controller support system for diversions around severe weather areas is presented that can use different meteorological nowcast models to automatically calculate approach routes and target times for arrival sequencing.
For this purpose, an AMAN was used in the H2020 project SINOPTICA as a planning system considering polygons enclosing severe weather areas as no-fly zones and the calculation of 4D trajectories based on aircraft type-specific parameters to avoid these areas. In the project, the AMAN considered not only standard approach routes, but also the constraints of waypoints; thus, realistic approach profiles were calculated that can be used for approach and touchdown sequencing. After a user requirements analysis with nine ATCOs, new functions were implemented so that approach controllers could receive guidance instructions from the AMAN for clearances in order to guide weather-affected aircraft along planned trajectories, and visual presentations were also provided on the primary display to help quickly and clearly identify aircraft concerned by a diversion. The AMAN and the newly developed diversion functionalities were tested with different extreme weather events that occurred in 2019 in northern Italy, which were modeled and reproduced with the PhaSt, WRF-RUC, and RaNDeVIL weather models.
During the first phase of the project, a user requirement survey was conducted in which different severe weather display types and support functionalities were evaluated by an international ATCO team with nine participants. As a result of the survey, two dynamic presentation variants were developed for the display of the current meteorological situation in the airspace, as well as its predicted development, and these variants are presented in detail in this paper. The first one is based on a linear extrapolation of the last meteorological measurements. It can be used if no dedicated weather forecasts are available. The second variant is based on a method similar to morphing in computer graphics. Here, the shapes of the actual and the predicted weather areas are decomposed into polygons and then merged in a flowing animation. In this way, an ATCO can track the development of severe weather areas at any time and can even adjust the organization of the airspace independent of planning support provided by a decision support system.
An evaluation with an international team of five active controllers showed that an AMAN is very helpful if there is a possibility of large-scale fly-around routing for the avoidance of severe weather areas. For this purpose, longer-term and highly precise forecasts that are precisely tailored to air traffic control requirements are essential. Additionally, the forecast model must correspond to the safety perception of ATCOs and pilots on site so that they can manage the traffic as efficiently and safely as possible. In summary, with the help of sophisticated nowcast models and an extended AMAN, SINOPTICA was able to show that it is possible to support ATCOs and pilots to guide air traffic safely and efficiently around severe weather areas in challenging meteorological situations, thus making planning more reliable and predictable for all stakeholders on the ground and in the air.

 ,
, 


