Article

Methodology for Determining the Event-Based Taskload of an Air Traffic Controller Using Real-Time Simulations

by
María Zamarreño Suárez
1,*,
Rosa María Arnaldo Valdés
1,
Francisco Pérez Moreno
1,
Raquel Delgado-Aguilera Jurado
1,
Patricia María López de Frutos
2 and
Víctor Fernando Gómez Comendador
1
1
Department of Aerospace Systems, Air Transport and Airports, School of Aerospace Engineering, Universidad Politécnica de Madrid (UPM), 28040 Madrid, Spain
2
ATM Research and Development Reference Centre (CRIDA), 28022 Madrid, Spain
*
Author to whom correspondence should be addressed.
Aerospace 2023, 10(2), 97; https://doi.org/10.3390/aerospace10020097
Submission received: 9 November 2022 / Revised: 16 January 2023 / Accepted: 16 January 2023 / Published: 18 January 2023

Abstract

:
The study of human factors in aviation makes an important contribution to safety. Within this discipline, real-time simulations (RTS) are a very powerful tool. The use of simulators allows for exercises with controlled air traffic control (ATC) events to be designed so that their influence on the performance of air traffic controllers (ATCOs) can be studied. The CRITERIA (atC event-dRiven capacITy modEls foR aIr nAvigation) project aims to establish capacity models and determine the influence of a series of ATC events on the workload of ATCOs. To establish a correlation between these ATC events and neurophysiological variables, a previous step is needed: a methodology for defining the taskload faced by the ATCO during the development of each simulation. This paper presents the development of this methodology and a series of recommendations for extrapolating the lessons learnt from this line of research to similar experiments. This methodology starts from a taskload design, and after RTS and through the use of data related to the subjective evaluation of workload as an intermediate tool it allows the taskload profile experienced by the ATCO in each simulation to be defined. Six ATCO students participated in this experiment. They performed four exercises using the SkySim simulator. As an example, a case study of the analysis of one of the participants is presented.

1. Introduction

Aviation combines great technological development with key activities performed by humans. Human factors are dedicated to better understanding how humans can safely and efficiently integrate with technology in aviation [1]. At the tactical level, air traffic controllers (ATCOs) are at the core of today’s air traffic management (ATM) [2].
As their work has a direct influence on air traffic safety, ATCOs must be highly trained and skilled to provide air traffic control (ATC) services [3]. Due to the great responsibility associated with the activities performed by these professionals, identifying which situations cause greater difficulty in their decision-making process so as to be able to model these situations to limit their workload is of great interest. In particular, the study of air traffic controllers’ workload is a topic of significant relevance within the air traffic industry.
The environment in which ATCOs work is inherently dynamic and requires them not only to perform their tasks safely and efficiently, but also to interact with a multitude of systems and coordinate with other people. Exploration of digitalisation and the possibility of automating some of these tasks is increasingly prevalent in current research. As an example, ref. [4] presents an experiment conducted with six ATCOs to analyse the possibilities and challenges of automation in terms of teamwork in a realistic ATC en route phase scenario. The authors in [5] presented a methodology for predicting if and when ATCOs would react to the presence of conflicts, which was developed through the use of deep learning techniques.
The use of simulations in the research and development stages has many advantages. One of them is the ability to create highly realistic exercises with controlled ATC events in order to understand their influence on the decision-making processes of air traffic controllers when resolving such events. In addition, it also allows for the testing and validation of new functionalities prior to large-scale implementation. These simulations also allow for the recreation of unusual or emergency situations in a controlled manner. In summary, current needs and future trends make simulators invaluable tools for both ATCO training and ATM system development [6].

1.1. CRITERIA Project

The CRITERIA project (atC event-dRiven capacITy modEls foR aIr nAvigation) is a collaborative project between Universidad Politécnica de Madrid (UPM) and CRIDA, the Spanish ATM Research and Development Reference Centre. The objective of this project is to establish capacity models based on ATC events. In the same way, another fundamental objective is to integrate the study of the human factors associated with air traffic controllers into these models.
ATC events are a model of the different actions carried out by air traffic controllers. From the beginning of the project, it was defined as one of the requirements that the data used in the analysis should be obtained during the development of the project itself so as to improve the traceability of the data and the explainability of the models.
For this purpose, an en route flight simulator has been used for the development of simulations. The simulator chosen was SkySim, which was developed by SkySoft-ATM. Within this project, SkySim has been used for the development of real-time simulations. However, the simulator can also be used for procedure and airspace design, ATC training, or the testing of new systems and functionalities. SkySim consists of simulation, user interface, management, recording, and replay modules [7].
Two ATC positions are available within the simulation platform. The user interface module consists of a radar display with a full graphical presentation of all ATC information and data [8].
Before this project started (though after the setup of the platform and a set of preliminary exercises had been designed), test simulations were carried out to study the feasibility of starting a project focused on the study of the neurophysiological variables of ATCOs and their relationship with ATC events. The methodology and preliminary results validating interest in the launch of a more detailed and robust project can be found in [9].
The ATC events mentioned in the above reference are conceptually the same as those that will be defined in later sections. The naming of the events has changed as a consequence of the development of the test simulations. Similarly, the exercises presented in the present study are practically the same as the first four exercises described in the previous reference. Following the development of the test simulations, improvements were made and minor errors were identified and corrected.
During the execution of the simulation and data acquisition campaign, the following data were recorded:
  • Subjective records of the workload perceived by participants during the course of the simulations.
  • Data on neurophysiological variables, in particular electroencephalography (EEG) and eye-tracking data.
  • Information on the actions carried out by the participants during the exercises.
Once the first simulations had been developed, it was necessary to define a methodology for assessing the impact of the ATC events that occurred during the development of the simulations on the ATCOs. This methodology is one of the main contributions of this paper.
Studying ATC events separately is not sufficient in itself. A variable is required that relates these events to the difficulty perceived by the ATCOs.

1.2. Taskload and Workload

Taskload is a measure associated with the challenge and difficulty faced by a person in completing a task [10]. ATCOs are subject to multiple task demand loads, or taskloads, over time [11]. Another key concept is mental workload. Mental workload reflects the subjective experience of individuals when performing specific tasks in specific environments and under specific time constraints [12].
Taskload and workload are not synonyms. While the concept of taskload refers to external duties, the amount of work, or the number of tasks to be performed by the ATCO, the concept of workload refers to the individual effort made by a person and his or her subjective experience under given conditions [13].
In [14], the authors identify some of the factors that influence the variables of taskload and workload. Factors such as airspace demand, interface demand, and procedure demand influence taskload. On the contrary, some factors that influence workload are skills, strategy, and expertise.
There are multiple approaches to defining the taskload faced by ATCOs. As an example, in [15], a study was conducted to determine whether air traffic control communication events would predict subjective estimates of controller workload and controller taskload measures. There were four taskload components considered in this study: two principal components related to the number and duration of communication-related events and two principal components related to the content of voice communications. This study is an example of the fact that, despite the generic definition of taskload, the way it is quantified and its components vary according to the specific objective of the study.
The authors in [16] discuss a comparison of different complexity metrics related to the ability to match the subjective workload results obtained in a simulation. The definitions of taskload and workload in this reference coincide with the definitions of these terms in this line of research. In the above reference, it is also explained that one of the simplest ways to quantify taskload is to count the number of aircraft present in a sector. Similarly, it is noted that this approach presents limitations, as it does not consider the evolution of aircraft in the sector. The study presented in this paper aims to use a more comprehensive measure of taskload than aircraft counts. To do so, the experiment described in this paper uses event-based taskload as a metric, which results from considering the taskload contribution of the aforementioned set of ATC events.
Based on the definitions of taskload and workload, it can be concluded that taskload is the part of the work demand imposed on the controller purely due to the tasks he/she has to perform [17]. The taskload value of the ATC events included in the research line of this paper is specific to each event. However, the workload perceived by the participants when facing such events will be specific to each person.

1.3. Hypothesis and Obejctives of the Study

To meet the objectives of the research line, tasks include a massive analysis of the data on neurophysiological variables so that correlation between their evolution over time and the ATC events that have taken place during the simulation can be defined. The aim is to establish general patterns and set limits on certain combinations of events so that the workload of ATCOs is within acceptable levels.
The starting hypotheses of the study are as follows:
Hypothesis 1: 
It is possible to determine a taskload distribution profile based on data recorded in a control position that can serve as a reference for the subsequent analysis of the evolution of the neurophysiological variables of ATCOs.
Hypothesis 2: 
Based on a taskload distribution profile, variables related to subjective workload assessment can be used to establish whether this baseline profile is the best reference for the subsequent study of the evolution of neurophysiological variables.
To test the hypotheses of this study, the development of a laboratory experiment with controlled ATC events, the use of an ATC simulator, and the development of a campaign of real-time simulations were chosen. Initially, when the exercises were designed, the starting point was a designed taskload profile. The research question to be answered now is whether this designed taskload is a good reference or whether it is necessary to define a more adequate taskload profile. Only by answering this question will it be possible to continue the study of events and the analysis of the combinations of events that induce a higher workload on the participants.
Additional information about the participants will be presented in later sections. The sample was selected in such a way that participants were as homogeneous as possible in relation to their age, training, and skills. In this first part of the research line, it was important to invest as many hours as possible in the simulator to obtain a robust methodology. For this reason, the chosen participants are ATCO students.
The study presented in this paper has two main objectives: (i) to establish a suitable taskload profile, which will serve as a reference for further studies in the project and determine whether the designed taskload profile can fulfil this function or whether it is necessary to define a new one; and (ii) once this reference is established, to study which events or combinations of events cause the most complex situations within the sector.
To the authors’ knowledge, this study is original as it includes as taskload references a series of specific events to this line of research. Similarly, the methodology used and the process of analysing the data collected during the experiment are also novel.
Studies focused on the taskload and workload concepts sometimes present the important limitation of using the two terms interchangeably. In this paper, right from the introduction, the aim is to eliminate this limitation by clarifying the differences between the two concepts. In the same way, another risk that can arise from these studies focused on such specific topics is that they have a limited application and cannot be extrapolated to other research. To overcome this limitation, this study, in addition to generalising the methodology to other similar experiments, includes a series of recommendations when discussing the results obtained. These recommendations are intended to serve as a guide for applying the lessons learnt during this research to similar subsequent studies.
The remainder of this paper aims to present the steps that have been taken to achieve these objectives. The structure is as follows. In Section 2, Materials and Methods, the steps followed in the study are presented, as well as some details on the development of the simulations and the data recorded. Section 3 presents the results obtained after the simulations were carried out by the six participants. Section 4 presents two subsections. In the first, the results are explained using a case study of one of the participants and the key findings are identified. The second subsection presents some recommendations for future research based on the lessons learnt in this study. Finally, Section 5 summarises the results obtained and the next steps to be taken within the line of research.

2. Materials and Methods
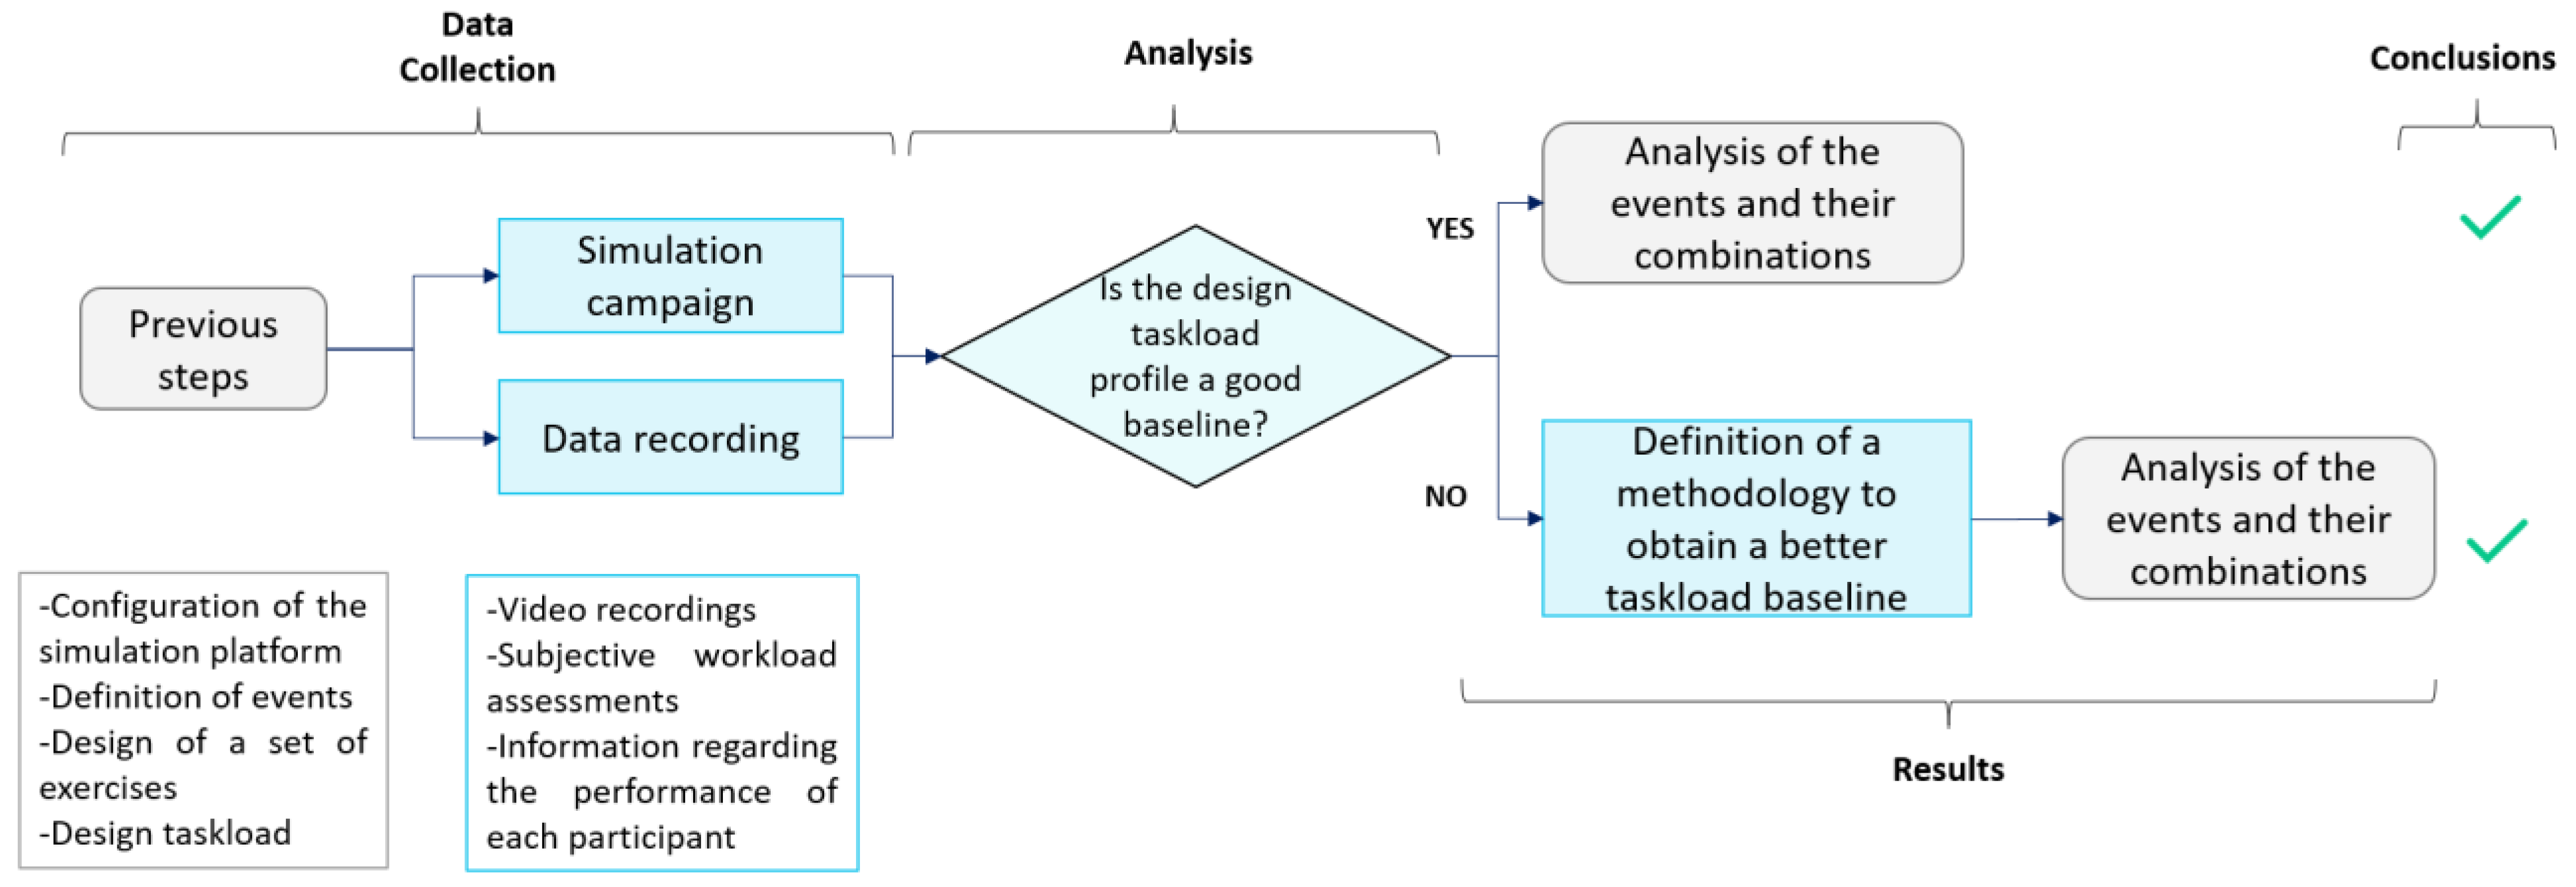
Before discussing the results obtained, it is necessary to present the methodology followed to achieve them. This section includes general information on the methodology followed in the first subsection, as well as some details on the events considered in the design of the simulations, useful information on the simulations carried out, and an explanation of the data recorded, respectively, in the following subsections.

2.1. Methodology

This subsection summarises the methodology followed throughout the study, from the first steps taken to setup the simulation platform to detailed analysis of the event combinations and their influence on the taskload and subjective workload of ATCOs. The methodology followed in this study can be seen in the form of a flow chart in Figure 1. Four stages have been defined:
  • Previous steps: Includes all the activities that needed to be carried out in order to get the simulation platform up and running and to start working with the participants.
  • Simulation campaign and data recording: Includes the process of running the experiment, as well as the recording of all the data associated with the simulations.
  • Definition of the best taskload profile: To be able to study the relationship between the evolution of the neurophysiological variables and the ATC events in the simulation, it is necessary to determine the best reference taskload profile. If this profile proves to be different from the designed profile, it will be necessary to define a new methodology to obtain a baseline that considers the actual events that occurred during the simulations. This stage is a decision point represented by a diamond with two possible outputs in Figure 1. Once this baseline is established, the first objective of the paper mentioned in Section 1 will be achieved.
  • Event analysis: Once the baseline has been established, the next step is to study which events or combinations of events induce the greatest difficulty in the exercise and the highest workload on the controller. This step addresses the second objective of the paper.
Before simulations could be performed, several preliminary steps had to be taken. First, the simulation platform was configured. Subsequently, the ATC events that would serve as the basis for exercise design were defined. For this first stage of the project, a total of four exercises of increasing difficulty were designed. When events were introduced at specific moments of the exercise, a unique designed taskload profile was obtained for each of the exercises.
Once the exercises had been designed, the next step was to develop the simulation campaign. In total, six participants participated in the simulations. Each of them simulated each of the four exercises. Several data were recorded during the development of the exercises.
For this line of research, the data of interest were the video recordings of the simulations, which provided information on the actual events and actions carried out by the participants, and subjective workload assessment data. For this purpose, the Instantaneous Self-Assessment (ISA) method was implemented in the simulator through the use of a window that appeared on the radar screen every two and a half minutes to ask participants to evaluate their perceived workload.
The ISA method is based on the idea of asking the operator to assess their workload at regular intervals. At each assessment, the operator is required to select a value on a scale of 1–5. On this scale, 1 means under-utilised and 5 means excessively busy [18]. The ISA method was chosen because it is considered less intrusive than other subjective workload assessment methods [19]. Furthermore, it can be run during the progression of exercises.
The first objective was to find an event-based taskload baseline. In fact, the ultimate goal was to create a profile with the taskload values for each minute of the simulation. When the exercises were created, a designed taskload profile was defined. Therefore, the first question to be solved is whether this designed taskload can be used as a reference. This question is represented by the diamond in Figure 1. There are two options: ‘yes’ and ‘no’. The first option is to demonstrate that the answer is ‘yes’. This would be the simplest possible situation. In that case, since the designed events of the simulations are known in advance, the designed taskload profile could be used directly as a reference when studying the evolution of neurophysiological variables.
The other alternative is that the answer to the question is negative. If it is not possible to use the designed taskload profile as a reference, it will be necessary to establish a methodology for obtaining a better reference based on the events that actually took place during the development of the simulations before addressing the second objective of the study and moving towards analysis of the events and their relationship with the recorded subjective workload values.

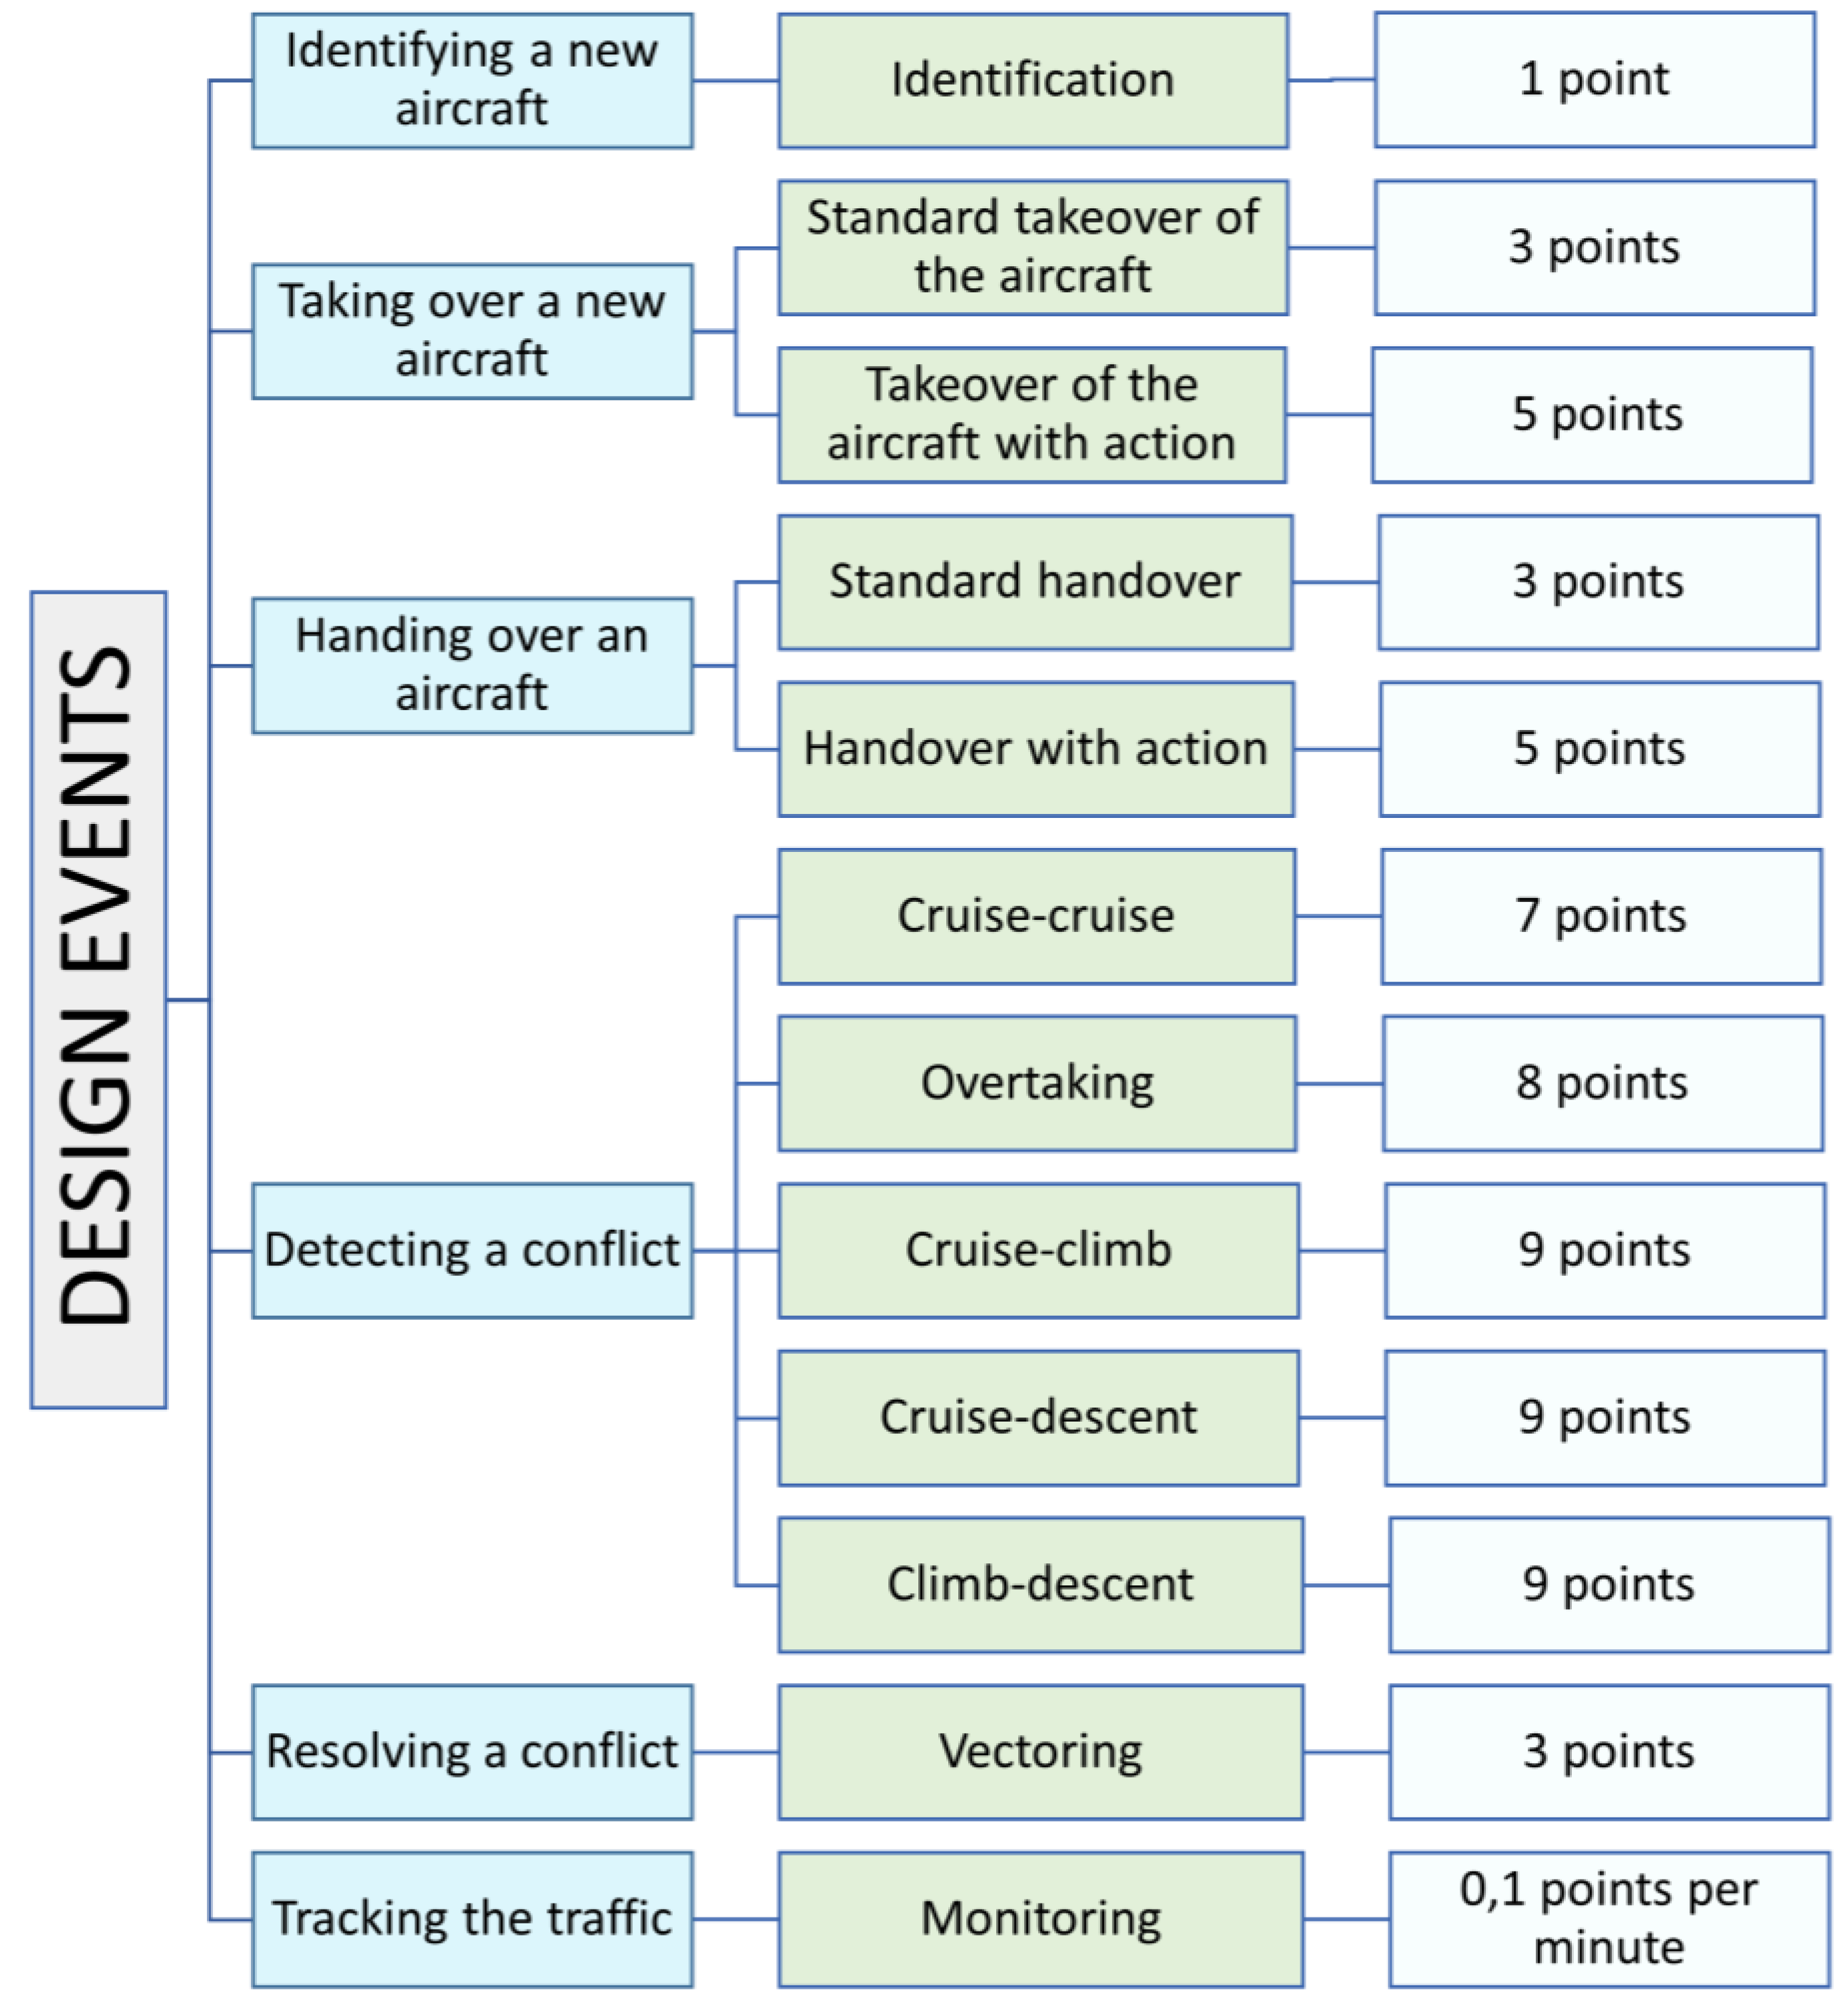
2.2. Events Considered in the Design of Exercises

To design the exercises, the first step was to agree on the ATC events to be considered when creating a designed taskload profile that would characterise each exercise. For this purpose, a series of workshops were organised that brought together ATM experts as well as people with previous experience using SkySim.
Within the group of experts, the vision of experienced working controllers was highly valued. On the other hand, researchers with previous experience in the design of simulation exercises and in the development of validations in research projects at the national and European level were included in the working group.
In particular, there were two previous studies that were very useful for defining the final ATC events. On the one hand, at the national level, UPM had previous experience working with the Spanish Aviation Safety Agency.
On the other hand, the events considered in the SESAR AUTOPACE project were also of great interest [20].
The results of the AUTOPACE project provide a better understanding of how cognition and automation coexist, thus supporting new strategies for training and interface design [21]. Although the objectives are not aligned with those of the present line of research, the events defined in this project have been considered as a reference, as has the definition of difficulty in the design of the exercises.
Figure 2 shows, in schematic format, the activities that were identified as key ATC tasks (shaded in blue), the designed ATC events associated with each of them (shaded in green), and the base score for each of the events (rectangles with a white background).
The first aspect that was defined was the key activities carried out by ATCOs in nominal traffic situations. The result can be seen in the six blue rectangles shown in Figure 2, including the identification of an aircraft, the takeover/handover process, the identification of a conflict and its resolution, and, finally, the monitoring of the traffic present in the sector. On the basis of these activities, at least one event associated with each of them was defined. The twelve events considered can be seen in the green rectangles in the figure above. For each event, an average duration and a base score were defined.
Eleven of the events have an absolute value associated with the event. The monitoring event is the only one that is relative. It is associated per minute with each of the aircraft within the sector at a given time.
In defining the twelve events, complexity factors aligned with those identified by other authors have been considered. Specifically, the authors of [22] conducted a Principal Component Analysis (PCA) on 24 complexity factors defined in the literature to reduce them. The final result was a set of eight complexity factors. Several of these factors have been considered when defining the events listed in Figure 2, in particular, aircraft count, aircraft vertical transitioning, and conflict sensitivity. In this line of research, the complexity factor of aircraft count has been considered by defining three scenarios of traffic density that condition the base values of taskload. Similarly, in the case of conflicts, the contribution of aircraft climbing or descending has been taken into account by giving conflicts where one or both aircraft are changing their flight level a higher taskload value than conflicts where aircraft are at cruise level.
Air traffic control is a service task whose duty is to prevent conflicts between aircraft [23]. The events associated with conflicts were discussed in detail. It was decided that conflicts should be categorised according to the state in which the aircraft were: in cruise flight or climbing or descending. When two aircraft are on the same trajectory and one of them starts to approach the other, until the separation minima are infringed, an overtaking event occurs.
ATCOs are required to ensure that minimum separation standards are complied with at all times in terms of horizontal and vertical separation between aircraft [24]. Regarding the level of automation of the platform, the configuration used in this experiment is very similar to the so-called attention-guided mode in [25]. In this configuration, conflict detection is automatically performed by the simulator. However, the ATCO retains the role of controlling the aircraft and is not assisted in resolving the conflict. In the context of this experiment, a conflict is defined as a situation where the minima of 5.0 NM in the horizontal plane and 1000 ft in the vertical plane are infringed.
In the simulator’s conflict detection tool, the detection threshold in the horizontal plane is set to 7.9 NM. This allows ATCOs to receive information in advance of a conflict situation occurring. The conflict detection tool helps them identify which aircraft are involved in the conflict situation, how close they will be at the closest point of approach (CPA), and the time until this point is reached. However, the decision-making process to resolve the conflict remains in the hands of the ATCO, without guidance. In short, conflict detection is automated on the simulation platform, but resolution is not.
Although there are many factors that can increase the complexity of an event for a controller, traffic density is one of the key factors that increases perceived workload [26].
To account for this contribution, the base score of each event increases as the number of simultaneous aircraft in the sector increases. For this purpose, three traffic density scenarios were defined: low (less than five aircraft), medium (between five and nine aircraft), and high (more than ten aircraft).
Additional information on the definition of events and the assignment of taskload values can be found in [9]. This reference also includes a table that compares the basic characteristics of the four exercises used in this study, including the number of aircraft in each exercise, the number of events, or the sector in which the simulations were conducted.

2.3. Details of the Simulation Campaign

To ensure safe and efficient traffic flow, ATCOs must predict future flight paths based on their perception and interpretation of multiple data on the radar display [27]. In this study, it was considered from the outset that one of the cornerstones of the experiment should be data collected in a especially designed simulation campaign. In this way, in addition to the numerical data, it is also possible to access all the information concerning the radar display, as well as the actions taken by ATCOs.
The exercises simulated in this research reproduce realistic en route scenarios where aircraft are established at certain flight levels. En route ATCOs are responsible for monitoring, controlling, and managing aircraft and traffic flows in the ATC sectors they have been assigned [28]. In the exercises simulated in the experiment described in this paper, the sectors of responsibility varied throughout the exercises, though sectors within Madrid Area Control Centre (ACC) airspace were always used.
In the simulations, each participant simulated four exercises. Each exercise lasted 45 min and was designed to be simulated in parallel in two sectors. The taskload value for the first exercise was 141.40, and this value continued increasing until Exercise 4, which had a value of 228.55. Table 1 presents a comparison of the designed taskload values for each of the exercises.
As mentioned above, to introduce subjective assessment of the workload by participants, the ISA method was used. This method was implemented on the platform through a Python program that was run in parallel to the simulations.
A window asking the participants to evaluate their perceived level of workload appeared every two and a half minutes in a fixed place on the radar display. To do so, they had to press one of the five buttons available under the question, with ‘1’ being the lowest value and ‘5’ the highest value. They had 20 s to select one of the options before the window automatically closed.
The data presented in this paper relate to six participants. All participants were ATCO students with an average age of 21 years and previous knowledge in the field of air traffic management. The ATCO students who participated in the study were selected on the basis of their performance in other practical tests developed during their training.
Throughout their training, participants were trained in concepts related to airspace management, conflict resolution strategies, and the operation of a control position. Although they had previously performed different exercises and simulations with other simulation platforms, this experiment was their first contact with the SkySim platform. For this reason, prior to the test exercises, they underwent specific training on the platform.
The test simulations for each participant took place on two days, with an interval of one week between them. Each day the participant performed simulations, they would simulate two exercises with a one-hour break between. Before starting the simulations, the participants were informed of the aim of the project, and all agreed to their data being analysed as part of the research.

2.4. Data Registered after the Simulations

During the course of the simulations, a multitude of data were recorded. Specifically, for the purposes of this work, two categories of data were of interest:
  • Firstly, the video recordings of the radar screen during the simulations. From these recordings, it is possible to obtain information about the events that actually took place, the actions taken by the participants, and the conflict resolution strategies followed.
  • Secondly, information that was obtained about the subjective workload values evaluated and the minute of simulation in which each of the values was selected.
In the study of human factors, the exclusive use of subjective measures of workload assessment has certain limitations. On the contrary, some of its main advantages are the relatively low effort required to acquire data and high user acceptance [29]. These advantages were considered decisive for the implementation of subjective measures in this study.
As mentioned above, neurophysiological data were also recorded during the simulations and will be studied in later stages of this line of research. Physiological measures have been shown to be sensitive to differences in taskload and task demand in a variety of domains [30]. For this reason, they are of interest in the study. However, to be able to compare the variation in these variables against the taskload, the first step is to have a good baseline for that taskload.
The use of subjective workload values is a preliminary step. It is assumed that the most complex traffic situations and the most difficult combinations of existing events will lead participants to evaluate these traffic situations with the highest workload values. The idea is to use these values to define the best baseline taskload profile for future use in determining other workload indicators.
From the data related to the subjective assessment of workload, two variables are of interest:
  • The first variable is the subjective workload value selected in each query by the participant. The possibilities are that a numerical value (1–5) is recorded or, in case the participant did not respond, a “not assessed” is recorded.
  • The second variable is reaction time. This variable can take values in the range of 0–20 s, as this was the time that the participant had to select one of the values of the ISA scale before the window closed. Reaction time is calculated as the difference between the time in the simulation when the participant selects one of the values and the time in the simulation when the ISA method window appears.
These two variables will be used as an intermediary step in the establishment of a methodology that can obtain the best reference taskload profile. The results of this analysis and its implications are presented in the following section.

3. Results

In the safety-critical area of ATC, workload remains a dominant consideration when seeking to improve the performance of ATC systems [31]. As mentioned above, subjective workload data will be used as an indicator to establish the best event-based taskload baseline.
The starting point is to try to assess the suitability of the design profile as a baseline. This would be the simplest situation, since this profile is available from the beginning of the creation of the exercises. In the following two subsections, the results obtained from the combined representation of this design profile and reaction time data and workload values will be presented.

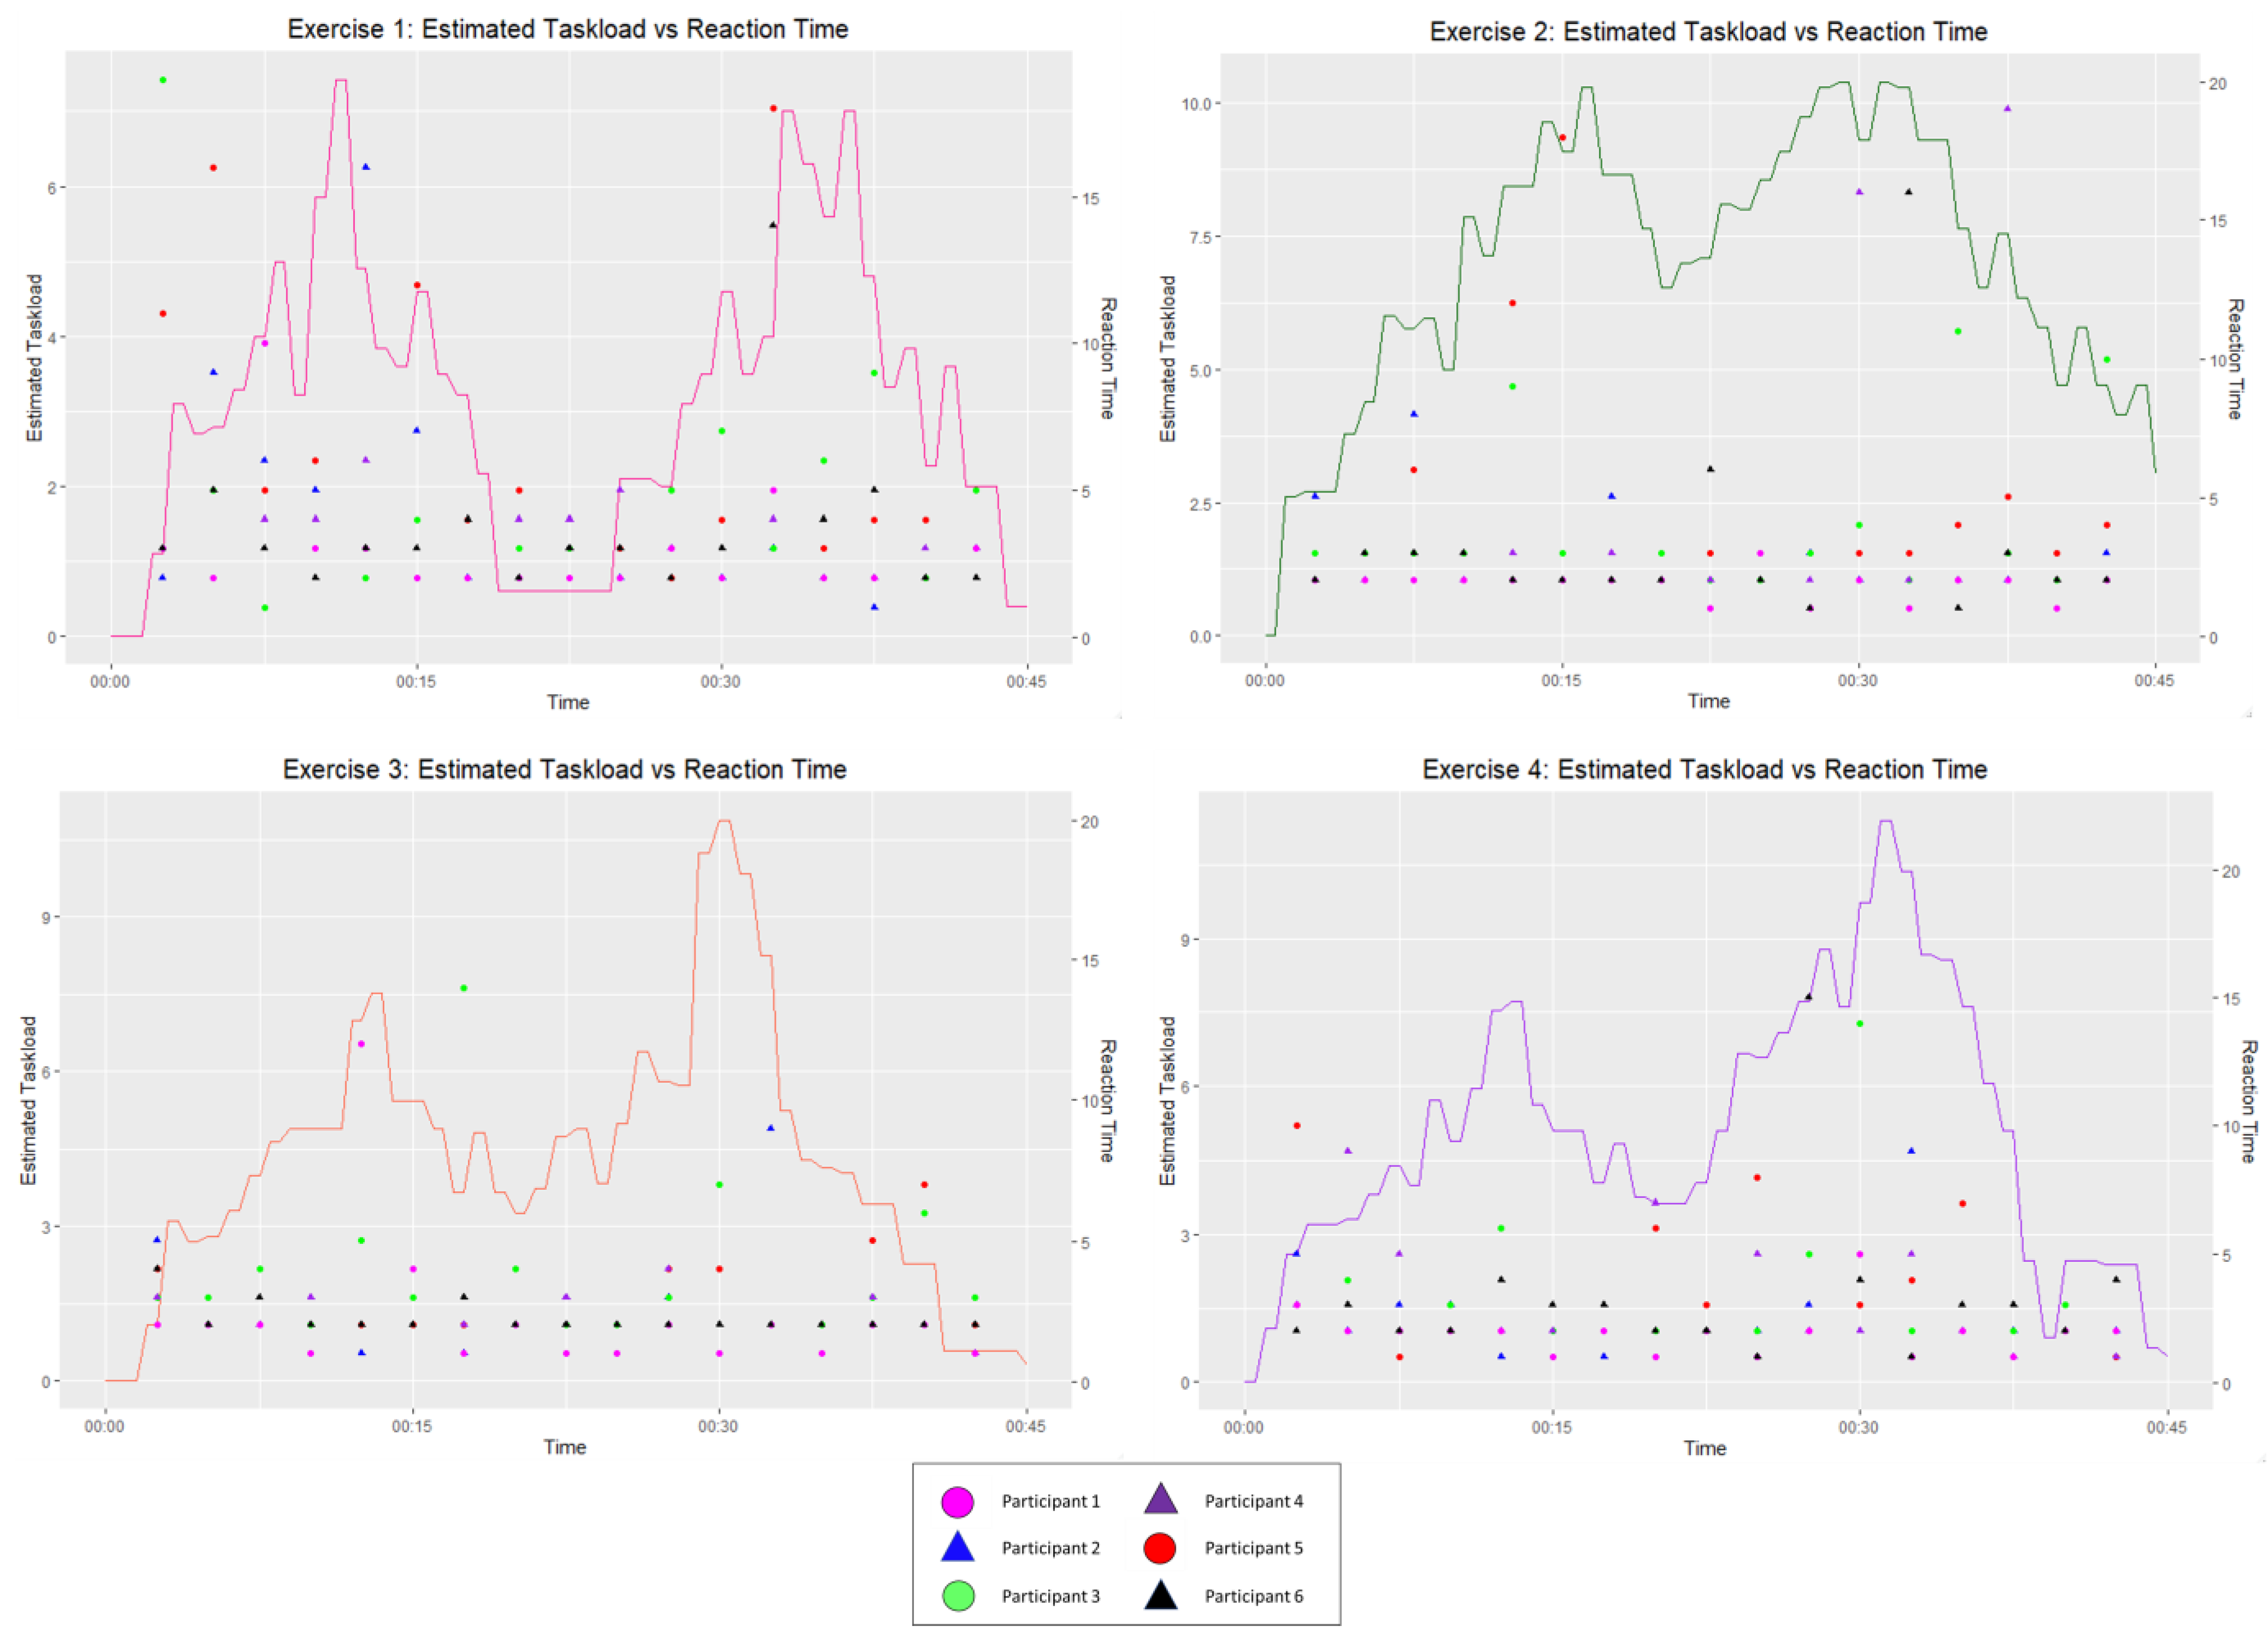
3.1. Analysis of the Reaction Time Variable

To establish a relationship between the reaction time variable and the designed taskload of each exercise, it was decided that a combined graph should be created. The same graph shows the designed taskload profile, which is different for each of the exercises, and superimposed on it are the reaction time values for each of the six participants.
A representation of the four exercises can be seen in Figure 3. Each participant is represented by a different geometric shape and colour, as can be seen in the legend that appears under the four plots.
Each of the exercises has been associated with a different colour to facilitate the interpretation of the plots. The taskload profiles of Exercise 1 appear in magenta, those of Exercise 2 in green, those of Exercise 3 in orange, and finally those of Exercise 4 in purple.
To correctly interpret Figure 3, the following aspects should be considered.
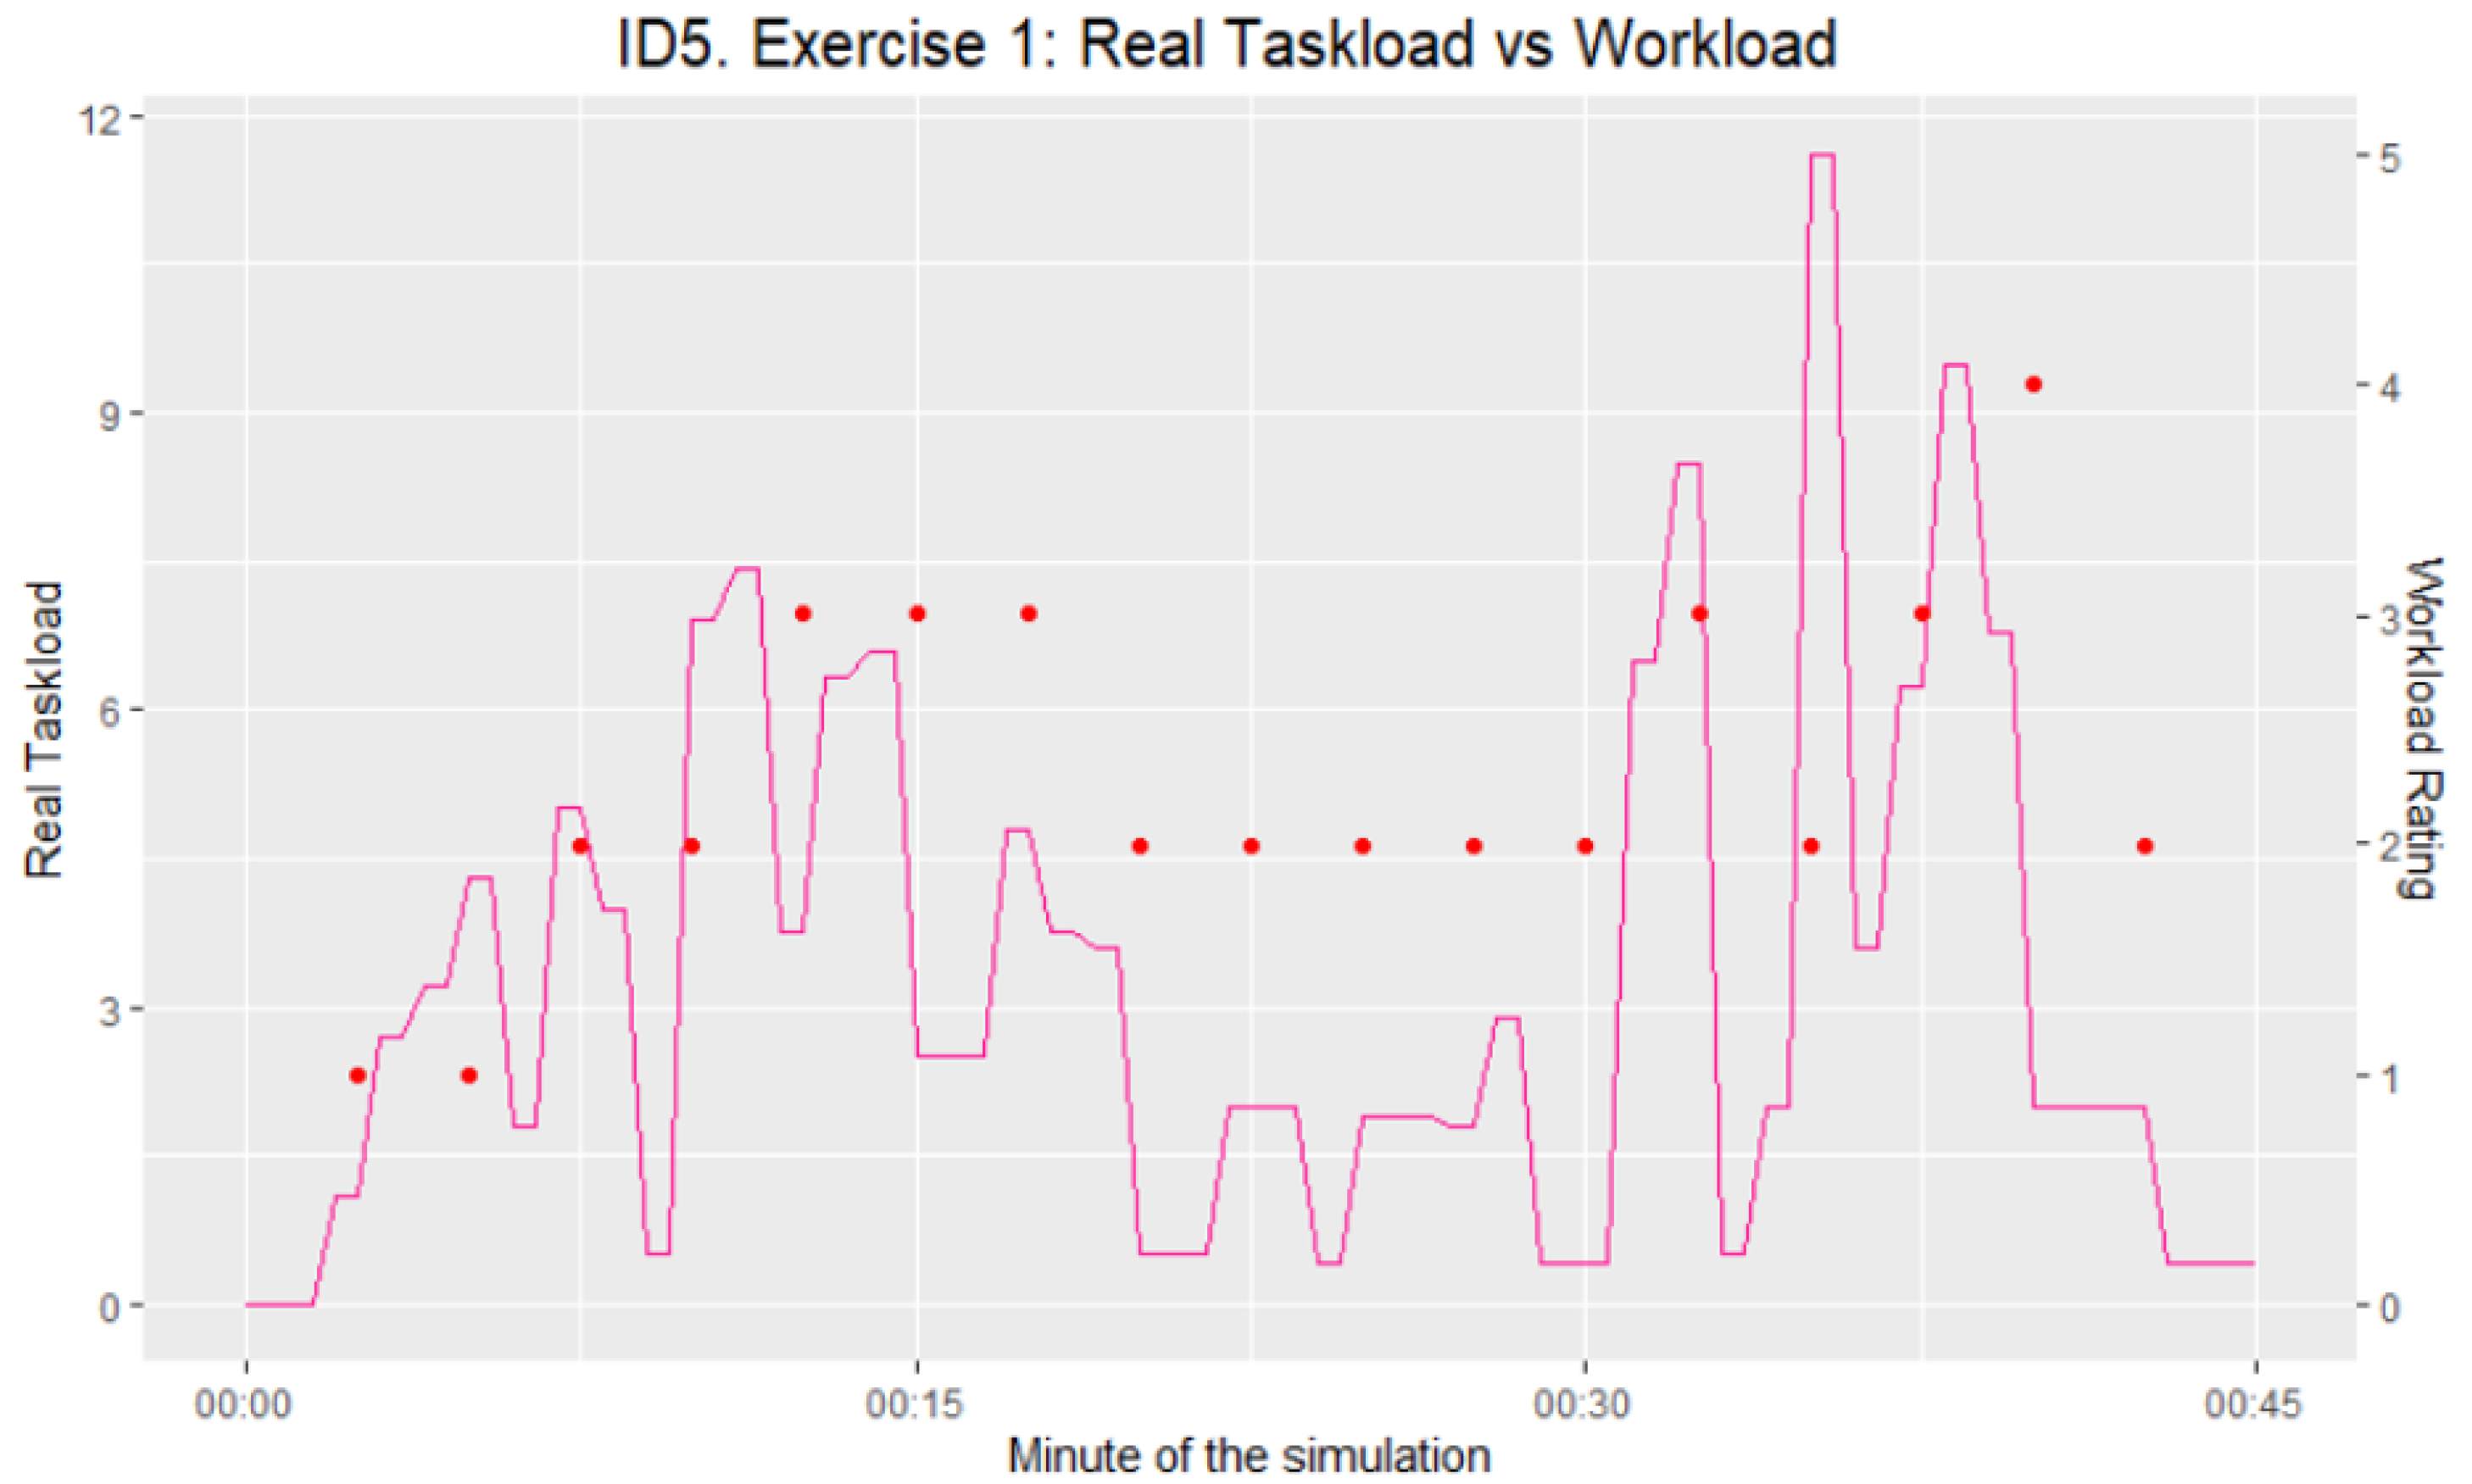
  • The x-axis of the four graphs represents the time elapsed since the start of the simulation. All exercises lasted 45 min.
  • Each graph has two vertical axes: the left vertical axis is associated with the taskload profile and the secondary axis on the right is associated with the reaction time variable.
  • The left vertical axis indicates the value of the designed taskload per minute of simulation. In each of the graphs, the upper limit of this axis is different considering that the difficulty increases progressively from the first exercise to the last.
  • The vertical axis on the right, i.e., the secondary axis, indicates the reaction time value for each of the participants. In all graphs, the values on this axis range from 0 to 20 s. There are reaction time values every two and a half minutes, as they are recorded at the moments when the participants assessed their workload.
As can be seen in the figure above, the taskload distribution profile for each exercise is different. In the exercise design process, the starting point was a specific shape of designed taskload and a total reference taskload score. Specifically:
  • The taskload profile of Exercise 1 was designed to be symmetric with two cycles of taskload and a low event valley in the central part. In each of the cycles, the taskload was intended to progressively increase to a maximum and then decrease again.
  • The taskload profile for Exercise 2 was designed to have two taskload cycles separated, again, by a valley. In this case, the area with fewer events did not have taskload values as low as in the case of the previous exercise.
  • The taskload profile of Exercise 3 was designed to be non-symmetric. In this case, the first cycle would reach a taskload maximum lower than the second cycle.
  • The profile of Exercise 4 has characteristics similar to those of the previous exercise. The difference is that in this exercise the maximum taskload values are higher.
Table 1 shows a summary of the design characteristics of each of the exercises to compare their design values. The second column presents the total taskload value for each of the exercises. The next two columns present the maximum value of the designed taskload and the minute of simulation at which this value was expected to be reached.
Taking all the above into account, the obtained values for reaction time and the designed taskload for each of the exercises were represented in a combined graph.
The initial hypothesis was that reaction time would increase as the taskload faced by the ATCO increased. Given that the situation in the sector is more complex, it would be expected that the controller would take longer to assess the workload.
However, such a correlation was not observed in any of the four exercises. Contrary to what might be expected, the highest reaction time values appear at the beginning of Exercise 1. The explanation for these values is not that the situation in the sector was more complex, but that the participants were not yet familiar with the platform, the radar screen, or the additional windows.
Some isolated cases that confirm the initial hypothesis are the values of Participants 3, 5, and 6 in Exercises 1, 2, and 4, where the reaction time values increase at times with high taskload values. However, in general, the expected generalised relationship is not observed. Based on the analysis conducted, it was considered that, in the case of the registered data from participants, reaction time was not a significant variable in the study, and it was decided to discard it.

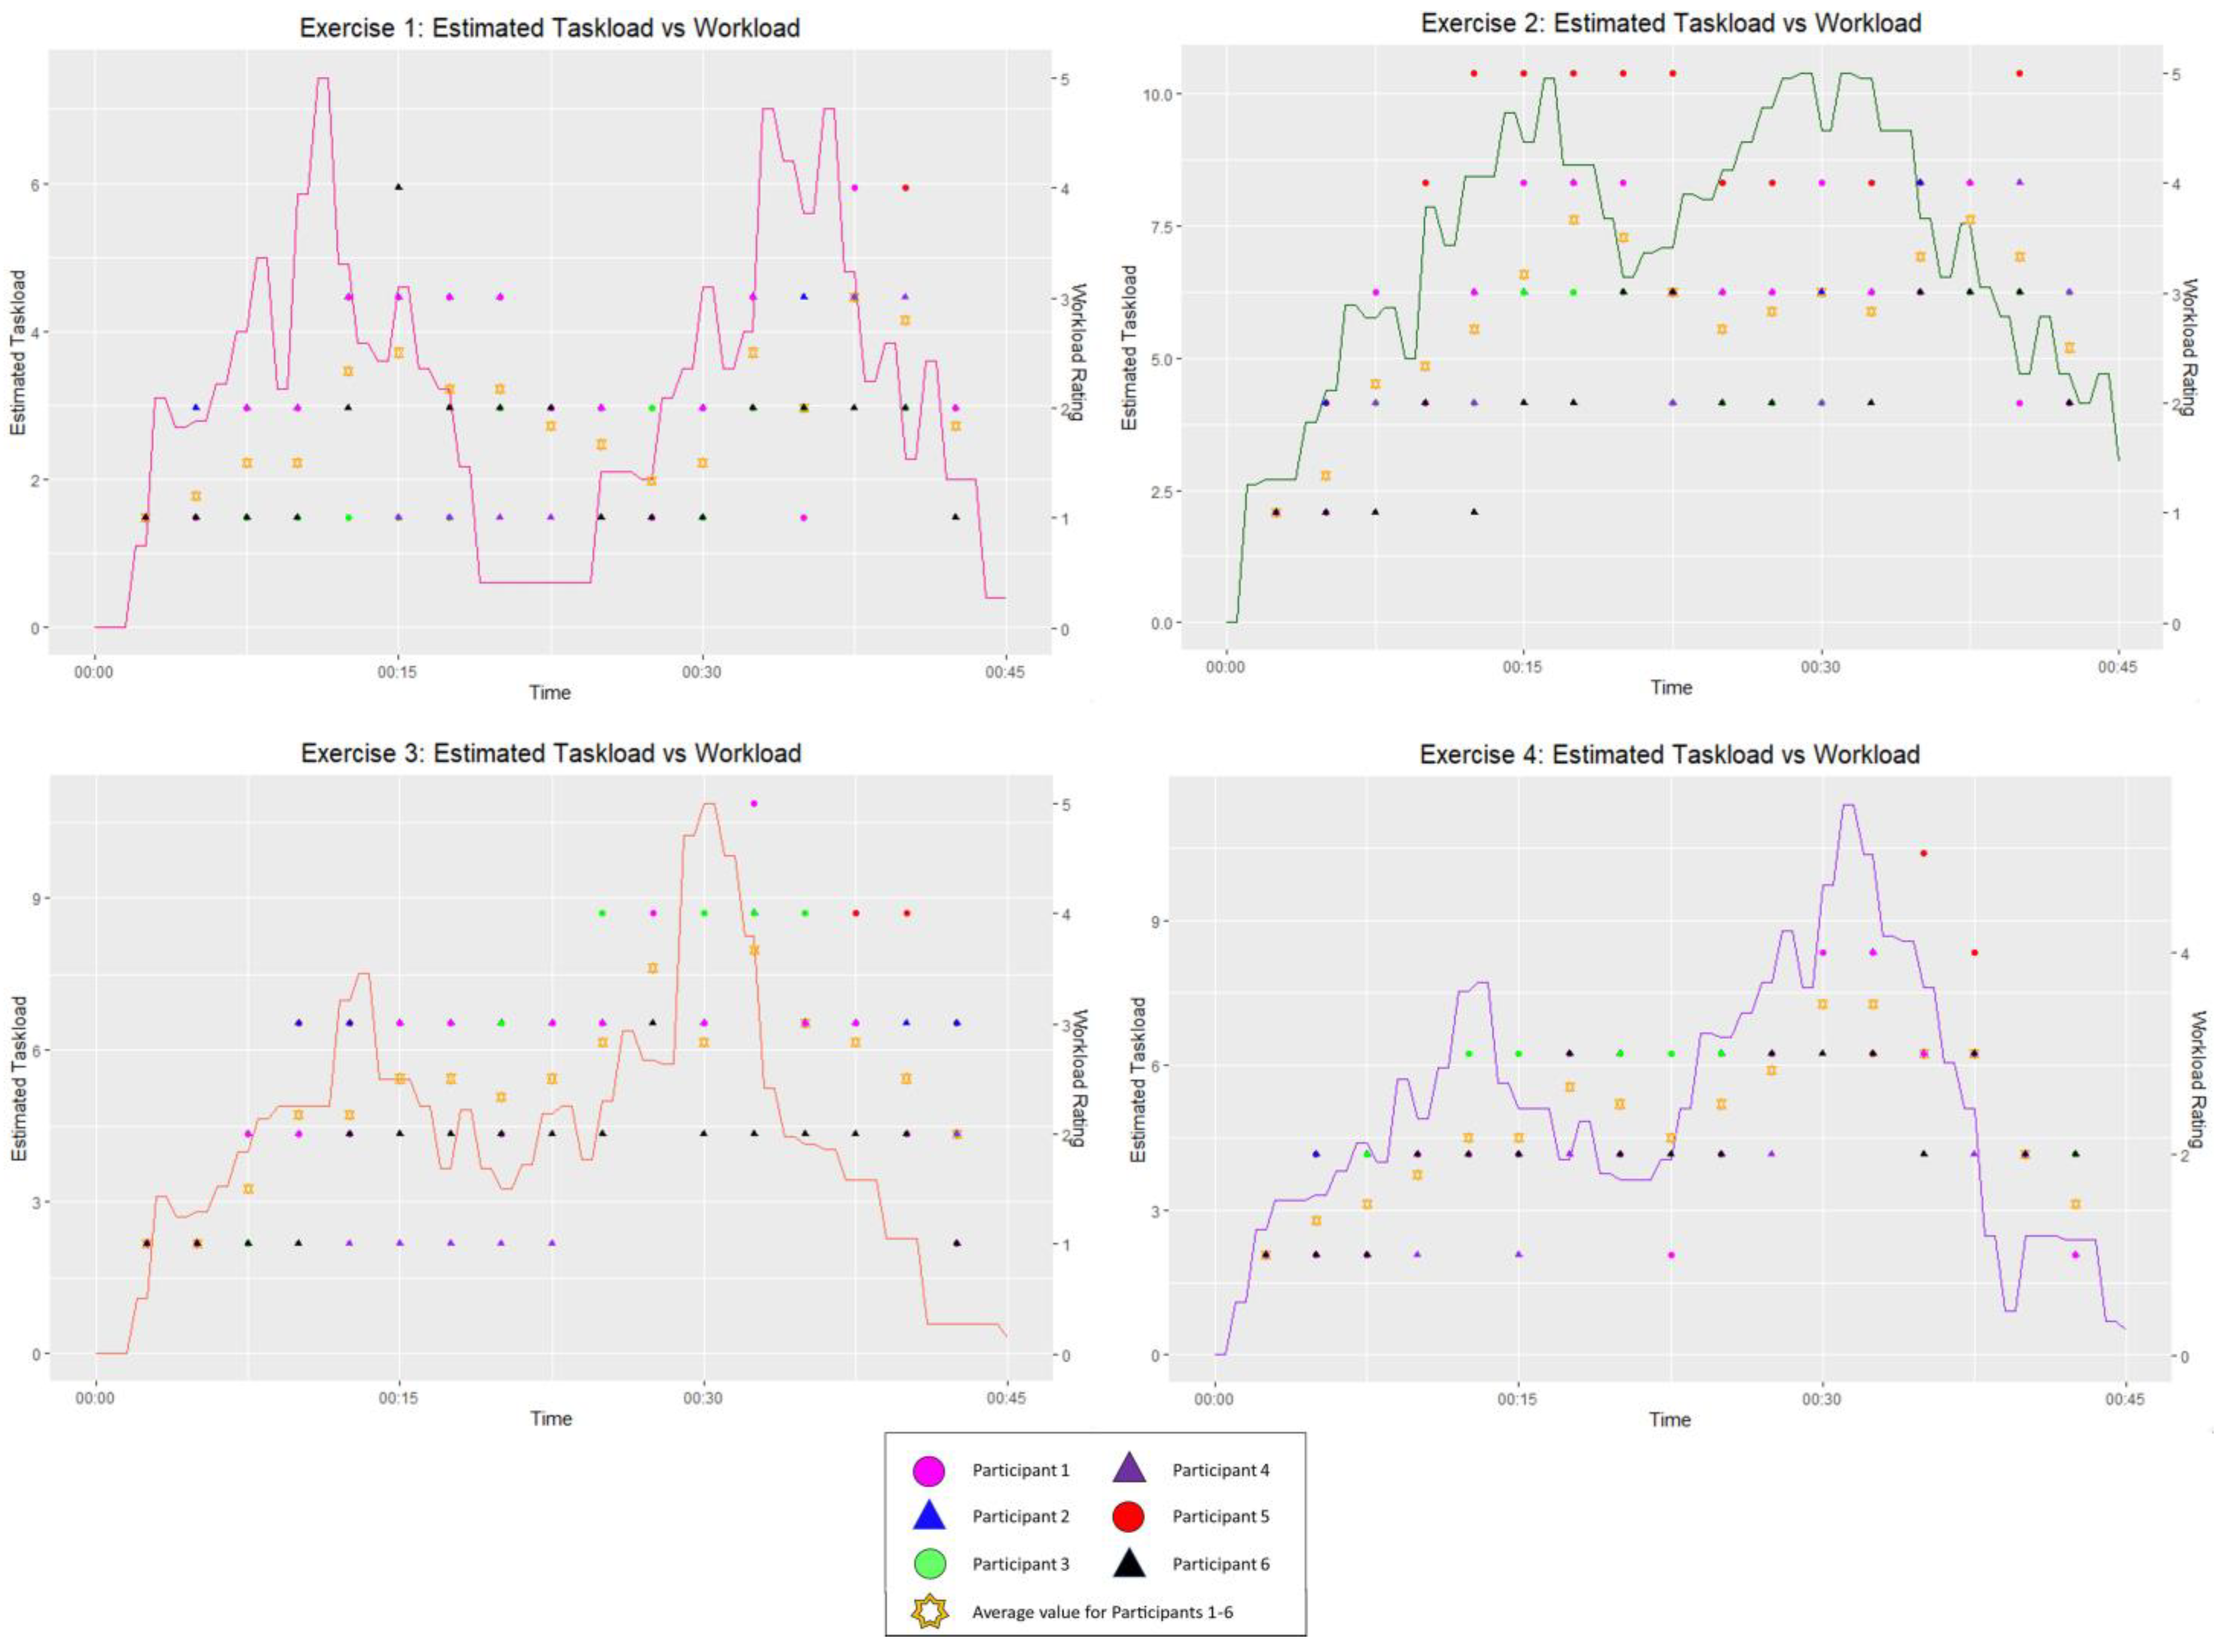
3.2. Analysis of Subjective Workload Scores

Once the variable associated with reaction time had been discarded, the approach was repeated while considering the workload values recorded by the participants. A combined representation of the exercise design profile and superimposed subjective workload values was created.
Figure 4 presents a combined representation of the designed taskload profile and superimposes the workload values assessed by each participant.
The rationale behind the plots is the same as in the case of reaction time. The only difference is that, in this case, the secondary axis presents the workload values on a scale of 1 to 5.
In addition to the series identifying each of the participants, an additional series of data points has been included in the graphs. The values indicated with an orange star correspond to the mean values of the six participants in each of the moments where the workload is evaluated. As can be seen, in general, the values evaluated by each of the participants are closer to the mean in the first evaluations of the exercises and in the final minutes. In the middle minutes of the exercise and in the intermediate minutes of the taskload cycles, the values assessed by the participants are more dispersed due to the different actions implemented by the participants, especially in the conflict resolution processes.
Unlike what happened in the case of the reaction time variable, the workload values evolve throughout the exercise. The initial hypothesis in this case is that the highest subjective workload values are reached in minutes when the designed taskload is highest. However, in general, this relationship is not observed.
The fact that workload values evolve over the course of the exercise makes them a variable of interest in the study. After the combined graph analysis, the results obtained are as follows:
  • The general tendency of the participants is to assess the highest workload values out of phase with the designed taskload. This is particularly clear in the graphs of Exercise 1 and Exercise 3. The reason for this is that events that have a higher value of taskload associated with them appear to have a longer duration than in the designed taskload profile. Therefore, participants must implement actions to deal with these events for longer periods of time. Depending on the actions selected by each participant, especially in conflict resolution processes, the taskloads of more complex events can influence the workload of ATCOs for longer periods of time.
  • Considering that the purpose of the study is to identify the situations associated with the highest workload values assessed by ATCOs, it is necessary to define a reference profile capable of explaining the events that take place at the moments when the workload values are at their maximum.
  • In general, the trend in workload assessments does not follow the designed taskload profile. To continue with the study, this designed taskload is not a good baseline.
  • It is necessary to establish a taskload profile based on the actual situation experienced by each participant during the simulations.
All of the above leads to the conclusion that the designed taskload is not a good reference. This profile was unique for each of the exercises. However, the decision-making process of each ATCO and the conflict resolution strategies used are specific to each controller.
Therefore, in order to explain the workload values evaluated by each of them, it is necessary to compare these values with a specific taskload profile for each participant and each exercise.
Analysis of the graphs in Figure 4 leads to the conclusion that the actual taskload experienced by each controller was different from the designed taskload. Therefore, it is necessary to determine the actual events that took place in the simulation for each participant so that a taskload reference representative of what actually happened may be obtained.
To find out which events took place during the simulations and at what time, the radar screen recordings of each controller were examined. The steps in the methodology to obtain the actual profile were the following:
1.
For each exercise, the minutes of the simulation in which the absolute events occurred were recorded. The taskload values associated with each event were the same as those shown in Figure 2. The aim is to enable a comparison between the design and actual taskload profiles.
2.
In addition to the taskload of absolute events, there is the taskload associated with aircraft monitoring. The time interval in which an aircraft is monitored is calculated as the difference between the time at which the identification event starts and the time at which the event associated with the handover ends.
3.
During analysis of the recordings, two new events were identified that had not been considered during the design of the exercises.
a.
The first event is the change of flight level. Some participants, upon identifying that two aircraft were about to encounter a conflict, would anticipate the situation and change the flight level of one of the aircraft before being alerted by the conflict detection tool. This event was assigned a base score of 2 points.
b.
The second event is the change of speed. As in the previous case, some participants detected in advance that an overtaking conflict was going to occur. In this case, some participants considered that the easiest way to resolve it was to change the speed of one of the aircraft involved. Since the taskload induced is similar to that of flight level changes, this event was also scored with a base value of 2 points.
4.
The events with the highest associated taskload are conflicts. These situations were analysed in great detail. The greatest differences with respect to the designed profile were found to occur as a consequence of conflict resolution. In the design of the exercises, for each of the designed conflicts, a generic vectoring event was assigned for conflict resolution. In actual simulated exercises, several participants needed to try different conflict resolution strategies before resolving a conflict. This was especially acute in the case of the second cycle of Exercises 3 and 4, where two conflicts were designed to take place with a short time interval between.
5.
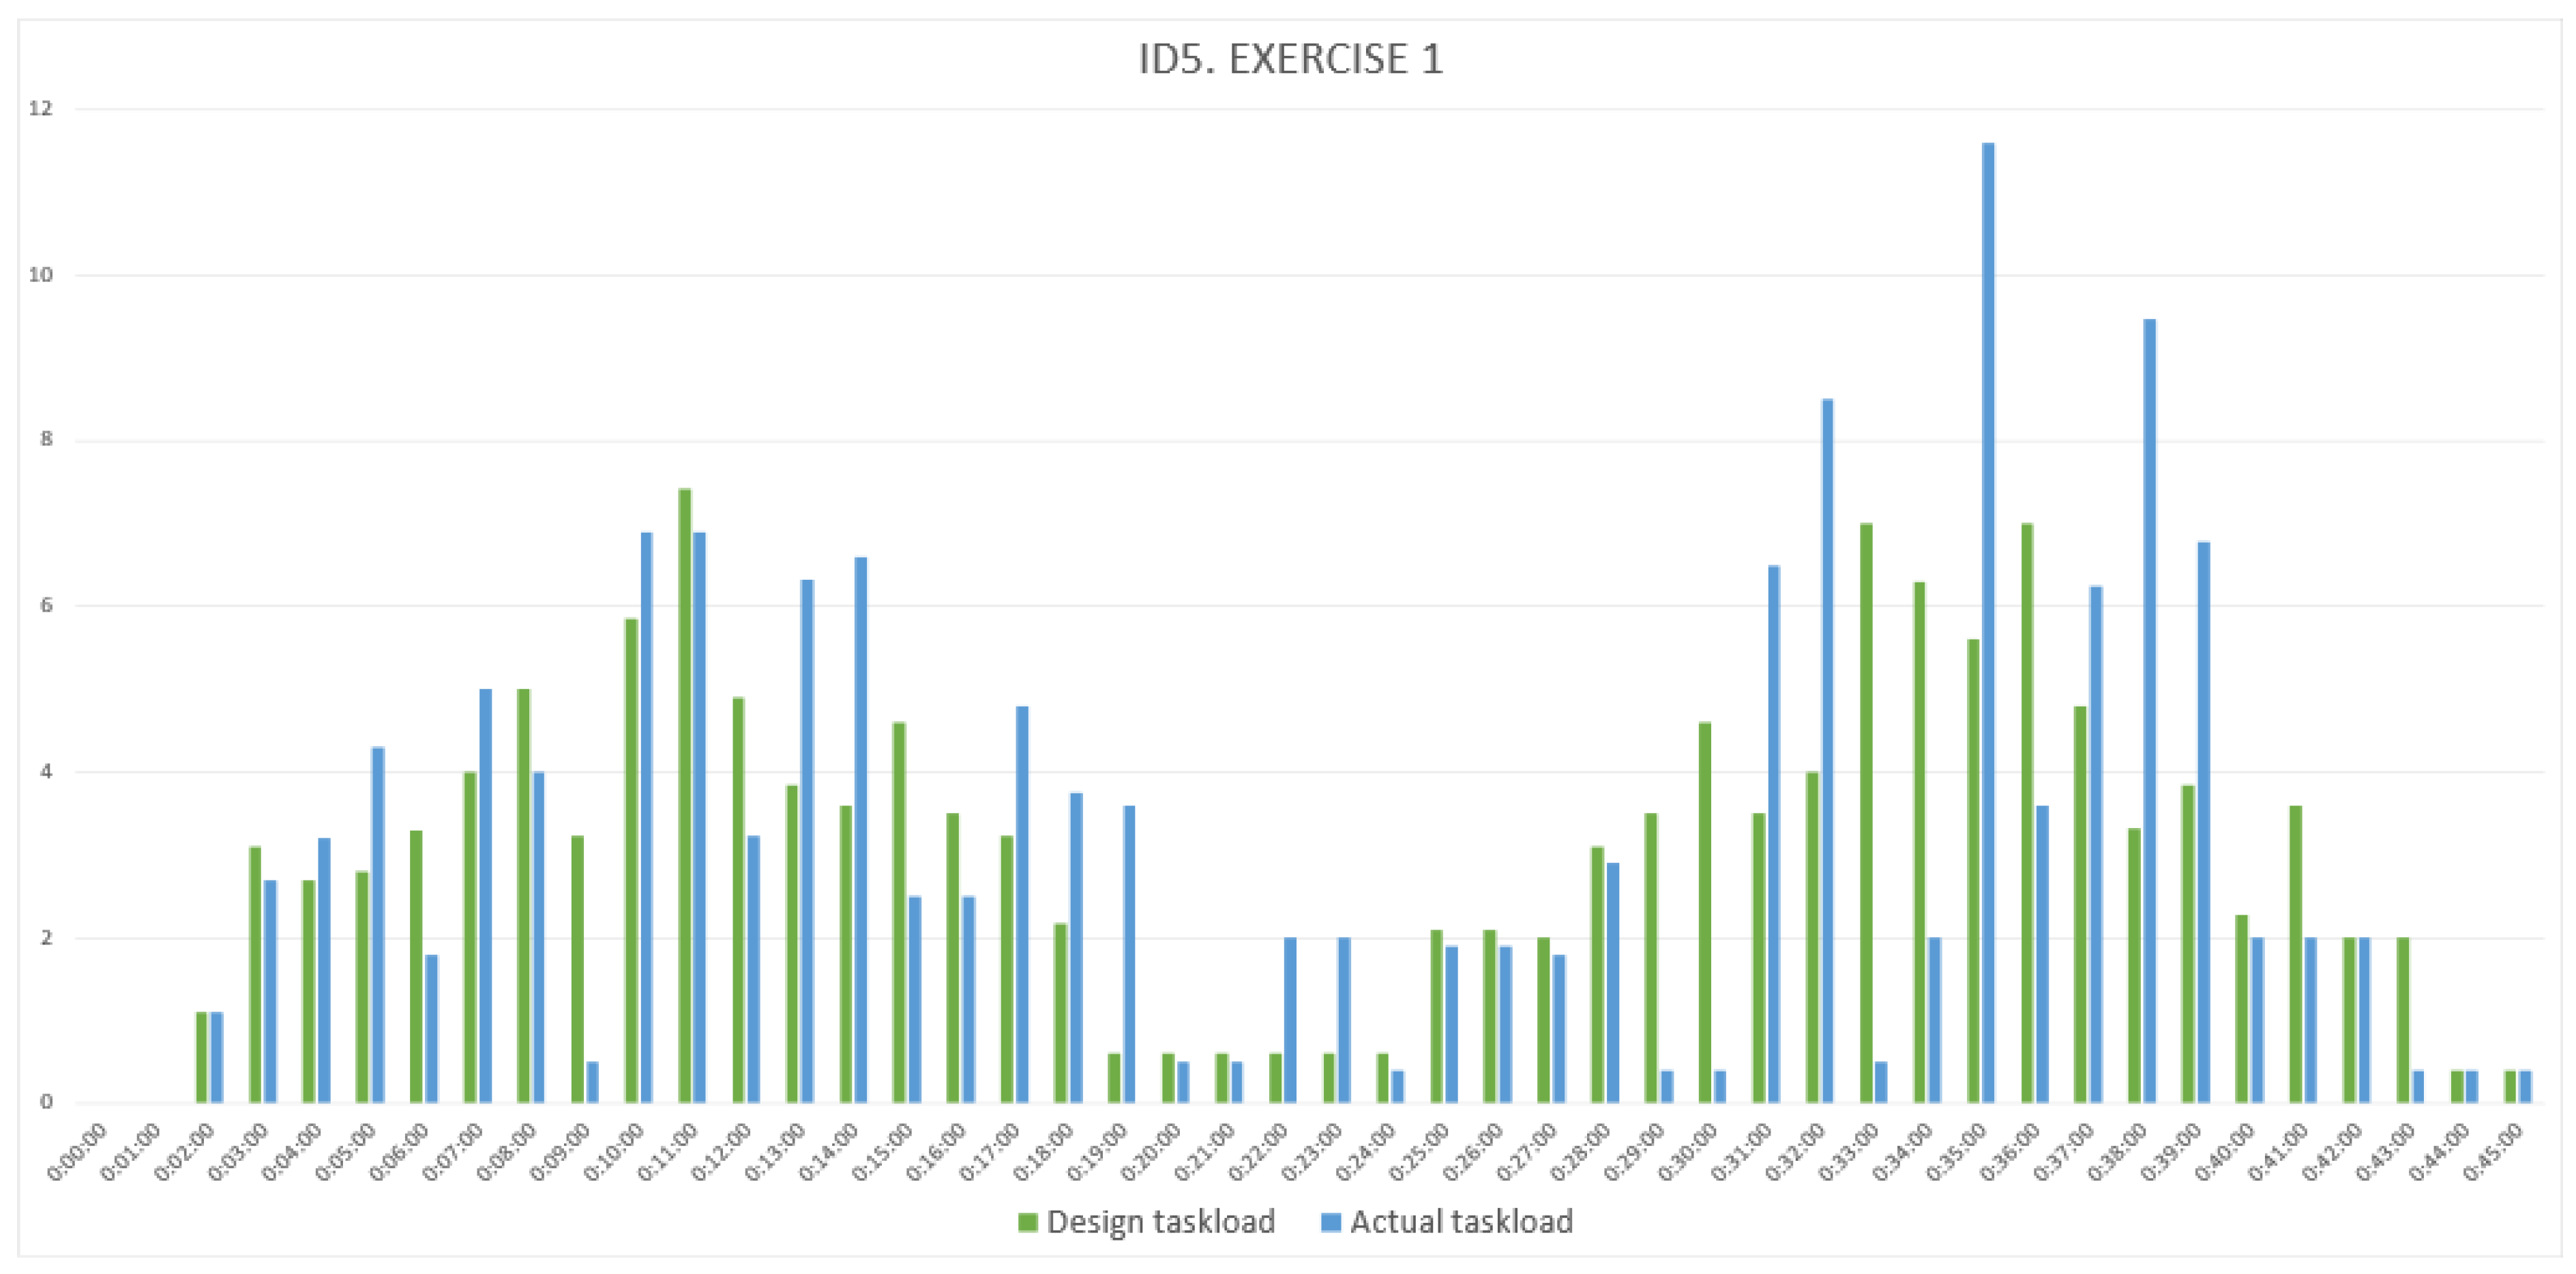
Taking all of the above into account, a bar chart was designed that represents the taskload associated with each minute of the simulation. This actual taskload can differ from the designed taskload in terms of the number of events, as well as in the start and end times of some events. To understand whether the participant had perceived the exercise as easier or more difficult than initially designed, a combined representation of the actual and designed taskload profiles was made, and tables were created comparing the score values of the two profiles to understand how the actual profile differed from the designed one.
6.
The actual taskload profile obtained for each exercise and for each participant was compared with the subjective workload values assessed by each participant. In this way, it was finally possible to identify which event or set of events led to the highest workload values.

4. Discussion

This section is structured in two parts. The first presents a case study to reflect the implementation of the steps of the methodology listed in the previous section. It then presents a series of general results obtained by repeating this analysis for all exercises and all participants.
The second part includes a series of recommendations for future research in the field based on the results of this study. The results presented in this study are specific to this. The idea of including a set of recommendations here is to justify the interest in the methodology and to highlight the lessons learnt for the benefit of other researchers in the field who might consider developing a similar experiment.

4.1. Case Study and Generalised Results

4.1.1. Case Study

Following all the steps in the methodology, the actual taskload profiles of each of the participants were constructed and analysed one by one. As an example, this subsection explains the detailed analysis of one of these actual taskload profiles. Exercise 1 of Participant 5 (ID5) was selected to be the case study.
After reviewing the radar screen recording of Exercise 1 and studying the decisions made by Participant 5, a total of 47 absolute events were identified, as well as the start and end times of each event.
For these absolute events, the taskload derived from aircraft monitoring was added. From these data, a bar chart representing the actual taskload profile was constructed and compared to the designed taskload profile.
The combined plot of both diagrams can be seen in Figure 5. For each minute of simulation, the green bars represent the designed taskload and the blue bars represent the actual taskload.
When comparing the two bar charts in the previous figure, it can be seen that the taskload distribution is different in the simulated exercise. In addition to the fact that the taskload values per minute of simulation are different, it can also be seen graphically that the taskload distribution in each of the cycles is not maintained.
The designed taskload profile was symmetric. However, symmetry has been lost in the actual taskload, with the highest taskload values being reached in the second part of the exercise.
Table 2 shows a comparison of the most relevant data for each of the designed and actual profiles.
The first row of the table above presents the total taskload values for each of the cases. The taskload profile of the actual exercise is higher than the designed profile. The first conclusion is that Participant 5’s simulation was a more difficult Exercise 1 than the one that had been initially designed.
The next two rows compare the scores associated with the absolute events and the monitoring event (defined per minute for each aircraft).
As can be seen, in the case of this participant, the taskload associated with the absolute events is higher than that of the design. This is due to the fact that a greater number of events appear in the simulation than those initially designed, fundamentally due to the resolution of conflicts. Specifically, the conflict that occurs at 00:10:41 is resolved by changing the flight level of one of the aircraft. As the exercise progresses, this aircraft must be returned to its original flight level in order to comply with the flight plan of its flight progress strip. In the same way, in order to resolve the conflict that takes place at 00:35:00, several vectoring events are required, as the first one is insufficient in terms of respecting the separation minima between aircraft.
In contrast, the monitoring score is slightly lower. This is explained by the fact that the participant handed over some aircraft earlier than planned in the design. Therefore, they spent less time in the sector.
The maximum designed taskload was 7.425 points. The most significant difference in the table is that the maximum taskload that occurred in the exercise was 11.600 points.
In the design, the minute with the maximum taskload was foreseen to be minute 11. Minutes 33 and 36 had a similar taskload associated with them, although slightly lower than the maximum. These high taskload values are associated with the occurrence of design conflicts in the exercise.
In the case of this specific participant’s taskload, the highest value was reached at minute 35. This high value is explained by an accumulation of events. Some of them have a taskload value that is not too high. This is the case with respect to the identification and takeover of an aircraft. The problem is that in this exercise, they gather in the same minute in which the participant identifies and starts to resolve a conflict.
Finally, the last row compares the number of absolute events. In the case of the simulated exercise, three additional events occurred compared to the design. Specifically, they were events associated with conflict resolution, as the participant had to try different strategies due to the first not being effective.
Once the actual profile of the participant has been obtained and analysed, it needs to be compared with the subjective workload values assessed by the participant. A combined graph of the participant’s actual profile and the subjective workload values assessed can be seen in Figure 6.

4.1.2. Generalised Results

From analysis of the above graph for the different participants, some general conclusions can be drawn about the relationship between the assessed workload values and the identified ATC events.
  • When comparing the workload values with the actual profile, it is possible to explain some values that seemed unusual compared to the design profile.
  • In general, there is a correlation between the moments in which the participant evaluates the workload to be at the highest level and the highest taskload values of the exercise.
  • The effect of events that produce an increased workload is spread over time. Even if the subsequent taskload is lower, participants evaluate the workload in a sustained way over time. An example of this can be clearly seen in Figure 6 in the workload assessments that take place in the central part of the exercise.
  • A common phenomenon is that, once participants have assessed the workload with a value higher than ‘1’, it is very rare that they assess it with the minimum value, except in the valley moments of the exercises or in the last workload assessment at 00:42:30.
  • The most complex events are those associated with conflicts and their resolution.
  • Events evaluated with a higher workload value include conflicts that are not resolved during the first attempt.
  • Simpler events, such as aircraft handovers, are perceived to be more difficult after conflict resolution and with a larger number of aircraft in the sector.
  • When comparing the workload assessment of the participants for a given time, differences are especially found in the middle part of the exercise and in the intermediate minutes of the two taskload cycles. These differences are due to the different actions performed by each participant. This fact, once again, justifies the definition of a taskload profile for each participant and each exercise. These differences in actions are particularly remarkable in conflict resolution processes. Some participants implement actions to resolve the conflict that are successful on the first attempt. On the contrary, other participants must implement several conflict resolution strategies if the first attempt is not satisfactory. For this reason, depending on where the participant is in the decision-making process when the workload assessment question is asked, the recorded values may vary.
The results presented in this study were obtained with a small sample of participants. Therefore, caution should be exercised when extrapolating these conclusions to all air traffic controllers or potential participants in the simulations. In the case under study, this sample of participants has been used to define the methodology and these steps are applicable to other subjects, although the results obtained by introducing more participants may vary. Therefore, these first participants are considered a validation group for the methodology to be followed. In future stages of research, a larger number of participants will be included in the study.
Another limitation is the use of ATCO students instead of air traffic controllers with operational experience. Future work in this research line aims to overcome this limitation. These ATCO students have been involved so as to obtain a methodology that is as robust as possible. In later stages, in-service ATCOs will be included as participants.
These limitations are common to other studies conducted in the study of human factors associated with air traffic controllers. The authors of [32] focused on assessing the effects of the number of crossings, traffic flows, and aircraft separation on the mental workload and perceived emotion of ATCOs. One of the limitations identified in the study was the caution necessary in interpreting the results, as only two ATCOs were included as participants.
Another study in which the number of participants is considered a limitation is [33]. In this case, the aim of the study was to monitor the heart rate variability of the controllers and to determine the suitability of the methods used. To overcome this limitation, including a larger number of participants in the study is suggested. However, the results obtained with the study sample are considered beneficial, as they provide an indication of the suitability of the analysis methods used in this type of research.
In the study documented in [34], the future work reported is very much in line with that proposed in this line of research. In their study, evaluating the behavioural response in ATCOs in terms of the use of the procedural control bay and the electric flight strip bay using human-in-the-loop simulations was proposed. Two experts and two trained subjects were used as participants. Future work includes the development of a study with a larger number of participants, as well as on-site replication in a real operational scenario.
Another possible solution to help overcome the limitation of all participants being ATCO students is to consider a mixed group where some participants have previous experience as ATCOs. As an example, this logic is applied in [17]. In this study, the objective was to present the development and evaluation of a 3D space-based metric solution for air traffic control workload. Participants were part of two different expertise groups: four were retired ATCOs and the other six were researchers in the ATM domain or participants who had completed an ATC course. The study presents comparative results between the two groups of participants.

4.2. Recommendations

The results presented in this study, as well as the baseline ATC events, are specific to this research. The input parameters to the methodology will vary in other studies depending on many variables, such as the number of aircraft introduced in the simulation, the characteristics of the participants in the study, the simulator used, the ATC events defined, etc.
However, the methodological process for obtaining the results can be extrapolated to other studies. Once the methodology has been validated within the CRITERIA project, this methodology will be used by CRIDA in other ongoing research projects.
Based on the experience gained in extrapolating the methodology to other research projects, a series of recommendations of interest have been identified based on the results of this study. These five recommendations could be considered by researchers who wish to implement a similar experiment using an ATC simulation platform.
  • From the beginning of the experiment’s design, it is very important to clearly document the ATC events to be considered. Based on previous work, it is advisable to at least define the mean duration parameter and a designed taskload value. Researchers are advised to keep these values realistic and to consider the opinion of experts with experience in the simulator being used for their definition.
  • Based on the values defined in the previous step, in addition to a list of the events to be included in the study, it is recommended to represent the designed taskload profile by, for example, using a bar chart and defining one bar for each minute of simulation. This will allow researchers to have a reference of what is expected to happen during the simulation before they start developing them. If an observer is watching the simulations with this reference profile in front of them, they can already draw some initial conclusions about the performance of the participants.
  • Whenever possible, researchers are recommended to register radar screen recordings during the exercises. As demonstrated in this study, they have been vitally important in understanding what actually happened during the exercise and in comparing the airspace conditions during the simulation to the design parameters.
  • Before going directly toward a study of the temporal evolution of neurophysiological parameters, it is necessary to invest some time in determining a good profile that considers the actual situation of what happens in simulation exercises. This study has proposed a methodology to determine the best reference profile.
  • In order to obtain the best reference profile for the study of neurophysiological variables, it is recommended to use an intermediate tool that allows researchers to conclude graphically whether the profile considered is consistent with the perception of the participants during the simulation. In this study, values related to the subjective assessment of workload that were obtained via the ISA method were used.

5. Conclusions and Future Work

The study of human factors in aviation integrates the human component with the advanced technology used in air traffic management.
Within this discipline, the use of real-time simulations presents many advantages, including the ability to design exercises with known ATC events and the ability to study their influence on the response of air traffic controllers.
This line of research aims to establish capacity models that consider the neurophysiological variables recorded during the development of ad hoc real-time simulation exercises designed for the project.
The problem is that, in order to develop a detailed and valid study of these variables, it is necessary to compare their evolution with a valid taskload profile, which represents the actual difficulty faced by the participant during performance of the exercises.
The results of this study show that the two initial hypotheses were correct. In this experiment, a methodology has been established to define an event-based taskload profile that is suitable for studying the evolution of neurophysiological variables. The future objective is to extrapolate the study to the real operation of a control unit.
It has been demonstrated that, in the case of the data analysed in this study, the subjective workload values obtained after implementing the ISA method on the platform have been a good intermediate tool for assessing the suitability of considering the different taskload profiles as a reference. In this paper, the methodology that was followed to obtain this reference taskload has been presented, as well as the main conclusions obtained after comparing the actual taskload profile obtained to the subjective workload values assessed by the participants.
From analysis of the designed taskload profile and the subjective workload values, it has been shown that the designed taskload profile of the exercises is not the best baseline for studying the combinations of events that generate the greatest difficulty. To solve this problem, a methodology has been defined to obtain the actual event-based taskload profile.
This reference will be used in later research investigating the behaviour of neurophysiological variables related to brain activity and eye-tracking.
When comparing the actual profile to subjective workload assessments, it is possible to explain values that previously seemed unusual. By being aware of the events occurring in each minute of the simulation, it is possible to draw a number of general conclusions about the difficulty of the events perceived by the participants.
Some of these conclusions are in line with what might be expected, based on previous work:
  • The events with the greatest associated difficulty are conflicts and their resolutions.
  • Difficulty increases as the number of simultaneous conflicts in the sector increases.
  • As the number of aircraft in the sector increases, certain events initially considered simple are perceived as more difficult due to the different aircraft that need to be monitored.
However, the results of the study have also revealed some interesting trends:
  • At first, it was suspected that the factor of greatest difficulty was the number of simultaneous conflicts. However, it has been shown that a factor that causes the difficulty to increase greatly is the conflicts that are not resolved at the first attempt and which require a new resolution strategy, i.e., those situations in which the participant tries a resolution strategy, it does not work, and it is thus necessary to change the strategy.
  • Those situations perceived as more difficult are not necessarily those where two conflicts occur in parallel, but those where the resolution of a conflict is prolonged over time, especially when the participant has tried different forms of resolution that are not effective and that worsen the situation of the first conflict detected.
  • In relation to the above, it was found that events that were initially assigned a low taskload value were perceived as more difficult if they occurred while one or more conflicts were present in the sector and when the participant had to deal with them immediately after the resolution of a conflict.
  • The general tendency in the assessment of workload in Exercises 2, 3, and 4 is to assess only the lowest value before the occurrence of the first conflict. Once the participants have to resolve the first conflict, even if the situation in the sector is under control and no additional events occur, it is very rare that the value chosen in the ISA scale is ‘1’.
The results obtained meet the objectives defined in the study and have allowed the establishment of a methodology that can be used to obtain the actual taskload profile of each participant, which can subsequently be used to compare the evolution of neurophysiological variables. On the basis of these findings, the following future work is defined:
  • Once the methodology has been shown to work and is of interest, it will be necessary to extend the process to a larger number of participants.
  • Taking the event-based taskload as a reference, the evolution of neurophysiological variables will be related to the ATC events recorded and the relationship between these variables and the traffic conditions in the sector that are established.
Two main limitations of the work presented in this paper have been identified:
  • Firstly, the small number of participants included in the study.
  • Secondly, the participants were ATCO students and therefore did not have the experience of real controllers. The results obtained could vary when repeating the study with ATCOs in service.
Future work will be organised in order to address these two limitations. The first set of participants was reduced so that the methodology could be validated before extending the study to a larger group. As demonstrated in this work, the methodology has been validated. Therefore, a simulation campaign has already been carried out that involves a larger number of participants. Work is currently in progress to review videos of the simulations and to determine the taskload profiles of what happened in the simulations according to the methodology described in this paper.
In this first stage of the process, ATCO students have been selected as participants with the aim of investing as much time as possible in the simulator. Through these tests with students, the idea was to obtain a methodology and relationships between ATC events and neurophysiological variables, as well as to be able to carry out a multitude of tests with the data obtained. Based on all the experience accumulated with the ATCO students’ simulations, the data collection and analysis process will already be optimised. Once the results obtained are sufficiently robust, the next step is to replicate the experiment with ATCOs in service or participants with operational experience. This phase of the study will be developed in close collaboration with CRIDA.

Author Contributions

Conceptualization, M.Z.S. and R.M.A.V.; methodology, M.Z.S. and V.F.G.C.; software, M.Z.S., F.P.M. and R.D.-A.J.; validation, R.M.A.V., F.P.M., P.M.L.d.F. and V.F.G.C.; data curation, M.Z.S. and P.M.L.d.F.; writing—original draft preparation, M.Z.S.; writing—review and editing, R.M.A.V., P.M.L.d.F. and V.F.G.C.; project administration, R.M.A.V. and P.M.L.d.F.; funding acquisition, P.M.L.d.F. All authors have read and agreed to the published version of the manuscript.

Funding

This research received no external funding.

Institutional Review Board Statement

Not applicable.

Informed Consent Statement

Informed consent was obtained from all subjects involved in the study.

Data Availability Statement

Data available on request.

Acknowledgments

The development of this paper is framed within the CRITERIA project (atC event-dRiven capacITy modEls foR aIr nAvigation). This project is framed within a research, development (R&D), and innovation partnership between CRIDA and Universidad Politécnica de Madrid. The authors would like to thank CRIDA for their support in the development of this research line.

Conflicts of Interest

The authors declare no conflict of interest.

References

  1. Yazgan, E.; Sert, E.; Şimşek, D. Overview of Studies on the Cognitive Workload of the Air Traffic Controller. Int. J. Aviat. Sci. Technol. 2021, 2, 28–36. [Google Scholar] [CrossRef]
  2. Isufaj, R.; Koca, T.; Piera, M. Spatiotemporal Graph Indicators for Air Traffic Complexity Analysis. Aerospace 2021, 8, 364. [Google Scholar] [CrossRef]
  3. Juričić, B.; Antulov-Fantulin, B.; Rogošić, T. Project ATCOSIMA—Air Traffic Control Simulations at the Faculty of Transport and Traffic Sciences. Eng. Power Bull. Croat. Acad. Eng. 2020, 15, 2–9. [Google Scholar]
  4. De Rooji, G.; Borst, C.; van Paassen, M.M.; Mulder, M. Flight Allocation in Shared Human Automation En-Route Air Traffic Control. In Proceedings of the 21st International Symposium on Aviation Psychology, Corvallis, OR, USA, 1 May 2021; pp. 172–177. [Google Scholar]
  5. Bastas, A.; Vouros, G. Data-Driven Prediction of Air Traffic Controllers Reactions to Resolving Conflicts. Inf. Sci. 2022, 613, 763–785. [Google Scholar] [CrossRef]
  6. Çetek, C.; Aybek, F.; Çinar, E.; Cavcar, A. New Directions for Air Traffic Control Simulators: A Discussion to Guide the Selection and Renovation of Simulators. Aeronaut. J. 2013, 117, 415–426. [Google Scholar] [CrossRef]
  7. Simulation. SkySim|Skysoft ATM Solutions. Available online: https://www.skysoft-atm.com/air-traffic-management/simulation/ (accessed on 22 December 2022).
  8. SkySim Datasheet. Available online: http://783910.web05.swisscenter.com/wp-content/uploads/datasheet_skysim.pdf| (accessed on 22 December 2022).
  9. Zamarreño Suárez, M.; Arnaldo Valdés, R.M.; Pérez Moreno, F.; Delgado-Aguilera Jurado, R.; López de Frutos, P.M.; Gómez Comendador, V.F. How Much Workload Is Workload? A Human Neurophysiological and Affective Cognitive Performance Measurement Methodology for ATCOs. Aircr. Eng. Aerosp. Technol. 2022, 94, 1525–1536. [Google Scholar] [CrossRef]
  10. Jazzar, A.; Alharasees, O.; Kale, U. Assessment of Aviation Operators’ Efficacy in Highly Automated Systems. Aircr. Eng. Aerosp. Technol ahead-of-print. 2022, 95, 302–311. [Google Scholar] [CrossRef]
  11. Abdul, S.M.B.; Borst, C.; Mulder, M.; van Paassen, M.M. Measuring Sector Complexity: Solution Space-Based Method. In Advances in Air Navigation Services; Magister, T., Ed.; InTech: London, UK, 2012; ISBN 978-953-51-0686-9. [Google Scholar]
  12. Tao, D.; Tan, H.; Wang, H.; Zhang, X.; Qu, X.; Zhang, T. A Systematic Review of Physiological Measures of Mental Workload. Int. J. Environ. Res. Public. Health 2019, 16, 2716. [Google Scholar] [CrossRef] [Green Version]
  13. Lean, Y.; Shan, F. Brief Review on Physiological and Biochemical Evaluations of Human Mental Workload. Hum. Factors Ergon. Manuf. Serv. Ind. 2012, 22, 177–187. [Google Scholar] [CrossRef]
  14. Hancock, P.A.; Desmond, P.A. (Eds.) Stress, Workload, and Fatigue, 1st ed.; CRC Press: Boca Raton, FL, USA, 2000; ISBN 978-1-4106-0044-8. [Google Scholar]
  15. Manning, C.A.; Mills, S.H.; Fox, C.M.; Pfleiderer, E.M.; Mogilka, H.J. Using Air Traffic Control Taskload Measures and Communication Events to Predict Subjective Workload; Office of Aerospace Medicine: Washington, DC, USA, 2002. [Google Scholar]
  16. Rahman, S.M.B.A.; Borst, C.; van Paassen, M.M.; Mulder, M. Cross-Sector Transferability of Metrics for Air Traffic Controller Workload. IFAC-Pap. 2016, 49, 313–318. [Google Scholar] [CrossRef]
  17. Somers, V.L.J.; Borst, C.; Mulder, M.; van Paassen, M.M. Evaluation of a 3D Solution Space-Based ATC Workload Metric. IFAC-Pap. 2019, 52, 151–156. [Google Scholar] [CrossRef]
  18. Instantaneous Self Assessment of Workload (ISA)|HP Repository. Available online: https://ext.eurocontrol.int/ehp/?q=node/1585 (accessed on 22 December 2022).
  19. Marinescu, A.; Sharples, S.; Ritchie, A.; Lopez, T.; McDowell, M.; Morvan, H. Physiological Parameter Response to Variation of Mental Workload. Hum. Factors 2018, 60, 31–56. [Google Scholar] [CrossRef] [Green Version]
  20. SESAR JU 2017. “D3.2 competence and training requirements”. In AUTOPACE Project. H2020-SESAR2015-1.
  21. De Frutos, P.L.; Parla, E.P.; Ballestín, L.; Cañas, J.J.; Ferreira, P.; Comendador, F.G.; Lucchi, F. Quantitative Prediction of Automation Effects on ATCo Human Performance. In Proceedings of the 8th International Conference on Research in Air Transportation, Castelldefels, Spain, 25–29 June 2018. [Google Scholar]
  22. Djokic, J.; Lorenz, B.; Fricke, H. Air Traffic Control Complexity as Workload Driver. Transp. Res. Part C Emerg. Technol. 2010, 18, 930–936. [Google Scholar] [CrossRef]
  23. Triyanti, V.; Azis, H.A.; Iridiastadi, H. Yassierli Workload and Fatigue Assessment on Air Traffic Controller. IOP Conf. Ser. Mater. Sci. Eng. 2020, 847, 012087. [Google Scholar] [CrossRef]
  24. De Reuck, S.; Donald, F.; Siemers, I. Factors Associated with Safety Events in Air Traffic Control. Ergon. SA 2014, 26, 18. [Google Scholar]
  25. Wang, Y.; Hu, R.; Lin, S.; Schultz, M.; Delahaye, D. The Impact of Automation on Air Traffic Controller’s Behaviors. Aerospace 2021, 8, 260. [Google Scholar] [CrossRef]
  26. Edwards, T.; Martin, L.; Bienert, N.; Mercer, J. The Relationship Between Workload and Performance in Air Traffic Control: Exploring the Influence of Levels of Automation and Variation in Task Demand. In Proceedings of the Human Mental Workload: Models and Applications; Longo, L., Leva, M.C., Eds.; Springer International Publishing: Cham, Switzerland, 2017; pp. 120–139. [Google Scholar] [CrossRef]
  27. Vallesi, A. The Case of Air Traffic Control. In Theory-Driven Approaches to Cognitive Enhancement; Colzato, L.S., Ed.; Springer International Publishing: Cham, Switzerland, 2017; pp. 293–303. ISBN 978-3-319-57505-6. [Google Scholar]
  28. Jakšić, Z.; Janić, M. Modeling Resilience of the ATC (Air Traffic Control) Sectors. J. Air Transp. Manag. 2020, 89, 101891. [Google Scholar] [CrossRef]
  29. Fürstenau, N.; Radüntz, T. Power Law Model for Subjective Mental Workload and Validation through Air Traffic Control Human-in-the-Loop Simulation. Cogn. Technol. Work. 2022, 24, 291–315. [Google Scholar] [CrossRef]
  30. Nixon, J.; Charles, R. Understanding the Human Performance Envelope Using Electrophysiological Measures from Wearable Technology. Cogn. Technol. Work 2017, 19, 655–666. [Google Scholar] [CrossRef] [Green Version]
  31. Pham, D.-T.; Alam, S.; Duong, V. An Air Traffic Controller Action Extraction-Prediction Model Using Machine Learning Approach. Complexity 2020, 2020, 1659103. [Google Scholar] [CrossRef]
  32. Trapsilawati, F.; Liu, Y.; Wee, H.J.; Subramaniam, H.; Sourina, O.; Pushparaj, K.; Sembian, S.; Chun, P.; Lu, Q.; Chen, C.-H.; et al. Perceived and Physiological Mental Workload and Emotion Assessments in En-Route ATC Environment: A Case Study. Transdiscipl. Eng. A Paradig. Shift 2017, 5, 420–427. [Google Scholar] [CrossRef]
  33. Socha, V.; Hanáková, L.; Valenta, V.; Socha, L.; Ábela, R.; Kušmírek, S.; Pilmannová, T.; Tecl, J. Workload Assessment of Air Traffic Controllers. Transp. Res. Procedia 2020, 51, 243–251. [Google Scholar] [CrossRef]
  34. Rahman, S.; Sidik, M.; Shukri, M.; Nazarudin, M. IOP Controller Response Behaviour during Procedural Control with Surveillance Information. IOP Conf. Ser. Mater. Sci. Eng. 2018, 405, 012004. [Google Scholar] [CrossRef]
Figure 1. Methodology to follow to obtain an event-based taskload profile of reference and to study ATC events and their combinations.
Aerospace 10 00097 g001
Figure 2. Identification of the key activities carried out by ATCOs (blue rectangles) and the ATC events associated with them (green rectangles). In total, twelve ATC events form the basis of the simulations in the experiment conducted.
Aerospace 10 00097 g002
Figure 3. Combined representation of the designed taskload profile of the different exercises together with the reaction time values for the six participants. The first row of graphs presents the two simplest exercises, with Exercise 1 on the left and Exercise 2 on the right. The second row presents the data from Exercise 3 on the left and Exercise 4 on the right.
Aerospace 10 00097 g003
Figure 4. Combined representation of the designed taskload profile of the exercises together with subjective workload assessments for the six participants. The first row of graphs presents Exercise 1 on the left and Exercise 2 on the right. The second row presents the data from Exercise 3 on the left and Exercise 4 on the right.
Aerospace 10 00097 g004
Figure 5. Combined representation of the designed taskload profile (green bars) and the actual taskload profile (blue bars) for Exercise 1 of Participant 5.
Aerospace 10 00097 g005
Figure 6. Comparison between the actual taskload profile obtained for Exercise 1 of Participant 5 and the workload values assessed by the participant during the simulation.
Aerospace 10 00097 g006
Table 1. Comparison of the designed values of the four exercises in the simulation program.
ExerciseTotal Designed TaskloadMaximum TaskloadMinute Maximum Taskload
1141.407.4250:11:00
2165.2010.4000:29:00
3193.2510.8750:30:00
4228.5511.4000:31:00
Table 2. Comparison of the most relevant data that characterise the designed and actual taskload profiles.
DesignedActual
Total taskload141.400146.800
Event taskload without monitoring118.000124.600
Monitoring taskload23.40022.200
Maximum taskload7.42511.600
Minute of maximum taskload00:11:0000:35:00
Number of absolute events4447
Disclaimer/Publisher’s Note: The statements, opinions and data contained in all publications are solely those of the individual author(s) and contributor(s) and not of MDPI and/or the editor(s). MDPI and/or the editor(s) disclaim responsibility for any injury to people or property resulting from any ideas, methods, instructions or products referred to in the content.

