Article

Wrinkle Detection in Carbon Fiber-Reinforced Polymers Using Linear Phase FIR-Filtered Ultrasonic Array Data

1
School of Energy and Power Engineering, Beihang University, Beijing 100191, China
2
Ningbo Institute of Technology, Beihang University, Ningbo 315800, China
3
School of Mechanical Engineering and Automation, Beihang University, Beijing 100191, China
4
COMAC Shanghai Aircraft Manufacturing Co., Ltd., Shanghai 201324, China
*
Author to whom correspondence should be addressed.
Aerospace 2023, 10(2), 181; https://doi.org/10.3390/aerospace10020181
Submission received: 2 December 2022 / Revised: 4 February 2023 / Accepted: 11 February 2023 / Published: 15 February 2023

Abstract

:
Carbon fiber-reinforced polymers (CFRP) are extensively used in aerospace applications. Out-of-plane wrinkles frequently occur in aerospace CFRP parts that are commonly large and complex. Wrinkles acting as failure initiators severely damage the mechanical performance of CFRP parts. Wrinkles have no significant acoustic impedance mismatch, reflecting weak echoes. The total focusing method (TFM) using weak reflection signals is vulnerable to noise, so our primary work is to design discrete-time filters to relieve the noise interference. Wrinkles in CFRP composites are geometric defects, and their direct detection requires high spatial precision. The TFM method is a time-domain delay-and-sum algorithm, and it requires that the time information of filtered signals has no change or can be corrected. A linear phase filter can avoid phase distortion, and its filtered signal can be corrected by shifting a constant time. We first propose a wrinkle detection method using linear phase FIR-filtered ultrasonic array data. Linear phase filters almost do not affect the wrinkle geometry of detection results and can relieve noise-induced dislocation. Four filters with different bandwidths have been designed and applied for wrinkle detection. The 2 MHz bandwidth filter is recommended as an optimum choice.

1. Introduction

Carbon fiber-reinforced polymers (CFRP) are extensively used lightweight materials in aerospace applications as they exhibit rather high specific strength and good corrosion resistance [1]. CFRP parts used in the aerospace field are always complex curved surface products, such as aircraft engine fan blades, aircraft wings, and satellites’ motor cases [2]. Out-of-plane wrinkles are common defects in these complex parts, with the carbon fiber plies deviating from the anticipated direction. Wrinkles act as failure initiators in CFRP parts, severely damaging the mechanical performance (like tensile [3], compressive [4], flexural, and fatigue strength [5]). Wrinkles frequently occur inside the CFRP laminated parts, almost impossibly inspected from the surface. A wide variety of non-destructive testing (NDT) methods is established for detecting and evaluating out-of-plane wrinkles. These methods include visual inspection [6], eddy current method [7], infrared thermography [8], X-ray micro-computed tomography [9], and ultrasonic testing (UT) [10,11]. Visual inspection can only examine the surface or cross-section wrinkles by optical microscopy or the naked eye. The eddy current method is mainly limited by its detection depth, and only near-surface waviness can be detected [12]. Infrared thermography detects out-of-plane wrinkles by stress analysis with cyclic loading. This method is cumbersome to evaluate large complex parts, and its result is non-intuitive and susceptible to other stress concentration points [8]. X-ray micro-computed tomography can provide an accurate 3D geometrical image of a detected part. However, the low X-ray absorption contrast between the carbon fibers and epoxy polymers limits the sample size. X-ray micro-computed tomography is unsuitable for aerospace CFRP parts which are large complex parts. The ultrasonic technique is the most powerful method to detect wrinkles for aerospace CFRP parts.
The ultrasonic technique is already used in the aerospace industry to detect delamination [13], barely visible impact damage (BVID) [14,15], and debonding [16]. Lamb waves are commonly used for the structural health monitoring (SHM) [17,18] of large structures because they can propagate long distances along the component curvature to achieve a quick inspection. However, the signal of lamb waves is complicated to analyze and interpret, and the result is non-intuitive for geometrical defects, namely wrinkles. Bulk waves, especially longitudinal waves, are usually used to detect and size flaws in CFRP parts. Our work only considers using longitudinal waves to detect out-of-plane wrinkles in this paper.
Unlike delamination and transverse cracks, wrinkles do not break material continuity, so they do not generate significant acoustic impedance mismatch. It is challenging to detect wrinkles because there is no strong reflection response when the ultrasound wave encounters wrinkles [19]. Researchers have tried to exploit the slight impedance mismatch between the carbon fiber plies and resin-rich interplies. The slight impedance mismatch generates weak reflection echoes that contain faint spatial information of resin-rich interplies. The most classical method is the instantaneous phase method using pulse-echo ultrasonic inspection, extracting the phase information from the multi-layered structure echoes [20,21]. The pulse-echo ultrasonic inspection has a convenient, inexpensive advantage, and its signals are easy to analyze and interpret. However, this pulse-echo method utilizes only one-dimensional information, namely the normal incidence reflection response of the CFRP parts. Other pulse-echo methods, such as the instantaneous amplitude method with low-pass (LP) filtering and the Wiener deconvolution method with spectral extrapolation [22], require a higher center frequency. High-frequency ultrasounds suffer severe attenuation in CFRP materials limiting the detection depth. Theoretically, the normal interplies can be correctly located by these one-dimensional ultrasonic signals, but the inter-ply incline caused by wrinkles induces estimation error or even failure. The lateral resolution of a spherically focused immersion transducer is limited by the ultrasonic beam width. The ultrasonic beam width cannot be fully optimal throughout a thick CFRP part.
Linear array probes with multiple elements at distinct positions in the space can provide multi-dimensional and multi-angle signals that can theoretically correctly estimate the inclined interplies’ location. Phase array technology with the ultrasonic beam electronically steering at different angles is employed to detect and characterize wrinkles [23]. One steered angle can only inspect one side of wrinkles. A thorough wrinkle inspection using phase array technology requires repeat scans at different angles, which is time-consuming. The analysis and interpretation of scan data acquired by phased array technology with different inspection angles are also cumbersome for wrinkle characterization. The scattering matrix contains all the far-field scattered amplitudes of discontinuity defects from the given combination of incident and scattered direction. It is considered to carry information about the shape, orientation, and size of discontinuity defects (such as cracks or voids). The scattering matrix has been extracted to detect and characterize wrinkles [24], but this is an indirect detection method that allows statistically distinguishing wrinkles with different severity. A convolutional neural network (CNN) is the most common image recognition and analysis tool. It can achieve accurate classification without feature analysis and extraction manually. A CNN model with a short-time Fourier transform has been applied to analyzing ultrasonic data acquired by a linear array probe under full matrix capture (FMC) mode, and it achieves superior accuracy for wrinkle detection [19]. However, the CNN method is also indirect, and its results are statistical indicators without clear physical meaning. The scattering matrix and CNN methods cannot directly measure the maximum wrinkle angle. The maximum wrinkle angle is the crucial indicator of mechanical performance damage and the primary parameter to be estimated necessarily [25]. The total focusing method (TFM) is a post-processing imaging algorithm using data acquired by linear array probes under FMC mode [26]. The TFM method can achieve optimal focusing and provide a high lateral resolution. The instantaneous phase method can eliminate the amplitude information, highlighting the phase information related to the spatial information of the resin-rich interplies. Therefore, researchers [27] have proposed a TFM instantaneous phase method which is a direct method for wrinkle detection. A Fourier domain approach, the wavenumber algorithm, is also used to detect wrinkles [28]. Its primary advantage is superior computational performance. However, the advantage of the TFM method is its flexibility and versatility for arbitrary imaging geometries [29]. The TFM method is more suitable for complex geometrical parts in the aerospace industry. This study adopts the TFM instantaneous phase method to detect wrinkles in CFRP composites.
The wrinkle detection using weak reflection echoes is vulnerable to noise. However, the signals acquired by the ultrasonic phased array system on CFRP composites are contaminated by various noises, for example, electrical noise from the ultrasonic inspection system and structural noise from the heterogeneity in CFRP composites (such as voids, the fiber–matrix heterogeneity). In this study, discrete-time filters are designed to relieve noise interference. These designed filters filter the noise in the A-scan data acquired under FMC mode. The wrinkle detection using the TFM instantaneous phase method requires high spatial accuracy, so the filters must preserve the phase information of the A-scan data. The TFM method is a time-domain delay-and-sum algorithm, and its result highly depends on the time information of A-scan signals. A finite impulse response (FIR) filter can easily be designed as a linear phase filter that can avoid phase distortion [30]. The phase component of the frequency response is linear to frequency for a linear phase filter, and all frequency components of the filtered signal are shifted for a constant time. The linear phase filter can preserve the phase information, and the time information change in filtered signals can also be corrected by shifting a constant time. Bandpass filters are designed to allow through frequency components in a specified band, and their parameters are determined by the time-frequency analysis of the A-scans in FMC datasets. We first apply linear phase FIR filters to the TFM instantaneous phase method for wrinkle detection in this paper.

2. Testing Sample and Experimental Setup

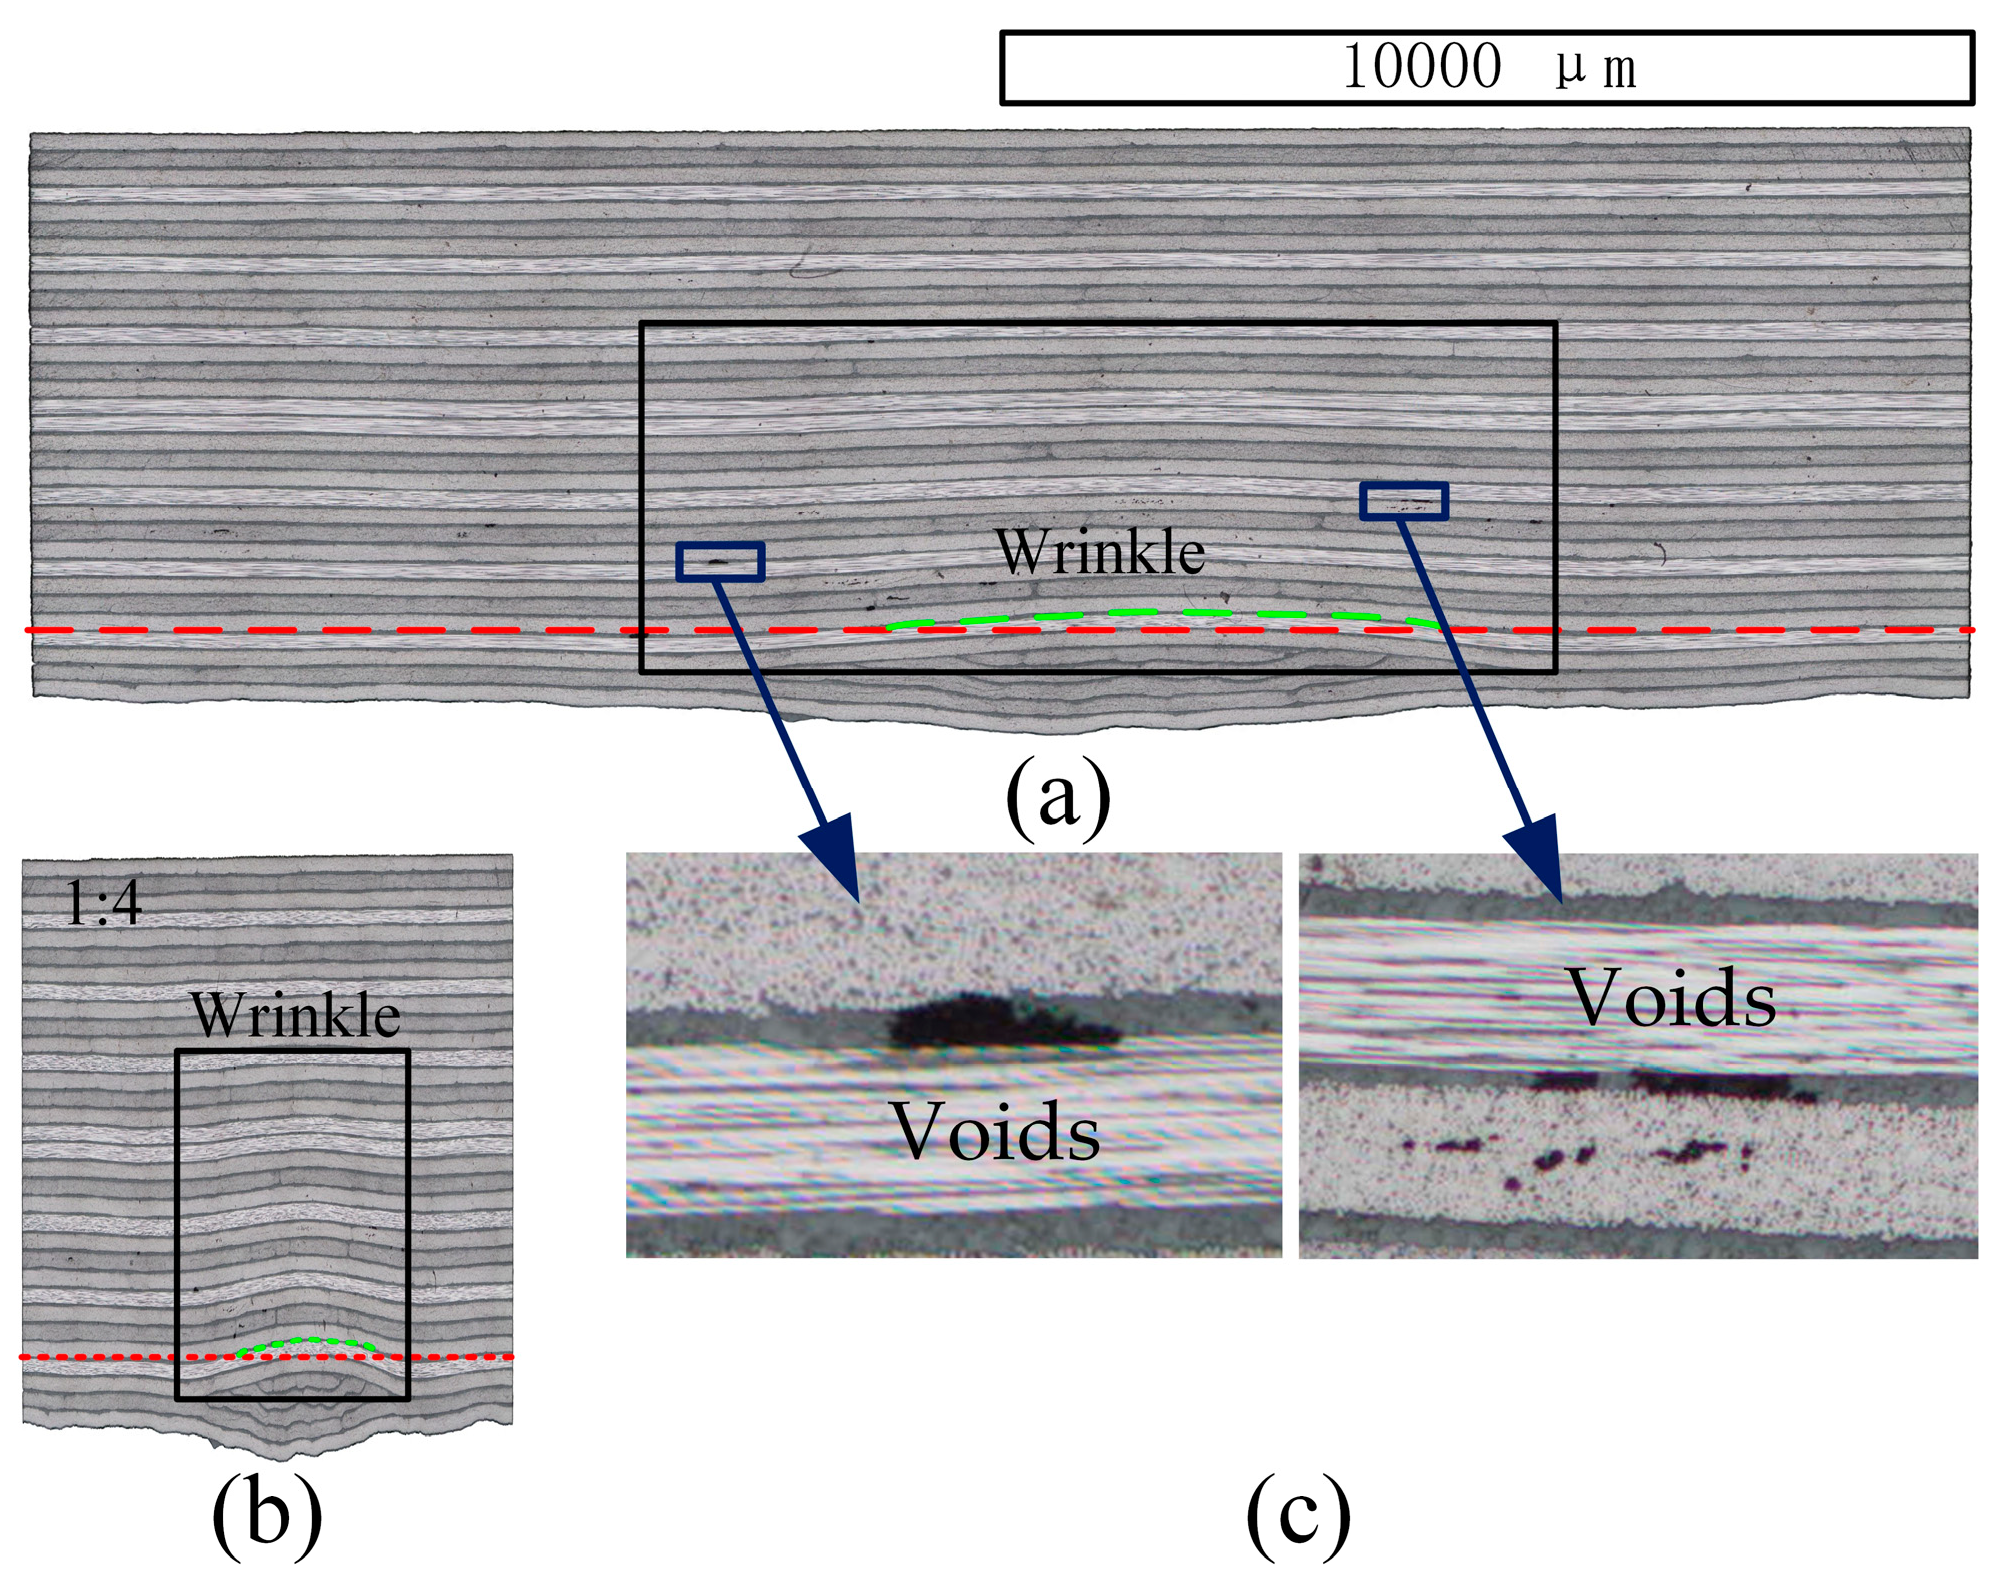
2.1. Testing Samples

A CFRP sample with an induced wrinkle is prepared. Its size is 195 mm × 100 mm × 5.92 mm. This CFRP sample consists of 32 unidirectional plies in the non-wrinkle section. The average thickness of each ply is 0.165 mm. The fiber volume fraction (FVF) of this sample is approximatively estimated to be 60%. The longitudinal velocity is assumed to be 3000 m/s, so the resonant frequency of the ply is about 9 MHz. The stacking sequence is [0/45/90/−45]4s. The wrinkle defect is induced by inserting three additional narrow strips between the 30th and 31st ply. The narrow strips’ angle is 90 degrees. The cure condition is one hour at 130 °C. The cross-section micrograph of the wrinkle and partially enlarged images of voids are shown in Figure 1. Many voids are randomly distributed in the resin-rich interplies, and a few are in the carbon fiber plies. The voids in the interplies seem a little larger than those in the carbon fiber plies. These voids induce material heterogeneity in CFRP composites, causing predominant structural noise.

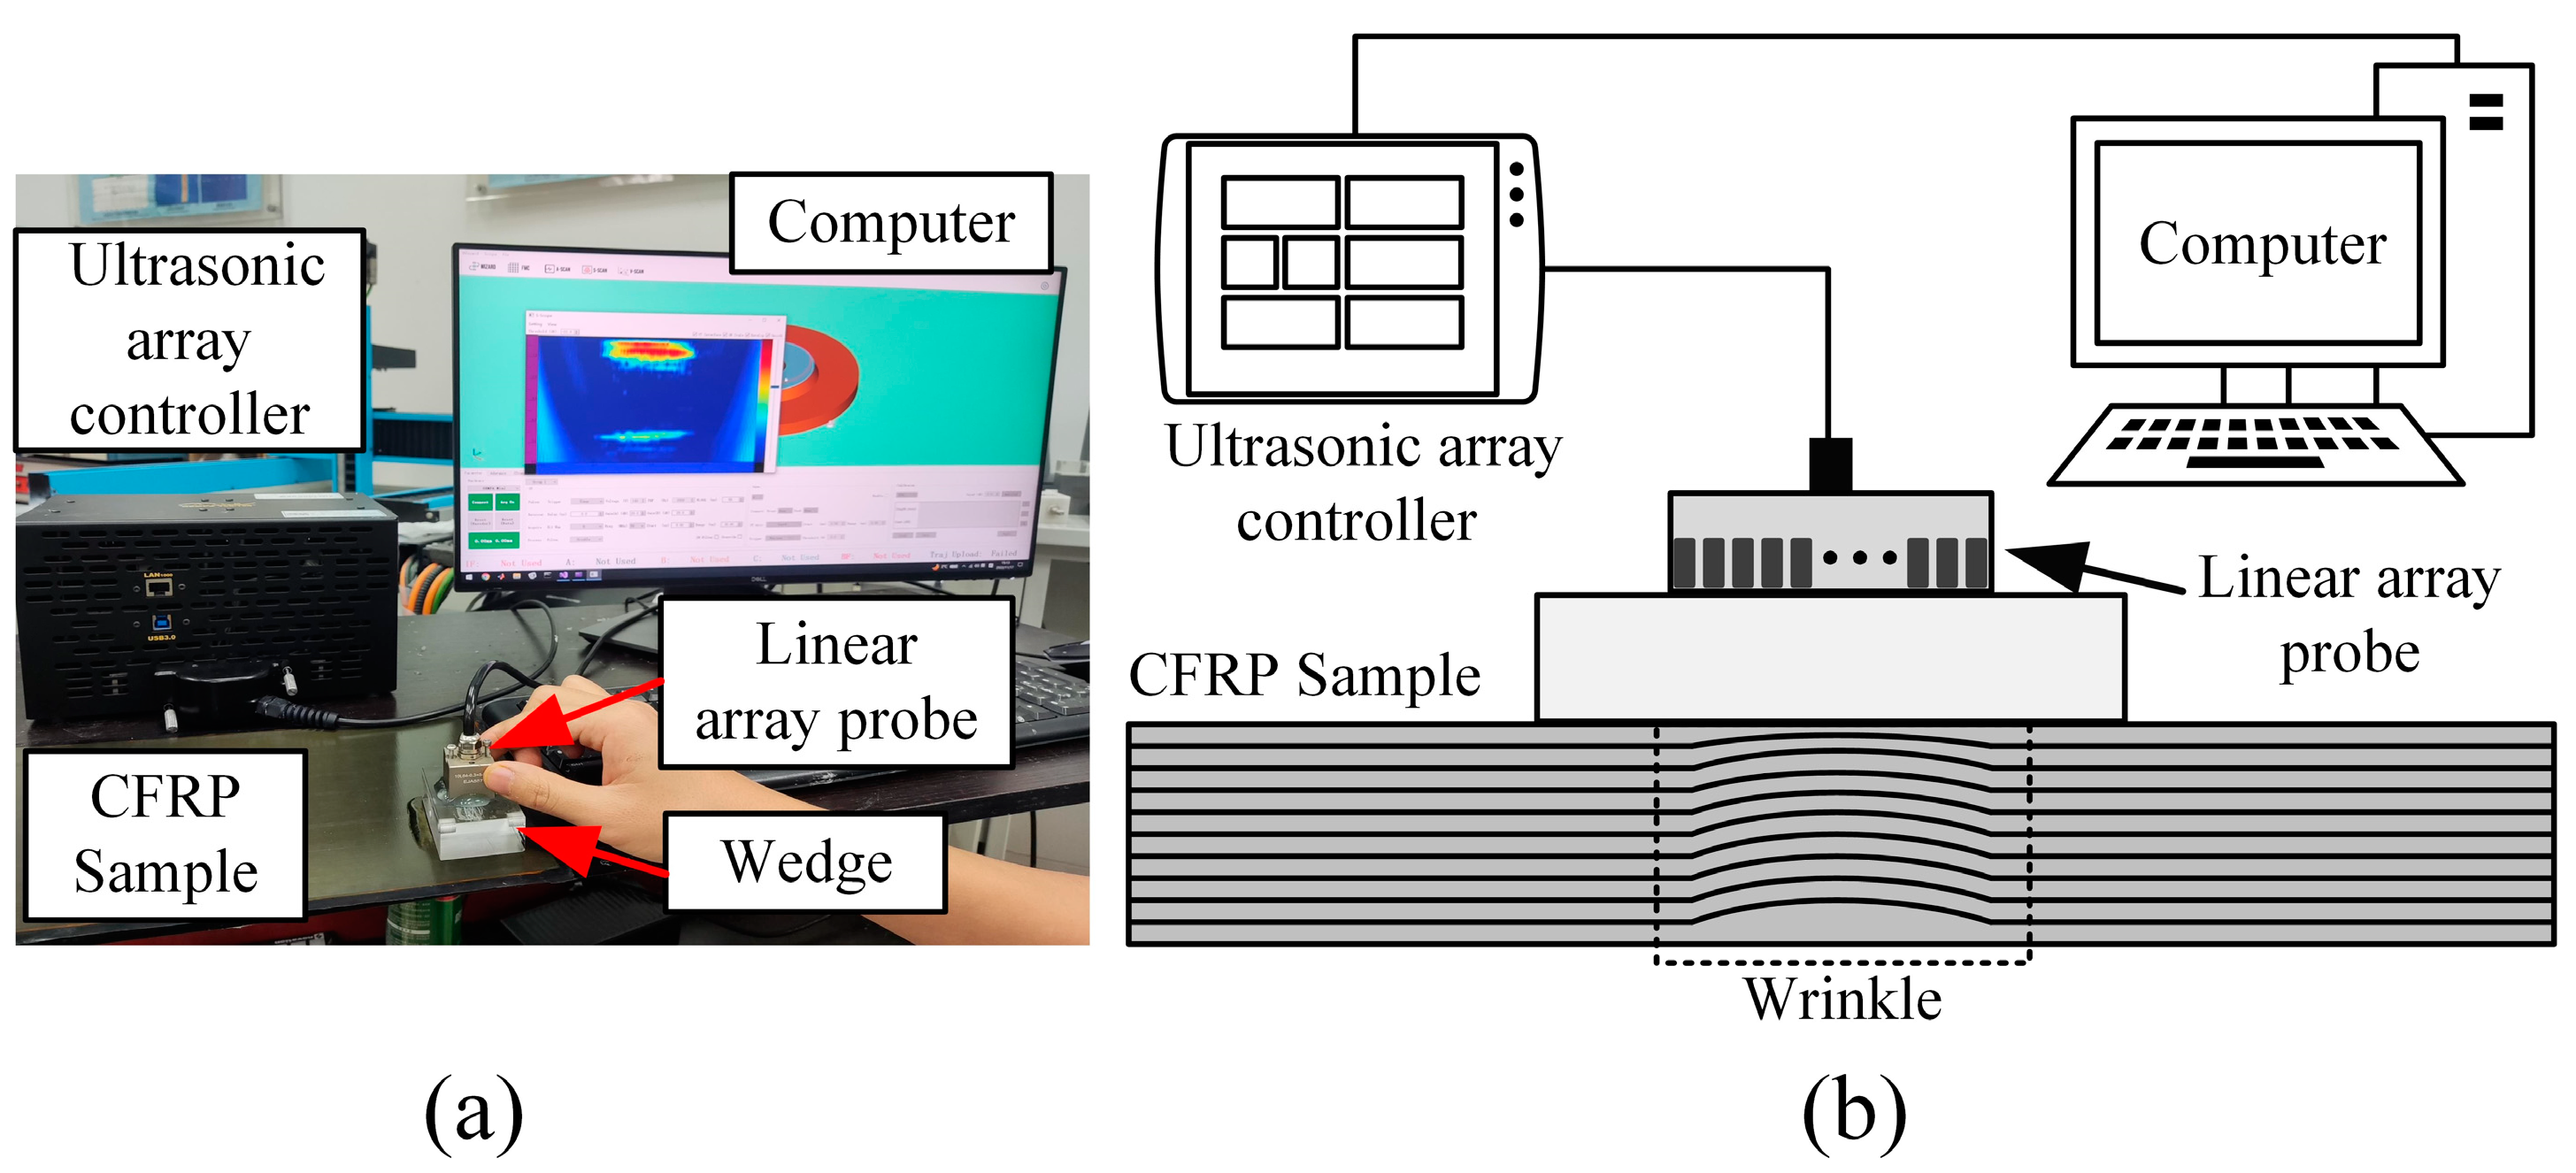
2.2. Experimental Setup

The experimental system (Figure 2a) consists of a computer workstation, an ultrasonic array controller (AOS OEM-PA 128/128), a 10 MHz linear array probe (Doppler 10L64-0.3×5-D77 EJA557), and a flat wedge. The main features of the flat wedge are listed in Table 1. The flat wedge is used to avoid the near-surface dead zones of the probes. The 10 MHz linear array probe is chosen because its center frequency, close to the resonant frequency (9 MHz), can enhance the inter-ply reflection [19]. The whole 64 elements of the linear array probe are used to acquire FMC datasets with the same sampling rate of 100 MS/s. The pulser pulse width values are set at 50 ns for the 10 MHz probe. The pulser pulse voltage is set at 100 V, and the A-scan resolution is chosen 8 bits during the FMC datasets acquirement. The dataset acquirement process is shown in Figure 2b.

3. Methods

The TFM instantaneous phase method using weak reflection signals is vulnerable to noise, especially structural noise from voids. The noise contaminates weak inter-ply reflection signals and induces dislocation in the TFM instantaneous phase results. Our primary work is to design bandpass filters to relieve the noise interference in this paper. The center of the passband frequencies is determined by the frequency components of the inter-ply echoes. The energy of the front-face and back-wall echoes dominates the acquired A-scan signals, so a time-frequency analysis is used to analyze the frequency components of the inter-ply echoes. The designed filters should have no influence on the TFM method and avoid inducing phase distortion, so linear phase filters are designed to filter A-scan signals in FMC datasets.

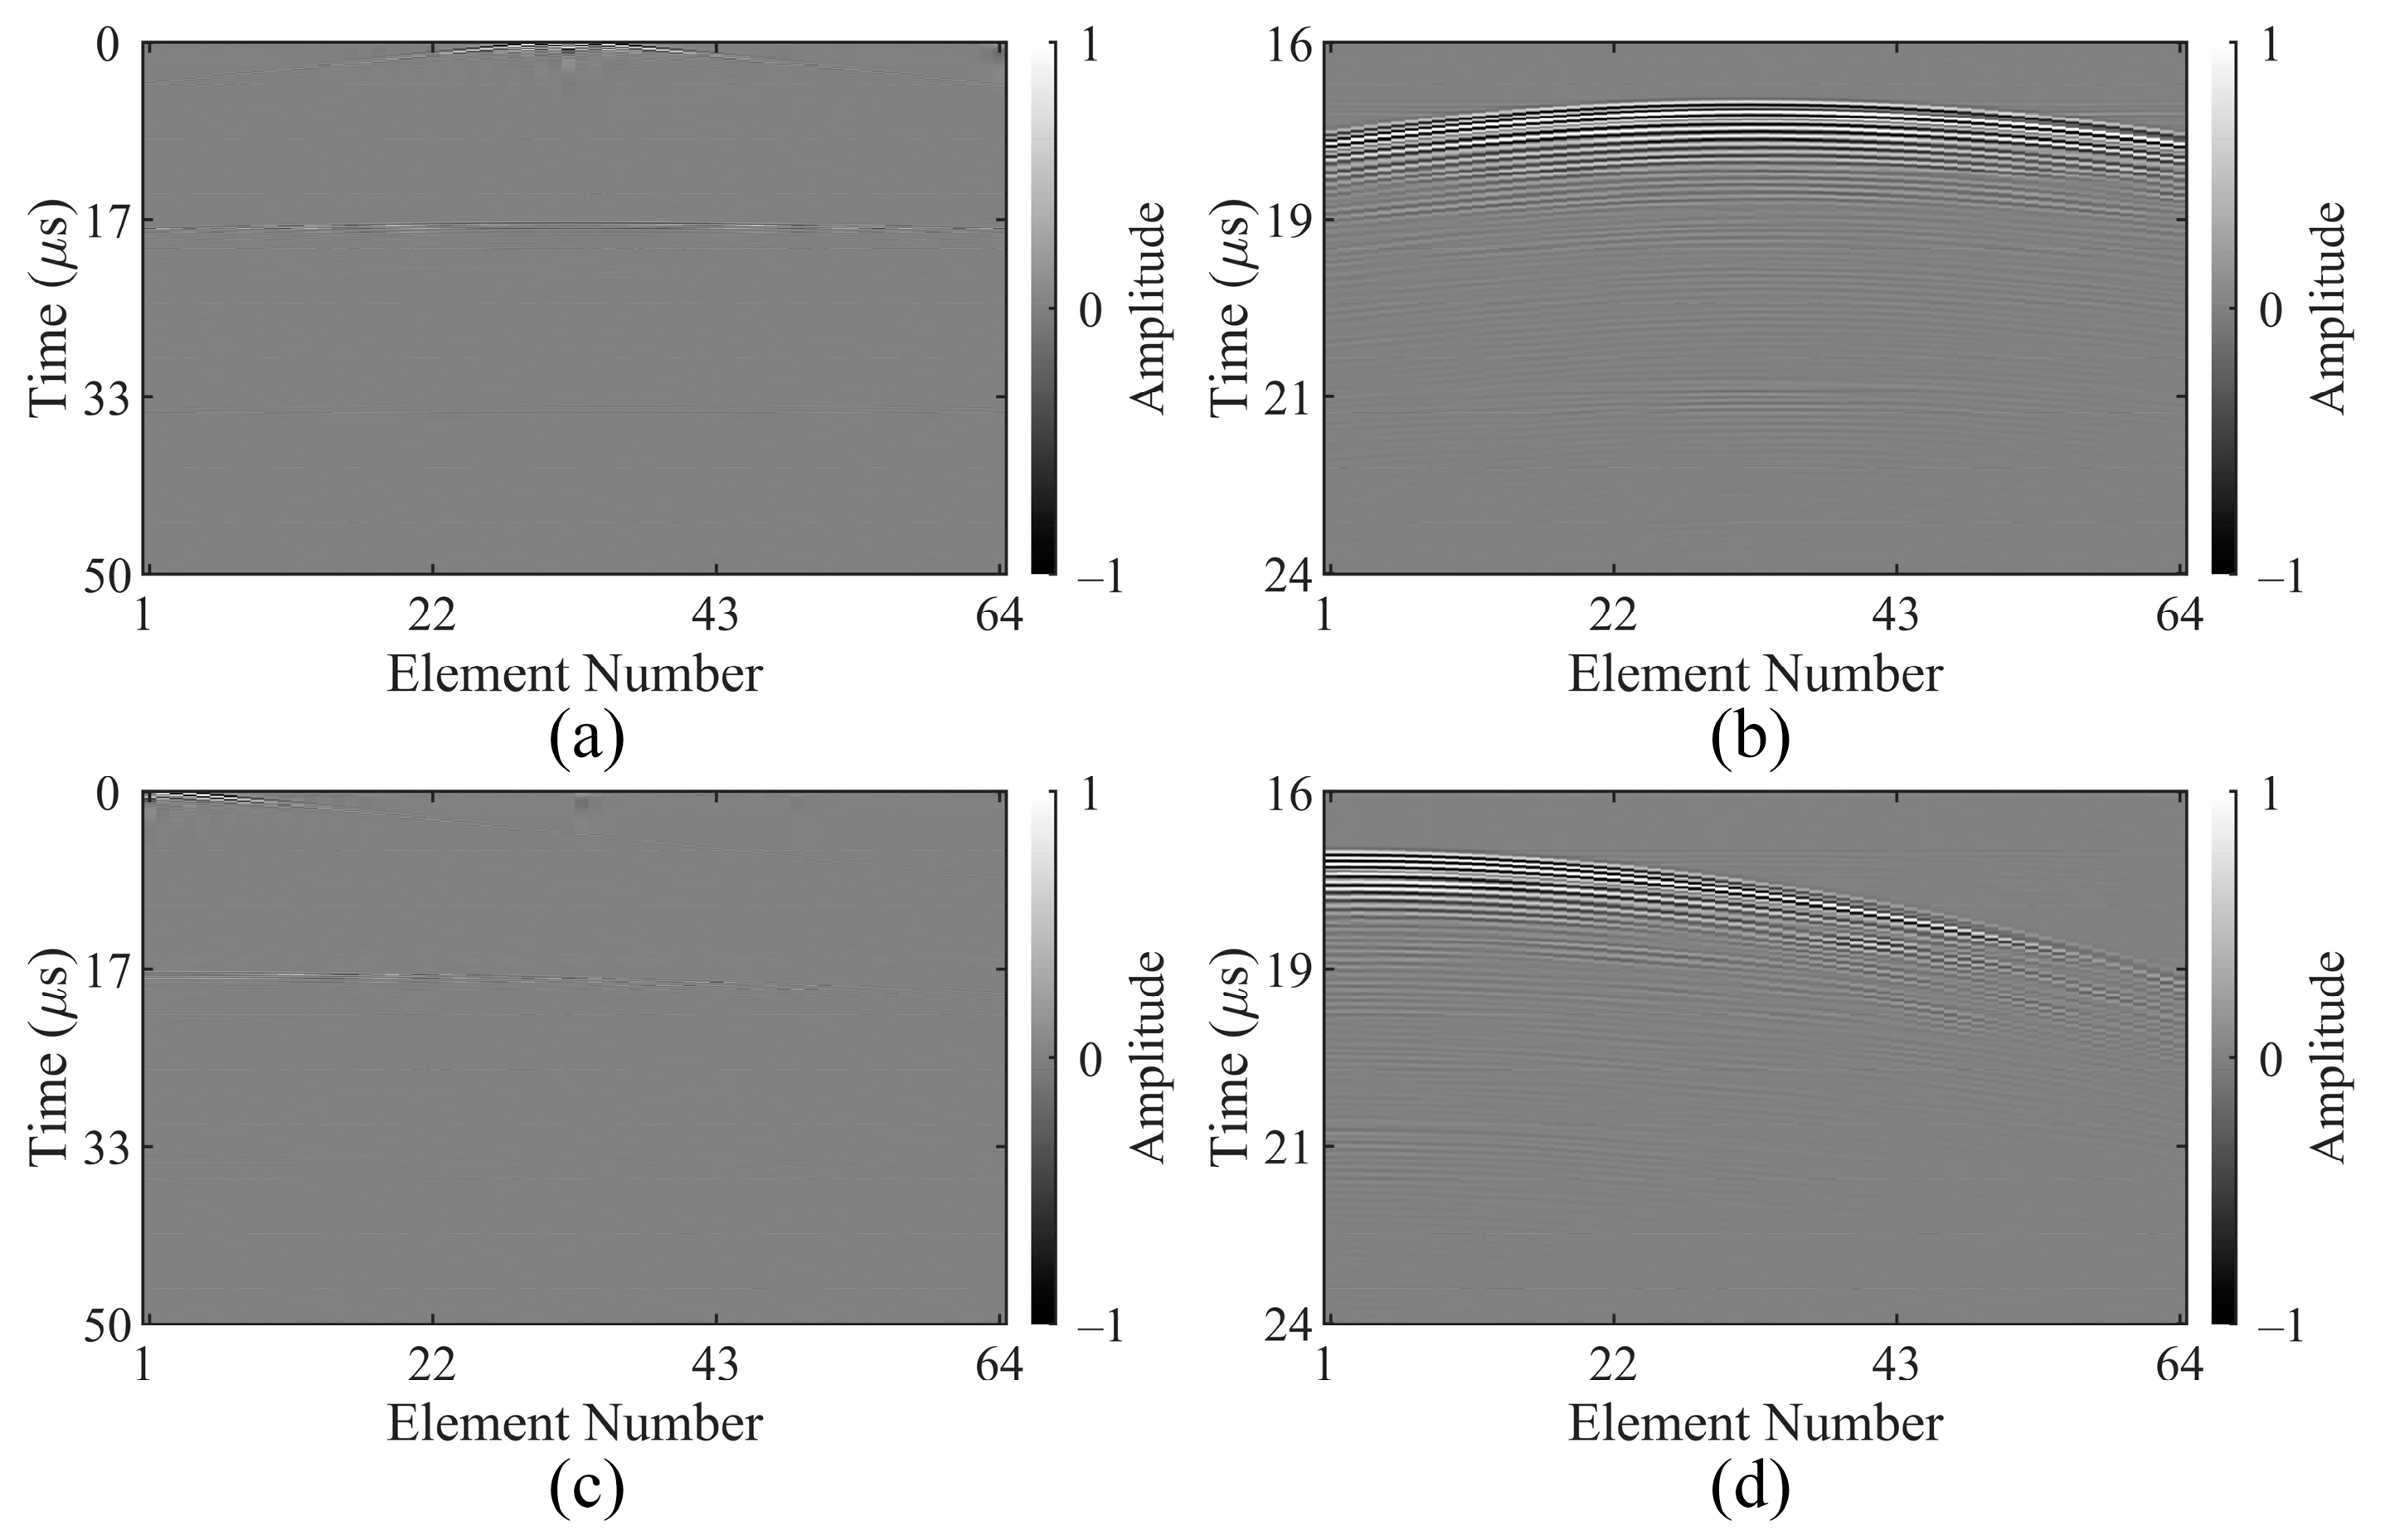
3.1. Total Focusing Method

The total focusing method applies heuristic delay-and-sum beamforming on the FMC dataset, achieving focus in the target region and generating a detection image. The intensity of the detection image I(x, z) at every point is calculated by [31]
I ( x , z ) = t = 1 N r = 1 N S t , r ( ( x t x ) 2 + z 2 + ( x r x ) 2 + z 2 c )
where t and r are the serial numbers of the transmission and reception element, respectively; N is the number of elements; c is the longitudinal velocity here; xt and xr are the positions of the transmission and reception elements, respectively; (x, z) is the position of every point in the target region; St,r is the A-scan signal in FMC datasets, received by element r (the transmission element t is firing). It should be noted that St,r is not the Hilbert transform, or instantaneous amplitude, of the A-scan signal in this paper. The phase information in A-scan signals is crucial for wrinkle detection.
The delay-and-sum beamforming is implemented in the time domain, permitting flexibility and versatility, which makes the TFM method suitable for aerospace CFRP parts with complex curved surfaces [32]. The TFM method can focus and steer the ultrasonic beam at every point in the target region, achieving a high imaging resolution, which is vital for the continuously varying geometric defects, namely wrinkles. The TFM method makes good use of the multi-dimensional and multi-angle information in FMC datasets, making it capable of handling the inclined interplies.

3.2. Phase Extraction

The TFM result using A-scan signals contains the intensity and spatial information. The wrinkle detection only needs spatial information to map the wrinkle geometry. The lateral spatial information along the upper surface of the sample does not require additional process, but in the depth direction, the intensity information should be removed. The intensity fluctuation in the depth direction can be treated as a modulated signal [20].
S depth ( t ) = a ( t ) cos ϕ ( t )
where the amplitude a(t) is mainly the intensity information related to the material attenuation and the reflection intensity; the phase ϕ(t) mainly contains the spatial information of the resin-rich interplies.
This section aims to extract the phase information from the intensity fluctuation in the depth direction. The Hilbert transform is a standard tool for extracting the phase information, but it requires that the amplitude a(t) variation is sufficiently slow to ensure spectral disjointness [33]. The reflection intensity of the interplies is similar everywhere in the sample. The intensity variation due to the material attenuation is smooth. As a result, the amplitude a(t) variation is mainly slow, except for the front-face and back-wall echoes. The Hilbert transform can be used as an effective tool to extract spatial information, just like the instantaneous phase method using pulse-echo ultrasonic inspection.
The real signal Sdepth(t) can be transformed into an analytic signal by
Z depth ( t ) = S depth ( t ) + i { S depth ( t ) }
where is the Hilbert transform [33],
{ S depth ( t ) } = 1 π p . v . { + S depth ( τ ) t τ d τ }
The analytic associate of the real signal Sdepth(t) can be represented as
Z depth ( t ) = a ( t ) e i ϕ ( t )
where ϕ(t) is also called as the instantaneous phase. The cosine of the instantaneous phase, like the wrapped phase, contains the main spatial information. The cosine of the instantaneous phase is used to map the wrinkle geometry in this paper, and the cosine results are still referred to as the instantaneous phase images.

3.3. Time-Frequency Analysis

The filter should be designed according to the frequency components of the inter-ply echoes. However, the front-face and back-wall echoes are the main energy components in the acquired A-scan signals. The Fourier transform is not suitable because its result is the frequency components of a full A-scan signal. The time-frequency analysis, analyzing a signal in both the time and frequency domains, is appropriate in this case.
The short-time Fourier transform (STFT) is a classical method for time-frequency signal analysis [34]. It can provide a proper resolution in the time or frequency domains depending on the parameter setting. The “Spectrogram” function in MATLAB R2021b is used to analyze A-scan signals.
The uncertainty principle, also called the Gabor limit, states that the time-frequency analysis of signals cannot achieve a high resolution in both the time and frequency domains. A too short time window (high time resolution) will lead to a poor frequency resolution, while a too long time window (poor time resolution) results in a good frequency resolution. The frequency components of the inter-ply echoes are concerned, so a relatively long window (ten times the duration corresponding to the center frequency) is chosen for the STFT.

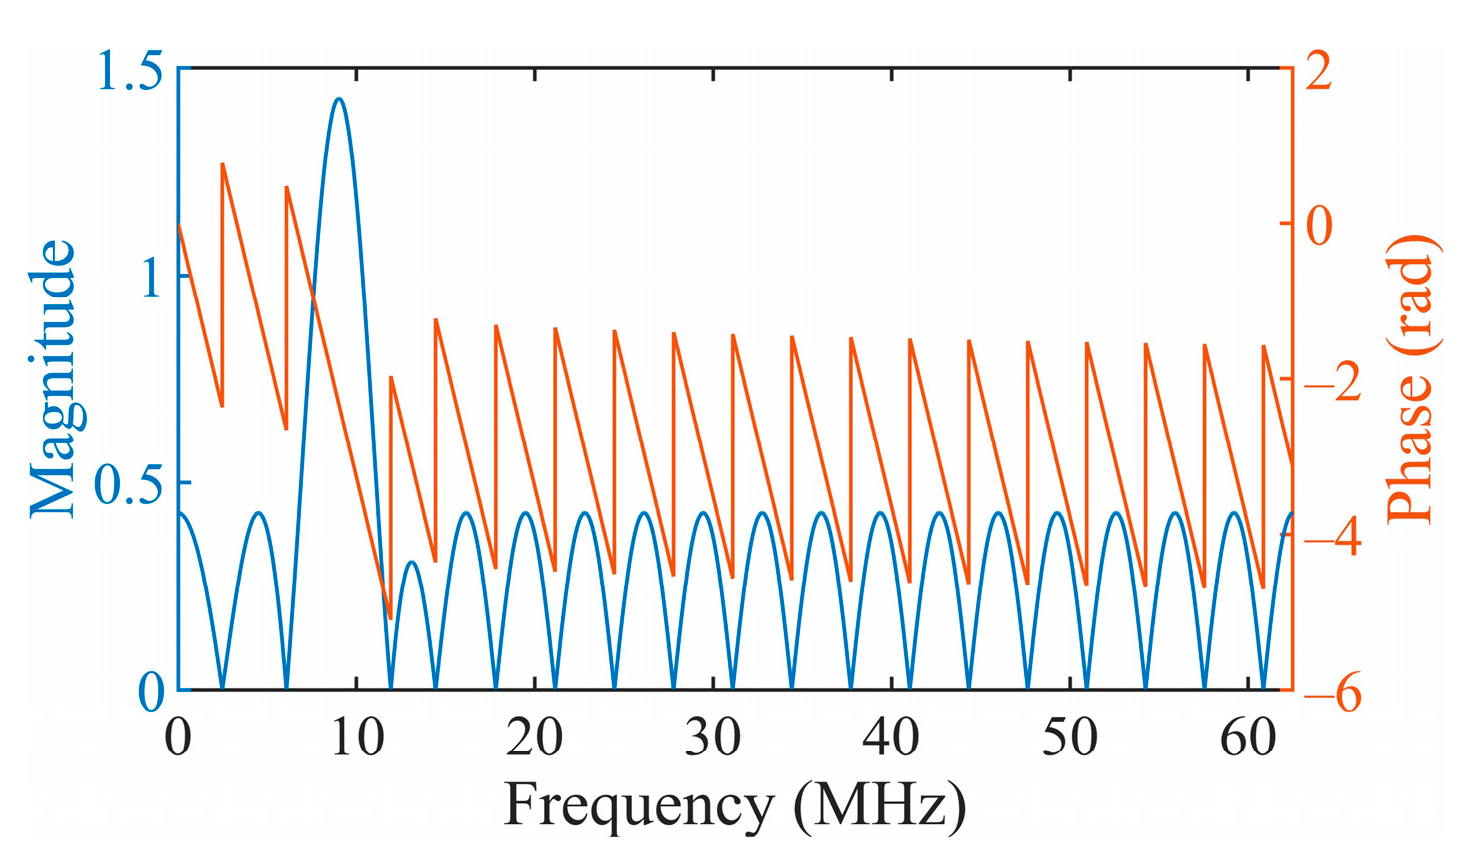
3.4. FIR Filter Design

The TFM method is a delay-and-sum algorithm in the time domain, and the time information of filtered signals should not change or can be corrected. Wrinkles in CFRP composites are geometric defects with the carbon fiber plies deviating from the anticipated direction. The deviating plies are continuously and gradually changed. The essence of direct wrinkle detection is locating carbon fiber plies and disclosing the deviating plies. Direct detection requires high spatial precision. The phase information is related to spatial information, so filters must avoid phase distortion. A linear phase filter can avoid phase distortion, and the filtered signal’s frequency components are shifted for a constant time. The time information change induced by a linear phase filter can be corrected by shifting the resulting signal. An FIR filter can become a linear phase filter by making coefficients symmetric. The Parks–McClellan algorithm [35] is used to implement linear phase FIR bandpass filters whose normalized stopband frequencies and normalized passband frequencies are determined by the frequency components of the inter-ply echoes. In this paper, the passband frequencies are set as the values within which the desired frequencies are allowed to pass, and the stopband frequencies are set to be 1.11 times wider than the passband frequencies.

4. Results and Discussion

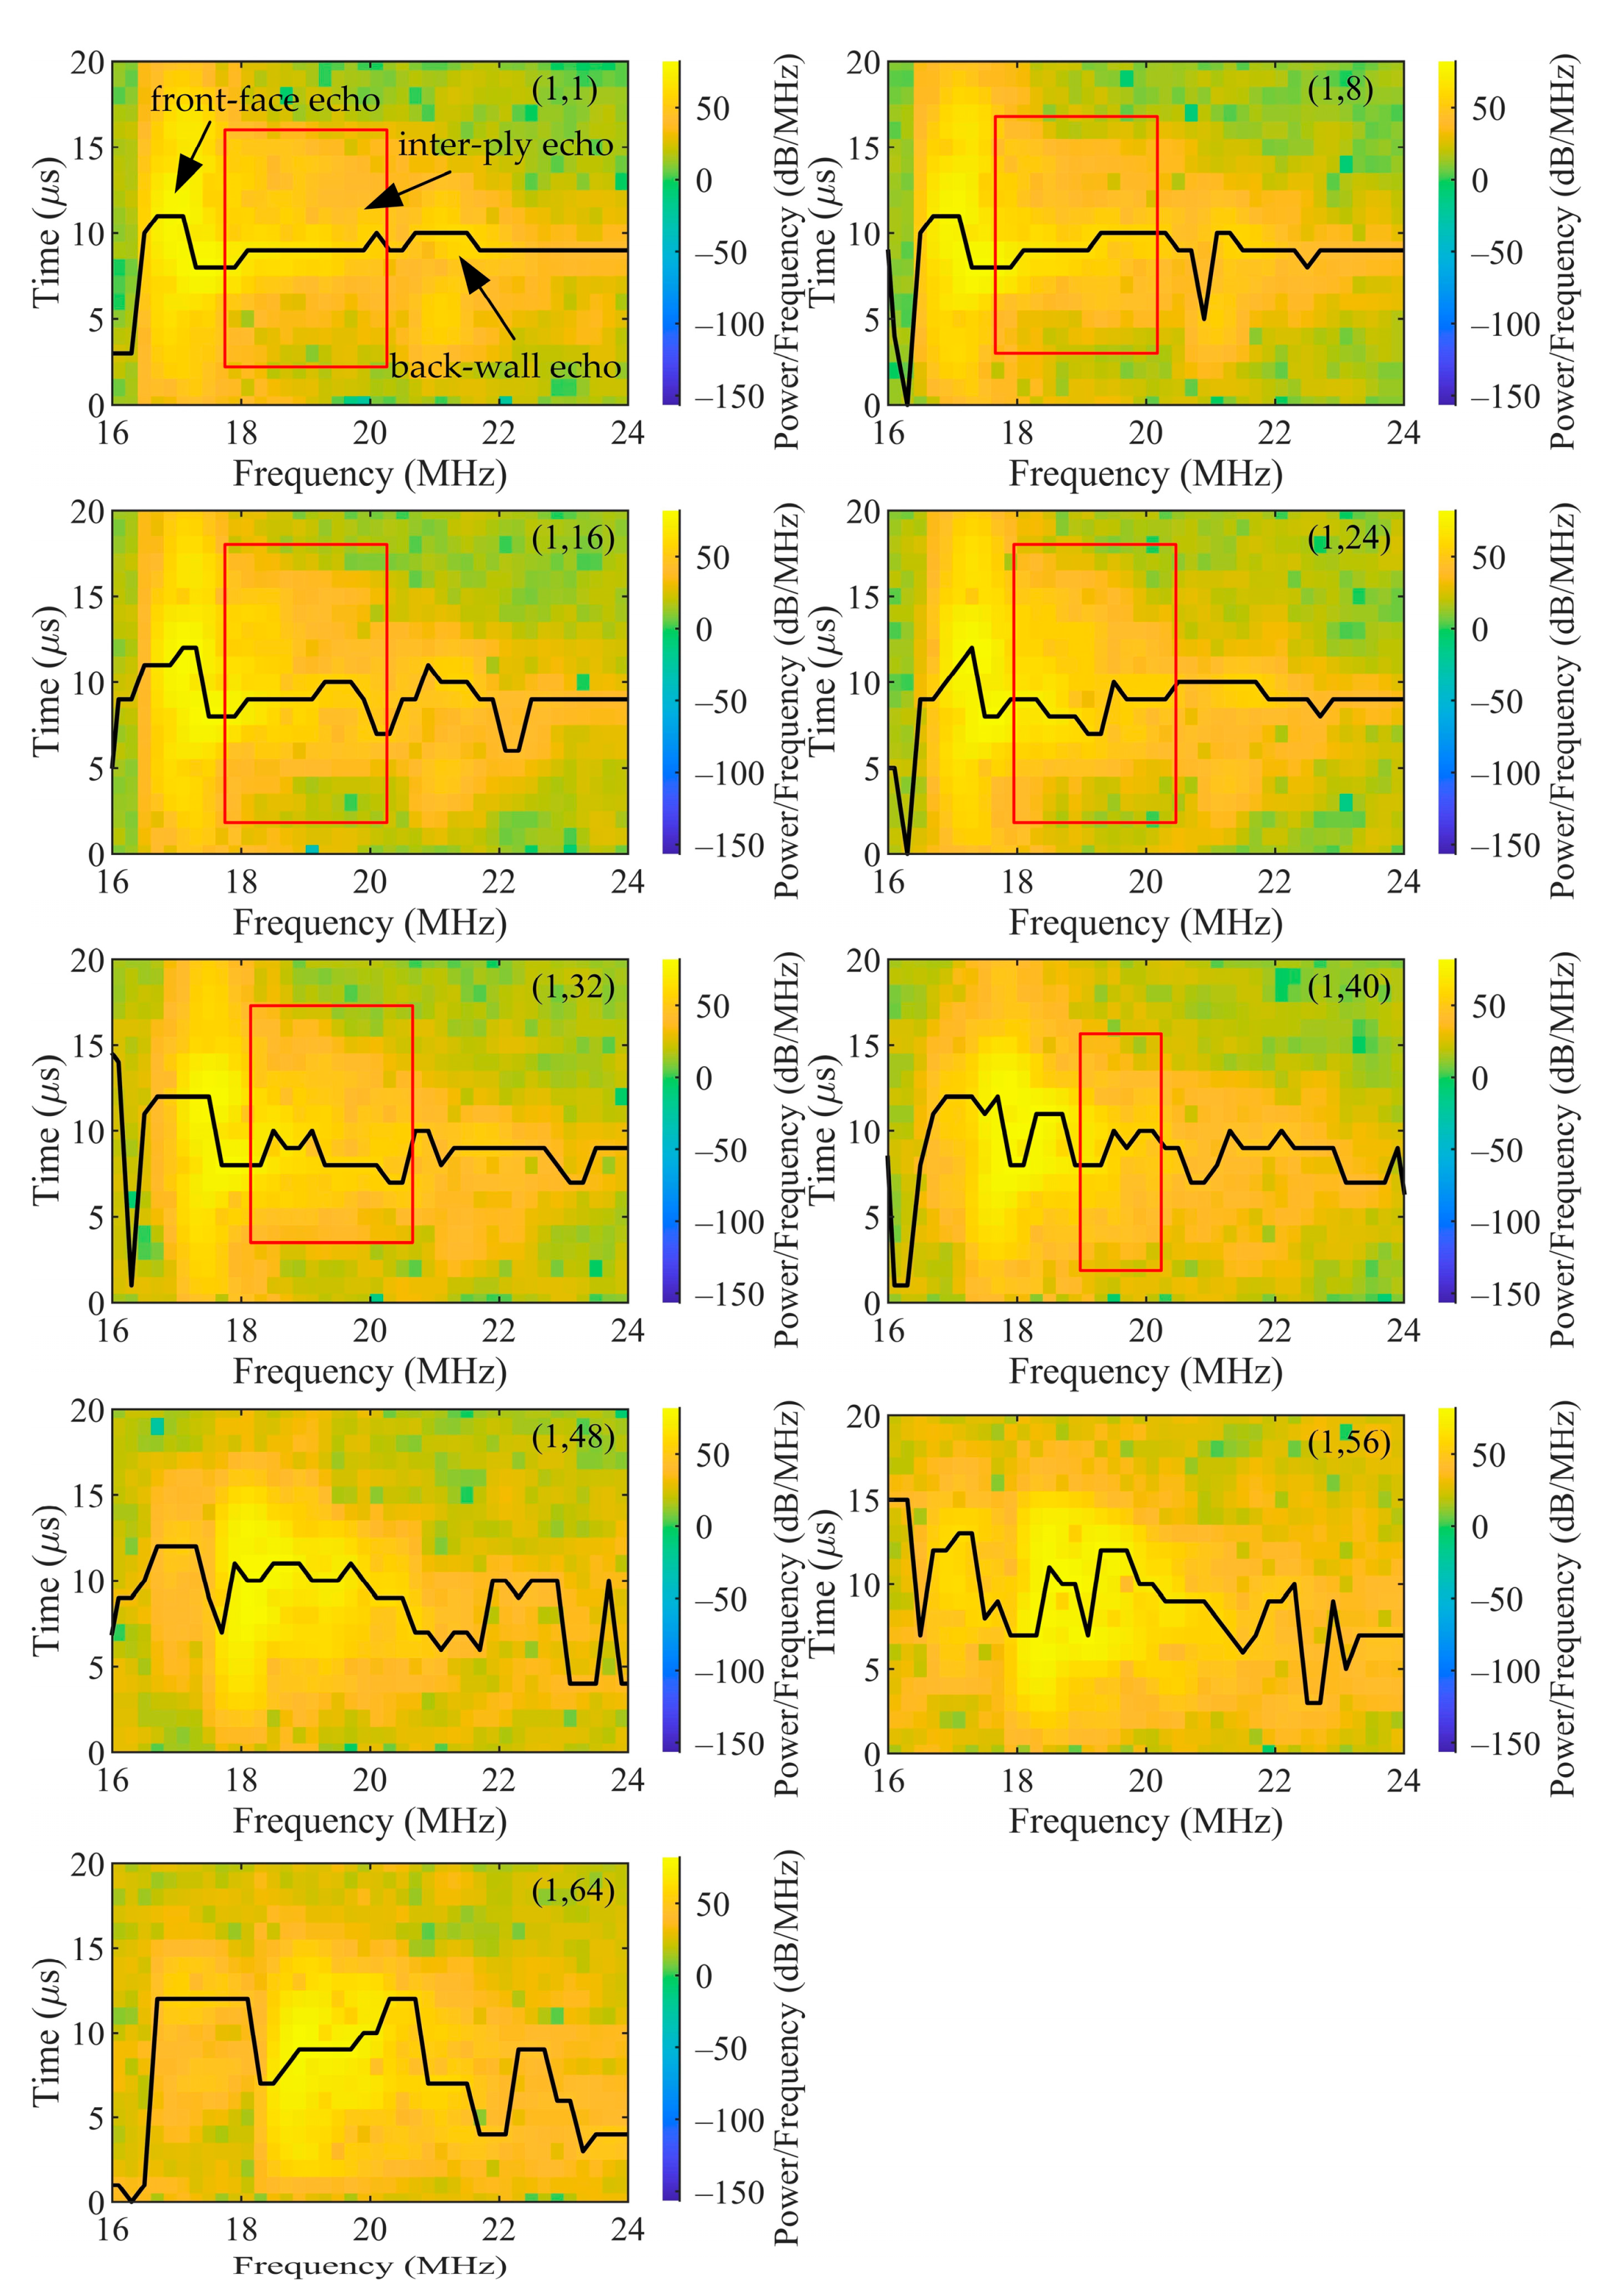
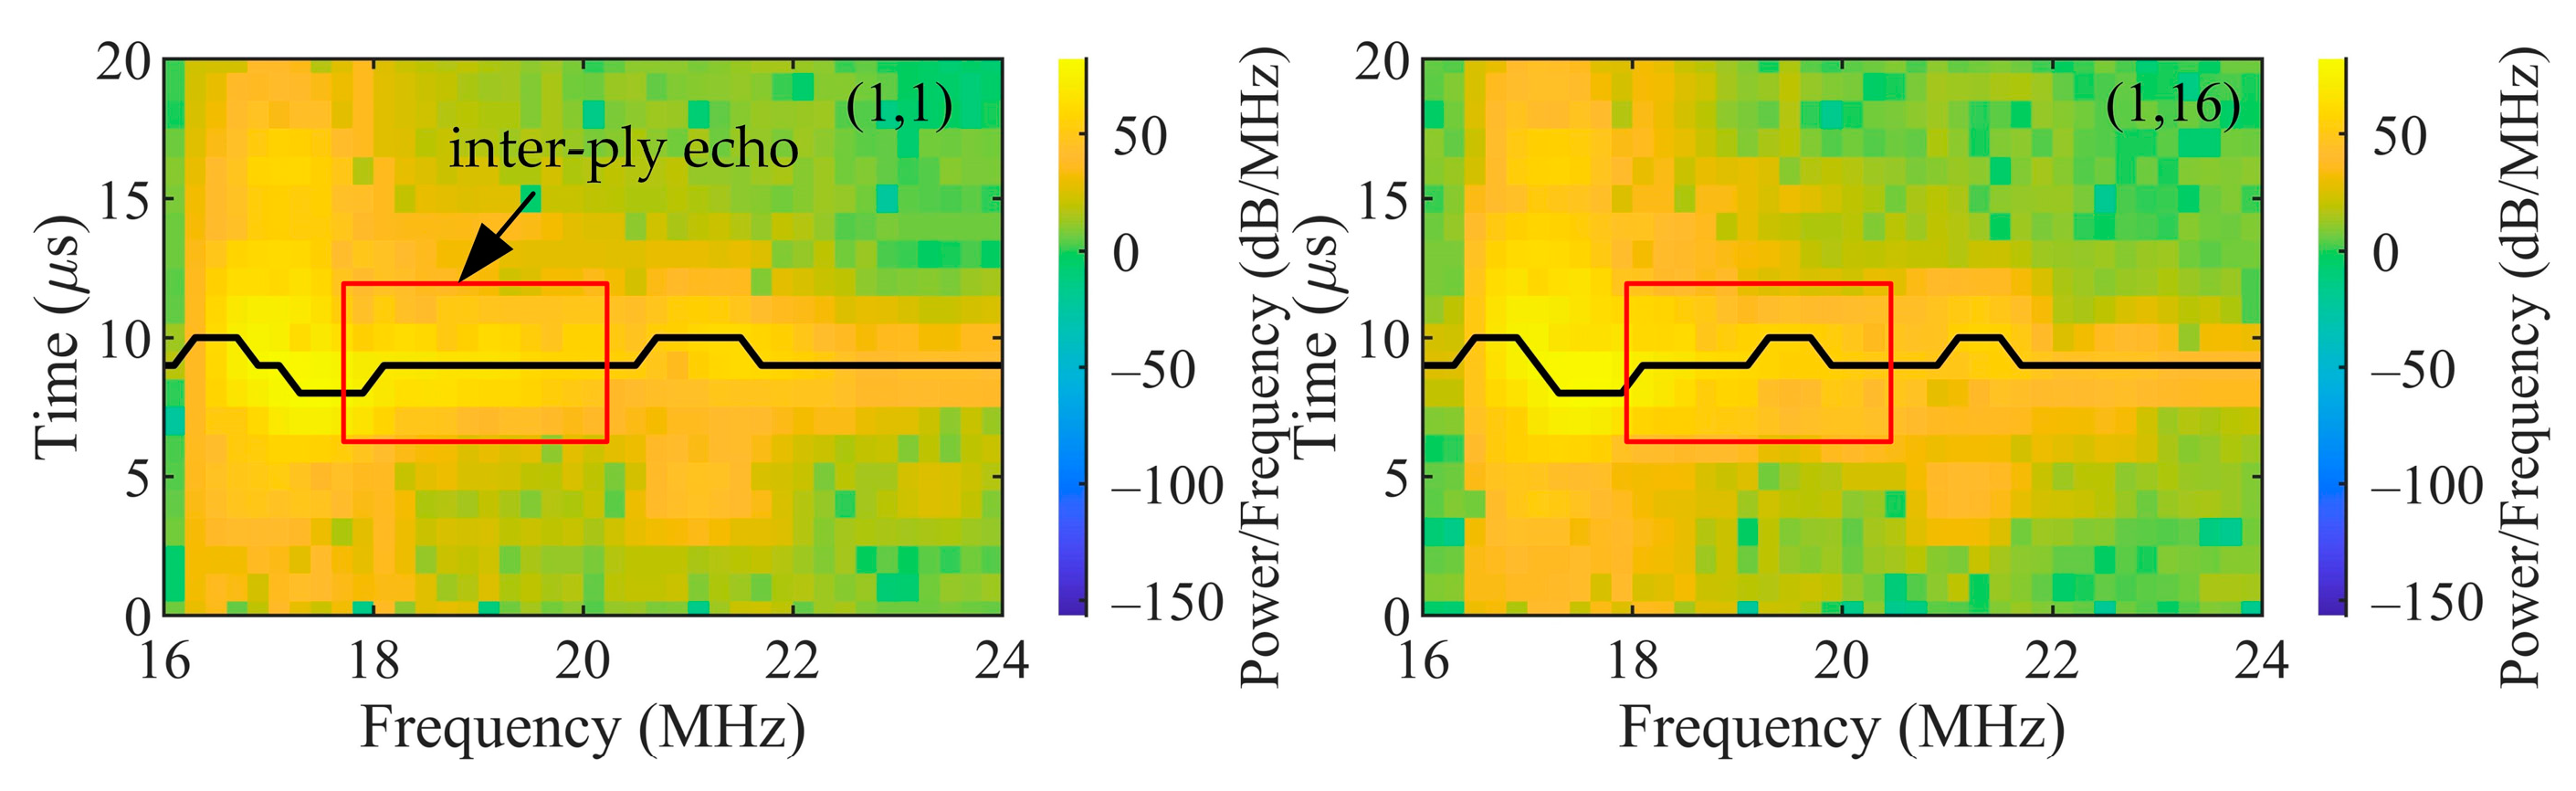
4.1. Frequency Components of the Inter-Ply Echoes

Figure 3a is the acquired A-scan signals with the 32nd element firing and all 64 elements receiving, and the partial signals related to the CFRP sample are shown in Figure 3b. The back-wall echoes’ amplitude reduces when the reception element drifts away from the transmission element. The A-scan signals are almost symmetric about the transmission element (the 32nd element). The A-scan signals with the 1st element firing and all 64 elements receiving are shown in Figure 3c, and the partial signals related to the sample are shown in Figure 3c. The inspected CFRP sample can be assumed to be the same everywhere for analyzing the frequency components of the inter-ply echoes. Some A-scan signals with the 1st element firing are analyzed using the “Spectrogram” function with a relatively long window. Figure 4 shows the spectrograms of the sample-related signals with the 1st element firing and the 1st, 8th, 16th, 24th, 32nd, 40th, 48th, 56th, and 64th elements receiving. The signal with the ith element firing and the jth element receiving is expressed as the (i, j) signal for short from here on. The black lines in Figure 4 are the Time-frequency ridges representing the maximum energy frequency component at each time. It can be seen that the main frequency components of inter-ply signals are distributed around 9 MHz (red rectangular boxes in Figure 4).

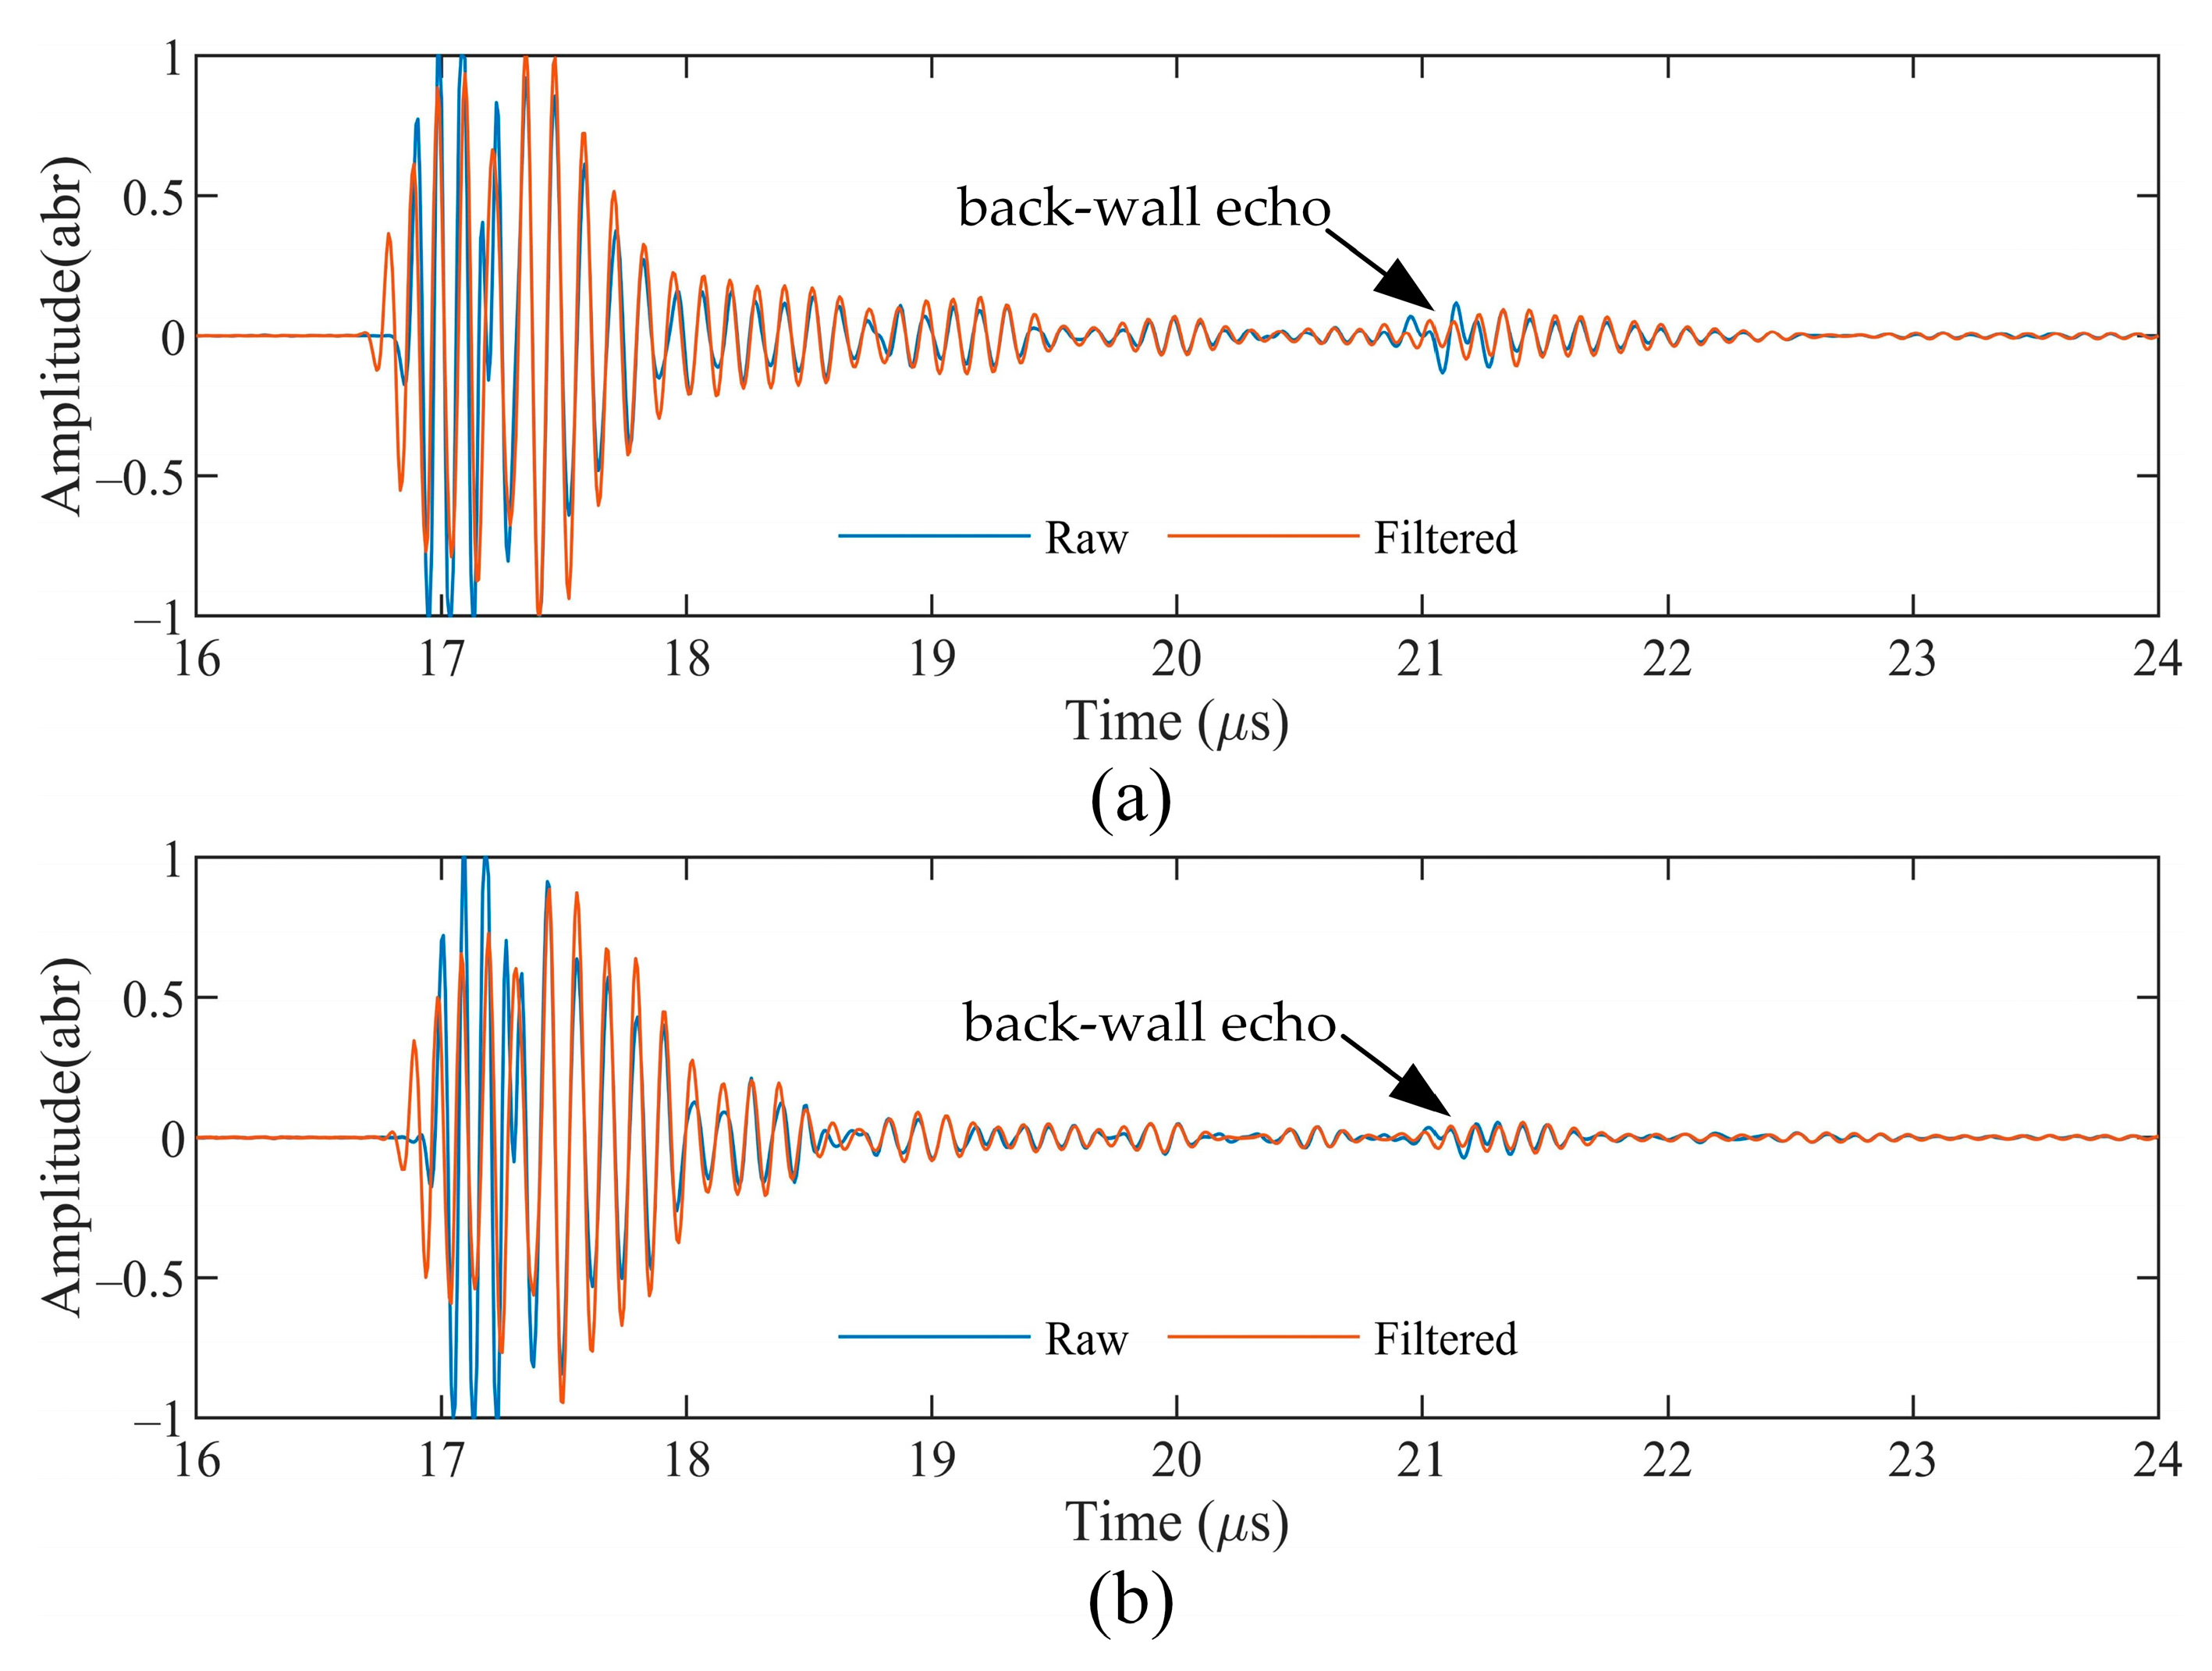
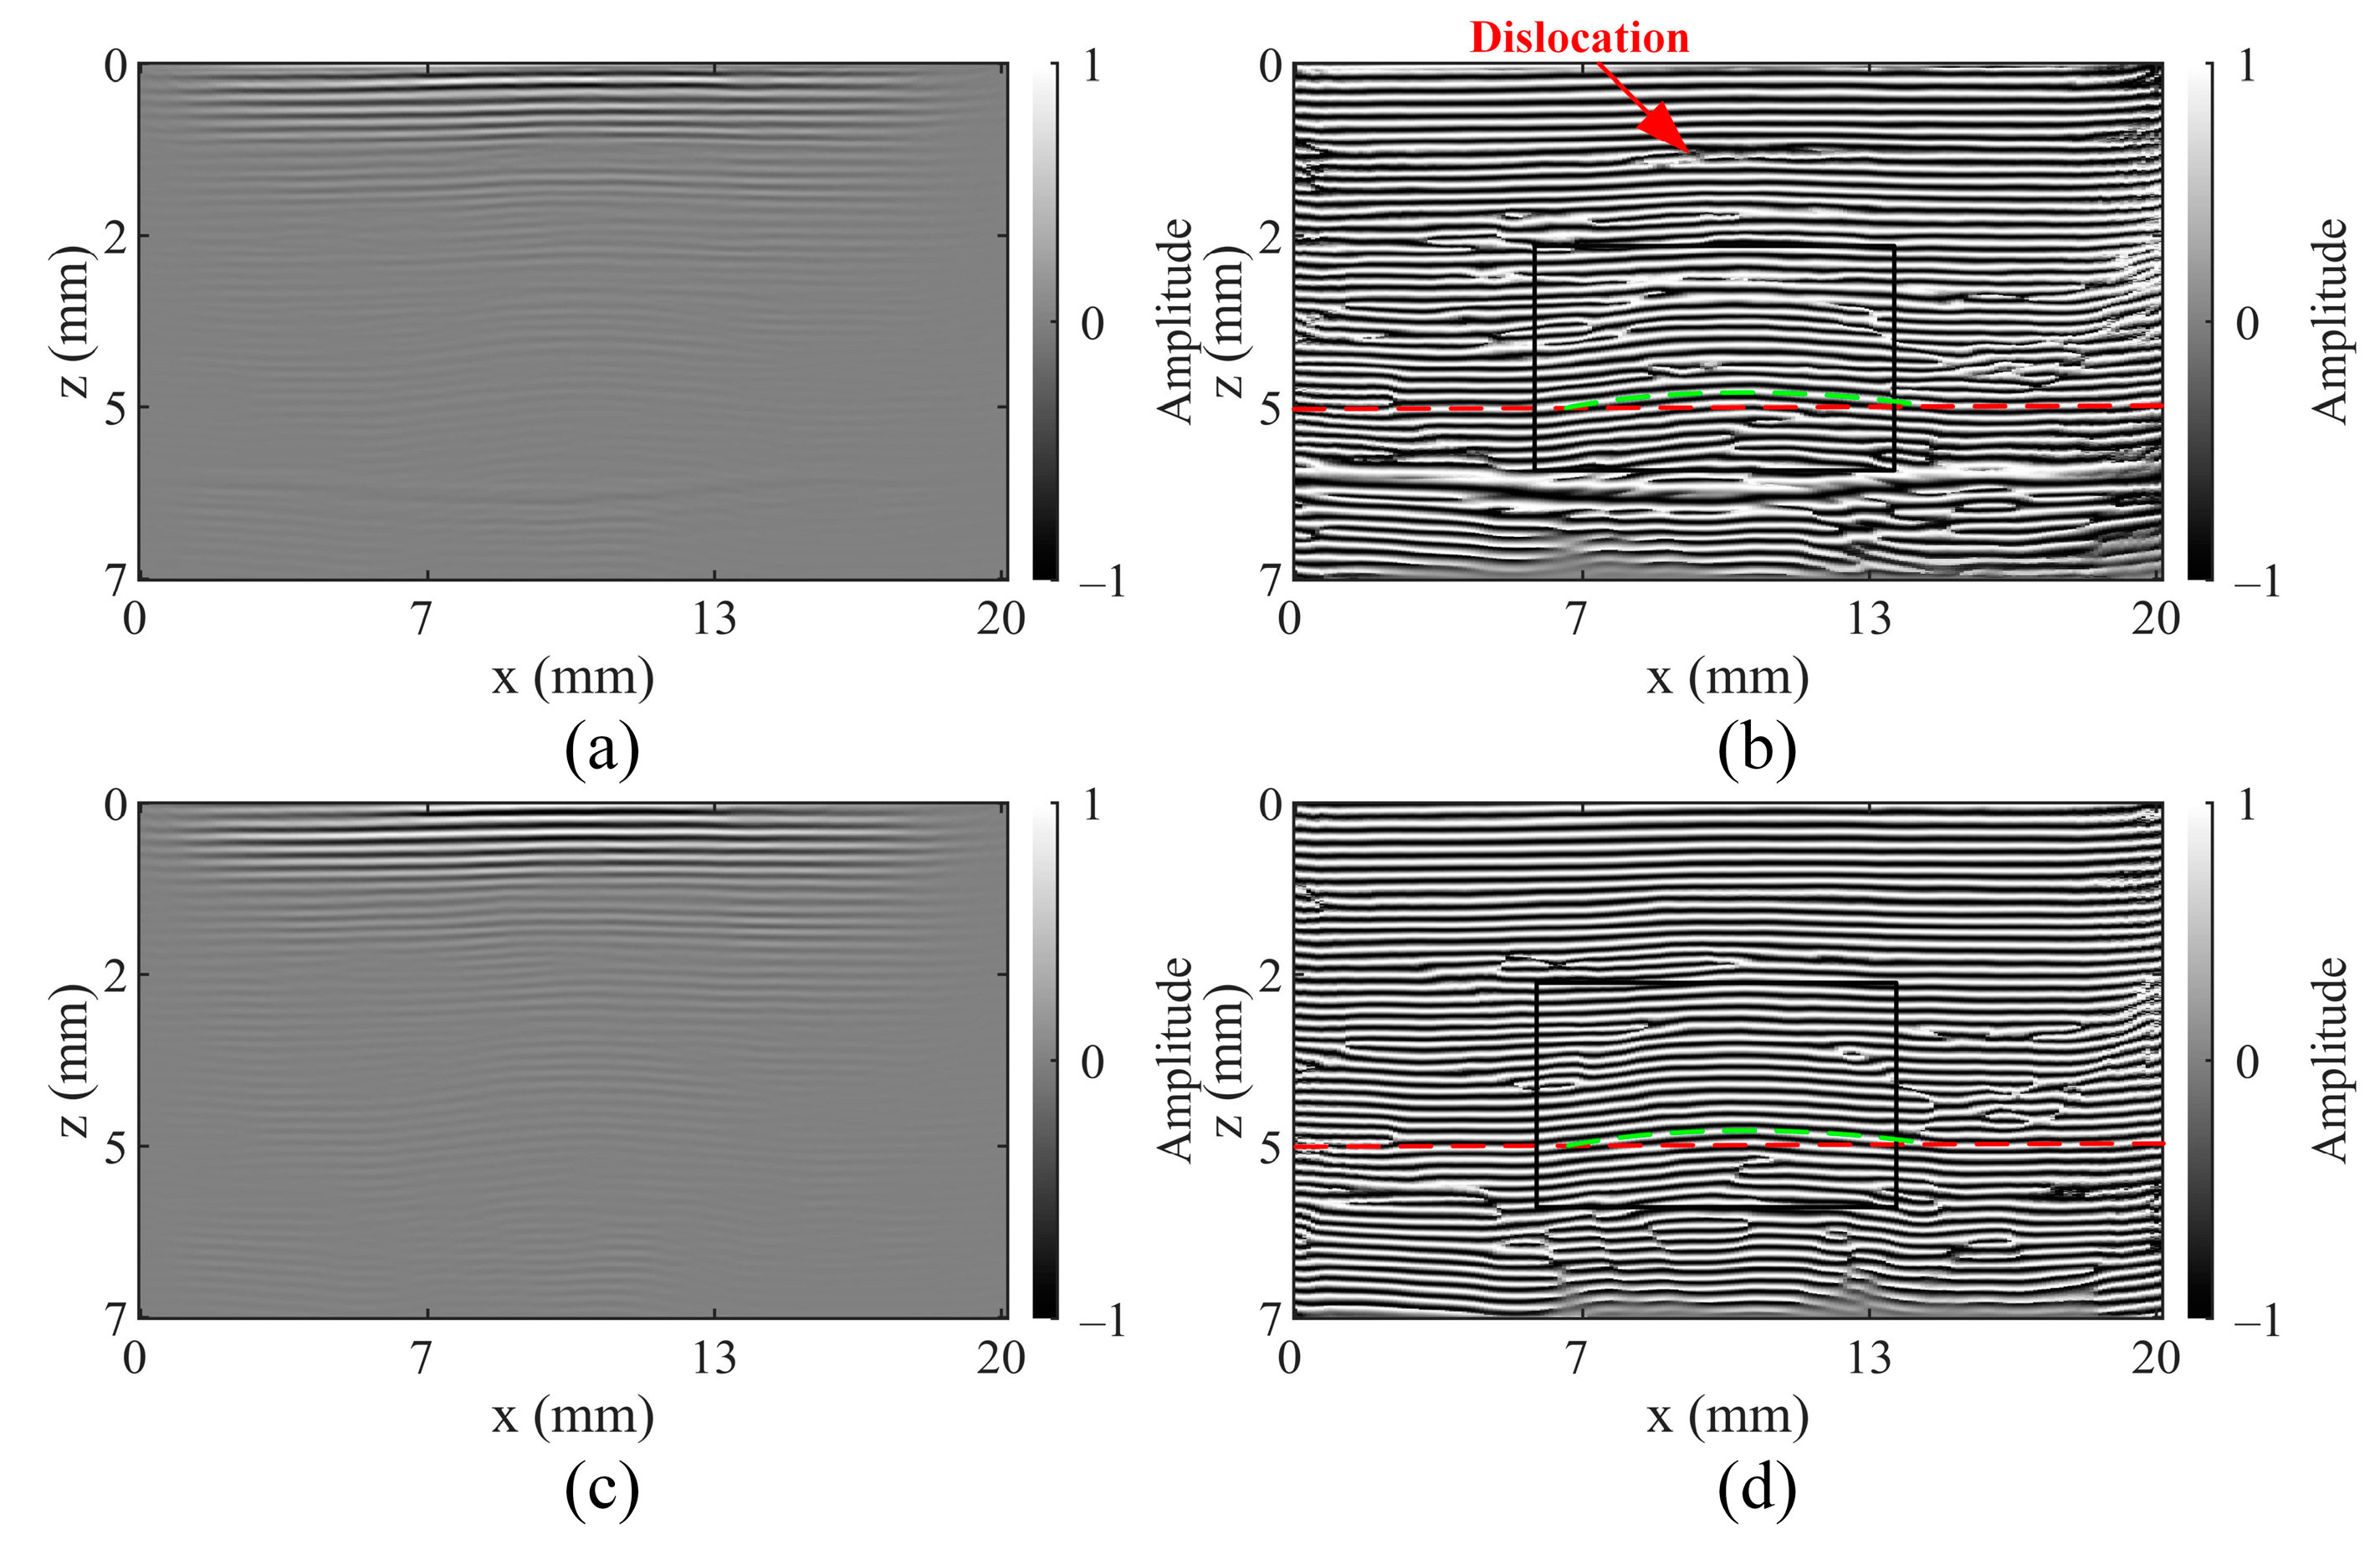
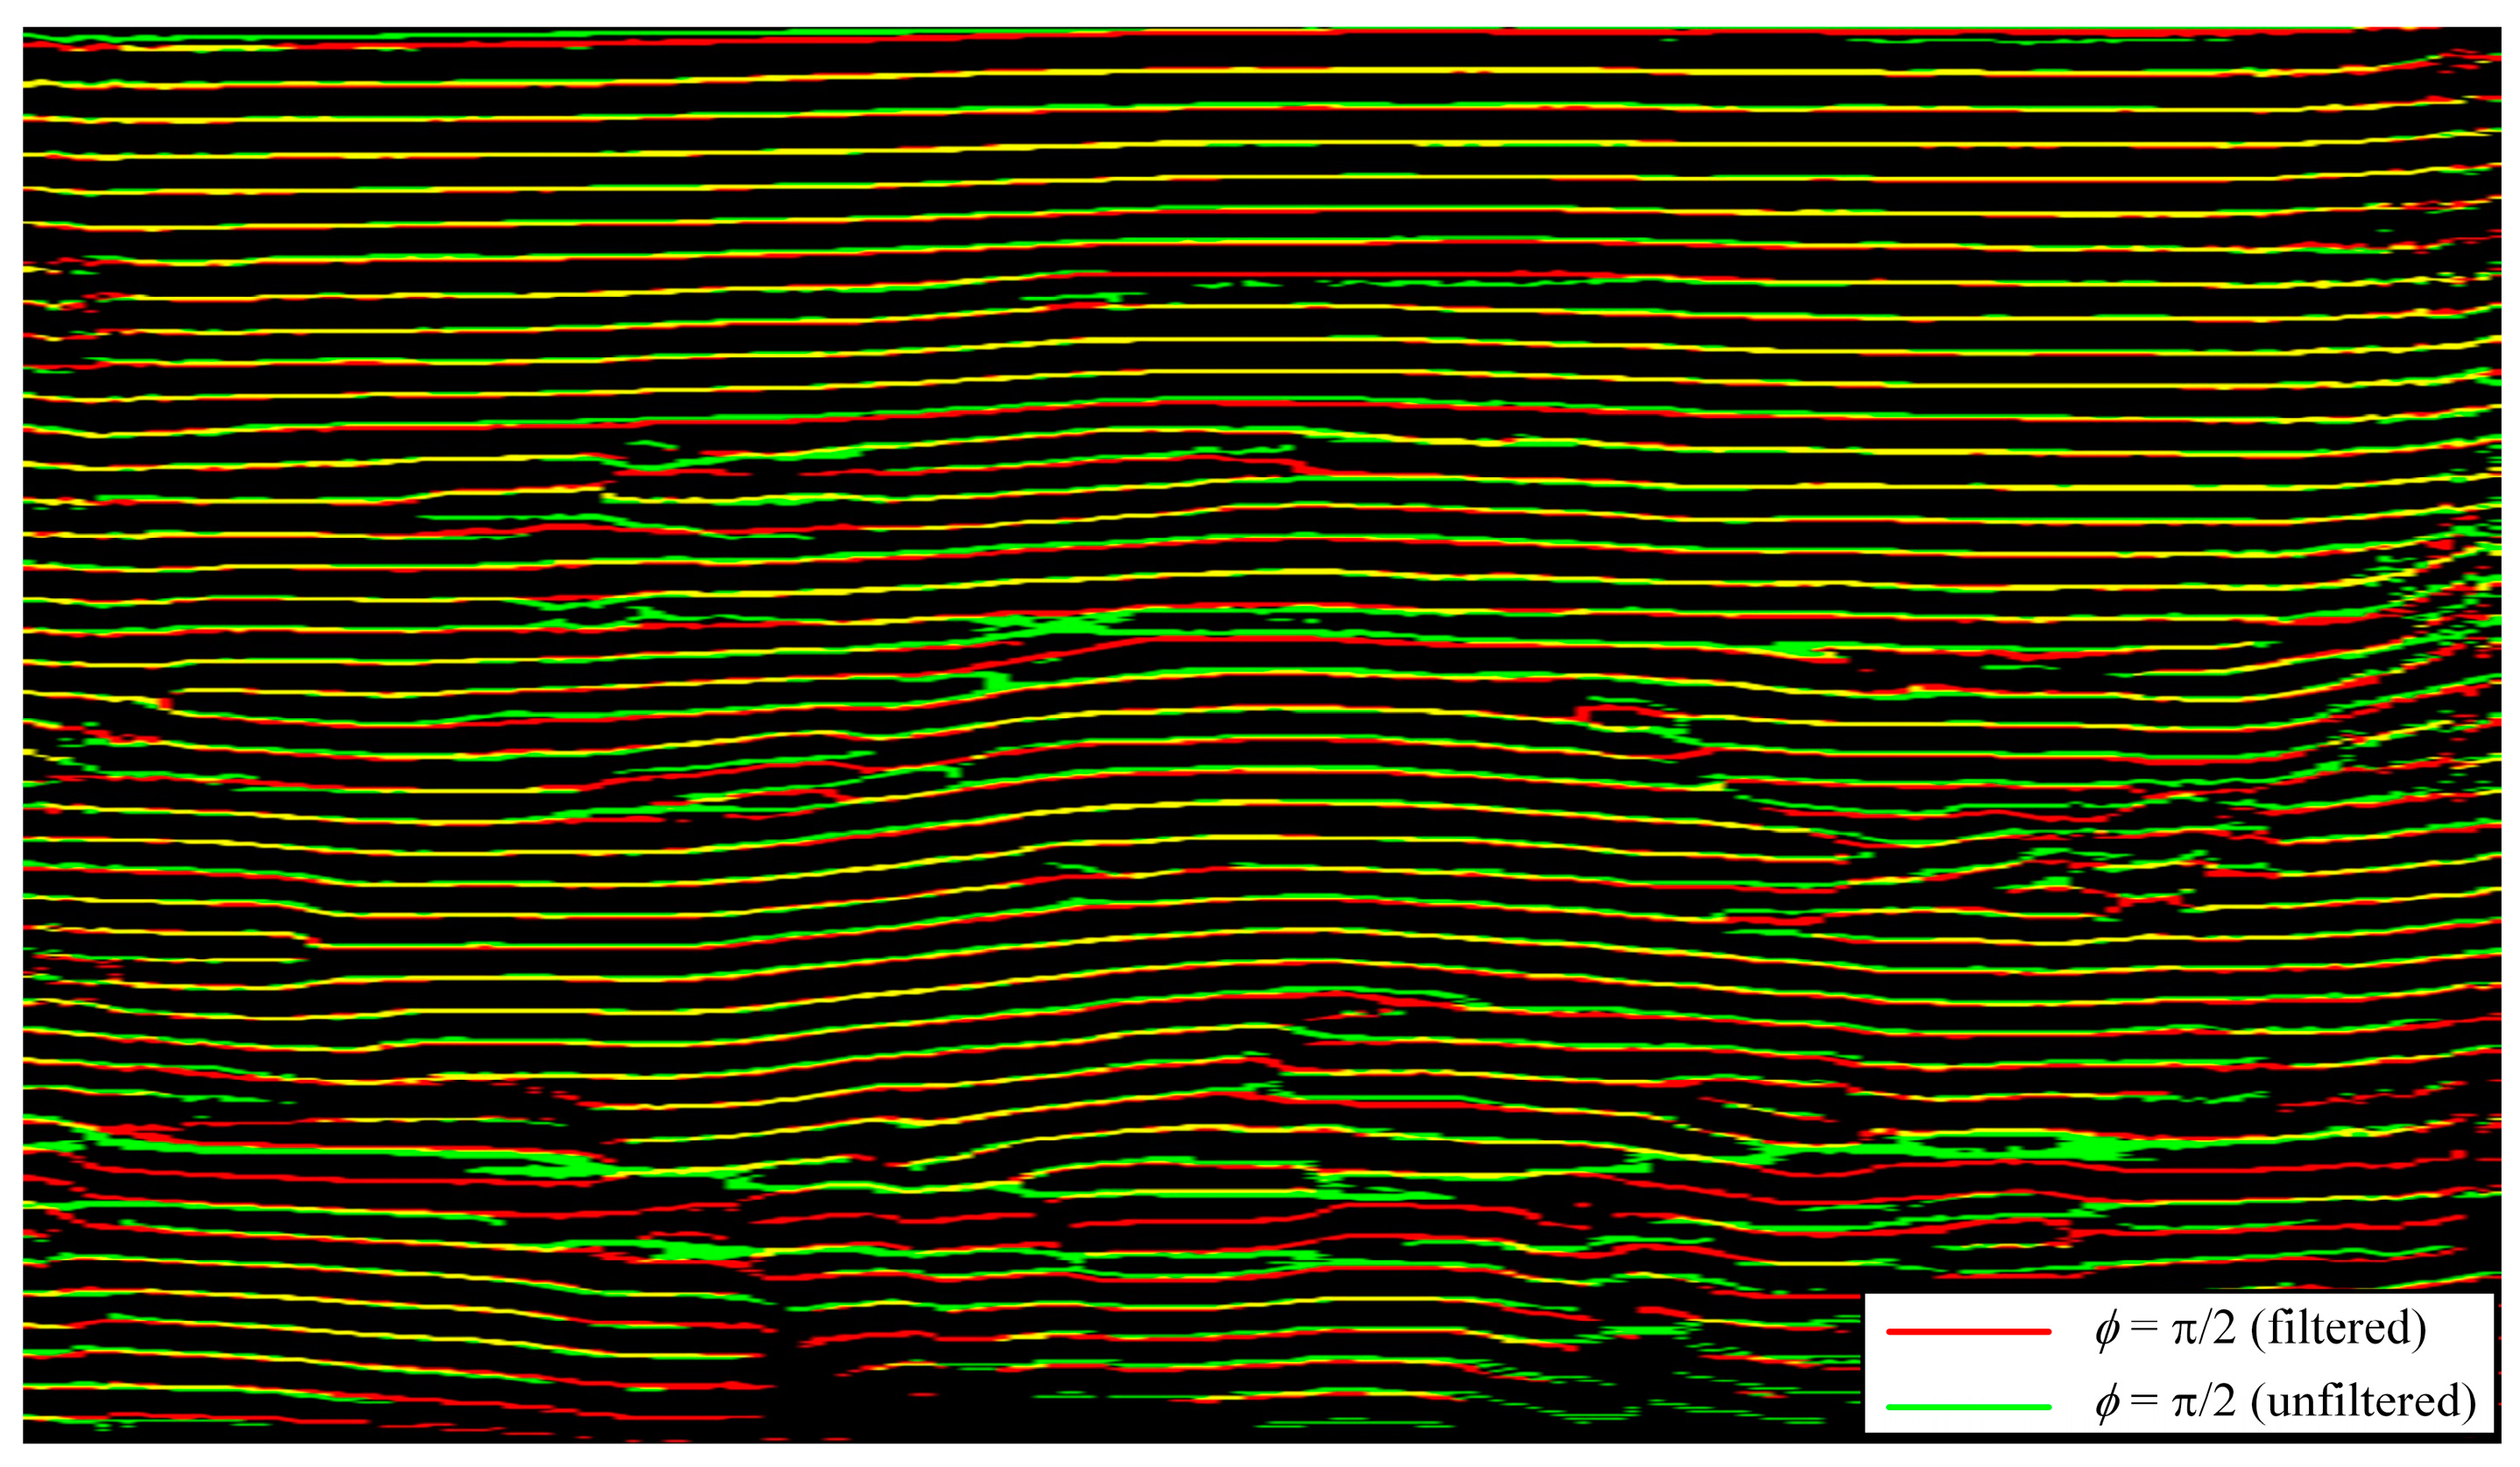
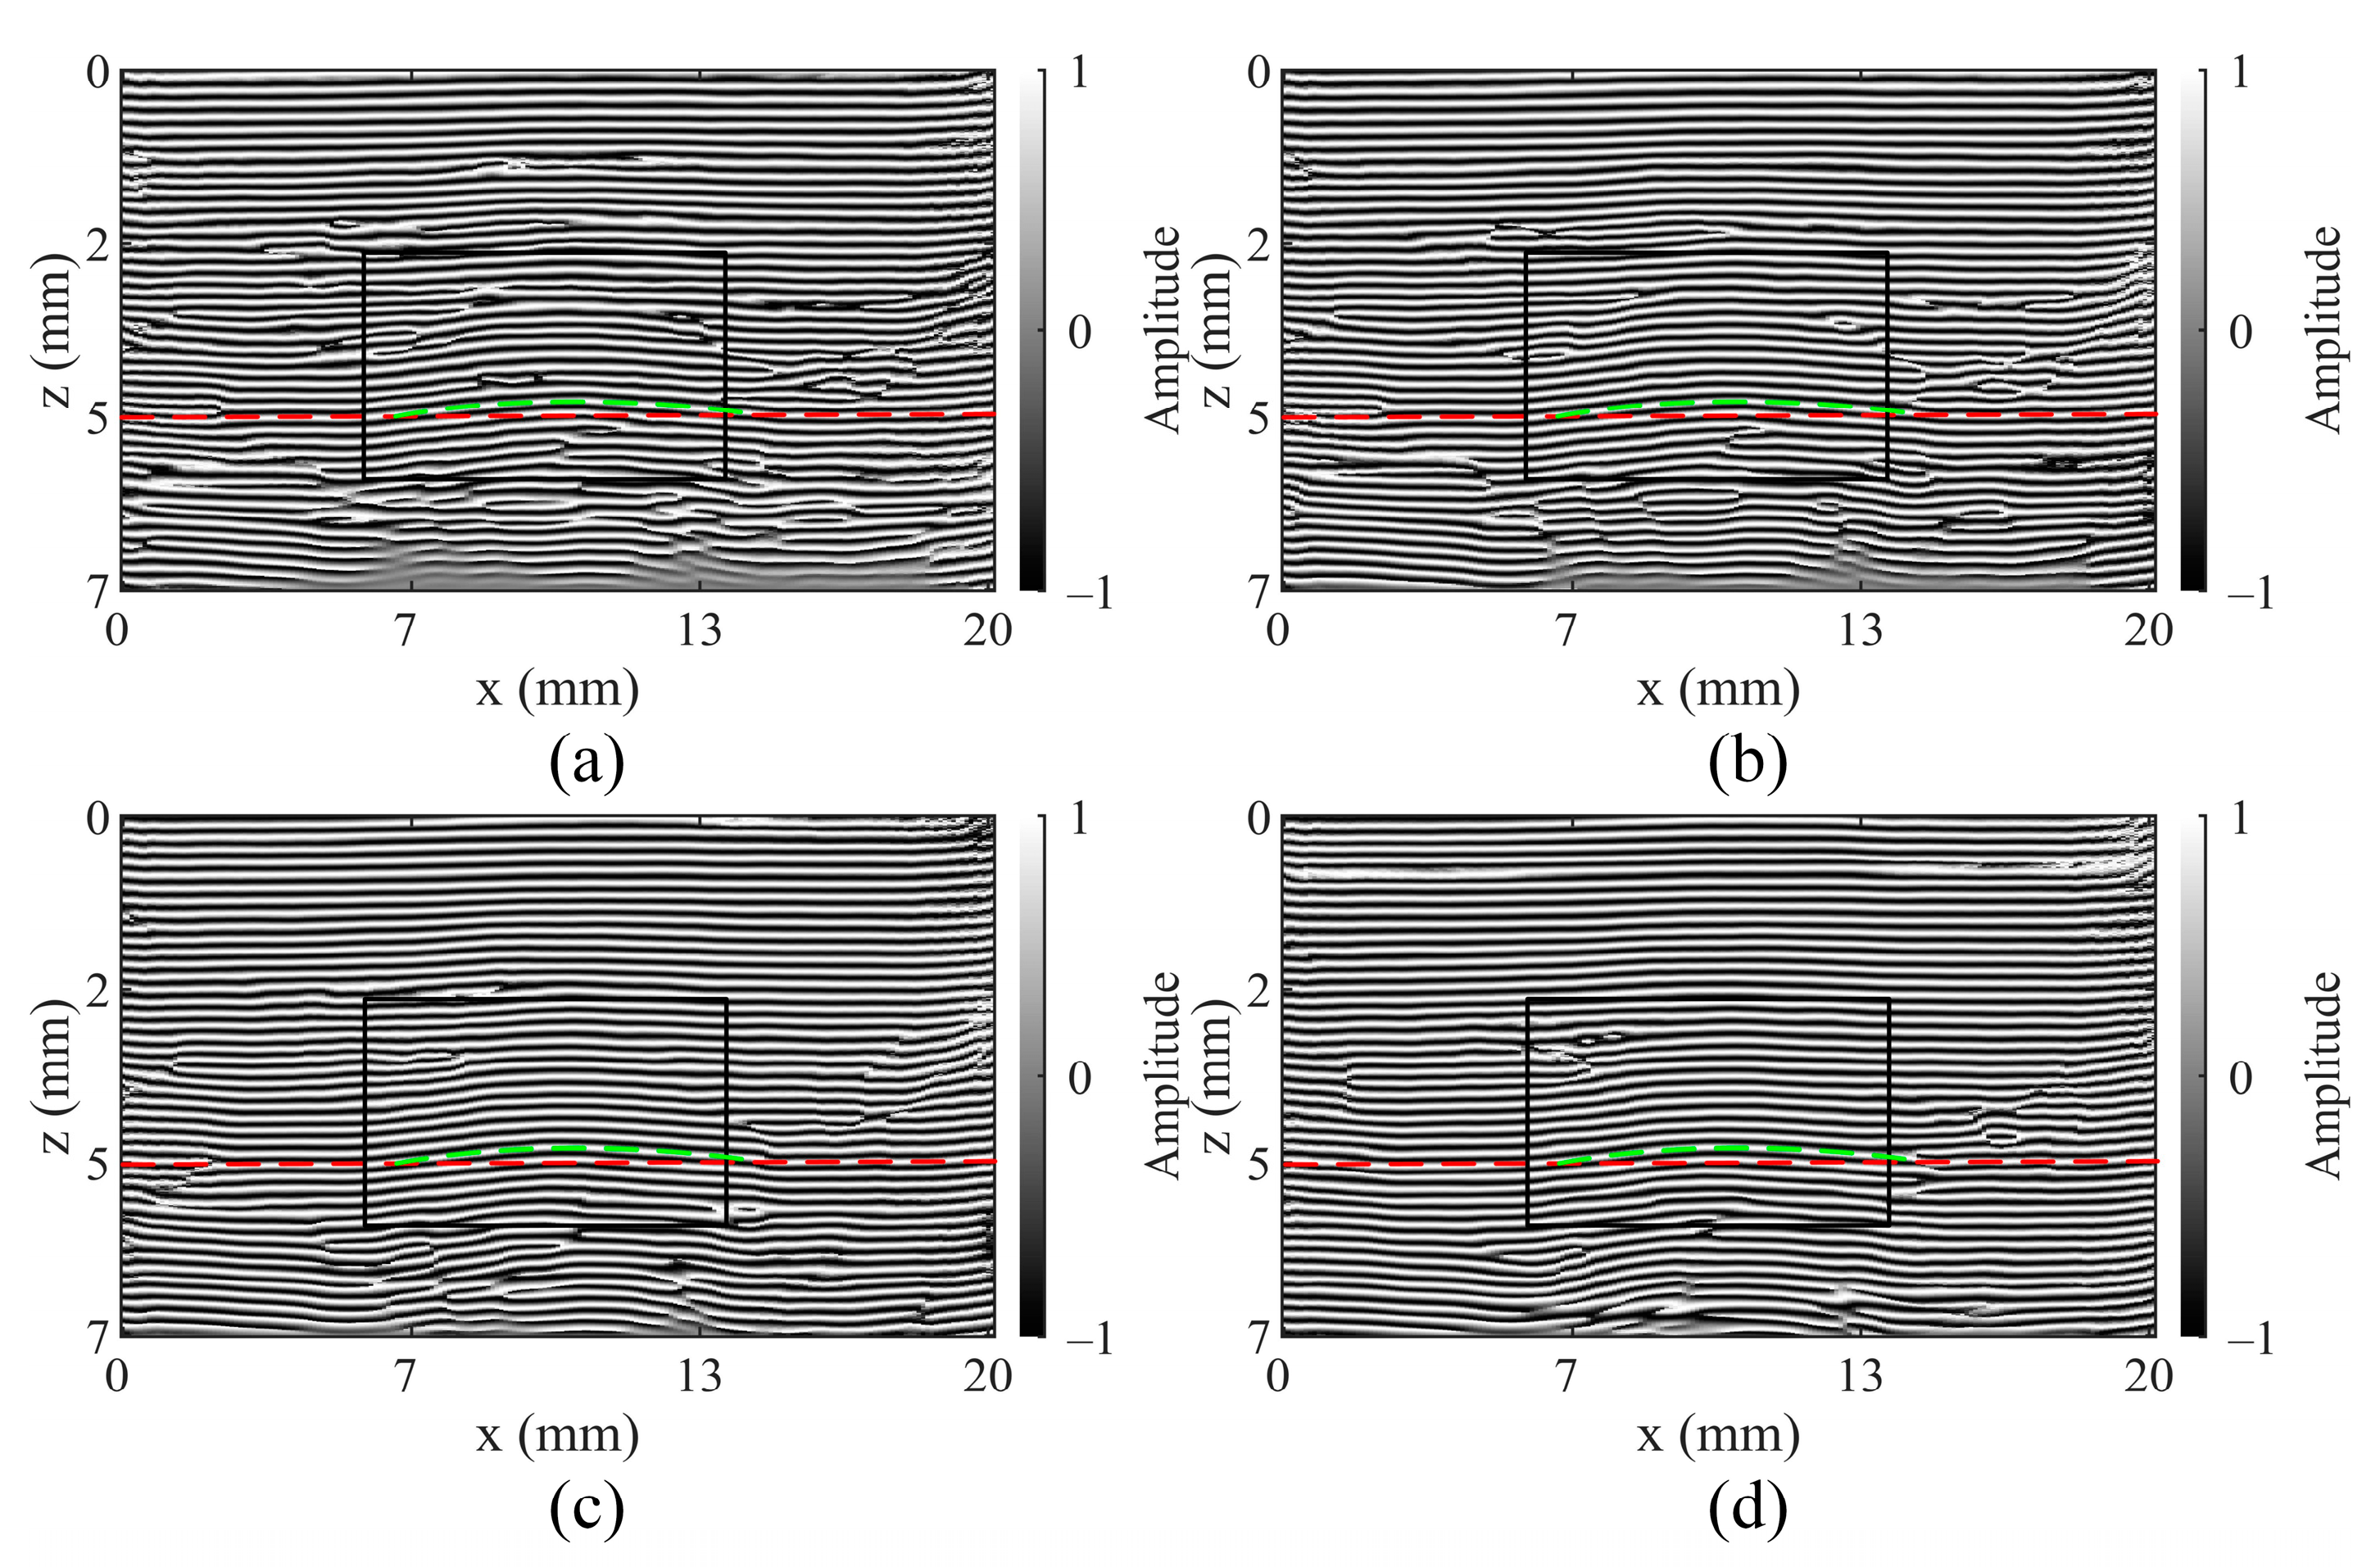
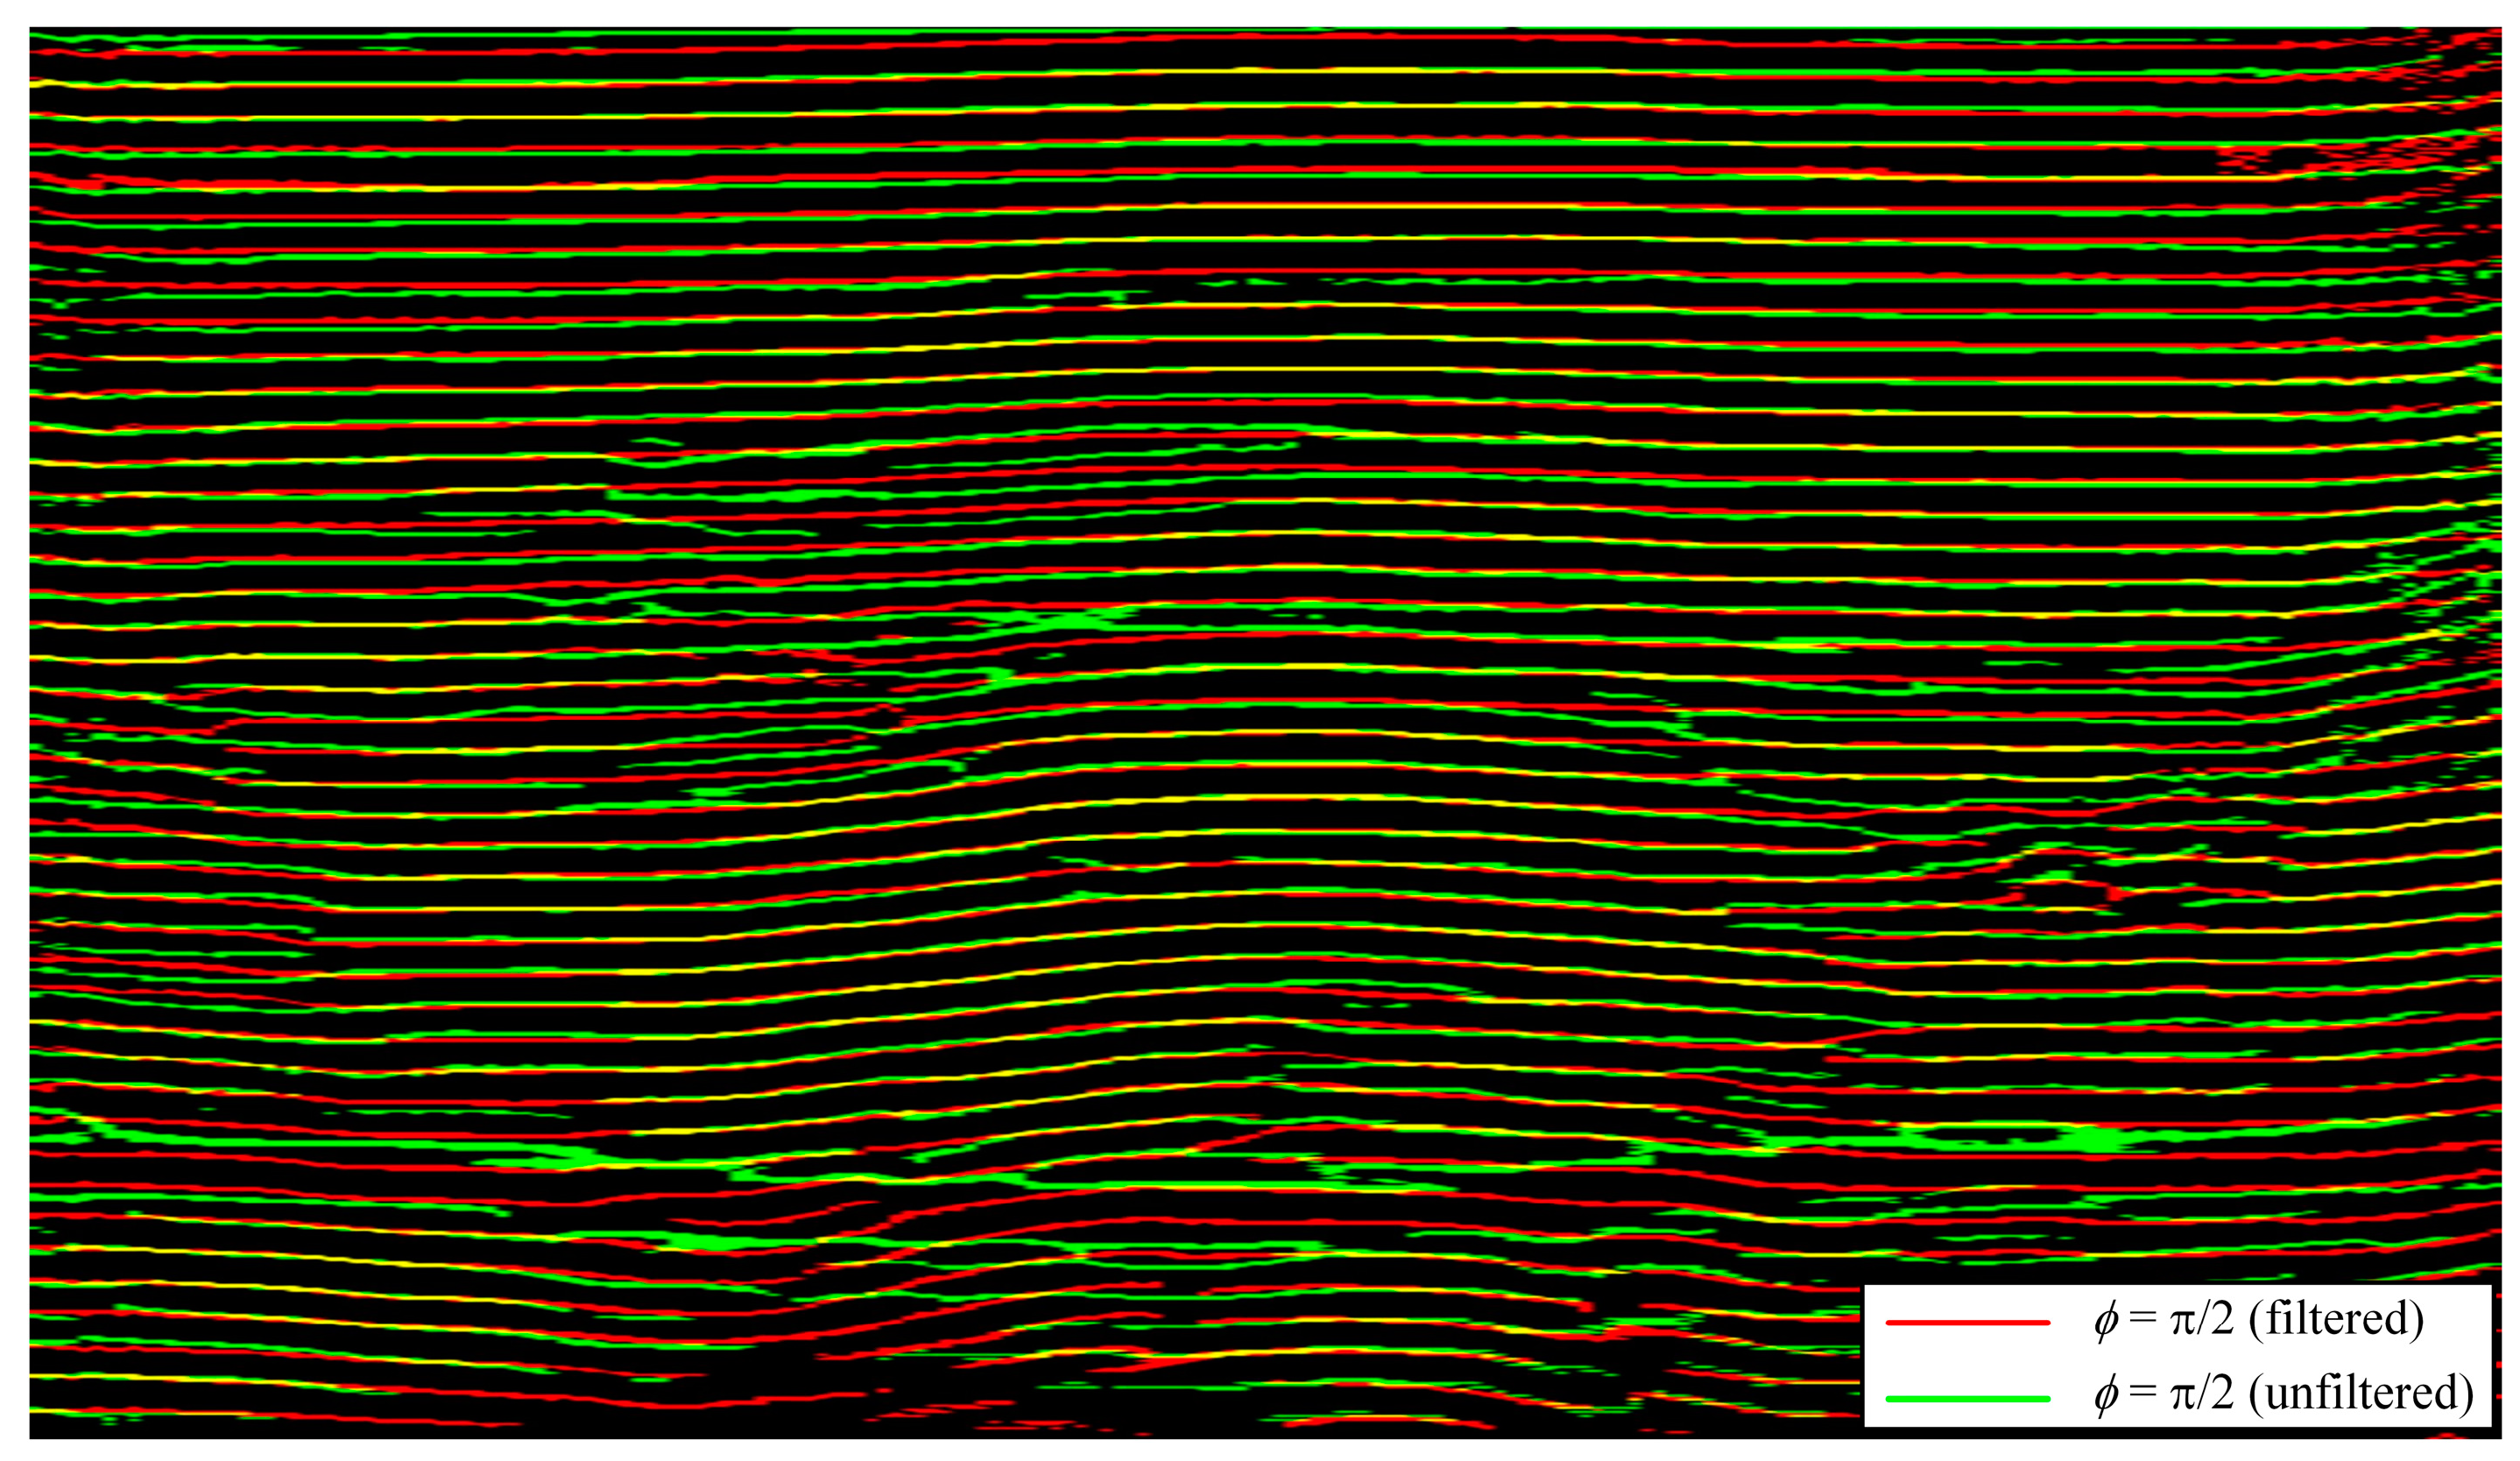
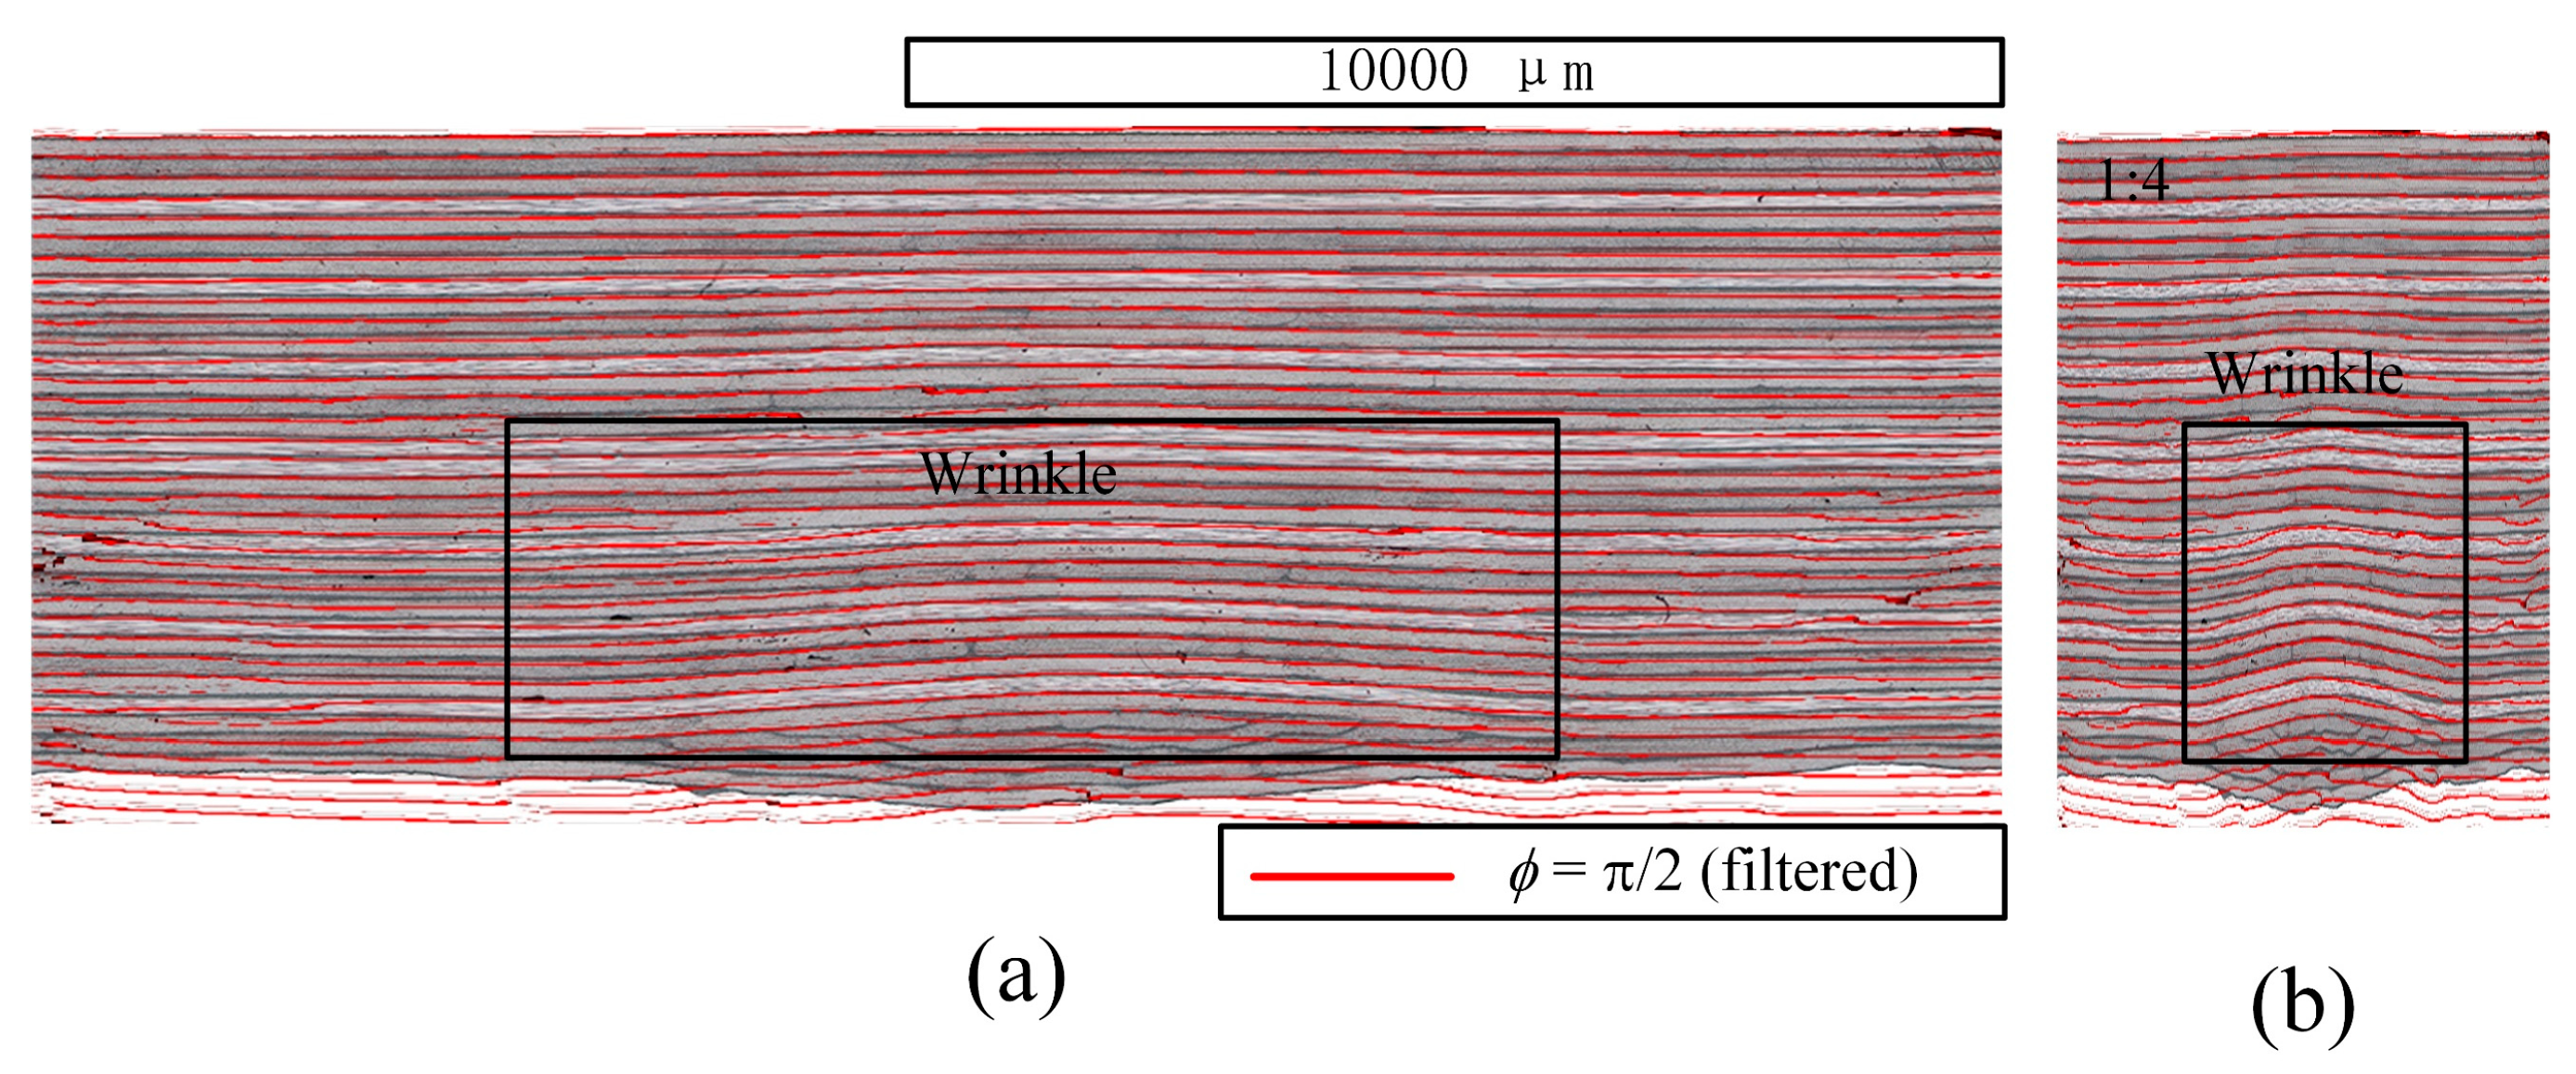
4.2. The TFM Instantaneous Phase Method with Linear Phase FIR Filter

Using the Parks–McClellan algorithm, a linear phase FIR bandpass filter with a coefficient sequence symmetric has been designed. Its passband frequencies are set between 7 MHz~11 MHz, and its stopband frequencies are set between 6.78 MHz~11.22 MHz. The stopband frequencies are 1.11 times wider than the passband frequencies. The center of the passband frequencies is set at 9 MHz. The magnitude and phase responses of the designed filter are shown in Figure 5. The phase response is a linear function of frequency within the passband frequencies. The time information change caused by the designed linear phase filter can be corrected by shifting the filtered signals (Figure 6). The comparison between the raw and the corrected A-scans of the (1,1) and (1,16) signals is shown in Figure 6. As expected, although the amplitude changes, the phase and time information are almost unchanged. The spectrograms of the (1,1) and (1,16) filtered signals related to the sample show that the frequency components of the inter-ply echoes are relatively more concentrated around 9 MHz (Figure 7). The TFM and its related instantaneous phase images of the unfiltered signals are shown in Figure 8a,b, respectively, and The TFM and its related instantaneous phase results of filtered signals are shown in Figure 8c,d, respectively. The back-wall information almost disappears in the filtered result. This phenomenon is mainly attributed to the amplitude reduction of the back-wall echoes after filtering. The high-frequency components have a high inter-ply reflection coefficient and high CFRP attenuation [36], so the frequency components of back-wall echoes contain substantial low-frequency components. The low-frequency components are filtered out by the designed filter. As a result, the back-wall echoes’ amplitude decreases, and the back-wall information becomes invisible in Figure 8c,d. In fact, the back-wall information is inessential, but the maximum wrinkle angle mainly affecting the mechanical performance is the primary parameter to be measured necessarily [25]. The instantaneous phase images can be used to map the wrinkle geometry. The dislocation in the instantaneous phase images is mainly induced by noise, so the TFM instantaneous phase image of the filtered signals has less dislocation than that of the unfiltered. The peaks (ϕ = π/2) in the filtered TFM instantaneous phase image are extracted and indicated by red points, and those in the unfiltered are green points (Figure 9). Most peaks in the filtered and unfiltered are coincident, and these coincident points appear with yellow ones. As shown in Figure 9, the designed linear phase filter almost does not affect the wrinkle geometry of the detection result and relieves some noise-induced dislocation.

4.3. The Filter Bandwidth

The filter bandwidth denotes the passband frequencies’ range in this paper. In Section 3.2, the filter passband frequencies have been set between 7 MHz~11 MHz; the filter bandwidth is 4 MHz. In this section, linear phase FIR filters with different bandwidths have been designed, and their parameters are mainly listed in Table 2. The bandwidths of designed filters are 8 MHz, 4MHz, 2MHz, and 1 MHz, and their corresponding TFM instantaneous phase results are shown in Figure 10a–d, respectively. It can be seen that the result corresponding to a narrower bandwidth filter has less dislocation in Figure 10. A narrower bandwidth filter can filter out more noise. The comparison between the unfiltered and the 1MHz bandwidth-filtered results is shown in Figure 11. Although the wrinkle geometry of the detection result remains nearly unchanged, the back-wall information suffers further loss for the 1 MHz bandwidth filter. The result of the 1 MHz bandwidth filter is not better than that of the 2 MHz bandwidth filter. The 2 MHz bandwidth filter is recommended as an optimum choice for the TFM instantaneous phase method. The peaks (ϕ = π/2) of the detection result from the 2 MHz bandwidth filter are overlaid on the micrograph of the wrinkle sample (Figure 12), and these peaks can excellently track the deviating plies (wrinkle defects).

5. Conclusions

The TFM instantaneous phase method using weak reflection signals is vulnerable to noise, especially structural noise from voids. The noise contaminates weak inter-ply re-flection signals and induces dislocation in the TFM instantaneous phase results. The aim of this paper is to use suitable filters to relieve noise-induced dislocation for the TFM instantaneous phase method. Due to the character of the total focusing method (TFM) and the high spatial precision requirements of direct wrinkle detection, we have chosen to design linear phase filters. Linear phase filters can avoid phase distortion and preserve spatial information.
The linear phase filter almost has no effect on the wrinkle geometry of the detection results and relieves some noise-induced dislocation. The 2 MHz bandwidth filter is an optimum choice for the TFM instantaneous phase method. The filtered detection result can excellently track the deviating plies (namely wrinkle defects).

Author Contributions

T.M.: conceptualization, investigation, and writing—original draft. Y.L.: supervision and writing—review and editing, project administration, and funding acquisition. Z.Z.: supervision and writing—review and editing, project administration. J.M.: resource and supervision. All authors have read and agreed to the published version of the manuscript.

Funding

This research was funded by the Commercial Aircraft Corporation of China (COMAC), grant number COMAC-SFGS-2021-666.

Data Availability Statement

Not applicable.

Conflicts of Interest

The authors declare no conflict of interest.

References

  1. Nartey, M.; Zhang, T.; Gong, B.; Wang, J.; Peng, S.; Wang, H.; Peng, H.-X. Understanding the impact of fibre wrinkle architectures on composite laminates through tailored gaps and overlaps. Compos. Part B Eng. 2020, 196, 108097. [Google Scholar] [CrossRef]
  2. Matsui, J. Polymer matrix composites (PMC) in aerospace. Adv. Compos. Mater. 1995, 4, 197–208. [Google Scholar] [CrossRef]
  3. Mukhopadhyay, S.; Jones, M.I.; Hallett, S.R. Tensile failure of laminates containing an embedded wrinkle; numerical and experimental study. Compos. Part A Appl. Sci. Manuf. 2015, 77, 219–228. [Google Scholar] [CrossRef]
  4. Wilhelmsson, D.; Gutkin, R.; Edgren, F.; Asp, L. An experimental study of fibre waviness and its effects on compressive properties of unidirectional NCF composites. Compos. Part A Appl. Sci. Manuf. 2018, 107, 665–674. [Google Scholar] [CrossRef]
  5. Kulkarni, P.; Mali, K.D.; Singh, S. An overview of the formation of fibre waviness and its effect on the mechanical performance of fibre reinforced polymer composites. Compos. Part A Appl. Sci. Manuf. 2020, 137, 106013. [Google Scholar] [CrossRef]
  6. Elhajjar, R.F.; Shams, S.S.; Kemeny, G.J.; Stuessy, G. A hybrid numerical and imaging approach for characterizing defects in composite structures. Compos. Part A Appl. Sci. Manuf. 2016, 81, 98–104. [Google Scholar] [CrossRef]
  7. Liao, Y.; Wang, J.; Zeng, Z.; Lin, J.; Dai, Y. Detection of fiber waviness in carbon fiber prepreg using Eddy current method. Compos. Commun. 2021, 28, 100981. [Google Scholar] [CrossRef]
  8. Elhajjar, R.; Haj-Ali, R.; Wei, B.-S. An infrared thermoelastic stress analysis investigation for detecting fiber waviness in composite structures. Polym.-Plast. Technol. Eng. 2014, 53, 1251–1258. [Google Scholar] [CrossRef]
  9. Hallander, P.; Akermo, M.; Mattei, C.; Petersson, M.; Nyman, T. An experimental study of mechanisms behind wrinkle development during forming of composite laminates. Compos. Part A Appl. Sci. Manuf. 2013, 50, 54–64. [Google Scholar] [CrossRef]
  10. Smith, R.A.; Nelson, L.J.; Mienczakowski, M.J.; Challis, R.E. Automated analysis and advanced defect characterisation from ultrasonic scans of composites. Insight-Non-Destr. Test. Cond. Monit. 2009, 51, 82–87. [Google Scholar] [CrossRef]
  11. Chakrapani, S.K.; Dayal, V.; Hsu, D.K.; Barnard, D.J.; Gross, A. Characterization of waviness in wind turbine blades using air coupled ultrasonics. In AIP Conference Proceedings; American Institute of Physics: College Park, ML, USA, 2011; pp. 956–962. [Google Scholar]
  12. Kosukegawa, H.; Kiso, Y.; Hashimoto, M.; Uchimoto, T.; Takagi, T. Evaluation of detectability of differential type probe using directional eddy current for fibre waviness in CFRP. Philos. Trans. A Math. Phys. Eng. Sci. 2020, 378, 20190587. [Google Scholar] [CrossRef]
  13. Zhang, Z.; Guo, S.; Li, Q.; Cui, F.; Malcolm, A.A.; Su, Z.; Liu, M. Ultrasonic detection and characterization of delamination and rich resin in thick composites with waviness. Compos. Sci. Technol. 2020, 189, 108016. [Google Scholar] [CrossRef]
  14. Philibert, M.; Soutis, C.; Gresil, M.; Yao, K. Damage Detection in a Composite T-Joint Using Guided Lamb Waves. Aerospace 2018, 5, 40. [Google Scholar] [CrossRef] [Green Version]
  15. Memmolo, V.; Boffa, N.D.; Maio, L.; Monaco, E.; Ricci, F. Damage Localization in Composite Structures Using a Guided Waves Based Multi-Parameter Approach. Aerospace 2018, 5, 111. [Google Scholar] [CrossRef] [Green Version]
  16. Malinowski, P.H.; Tserpes, K.I.; Ecault, R.; Ostachowicz, W.M. Mechanical and Non-Destructive Study of CFRP Adhesive Bonds Subjected to Pre-Bond Thermal Treatment and De-Icing Fluid Contamination. Aerospace 2018, 5, 36. [Google Scholar] [CrossRef] [Green Version]
  17. Díaz Valdés, S.H.; Soutis, C. A structural health monitoring system for laminated composites. In Proceedings of the International Design Engineering Technical Conferences and Computers and Information in Engineering Conference, Pittsburgh, PN, USA, 9–12 September 2001; pp. 2013–2021. [Google Scholar]
  18. Su, Z.; Ye, L.; Lu, Y. Guided Lamb waves for identification of damage in composite structures: A review. J. Sound Vib. 2006, 295, 753–780. [Google Scholar] [CrossRef]
  19. Zhang, H.; Peng, L.; Zhang, H.; Zhang, T.; Zhu, Q. Phased array ultrasonic inspection and automated identification of wrinkles in laminated composites. Compos. Struct. 2022, 300, 116170. [Google Scholar] [CrossRef]
  20. Smith, R.A.; Nelson, L.J.; Mienczakowski, M.J.; Wilcox, P.D. Ultrasonic tracking of ply drops in composite laminates. In AIP Conference Proceedings; AIP Publishing LLC.: Melville, NY, USA, 2016; p. 050006. [Google Scholar]
  21. Smith, R.A.; Nelson, L.J.; Mienczakowski, M.J.; Wilcox, P.D. Ultrasonic Analytic-Signal Responses From Polymer-Matrix Composite Laminates. IEEE Trans. Ultrason. Ferroelectr. Freq. Control. 2018, 65, 231–243. [Google Scholar] [CrossRef] [Green Version]
  22. Yang, X.; Verboven, E.; Ju, B.-f.; Kersemans, M. Comparative study of ultrasonic techniques for reconstructing the multilayer structure of composites. NDT E Int. 2021, 121, 102460. [Google Scholar] [CrossRef]
  23. Fernández-López, A.; Larrañaga-Valsero, B.; Guemes, A. Wrinkle detection with ultrasonic phased array technology. In Proceedings of the 6th International Symposium on NDT in Aerospace, Madrid, Spain, 12–14 November 2014; Department of Aeronautics, Polytechnic University of Madrid (UPM): Madrid, Spain, 2014. [Google Scholar]
  24. Pain, D.; Drinkwater, B.W. Detection of Fibre Waviness Using Ultrasonic Array Scattering Data. J. Nondestruct. Eval. 2013, 32, 215–227. [Google Scholar] [CrossRef]
  25. Xie, N.; Smith, R.A.; Mukhopadhyay, S.; Hallett, S.R. A numerical study on the influence of composite wrinkle defect geometry on compressive strength. Mater. Des. 2018, 140, 7–20. [Google Scholar] [CrossRef]
  26. Lin, L.; Cao, H.; Luo, Z. Total focusing method imaging of multidirectional CFRP laminate with model-based time delay correction. NDT E Int. 2018, 97, 51–58. [Google Scholar] [CrossRef]
  27. Larrañaga-Valsero, B.; Smith, R.A.; Boumda, R.T.; Fernández-López, A.; Güemes, A. Wrinkle characterisation from ultrasonic scans of composites. In Proceedings of the 55th Annual Conference of the British Institute of Non-Destructive Testing, NDT 2016, Nottingham, UK, 12–14 September 2016; pp. 508–521. [Google Scholar]
  28. Zhang, H.; Ren, Y.; Song, J.; Zhu, Q.; Ma, X. The wavenumber imaging of fiber waviness in hybrid glass–carbon fiber reinforced polymer composite plates. J. Compos. Mater. 2021, 55, 4633–4643. [Google Scholar] [CrossRef]
  29. Hunter, A.J.; Drinkwater, B.W.; Wilcox, P.D. The wavenumber algorithm for full-matrix imaging using an ultrasonic array. IEEE Trans. Ultrason. Ferroelectr. Freq. Control 2008, 55, 2450–2462. [Google Scholar] [CrossRef] [PubMed]
  30. Oppenheim, A.V.; Schafer, R.W. Discrete-Time Signal Processing; Pearson: London, UK, 2010. [Google Scholar]
  31. Holmes, C.; Drinkwater, B.W.; Wilcox, P.D. Post-processing of the full matrix of ultrasonic transmit–receive array data for non-destructive evaluation. NDT E Int. 2005, 38, 701–711. [Google Scholar] [CrossRef]
  32. Luo, Z.; Zhang, S.; Jin, S.; Liu, Z.; Lin, L. Heterogeneous ultrasonic time-of-flight distribution in multidirectional CFRP corner and its implementation into total focusing method imaging. Compos. Struct. 2022, 294, 115789. [Google Scholar] [CrossRef]
  33. Boashash, B. Time-Frequency Signal Analysis and Processing: A Comprehensive Reference; Academic Press: Cambridge, MA, USA, 2015. [Google Scholar]
  34. Durak, L.; Arikan, O. Short-time Fourier transform: Two fundamental properties and an optimal implementation. IEEE Trans. Signal Process. 2003, 51, 1231–1242. [Google Scholar] [CrossRef]
  35. Filip, S.-I. A robust and scalable implementation of the Parks-McClellan algorithm for designing FIR filters. ACM Trans. Math. Softw. (TOMS) 2016, 43, 1–24. [Google Scholar] [CrossRef]
  36. Smith, R.A. Use of 3D Ultrasound Data Sets to Map the Localised Properties of Fibre-Reinforced Composites. Ph.D. Thesis, University of Nottingham, Nottingham, UK, 2010. [Google Scholar]
Figure 1. (a) A cross-section micrograph of the wrinkle sample; (b) a shortened length image to highlight the wrinkle defect; (c) partially enlarged images of voids.
Aerospace 10 00181 g001
Figure 2. (a) Experimental system and (b) the system sketch used to acquire datasets under FMC mode.
Aerospace 10 00181 g002
Figure 3. (a) Signals with the 32nd element firing and all 64 elements receiving, and (b) the partial signals related to the CFRP sample; (c) signals with the 1st element firing and all 64 elements receiving, and (d) the partial signals related to the CFRP sample.
Aerospace 10 00181 g003
Figure 4. Spectrograms of the sample-related signals. Note: the signal with the ith element firing and the jth element receiving is expressed as the (i, j) signal for short, and the symbol (i, j) is labeled in the top right-hand corner of each spectrogram.
Aerospace 10 00181 g004
Figure 5. The magnitude and phase responses of the designed filter.
Aerospace 10 00181 g005
Figure 6. The comparison between the raw and the corrected filtered A-scans of the (a) (1,1) and (b) (1,16) signals.
Aerospace 10 00181 g006
Figure 7. Spectrograms of the (1,1) and (1,16) filtered signals.
Aerospace 10 00181 g007
Figure 8. (a) The TFM and (b) its related instantaneous phase images of the unfiltered signals; (c) the TFM and (d) its related instantaneous phase images of the filtered signals.
Aerospace 10 00181 g008
Figure 9. The comparison between the unfiltered and the filtered results.
Aerospace 10 00181 g009
Figure 10. The TFM instantaneous phase results filtered by the (a) 8 MHz, (b) 4 MHz, (c) 2 MHz, and (d) 1 MHz bandwidth linear phase filters.
Aerospace 10 00181 g010
Figure 11. The comparison between the unfiltered and the filtered results.
Aerospace 10 00181 g011
Figure 12. (a) The overlaid view of peaks (ϕ = π/2) from the 2 MHz bandwidth linear phase filter, and (b) its shortened length image.
Aerospace 10 00181 g012
Table 1. The main features of the used flat wedge.
LengthWidthHeightUltrasonic Velocity
65 mm40 mm20 mm2337 m/s
Table 2. The parameters of FIR filters with different bandwidths.
Filter NamePassband
Frequencies
Stopband
Frequencies
Filter
Bandwidth
a5 MHz~13 MHz4.56 MHz~13.44 MHz8 MHz
b7 MHz~11 MHz6.78 MHz~11.22 MHz4 MHz
c8 MHz~10 MHz7.89 MHz~10.11 MHz2 MHz
d8.5 MHz~9.5MHz8.45 MHz~9.55 MHz1 MHz
Disclaimer/Publisher’s Note: The statements, opinions and data contained in all publications are solely those of the individual author(s) and contributor(s) and not of MDPI and/or the editor(s). MDPI and/or the editor(s) disclaim responsibility for any injury to people or property resulting from any ideas, methods, instructions or products referred to in the content.

