Article

Determination of the Parachute Harness Critical Load Based on Load Distribution into Individual Straps with Respect of the Skydiver’s Body Position

Institute of Aerospace Engineering, Brno University of Technology, 60190 Brno, Czech Republic
*
Authors to whom correspondence should be addressed.
Aerospace 2023, 10(1), 83; https://doi.org/10.3390/aerospace10010083
Submission received: 22 November 2022 / Revised: 5 January 2023 / Accepted: 11 January 2023 / Published: 14 January 2023

Abstract

:
This article evaluates the redistribution of forces to the parachute harness during an opening shock load and also defines the ultimate limit load of the personal parachute harness by specifying the weakest construction element and its load capacity. The primary goal of this research was not only to detect the critical elements but also to gain an understanding of the force redistribution at various load levels, which could represent changes in body mass or aerodynamic properties of the parachute during the opening phase. To capture all the phenomena of the parachutist’s body deceleration, this study also includes loading the body out of the steady descending position and asymmetrical cases. Thus, the result represents not only idealized loading but also realistic limit cases, such as asymmetric canopy inflation or system activation when the skydiver is in a non-standard position. The results revealed a significant difference in the strength utilization of the individual components. Specifically, the back webbing was found to carry a fractional load compared to the other webbing used in the design in most of the scenarios tested. Reaching the maximum allowable strength was first achieved in the asymmetric load test case, where the total force would be equal to the value of 7.963 kN, which corresponds to the maximum permissible strength of the carabiner on the measuring element three. In the same test case, the second weakest point would reach the limiting load force when the entire harness is loaded with 67.89 kN. This information and the subsequent analysis of the individual nodes provide a great opportunity for further strength and weight optimization of the design, without reducing the load capacity of the harness as a system. The findings of this study will be used for further testing and possible harness robustness optimization for both military and sport parachuting.

1. Introduction

In order to follow the modern trend of using lightweight materials and optimized product design, it is necessary to focus on the individual construction elements and dimension them exactly according to the expected requirements. Nowadays, proven designs of parachute harnesses are commonly used, which do not differ greatly in the materials and construction elements used. [1]. The effective sizing of individual elements is only possible when detailed information about their loading is available. This is the aim of this research, which in principle, can be divided into three main stages. The first stage is to obtain the opening shock force, which characterizes the aerodynamic parameters of the canopy. This force is then applied to the harness worn by a dummy fixed in different positions. The final stage is to identify the decomposition of this total force into the individual structural elements. This information is then used for evaluating the load capacity of the elements and to gain insight into the possibility of subsequent optimization of the structure. In the results section of this research, it is shown that the safety margins of the separate construction elements differ significantly. This suggests a unification of the safety coefficients of the individual components when the maximum required load is reached. The outcome would be a lighter overall structure. However, the intention is not just to analyze the case for one specific loading force representing a particular canopy during its opening shock load test. The objective is to obtain a percentage value of the total force that will be transmitted to each node and to prove or disprove that this redistribution is constant over a certain range of loading. Expressing this dependence would imply the possibility of applying the presented results without restriction on the magnitude of the total force, in other words, for arbitrarily chosen canopies and activation parameters.
Nowadays, structural overload tests, which include the entire sequence of canopy activation, are considered standard [2,3]. The procedure is performed based on the Technical Standard 135 published by the Parachute Industry Association (PIA) [4]. These types of tests evaluate whether a harness shows signs of mechanical damage after activation under specific conditions. Capture 4.3.6, named “Structural Overload Tests”, defines the general conditions for a drop test that the complete parachute assembly or separate components must withstand. This approach has a major disadvantage for the proposed force redistribution analysis, since dropping a dummy from an airplane or helicopter does not guarantee an exact position when the rescue system is activated. As will be shown in the results section of this document, not only does the opening shock load play a major role but also the direction of it does. In fact, the proposed test methodology is a combination of dynamic and static tests that are primarily used for the certification of paragliding harnesses and work at heights for safety harnesses [5,6,7]. They have a common main feature, namely, the fact that both force and position conditions are precisely defined.
The possibility to divide the parachute assembly test into separate tests of individual components allows one to obtain the dynamic opening force of the canopy first, and then apply this force to the harness as a static load. This makes it possible to position the dummy in the different setups and evaluate the required influence of the skydiver’s body position, asymmetry during parachute activation, and the tightening or loosening of each strap.
To achieve the above goals, the following tasks were completed. The first step was the development of the drop test laboratory and methodology. The most important factor was reaching the activation speed exactly according to the specification. This was achieved using a real-time measurement of the speed together with a backup timer. Data logging of the forces in the connection between the parachute and ballast is performed at a frequency of 200 Hz. The opening force is recorded by measuring the carabiners, so it is possible to reach force on both attachment points. A similar logging of the force has been presented in this publication [8].
The next challenging step was to measure the force in flexible straps. Few studies have focused on the measuring tension in flexible structures, such as parachute fabric, but for the purpose of the proposed aim, this could not be used [9,10,11]. The requirement for strain gauges developed, especially for the purpose of this research, was that they be versatile enough to be used regardless of the exact type of strap on with which they were installed. The second important goal was to minimize the influence of structural rigidity. Preferably, the measuring components were made of parts from which the harness itself is assembled. The main advantage of this research is that it provides a very detailed analysis of the distribution of forces in the individual parts of the harness. By achieving dimensionally small load cells, it was possible to install the strain gauges in all the necessary places so that a load from the individual nodes was captured during one harness load cycle. In order to obtain comprehensive data, the different dummy positions that may occur when the rescue system is activated were also investigated.
Information about the forces in the individual parts of the harness gives the possibility to analyze the dimensioning of each part according to the required load. Thus, by evaluating the data, it was possible to identify the critical elements for different dummy configurations and harness settings. Subsequently, identifying non-uniformity in the sizing of the individual elements based on their actual loading is also very important information. The outcome is, therefore, a vision of significant weight savings without affecting the load capacity of the whole system, once the above results are incorporated into the design of the new version.

2. Materials and Methods

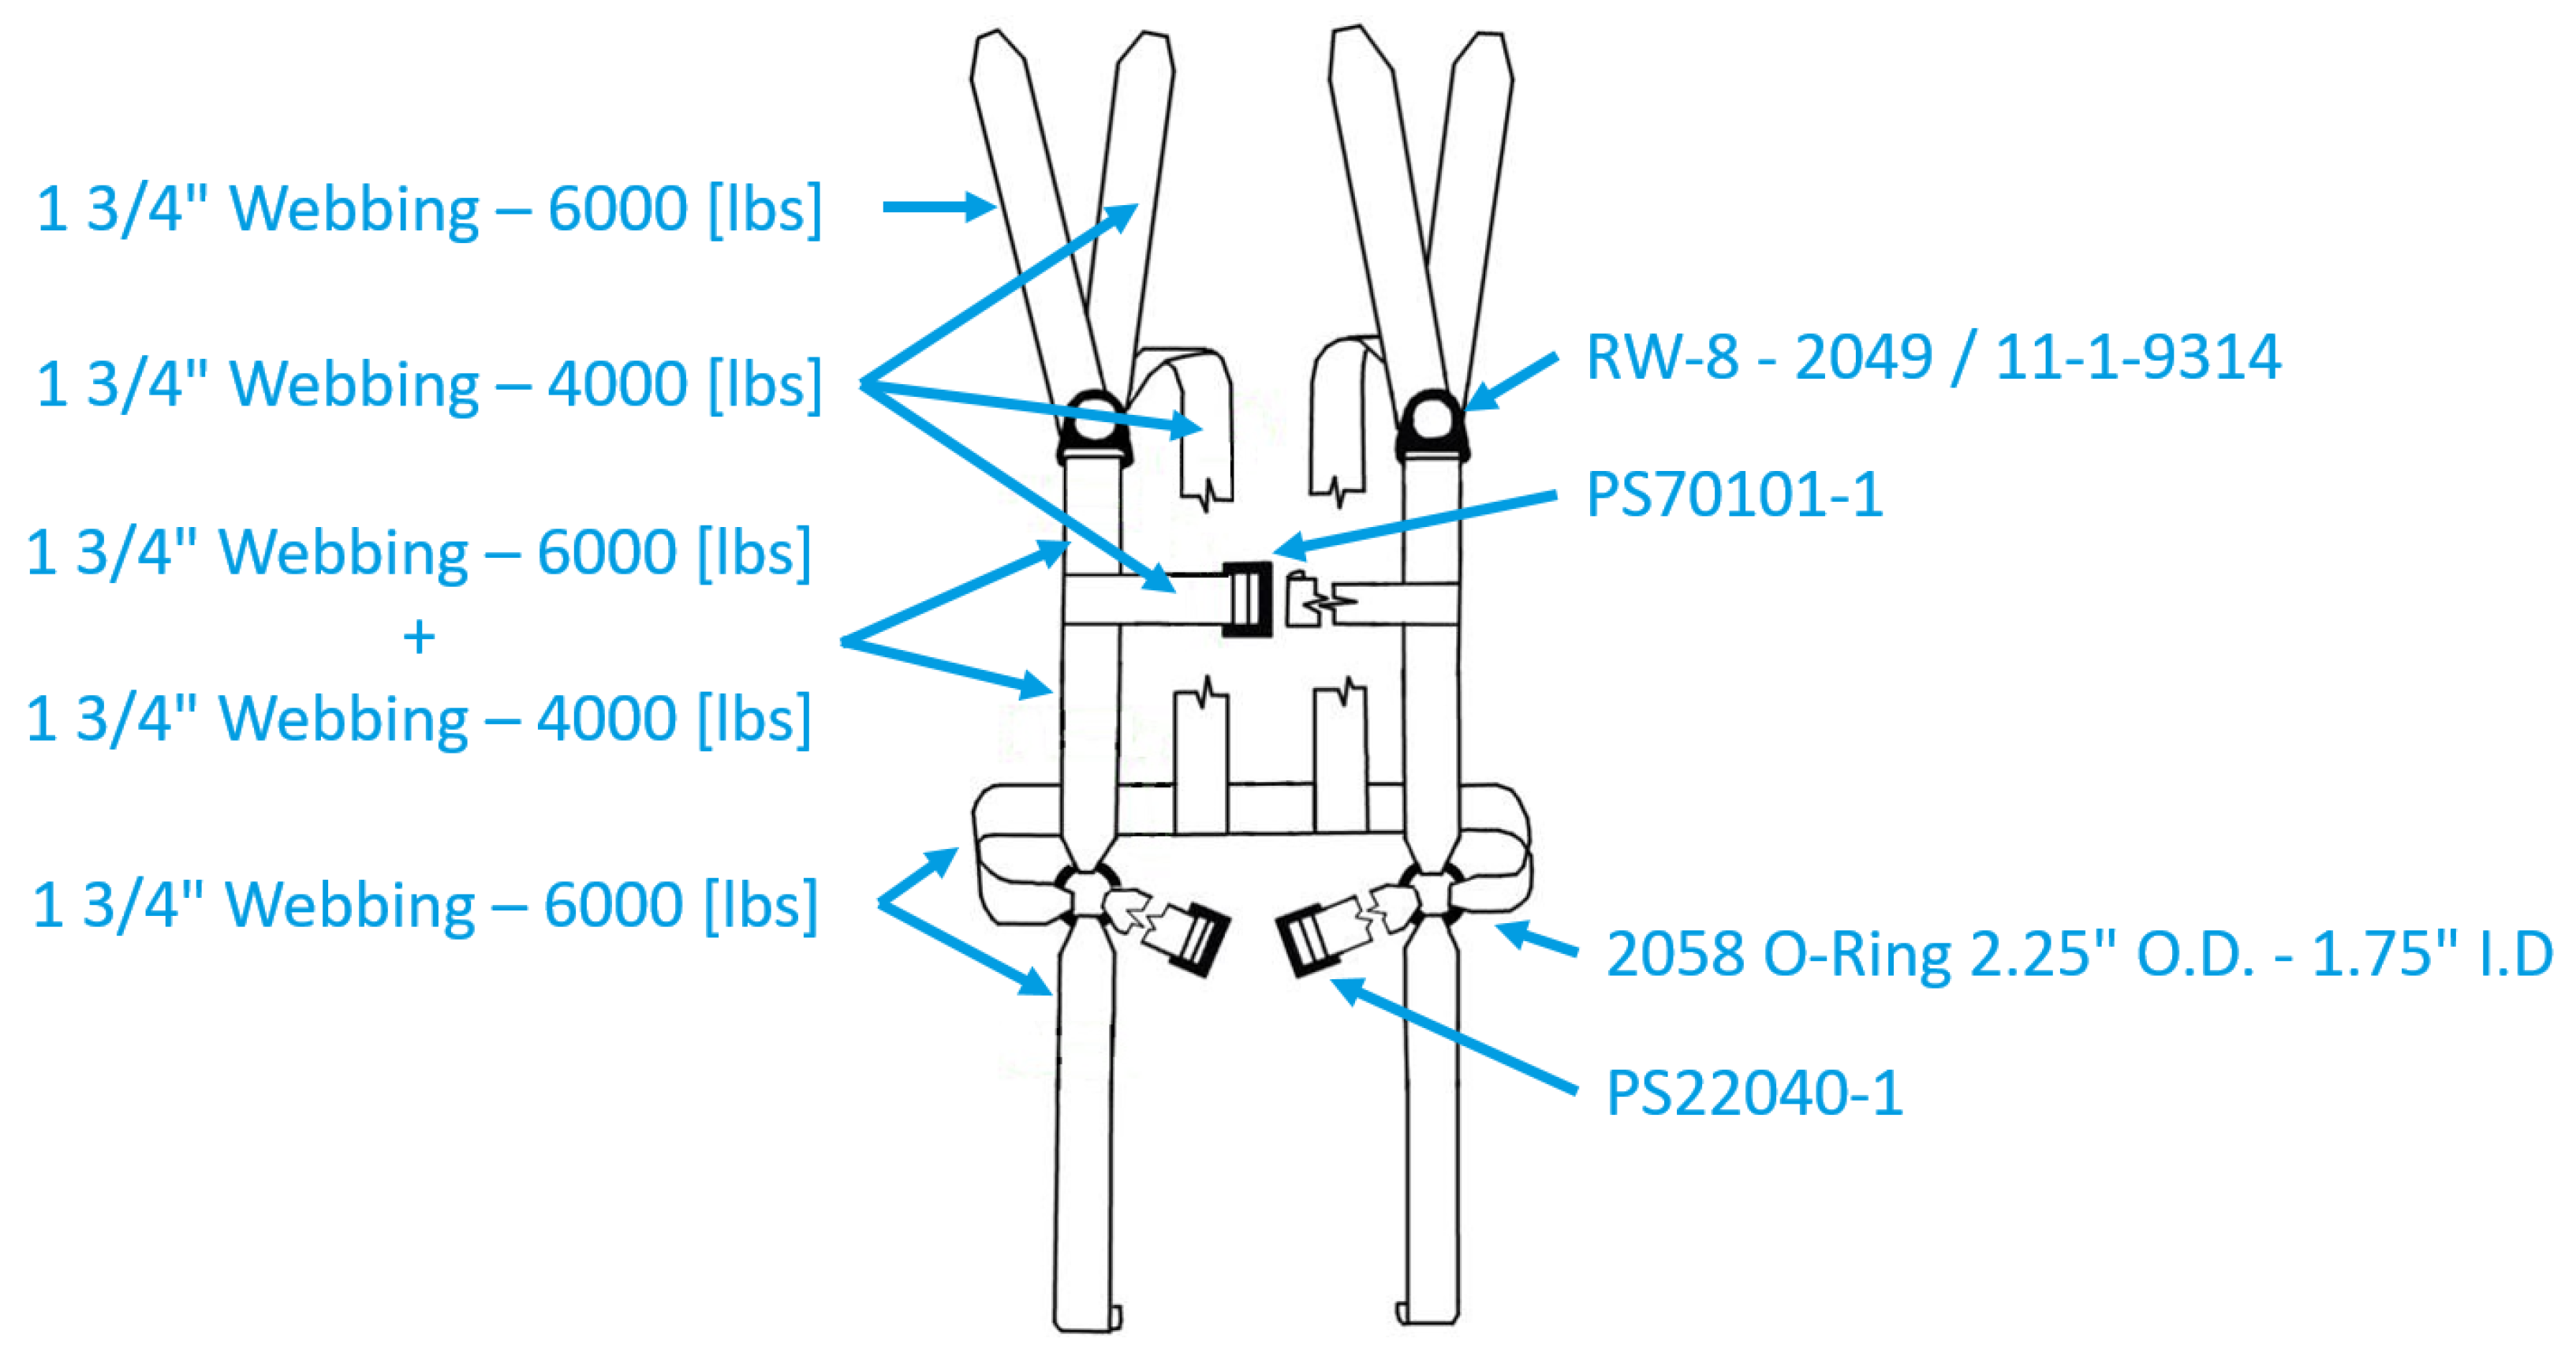
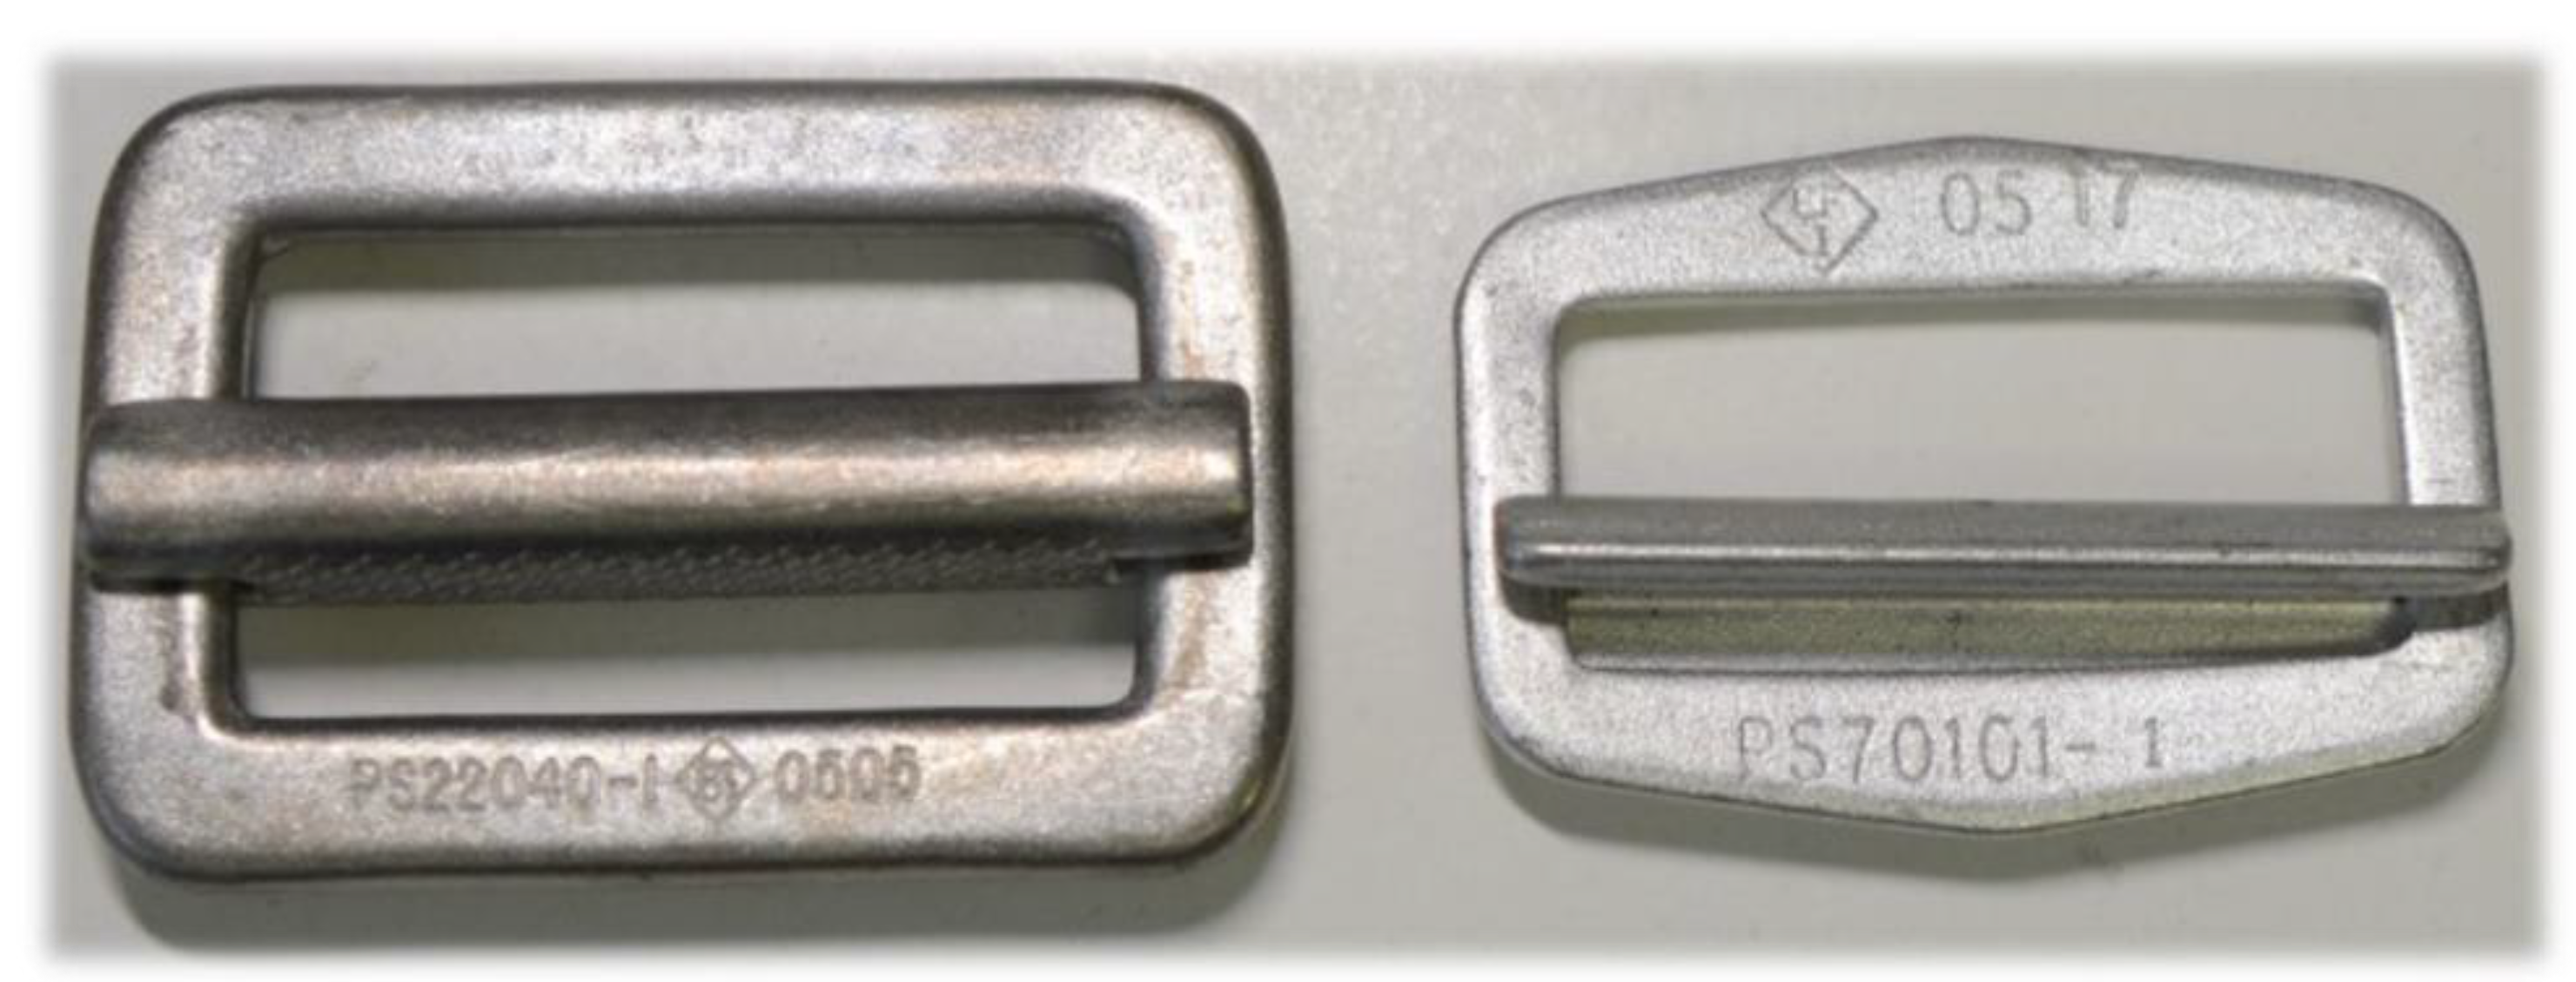
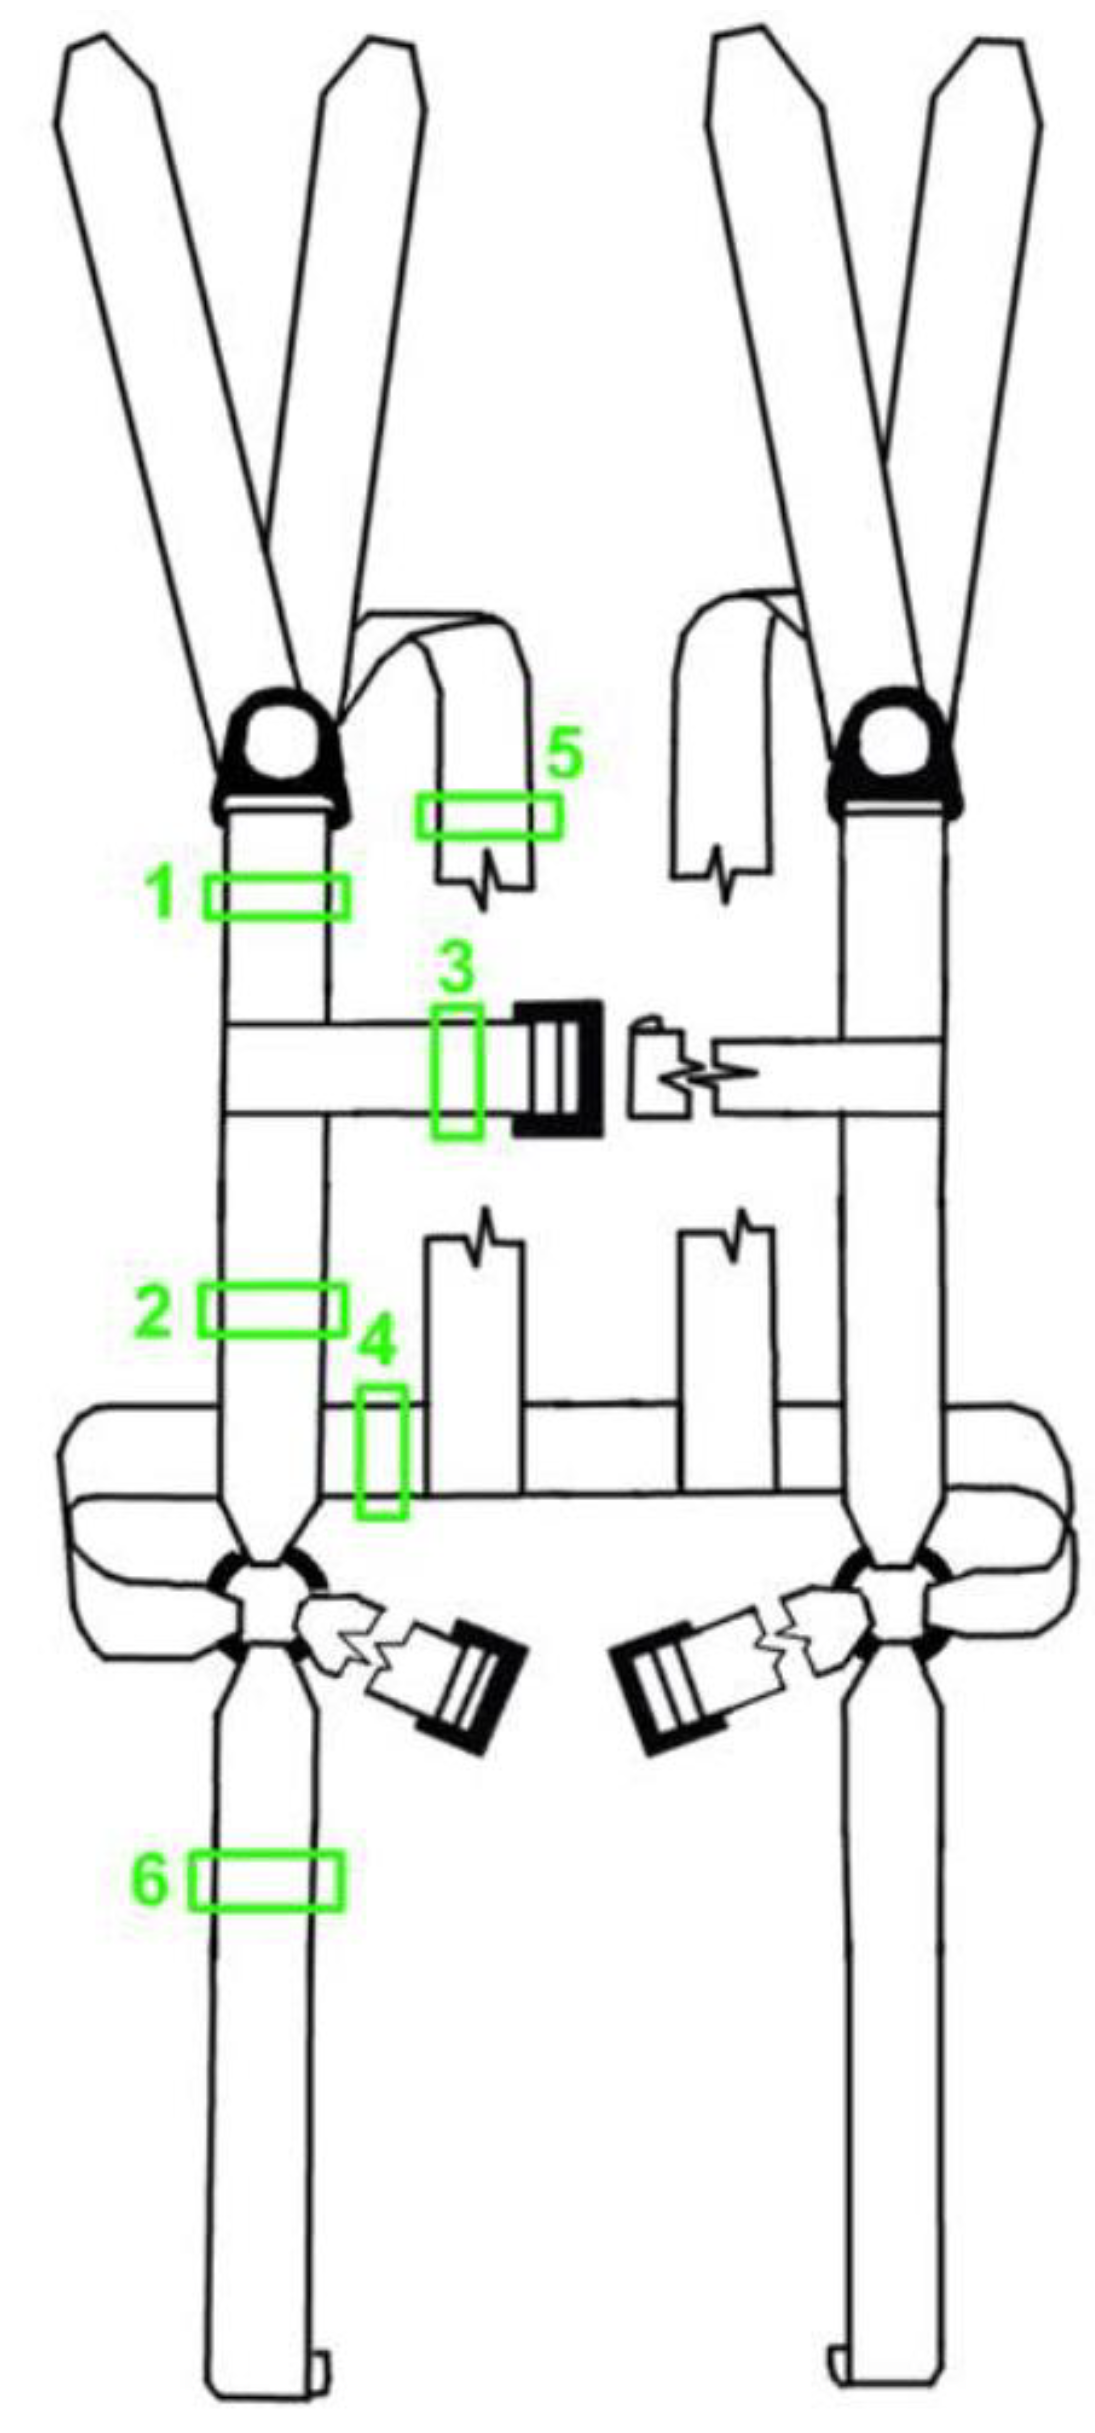
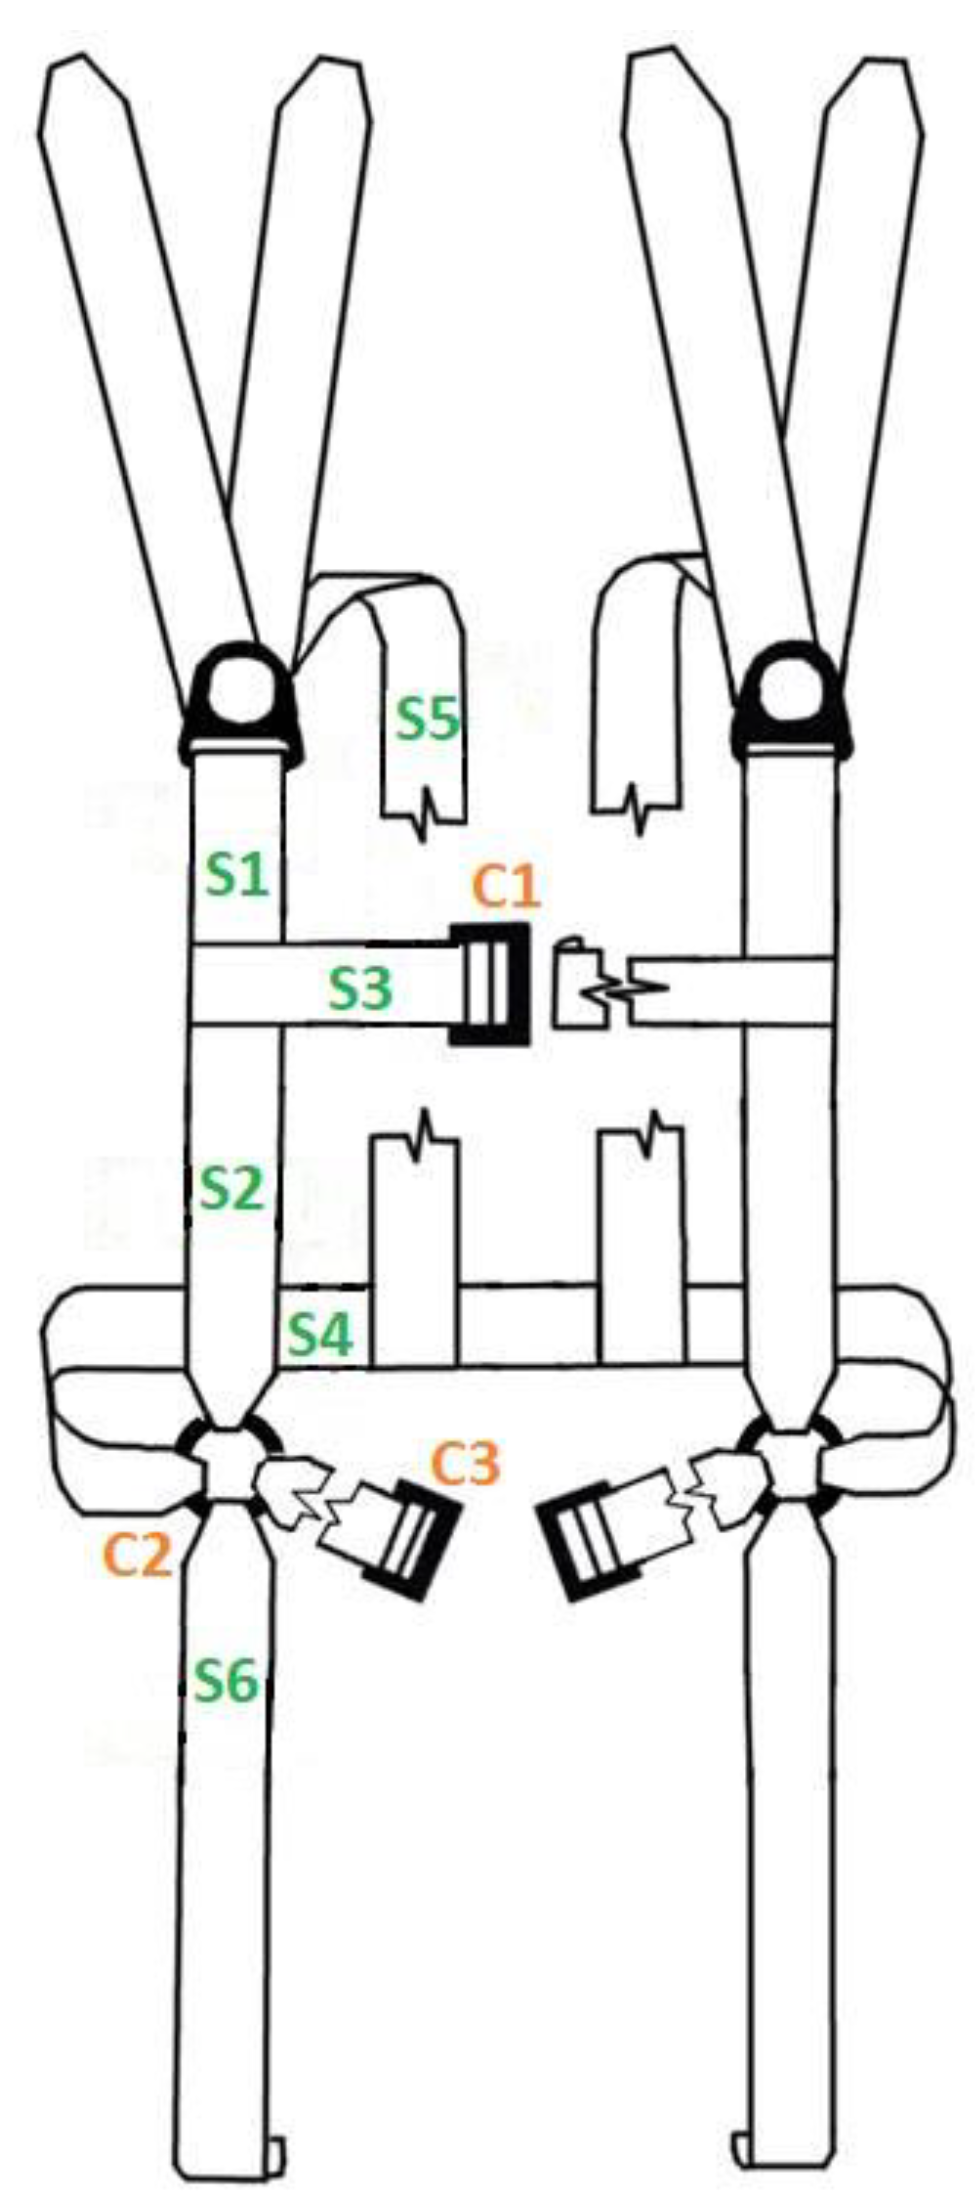
2.1. Design of the Tested Harness

For the purpose of the test, a fully articulated harness from serial production has been chosen. However, all non-load-bearing elements that increase pilot comfort were intentionally removed. The aim was to extract only the structural frame to obtain more variability in the positioning of the measuring elements. Because the removed elements do not affect the strength of the harness, similarity to a fully equipped harness intended for real use is guaranteed. The complete scheme of used materials is highlighted in Figure 1.
Straps of the same width were used for the entire harness. The only differences are in their declared strengths. Regarding the buckles, the exact types are also shown. The names stated in Figure 1 are the trade names of the buckles. It is therefore possible to trace their exact parameters, which will be discussed further in the following section.

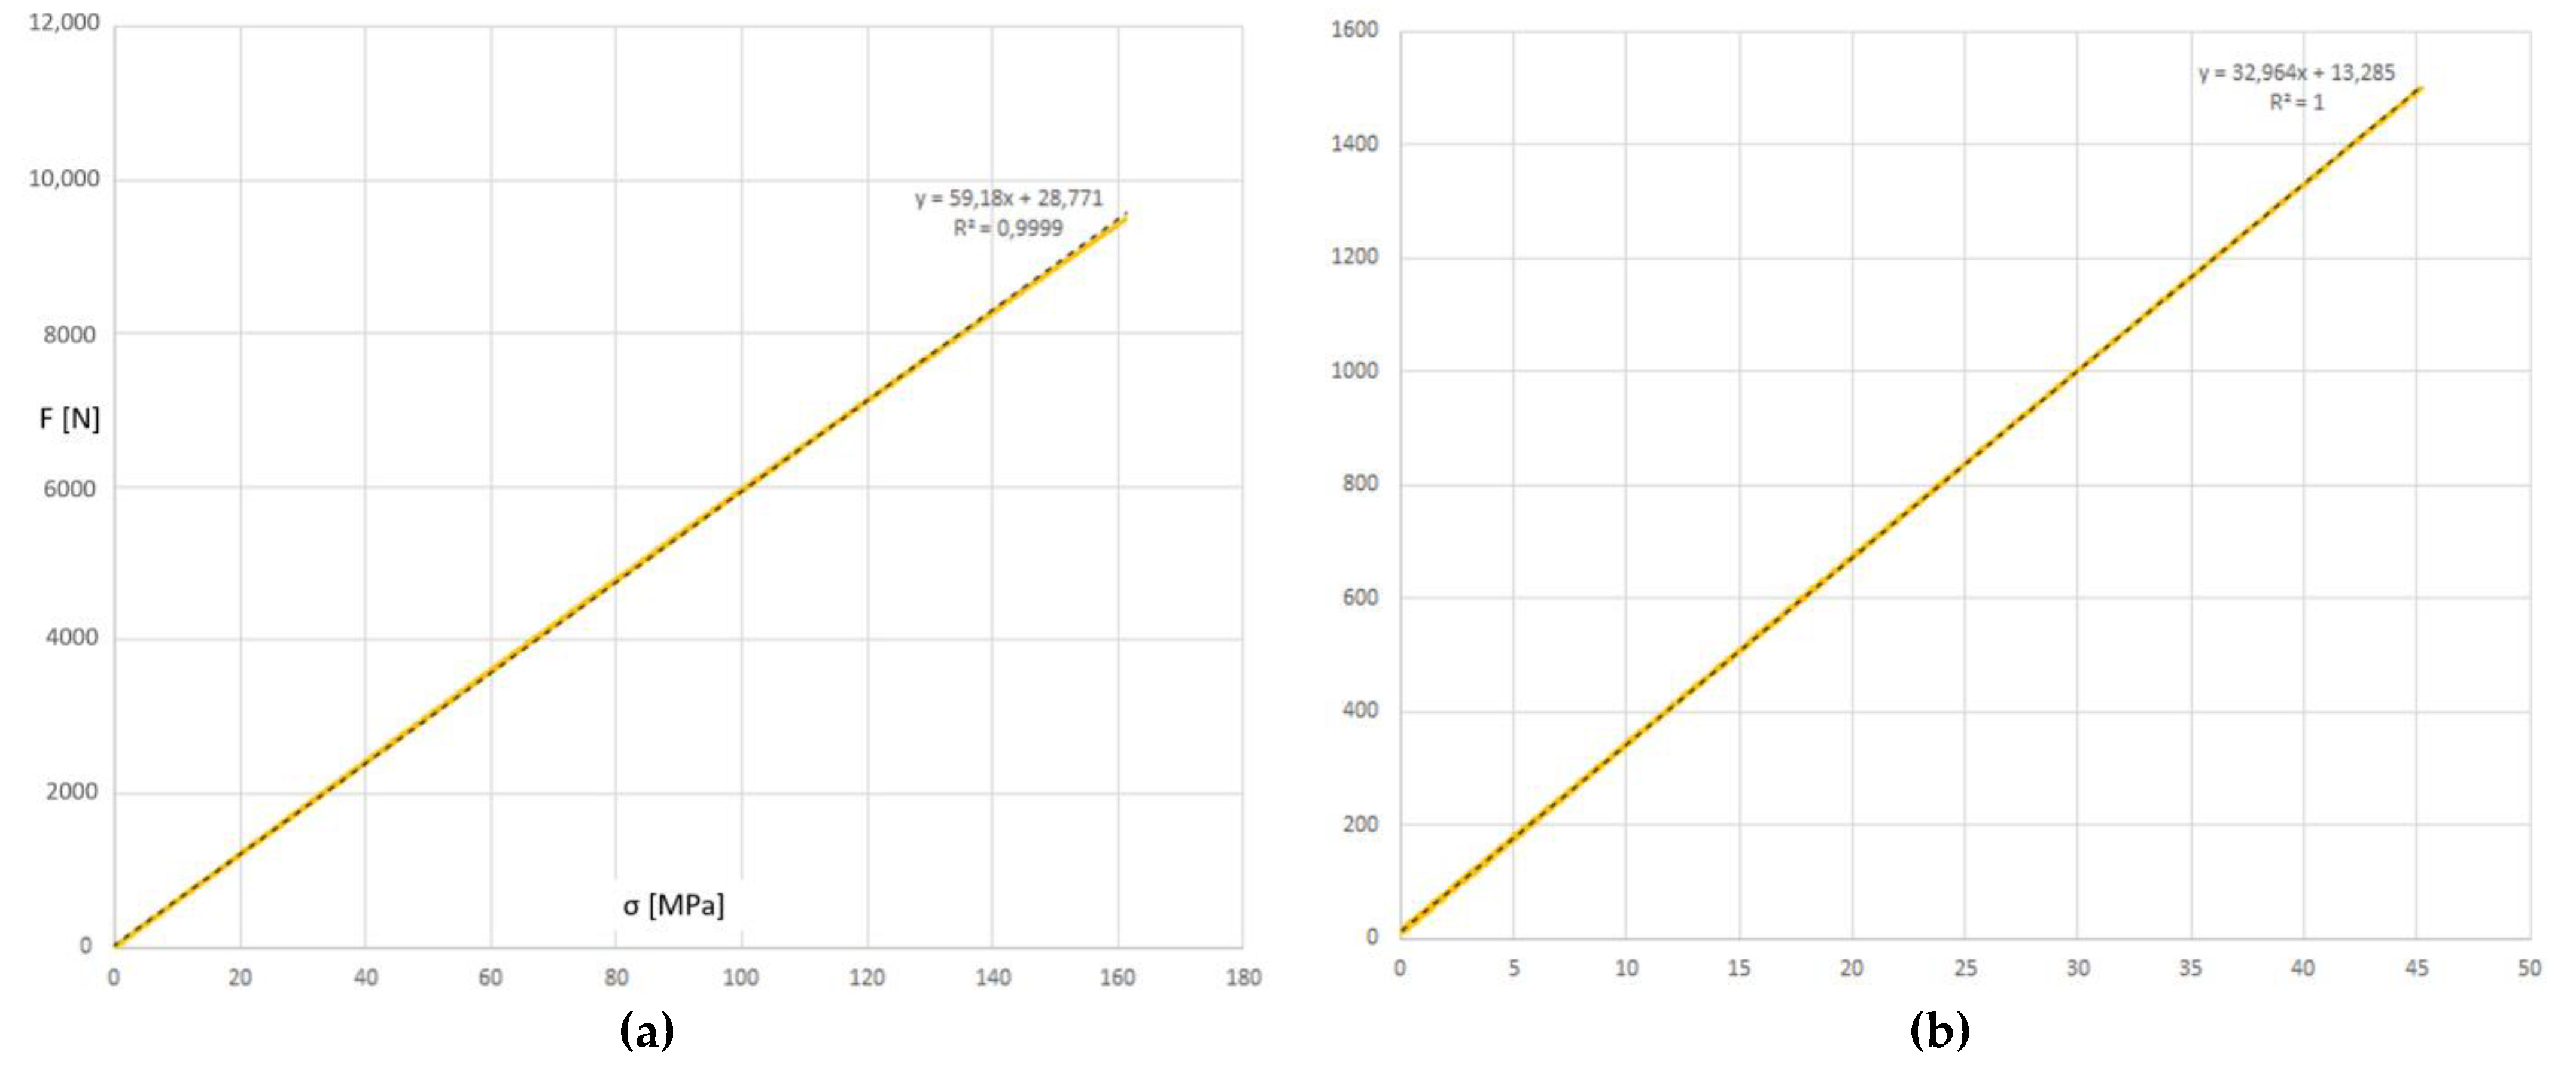
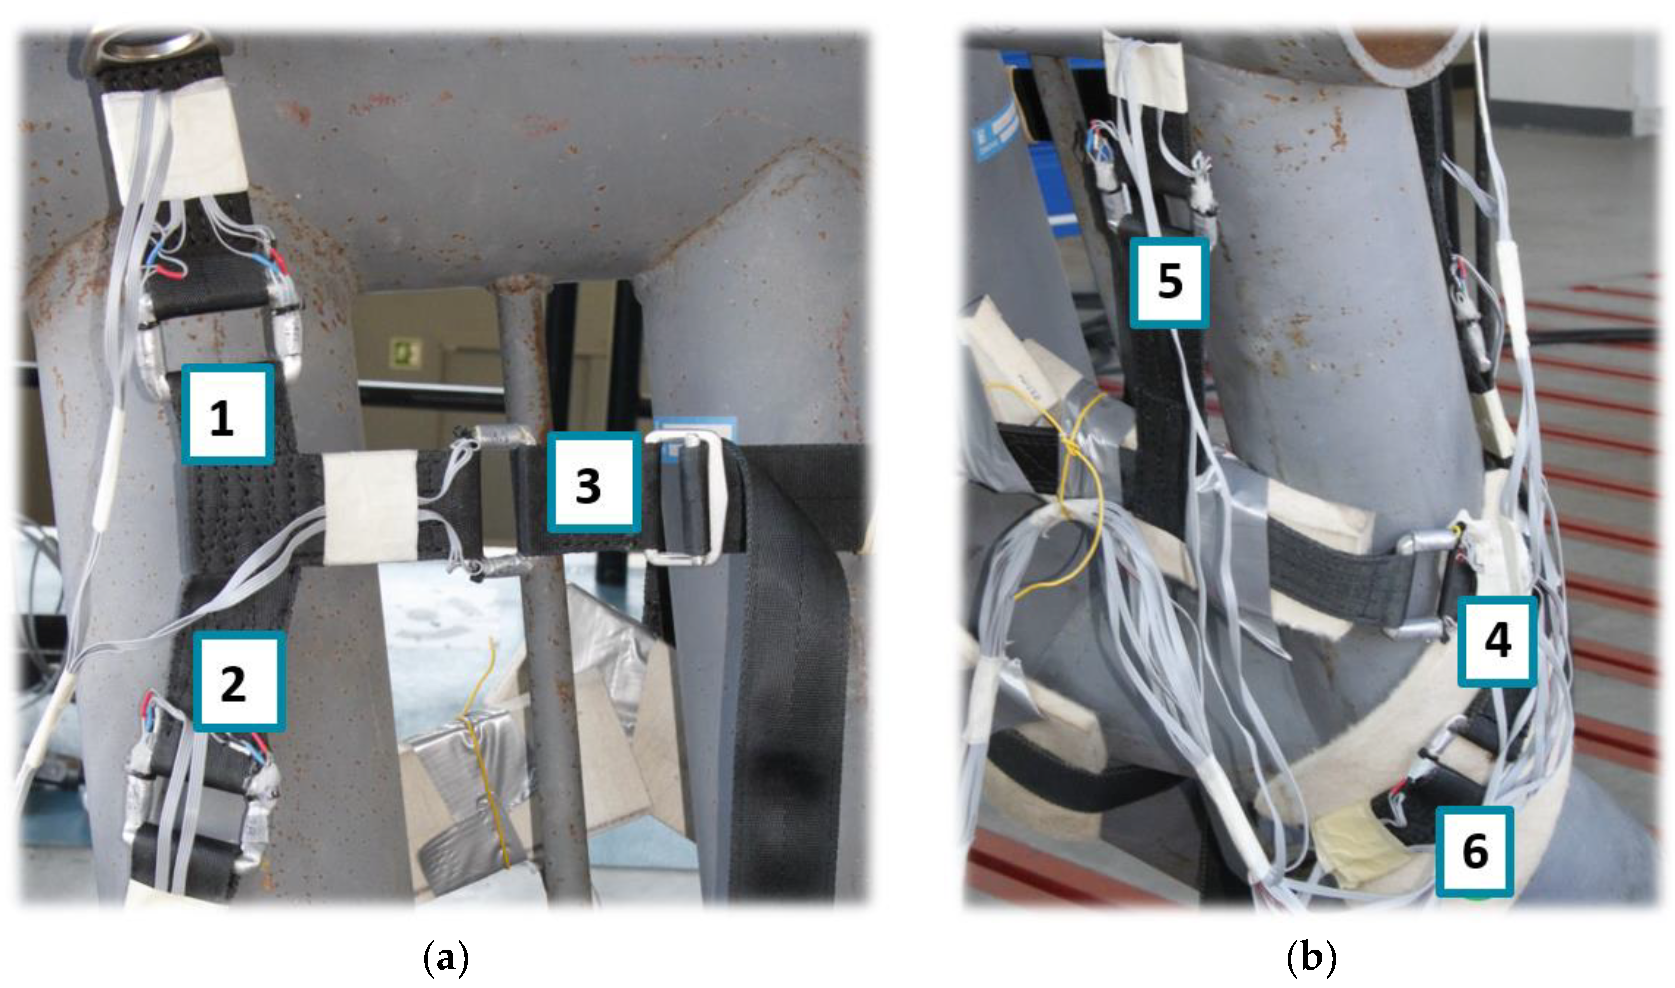
2.2. Equipment for Measuring Forces in Webbing

Measuring the forces in a flexible structure, such as parachute webbing, is a very specific issue. The main reason is that straps in the final configuration are not uniformly loaded in most cases. It is necessary to consider, for example, the partial loading of the sides of the strap due to the seating around the dummy’s body. Hence, there was a need to develop a custom measuring element. The major request was also to use elements with minimum dimensions to have the possibility of implementing them into each webbing. The minimum dimensions of the feature also ensured the smallest possible influence on the harness’ structural characteristics. In addition, the aim was to eliminate any undesirable loads, for example, from bending. When selecting the positions for the load cells, consideration was given to placing them in positions where only tension could be expected, and the bending component was eliminated as much as possible.
Regarding the design of the load cells, modification of the buckle frames was determined to be the most appropriate and least costly option. The aim was to ensure that the stiffness of the structural node was not adversely affected by the incorporation of the individual measuring components. Therefore, the same carabiners were always selected for the design of the strain gauges as those already used in the design chain. For the purpose of this study, only two types of buckle bases were required. The stronger type is a carabiner with the trademark PS 22040-1 and a declared strength of 2500 lbs, while the weaker type is for use in chest webbing and has a declared strength of 500 lbs. Figure 2 shows the initial geometry of the buckles used before any modifications. Figure 2 highlights the initial geometry of the used buckles before any modification. To obtain the basic frame for strain gauge installation, it was necessary to remove the moving part used to fix the strap in the tightened position.
Once a clear rectangular base plate was prepared, four strain gauges were installed on the degreased surface, one on each side of the buckle. The intention was to reach a full bridge connection that will ensure accurate measurement of the force, regardless of whether the buckle is loaded symmetrically or not. This assumption has been confirmed during the calibration, which has been performed for all six load cells. In the procedure, the carabiners were loaded evenly and unevenly, in the sense that one side of the carabiner was loaded more than the other. This process verified that the total measured force did not vary from case to case. Repeating the above approach for each load cell separately guarantees accurate measurement of all elements, regardless of any manufacturing tolerances of the buckle or inaccurate placement of the strain gauge on its surface. The specific regression curves of these load cells are shown in Figure 3. The regression dependence is linear over the entire applied load range, and therefore, a very high accuracy of force measurement can be assumed. The dependence of the material tension on the total loading force generated by the tensile test machine is shown.
The final load cell implemented into the harness structure is highlighted in Figure 4. It was necessary to provide mechanical protection around the strain gauge against damage when the harness settles on the metal dummy. During the first moments of loading, significant movements occur. The area around the strain gauges was sealed with hot melted glue. This method of protection proved to be sufficient as no damage occurred during the test.

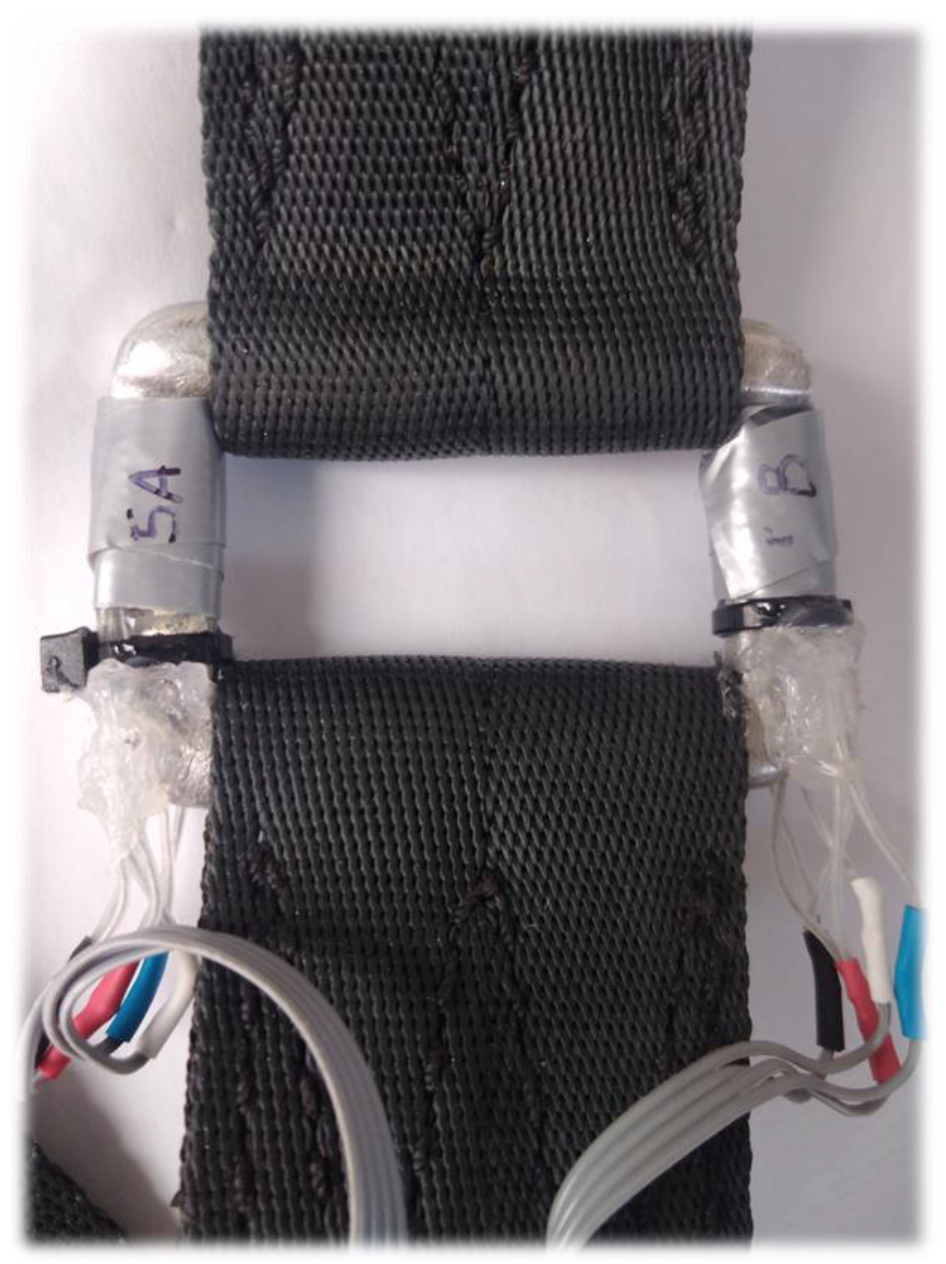
2.3. Design of the Harness Fitted with the Load Cells

When fitting the load cells to the harness, symmetry was utilized. Measurement elements were sewn only on the right side of the harness, so only six of them were needed. To obtain complete load decomposition into individual elements during the asymmetric load cases specified in the next section of the publication, it was only necessary to perform one additional test.
Despite the fact that it was proven during calibration that the laterally uneven loading of the measuring element does not affect the accuracy of the total read-out forces, it was the intention to place the elements only in locations where there would be only tensile loading without influence from bending. It can be expected that when placing the measuring element in a position where bending occurs, measurement inaccuracies will begin to appear. The main reason for this would be the contribution of friction in the contact with “dummy–webbing”. With this knowledge, the optimum position for each element has been found. The location of the load cells sewn into the harness structure is highlighted in Figure 5. The numbering of the elements given in the diagram matches the following naming of the forces in the evaluation of the results.

2.4. Fitting the Harness to the Test Dummy

Great care was taken in fitting the harness to the test dummy. The position of the individual structural points was set to fully correspond with the real position of the human body. To achieve this, the harness was specially adjusted in length for the real dimensions of the dummy. In the area of the legs and buttocks, the measuring devices were lined with felt sheets. This method eliminated bending of the strain gauges while also reducing friction. Detailed placement of the loading cells once the harness is fitted to the dummy is displayed in Figure 6. The numbering of individual load cells is also highlighted. Based on this marking, the redistribution of forces was subsequently evaluated, which is presented in the following sections.

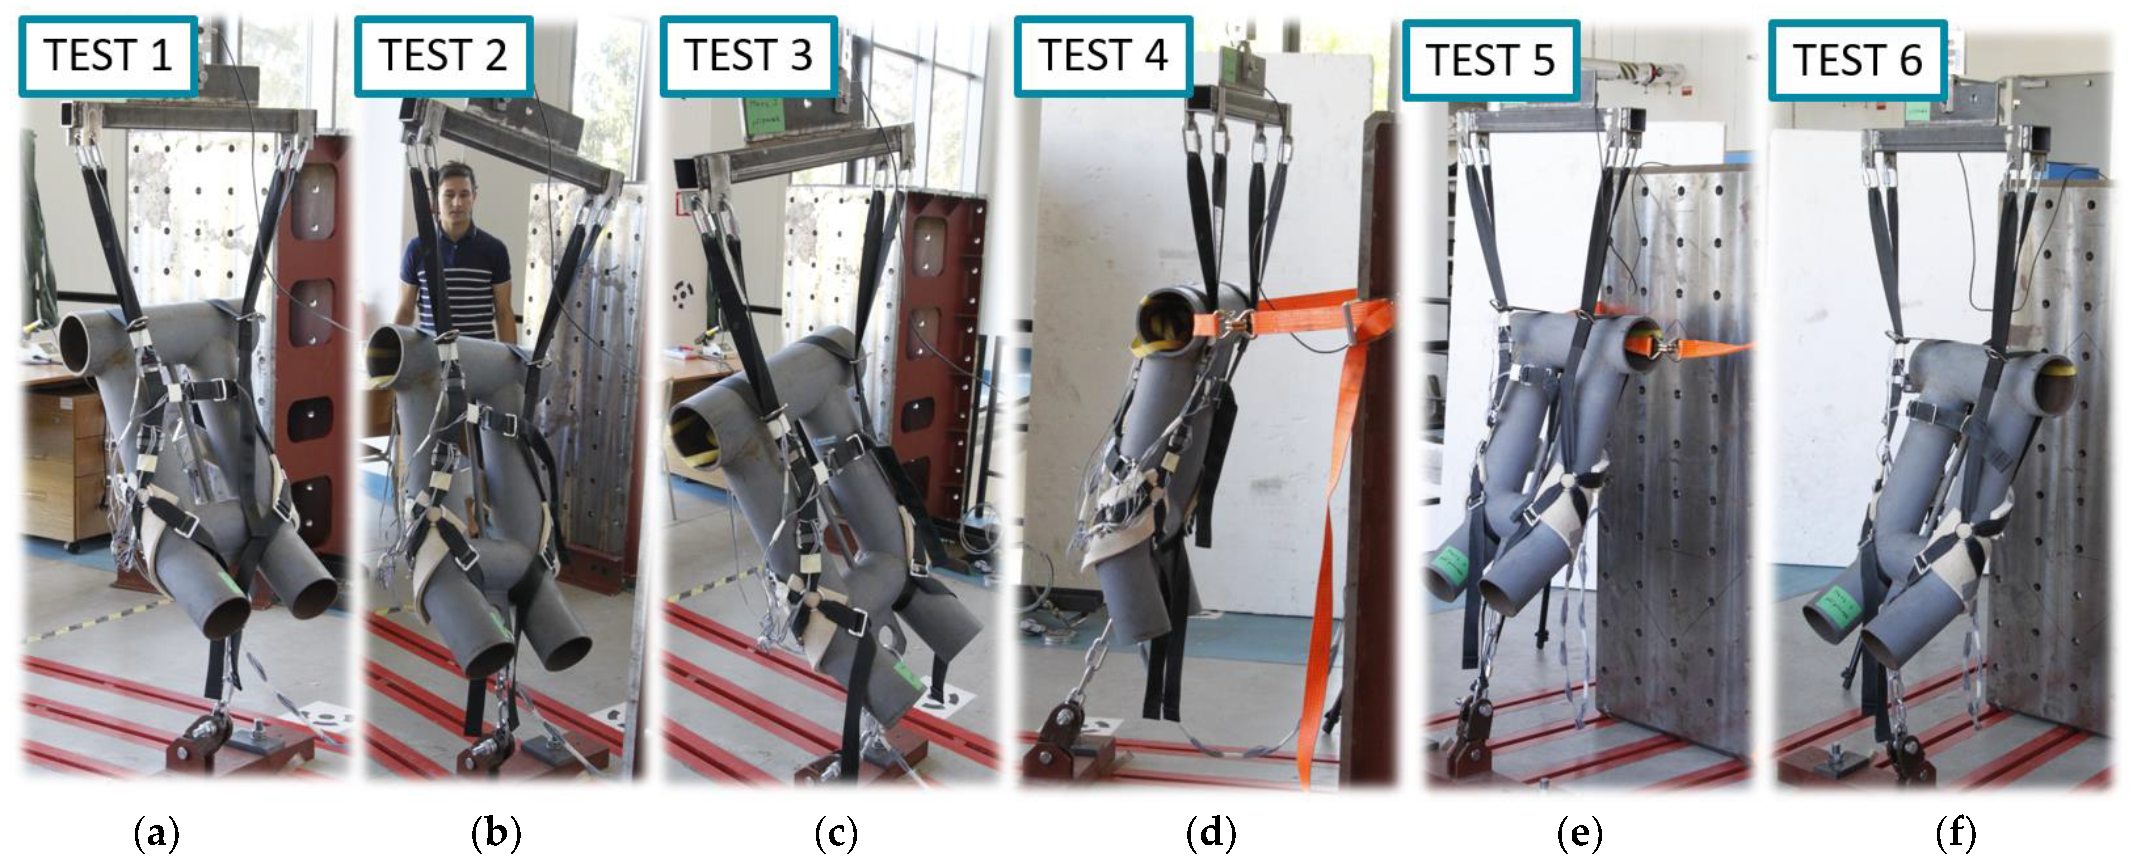
2.5. Tested Configurations

The number of test configurations and their setup were designed considering the parameters identified as important for the survey. The aim was to perform a series of tests in different spatial positions of the dummy so that it would then be possible to evaluate the effect of force redistribution on the individual elements, based not only on the geometry of the structure itself but also on the different spatial body positions in which the rescue system would be activated. This will replicate the use of emergency parachutes, which are assumed to be activated in positions other than those for ideal and stable skydivers. Another important objective was to determine the effect of chest strap tightening. Nevertheless, the main feature of all tests will be the evaluation of the critical element in terms of its structural capacity. In other words, the critical element may not be the same in all cases. Based on the mentioned requirements, six different test cases have been established:
  • Symmetrical load;
  • Unsymmetrical load–FRIGHT = 2 · FLEFT;
  • Unsymmetrical load–FLEFT =2 · FRIGHT;
  • Symmetrical load–dummy, fixed at about 15° face down;
  • Symmetrical load–dummy, fixed at about 15° back down;
  • Symmetrical load–loose chest strap.
The meaning of “symmetrical loading” is the fact that a force of the same magnitude is applied to the left and right sides of the harness. The opposite is the case for the second and third tests, as their aim is to obtain information on the redistribution of the forces in the case of opening the canopy asymmetrically. Regarding test cases 1, 2, 3, and 6, the steel dummy has only one fixation point in the bottom between its legs. The position of equilibrium is determined just by the center of gravity and by adjusting the individual straps. Tilted cases 4 and 5 have generally fixed positions in the space defined. The setup of the configurations in the unloaded state is shown in Figure 7.

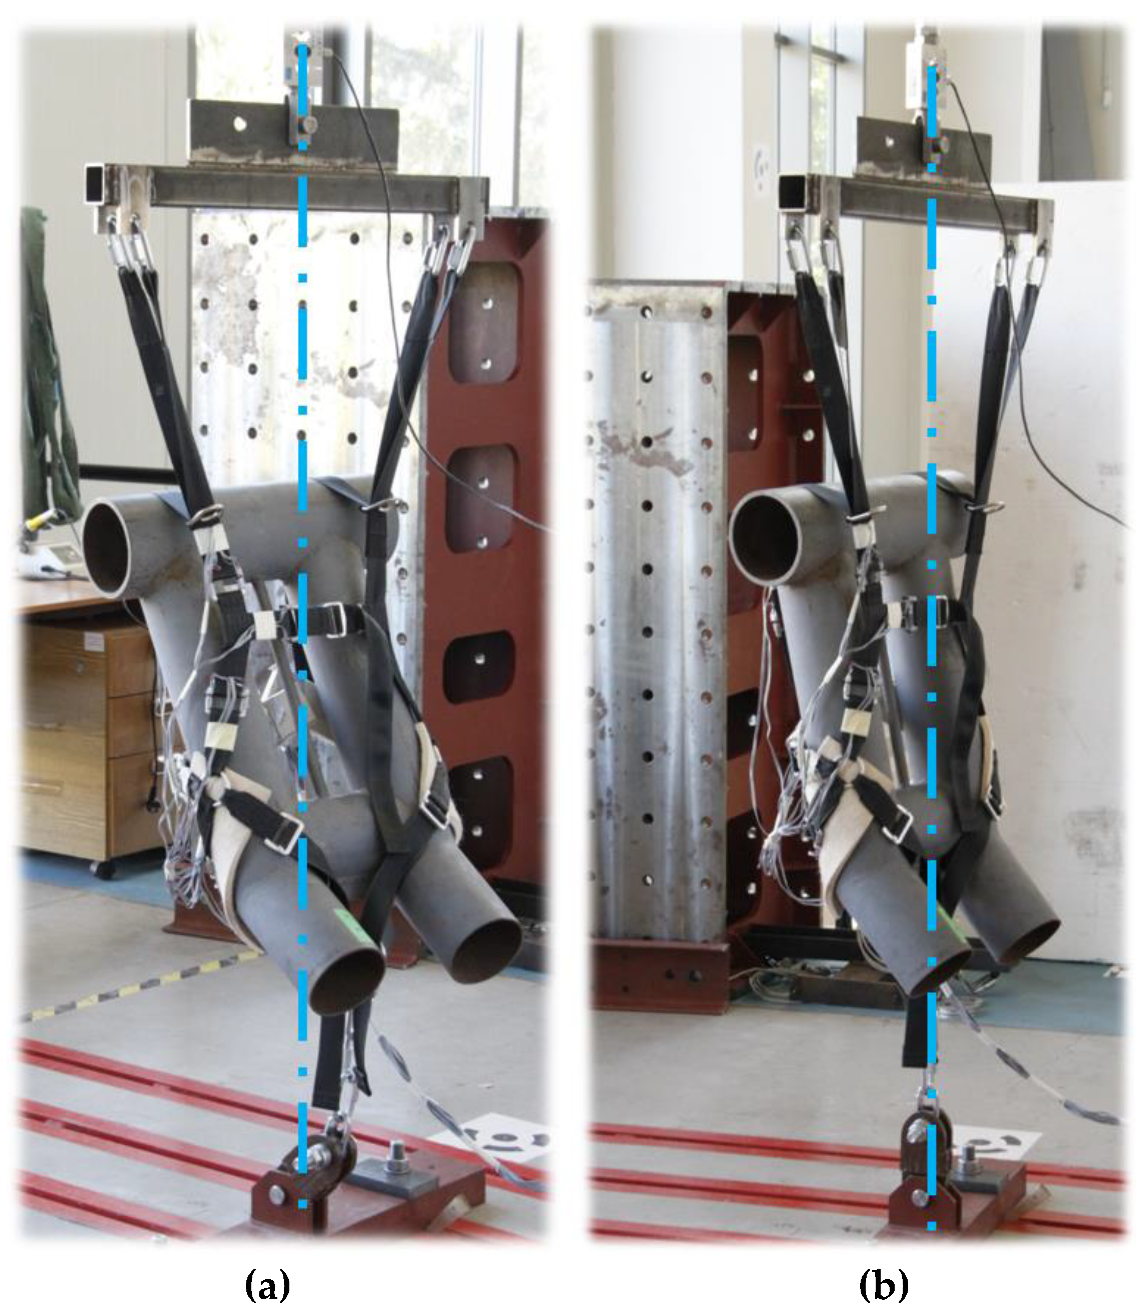
2.6. Drop Test Laboratory Setup for Reaching the Opening Shock Load

In order to reach the inputs in the harness load test, it is necessary to obtain data from the actual drop, which reflects parachute aerodynamic characteristics during the opening phase. For this purpose, a special drop test laboratory has been developed. The scheme, with a description of the basic components, is highlighted in Figure 8. The test laboratory consists of electronics that record the most important information regarding the entire drop in real time. The high recording frequency allows the system to be activated with high accuracy and is also very important for the next postprocessing of the data. Not only speed-related information is recorded, but also the duration of the freefall, forces in separate connections between parachute and laboratory, position in the coordinate system, and G-force. Data from the indicated speed and free fall time are used to activate the system at the required speed. Exceeding the design speed should mean the destruction of the parachute, and in most cases, damage to the laboratory caused by high-speed impact with the ground.
Information related to G-Force and load in separate connections is the value that needed to be identified for further analysis. Even though the laboratory records the complete progress of the quantities over the whole drop test sequence, for the present research, only one point is important, which is the maximum peak related to the opening shock load. The amount of asymmetry read from the measuring carabiners on the attachment points can be considered as additional information and input to the proposed tests 2 and 3.
It should be highlighted that the activation of the parachute must be executed in the same manner as if it were activated by a skydiver while wearing the serial harness. That means that the folding of the parachute into the storage area needs to be executed in the same way and deploying the drogue chute equipped with the serial extracting spring is also required. There should be free space in the area of deployment that would cause the elements to be trapped during the pulling sequence. This ensures that there will be no unwanted delay in the deceleration of the ballast. It is an important parameter for drop tests that use gravitation to accelerate the laboratory to the final speed. Any delay in activation thereafter means exceeding the design speed, which is unacceptable.

3. Results

3.1. Drop Test Evaluation

To obtain information about the forces, the test conditions were designed so that they corresponded to the conventional values at which the skydiving or rescue systems are activated. It was intended to determine the G factor generated by the canopy at the typical terminal speeds in a stable belly-to-earth position. The conditions of the drop test were specified as:
activation speed vactivation = 200 [km/h].
weight of the ballast mlaboratory = 130 [kg].
Information related to parachute geometry will not be presented, as it is considered the property of the company that provided the canopy for the test. Nevertheless, for the purpose of this research, that information is not important. Generally, a gliding parachute equipped with a slider to reduce the opening shock load was used. The results presented in this study define the maximum aerodynamic force generated by the canopy for the subsequent analysis. The point corresponding with the maximum opening shock load is highlighted in Figure 9 by point three.
The drop test identified the maximum overload as G = 6.3 [–]. By converting the overload to a force based on the input mass using Equation (1), the opening shock load is obtained:
F s h o c k _ l o a d = G · g · m l a b o r a t o r y = 6.3 · 9.81 · 130 = 8034.4   N  

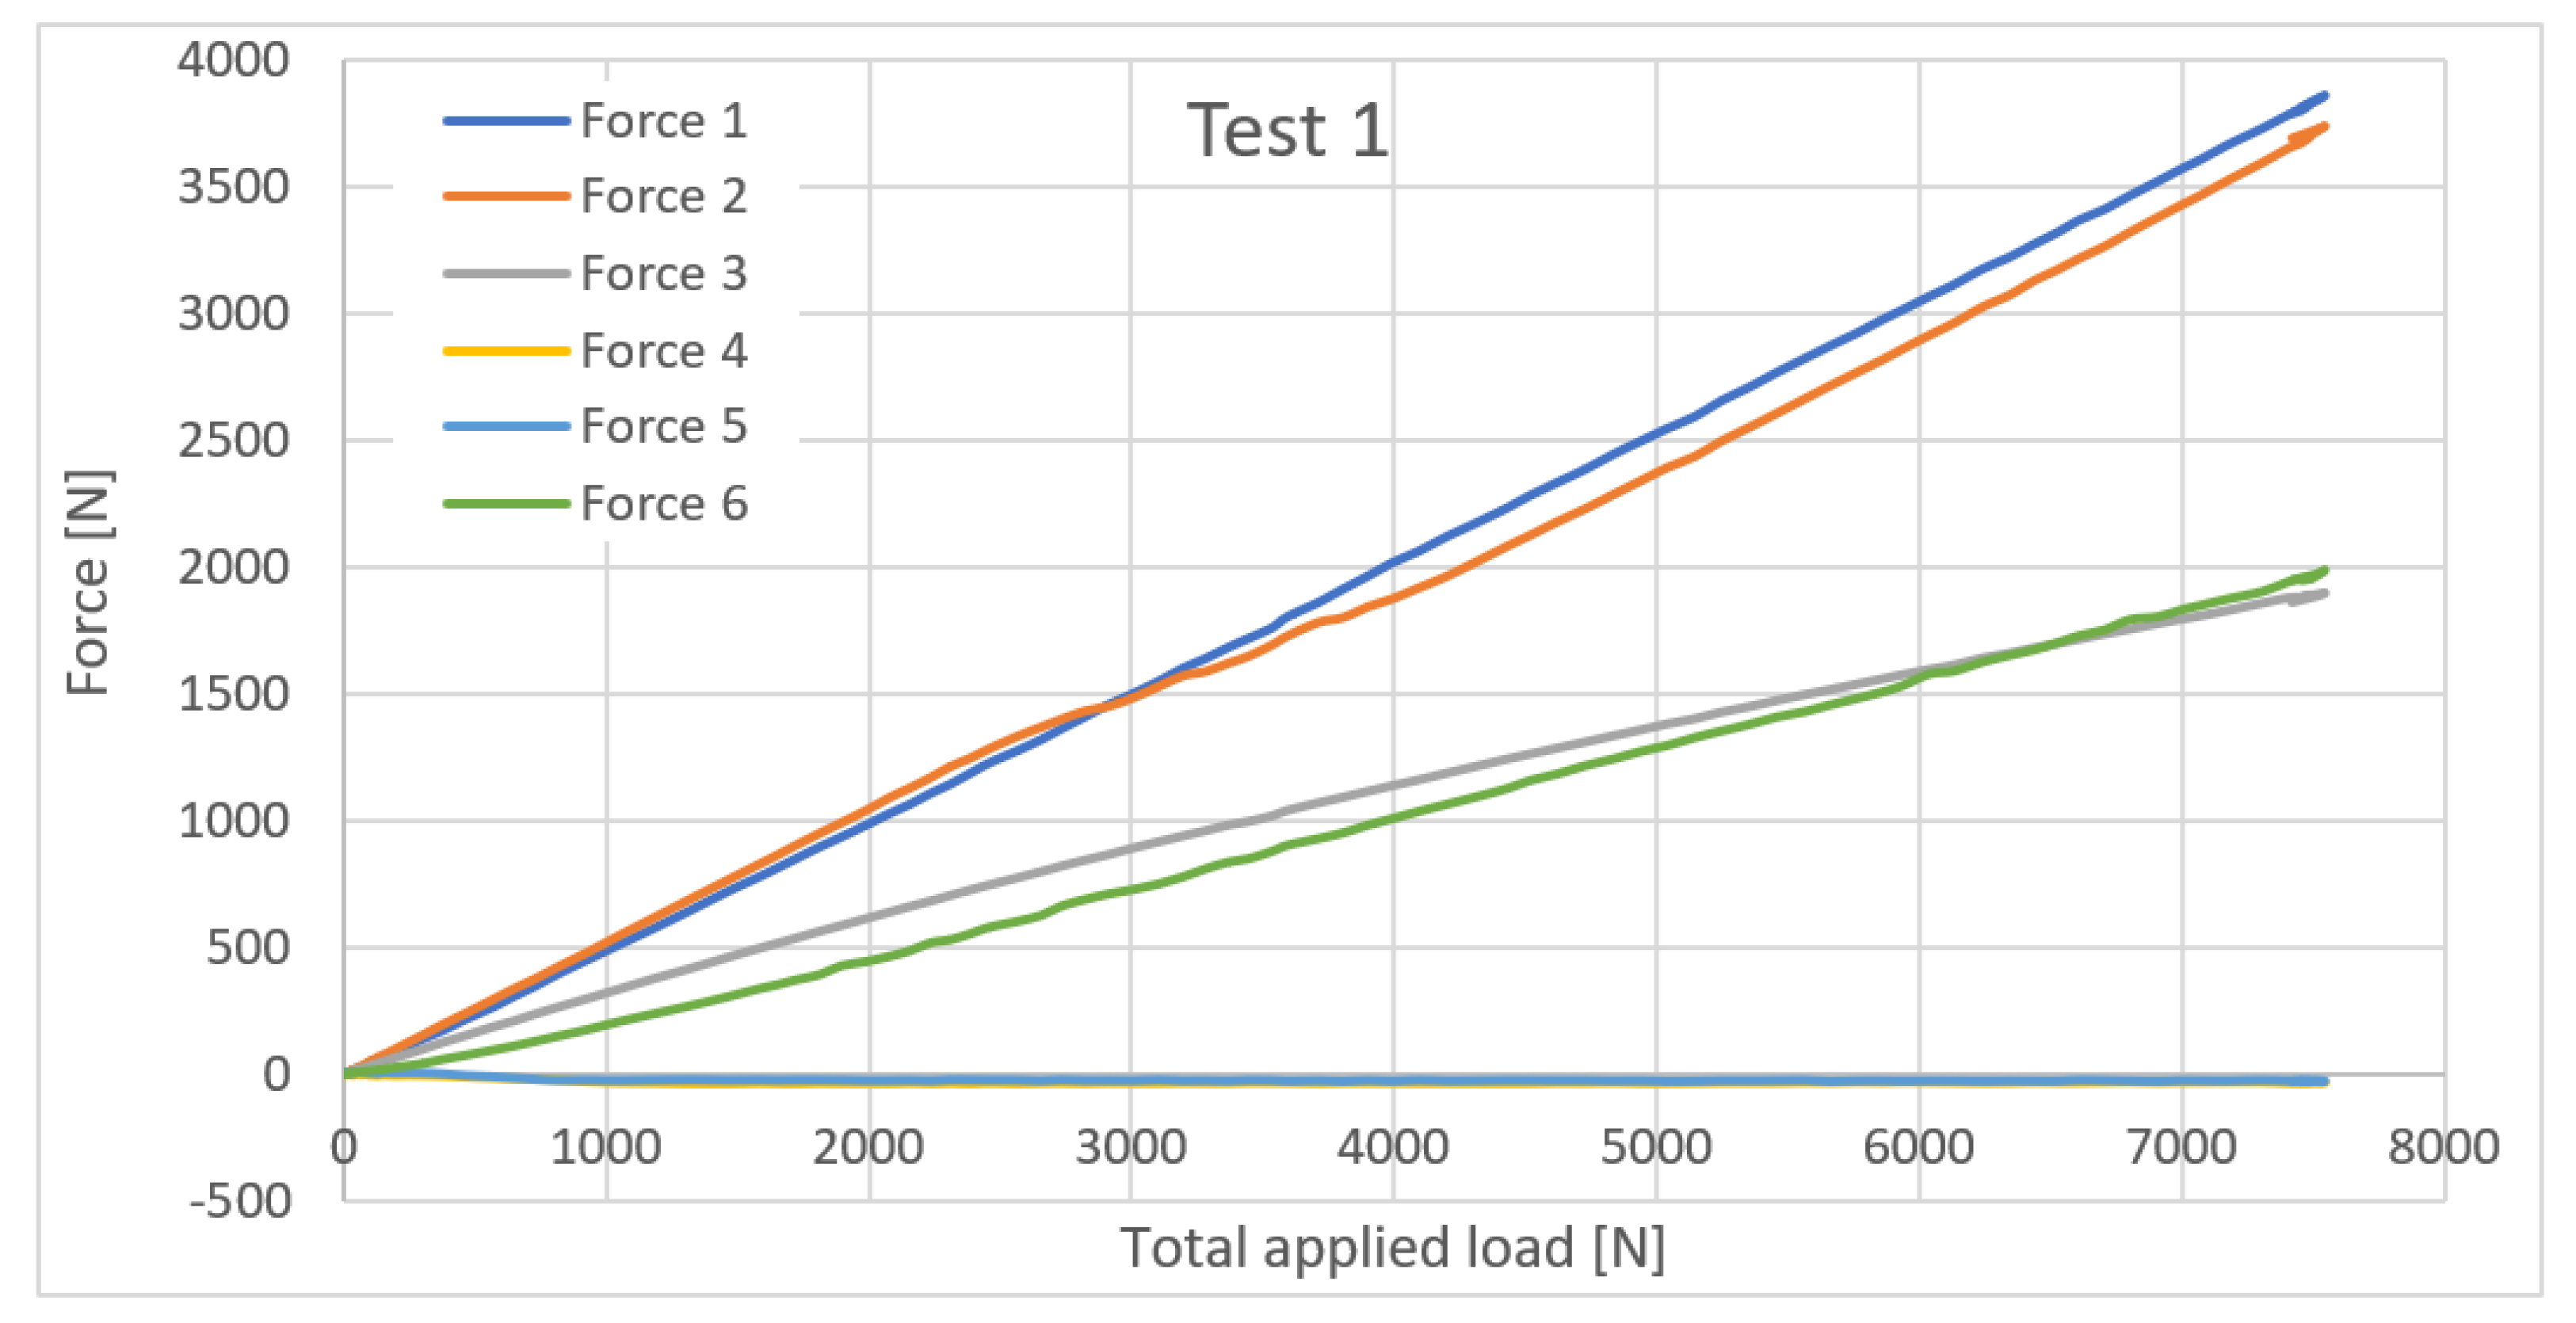
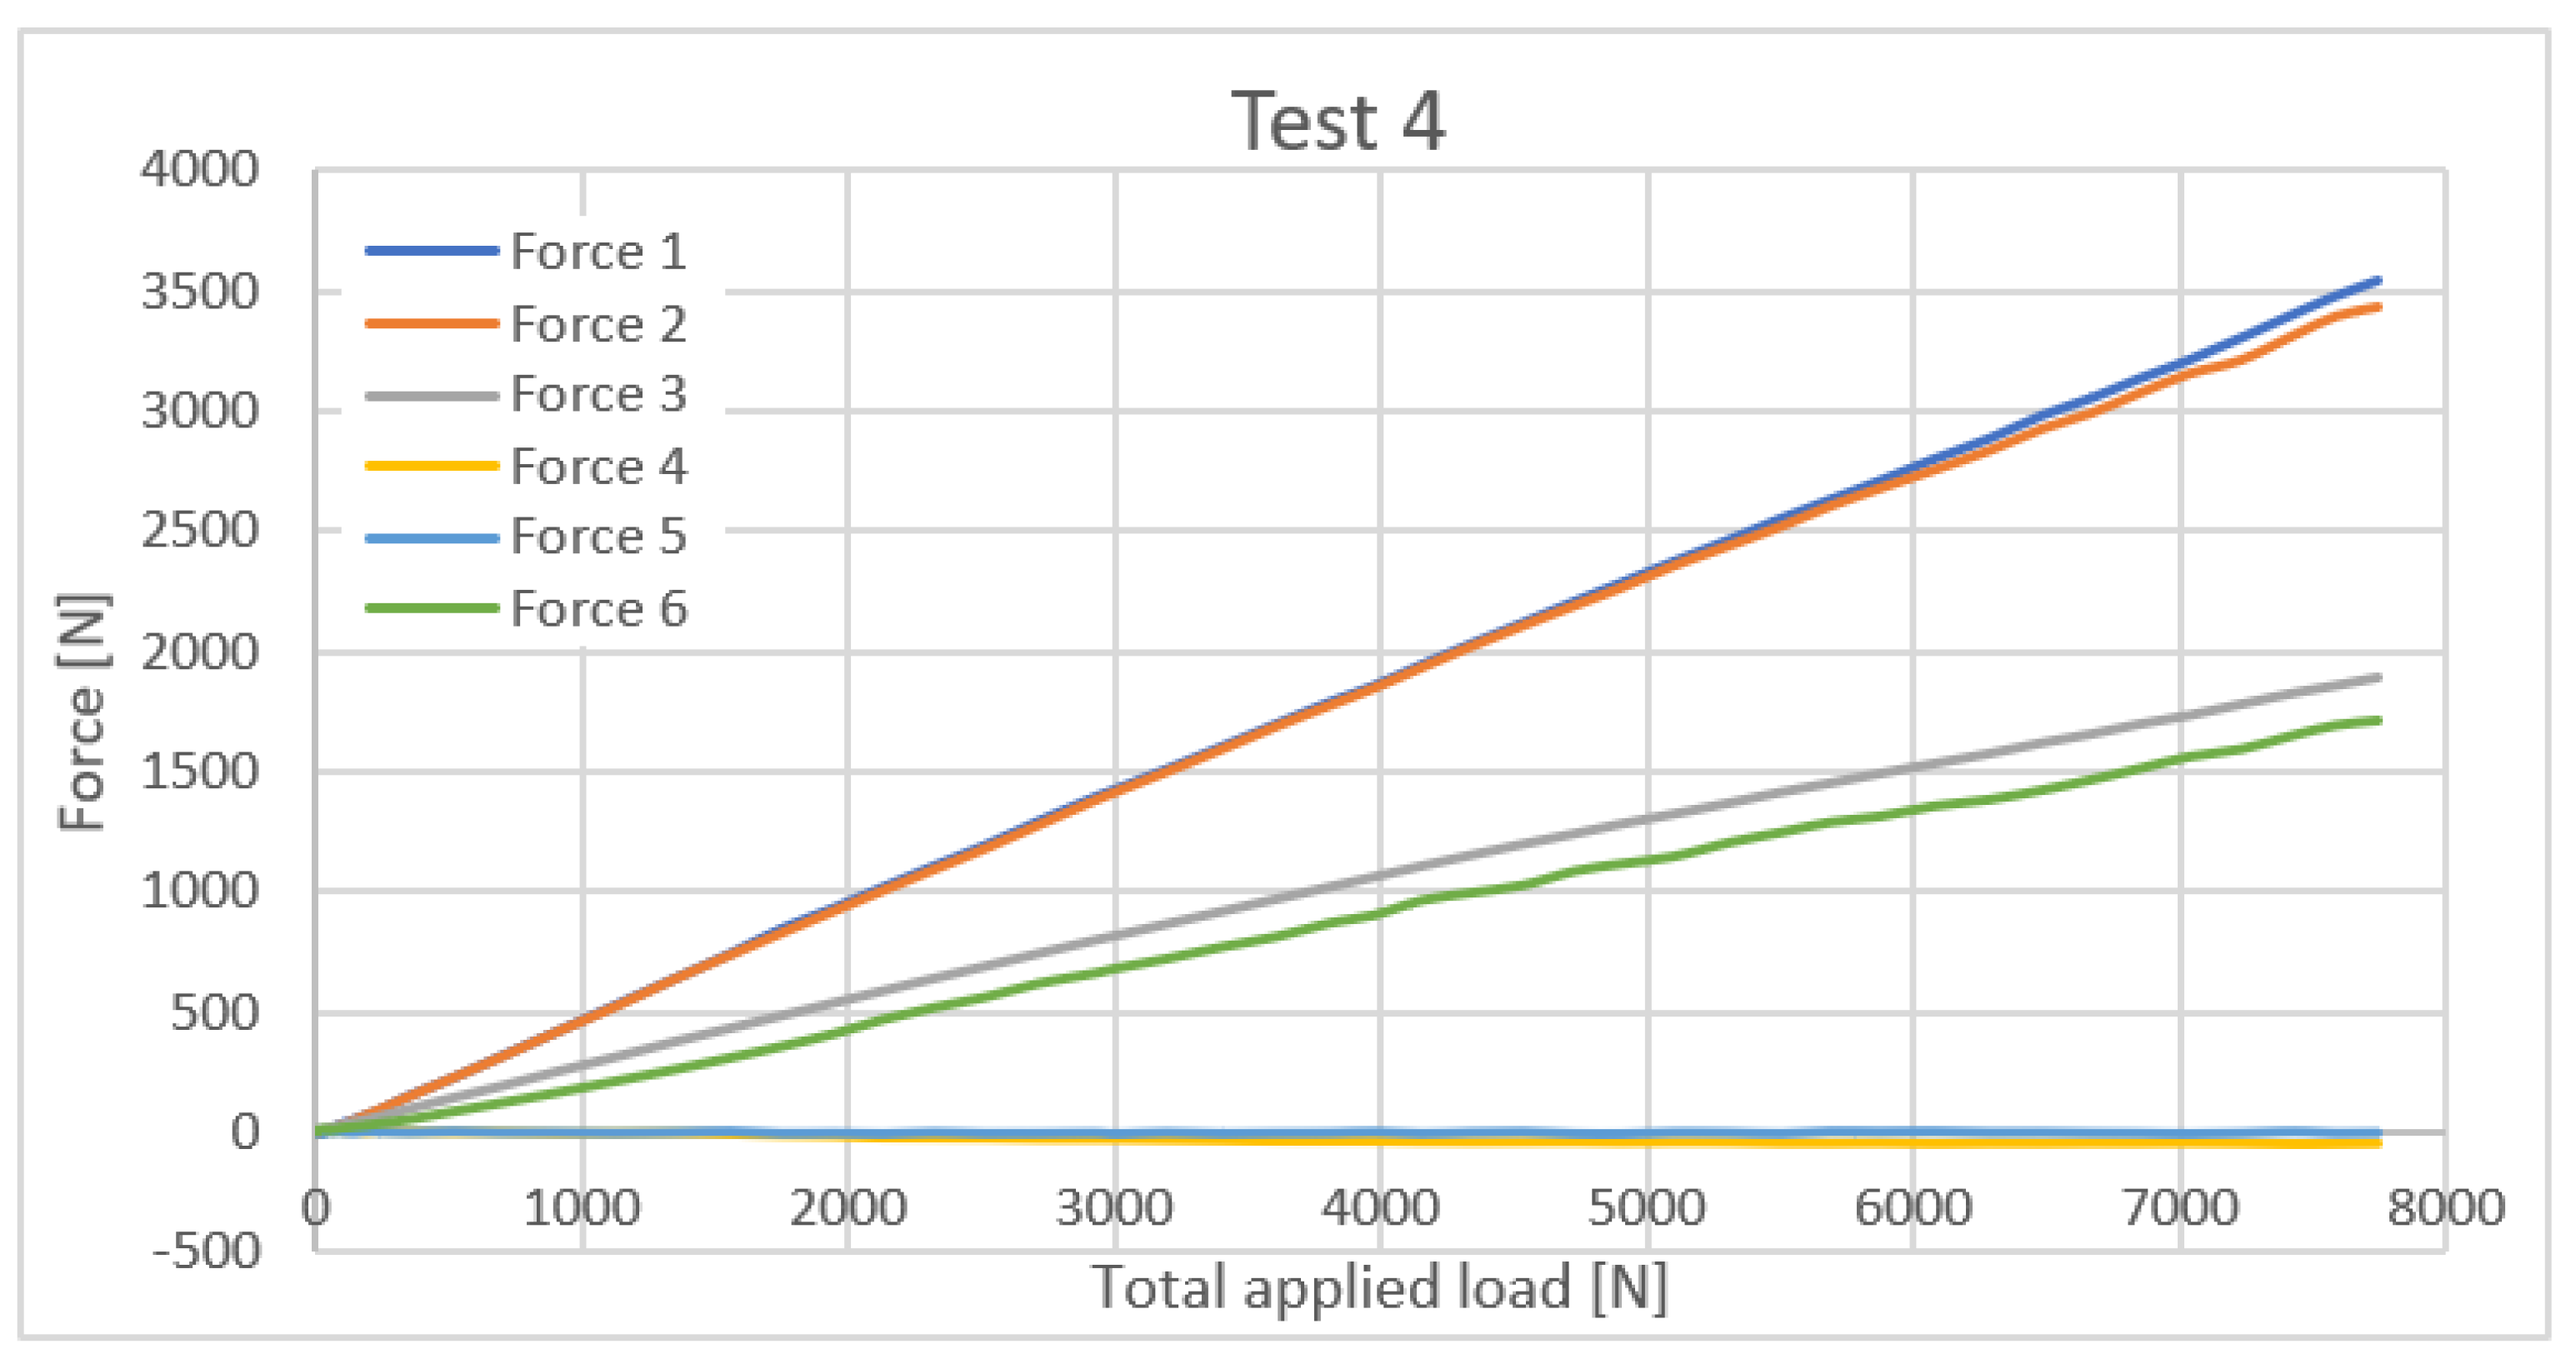
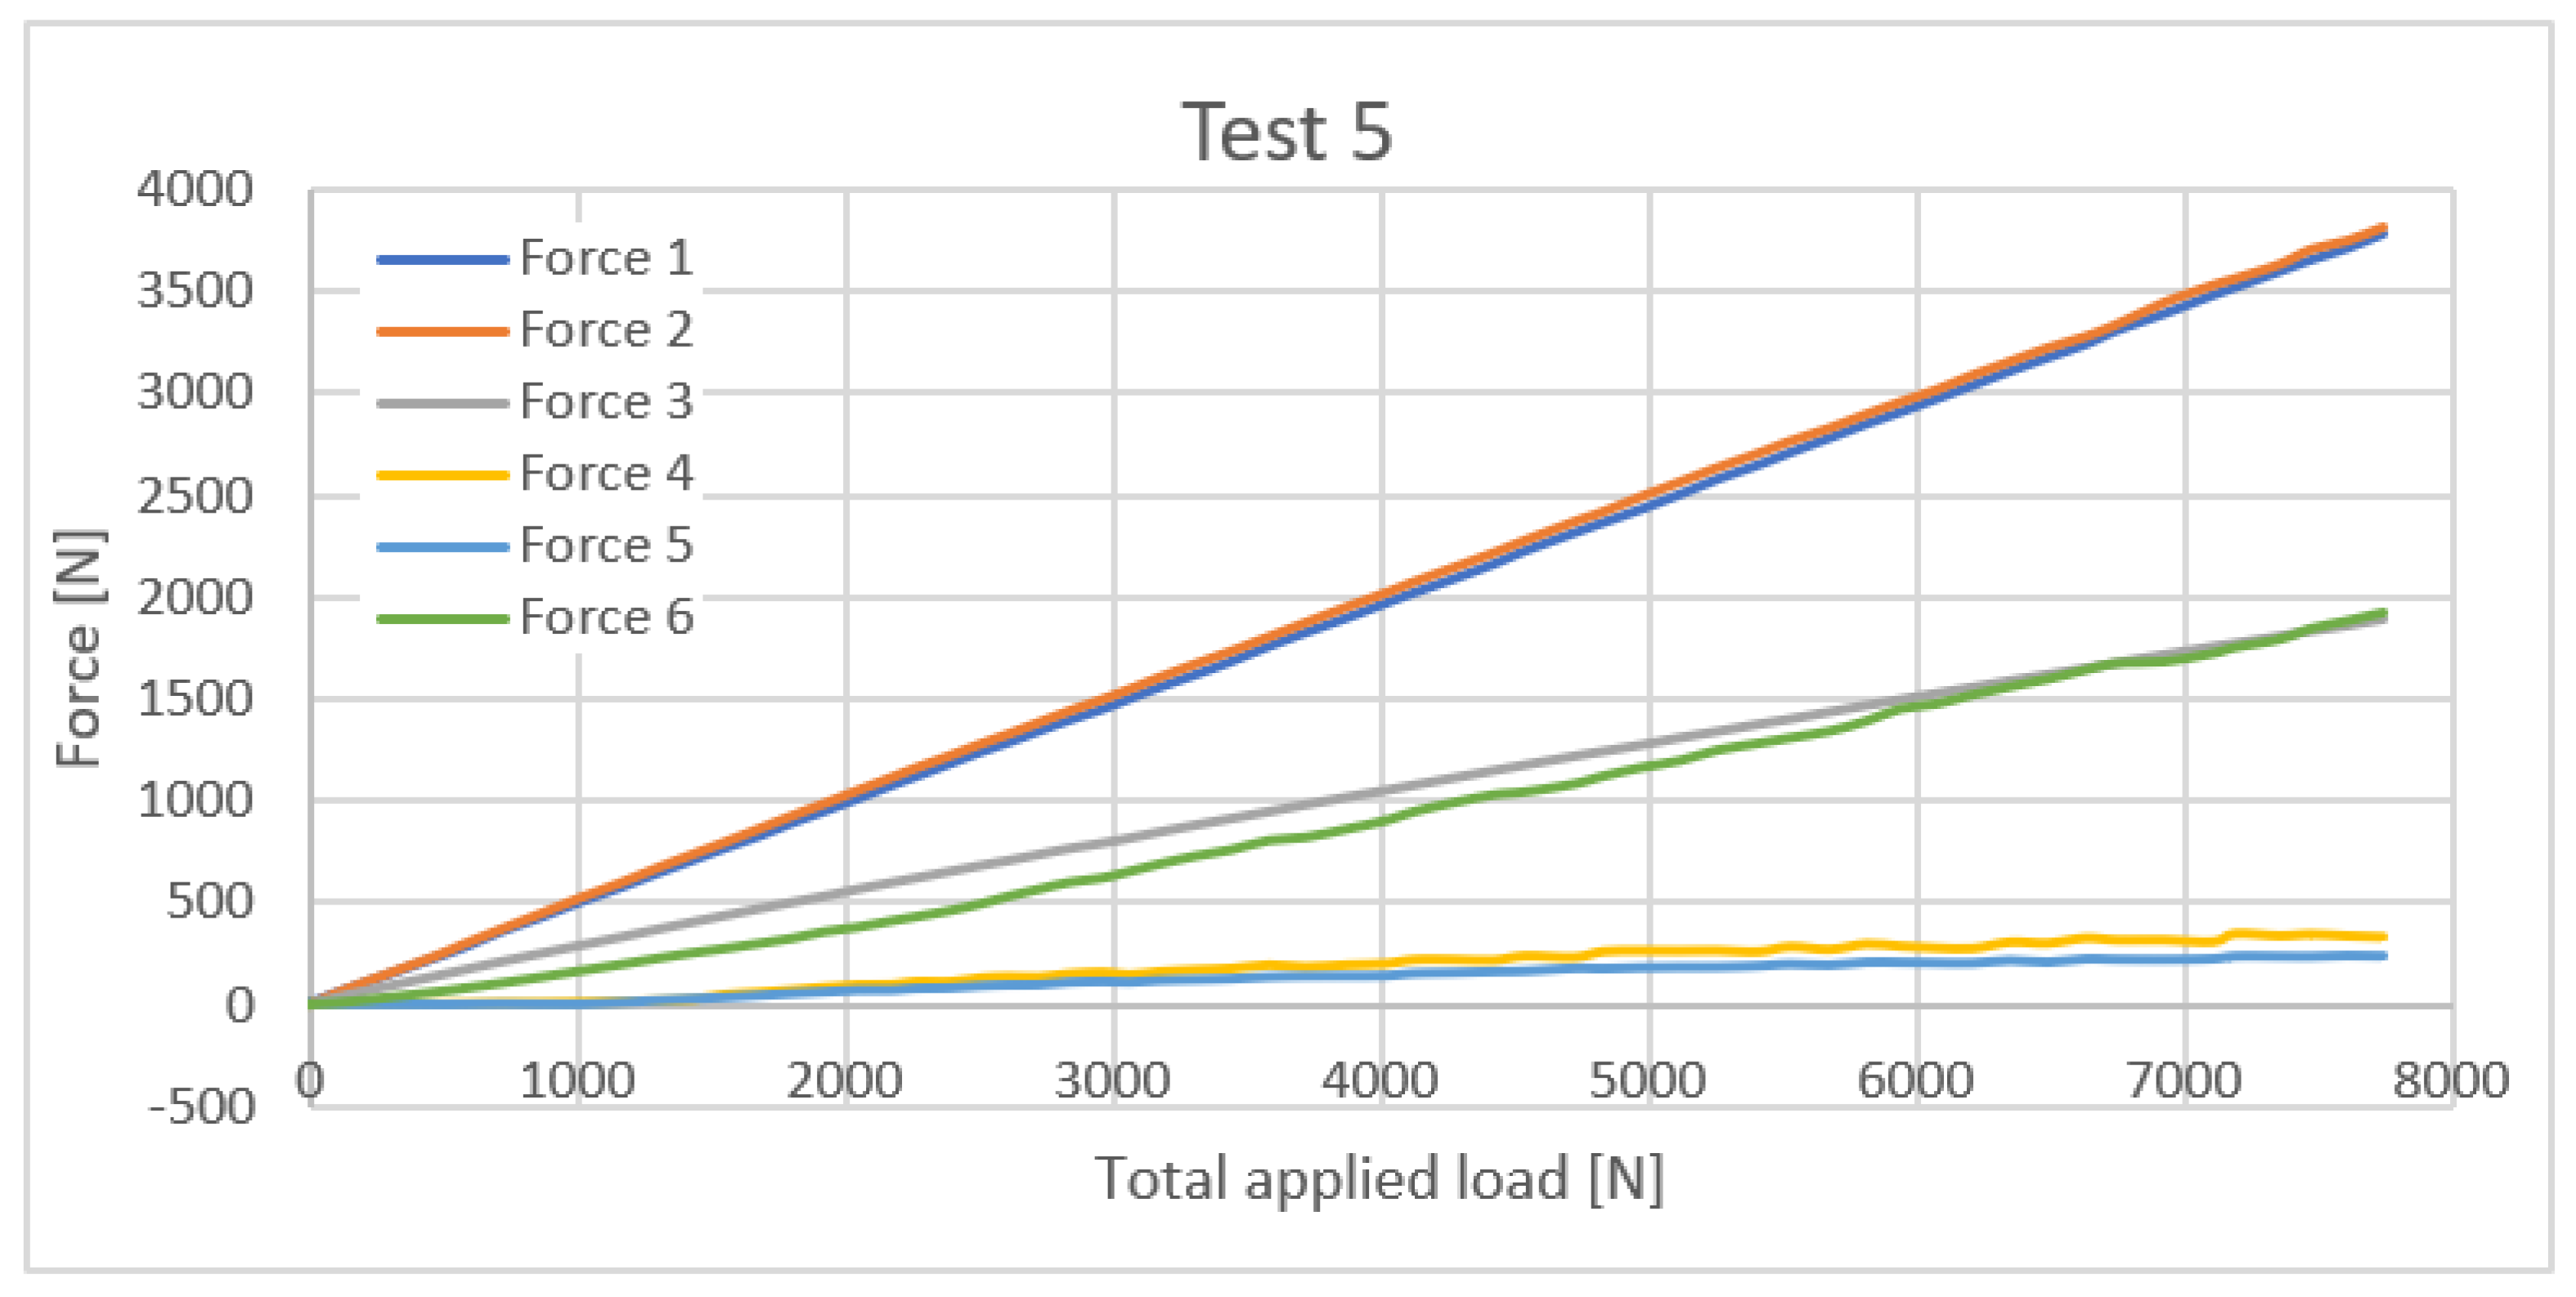
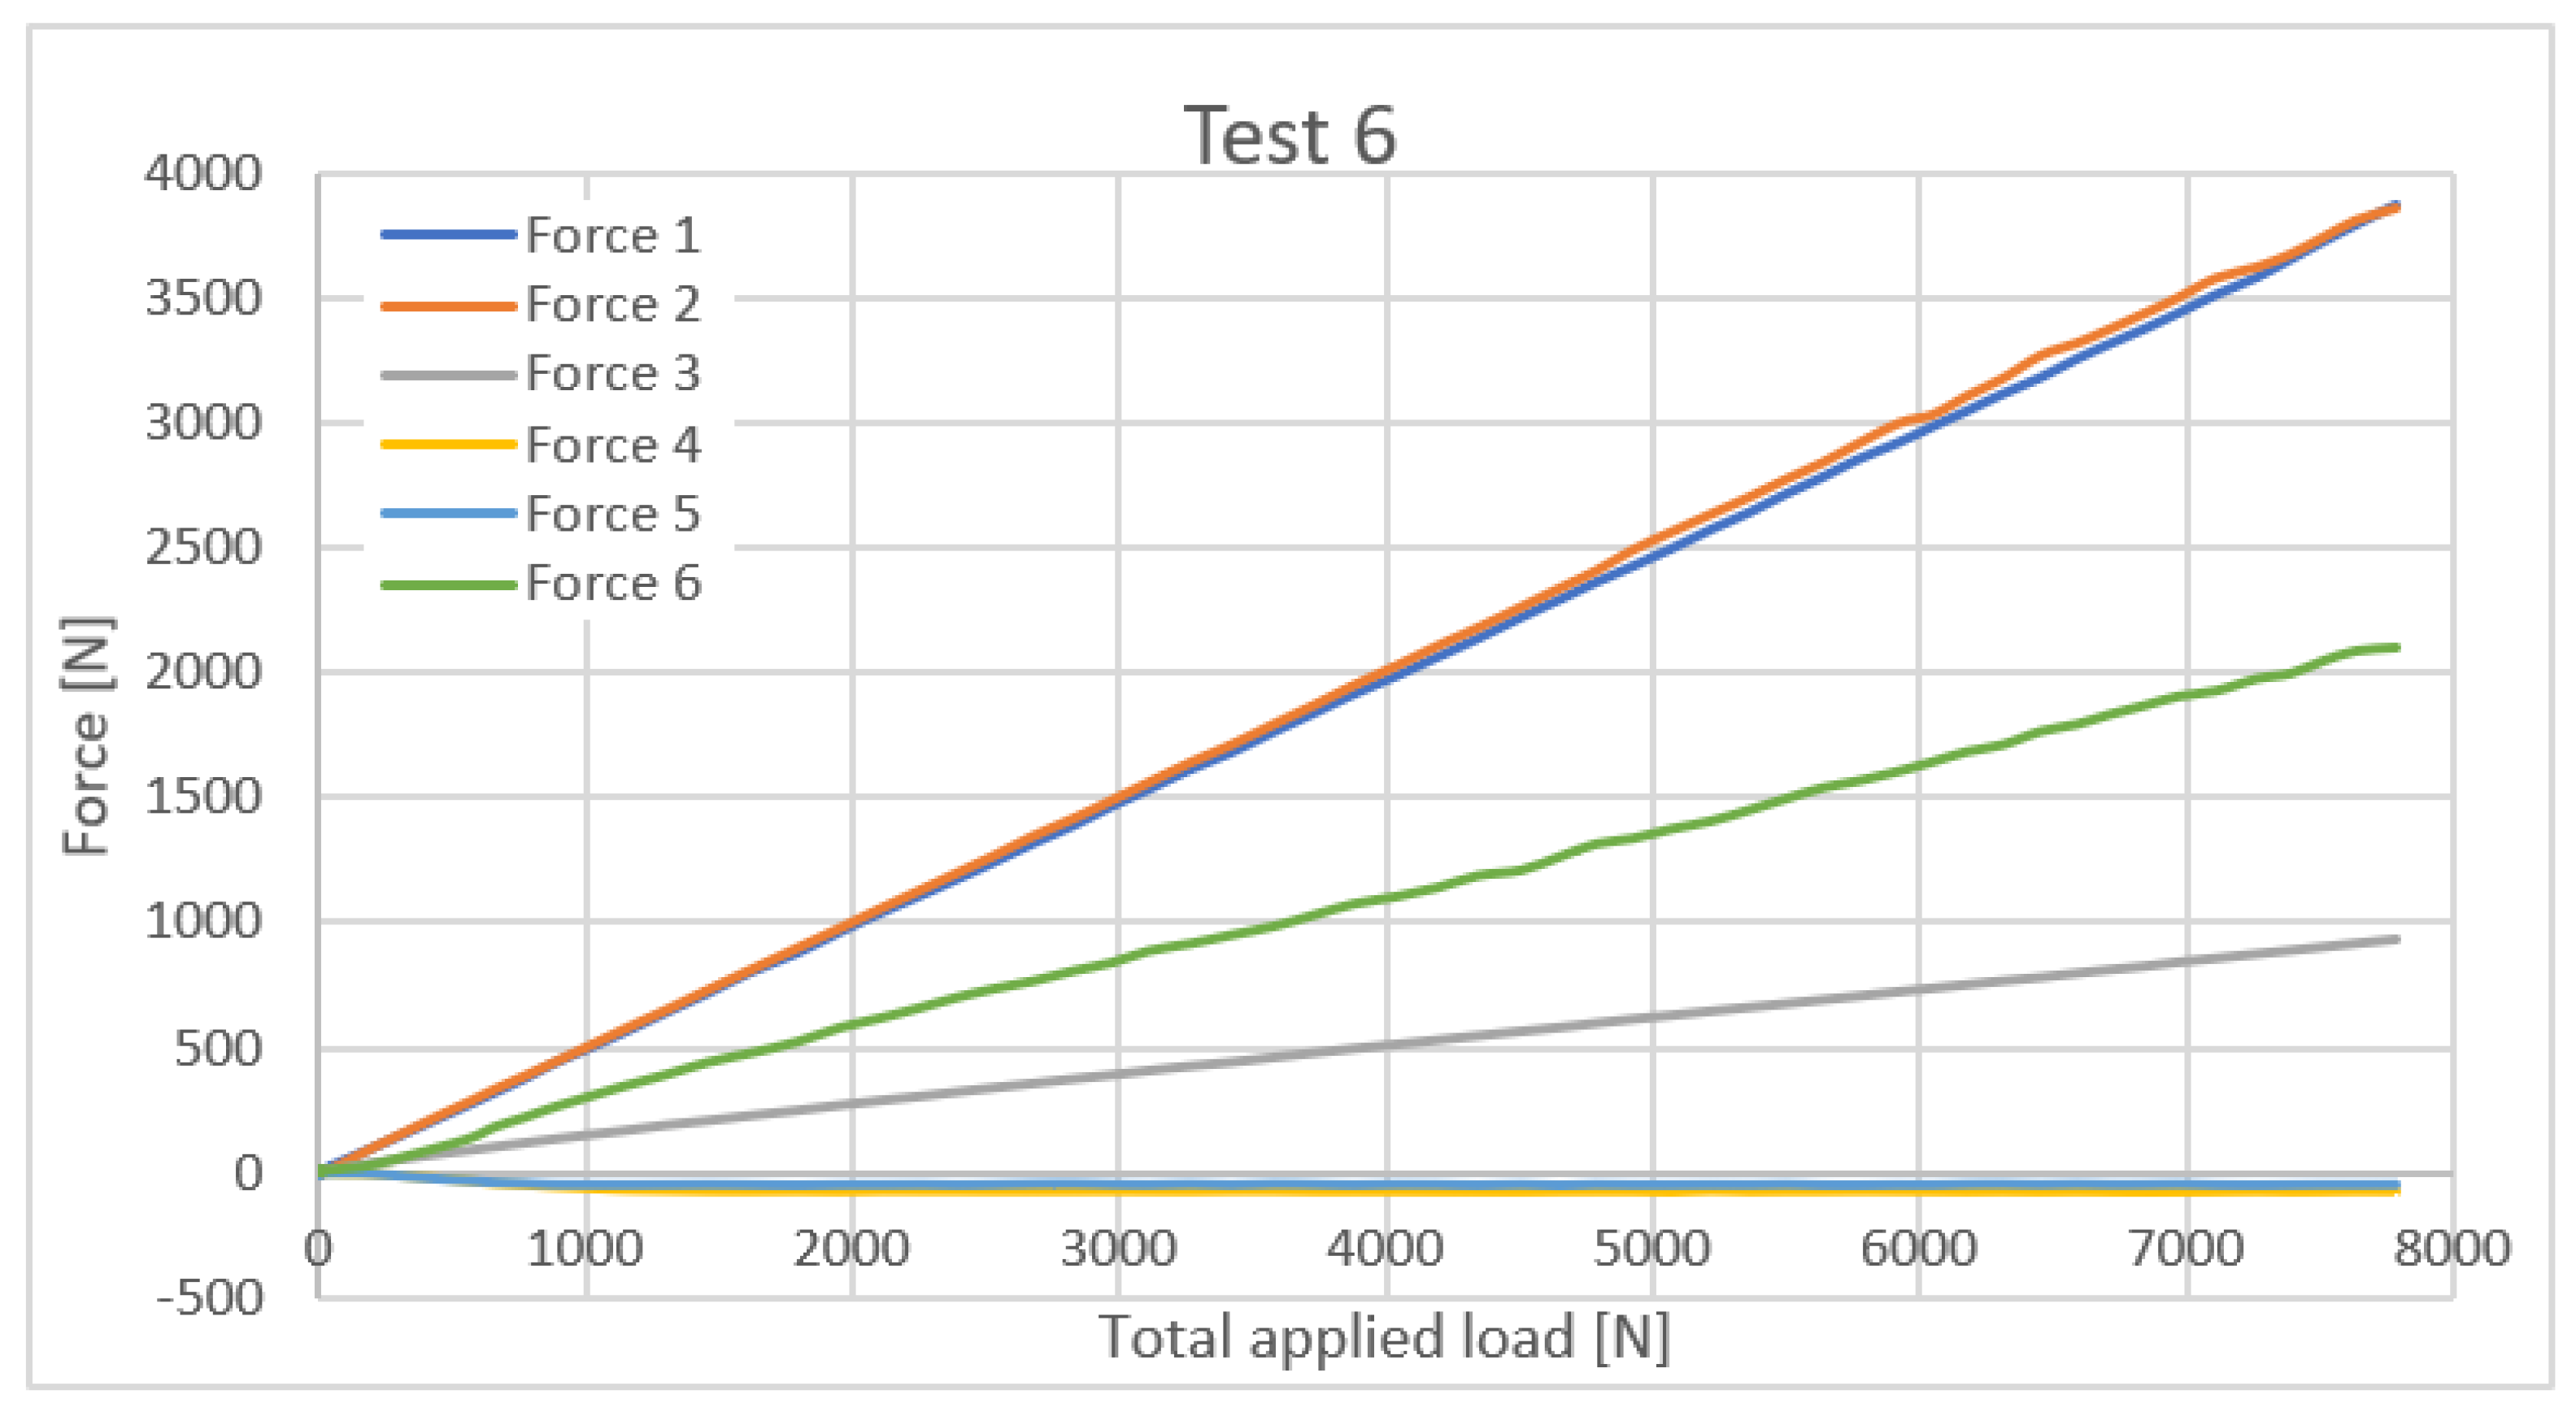
3.2. Results of Harness Loading

The aim of the test was to progressively load the harness up to the force corresponding with the maximum opening shock load generated by the canopy during the activation phase. The gradual loading process will help to obtain information on whether the individual straps are taking the same percentage of the total applied force during all processes. If the test results show that there is a uniform percentage redistribution above a certain load value that does not change further, the results of this study can be used without regard to the opening shock load magnitude. In other words, the loading of the individual elements would then only be determined by the total applied force and the redistribution factor based on this research. As the result shows, this will play a major role in the investigation of the element’s safety margin.
Based on the load output from the drop test, the maximum required force has been established as 8000 N. In order to not distort the data due to the initial settling of the harness on the dummy, a preload of 1500 N was applied before each test. This level of preload was set by an estimation. Above this value, there was no further movement of the harness on the dummy’s body.
It must be noted that the values of the force recorded by the station also include the weight of the dummy and hanging devices. Hence, some postprocessing was necessary to have comparable results. The presented values of the forces are zeroed at the beginning of the test. This ensures that the weight of the equipment and the initial tension of the webbing are no longer present. As a result, the data only represent the value increment gained from main loading force redistribution into individual segments.
The maximum applied forces are not totally identical between the separate cases. The reason for this is that the readout of the forces was performed manually. Once the operator saw the desired load on the display, further loading was stopped. These small differences do not affect the evaluation of the individual tests. Only the parameters from the separate test entered the analysis of the load capacity, followed by a recalculation of the critical element’s theoretical load capacity at a given configuration. The subsequent comparison in Table 1 includes a conversion to the theoretical critical force, which can already be used to compare the harness load capacity for different configurations.
In general, all test cases have the same evolution, where four main stages can be identified:
  • Dummy rotation into the steady position;
  • Settling the harness–force redistribution;
  • Gradual loading with straight slope;
  • Limit force for gradual loosening of the buckle.
The first stage is, in general, caused by the difference in position of the center of gravity of the steel dummy and the point where the dummy is fixed to the ground of the test room. During the first seconds of loading, the dummy is rotating to the new equilibrium state, which is not changing significantly during further loading. The position change is highlighted in Figure 10.
During the second phase, the system stops rotating and only the harness itself begins to show signs of slight movement on the dummy’s body. This is clearly visible in the chart showing the load profiles of the individual elements. Once the load exceeds a certain value, the harness is already static, and there is a steady increase in force. This phenomenon allows the referenced generalization of the published results to use this procedure for a different opening shock load. The assumption is that if a higher load was applied, it could be expected to increase in separate positions with respect to the obtained redistribution ratio. This is one of the most important findings. This idea is possible to apply to all six tests, which enables the calculation of the theoretical limit load of the harness for all the configurations.
The fourth point of the observation showed undesirable conditions. The buckle located on the right leg webbing started to gradually and irregularly loosen once the overall load exceeded the value of around 3000 N. This could be caused by the wear of the buckle, the hard base under the buckle, or a combination of both phenomena. The relaxation was gentle and did not affect the final results presented.
The load redistribution of the total applied load into individual load cells is shown for all six tests in Figure 11, Figure 12, Figure 13, Figure 14, Figure 15 and Figure 16.
Figure 11 displays the load profile of the test configuration one. Progressive loading began at force 0 N, which represents a steady state in which the harness is only loaded by gravity and tightening the webbings to fit the dummy. Loading was stopped at the maximum overload value of 7665 N. Above the value of 4000 N, forces are already steadily distributed, and the same slope of the curves is observable. The load in elements one and two differs by 120.9 N. It can be assumed that this difference in load is transferred by the chest strap, which was tightened.
Figure 12 displays the load profile of the test configuration two. During this test, the force applied to the right connection points of the harness was two times higher than to the left side. This resulted in higher loading of the chest webbing and bigger differences between the loads in positions one and two Loading begins at 0 N and increases to a maximum of 7699 N, as in the previous test. Unlike the first test, the forces were already evenly distributed once the total applied load reached a value of 1000 N.
Figure 13 displays the load profile of the test configuration three. During this test, the force applied to the left connection points of the harness was two times higher than to the right side. This resulted in a different redistribution pattern. The load cell one measured a lower load than the load cell two. Loading started at 0 N and reached a maximum of 7599 N. The forces were evenly distributed once the total applied load reached 3000 N.
Figure 14 displays the load profile of the test configuration four. The dummy was fixed in place and rotated face down during this test. This resulted in a loosening of the back straps, which were not carrying any load. Loading started at 0 N and reached a maximum of 7735 N. During this test, load cells in positions one and two measured similar forces throughout the whole process. As in the second test, once the total applied load reached 1000 N, the forces were already evenly distributed.
Figure 15 displays the load profile of the test configuration five. The dummy was fixed in place and rotated backwards during this test. This increased the loading on the back straps. Loading started at 0 N and reached a maximum of 7748 N. During this test, load cells in positions one and two measured similar forces throughout the whole process. The forces were evenly distributed once the total applied load reached 2000 N.
Figure 16 displays the load profile of the test configuration six. During this test, the chest webbing has been loosened. This resulted in lower loading of the chest webbing compared to test one, which has the same setup but with tightened chest webbing. Loading started at 0 N and reached a maximum of 7787 N. The forces were evenly distributed once the total applied load reached 1000 N, the same as in the second test.
Table 1 summarizes the measured forces in separate load cells with respect to the maximum applied force, which is also highlighted. The marking of the separate elements is performed according to the established convention. As already discussed, the peak of the applied force is not identical for all test cases because of the delay between switching off the load hydraulic cylinder, which was mechanically operated. Nonetheless, the evaluation of the results within the single tests has no effect on the results of the subsequent load capacity analysis.

3.3. Determination of the Theoretical Load Capacity of Separate Configurations

Once the ratio of the redistribution of the total applied force to the individual structural elements is known, it is possible to calculate the load capacity of the individual components. For this operation, it is important to know the strength of each component declared by the manufacturer [12,13,14]. In Table 2, these values for single parts are listed. For clarity, Figure 17 shows the position of the items marked in the table. The mark C indicates the carabiner (buckle) and mark S indicates the strap (webbing). Its number corresponds to the specific designation of the measuring element.
With this knowledge, it is possible to use Equations (2)–(3) to determine the limiting force during the canopy activation stage, at which the maximum allowable component load is reached. The given force calculation will thus show not only the critical element but also the strength margin for the other components. This makes the uniformity or non-uniformity of the strength margin of each element visible at first sight. As an example, test case one is analyzed according to the mentioned procedure. With the use of Equations (2)–(3), the results defining the critical applied force to reach the limit force in separate construction elements for test one are as stated in Table 3. The calculations shown in Equations (2)–(3) are demonstrated on the critical element for test case one.
  • b1 = percentage value of the force carried by the element, relative to the loading force.
  • Fc1 = force at a particular position C1.
  • Fresultant = total loading force that represents the opening load of the parachute.
  • Flimit = the manufacturer’s declared element limit force.
  • Fcrit = loading force at which the maximum permitted force value is reached.
b 1 C 1 = F c 1 F r e s u l t a n t 1 · 100 = 1910 7665 · 100 = 24.9   %    
F c r i t _ 1 C 1 = F l i m i t C 1 b 1 C 1 · F r e s u l t a n t 1 100 · F r e s u l t a n t 1 = F l i m i t C 1 b 1 C 1 · 100 = 2224.91 24.92 · 100 = 8928.3   N  
The results show that while the theoretical strength of element C1 is achieved at 8.928 kN, element S2 can withstand a value more than ten times higher. By evaluating all the remaining tests, it was found that C1 is a critical element for all configurations. The other elements indicate a significant difference in the safety margin compared to element C1.
Table 4 summarized the critical force calculated according to Equation 1 for all the test setups. This procedure also highlights the most vulnerable position of the dummy, where the limit load of element C1 first appeared.
It is evident from the results that the asymmetric load is the first case in which the limit load is exceeded. In other words, test configuration two. However, the differences in the strengths of individual cases are not so significant. It varies up to 14.8% for tests one-five.
The evaluation of element C1 brings another important piece of information related to the influence of chest strap tightening. This can be achieved based on the comparison of the results from test one, where the chest strap was tightened, and test six, where it was loose. The difference in maximum value to reach the limit load is about 107% higher in the case of a loosening chest strap.

4. Discussion

The present study focuses on two major chapters. First, is a test of the aerodynamic characteristics of the canopy in its activation phase to obtain the opening shock load during its activation. The second part is the application of this specific load to the harness and finding the redistribution of the total applied load to the different structural nodes of the harness. The force application is extended to loads in different configurations.
In the canopy testing phase, it was important to maintain the design parameters, which were determined based on the terminal speeds at which a parachutist falls in free fall. For the purpose of the test, the speed was set at 200 km/h. The progress of the test confirmed the normal canopy function, and the results from the first test were used for the postprocessing. The logging of the individual parameters proved to be sufficient to provide the data for the following harness analysis, which is the main goal of the research. The G-force data were used to calculate the opening shock load. As a supplement, measuring carabiners on each side of the canopy hinge were also used. The existing measuring carabiners showed non-standard behavior during the test, and therefore, the results were not included in the evaluation. However, they are the subject of additional internal development, and further practical use is planned for future tests. The maximum value of the measured opening shock overload was G = 6.3. With a weight mass of m = 130 kg, this overload was converted to an opening shock load of Fshock_load = 8035 N. For subsequent analysis, it was stated that the testing force could be rounded up to the value of Fshock_load = 8000 N. The provided methodology proved to be adaptable and can be used for a variety of activation speeds and ballast masses or types of parachutes. This brings the possibility of filling the certification requirements defined by the Technical Standard 135 in the section “Structural Overload Tests” [4].
The second section of this paper focuses on a comprehensive loading study of the fully articulated parachute harness structure. The decomposition and incorporation of each element’s strength limits, as well as the determination of the applied force’s redistribution into separate parts, shed light on the sizing of individual elements. Load cells based on the minimum dimension parameters were developed to measure forces in separate webbings. With this benefit, serial production parts were used for the strain gauge installation. This procedure ensured minimum costs and, due to the load cell’s small dimensions, minimal structural influence once it was sewn into the final harness. During calibration, it was verified that laterally uneven loading of the measuring feature has no effect on the measurement precision. It was one of the biggest concerns when considering the location of the separate features. It was expected that, because of the required number of load cells, there would not be enough space to locate them all in ideal positions. The element on the webbing heading to the back of the dummy was, despite all efforts, loaded partly by bending. The aim of future work will be to develop an element that will not be sensitive to the bending component. A very important observation was identified. Once the harness settles on the dummy body, the redistribution of the forces related to the applied force does not change significantly. This opened the possibility of generalizing the research. It can be expected that by increasing the applied force above the presented value of 8000 N, the same trend of redistribution will follow. This means that the use of a different canopy or changes in activation speed resulting in a different opening shock load can be applied for recalculation.
In all cases, the buckle located on the chest webbing was identified as the weakest element. Based on the results, the fixed spatial position that loads this element the most is an asymmetrically loaded case. This is because the chest strap took some of the force from the opposite side through the cross-connection. However, the amount of load transferred by this carabiner is strongly dependent on how tight the strap is. It was identified that the difference in critical force can vary by up to 107%. This result is also expected because the loosening of the chest webbing causes the main load to pass from the pilot’s buttocks directly to the upper hinge points. When tightened, the webbing tends to create two triangles that tend to expand under the load. When using the harness, it is therefore a good idea to tighten the harness, but in the case of the chest strap, tighten it only to the point that the harness cannot come loose on the pilot. Any overtightening will not bring any benefit. It will only cause overloading of the structural node.
It can be expected that the maximum allowed load declared by the manufacturer uses some safety factors. This means that even though elements would reach their maximum limit, no visible damage would be observable. Compared to the test of a complete assembly according to TS-135 [4], exceeding the recommended limit of single structural nodes is not controlled. After the test, the harness structure must only be inspected for visible damage. Hence, the testing procedure proposed in this study is considered safer as it allows for the direct monitoring of each component.
For further extension of this study, the strength test of individual components up to visible damage is suggested. Incorporating the maximum strength limits of the parts assumes a significant increase in the maximum load limit of the entire harness.

5. Conclusions

During the research, a methodology was developed to optimize the structure of the parachute harness with the purpose of lightening it. In order to efficiently design the harness for the intended load, an extensive study was conducted to consider the loading of the individual structural elements. A test of the parachute has been performed to reach the required aerodynamic characteristics, which were interpreted as opening shock load. The maximum force obtained from the drop test was directly used to test the harness itself. The static loading test of the harness was designed to gradually increase the load from zero to the maximum load. Different load cases were also incorporated to capture the effect of non-ideal pilot positions during system activation. As a result, the study presents a complete analysis of the separate cases together with a percentage redistribution of the forces during gradual loading. The results evaluation also provided an overview of the sizes of the individual elements. The chest strap is significantly the weakest point, and most of the elements show several times higher strength. Therefore, the intent is to focus on these elements and create a harness with an adapted design. The vision is to create a lightweight harness without affecting the overall load capacity.

Author Contributions

Conceptualization, R.P. and R.G.; methodology, R.P. and R.G.; software, I.J.; validation, M.H., I.J. and R.G.; formal analysis, R.G.; investigation, R.G., J.Š. and M.H.; resources, I.J.; data curation, R.G.; writing—original draft preparation, R.G.; writing—review and editing, R.G.; visualization, R.G. and M.H.; supervision, R.P. and I.J.; project administration, R.P.; funding acquisition, R.P.; All authors have read and agreed to the published version of the manuscript.

Funding

The work of Robert Grim, Robert Popela and Marek Horák on this paper has been supported by the Technology Agency of Czech Republic grant project no. TN01000029 National Competence Centre for Aeronautics and Space under the National Centres of Competence 1 programme—support programme for applied research, experimental development and innovation.

Data Availability Statement

The data presented in this study are available on request from the corresponding authors.

Acknowledgments

Robert Grim wishes to thank to the BUT Institute of Aerospace Engineering for providing the laboratory and the equipment that was necessary to perform the tests in such range.

Conflicts of Interest

The authors declare no conflict of interest.

References

  1. Parachute Rigger Handbook (Change 1); LULU PR: Oklahoma City, OK, USA, 2015; ISBN 0359096352.
  2. Zhang, S.Y.; Li, Y. Pierangelo MASARATI a Bo Wen QIU. New general correlations for opening shock factor of ram-air parachute airdrop system. In Aerospace Science and Technology; Elsevier: Amsterdam, The Netherlands, 2022; p. 129. ISSN 1270-9638. [Google Scholar]
  3. Maydew, R.C.; Peterson, C.W. Design and Testing of High-Performance Parachutes La Conception et Les Essais Des Parachutes à Hautes Performances; Advisory Group for Aerospace Research: Neuilly sur Seine, France, 1991; ISBN 92-835-0649-9. [Google Scholar]
  4. Performance Standards for Personnel Parachute Assemblies and Components: Technical Standard 135. Available online: https://www.pia.com/wp-content/uploads/TS-135v1.4.pdf/ (accessed on 2 May 2022).
  5. Para-Test. Available online: https://para-test.com/ (accessed on 21 October 2022).
  6. Prostakishin, D.; Nam, T.P. Dynamic test method for full body harnesses exploited in cold climate. IOP Conf. Ser. Mater. Sci. Eng. 2020, 945, 012027. [Google Scholar]
  7. EN 361:2002 Full Body Harness; ATRA Technology Centre, Wyndham Way, Telford Way: Kettering, UK, 2022; Available online: https://www.satra.com/ppe/EN361.php (accessed on 19 December 2022).
  8. Kalavsky, P.; Rozenberg, R.; Tobisova, A.; Antosko, M. Fall testing of the personal airborne equipment backpack: Ground and flight testing. Appl. Sci. 2022, 12, 3671. [Google Scholar] [CrossRef]
  9. WAGNER; Peggy, M. Experimental Measurement of Parachute Canopy Stress During Inflation; National Technical Information Service (NTIS): Springfield, VA, USA, 1978; Available online: https://apps.dtic.mil/sti/pdfs/ADA058474.pdf/ (accessed on 13 January 2023).
  10. Cochrane, C.; Lewandowski, M.; Koncar, V. A flexible strain sensor based on a conductive polymer composite for in situ measurement of parachute canopy deformation. Sensors 2010, 10, 8291–8303. [Google Scholar] [CrossRef] [PubMed] [Green Version]
  11. Min, A.O.; Jin, Y.; Zhao, M.; Xu, S. Research and Application of Heavy-Equipment Parachute Rope Tension Sensor. J. Sens. 2018, 2018, 1–10. [Google Scholar]
  12. PS22040-1: QUICK-FIT Adapter. Available online: https://catalog.dj-associates.com/item/military-hardware/adapters/ms22040-1 (accessed on 21 November 2022).
  13. PS 70101: Adapter, Reversible Friction. Available online: https://catalog.dj-associates.com/item/special-hardware/adapter-reversible-friction/ms-ps-70101 (accessed on 2 May 2022).
  14. 2058-2.25: O-Ring. Available online: https://catalog.bourdonforge.com/item/forged-metal-safety-o-rings/2058-o-ring-2-25-o-d-1-75-i-d-/2058 (accessed on 2 May 2022).
Figure 1. Scheme of used materials.
Aerospace 10 00083 g001
Figure 2. Selected buckles for the frame preparation to create the measuring load cell.
Aerospace 10 00083 g002
Figure 3. Exact buckle plate calibration curve: (a) curve related to baseplate PS22040-1 and (b) curves related to baseplate PS 70101-1.
Aerospace 10 00083 g003
Figure 4. Final load cell manufactured on PS22040-1 baseplate sewn into structure.
Aerospace 10 00083 g004
Figure 5. Load cell layout diagram, including markings.
Aerospace 10 00083 g005
Figure 6. Alignment of measuring elements: (a) Front side view of the dummy. (b) Back side view of the dummy.
Aerospace 10 00083 g006
Figure 7. Equilibrium position in the unloaded state for each test case: (a) test case 1, (b) test case 2, (c) test case 3, (d) test case 4, (e) test case 5, and (f) test case 6.
Aerospace 10 00083 g007
Figure 8. A scheme of a fully equipped laboratory mounted on the AN-2 before takeoff.
Aerospace 10 00083 g008
Figure 9. Overload record during reference drop test. 1. release of the system from the airplane; 2. reaching the activation speed–releasing the drogue chute; 3. point of the maximum system overload; and 4. initial point of the steady descent.
Aerospace 10 00083 g009
Figure 10. Rotation of the dummy during the first stage of test case one: (a) Unloaded, and (b) loaded.
Aerospace 10 00083 g010
Figure 11. Total force redistribution into individual load cells during test one.
Aerospace 10 00083 g011
Figure 12. Total force redistribution into individual load cells during test two.
Aerospace 10 00083 g012
Figure 13. Total force redistribution into individual load cells during test three.
Aerospace 10 00083 g013
Figure 14. Total force redistribution into individual load cells during test four.
Aerospace 10 00083 g014
Figure 15. Total force redistribution into individual load cells during test five.
Aerospace 10 00083 g015
Figure 16. Total force redistribution into individual load cells during test six.
Aerospace 10 00083 g016
Figure 17. The highlighted position of the evaluated elements.
Aerospace 10 00083 g017
Table 1. Complete results of the maximum forces during loading.
Test OneTest TwoTest ThreeTest FourTest FiveTest Six
Applied Force766576997599773577487787[N]
Force 1MAX392050452719354437883869[N]
Force 2MAX380645603350343238163856[N]
Force 3MAX19102151188418921886936[N]
Force 4MAX212213450[N]
Force 5MAX34922412[N]
Force 6MAX200122381697171519232105[N]
Table 2. Declared strength of the elements.
ElementFlimit
C12225[N]
C211,121[N]
C311,121[N]
S1 and S244,482[N]
S3 and S517,793[N]
S4 and S626,689[N]
Table 3. Recalculation of critical force for test case one.
Elementb1 [%]Flimit [N]Fcrit1 [kN]
S151.144,48286.971
S249.744,48289.590
S324.917,79371.401
S40.0326,68989,134
S50.0417,79346,058.5
S626.126,689102.231
C124.922258.9283
C249.716,01432.252
C326.111,12142.596
Table 4. Extracting the limit force at the weakest point of the harness for all test configurations.
Fcrit_C1 [kN]
Test one8.9283
Test two7.963
Test three8.972
Test four9.098
Test five9.143
Test six18.51
Disclaimer/Publisher’s Note: The statements, opinions and data contained in all publications are solely those of the individual author(s) and contributor(s) and not of MDPI and/or the editor(s). MDPI and/or the editor(s) disclaim responsibility for any injury to people or property resulting from any ideas, methods, instructions or products referred to in the content.

