Article

Service Life Modelling of Single Lap Joint Subjected to Cyclic Bending Load

1
College of Engineering and Technology, American University of the Middle East, Egaila 54200, Kuwait
2
Mechanical Engineering Department, College of Engineering, University of Bahrain, Sakhir 32038, Bahrain
3
Department of Mechanical Engineering, Erzurum Technical University, 25050 Erzurum, Turkey
*
Author to whom correspondence should be addressed.
Aerospace 2023, 10(1), 8; https://doi.org/10.3390/aerospace10010008
Submission received: 10 November 2022 / Revised: 15 December 2022 / Accepted: 19 December 2022 / Published: 22 December 2022

Abstract

:
Bonded joints used in wing sections and frames of aircraft structures are mostly exposed to cyclic loadings instead of static ones during their services. Bending types of dynamic loadings are mostly encountered. In this study, the fatigue response of a single lap joint (SLJ) exposed to bending loading was studied with the developed advanced finite-element (FE) model. The cohesive zone model describing the behaviour of the adhesive layer used the damage mechanism, where static and fatigue damages were linked to each other; i.e., the total damage was accumulated because of material deterioration and cyclic plastic separation. This enabled us to predict the fatigue characteristics including the finite fatigue life, crack propagation rate using Paris law. The model was implemented via a user-defined UMAT subroutine offered in ABAQUS-Standard. The numerical model was validated by experiments available in the literature. The fatigue performance of an SLJ subjected to bending loading was investigated for different lap joint configurations. A smaller bending load, a thicker adherend or a longer overlap length (OL) led to enhanced fatigue life. For instance, the fatigue life was observed to increase up to 50 times for a 66% increase in OL.

1. Introduction

Advanced engineering applications including automotive, marine, space and aeronautics have frequently utilised adhesively bonded connections as they provide noteworthy advantages such as lessened stress concentrations, a more uniform stress distribution, lighter weights, etc. [1,2,3,4]. During their services, these joints are often subjected to bending loads particularly in aviation sectors [5]. A few studies are available in the literature discussing the performance of single lap joints (SLJs) under flexural loading. For instance, Grant et al. [6] tested lap joints with a toughened epoxy adhesive and mild steel adherends subjected to tension, three-point and four-point loadings. It was observed that four-point testing resulted in different failures than those of the other two loadings conditions. The numerical studies in [7,8] performed stress analysis to explain the failure of SLJs subjected to bending load. In similar studies, Nakano et al. [9] conducted a study for the scarf joints, while Liu et al. [10] performed one for dissimilar adherends. In these studies, the lap joint strength was evaluated for different materials or lap joint geometries. Additionally, Akpinar [11] compared the mechanical behaviour of double strap joints with aluminium and carbon/epoxy composite adherends under bending moment. Similarly, the experimental study in [12] compared the bending moment performance of SLJs with different nanofillers added to the adhesive layer. Kadioglu and Demiral [13] investigated the failure behaviour of the SLJs of angle-plied composites subjected to three-point bending. The influence of various model parameters such as adherend thickness, overlap length and the thickness of the adhesive layer were investigated in detail.
The SLJs in their operating conditions were not only exposed to static loadings but also to cyclic loadings. Very few studies exist in the literature investigating the performance of SLJs under bending fatigue loadings. For instance, Zamani et al. [14] demonstrated the influence of different additives on fatigue life and crack initiation phase of Al-GFRP bonded lap joints under a four-point bending load. It was observed that nanoparticles altered the failure mode of the SLJs from adhesive to cohesive. The synergistic effect of two or more nanoparticle types on the bending fatigue performance of the adhesive was studied in [15]. In another study, Zamani et al. [16] studied the influence of fatigue load ratio and maximum fatigue load on the crack initiation cycles and total life for Al-GFRP bonded lap joints subjected to four-point bending. Similarly, Gavgali et al. [17] investigated the fatigue performance of step-lap joints. It was reported that applying three-step-lap joints onto the overlap region largely decreased the fatigue strength limit of the joint due to the reduced rigidity of the material at the edges of the overlap region. Akpinar and Sahin [5] performed fracture load analysis of the SLJs subjected to fully reversed bending fatigue load for different thicknesses of the adhesive material experimentally. Choi et al. [18] proposed a mixed-mode cohesive zone-based fatigue crack growth model in conjunction with the special traction–separation relationship and used it for different tests including the three-point bending test. In another study, Liang et al. [19] developed a cohesive zone model within the extended finite element method (xFEM) discrete damage modelling framework for fatigue analysis of laminated composites and predicted its response under a mixed-mode bending test.
The fatigue performance of structural components using adhesive bonding systems in their designs is crucial, as the cyclic loading may lead a structure to fail even at a small percentage of its static strengths. The nature of fatigue failure is very complicated in terms of crack initiation, propagation, the geometry of bonded joints and complex material behaviour under loading/unloading regimes. Therefore, an accurate prediction of fatigue life is a challenge, especially, in terms of the crack initiation cycle (Ni), the failure cycle (Nf), the crack propagation rate ( d a / d N ) and strain energy release rate, which are the main objectives of this work. These facts need to be elucidated to describe the failure characteristics of the joints. However, in limited studies [11,12,13,14,15,16,17,18,19,20], these points were addressed partially for SLJs subjected to bending fatigue loading, which is addressed in the current numerical study. In the developed finite element (FE) model, the load was applied first up to its maximum value within a static step followed by the fatigue one, where it was held constant. The aluminium alloy adherends, AA2024-T3, were modelled using an elasto-plastic material model. Cohesive zone elements were used to model the adhesive layer, Araldite-2015. The rate of fatigue damage ( D / N ) was calculated based on damage mechanics, where the damage accumulates due to cyclic material deterioration. The life spent in the propagation phase was obtained using the Paris law relating the strain energy release rate (SERR) to the rate of the crack growth. The influence of bending direction, adherend thickness and overlap length on the fatigue performance of an SLJ was investigated in depth. This model was implemented via a user-defined UMAT subroutine. The developed model was validated with the experiments in the literature.
This work is laid out as follows: Section 2 describes the created FE model and gives a brief theoretical explanation of the cohesive zone used in the model. Section 3 presents the findings and discussion of the parametric analysis that was conducted after the numerical model is validated with the available experimental data in the literature. Section 4 concludes the study with a few notes.

2. Numerical Modelling

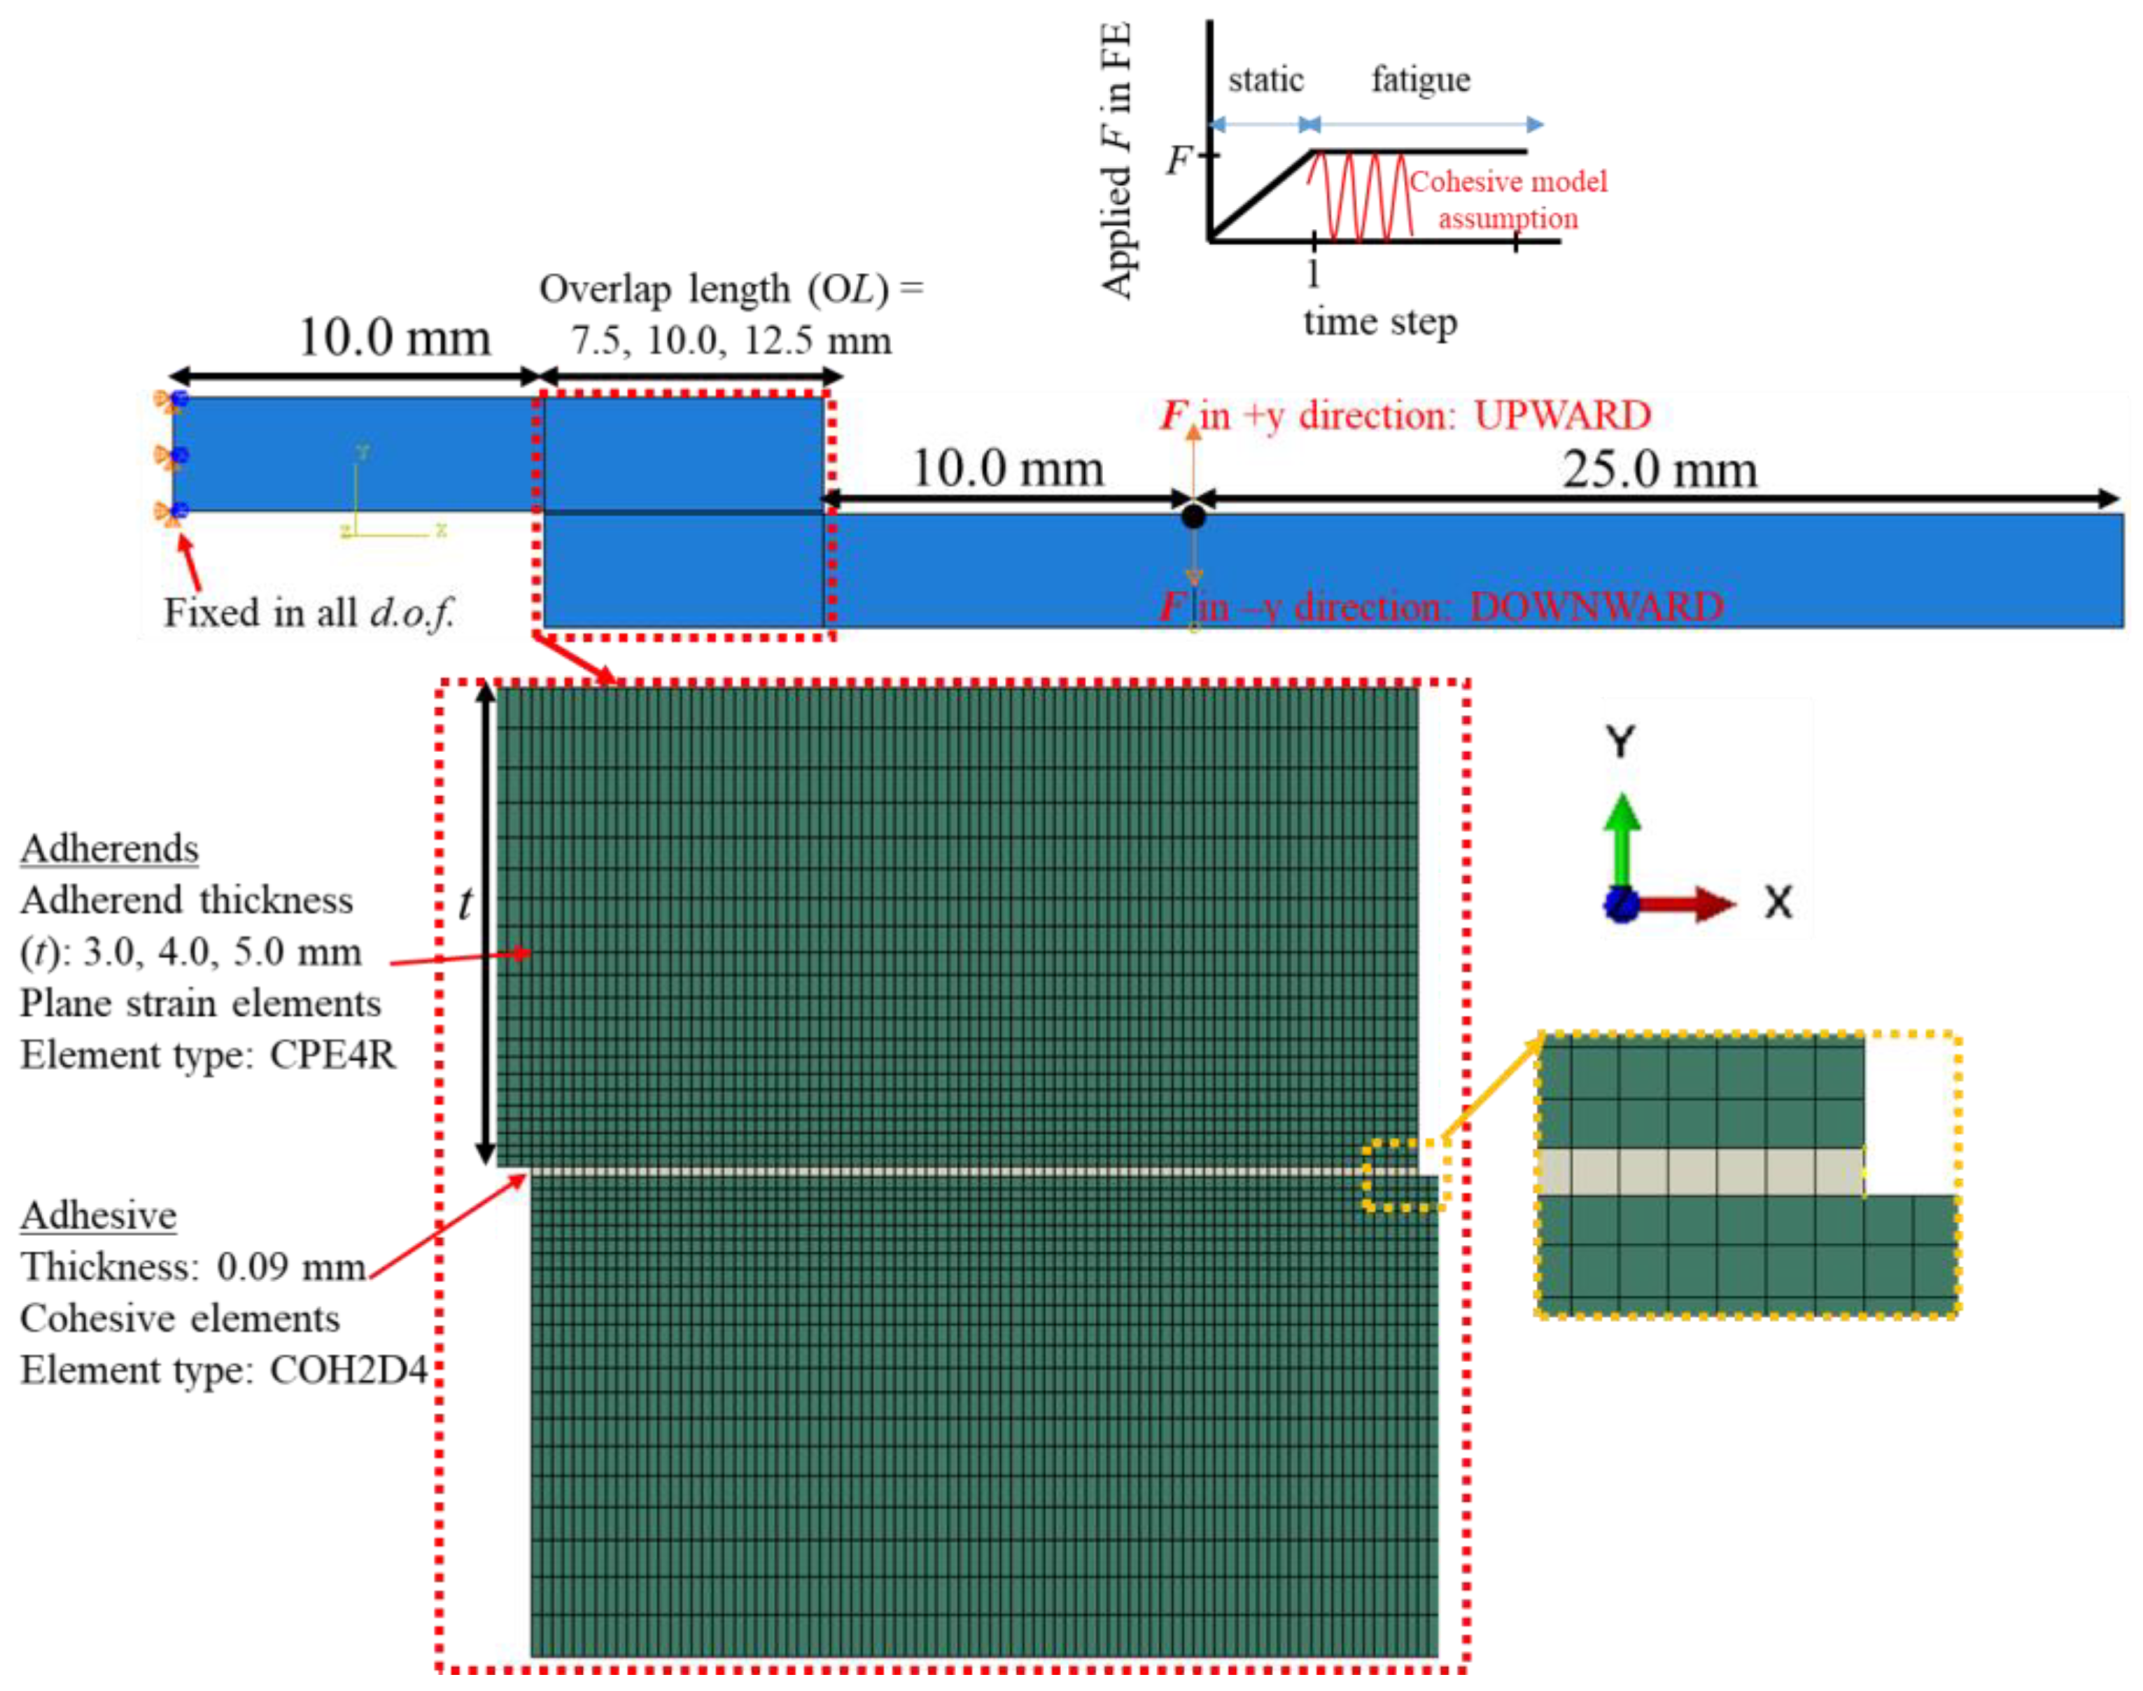
2.1. Finite Element Modelling

A model of adhesively bonded SLJ of aluminium adherends subjected to bending cyclic loading was developed using the ABAQUS-Standard FE program [20]. Its details are shown in Figure 1. The dimensions were selected in accordance with the experiments in Akpinar et al. [2] for verification purposes. The 2D FE simulations were performed for different configurations of the SLJs, where the cycling load F was changed to 350, 400, and 500 N, and the thicknesses of the adherends were 3.0, 4.0 and 5.0 mm, whereas the overlap lengths were 7.5, 10.0 and 12.5 mm.
Four-noded plane strain elements (CPE4R) and four-noded cohesive elements (COH2D4) were used to model the behaviours of adherends and the adhesive layer, respectively. An element size of 0.090 mm was used for the adhesive layer along the overlap length, while a single element was used in the thickness direction. The adherends on the side of the overlap region were meshed more finely when compared to the opposite side with a bias ratio of 4. In addition, the adherends in the direction of loading and support points were meshed coarsely with a bias ratio of 2. This resulted in 7724 CPE4R elements and 84 COH2D4 elements. The FE discretization of the SLJ is shown in Figure 1 and also satisfied the mesh convergency study. Three different element sizes, 0.045 mm, 0.090 mm and 0.180 mm, along the OL in the adhesive layer were considered. The respective number of failure cycles for the SLJ with 4.0 mm adherend thickness subjected to 4000 N was 4342, 4308 and 4113 cycles, while the von Mises stress value at the right end element upon the completed static loadings was 26.06 MPa, 26.65 Mpa and 27.47 Mpa, respectively. The convergence was obtained for the element size equalled to 0.090 mm where the differences for both parameters were less than 3% when compared to those of the finer mesh.
The left side of the SLJ was restricted in all degrees of freedom, while the upper point of the lower adherend with a distance of 10.0 mm from the tip of the overlap length was allowed to move only in the y-direction, where the bending load was applied from this point.
Elastic perfectly plastic constitutive equations available in Abaqus were used to describe the behaviour of the adherends. The fatigue damage model formed by degrading the bi-linear traction–separation response was used to simulate the behaviour of the adhesive layer. It was applied following the study in [21] as follows: Initially, the maximum load was applied within a static step, where no fatigue damage accumulation occurs. This was followed by the fatigue step in which the maximum load was held constant, where the fatigue degradation was calculated through the cohesive model assumption. During this cycle, the number of loading cycles was considered to be proportional to the time increment of the analysis [17]. In the next section, the respective constitutive equations used in the cohesive model were explained.

2.2. Constitutive Equations

A bi-linear traction–separation law was used in the static model. The mixed-mode equivalent displacement jump λ was expressed in terms of opening, Mode 1 ( n o r m a l ), and shear modes, Mode 2 ( s h e a r ) as below:
λ = K s h e a r s h e a r 2 + K n o r m a l 2 K s h e a r 2 s h e a r 2 + K 2 n o r m a l 2
To disregard negative values, the Macauley operator ( . ) was used for n o r m a l . The relationship between K , the interface stiffness for the opening mode, and K s h e a r , the shear mode penalty stiffness, is expressed as:
K s h e a r K = G n o r m a l , c G s h e a r , c ( τ s h e a r , c τ n o r m a l , c ) 2
In this equation, G n o r m a l , c and G s h e a r , c correspond to the critical strain energy release rates for Modes 1 and 2, respectively, while τ n o r m a l , c and τ s h e a r , c are the interfacial strengths of the respective modes. The initial displacement jumps for different modes were calculated using the following equations:
n o r m a l 0 = τ n o r m a l , c K s h e a r 0 = τ s h e a r , c K s h e a r
Then, the onset ( λ 0 ) and critical displacement jumps ( λ c ) were calculated as follows:
λ 0 = K n o r m a l 2 + [ K s h e a r s h e a r 2 K ( n o r m a l 0 ) 2 ] [ B ] n K B λ c = K n o r m a l 0 n o r m a l c + [ K s h e a r 0 s h e a r c K n o r m a l 0 n o r m a l c ] [ B ] n K B λ 0
In these equations, i c = 2 G i , c / τ i , c . K B , the mode-dependent penalty stiffness is equal to K ( 1 B ) + B K s h e a r , following the work of Turon et al. [22]. N corresponds to the material constant from the Benzeggagh–Kenane criterion [23]. B, the local mixed-mode ratio, is computed by:
B = K s h e a r s h e a r 2 K s h e a r s h e a r 2 + K n o r m a l 2
A critical damage r t was defined to check whether the displacement jump was large enough to produce damage in the model. It was calculated using the displacement jump values at instantaneous time as well as at the next step as follows:
r t = λ 0 λ c λ c D s t a t i c t [ λ c λ 0 ] r t + 1 = max { r t , λ }
Here, D s t a t i c t denoting the static damage is calculated by:
D s t a t i c t + 1 = λ c ( r t + 1 λ 0 ) r t + 1 ( λ c λ 0 )
With the calculated damage value at the upcoming time step, the stiffness loss in the element was known, and the traction was obtained using τ i = D i j λ j .
For fatigue, the damage model in [24] was adjusted. In the analysis, the force was taken as constant after it reached its maximum value at the end of the static step.
In this cycling damage model, the evolution of the damage variable was related to the crack growth rate ( d a / d N ) with the following:
D N = D l D l D N l D N = l e l C Z d a d N
where l D represented the length of the damaged area, l D / N was its growth rate, and l C Z / l e corresponded to the proportion of the number of elements in the cohesive zone (CZ). Ref. [24] assumed that the ratio of the damaged area with respect to the element size ( l D / l e ) was equal to the ratio of the dissipated energy over the fracture toughness:
l D l e = D 0 f ( 1 D ) + D 0
Rewriting Equations (7) and (8) produced the following equation:
D N = 1 l C Z ( f ( 1 D ) + D 0 ) 2 f 0 d a d N
l C Z , the length of the cohesive zone, was obtained for the mixed mode via l C Z = ( 9 π / 32 ) ( E m G c / ( τ c ) 2 ) . Here, G c , the mixed-mode fracture toughness, was determined using the pure mode values using the Benzegaggh–Kenane criterion as G c = G n o r m a l , c + ( G s h e a r , c G n o r m a l , c ) [ B ] n . τ c , the mixed-mode interlaminar strength, was calculated using τ c 2 = τ n o r m a l , c 2 + ( τ s h e a r , c 2 τ n o r m a l , c 2 ) [ B ] n . On the other hand, E m was the mixed-mode Young’s modulus. As the aluminium adherends were isotropic, it corresponded to E.
The crack growth rate was computed using the Paris law [25], d a / d N = C . G m , where C and m were the material constants. G was the change in strain energy release rate within each fatigue cycle and calculated by G = G m a x ( 1 R 2 ) , where R was the load ratio: the ratio of the minimum and maximum loads during the fatigue loading. G m a x represented the area under the traction separation curve as shown below:
G m a x = τ n o r m a l , c 2 [ λ f ( λ f λ m a x ) 2 ( λ f λ 0 ) ]
where λ f and λ m a x were the final and maximum displacement jumps during the loading cycle, respectively. The stable crack propagation depended on the following condition: G t h < G m a x < G C . That meant the crack growth rate became unstable if the strain energy release rate was larger than the critical strain energy release rate, G C , or the crack could not propagate if this value was less than the threshold value, G t h . This threshold value was selected to be 0.01 G C following Ref. [20].
A cycle jump approach [26] was used in the computations to circumvent the lengthy computational time due to having a large number of cycles. The damage variable at time step i + N i was calculated as follows:
D i + N i = D i + D i N N i
where D i was the damage variable at time step I, and D i / N was the damage progress rate at the identical time step. N i , the number of cycles that were skipped to the following time step, influenced the exactness of the results and was calculated using
N i = D m a x D i N
Here, the maximum damage increase, D m a x , was chosen by the user, and its smaller value led to more accurate results. D m a x was selected to be 0.001 following the study [24]. Eventually, the total damage was calculated as the summation of static and fatigue damages, D t o t a l = D s t a t i c + D i + N i . Regarding the activation of different failure modes, a mode-dependent penalty stiffness and a cohesive zone length from the study in [27] were used.
The UMAT subroutine was used to accommodate the constitutive equations above in the computations. Its flowchart can be found elsewhere [28]. Table 1 shows the material parameters used in the simulations for modelling the behaviour of adherends and the adhesive layer.

3. Result and Discussion

In this section, firstly, the numerical model was calibrated and verified with the experiments from the literature. Afterwards, the influence of different model parameters on the fatigue damage in the adhesive layer was investigated in depth.

3.1. Validation of the FE Model

The SLJs with adherend thicknesses of 3.0 mm and 4.0 mm subjected to fatigue load of 500 N were considered for the calibration of Paris law constants C and m (see Table 1). A load ratio of −1.0 was considered; i.e., a fully reversed bending fatigue load was applied. Table 2 compares the numerically obtained number of cycles to failure, Nf, with the experimental ones [5] as well as the results for other configurations. For the values of C = 1.3 × 10⁻¹² N/mm3 and m = 2.1, Nf was found to be 841 cycles and 1059 cycles numerically for t = 3.0 mm and 4.0 mm, respectively. The simulation results are in good agreement with obtained experimental results of 1190 cycles and 1130 cycles, respectively. After the calibration of the model, the developed model was checked for verification purposes for fatigue loads of 400 N and 350 N. For t = 3.0 mm, the experimentally and numerically obtained Nf values were 1599 cycles and 2259 cycles for F = 400 N, while there were 3796 cycles and 3581 cycles for F = 350 N, respectively.
On the other hand, for t = 4.0 mm, the Nf values were 3964 cycles and 4308 cycles for F = 400 N, while there were 9348 cycles and 6616 cycles for F = 350 N, respectively. The results revealed that the predictions were in accord with the experiments, especially for the following SLJ configurations: (F = 400 N, t = 4.0 mm and F = 350 N, t = 3.0 mm), whereas some deviations were noticed for other configurations, namely (F = 400 N, t = 3.0 mm and F = 350 N, t = 4.0 mm). That could be explained by the fact that the experimental results were just the average of three tests performed, and their deviations were not mentioned in the article [5]. A better comparison could be made if the deviations had been given. In general, a reasonable match between the experiments and numerical predictions was achieved at least qualitatively. For instance, it was noticed from the experiments that a higher fatigue load and/or a thinner adherend led to shorter fatigue life and is verified by the simulation results.
Furthermore, the influence of different parameters such as loading direction, adherend thickness and overlap length on the crack propagation rate was investigated in a row. When the SLJ was subjected to a fully reversed bending fatigue load with R = −1.0, the crack expanded from both ends of the overlap length simultaneously, making the analysis of the damage progress in the adhesive layer difficult. For its better understanding, the fatigue load ratio of 0.0 (min loading of 0.0 and maximum loading of F either in the upward or downward direction) was considered in the next subsections, where the crack initiated and propagated only from the tension side of the adhesive [16,29] instead of both sides as in the case of R = −1.0.
Similarly, the distributions of fatigue damage and the crack propagation rate in the adhesive layer for the SLJ with 4.0 mm adherends subjected to 500 N are shown in Figure 2. at two different cycles (252 cycles and 1059 cycles). The former representing the crack initiation life (Ni) was defined as the number of cycles at which the damage reached a minimum of 90% at one end of the adhesive layer. It was noticed that the damage initiated after 252 cycles from the end of the overlap length subjected to tensile stress and propagated towards the other end, and finally, the fatigue damage was almost completed after 1059 cycles. When the crack propagation rate was checked at these two cycles, it was around 3 × 10⁻⁴ mm/cycle at the very beginning and increased to the maximum value of 4 × 10⁻³ mm/cycle before the failure. In the simulations, the position of the crack represented by the elements with complete damage was not reached yet, as the completely damaged ones could not carry loading anymore. This is highlighted in Figure 2 for N = 1059 cycles, where the crack propagation rate was computed from the elements where the damage was not completed yet.

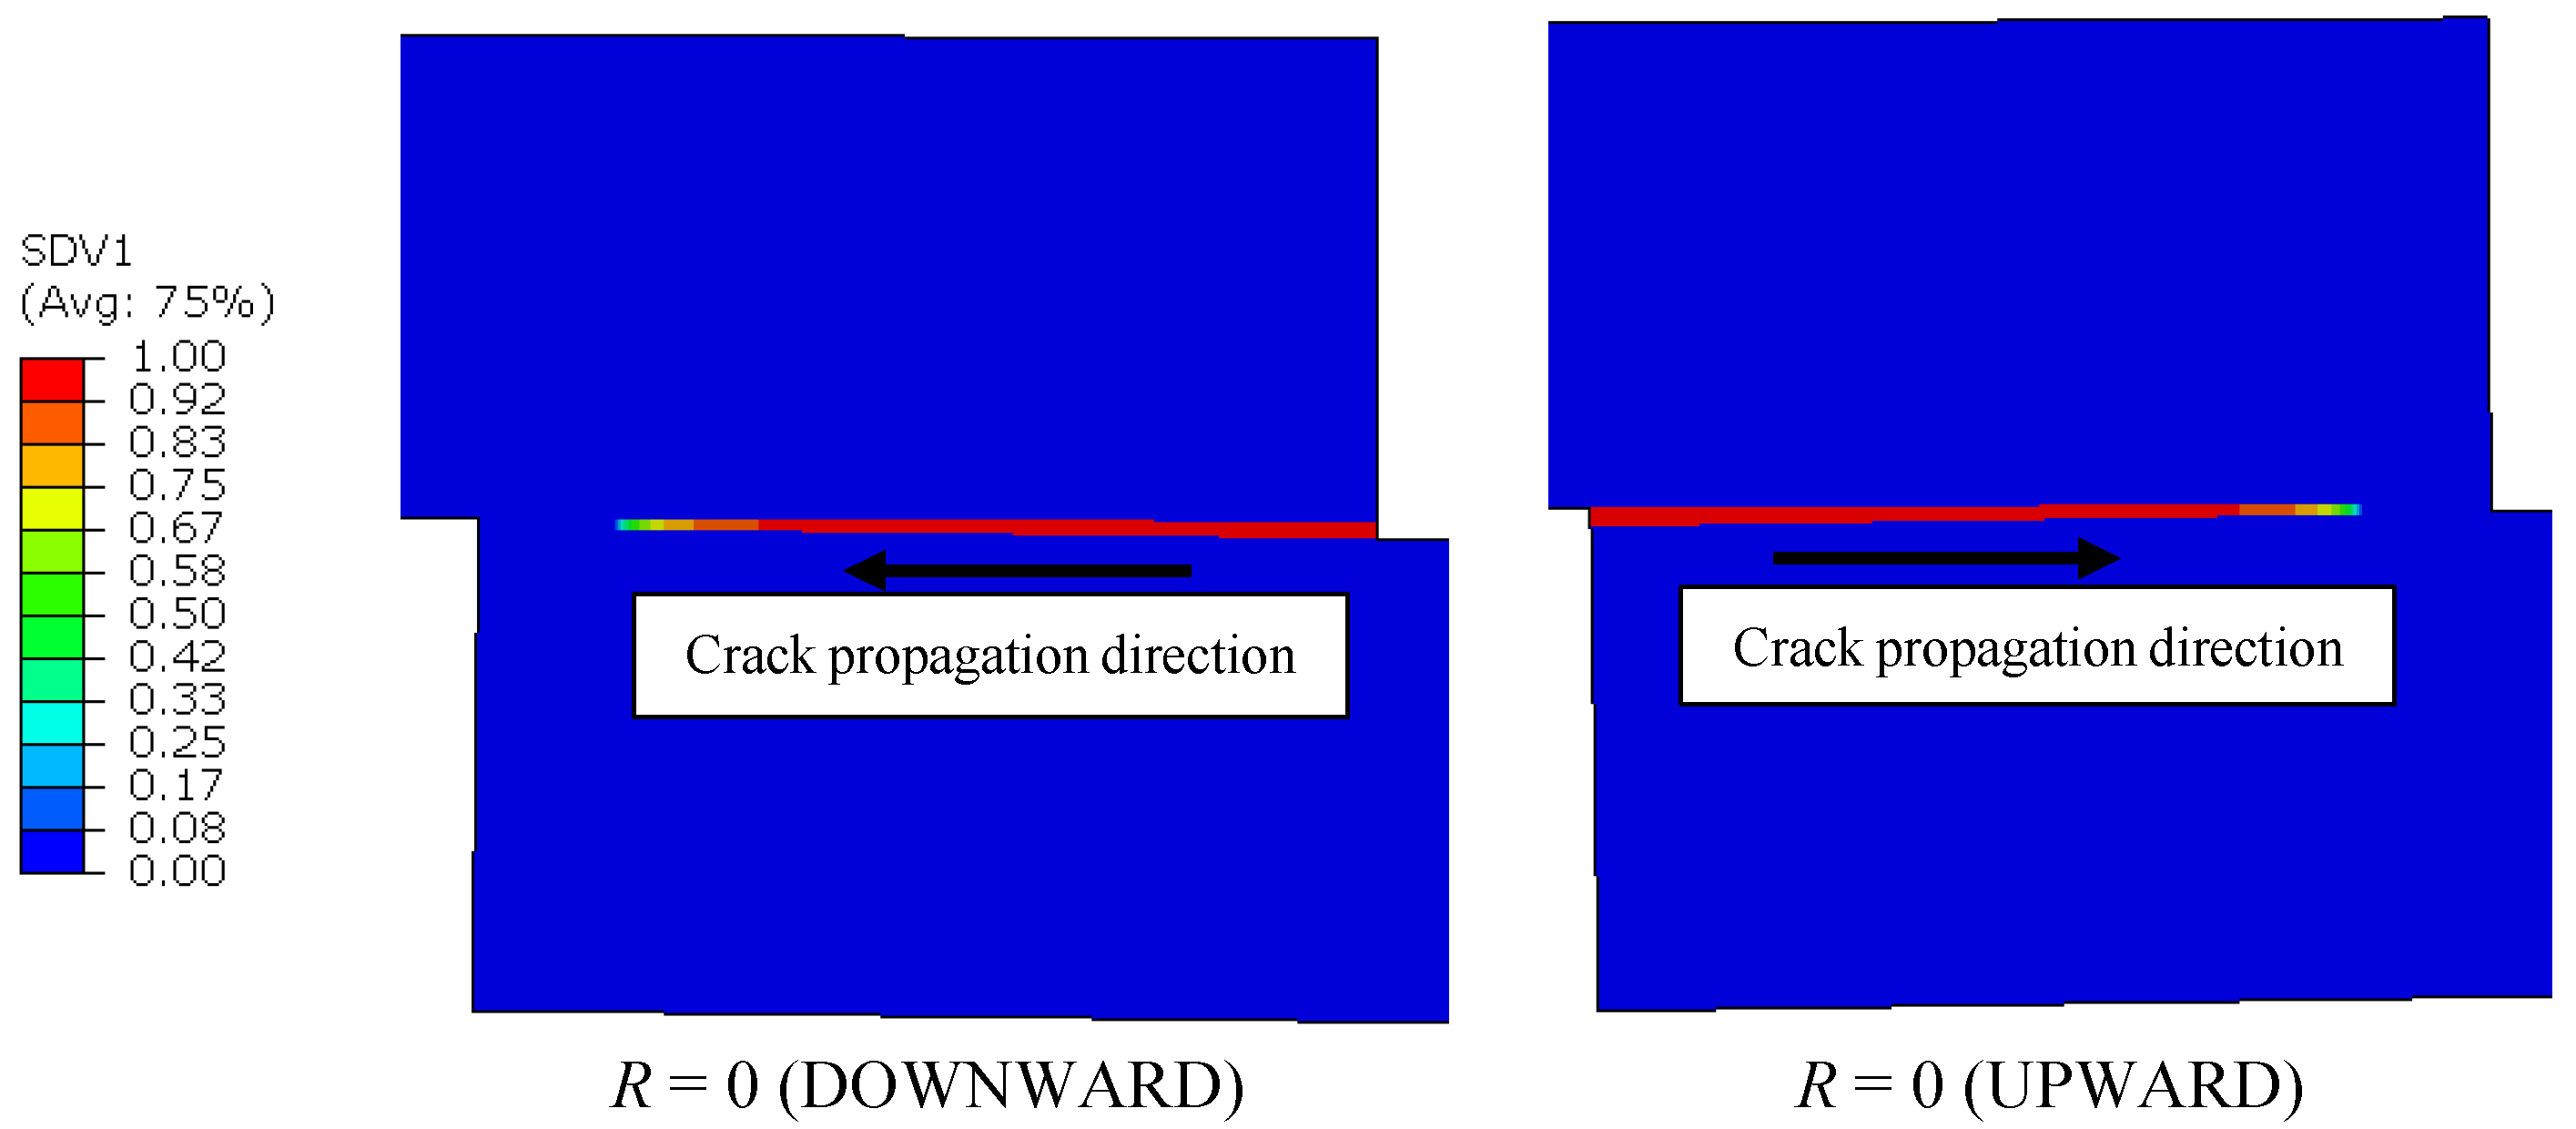
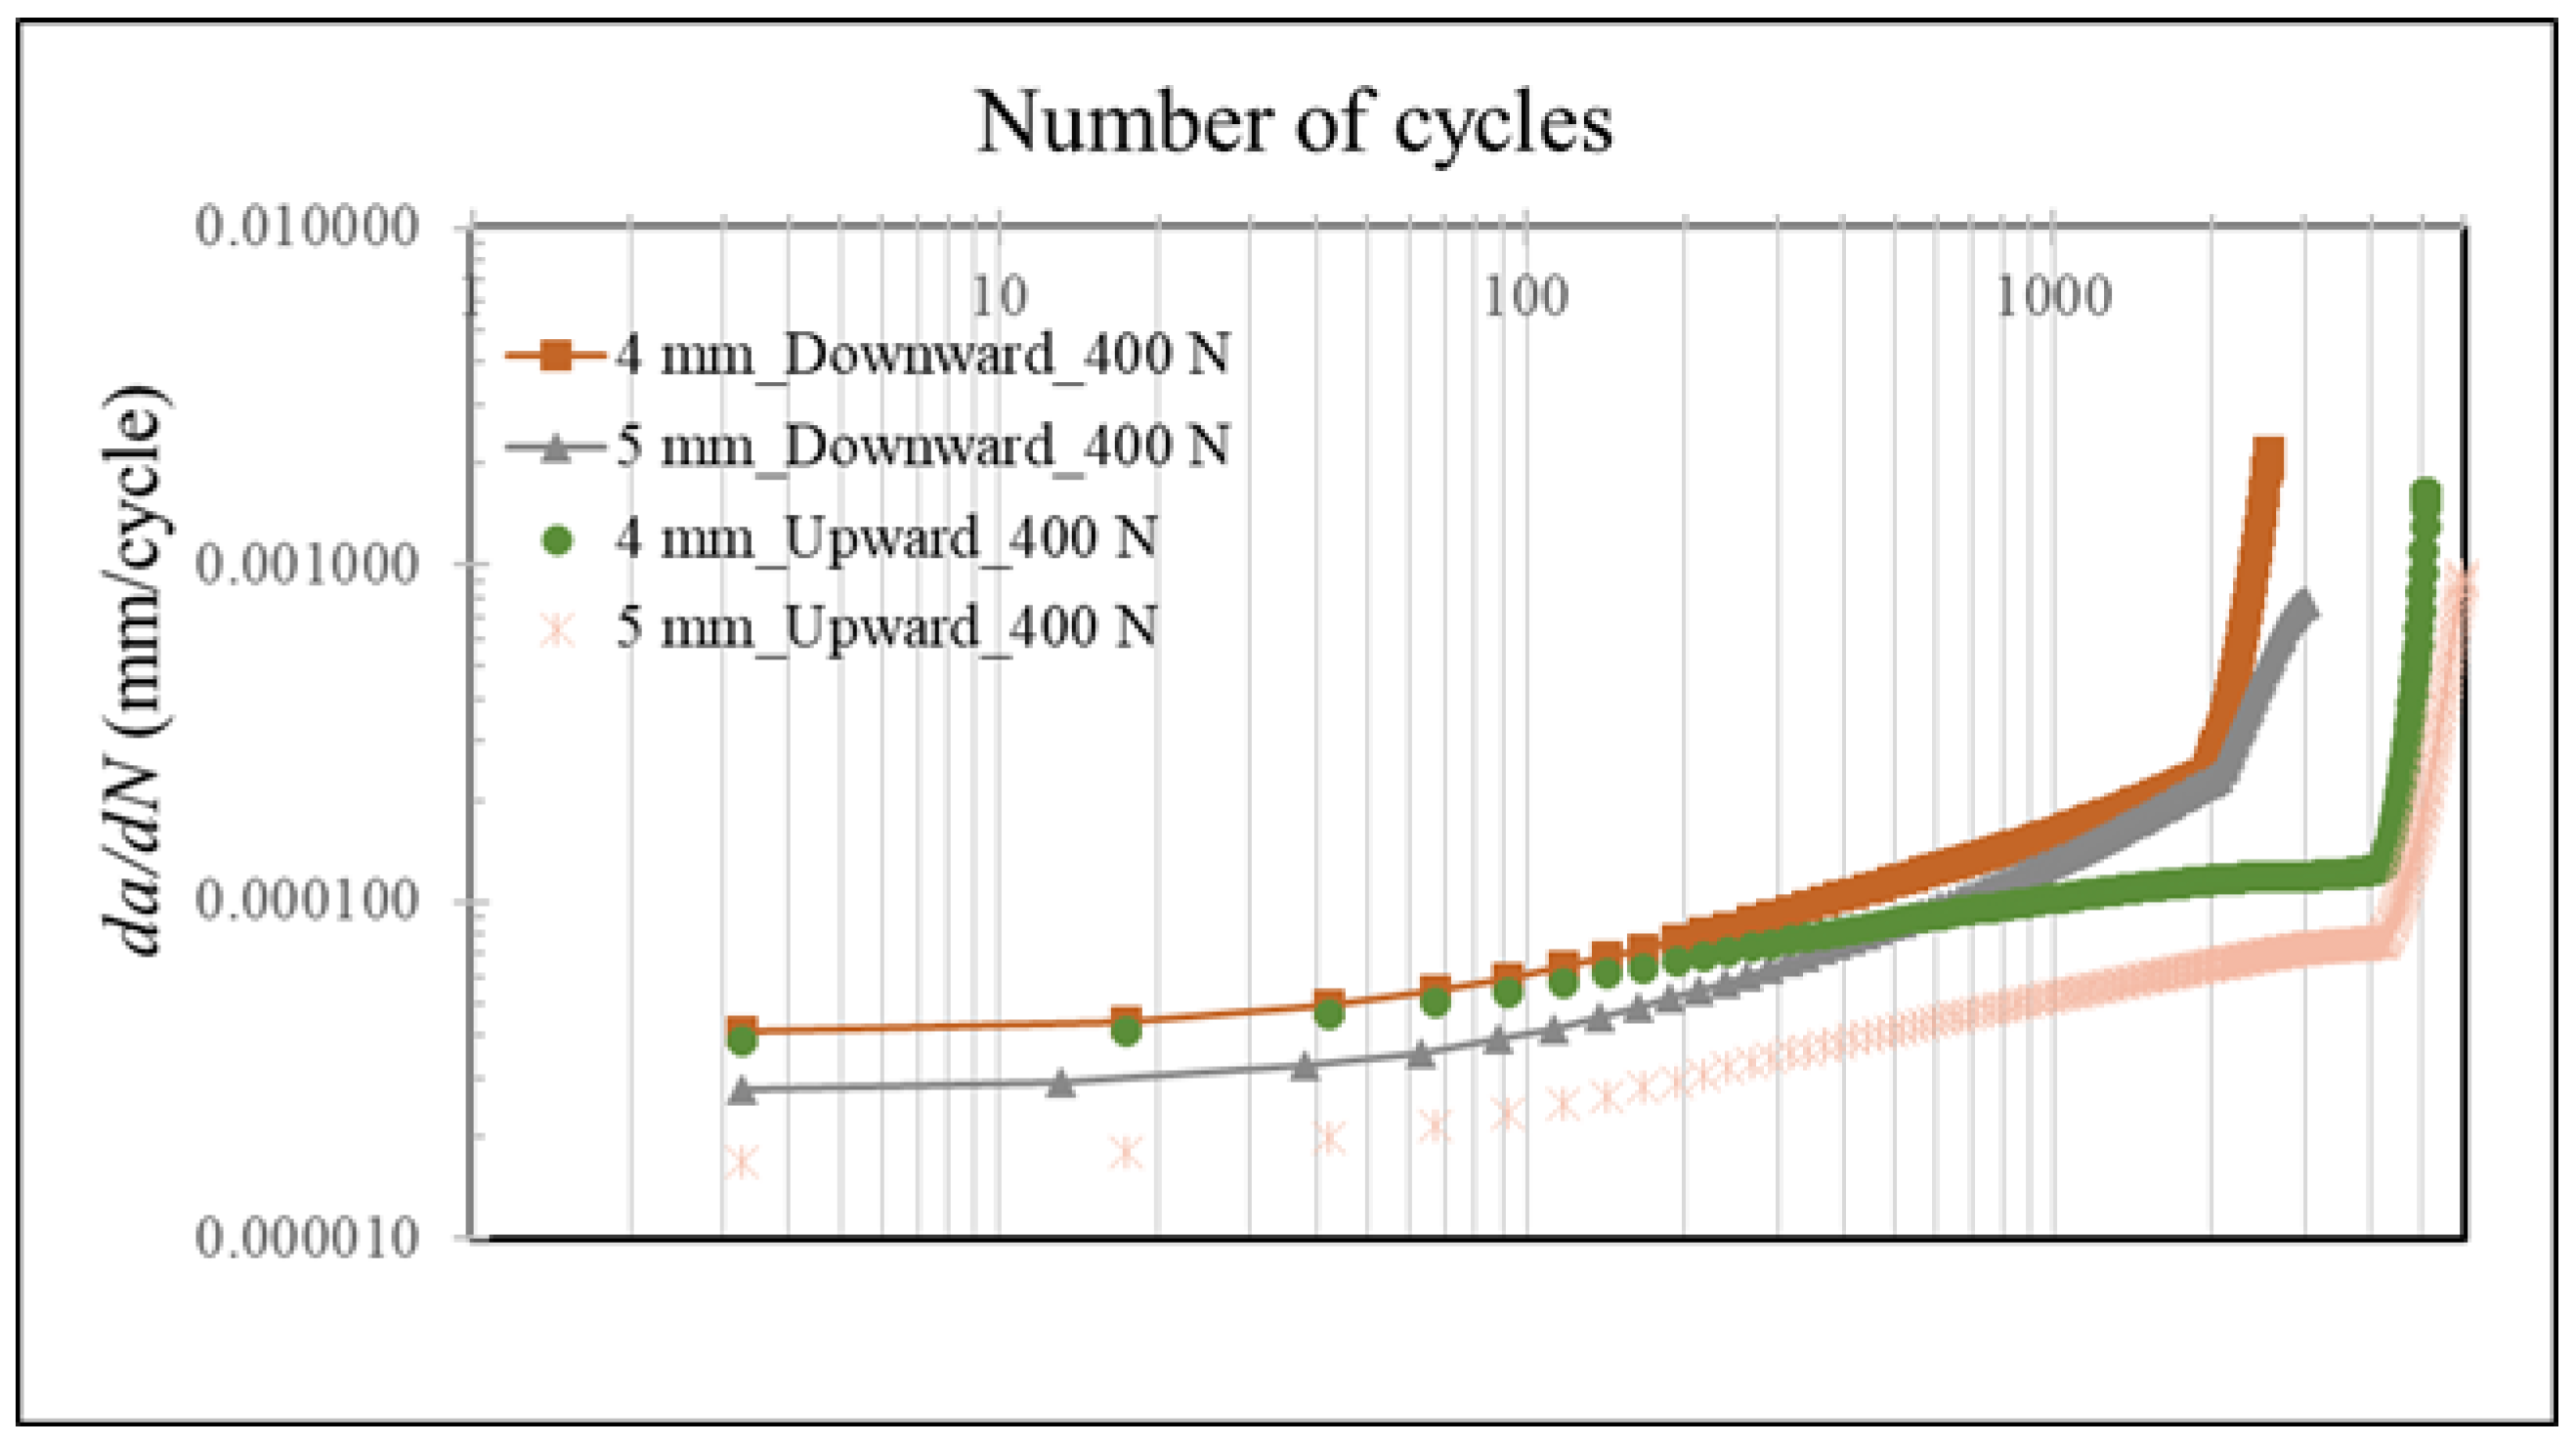
3.2. Effect of Loading Direction

In this section, the influence of loading direction on the fatigue response of the SLJ was investigated. For this purpose, the loading values of 400 N and 500 N were applied to the SLJ with 4 mm adherend thickness in −y (downward) and +y (upward) directions (see Figure 1). Figure 3 shows the respective directions of the crack propagation in the adhesive layer of SLJ with 4.0 mm adherend thickness, where it was opposite to each other as expected. Figure 4 presents the Nf values of all the configurations studied. They were 2564 cycles and 5097 cycles for F = 400 N and 1084 cycles and 2523 cycles for F = 500 N when the load was applied to the 4.0 mm thick adherend in the downward and upward directions, respectively. The corresponding values for adherend thickness equal to 5.0 mm were 4738 cycles and 6417 cycles for F = 400 N and 1912 cycles and 4263 cycles for F = 500 N. It was noticed that the direction of loading affected the life cycle significantly, where the life of the SLJ was shorter when the loading was in the downward direction when compared to that of the upward direction. That could be explained by the proximity of the loading to the crack initiated in the adhesive layer. From the fracture mechanics point of view, when the applied load was closer to the potential crack site, the crack was nucleated and expanded faster. Here, when F was applied in the downward direction, the crack nucleated on the right end side of the overlap length, and this was closer to the loading point, which, in turn, led to a shorter fatigue life.
The ratio of the lives for the SLJs based on the change in the loading direction was investigated. It was observed that the life of the SLJ with 4 mm adherend thickness was 1.99 times longer with a 400 N loading in the upward direction when compared to that for the opposite direction, i.e., the ratio of 5135 cycles and 2584 cycles. This ratio was 2.13 for 5 mm thickness. When the loading was increased to 500 N, it became 2.33 and 2.92 for t equal to 4.0 mm and 5.0 mm, respectively. These results revealed that when the amount of loading was increased, the influence of loading direction became more prominent.
To obtain an insight into the failure response of the SLJ with respect to the loading direction, da/dN was plotted for all the configurations studied when the adherend thickness was 4.0 mm (Figure 5a). Overall, the crack propagation rate increased with the advancement of the cyclic loading, which was followed by a sudden jump in its value just before the fatigue failure. For instance, when 400 N was applied to the SLJ in the downward direction, the initial crack propagation rate was around 5.0 × 10⁻⁵ mm/cycle and later reached to 2.77 × 10⁻⁴ mm/cycle when n = 2017 cycle, but then it jumped to 2.17 × 10⁻³ mm/cycle in less than additional 600 cycles, i.e., at n = 2584 cycle.
It was observed that the gradient of the crack propagation rate, change in da/dN, was steeper for the upward direction of the loading regardless of its amount. On the other hand, the expansion of the crack was more in steady-state mode for the loading applied in the +y direction; i.e., its rate increased gradually.
Figure 5b presents the da/dN vs. strain energy release rate (SERR) for the cases with t = 4.0 mm. The relation between them was described using Paris law in the constitutive equations, and the constants C and m were the same for all. Therefore, all the obtained data points fell well on the same curve. It was noted that the SERR values were smaller for the bending load in the upward direction in comparison with those for the downward direction; i.e., more energy was released in the latter case.
Understanding the crack nucleation in the SLJs due to the cycling load is an important parameter for their designs, as this phase can often dominate fatigue life at lower loadings. To this end, their lives to damage initiation (Ni) and their ratios in percent with respect to Nf are presented in Figure 4. For all the cases studied, Ni increased when the loading direction was shifted to an upward direction. For example, for t = 4.0 mm, it increased from 470 to 571 cycles and 251 to 321 cycles for F equal to 400 N and 500 N, respectively. The comparison of Ni in Nf showed that the damage initiations occurred at later stages for a bending load in the downward direction. For example, their ratios are 18.21% and 22.88% for F were equal to 400 N and 500 N when t = 4.0 mm, respectively. The respective values for t = 5.0 mm are 19.51% and 18.01%. As the crack propagation rates for these configurations were high and have an increasing tendency in the course of cyclic loading (see Figure 5a), they failed after a smaller number of cycles just after the crack initiated when compared to other configurations (bending in the upward direction), where the cracks could be nucleated before 13.0% of Nf and their da/dN values were smaller.

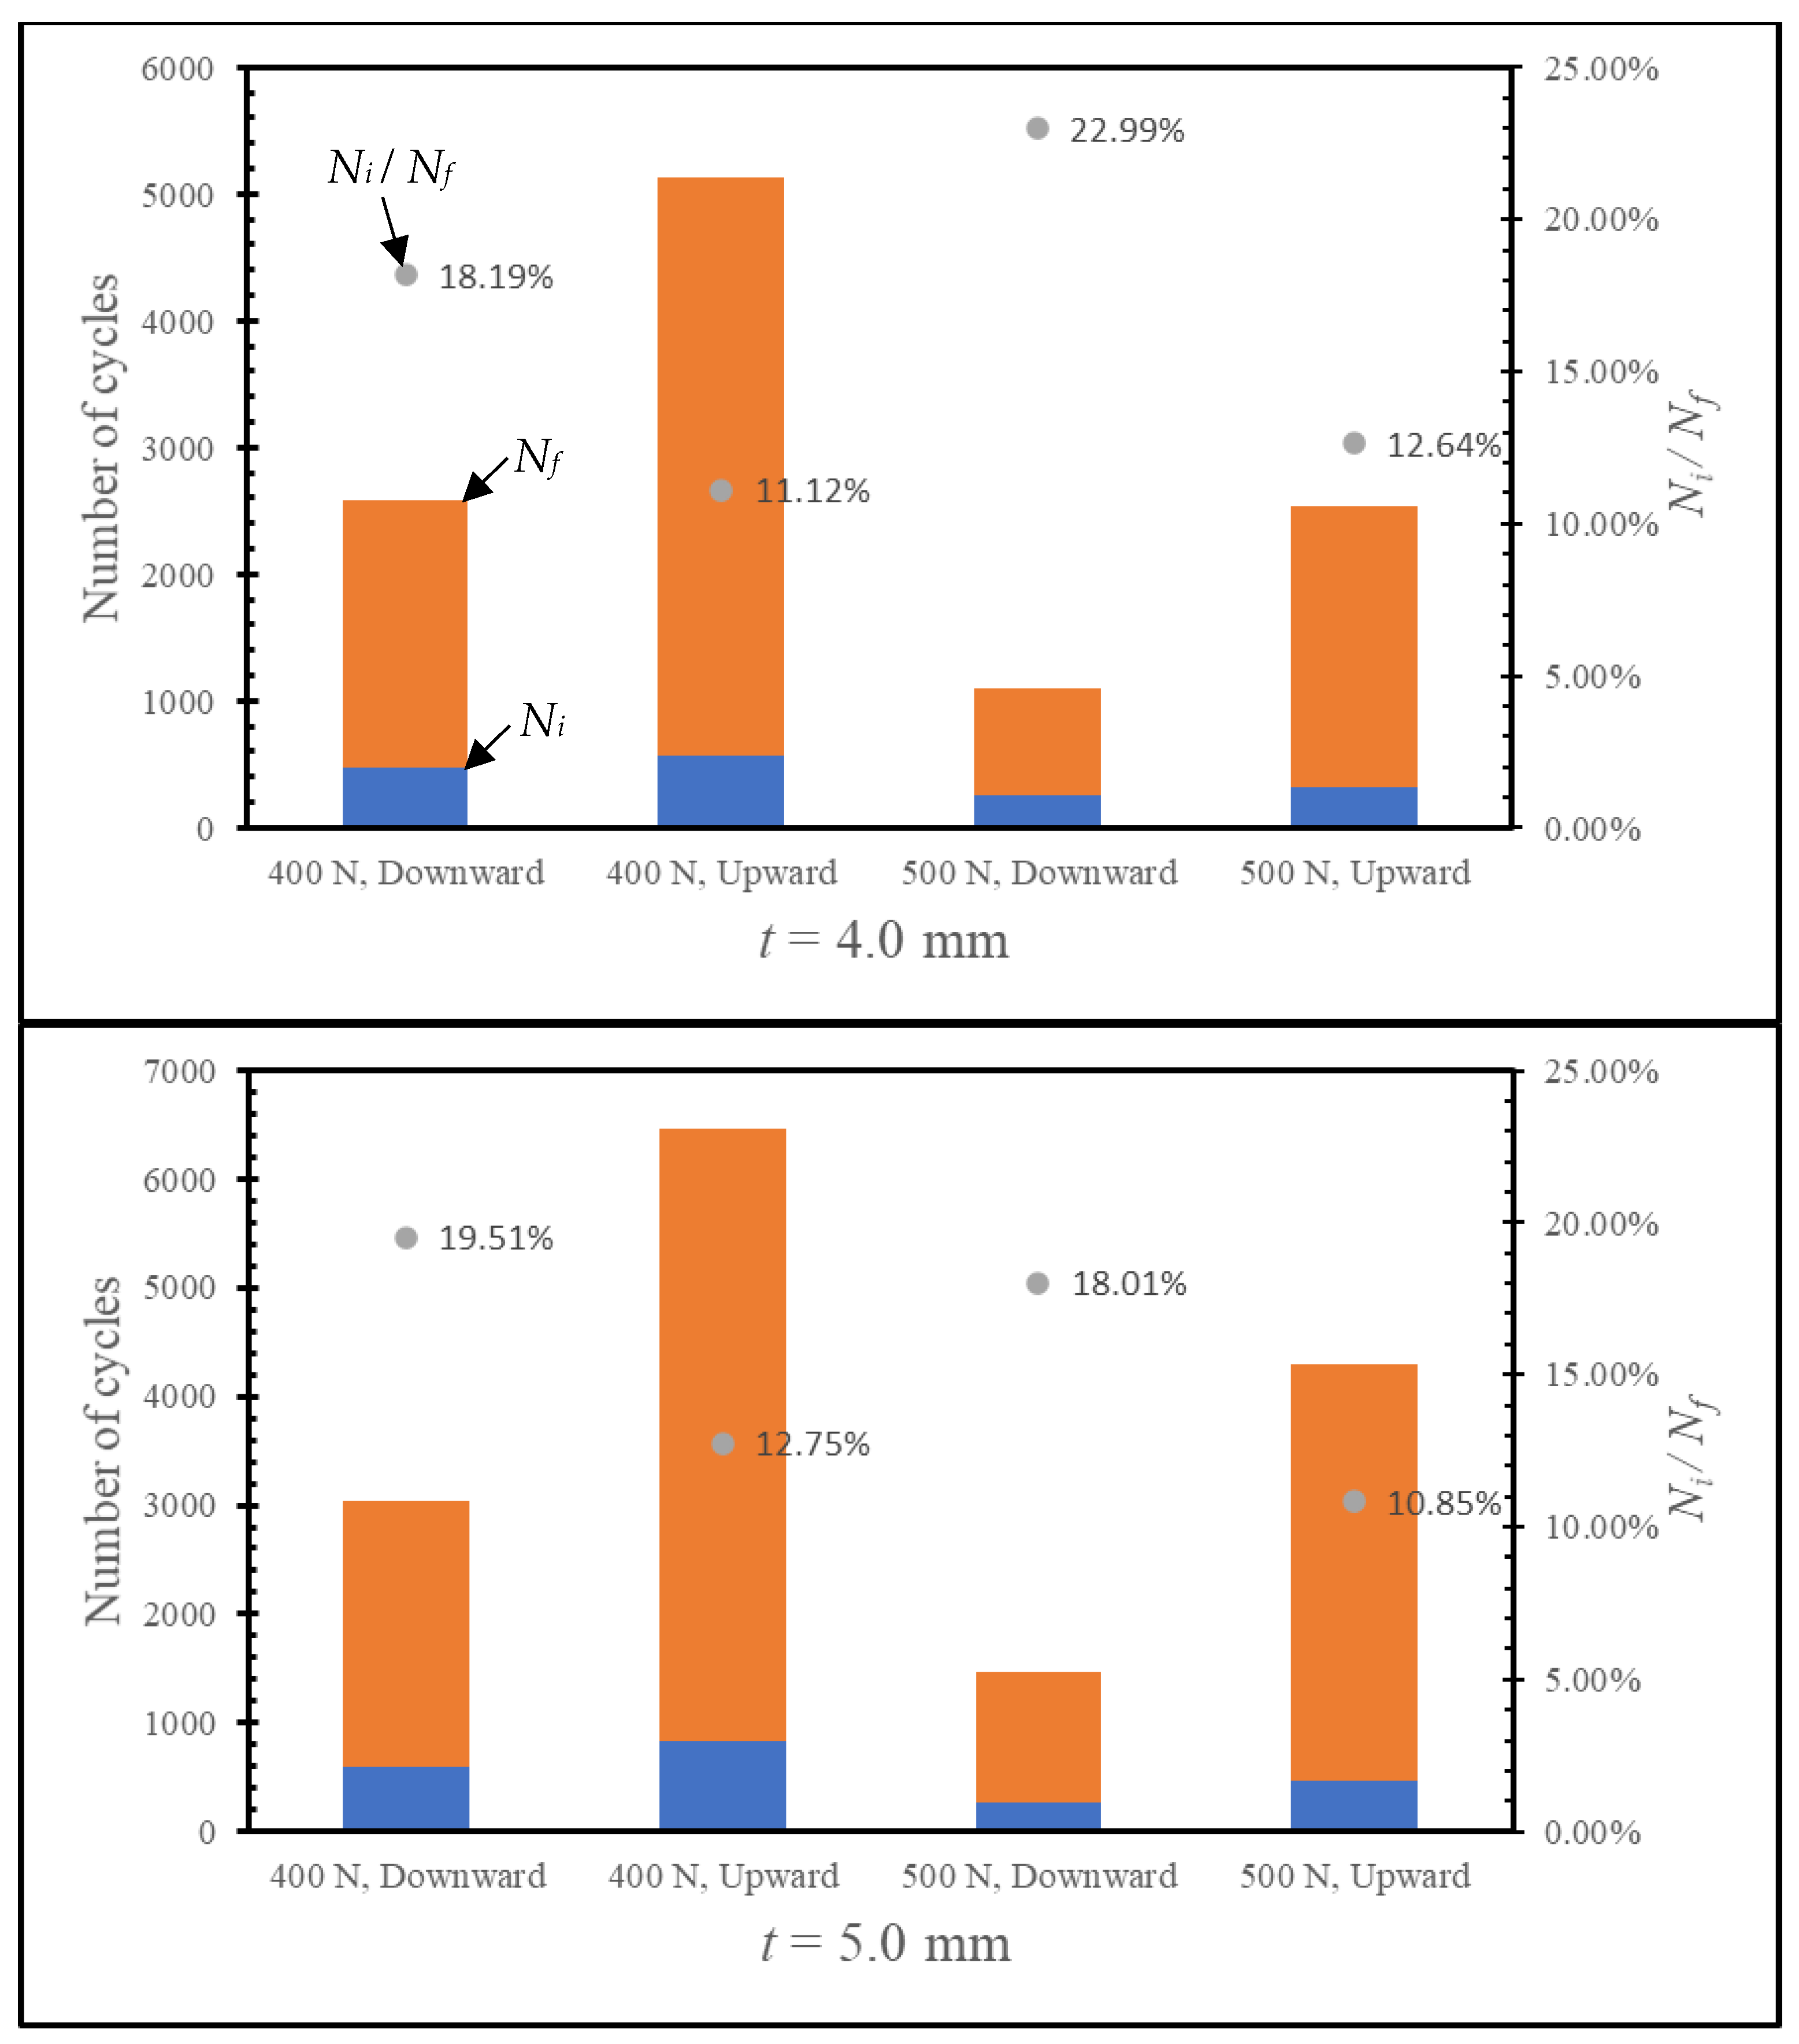
3.3. Effect of Adherend Thickness

The adherend thickness plays an important role in the static strength of SLJs. In this section, its effect on their fatigue lives was investigated. The thickness of the adherend was increased from 4.0 to 5.0 mm for the SLJ configurations subjected to a bending load of 400 N in both upward and downward directions. The Nf was observed to increase when the thickness was increased for all the cases. For instance, it increased from 2584 to 3039 cycles and from 5135 to 6465 cycles for the downward and upward directions, respectively (see Figure 4). Their da/dN values were compared in Figure 6. It was observed that when the loading was in the downward direction, the initial crack propagation rates were around 5.0 × 10⁻⁵ mm/cycle and 2.5 × 10⁻⁵ mm/cycle for t equal to 4.0 mm and 5.0 mm, respectively. However, this difference was lessened with the advancement of cycling loading, where it reached 2.79 × 10⁻⁴ mm/cycle at 2017 cycles and 2.53 10−4 mm/cycle at 2004 cycles, respectively. The crack propagation rate again jumped to a much higher value just before the fatigue damage was completed for a thinner adherend. A similar behaviour was also noticed when an upward loading was applied.

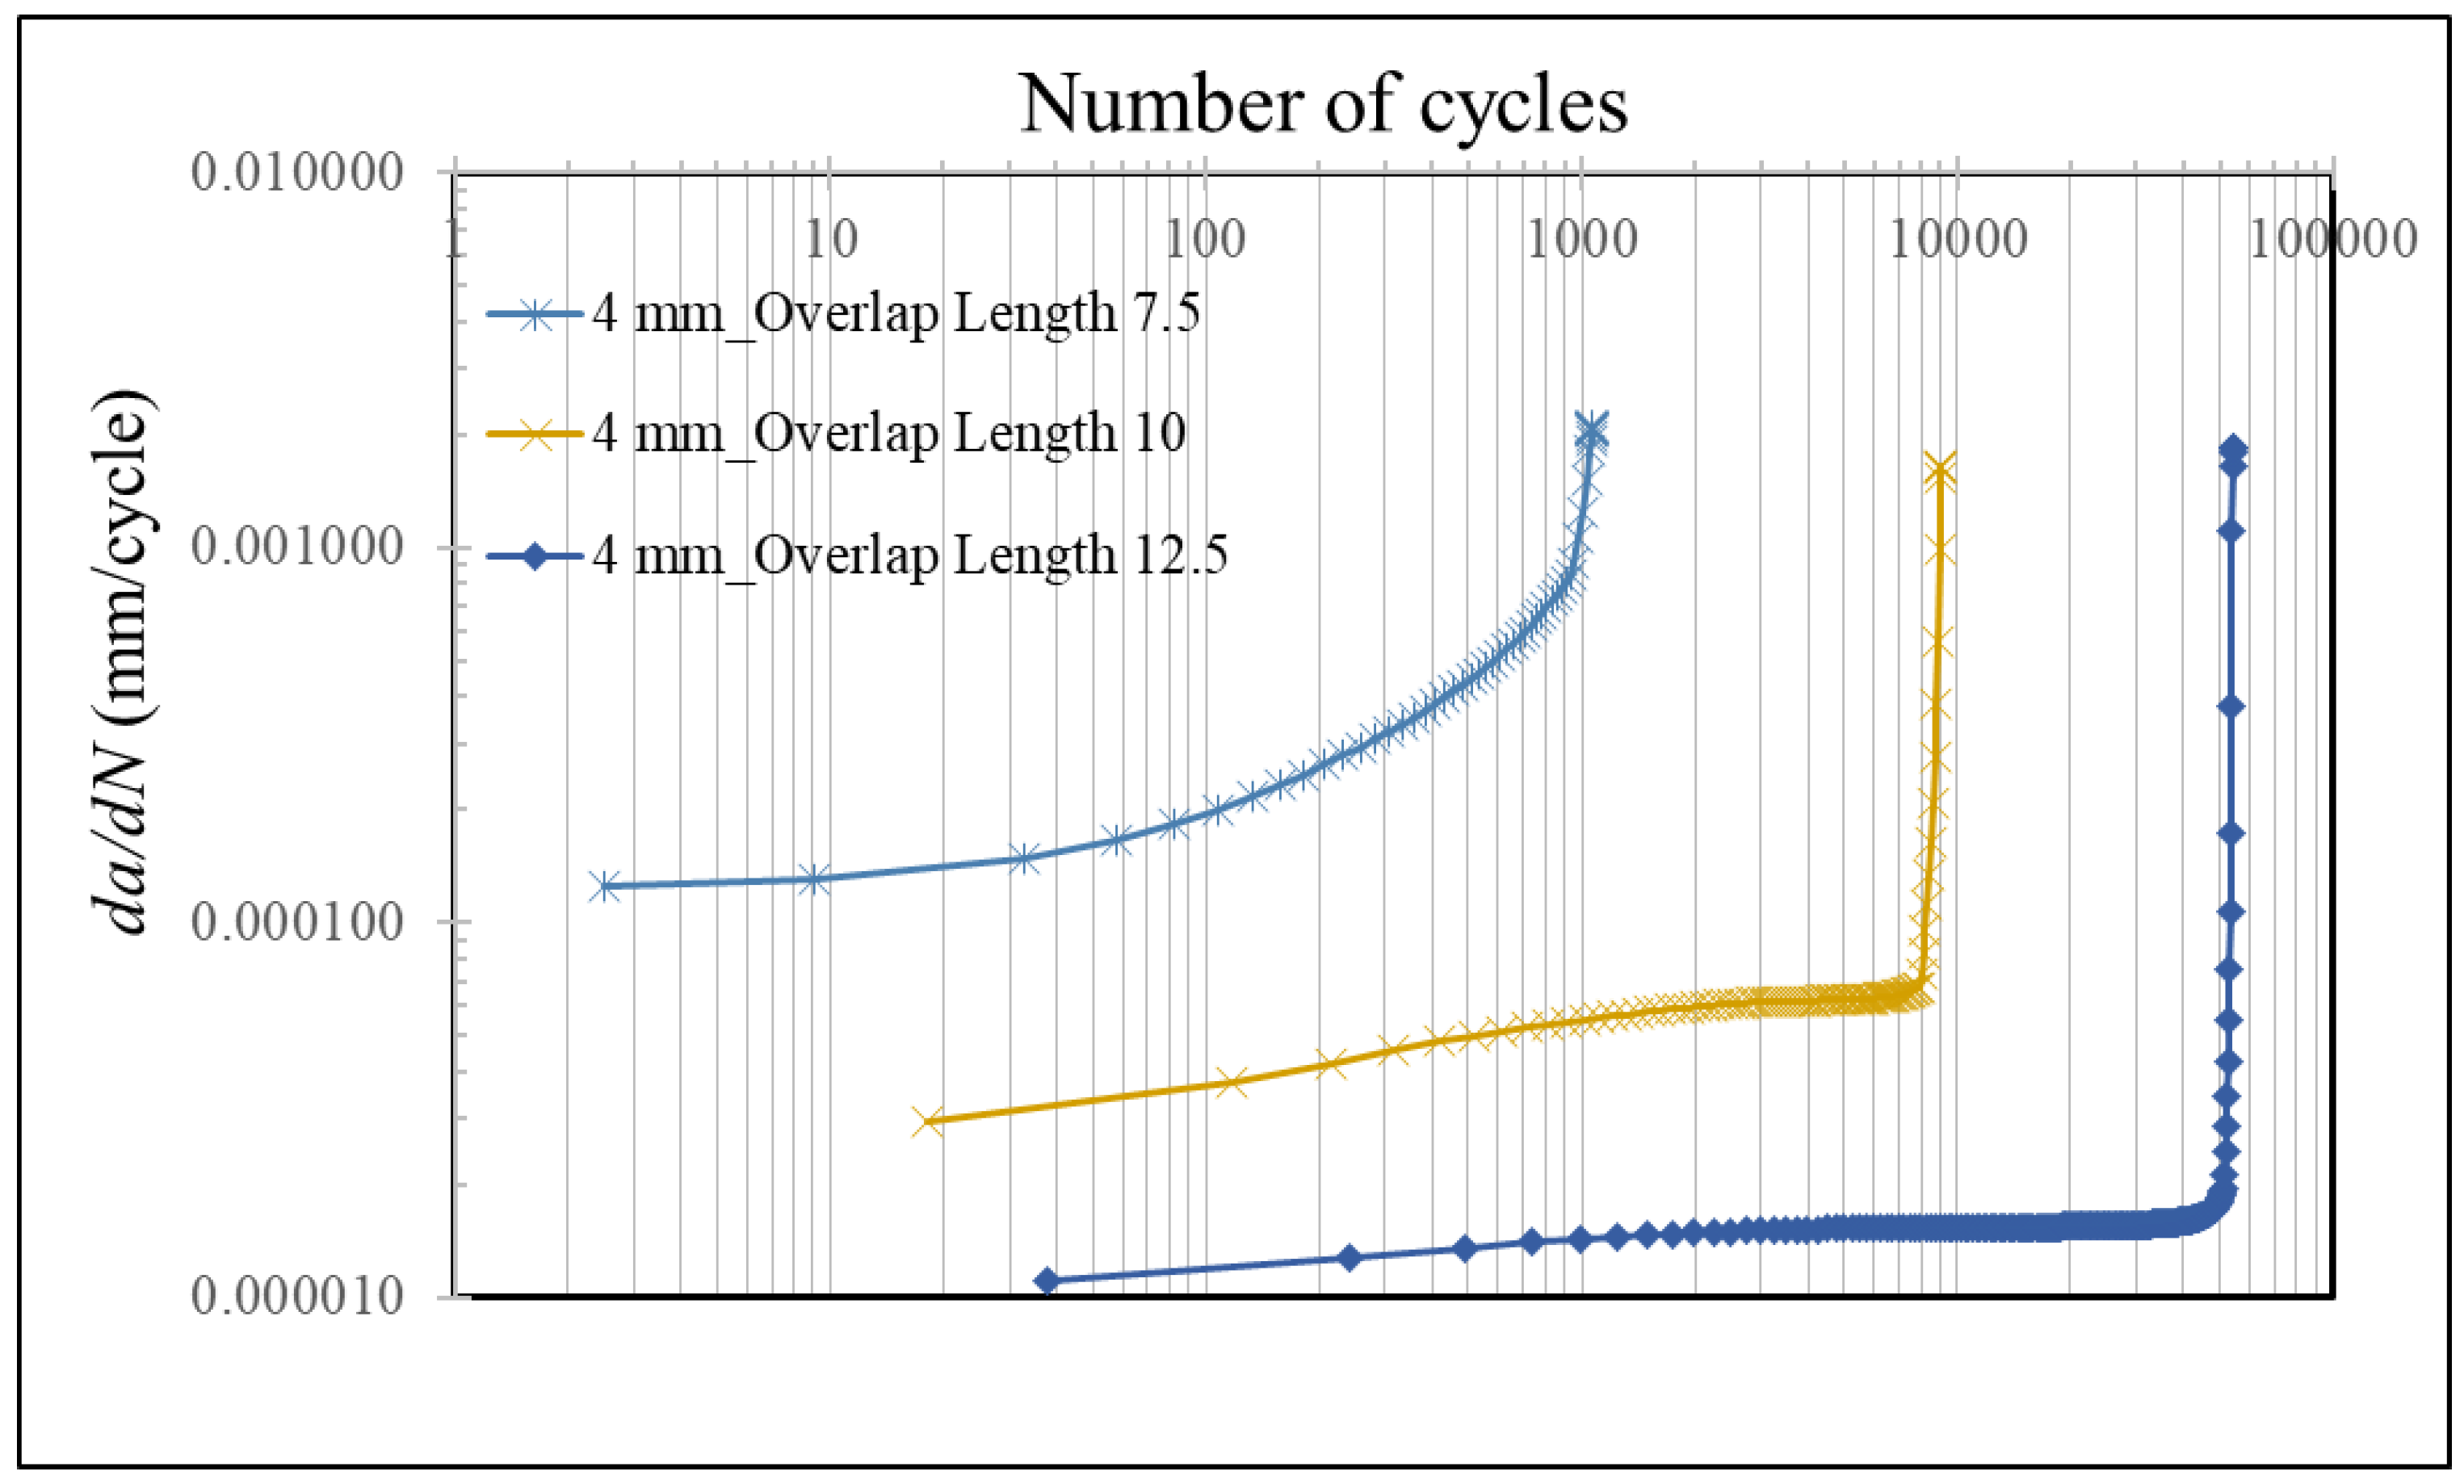
3.4. Effect of Overlap Length

Another important parameter affecting the performance of SLJs is overlap length. To see its effect on fatigue performance, simulations for the SLJs with three different overlap lengths, namely 7.5 mm, 10 mm, and 12.5 mm, were performed. The adherend thickness of 4.0 mm with cyclic 500 N loading in the downward direction was considered. Table 3 presents the obtained Ni and Nf values of 1092 cycles, 9154 cycles and 54,475 cycles for the SLJs with the studied shortest overlap length to the longest one. It was noticed that the life cycle of an SLJ increased dramatically when the overlap length increased with a smaller amount. For instance, when the OL was increased from 7.5 to 10.0 mm, i.e., with just a 33.3% increase in its value, the Nf increased more than eight times from 1092 to 9154 cycles. This increase was almost 50 times when the OL was increased from 7.5 to 12.5 mm and can be explained by analysing their crack propagation rates presented in Figure 7. It was noticed that the initial value of da/dN was more than four times bigger for OL = 7.5 mm when compared to that for OL = 10.0 mm, where their respective values were 1.27 × 10⁻⁵ mm/cycle and 2.99 × 10⁻⁵ mm/cycle. In addition, the difference increased with an increased in loading cycle and reached more than 19 times when their crack growth rates were compared before their failures, i.e., 1.22 × 10⁻⁵ mm/cycle (at 1012 cycle) and 6.44 × 10⁻⁵ mm/cycle (7026 cycle), respectively. The difference was more significant when comparing it with OL equal to 12.5 mm instead of 10.0 mm. For an increased overlap length, the amount of load that the unit overlap region exposed to loading decreased. Therefore, the crack expansion rate decreased, which, in turn, led to a longer life after the crack nucleated. That also explains why the Ni/Nf became smaller for an increased overlap length as seen in Table 3, where it decreased from 22.98% to 2.29% when OL was increased from 7.5 to 10.0 mm. Our quantified findings match well with Ref. [30] where it was reported that increasing the OL led to an improvement in the fatigue life.

4. Concluding Remarks

In this study, the fatigue performance of an SLJ subjected to bending loading was investigated using an advanced FE model. The cyclic damage model integrated into the cohesive zone for the adhesive layer was implemented via user-defined UMAT subroutine. After the model was verified with the experiments from the literature successfully, the influence of different model parameters was studied in depth.
The following conclusions were drawn:
  • A lower bending load and/or a thicker adherend resulted in an extended fatigue life.
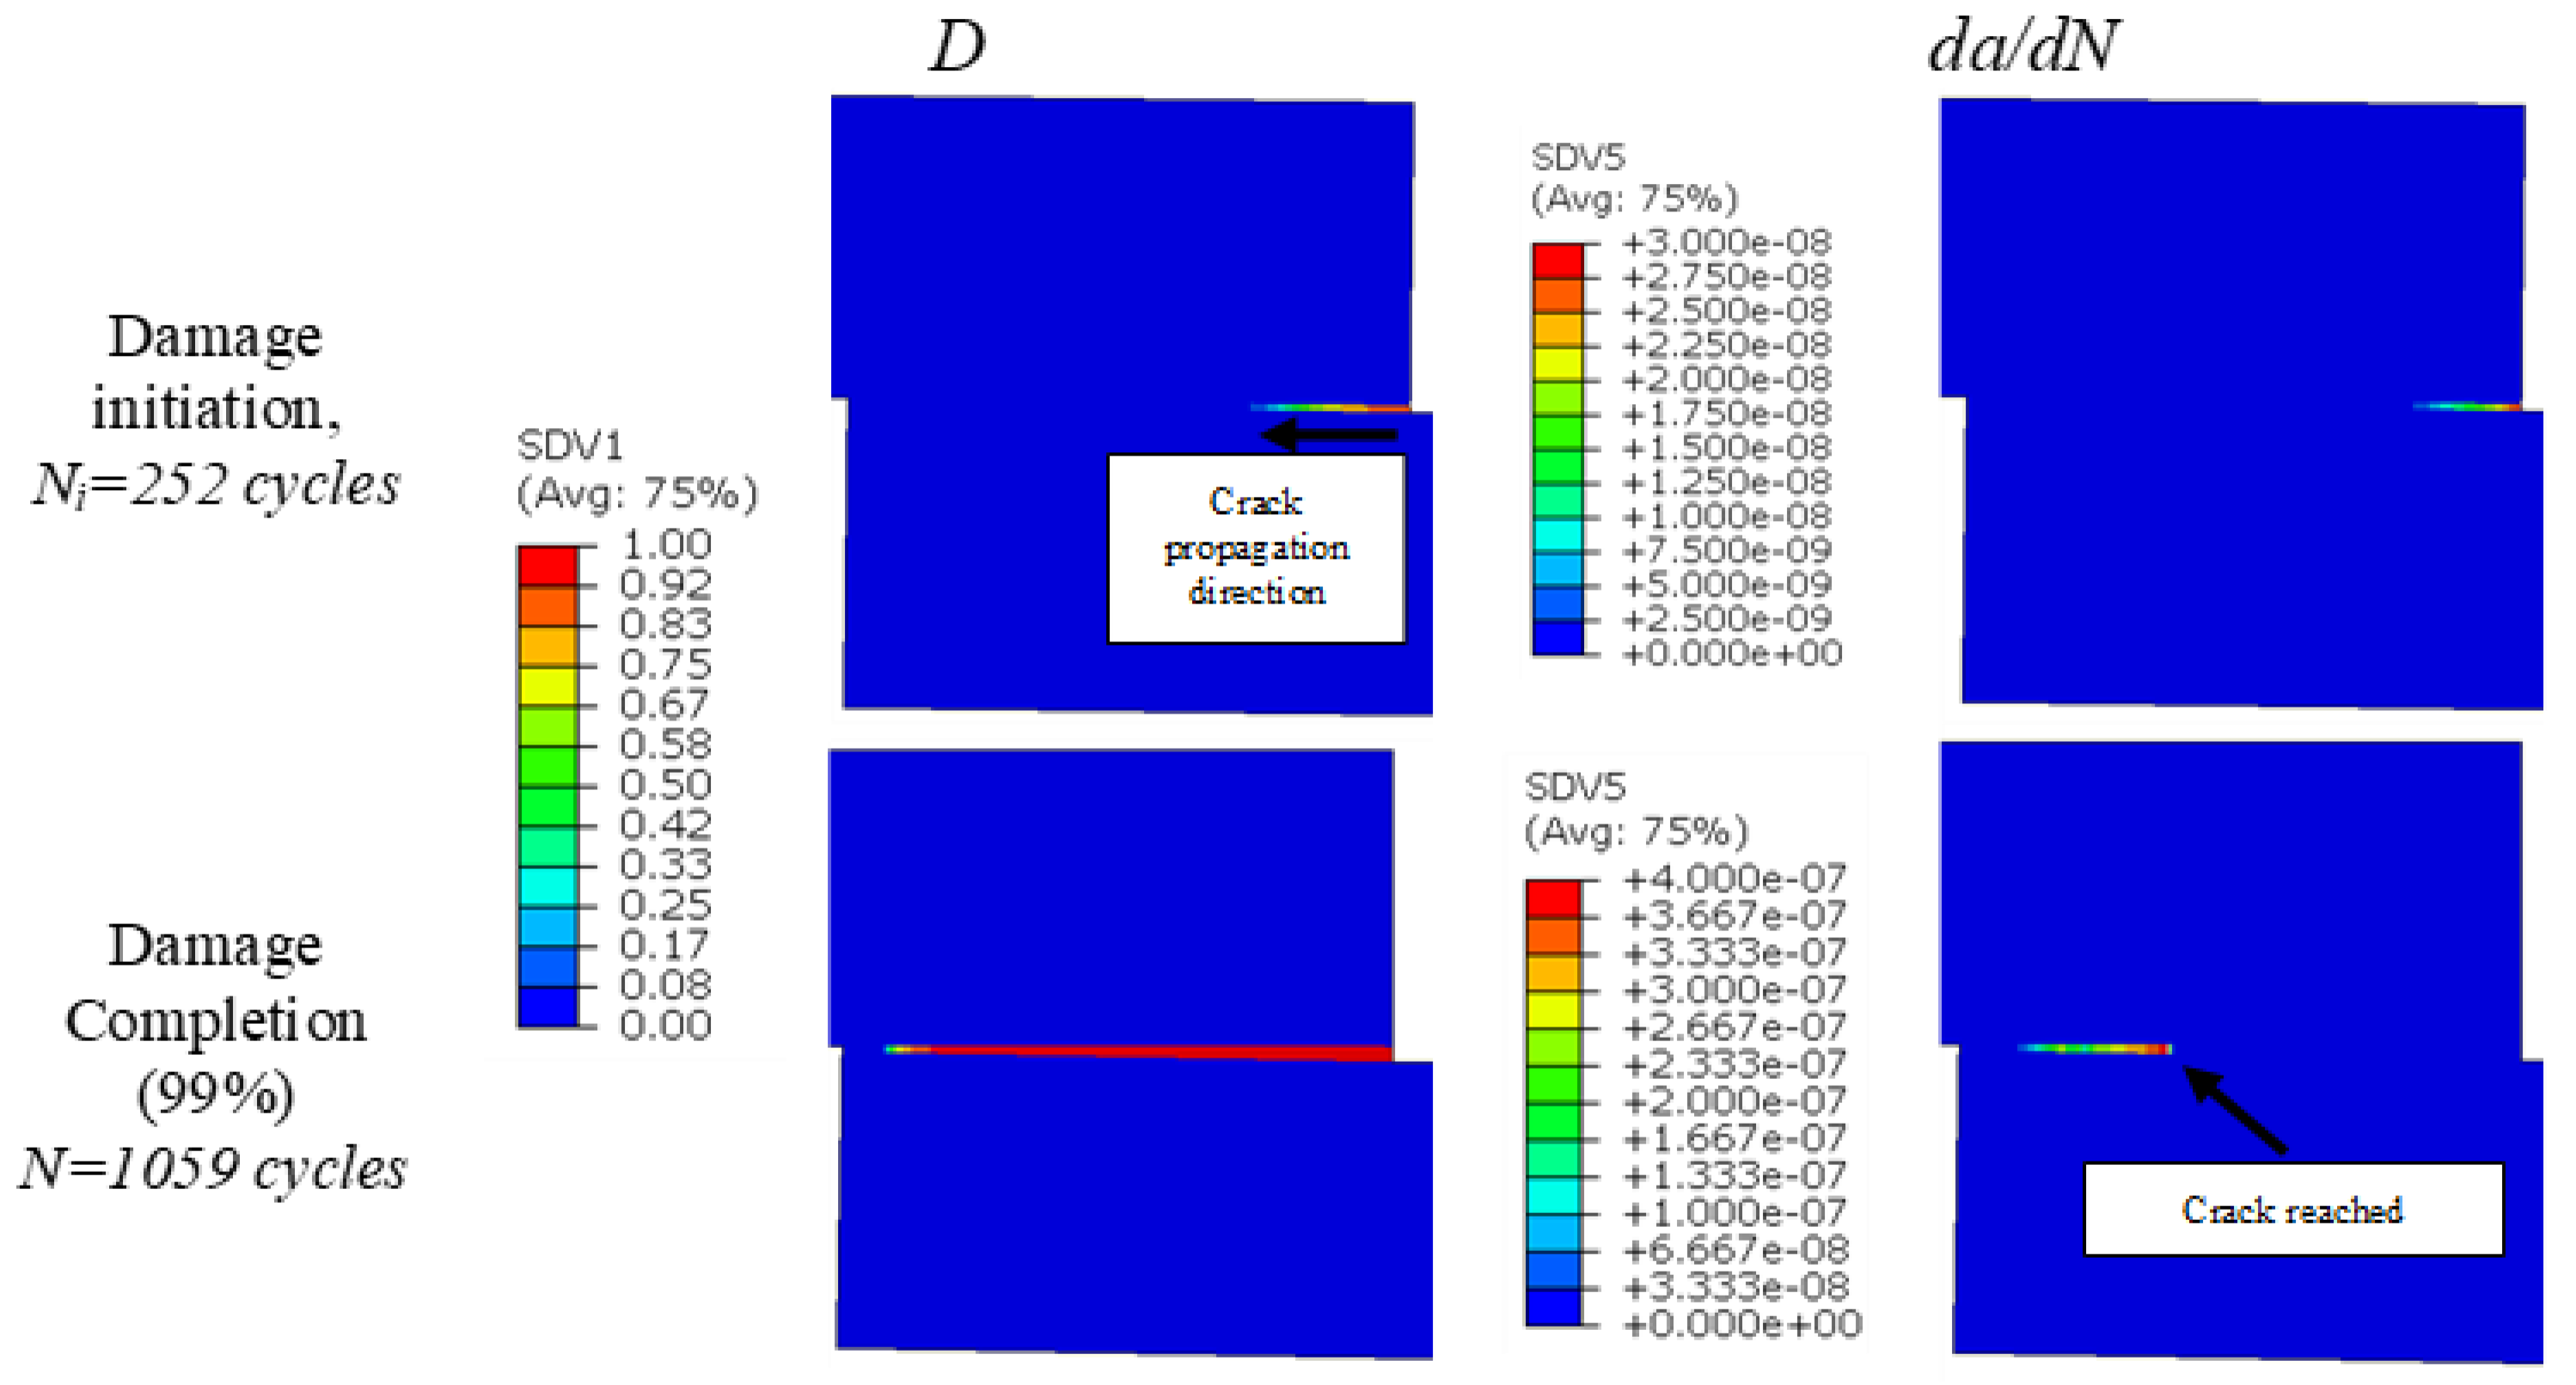
  • The crack propagation rate was observed to increase with more cyclic bending load, but an abrupt change in its value was noticed just before the final failure
  • The bending direction for a constant load ratio was observed to influence the crack initiation and its propagation in the adhesive layer significantly. Nf was noticed to increase by 200% by changing the loading direction. Its influence became more apparent for higher bending loadings.
  • The adherend thickness affected the crack propagation rate in the adhesive layer sensibly but at different levels at different damage stages.
  • For shorter overlap lengths, as the unit overlap region was exposed to higher bending loading, the crack was nucleated easily, where its expansion rate also became higher. For instance, when the OL decreased by 25%, da/dN increased more than 19 times, while the SLJ had around eight times shorter life.
The present model cannot distinguish the crack formation, and its propagation to be inside the adhesive layer or at the interface between the adhesive layer and the adherends upon the tensile load was applied to the SLJ [5]. In the future, for more accurate prediction of the crack path, xFEM formulation [19,31] in combination with a cohesive zone method will be used for the modelling of the SLJs.

Author Contributions

Conceptualisation, M.D. and S.A.; methodology, M.D. and S.A.; software, M.D., R.M. and F.A.; validation, M.D., F.A. and R.M.; formal analysis, M.D. and F.A.; investigation, M.D.; resources, M.D. and F.A.; writing—original draft preparation, M.D.; writing—review and editing, M.D., F.A. and R.M.; visualisation, M.D.; supervision, M.D. and S.A.; project administration, M.D. All authors have read and agreed to the published version of the manuscript.

Funding

This research received no external funding.

Institutional Review Board Statement

Not applicable.

Informed Consent Statement

Not applicable.

Data Availability Statement

Not applicable.

Conflicts of Interest

The authors declare no conflict of interest.

References

  1. Tserpes, K.; Tzatzadakis, V. Synthesis and Experimental Characterization of a MWCNT-Filled Bio-Based Adhesive. Aerospace 2021, 8, 26. [Google Scholar] [CrossRef]
  2. Alderucci, T.; Borsellino, C.; Di Bella, G. Effect of surface pattern on strength of structural lightweight bonded joints for marine applications. Int. J. Adhes. Adhes. 2022, 117, 103005. [Google Scholar] [CrossRef]
  3. Kupski, J.; Teixeira de Freitas, S. Design of adhesively bonded lap joints with laminated CFRP adherends: Review, challenges and new opportunities for aerospace structures. Compos. Struct. 2021, 268, 113923. [Google Scholar] [CrossRef]
  4. Abdel Wahab, M.M. Fatigue in Adhesively Bonded Joints: A Review. ISRN Mater. Sci. 2012, 2012, 746308. [Google Scholar] [CrossRef]
  5. Akpinar, S.; Sahin, R. The fracture load analysis of different material thickness in adhesively bonded joints subjected to fully reversed bending fatigue load. Theor. Appl. Fract. Mech. 2021, 114, 102984. [Google Scholar] [CrossRef]
  6. Grant, L.D.R.; Adams, R.D.; da Silva, L.F.M. Experimental and numerical analysis of single-lap joints for the automotive industry. Int. J. Adhes. Adhes. 2009, 29, 405–413. [Google Scholar] [CrossRef]
  7. Özel, A.; Aydin, M.; Temiż, Ş. The effects of overlap length and adherend thickness on the strength of adhesively bonded joints subjected to bending moment. J. Adhes. Sci. Technol. 2004, 18, 313–325. [Google Scholar] [CrossRef]
  8. Akpinar, S.; Aydin, M.D. 3-D non-linear stress analysis on the adhesively bonded composite joint under bending moment. Int. J. Mech. Sci. 2014, 81, 149–157. [Google Scholar] [CrossRef]
  9. Nakano, H.; Sekiguchi, Y.; Sawa, T. FEM stress analysis and strength prediction of scarf adhesive joints under static bending moments. Int. J. Adhes. Adhes. 2013, 44, 166–173. [Google Scholar] [CrossRef]
  10. Liu, J.; Sawa, T.; Toratani, H. A Two-dimensional Stress Analysis and Strength of Single-lap Adhesive Joints of Dissimilar Adherends Subjected to External Bending Moments. J. Adhes. 1999, 69, 263–291. [Google Scholar] [CrossRef]
  11. Akpinar, S. The Effect of Composite Patches on the Failure of Adhesively-Bonded Joints Under Bending Moment. Appl. Compos. Mater. 2013, 20, 1289–1304. [Google Scholar] [CrossRef]
  12. Akpinar, I.A.; Gültekin, K.; Akpinar, S.; Akbulut, H.; Ozel, A. Research on strength of nanocomposite adhesively bonded composite joints. Compos. Part B Eng. 2017, 126, 143–152. [Google Scholar] [CrossRef]
  13. Kadioglu, F.; Demiral, M. Failure behaviour of the single lap joints of angle-plied composites under three point bending tests. J. Adhes. Sci. Technol. 2020, 34, 531–548. [Google Scholar] [CrossRef]
  14. Zamani, P.; Jaamialahmadi, A.; da Silva, L.F.M. The influence of GNP and nano-silica additives on fatigue life and crack initiation phase of Al-GFRP bonded lap joints subjected to four-point bending. Compos. Part B Eng. 2021, 207, 108589. [Google Scholar] [CrossRef]
  15. Zamani, P.; da Silva, L.F.M.; Masoudi Nejad, R.; Ghahremani Moghaddam, D.; Soltannia, B. Experimental study on mixing ratio effect of hybrid graphene nanoplatelet/nano-silica reinforcement on the static and fatigue life of aluminum-to-GFRP bonded joints under four-point bending. Compos. Struct. 2022, 300, 116108. [Google Scholar] [CrossRef]
  16. Zamani, P.; Jaamialahmadi, A.; da Silva, L.F.M.; Farhangdoost, K. An investigation on fatigue life evaluation and crack initiation of Al-GFRP bonded lap joints under four-point bending. Compos. Struct. 2019, 229, 111433. [Google Scholar] [CrossRef]
  17. Gavgali, E.; Sahin, R.; Akpinar, S. An investigation of the fatigue performance of adhesively bonded step-lap joints: An experimental and numerical analysis. Int. J. Adhes. Adhes. 2021, 104, 102736. [Google Scholar] [CrossRef]
  18. Choi, H.; Park, K.; Paulino, G.H. Mixed-mode fatigue crack growth using cohesive zone modeling. Eng. Fract. Mech. 2020, 240, 107234. [Google Scholar] [CrossRef]
  19. Liang, Y.-J.; Dávila, C.G.; Iarve, E.V. A reduced-input cohesive zone model with regularized extended finite element method for fatigue analysis of laminated composites in Abaqus. Compos. Struct. 2021, 275, 114494. [Google Scholar] [CrossRef]
  20. Systemes, D. Abaqus 6.14 Documentation; Simulia Co.: Providence, RI, USA, 2014. [Google Scholar]
  21. Belnoue, J.P.H.; Giannis, S.; Dawson, M.; Hallett, S.R. Cohesive/adhesive failure interaction in ductile adhesive joints Part II: Quasi-static and fatigue analysis of double lap-joint specimens subjected to through-thickness compressive loading. Int. J. Adhes. Adhes. 2016, 68, 369–378. [Google Scholar] [CrossRef]
  22. Turon, A.; Camanho, P.P.; Costa, J.; Dávila, C.G. A damage model for the simulation of delamination in advanced composites under variable-mode loading. Mech. Mater. 2006, 38, 1072–1089. [Google Scholar] [CrossRef] [Green Version]
  23. Benzeggagh, M.L.; Kenane, M. Measurement of mixed-mode delamination fracture toughness of unidirectional glass/epoxy composites with mixed-mode bending apparatus. Compos. Sci. Technol. 1996, 56, 439–449. [Google Scholar] [CrossRef]
  24. Turon, A.; Costa, J.; Camanho, P.P.; Dávila, C.G. Simulation of delamination in composites under high-cycle fatigue. Compos. Part A Appl. Sci. Manuf. 2007, 38, 2270–2282. [Google Scholar] [CrossRef]
  25. Paris, P.; Erdogan, F. A Critical Analysis of Crack Propagation Laws. J. Basic Eng. 1963, 85, 528–533. [Google Scholar] [CrossRef]
  26. Van Paepegem, W.; Degrieck, J. Fatigue degradation modelling of plain woven glass/epoxy composites. Compos. Part A Appl. Sci. Manuf. 2001, 32, 1433–1441. [Google Scholar] [CrossRef]
  27. Turon, A.; González, E.V.; Sarrado, C.; Guillamet, G.; Maimí, P. Accurate simulation of delamination under mixed-mode loading using a cohesive model with a mode-dependent penalty stiffness. Compos. Struct. 2018, 184, 506–511. [Google Scholar] [CrossRef]
  28. Smeets, E. Development of a Fatigue Analysis Tool Using Cohesive Zone Modelling for Composite Specimens. Master’s Thesis, Delft University of Technology, Delft, The Netherlands, 2019. [Google Scholar]
  29. Demiral, M.; Kadioglu, F.; Silberschmidt, V.V. Size effect in flexural behaviour of unidirectional GFRP composites. J. Mech. Sci. Technol. 2020, 34, 5053–5061. [Google Scholar] [CrossRef]
  30. Quaresimin, M.; Ricotta, M. Fatigue behaviour and damage evolution of single lap bonded joints in composite material. Compos. Sci. Technol. 2006, 66, 176–187. [Google Scholar] [CrossRef]
  31. Chen, C.; Araby, S.; Demiral, M.; Cai, R.; Yang, X.; Wang, W.; Meng, Q. Fatigue behavior and tribological properties of laser additive manufactured aluminum alloy/boron nitride nanosheet nanocomposites. J. Mater. Res. Technol. 2022, 20, 3930–3948. [Google Scholar] [CrossRef]
Figure 1. Details of the developed numerical model of single lap joint under cyclic bending loading.
Aerospace 10 00008 g001
Figure 2. Distributions of fatigue damage and crack propagation rate in the adhesive layer at different fatigue cycles for the SLJ with 4.0 mm adherends under 500 N bending load.
Aerospace 10 00008 g002
Figure 3. Distribution of fatigue damage in the adhesive layer with the crack propagation direction for the SLJs with 4.0 mm adherends subjected to downward (left) and upward (right) 400 N bending loading.
Aerospace 10 00008 g003
Figure 4. Ni and Nf with their ratio (Ni/Nf) (in percentage) for the SLJs with t = 4.0 mm (top) and t = 5.0 mm (bottom) when subjected to different loadings and loading directions.
Aerospace 10 00008 g004
Figure 5. da/dN vs. number of cycles (a) and da/dN vs. SERR (b) for the SLJs subjected to different loadings and loading directions.
Aerospace 10 00008 g005
Figure 6. da/dN vs. number of cycles for the SLJs subjected to 400 N cyclic bending load applied for different adherend thicknesses.
Aerospace 10 00008 g006
Figure 7. da/dN vs. number of cycles for the SLJs subjected to 400 N cyclic bending load for different overlap lengths.
Aerospace 10 00008 g007
Table 1. The material parameters for AA2024-T3 and Araldite 2015 used in FE simulations [5].
ParameterValue
MaterialAA2024-T3Araldite 2015
E (mPa)72,400 -
K (N/mm3)-1014
ϑ 0.330.38
σ Y (mPa)324 -
τ i , c , i = normal, shear (mPa)-21.6, 17.9
G i , c , i = normal, shear (mPa)-0.43, 4.7
C (N/mm3)-1.3 × 10−12
m-2.1
n-2.1
Table 2. Number of cycles to failure (Nf) for the SLJs with different adherend thicknesses when subjected to different bending loadings.
Adherend
Thickness
Nf
F500 N400 N350 N
t = 3.0 mmExperimental1190 15993796
FE Simulation84122593581
t = 4.0 mmExperimental113039649348
FE Simulation105943086616
Table 3. Ni and Nf with their ratios (Ni/Nf) in percentage for the SLJs with different overlap lengths (t = 4.0 mm and F = 500 N (downward)).
Load (N), t (mm)7.5 mm10.0 mm12.5 mm
Ni2517221252
Nf1092915454475
Ni/Nf (%)22.987.892.29
Disclaimer/Publisher’s Note: The statements, opinions and data contained in all publications are solely those of the individual author(s) and contributor(s) and not of MDPI and/or the editor(s). MDPI and/or the editor(s) disclaim responsibility for any injury to people or property resulting from any ideas, methods, instructions or products referred to in the content.

