Article

Effects of Extreme Temperature and Precipitation Events on Daily CO2 Fluxes in the Tropics

1
Department of Meteorology and Climatology, Faculty of Geography, Lomonosov Moscow State University, GSP-1, Leninskie Gory, 1, 119991 Moscow, Russia
2
A.N. Severtsov Institute of Ecology and Evolution, Russian Academy of Science, Leninsky Prospekt 33, 119071 Moscow, Russia
3
Laboratory of Snow Avalanches and Debris Flows, Faculty of Geography, Lomonosov Moscow State University, GSP-1, Leninskie Gory, 1, 119991 Moscow, Russia
*
Author to whom correspondence should be addressed.
Climate 2023, 11(6), 117; https://doi.org/10.3390/cli11060117
Submission received: 31 March 2023 / Revised: 8 May 2023 / Accepted: 24 May 2023 / Published: 25 May 2023

Abstract

:
The effects of anomalous weather conditions (such as extreme temperatures and precipitation) on CO2 flux variability in different tropical ecosystems were assessed using available reanalysis data, as well as information about daily net CO2 fluxes from the global FLUXNET database. A working hypothesis of the study suggests that the response of tropical vegetation can differ depending on local geographical conditions and intensity of temperature and precipitation anomalies. The results highlighted the large diversity of CO2 flux responses to the fluctuations of temperature and precipitation in tropical ecosystems that may differ significantly from some previously documented relationships (e.g., higher CO2 emission under the drier and hotter weather, higher CO2 uptake under colder and wetter weather conditions). They showed that heavy precipitation mainly leads to the strong intensification of mean daily CO2 release into the atmosphere at almost all stations and in all types of study biomes. For the majority of considered tropical ecosystems, the intensification of daily CO2 emission during cold and wet weather was found, whereas the ecosystems were predominantly served as CO2 sinks from the atmosphere under hot/dry conditions. Such disparate responses suggested that positive and negative temperature and precipitation anomalies influence Gross Primary Production (GPP) and Ecosystem Respiration (ER) rates differently that may result in various responses of Net Ecosystem Exchanges (NEE) of CO2 to external impacts. Their responses may also depend on various local biotic and abiotic factors, including plant canopy age and structure, plant biodiversity and plasticity, soil organic carbon and water availability, surface topography, solar radiation fluctuation, etc.

1. Introduction

The observed rapid growth in global air temperature, changes in precipitation, as well as an increase in the frequency and severity of extreme weather events can have a significant impact on the growth and development of plant communities in various geographical regions [1,2,3,4,5]. The extreme weather phenomena such as heat waves, catastrophic droughts and heavy precipitation may disturb the functioning of plant communities that is evidenced in changes in plant transpiration, Gross Primary Production (GPP), Ecosystem Respiration (ER), and Net Ecosystem Exchange (NEE) of CO2 between land surface and the atmosphere [6,7,8]. Prolonged and intense extreme weather events can significantly reduce ecosystem resilience, biodiversity, and net primary production. Understanding and quantifying the sensitivity of various terrestrial ecosystems to such influences and the primary driving mechanisms is important for assessing climate impacts and developing effective adaptive strategies [9].
The tropics are characterized by the world’s greatest biological diversity, with many species interacting in complicated and multifaceted ways [10]. The structure and productivity of plant ecosystems in the tropics are very sensitive to changes in energy and water balance, which could be caused by changes in precipitation and temperature [11,12,13,14,15,16,17]. The largest areas in the humid and semi-humid tropics are covered by forests that play an important role in the global climate system [11,18]. They regulate the exchange of greenhouse gases (GHGs) between the Earth’s surface and the atmosphere, perform important water-regulating and water-saving functions, influence the radiation and energy budgets, determine the microclimate of the large territories, absorb and retain atmospheric carbon, sequestrate it in soil, and retain in an inactive state during large time intervals [19,20,21].
To assess possible atmospheric effects on plant ecosystems, the rates of evapotranspiration, GPP, ER, and NEE (determined as the difference between ER and GPP) can be considered as universal characteristics determining the living conditions and functioning of plant communities in different geographical areas [22,23]. The global GHG flux monitoring network based on the eddy covariance method includes, in the present time, over 1000 active and historical flux stations, with only a small part of them situated in tropical regions [24]. Around 25% of the stations have an operating period of more than 3 years. The GHG monitoring stations provide very useful and comparable information on the spatial and temporal variability of the fluxes, as well as the flux sensitivity to varying atmospheric conditions. It can be expected that the aggregated analysis of global GHG fluxes and meteorological conditions can provide new knowledge on the response of different terrestrial ecosystems in different geographical regions to atmospheric influences.
To assess the impact of anomalous climate and weather events (heat waves, frosts, droughts, floods, etc.) on GHG fluxes in various ecosystems in the tropics and mid-latitudes over the last decades, numerous studies have been carried out [8,14,16,24,25,26,27,28,29,30,31,32,33,34]. It was demonstrated that droughts and heat waves likely result in increased emission of CO2 to the atmosphere, whereas the cold and wet conditions are mainly associated with the CO2 uptake intensification [8]. Several studies have highlighted the precipitation deficit as a crucial factor leading to the abrupt decline of GPP [8,16,32]. However, the response of CO2 exchange to the weather conditions is rather uncertain: the high temperature often causes the increased CO2 uptake by terrestrial ecosystems [33], but, at the same time, leads to the intensification of soil CO2 emission [34]. Despite a number of experimental and modeling studies of anomalous climate and weather events, there are still limited studies on the regional and global synthesis of the terrestrial ecosystem responses to atmospheric impacts. Given the diversity of possible feedbacks between terrestrial ecosystems and the atmosphere, we may suppose that new comprehensive knowledge of the plant–atmosphere interaction is essential for a better understanding of the changes in ecosystem functioning, productivity, and stability, as well as for predicting future climate change.
Another very important issue is the different response of ecosystems to atmospheric anomalies of different intensities and durations. There are several studies discussing the extreme threshold definition in regard to terrestrial ecosystem response to weather and climate anomalies [3]. Smith [35] proposed to consider events that simultaneously experience abnormal climatic conditions and natural ecosystems experience strong impacts that exceed normal variability. Frank et al. [3] introduced the term “extreme impact”, when a resilience threshold (“extreme response threshold”) is passed, placing the ecosystem and associated carbon cycling into an unusual or rare state. Threshold values are usually exceeded when a stressor dose (i.e., cumulative amount defined by stress intensity multiplied by stress duration) reaches a critical level (e.g., during waterlogging, drought, and/or extended periods of exceptionally high or low temperatures), or when the intensity of an extreme climatic event is critically high (e.g., during a storm). Thresholds can be overcome at a plant organ, individual plant, or entire plant community level, resulting in changes in the carbon and water budgets of the entire ecosystem. However, in the above-mentioned study, the specific threshold values for meteorological parameters are not defined. Meanwhile, the threshold values of meteorological parameters associated with the abrupt changes in the rates of evapotranspiration, GPP, ER, and NEE of CO2 between ecosystems and the atmosphere may differ significantly between geographical regions. In this context, the question of identifying weather extremes in terms of their impact on plant communities, taking into account regional conditions and using different methods for extreme event assessment, needs further investigation.
The main goal of our study is to assess the differences in the response of daily net CO2 fluxes between different tropical ecosystems and the atmosphere to extreme weather conditions (such as extreme temperatures and precipitation). As a working hypothesis, the study suggests that the daily CO2 flux response of tropical vegetation can differ depending on local geographical conditions and intensity of temperature and precipitation anomalies. To solve this scientific problem, we are going to use available reanalysis data, as well as information about CO2 fluxes from the global FLUXNET database [24].

2. Materials and Methods

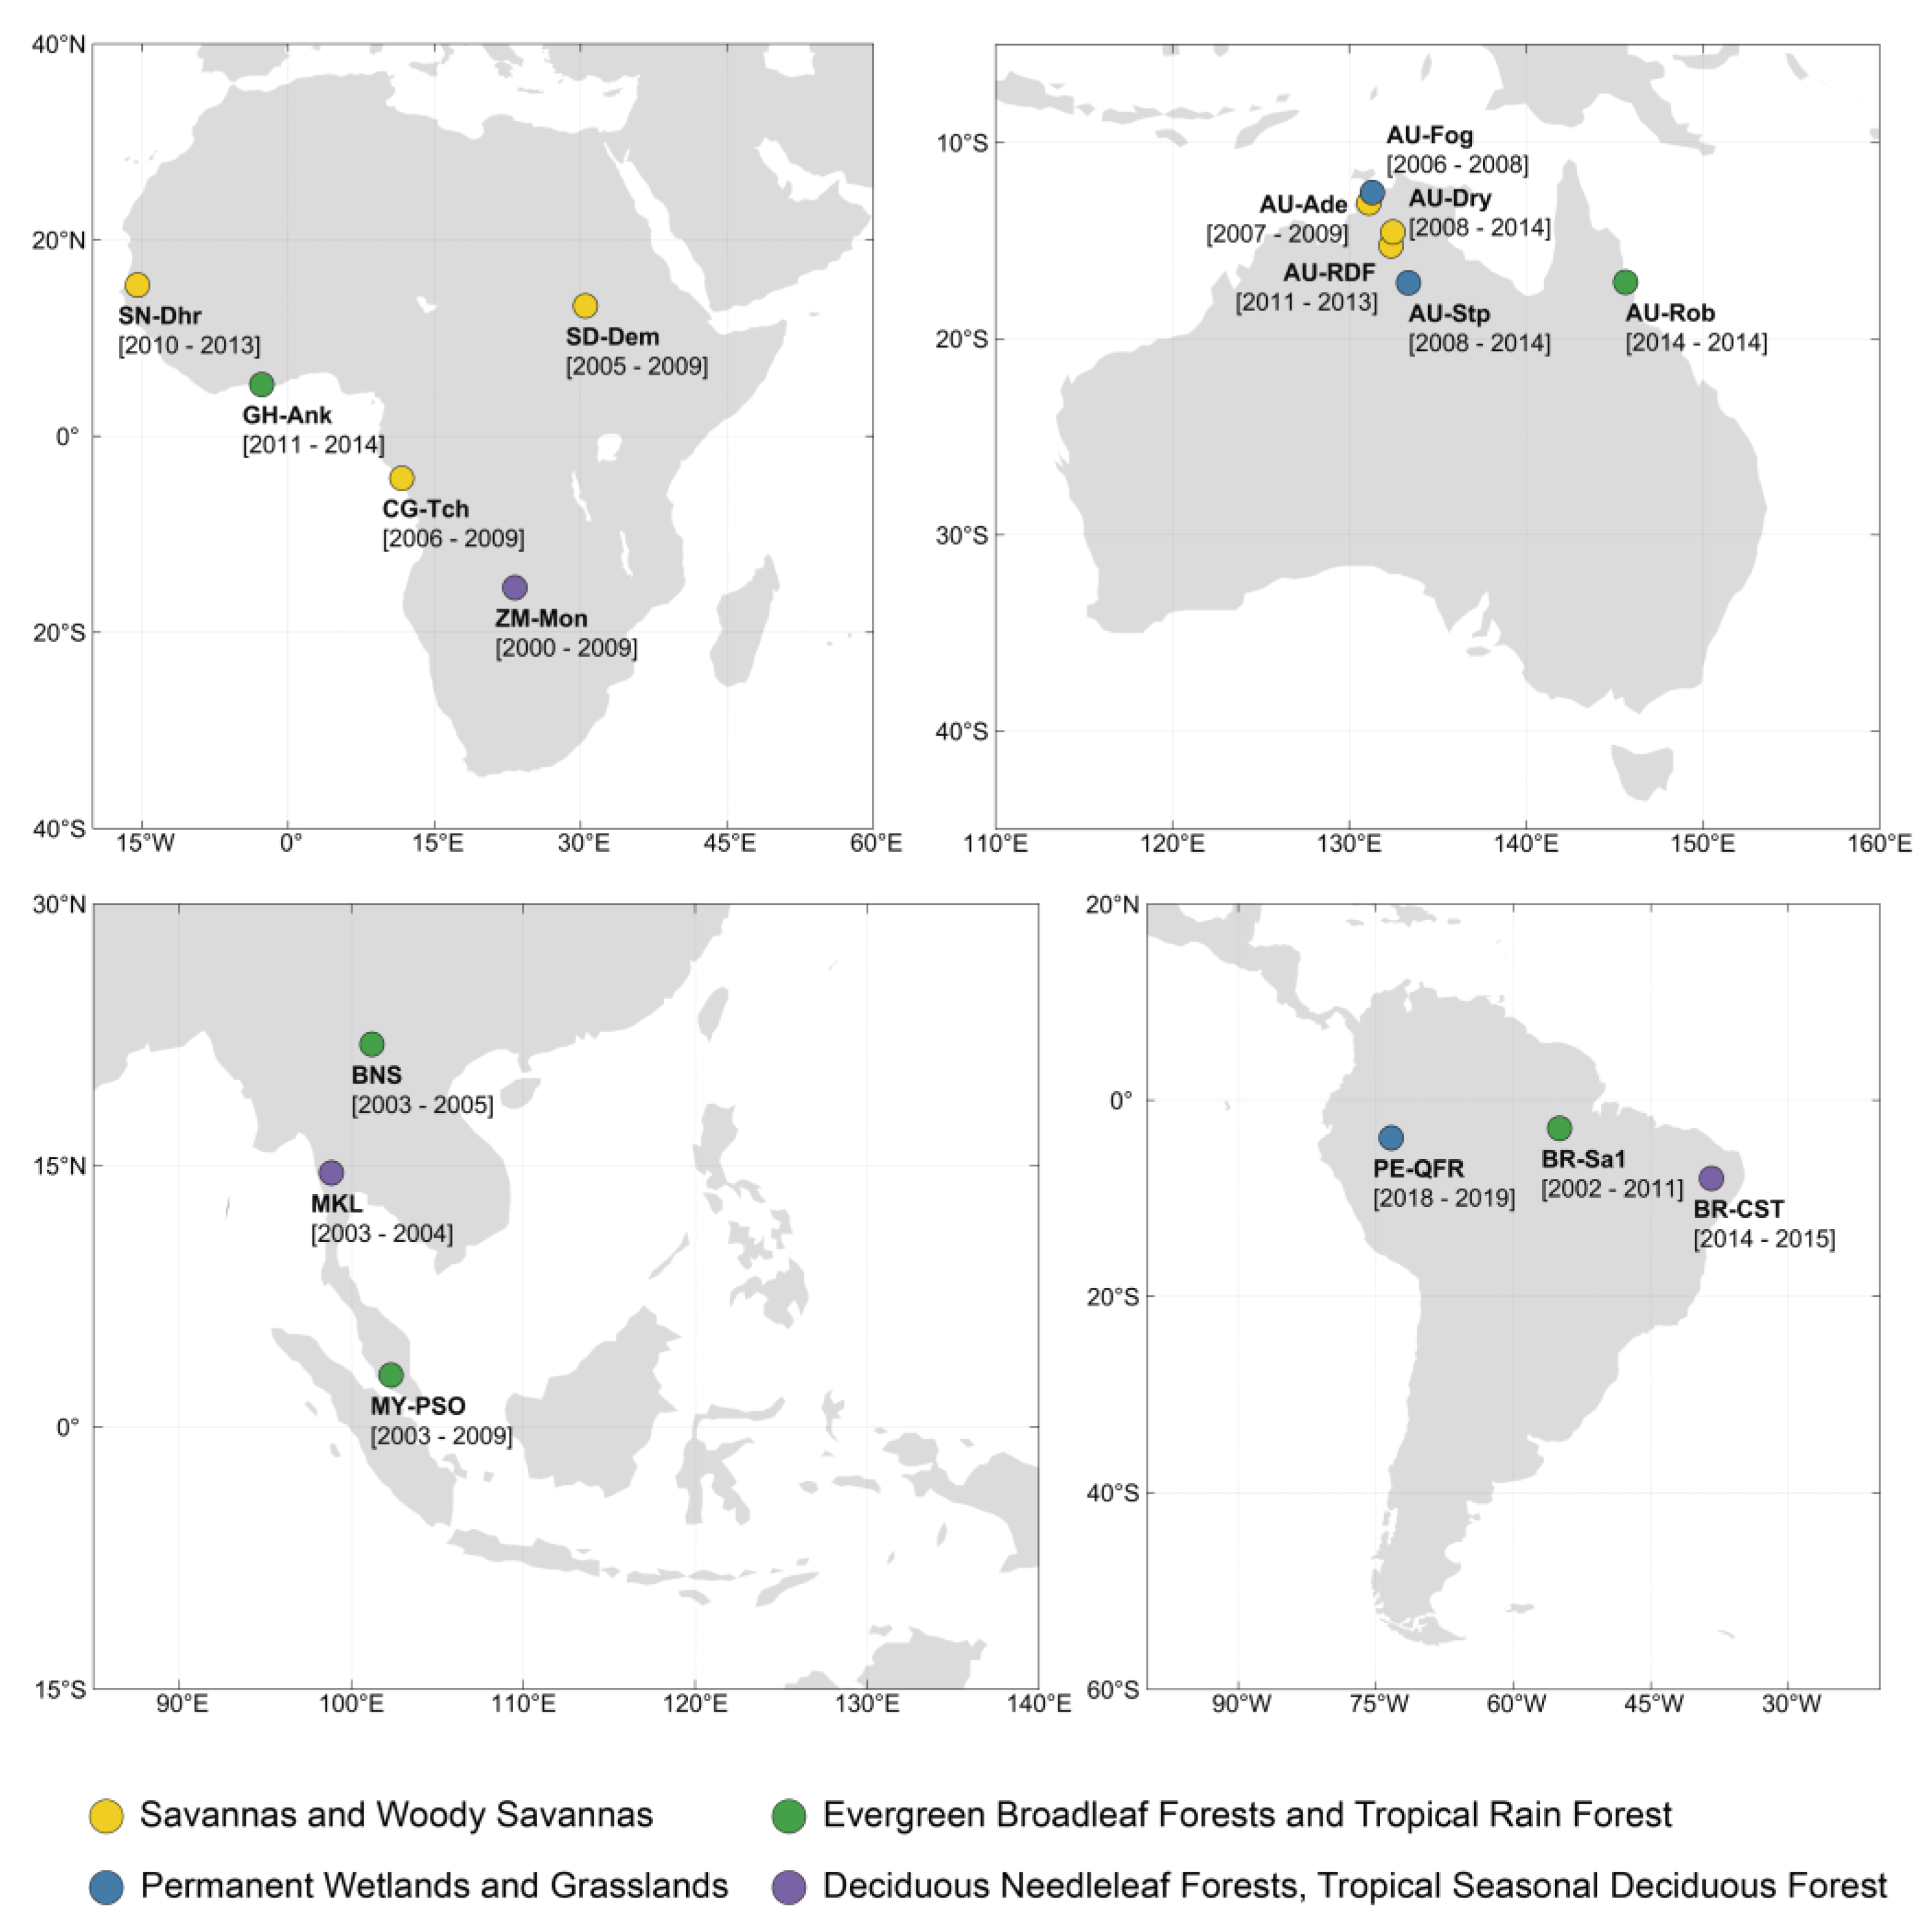
2.1. Meteorological and CO2 Flux Data Sets

To analyze the possible CO2 flux feedbacks of tropical terrestrial ecosystems on the extreme temperature and precipitation events, 17 monitoring stations of CO2 fluxes situated on different continents in tropical latitudes with various landscape and climate conditions and providing the open access data were selected. All stations were assigned to 4 main biome types [36] in accordance with ecosystem classification used in the FLUXNET archive: savannas and woody savannas, evergreen and tropical rain forests, dry or seasonal forests (include deciduous needle-leaf forests and tropical seasonal deciduous forests), and wetlands (Figure 1).
To identify the extreme weather conditions, the reanalysis produced by the European center for medium-range weather forecast ERA5 [37] was used. We used the temperature at 2 m above ground with a temporal resolution of 3 h and precipitation amount with an hourly resolution. The spatial resolution of the data sets was 0.25° × 0.25°, and the period analyzed was 1991–2021. We believed that the reanalysis data set was more useful for our study, as they did not have gaps and were, therefore, able to provide a continuity of time-series data and, therefore, better data comparability at different locations. The FLUXNET meteorological data set contained numerous gaps in temperature and precipitation data, ranging from 2 to 37% for selected stations. This made their application for spatial and temporal data analysis challenging. A correlation analysis revealed a strong agreement between the reanalysis and the gap-free FLUXNET data sets for the air temperature. The R-squared values for the temperature data sets ranged mainly from 0.69 (AU-Fog) to 0.96 (AU-Rob) at p < 0.05 (Supplementary Materials Figure S1). For MY-PSO and Br-Sa1 (Figure S2), it was somewhat less (0.69 at p < 0.05). The agreement between the precipitation rates obtained from reanalysis and monitoring stations was worse due to the high spatio-temporal inhomogeneity of the precipitation fields and the numerous gaps in precipitation measurements at the flux stations. At the same time, it was noteworthy that the correlation between extreme precipitation (exceeding the thresholds) from reanalysis and FLUXNET data for the threshold 95% quantile at stations with a longer period of observation (more than 6 years) remained high, ranging from 0.45 to 0.73 at p < 0.05 (Figure S3). The latter factor determined the appropriateness of reanalysis precipitation data in our study.
Information about net daily CO2 fluxes (NEE) was taken from the FLUXNET archive [24] that had open access to historical flux data sets. Available datasets covered the periods from 1 to 9 years. The archive included meteorological data, net radiation, CO2 fluxes, and latent and sensible heat fluxes measured using the eddy covariance method [38]. The eddy covariance method allowed for providing direct long-term measurements of turbulent GHG fluxes on an ecosystem scale. All FLUXNET stations used similar standardized equipment and data processing software to produce comparable time-series data on GHG fluxes. The gaps in the CO2 flux time series, caused by equipment and power failures, low wind, strong rainfalls, etc., for all selected flux stations were filled using the REddyProc package [39].

2.2. Data Analysis

The daily means were calculated from 3 h and 1 h reanalysis datasets on temperature and precipitation, respectively. In the next step, they were used to determine the values of the air temperature and precipitation at the location of the FLUXNET station by averaging 4 adjacent grid points. It allowed for a reasonable approximation of meteorological parameters at selected flux tower locations, presented in continuous time series.
The temperature anomalies were calculated by removing the daily mean, calculated over the period 1991–2021. For the precipitation, the daily anomalies were not calculated as in the region characterized by lack of precipitation during some periods, the daily anomalies were not informative.
The mean daily net ecosystem CO2 fluxes were calculated by averaging 30 min FLUXNET data sets. Gaps in the CO2 flux measurement records were filled using standard algorithms provided by the REddyProc online tool, which was based on procedures described by Reichstein et al. [40]. The daily anomalies of CO2 fluxes were calculated as the difference between mean daily and mean monthly CO2 fluxes over the available observation period at each station.
The periods with extreme weather conditions were defined using two methods:
as a period when the daily mean temperature anomaly/daily precipitation amount exceeded 95% (90%) quantile (for extreme high temperature and precipitation) or did not reach 5% (10%) quantile (for extreme low temperature and precipitation) of probability density function (PDF);
as a period when the daily mean temperature anomaly exceeded one standard deviation (STD) calculated for each calendar month over the whole time series;
as the precipitation was not normally distributed, the threshold definition based on the STD exceeding was less informative. Therefore, only the quantile thresholds were applied for precipitation.
The combined exceeding of the PDFs of daily temperature anomalies (T) and daily precipitation amount (p) was obtained for the four combinations of temperature and precipitation quantiles, i.e., T5(10)/p5(10), T5(10)/p95(90),T95(90)/p5(10), and T95(90)/p95(90), which defined, respectively, the cool/dry (CD), cool/wet (CW), hot/dry (HD), and hot/wet (HW) extreme conditions. Subscripts 5, 10, 90, and 95 referred to the respective quantile level for temperature and precipitation.
The PDFs were calculated for every month of the observation periods and averaged over 1991–2021. The normal distribution for the temperature and the Weibull distribution for the precipitation were used that were demonstrated to be the most appropriate for the continents in the tropics [41].
The extreme daily CO2 flux anomaly was defined as an anomaly greater (lower) than 1 STD (−1 STD). The STD was calculated separately for each calendar month to exclude the influence of the seasonal cycle. The quantile thresholds were not applied to CO2 fluxes because the PDF of CO2 fluxes varied significantly between the ecosystem type that complicated the choice of the theoretical distribution to approximate the CO2 flux data. Moreover, the short time series available at several stations also made it difficult to identify the appropriate theoretical PDF.

3. Results and Discussion

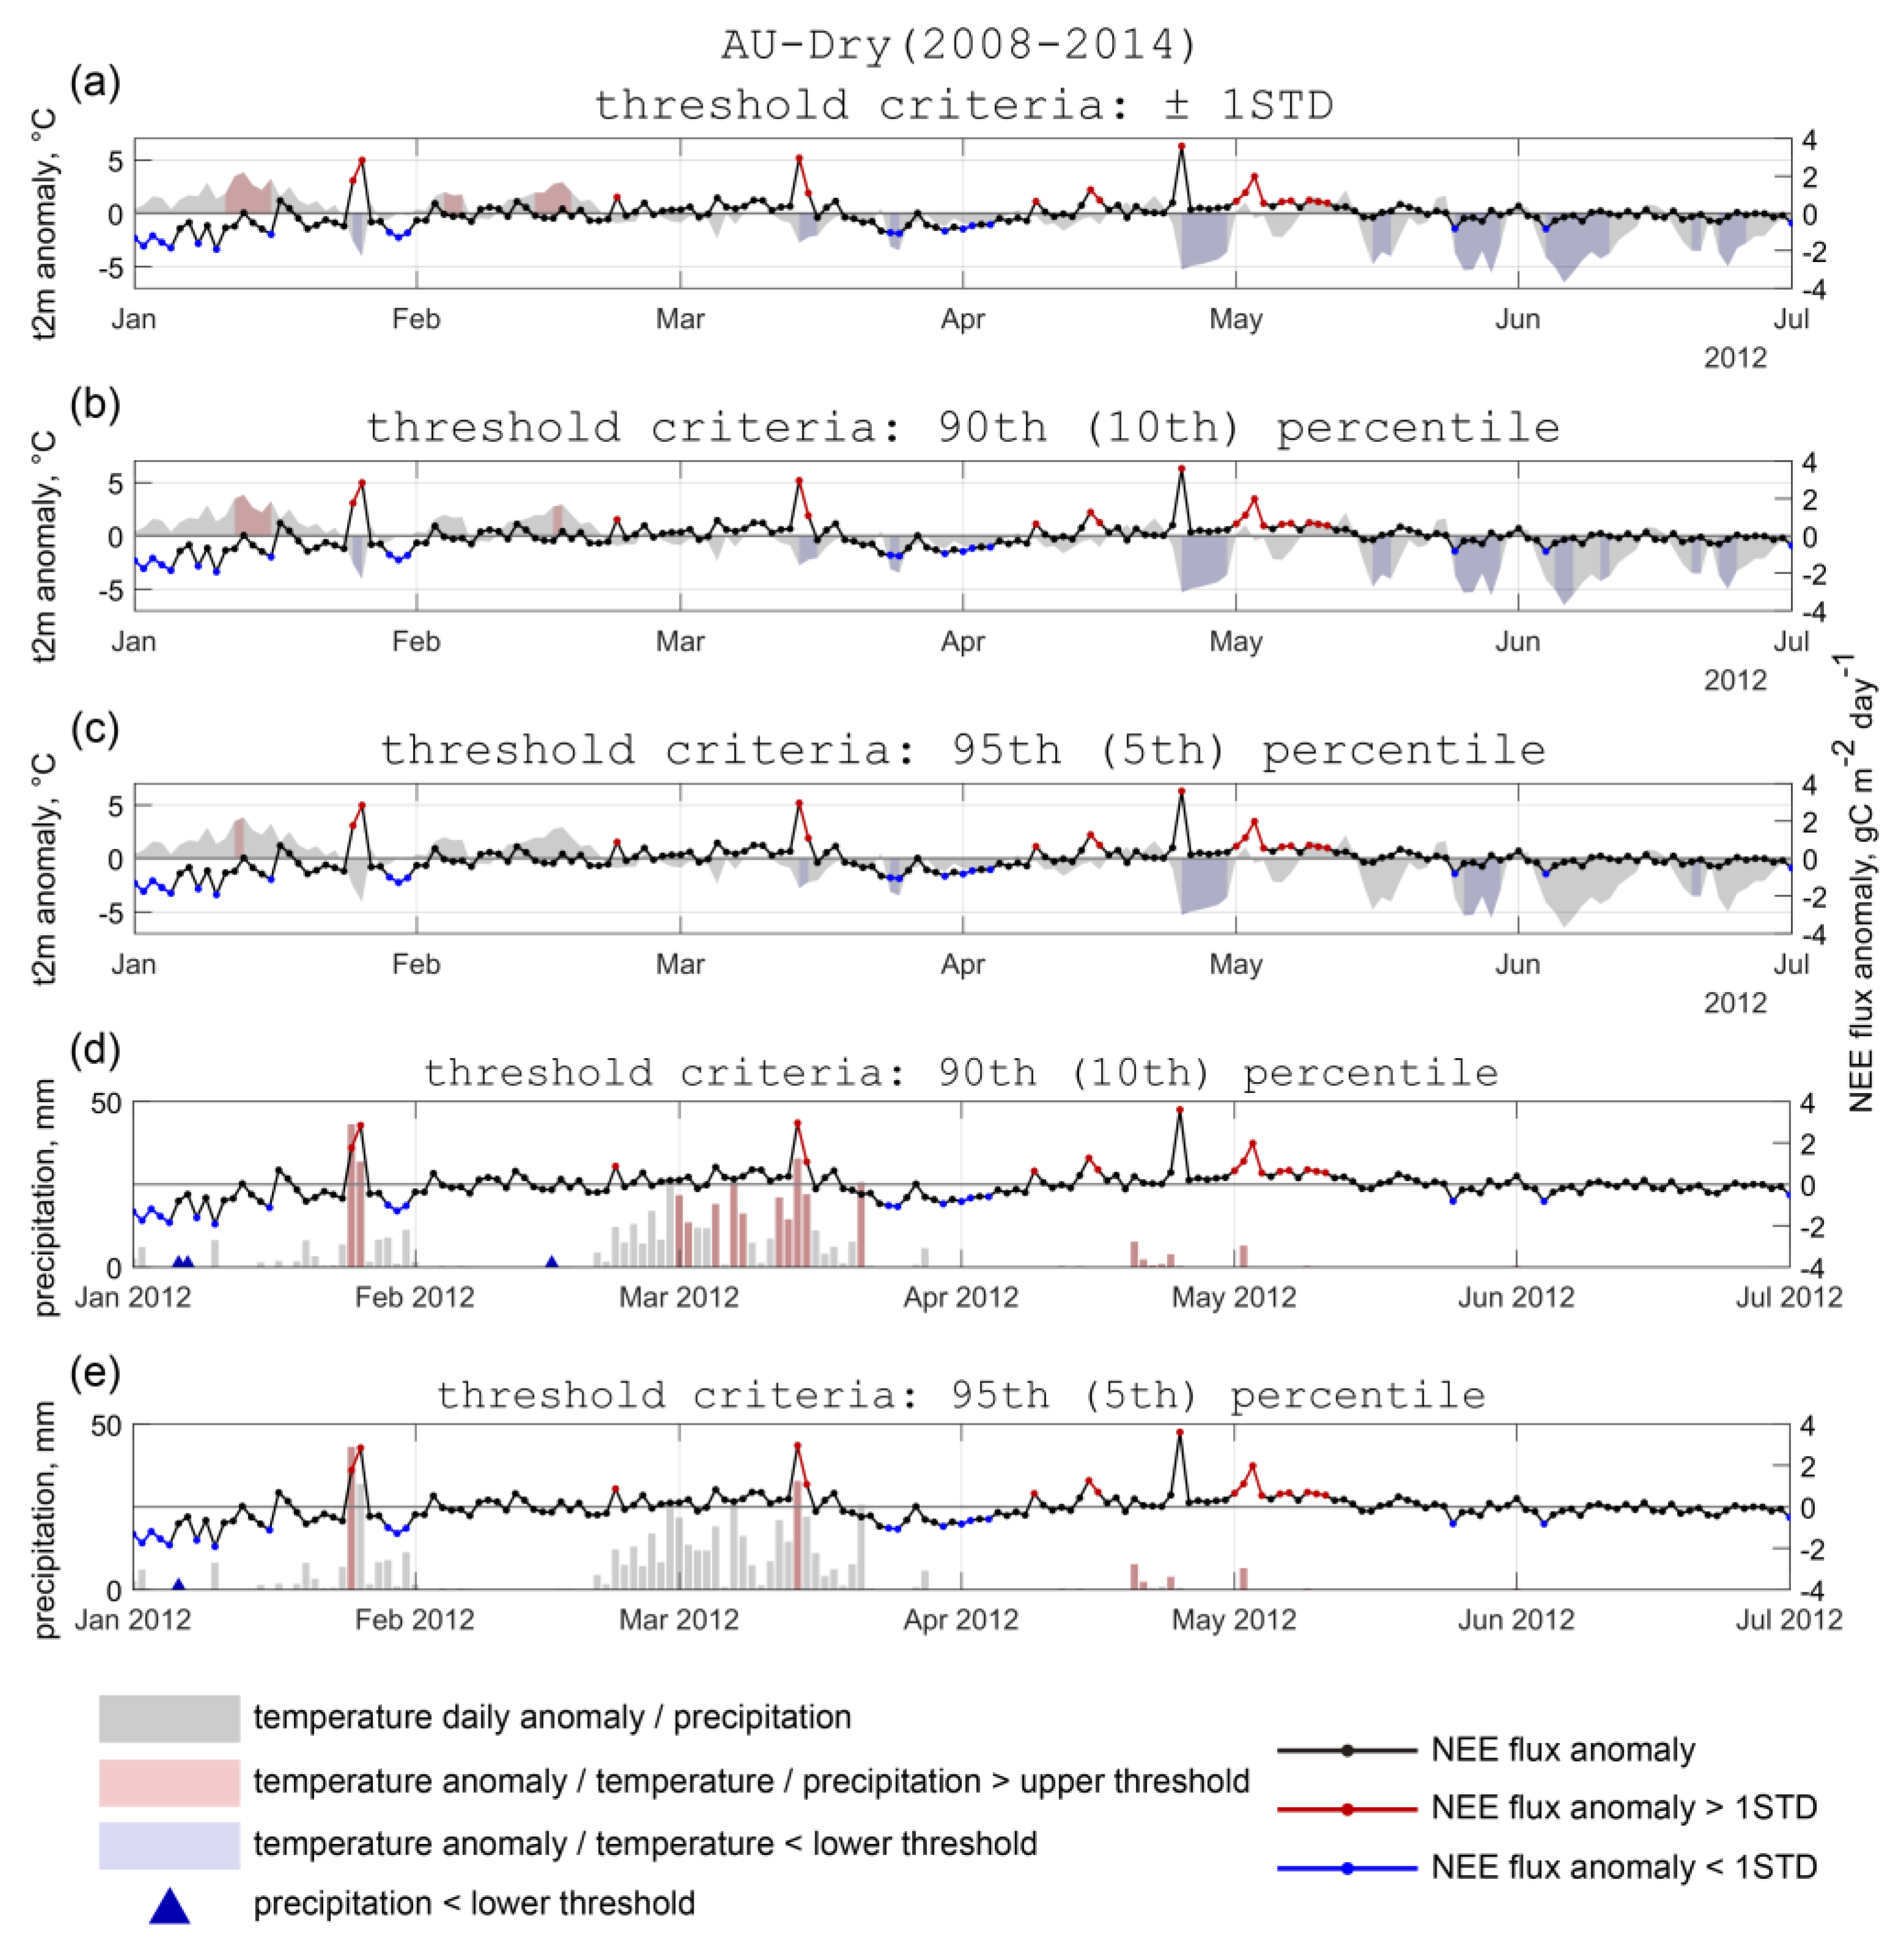
3.1. Temporal Variability of Daily Temperature, Precipitation, and CO2 Fluxes in Various Tropical Terrestrial Ecosystems

Analysis of the variability of daily CO2 fluxes, air temperature, and precipitation, as well as daily CO2 flux feedbacks to the anomalous temperature and precipitation events in the tropical ecosystems, showed significant variability depending on geographical locations, landscape and climate conditions, and plant species composition.
Firstly, we focused on the temporal variability of the weather conditions (temperature and precipitation) and associated CO2 flux anomalies. The daily flux data from 17 measurement stations in the tropics for the entire period of measurements were analyzed (see the examples for four selected biomes in the Supplementary Materials). As an example, Figure 2 shows the temporal variability of daily temperature, precipitation, and CO2 flux anomalies for the measurement station located in the Australian savannas (Dry River, AU-Dry).
The time-series analysis evidenced that the CO2 flux anomalies in the savanna and woody savanna areas usually occurred during the wet season. Positive daily CO2 flux anomalies (up to 4 gC m−2 d−1) were usually observed on days with extreme precipitation (Figure 2, Figure S4a of Supplementary Materials) and were associated with high soil moisture, resulting in higher soil respiration rates [42]. This effect may have been associated with the “Birch effect” [43], manifested by a strong CO2 release following the rewetting of dry soils. Several phenomena connected with the effect were previously found: more nitrogen and carbon are released from soils under wetting and drying cycles than from continuously wet soils; the longer the drying period the greater the degree of decomposition and mineralization during subsequent wetting; enhanced decomposition and the mineralization of soil organic matter decline with time after rewetting [44,45]. A sharp increase in CO2 uptake by these ecosystems, leading to negative flux anomalies, was observed between a few days and one week after heavy rains (for example the period March–April 2012 at Figure 2). It may have been due to the intensification of photosynthesis in living plants [32]. Similar effects of precipitation on CO2 uptake were previously detected at several experimental sites in savanna in Australia [46,47] and Africa [48].
The influence of temperature on CO2 fluxes in savannas is stronger in a dry season: low temperatures are accompanied by negative CO2 flux anomalies (Figure S4b), mainly due to the reduction in soil and plant CO2 respiration rates, whereas positive flux anomalies (increased CO2 emission) tend to occur during hot periods (Figure S4c). However, all these anomalies were significantly lower than CO2 flux anomalies during extreme precipitation periods.
The tropical seasonal or dry forests were characterized by well manifested seasonal variability in CO2 fluxes caused by plant phenology, air temperature, and precipitation. Significant negative daily CO2 flux anomalies (increase in CO2 uptake up to 4.0 gC m−2 day−1) may have been due to photosynthesis intensification after the heavy rainfalls at the onset of the summer monsoon season (Figure S5a). Another reason for such an effect was the inhibition of soil respiration by strong rainfalls [49]. Similar but weaker (<−2.0 gC m−2 day−1) negative CO2 flux anomalies were also associated with negative temperature anomalies (Figure 2b). Prolonged heavy rainfalls were often accompanied by positive flux anomalies (increasing CO2 release) due to soil wetting and solar radiation decrease (Figure S5c). Such positive daily CO2 flux anomalies did not exceed 2.6 gC m−2 day−1. The positive CO2 flux anomalies occurred also during the dry period in the days with extreme high temperatures, resulting from suppressed photosynthesis and the respiration of vegetation (Figure S5b March–April–May). These daily anomalies were usually lower than 1.0 gC m−2 day−1.
Temperature extremes are quite rare in the equatorial climate; therefore, CO2 flux anomalies in tropical rainforests are primarily related to precipitation variations. The precipitation intensity varies over the year, depending on the seasonal migration of the Intertropical convergence zone, resulting in drier and wetter seasons [31,50,51]. Inter-annual variability of precipitation in the Pacific is also induced by El Niño Southern Oscillation phenomenon [29]. During the wetter period, the positive daily CO2 flux anomalies (up to 6.2 gC m−2 day−1) are observed in days with heavy precipitation due to decreased solar radiation, reducing GPP, and sufficient soil moisture conditions, enhancing soil decomposition and the mineralization processes (Figure S6a). The analysis also showed that even insignificant precipitation leads to positive CO2 flux anomalies during dry seasons (Figure S6a, November–December). The positive CO2 flux anomalies are also observed during the periods with positive temperature anomalies due to an increase in ER and CO2 emissions into the atmosphere (Figure S6b). However, these anomalies are significantly lower than those induced by extreme precipitation and do not exceed 1.0 gC m−2 day−1.
The CO2 fluxes in wetlands are primarily dependent on precipitation rather than on anomalous temperatures. Positive daily CO2 flux anomalies (up to 3.1 gC m−2 day−1) tend to occur during heavy precipitation events (Figure S7), resulting in an increase in CO2 release into the atmosphere. As annual temperature fluctuations are small, and temperature extremes are rarely exceeded in the wetlands, their influence on the anomalies of CO2 fluxes is less than that of precipitation.

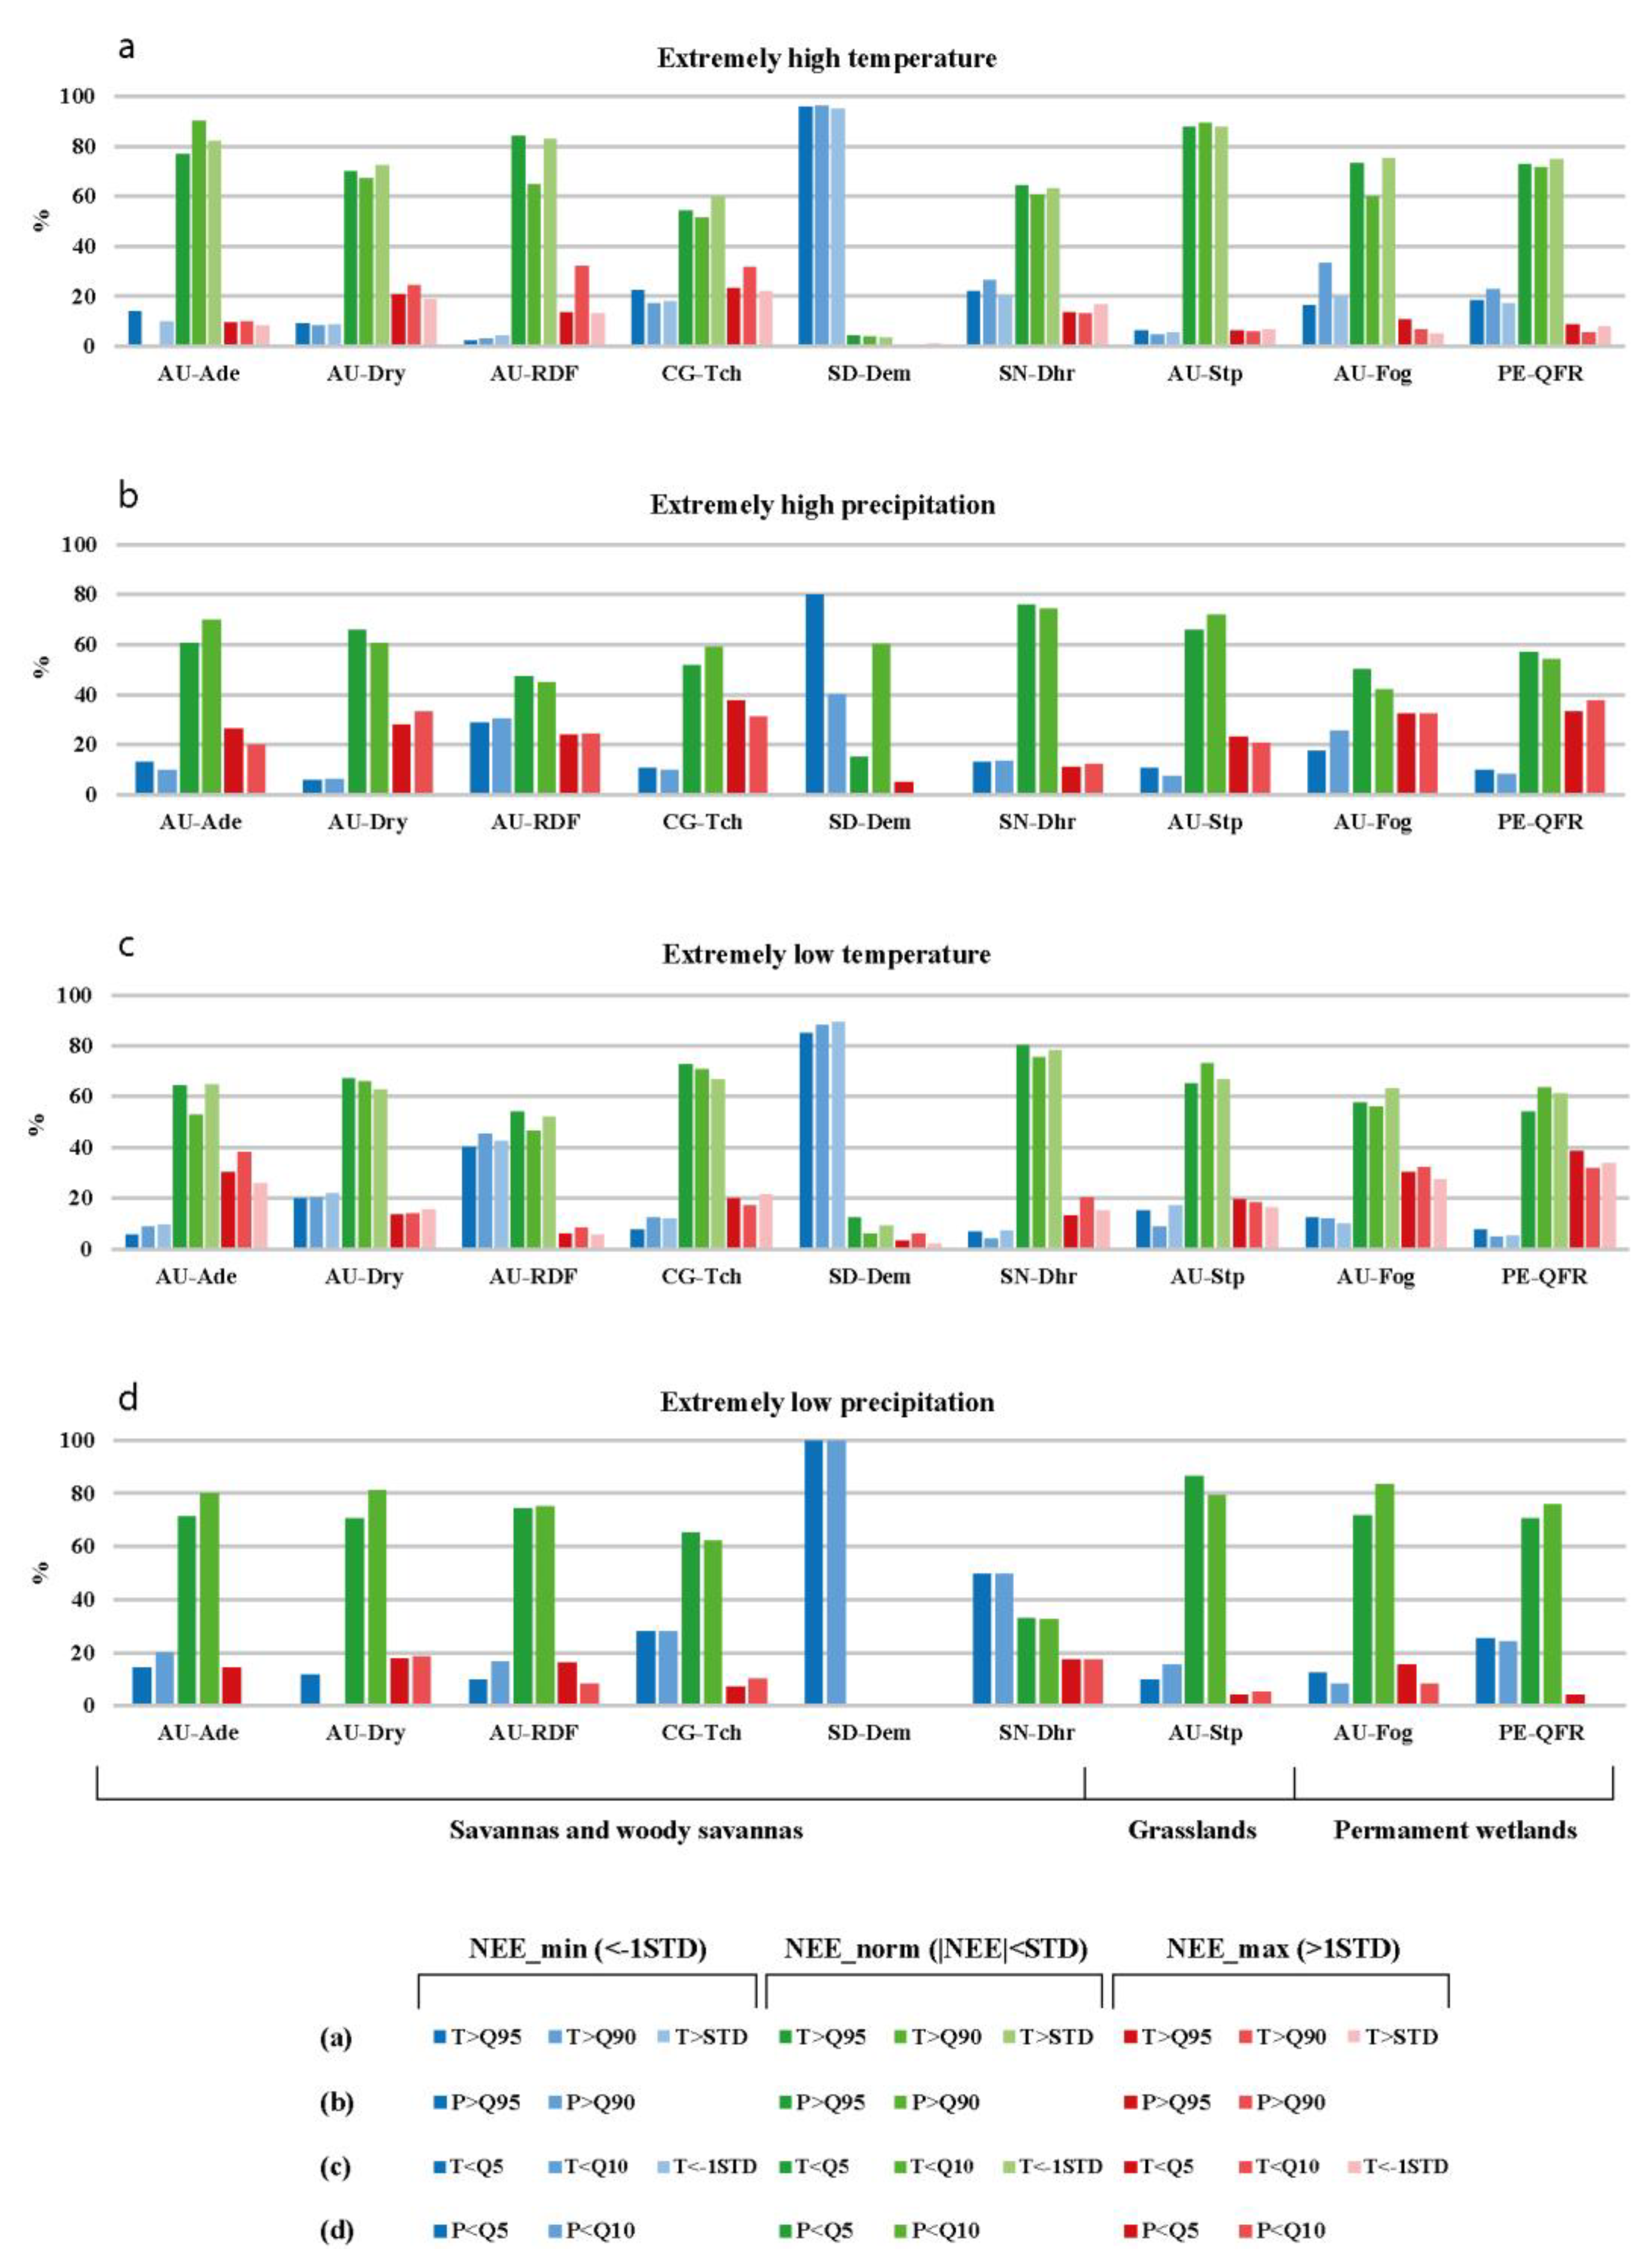
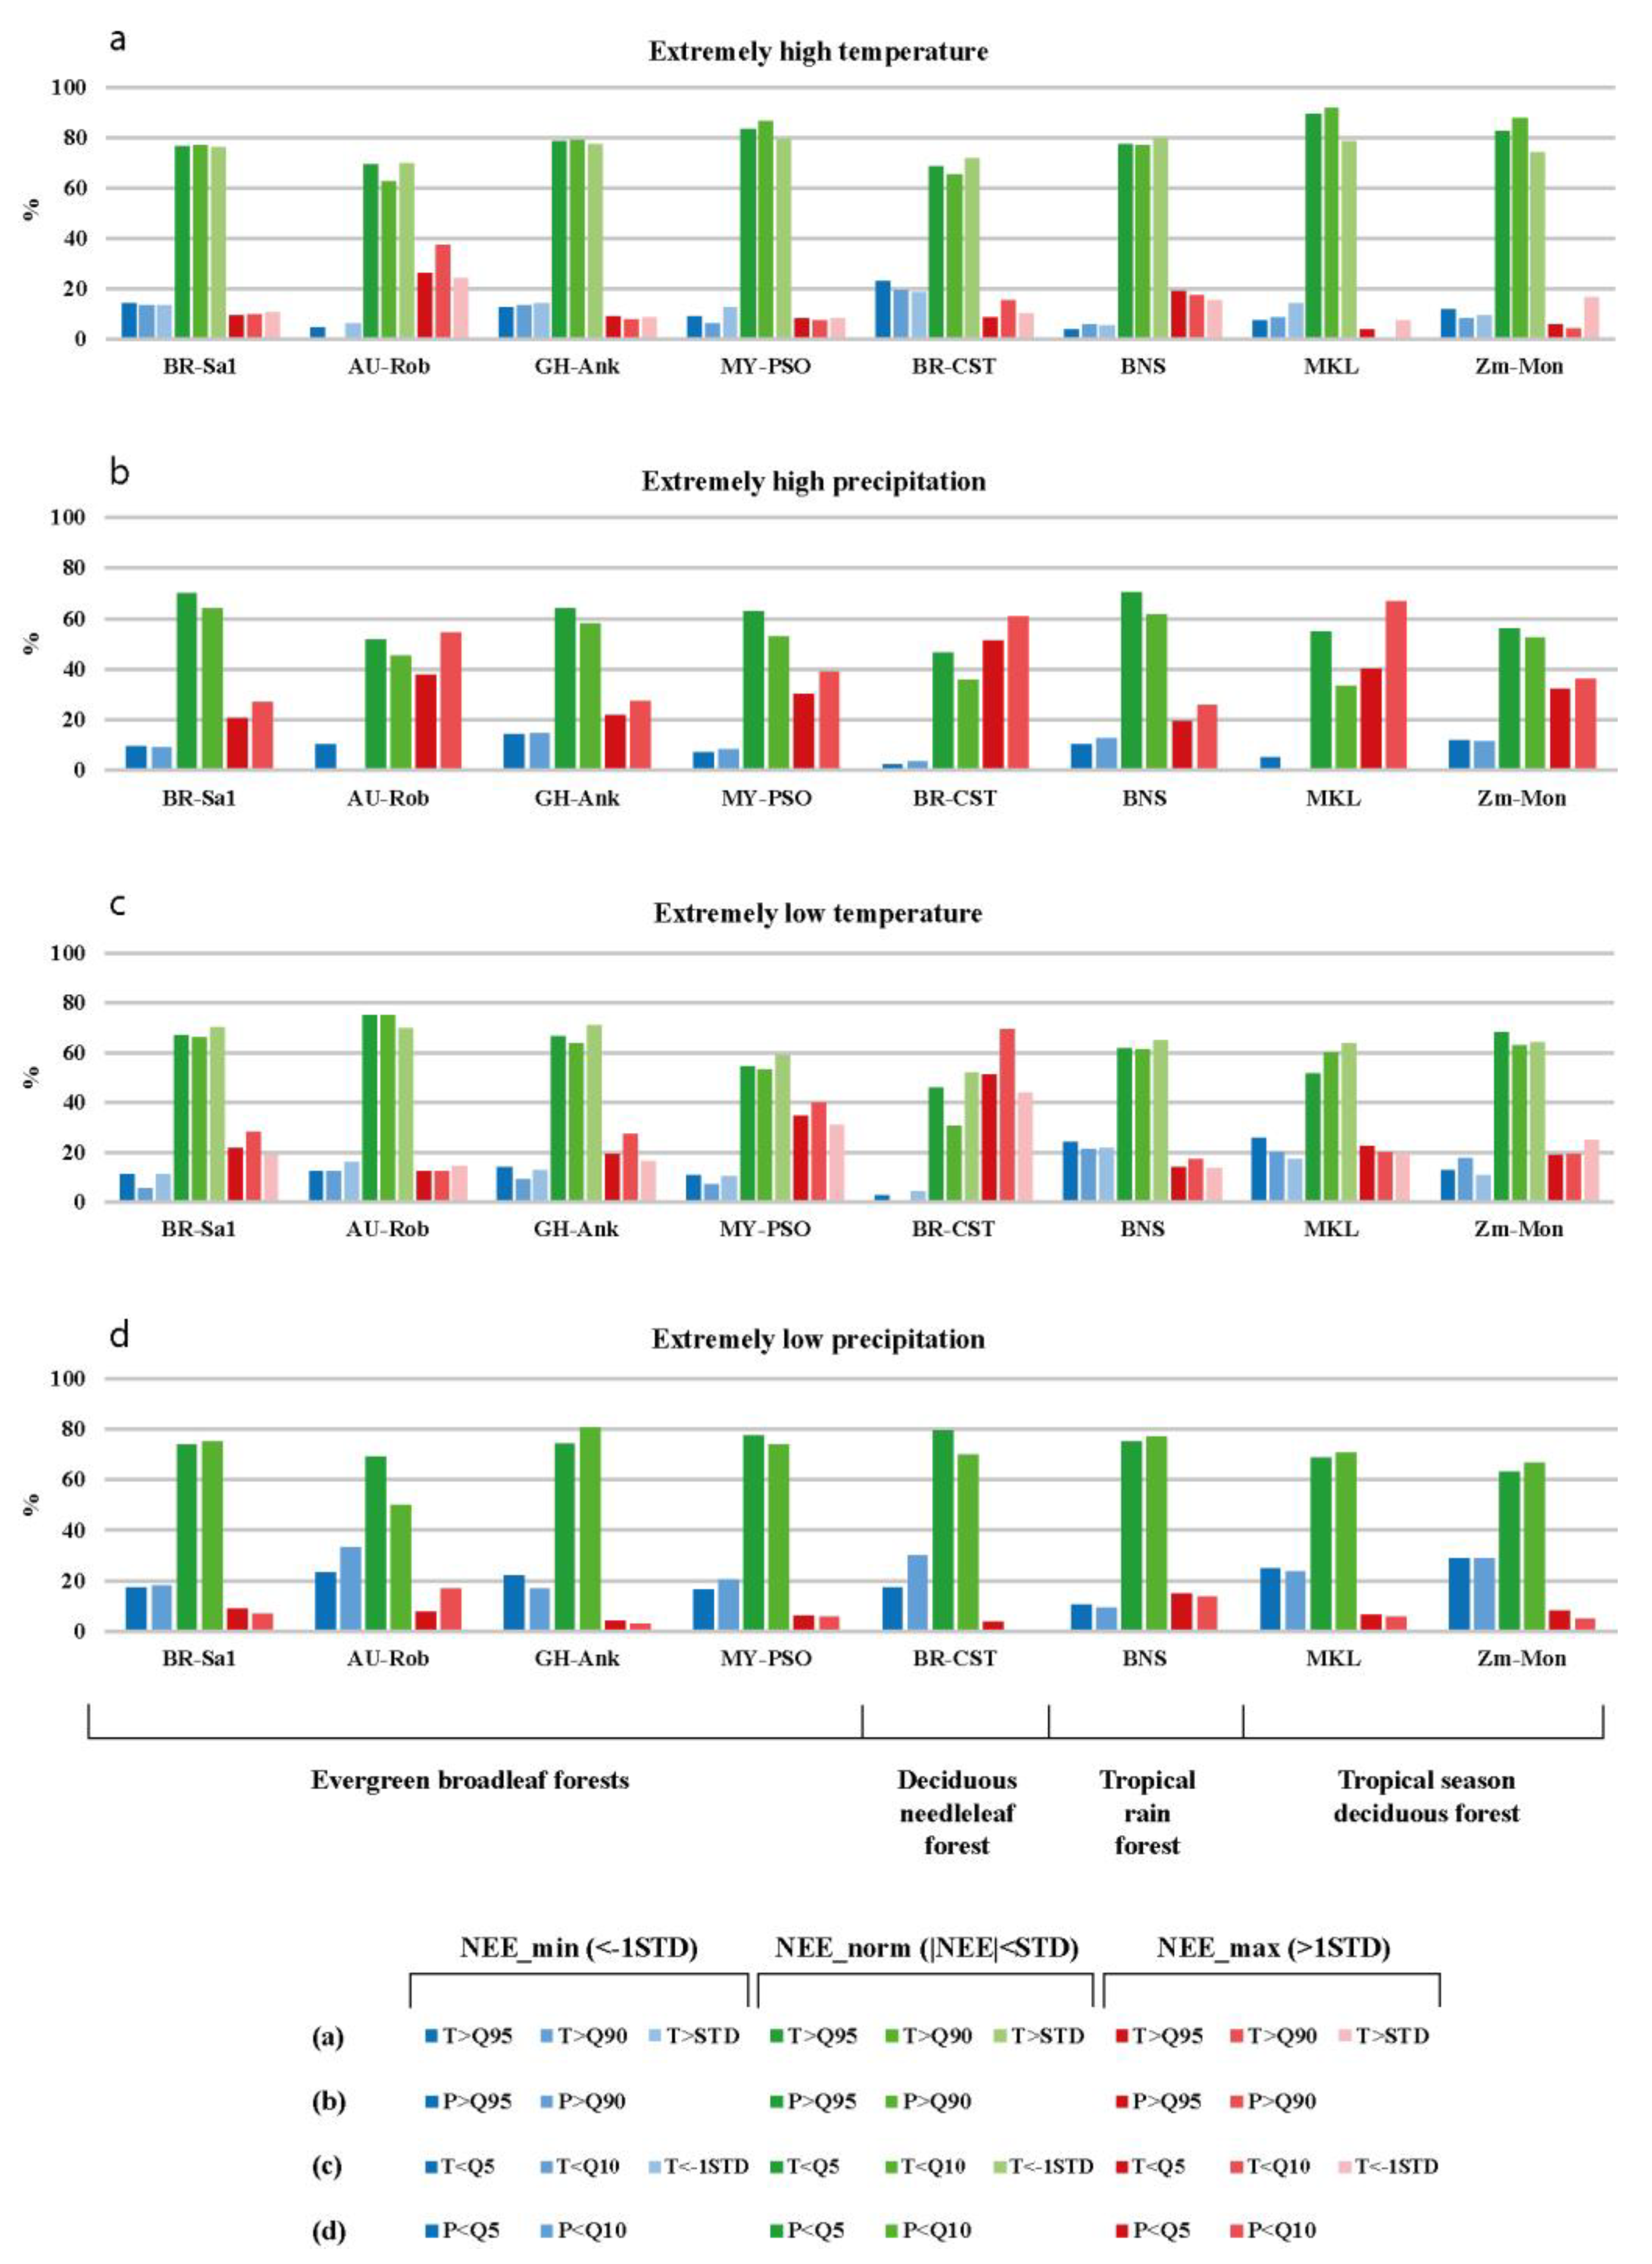
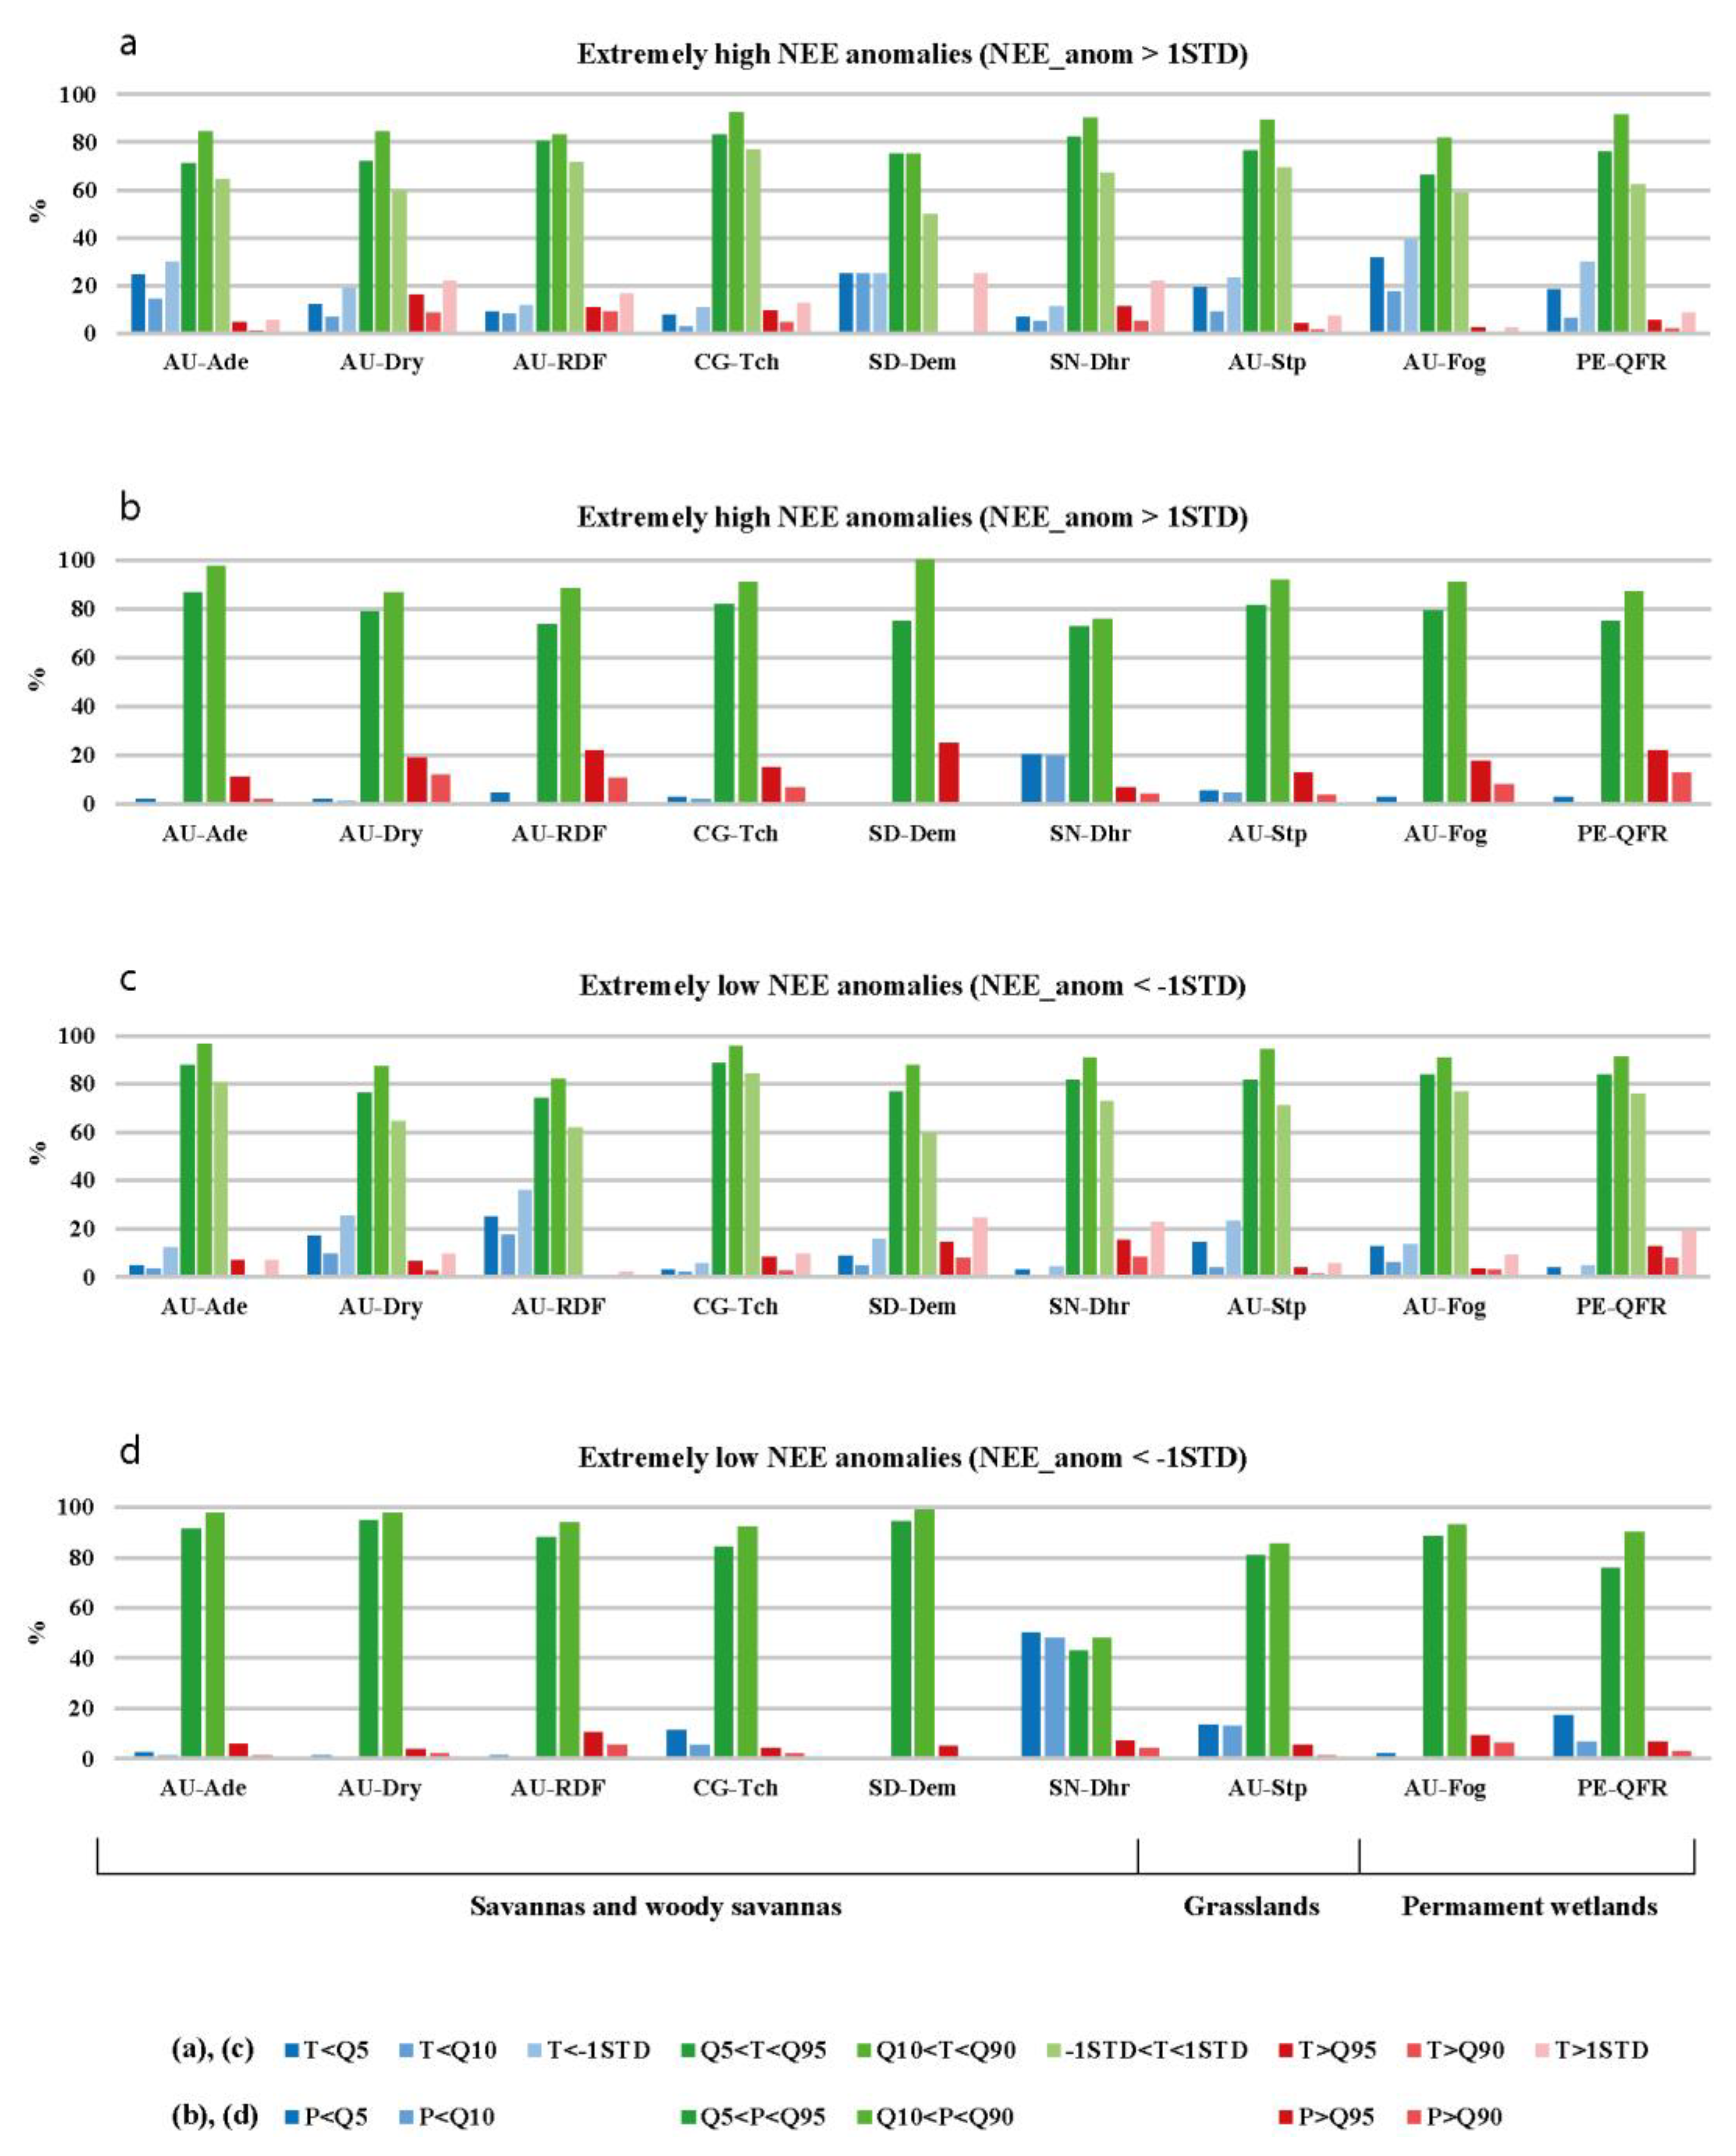
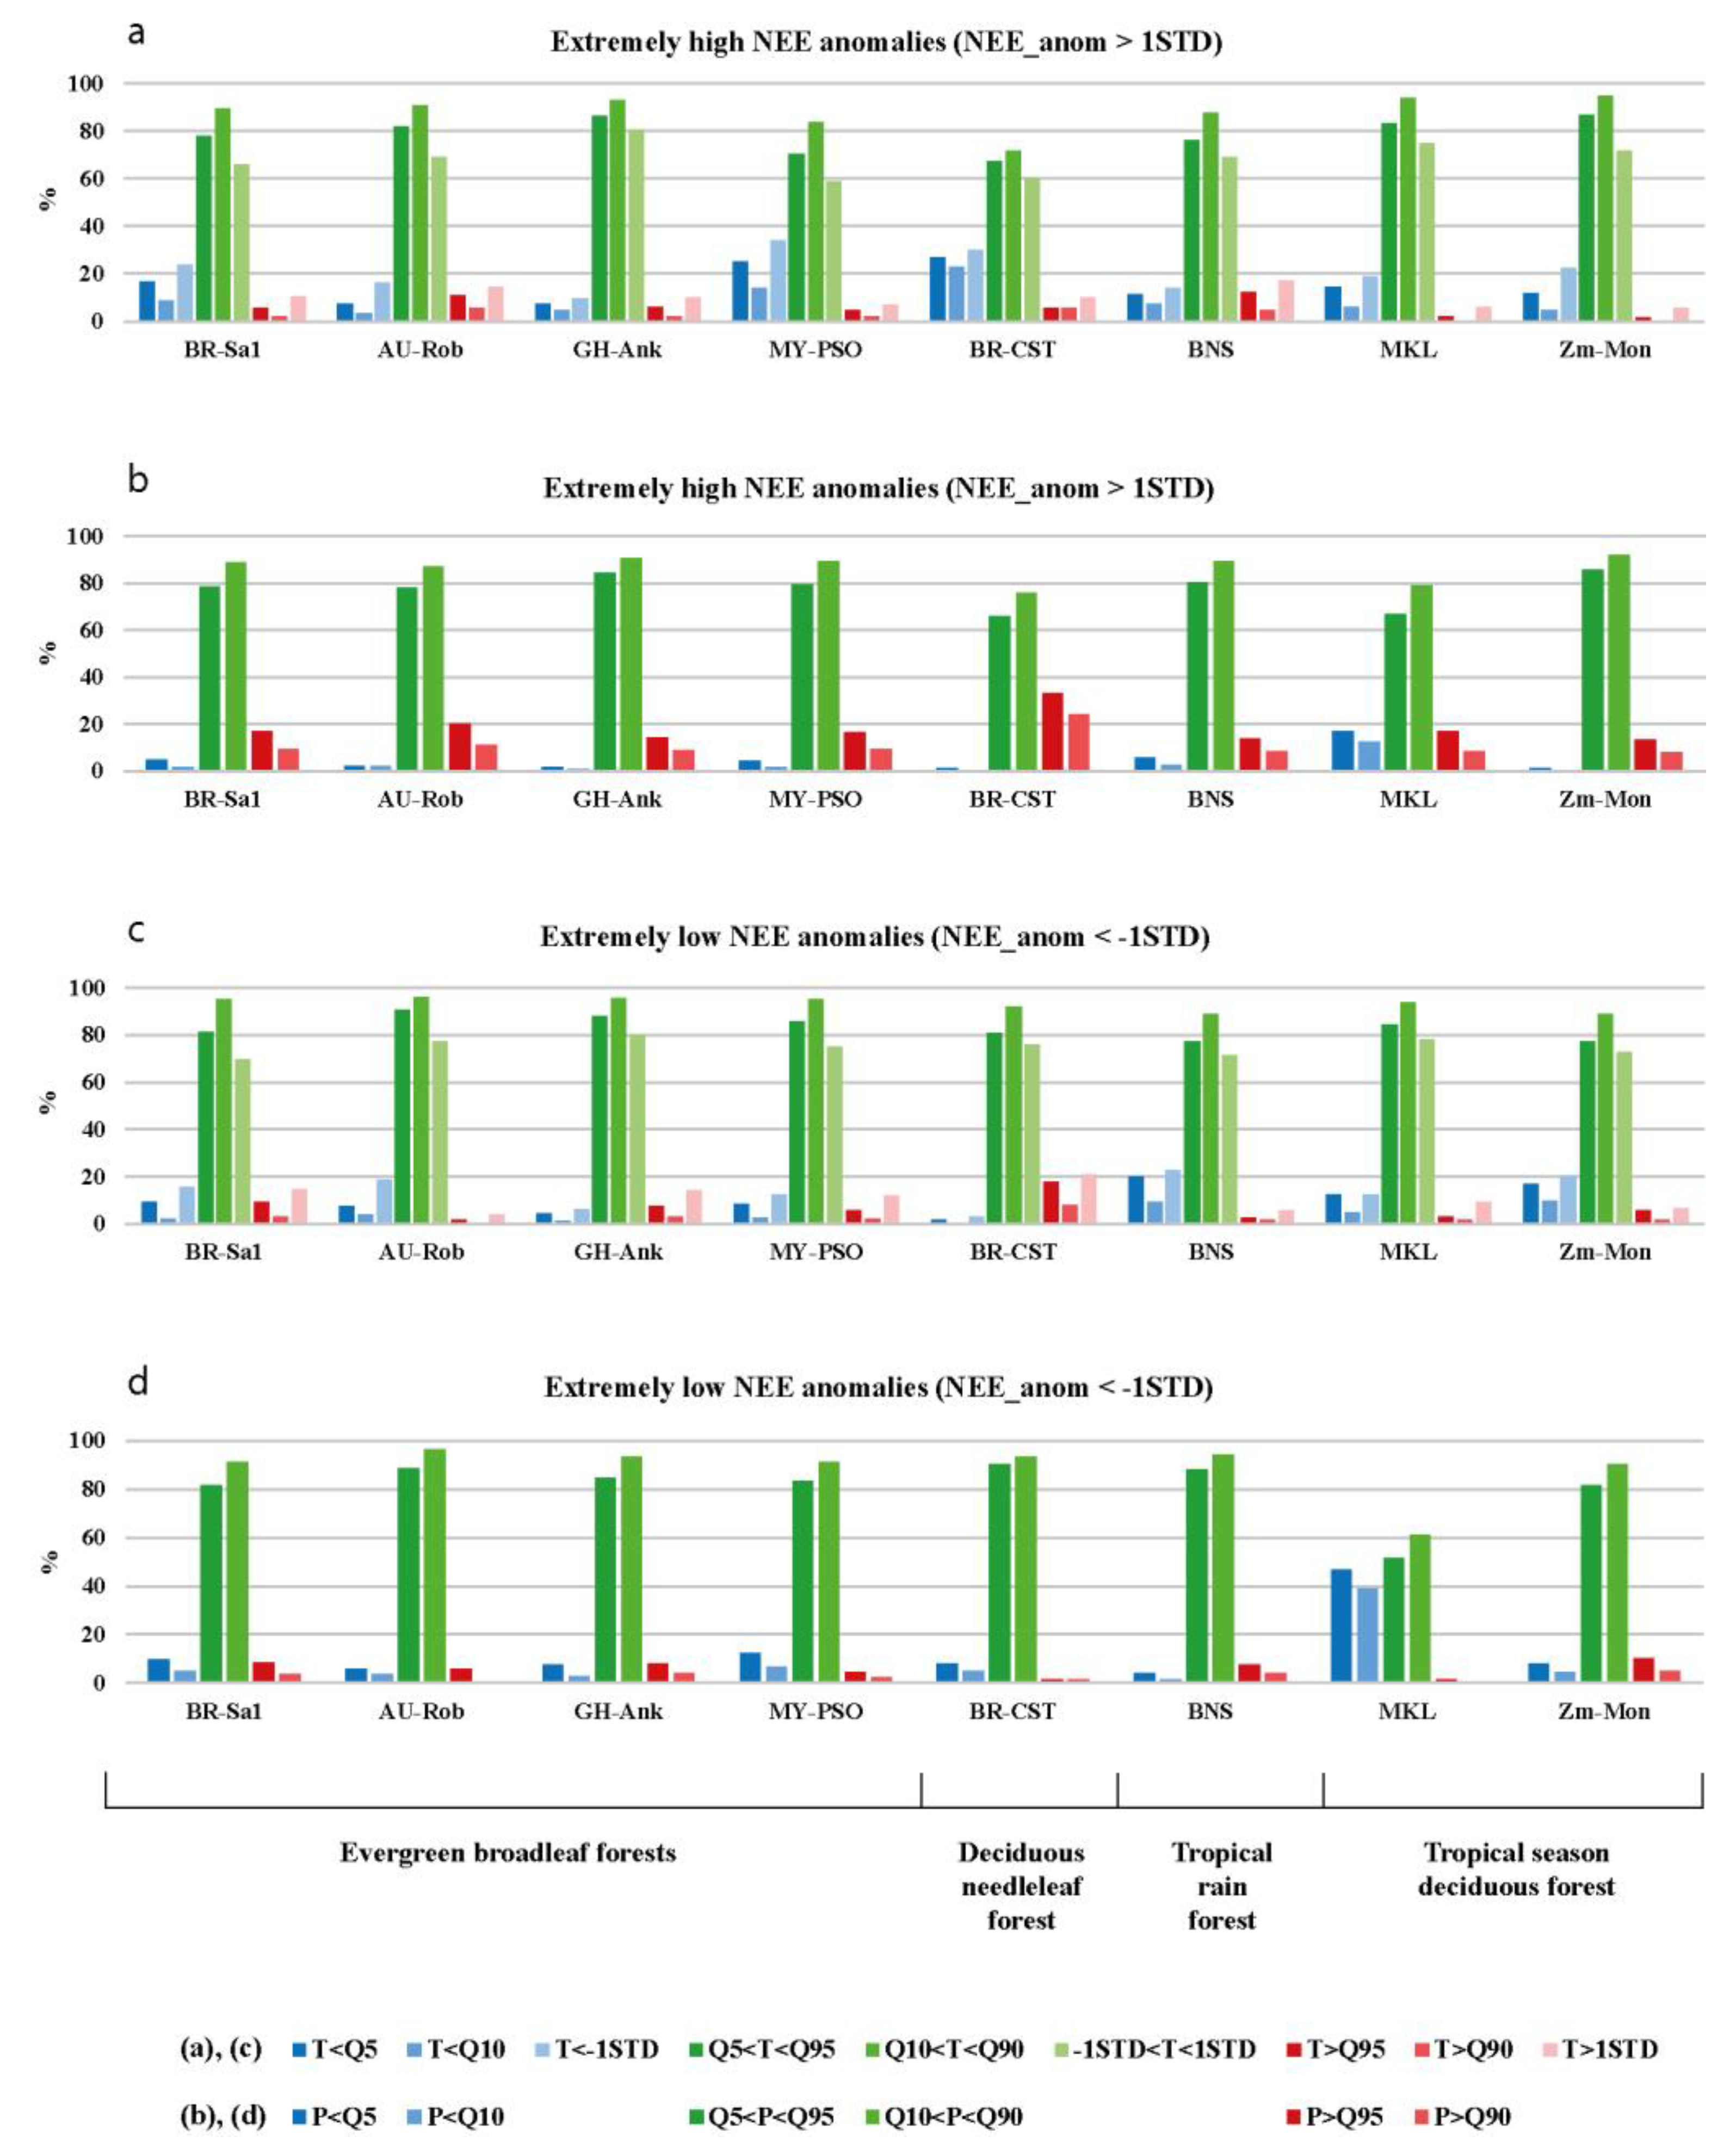
3.2. The Statistics of Relationships between Extreme Weather Conditions and Daily CO2 Flux Anomalies

To quantify the relationships between extreme temperature/precipitation and CO2 fluxes, we calculated the percentage of the days when the temperature (precipitation) and CO2 flux thresholds were simultaneously exceeded from the total number of the days when one of the characteristics (temperature or precipitation or CO2 flux anomalies) exceed the threshold values. For example, we considered the number of days when the temperature anomaly exceeded the threshold (95%, 90% quantile or 1 STD) or when it was lower than the threshold (5%, 10% quantile or −1 STD) during the analyzed period as 100%. Within this sample, we then calculated the percentage of days when the CO2 flux anomalies occurred simultaneously with temperature extremes: higher than 1 STD (max), lower than −1 STD (min), and the anomaly was less than STD (norm). This percentage is presented in Figure 3a and Figure 4a for extreme high temperatures and in Figure 3c and Figure 4c for extreme low temperatures. The same procedure was applied to precipitation, where the 95 (90)% and 5 (10)% thresholds were considered (Figure 3b,d and Figure 4b,d). As a second step, we verified the inverse relationship, i.e., considered the total number of the days, when CO2 flux anomalies exceeded 1 STD as 100% and, within this sample, calculated the number of the days when temperature (daily precipitation) anomalies simultaneously exceeded the thresholds (Figure 5a,c and Figure 6a,c for CO2 flux anomalies > 1 STD, Figure 5b,d and Figure 6b,d for CO2 flux anomalies <−1 STD).

3.2.1. Relationships between Daily Precipitation and CO2 Flux Anomalies

Analysis showed that abundant precipitation mainly leads to increased CO2 emissions (Figure 3b) in savannas: during 25–37% of the days with extreme precipitation (exceeding 95% quantile), the positive anomalies of CO2 fluxes exceeded 1 STD. This trend was confirmed by the inverse relationship: 18–22% of the days with CO2 flux anomalies higher than 1 STD corresponded to the days with extreme (>95% quantile) precipitation (Figure 5b). This was due to the watering of the soil horizons and was a consequence of the increased activity of soil biota resulting in increased CO2 emissions from the soil surface. An exception to this rule was the station Au-RDF located in the north of Australia, where the extreme precipitation almost equally entailed strong positive and negative CO2 flux anomalies (Figure 3b). This may have been due to limited soil organic carbon stocks, leading to reduced soil respiration, as well as the rapid response of the photosynthetic apparatus of plants to increased water availability in the root zone. Noteworthy, this station was very close to the AU-Dry station, where the increase in CO2 emissions was only connected with abundant precipitation (Figure 1).
Precipitation deficit in savannas led to an increase in CO2 uptake on the African continent: negative CO2 flux anomalies exceeding 1 STD occurred within 28–100% of days, with daily rainfall below 5% (Figure 3d). Half of the days with CO2 flux anomalies lower than −1 STD (50%) coincided with precipitation amounts lower than 5% quantile in Sahel (SN-Dhr). At the other stations, the percentage was much lower (Figure 5d). On the other continents, the relationship “increased CO2 uptake/precipitation deficit” was not evident, and the CO2 flux anomalies did not exceed the STD during the days with the lack of precipitation. The increased CO2 uptakes under dry conditions may have resulted from the combined effects of the reduced ER and non-significantly changed GPP in savanna ecosystems due to their adaptation to drought conditions. The water supply from deeper water layers may have been a key factor influencing the high rate of plant photosynthesis. This was despite the fact that the seasonal GPP variations in semi-arid ecosystems were mainly controlled by near-surface soil water [52,53].
An increase in CO2 release in evergreen broadleaf forests was associated with extreme precipitation over 20–30% of days (Figure 4b), resulting from soil wetting and intensive soil respiration. This was the main feature of all analyzed flux stations located in evergreen tropical rainforests on different continents. A lack of precipitation (Figure 4d) led to an increase in CO2 uptake (16–23% of days). The latter may have been due to the increase in GPP values at high solar radiation (during the days without precipitation and clouds) and optimal soil moisture conditions that remained in evergreen forests even in the absence of precipitation. The inverse relationship was significant for positive CO2 flux anomalies that often were accompanied by heavy rainfall (Figure 6b) but was not significant for negative anomalies that were observed with no relevance to the precipitation extremes (Figure 6d). In tropical rainforests (e.g., flux station in South East Asia—BNS), the relationships between precipitation and CO2 fluxes were less evident, and the extreme precipitation usually did not correspond to the anomalies of CO2 fluxes.
The grasslands and permanent wetlands were characterized by the response of CO2 fluxes to the precipitation variability, similar to rainforests (Figure 3b,d): the strong CO2 release resulting from heavy rainfall (up to 33% of the days) and increased CO2 uptake associated with the lack of precipitation (up to 25% of the days). This type of relationship also occurred in the seasonal tropical deciduous forest, where up to 40% of days with extreme precipitation were characterized by extremely positive CO2 flux anomalies (Figure 4b), and up to 46% of the days with low precipitation coincided with strong negative CO2 flux anomalies (Figure 4d). However, in the other type of seasonal tropical forest—deciduous needle-leaf forest—there was no evidence of any relationship between precipitation and CO2 fluxes, with an almost equal percentage of the days with positive and negative flux anomalies accompanying the lack of precipitation. The heaviest precipitation was mostly associated with increased CO2 emission, but the percentage was low (up to 19%). The differences in the observed relationship were mainly influenced by the differences in ER and GPP and their responses to changing soil moisture conditions caused by both precipitation anomalies and local soil moisture conditions, as well as it was affected by various specific biotic and abiotic factors [54].

3.2.2. Relationships between Daily Air Temperature and CO2 Flux Anomalies

The response of CO2 fluxes to extreme temperatures varied significantly between ecosystems and even within one biome. It may have been due to the stronger dependence of CO2 fluxes of tropical ecosystems on the precipitation than on temperature variations, as was evidenced by the earlier analysis of the time series.
At two savanna stations (AU-Dry and AU-RDF), the extreme high temperatures resulted in increased CO2 emissions (Figure 3a) and extreme low temperatures—in increased CO2 uptake (Figure 3c). The inverse relationship was also significant (with lower percentage): the positive CO2 flux anomalies were more likely during the hot days (Figure 5a) and negative anomalies—during the days with temperature declines (Figure 5c). At the station AU-Ade, the opposite response was detected: minimum temperatures were associated with increased CO2 emission (up to 38% of the days) and maximum temperatures, in turn, with CO2 uptake (up to 30% of the days). In Sahel (SN-Dhr), the hot days were characterized by prevailing increased CO2 uptake. In Congo (CG-Tch), there was no evident relationship between air temperature and CO2 flux variations, which was likely the result of the dominant influence of precipitation conditions (as evidenced by the high percentage of precipitation extremes). At least in Sudan (SD-Dem), the negative CO2 flux anomalies dominated during the period of observations, with no relevance to the temperature changes.
In the evergreen forests, the temperature decreases mainly coincided with high CO2 emissions (Figure 4c). Similar relationships were found in seasonal or dry forests (an exclusion for MKL, where the positive and negative CO2 flux anomalies were equally likely during the periods of low temperature) and in wetlands (Figure 3c). However, these tendencies may also have been related to precipitation changes: as mentioned above, the abundant precipitation results in increased net CO2 releases due to lower GPP and higher ER. At the same time, the heavy precipitation was accompanied by increased cloudiness. Cumulonimbus clouds with a high cloud optical depth dominated in the equatorial latitudes. This led to a significant reduction in total solar radiation, a corresponding decrease in temperature under cloudy conditions, and a large angle of incidence of sunlight. However, in Australian evergreen and tropical rain forests, the positive CO2 flux anomalies occurred, on the contrary, during the days with high temperature (Figure 4a) and negative CO2 flux anomalies—during the days with low temperature (Figure 4c).
In comparison to precipitation, when the maximum percentage of simultaneous extremes in weather conditions and CO2 fluxes was observed for the 95% quantile threshold, for temperature, the maximum percentage was observed for the 90% quantile of PDF.

3.2.3. The Correlation between Daily CO2 Flux Anomalies and Temperature/Precipitation Extremes

The correlations between extreme air temperature (precipitation) and CO2 flux anomalies confirmed the results mentioned above (Table 1). Correlations were calculated for the time series, consisting of the days when the extreme event threshold was exceeded: 5%/95% (P Q95) and 10%/90% (P Q90) quantiles for precipitation and 5%/95% (T Q95) and 10%/90% (T Q90) quantiles with ±1 STD (T STD) for temperature. The number of samples used for correlation analysis is shown in Table S1 of the Supplementary Materials.
The extreme precipitation was positively correlated with CO2 flux anomalies, i.e., the abundant precipitation was associated with the strong CO2 release and weak precipitation with increased CO2 uptake. The statistically significant (p < 0.05) correlation for 95% quantile threshold was found in the Australian and Congo savannas, the evergreen forests in Australia (the maximum correlation—0.81) and Malaysia, and the deciduous needle-leaf forest in Brazil. The statistically significant correlation for the 90% quantile threshold was found only in two stations (Au-Rob and MY-PSO) in the evergreen forests. At two stations, the MKL in monsoon forests in Thailand and the GH-Ank in evergreen forests in Ghana, a negative correlation between precipitation and CO2 fluxes was found, but it was not statistically significant.
The extreme temperatures had a positive and negative correlation with CO2 flux anomalies. A positive correlation was found in the savanna in Sudan and the evergreen forests in Australia (R = 0.39 for 95% quantile) and Ghana. In these ecosystems, the high temperatures corresponded to increased CO2 releases, and a decrease in temperature led to higher CO2 uptake. Most ecosystems were characterized by a negative correlation between temperature and CO2 flux anomalies, i.e., positive CO2 flux anomalies occurred during periods of low temperature and negative anomalies during rising temperatures. The maximum correlation (R = −0.51, p < 0.05) was found in the Brazilian needle-leaf forest.

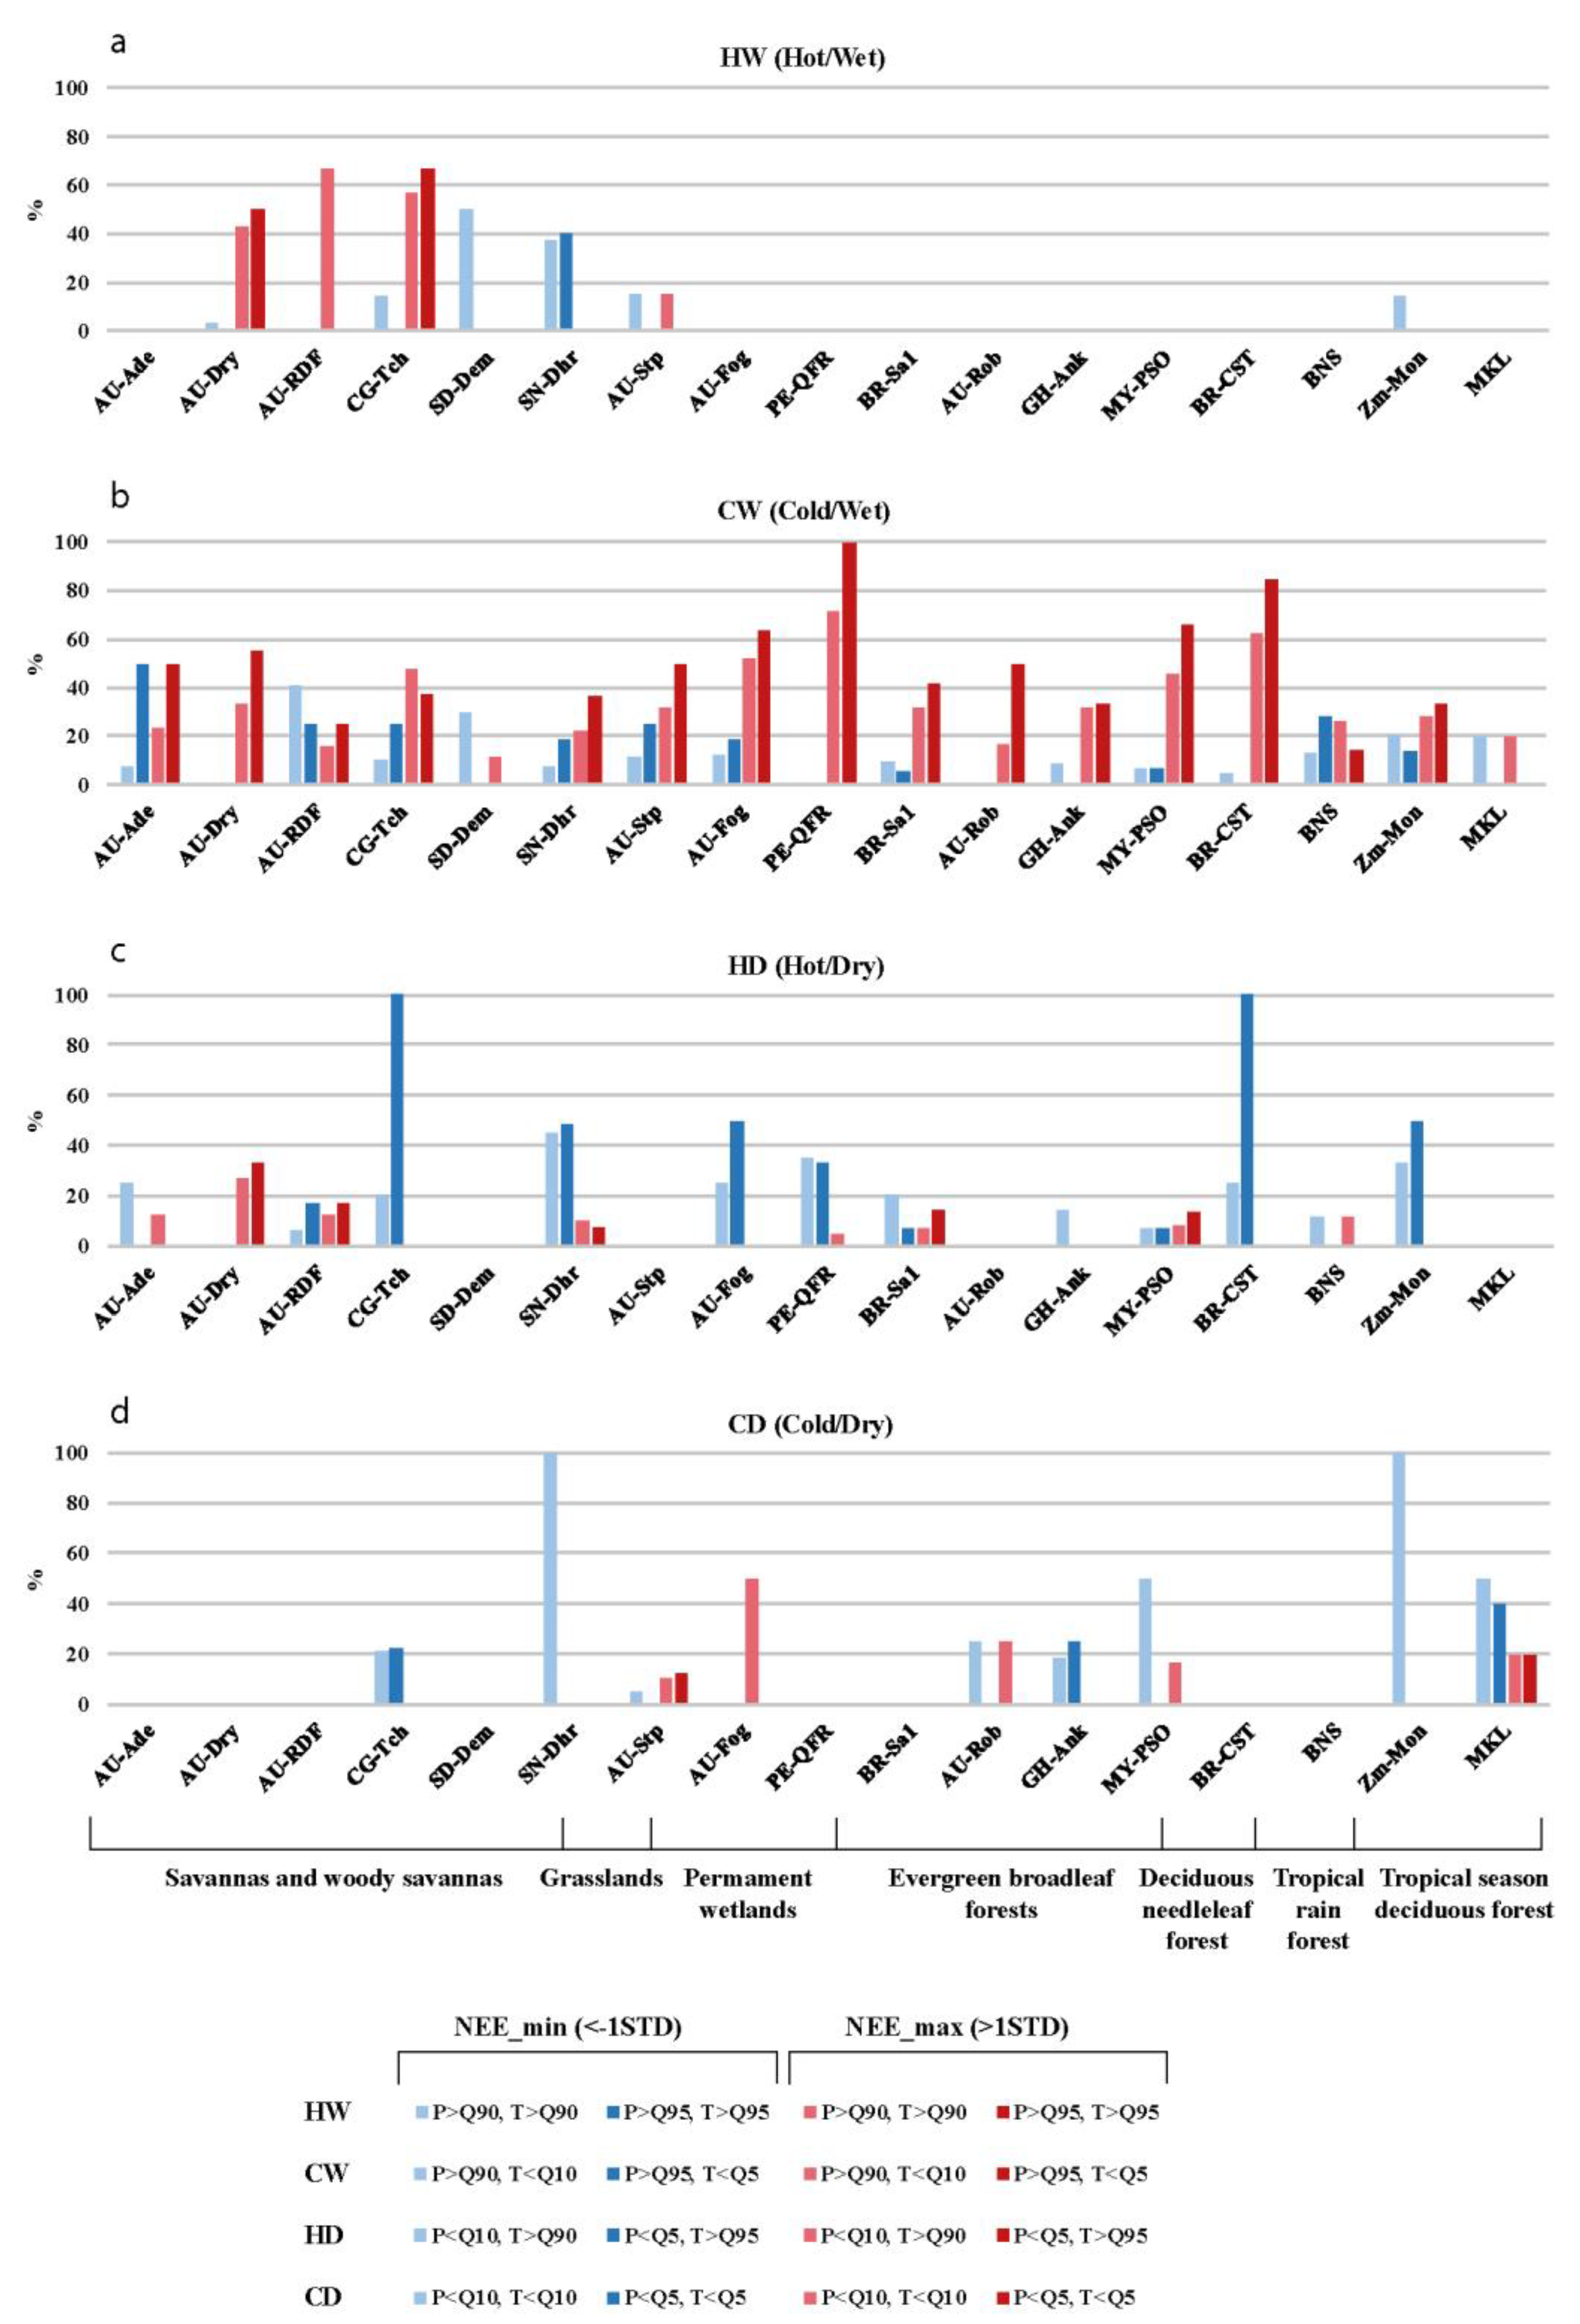
3.2.4. Combined Effect of Temperature and Precipitation Extremes on Daily CO2 Fluxes

In the second step, we examined the combined effect of temperature and precipitation on CO2 fluxes (Figure 7). The most significant impact on daily CO2 fluxes had the aggregated effect of cold/wet (CW) conditions, i.e., extremely high precipitation and extreme low temperatures (Figure 7b). In all considered stations, the CW conditions were mostly associated with positive CO2 flux anomalies: 20–100% of the days with CW conditions corresponded to CO2 flux anomalies exceeding 1 STD. Maximum simultaneous occurrences of CW and positive CO2 flux anomalies were observed in evergreen forests, whereas they were rare in the tropical rain forests and tropical seasonal deciduous forests. The increase in the release of CO2 into the atmosphere under CW conditions likely resulted from the combined effect of GPP and ER changes: cold, wet, and cloudy weather promoted reduced plant photosynthesis and GPP; cold weather led to a decrease in ER; and increased soil water content, SWC (at SWC < field capacity), may have, in turn, resulted in ER increase. The surface water logging under abundant precipitation may have resulted in reduced GPP because of hypoxia and increased heterotrophic soil respiration [55,56].
The effect of hot/wet (HW) anomalies on daily CO2 fluxes was manifested only in savannas and woody savannas, and they could lead to both positive and negative CO2 flux anomalies. Negative anomalies could be associated with an increase in savanna greenness and GPP, especially after the dry season [57]. Positive CO2 flux anomalies were mainly the result of higher rates of heterotrophic and autotrophic respiration under elevated temperatures [58] and sufficient soil water supply [42]. It was notable that the high positive CO2 flux anomalies occurred during hot/wet conditions with almost the same probability as during cold/wet periods in the savannas (Figure 7a,b). This confirmed the hypothesis of the dominant influence of precipitation and soil moisture content on CO2 fluxes in the semiarid tropical regions.
The hot/dry (HD) weather conditions had a maximum impact on the CO2 fluxes in the tropical forests (evergreen, seasonal deciduous, and deciduous needle-leaf). During 22–100% of the days with extremely high temperatures and extremely low precipitations, increased CO2 uptakes (anomaly exceeds −1 STD) were found. These may have been the result of the very high GPP of tropical forests under sufficient soil moisture conditions. The reduced precipitation, in this case, was not a limiting factor in the optimal plant water supply. A similar effect of the hot/dry weather conditions on CO2 fluxes occurred in the savanna in Congo (Figure 7c). However, in the Australian forest savanna (station AU-Dry), 30% of the days with HD conditions corresponded to the abnormally high CO2 release. It was an interesting result because, according to an analysis of Chen et al. [59], the soil CO2 efflux in the northern Australian savanna during the most part of the dry season was much lower than the CO2 efflux during the wet season. The very high CO2 release under hot/dry weather conditions may have been due to the contribution of the forest canopy (reduced GPP and high ER) into the total CO2 flux [60].
The effect of cold/dry (CD) anomalous weather events on CO2 fluxes (during more than 20% of the days, the simultaneous CD and CO2 flux anomalies were observed) was detected in several ecosystems in western Africa, northern Australia, the Malaysian peninsula, and Southern Africa. Negative anomalies prevailed, although there was one positive (AU-Fog). The effect of CD anomalies on CO2 fluxes in other studied ecosystems was very small. The maximum negative CO2 flux anomaly was found in Sahel (SN-Dhr) and the deciduous broadleaf forest in western Zambia in Africa (ZM-Mon) and was evidently connected with seasonal variations in GPP [61] and the adaptation of woody landscapes to dry conditions [62]. The positive CO2 flux anomaly in a seasonal wetland in the wet–dry tropics of Northern Australia (AU-Fog) could be associated with variation in soil water content and groundwater depth, influencing GPP and ER [63]. The reduction in GPP under cold/dry anomalies while maintaining CO2 emissions from the wetted peat may have been the main reason for this trend.
It should be noted that the response of CO2 fluxes to weather anomalies evidenced in our study was somewhat different from the previously documented relationships. Zscheischler et al. [8] evidenced that positive extremes in CO2 fluxes were associated with dry and hot conditions in tropical forests. We detected the same CO2 flux responses in Australian forest savannas, whereas higher CO2 emission occurred during periods of extreme positive temperature anomalies in several types of evergreen and seasonal forests. However, the opposite feedback was revealed for most of the considered monitoring stations: intense CO2 emissions, associated with cold/wet and hot/dry weather conditions, were accompanied by strong CO2 uptakes. This indicated that CO2 flux changes were not related to the temperature/precipitation fluctuations in a straightforward manner, i.e., positive and negative temperatures and precipitation oscillations differently influenced GPP and ER rates that may have resulted in various responses of CO2 fluxes to external impacts. The response may have depended on various local biotic and abiotic factors, including plant canopy age and structure, biodiversity, plant plasticity, soil organic carbon, soil water availability, surface topography, solar radiation fluctuation, etc.

4. Conclusions

The analysis of the temporal variability of daily temperature, precipitation, and CO2 flux anomalies, as well as their relationships, highlighted the large diversity of CO2 flux responses to the fluctuations of temperature and precipitation in tropical ecosystems.
The heavy precipitation mainly led to a strong intensification of CO2 release into the atmosphere due to increased soil moisture and intensified microbial activity, enhanced the decomposition and mineralization of soil organic matter (“Birch effect”), and increased autotrophic plant respiration. These types of relationships have been observed at almost all stations in all types of study biomes. Within a few days after heavy rainfall, CO2 emission gradually declined with time after rewetting, and the ecosystems began to serve as a CO2 sink from the atmosphere, mainly due to the intensification of plant photosynthesis under optimal soil moisture conditions.
The precipitation deficit contributed to the negative anomalies (higher uptake) of CO2 fluxes (with, however, almost half weaker relationship than for heavy precipitation) due to reduced ER and high GPP rates under sufficient soil moisture supply.
The influence of temperature fluctuations on CO2 fluxes was more pronounced during the dryer period, associated with a lack of precipitation. In evergreen forests, seasonal or dry forests, wetlands, and some savannas, the low temperatures coincided with higher CO2 emissions. During the rainy season, the temperature effect was closely related to changes in precipitation: the abundant precipitation was accompanied by a strong cloudiness and, therefore, a lower temperature. At the same time, extreme precipitations implied an increase in CO2 emissions.
In some savannas, Australian evergreen forests, and seasonal or dry forests, high temperatures contributed to higher CO2 emissions, whereas low temperatures assisted in higher CO2 uptake. Higher temperatures usually led to higher ER rates if there was a lack of the limiting influence of other external factors such as soil moisture availability. This type of relationship was likely typical of the dry season, when the influence of precipitation was negligible. The extreme high temperatures stressed the photosynthesis, reduced GPP rate, and led to a higher release of CO2 into the atmosphere.
A comparison of the relationship between daily CO2 flux, precipitation, and temperature anomalies showed that the sensitivity of CO2 fluxes to precipitation anomalies was stronger than that of the temperature change. This may have been explained by relatively small temperature fluctuations in the tropics in comparison with the precipitation. In the geographical regions with strong seasonal variations in precipitation conditions, the stronger dependence of CO2 fluxes on precipitation than on temperature may have been due to the overall soil moisture deficiencies in these ecosystems during dry periods.
The strongest combined effect of temperature and precipitation on the daily CO2 fluxes was detected under cold/wet weather conditions, resulting in higher CO2 emissions almost in all considered tropical ecosystems. It may be interpreted as the effect of reduced GPP due to low temperature and reduced incoming solar radiation, as well as more intensive soil respiration due to abundant precipitation. The opposite weather conditions (hot/dry) were mostly associated with increased CO2 uptake. That was also not an evident result, as a lack of precipitation and extremely hot temperatures often led to the suppression of GPP and positive CO2 flux anomalies. In the tropical forests, however, the prevailing sufficient soil moisture conditions made precipitation not a limiting factor for GPP, whereas high temperatures associated with high solar radiation may cause the intensification of photosynthesis.
Notably, the anomalies of CO2 fluxes often did not coincide with extreme precipitation or temperature anomalies, indicating the strong influence of various abiotic and biotic factors on ecosystem functioning, manifesting differently for individual plant communities.
The optimal threshold for determining the strongest relationship between the weather extremes and CO2 fluxes was different for temperature and precipitation: it was a 95% (5%) quantile for precipitation and a 90% (10%) quantile for temperature. These were likely due to a smoother distribution of temperature as compared to precipitation.
Taking into account the revealed relationships, the results obtained require further multifaceted studies, involving a greater number of monitoring stations and a longer time series of observations of GHG fluxes.

Supplementary Materials

The following supporting information can be downloaded at: https://www.mdpi.com/article/10.3390/cli11060117/s1. Figure S1: Scatter plots for stations with good agreement (R2 ≥ 0.85, p < 0.05) of daily temperature from ERA5 reanalysis versus FLUXNET data sets. The period is specified in the parentheses of the plot title. Figure S2: Scatter plots for stations with moderate agreement (R2 < 0.85, p < 0.05) of daily temperature from ERA5 reanalysis versus FLUXNET data sets. The period is specified in the parentheses of the plot title. Figure S3: Scatter plots for stations of daily precipitation amount from the ERA5 reanalysis versus FLUXNET data sets with a period of observations longer than six years. The days when the daily precipitation from reanalysis and flux monitoring stations simultaneously exceeds the threshold 95% quantile (defined on the reanalysis data set) are considered. The period is specified in the parentheses of the plot title. Figure S4: The time series of CO2 flux anomaly and daily precipitation amount (a), daily temperature anomaly (b,c) in savannas at flux monitoring station SN-Dhr for 2011 (a), AU-Dry for 2011 (b) and AU-Ade for June 2008–June 2009. The days when the CO2 flux anomalies were greater (lower) than 1STD are marked by red (blue) points. The red (blue) shading is applied for the periods when temperature anomalies exceed the upper (low) threshold: 95% (5%) PDF quantile. The red shaded column (blue triangle) is applied for the days when precipitation daily amount exceeds the upper (low) threshold: 95% (5%)PDF quantile. The yellow shading corresponds to the dry period. Figure S5: The time series of CO2 flux anomaly and daily precipitation amount (a,c), daily temperature anomaly (b) in tropical seasonal or dry forests at flux monitoring station ZM-Mon for September 2007–September 2008 (a), MKL for 2004 (b), and BR-CST for June 2014–July 2015. The days when the CO2 flux anomalies were greater (lower) than 1STD are marked by red (blue) points. The red (blue) shading is applied for the periods when temperature anomalies exceed the upper (low) threshold: 95% (5%) PDF quantile. The red shaded column (blue triangle) is applied for the days when precipitation daily amount exceeds the upper (low) threshold: 95% (5%) PDF quantile. The yellow shading corresponds to the dry period. Figure S6: The time series of CO2 flux anomaly and daily precipitation amount (a), daily temperature anomaly (b) in evergreen broadleaf forests at flux monitoring station BR-Sa1 for 2002 (a), and AU-Rob for 2014 (b). The days when the CO2 flux anomalies were greater (lower) than 1STD are marked by red (blue) points. The red (blue) shading is applied for the periods when temperature anomalies exceed the upper (low) threshold: 95% (5%) PDF quantile. The red shaded column (blue triangle) is applied for the days when precipitation daily amount exceeds the upper (low) threshold: 95% (5%) PDF quantile. The yellow shading corresponds to the dry period. Figure S7: The time series of CO2 flux anomaly and daily precipitation amount in wetlands at flux monitoring station PE-QFR for 2018 (a), 2019 (b). The days when the CO2 flux anomalies were greater (lower) than 1STD are marked by red (blue) points. The red shading (blue triangle) is applied for the periods when precipitation exceeds the upper (low) threshold: 95% (5%) PDF quantile. Table S1. The number of samples (days) used for calculation of the correlation between the daily CO2 flux and temperature/precipitation anomalies.

Author Contributions

Conceptualization, D.G.; methodology, D.G., I.Z. and M.T.; software, M.T. and I.Z.; validation, M.T., D.G., E.S., E.E. and E.N.; formal analysis, M.T., E.S., E.E. and E.N.; investigation, M.T., E.S., I.Z. and D.G.; data curation, M.T., I.Z., E.S. and E.E.; writing—original draft preparation, D.G.; writing—review and editing, D.G. and A.O.; visualization, E.S. and M.T.; supervision, A.O.; project administration, A.O.; funding acquisition, A.O. All authors have read and agreed to the published version of the manuscript.

Funding

This research was funded by the Russian Science Foundation, grant number 22-17-00073.

Data Availability Statement

Not applicable.

Conflicts of Interest

The authors declare no conflict of interest.

References

  1. Gulev, S.K.; Thorne, P.W.; Ahn, J.; Dentener, F.J.; Domingues, C.M.; Gerland, S.; Gong, D.; Kaufman, D.S.; Nnamchi, H.C.; Quaas, J.; et al. The Changing State of the Climate. In Climate Change 2021: The Physical Science Basis. Contribution of Working Group I to the Sixth Assessment Report of the Intergovernmental Panel on Climate Change; Masson-Delmotte, V., Zhai, P., Pirani, A., Connors, S.L., Péan, C., Berger, S., Caud, N., Chen, Y., Goldfarb, L., Gomis, M.I., et al., Eds.; Cambridge University Press: Cambridge, UK; New York, NY, USA, 2021; pp. 287–422. ISBN 9781009157896. [Google Scholar]
  2. Seneviratne, S.I.; Zhang, X.; Adnan, M.; Badi, M.; Dereczynski, C.; Di Luca, A.; Ghosh, S.; Iskandar, I.; Kossin, J.; Lewis, S.; et al. Weather and Climate Extreme Events in a Changing Climate. In Climate Change 2021: The Physical Science Basis. Contribution of Working Group I to the Sixth Assessment Report of the Intergovernmental Panel on Climate Change; Masson-Delmotte, V., Zhai, P., Pirani, A., Connors, S.L., Péan, C., Berger, S., Caud, N., Chen, Y., Goldfarb, L., Gomis, M.I., et al., Eds.; Cambridge University Press: Cambridge, UK; New York, NY, USA, 2021; pp. 1513–1766. ISBN 9781009157896. [Google Scholar]
  3. Frank, D.; Reichstein, M.; Bahn, M.; Thonicke, K.; Frank, D.; Mahecha, M.D.; Smith, P.; van der Velde, M.; Vicca, S.; Babst, F.; et al. Effects of climate extremes on the terrestrial carbon cycle: Concepts, processes and potential future impacts. Glob. Chang. Biol. 2015, 21, 2861–2880. [Google Scholar] [CrossRef]
  4. Forzieri, G.; Girardello, M.; Ceccherini, G.; Spinoni, J.; Feyen, L.; Hartmann, H.; Beck, P.S.A.; Camps-Valls, G.; Chirici, G.; Mauri, A.; et al. Emergent vulnerability to climate-driven disturbances in European forests. Nat. Commun. 2021, 12, 1081. [Google Scholar] [CrossRef] [PubMed]
  5. Pugnaire, F.I.; Morillo, J.A.; Peñuelas, J.; Reich, P.B.; Bardgett, R.D.; Gaxiola, A.; Wardle, W.H.; van der Putten, W. Climate change effects on plant-soil feedbacks and consequences for biodiversity and functioning of terrestrial ecosystems. Sci. Adv. 2019, 5, eaaz1834. [Google Scholar] [CrossRef] [PubMed]
  6. Ummenhofer, C.C.; Meeh, I.G.A. Extreme weather and climate events with ecological relevance: A review. Philos. Trans. R. Soc. Lond. B Biol. Sci. 2017, 372, 20160135. [Google Scholar] [CrossRef] [PubMed]
  7. Parmesan, C.; Root, T.L.; Willig, M.R. Impacts of extreme weather and climate on terrestrial biota. Bull. Am. Meteorol. Soc. 2000, 81, 443–450. [Google Scholar] [CrossRef]
  8. Zscheischler, J.; Michalak, A.M.; Schwalm, C.; Mahecha, M.D.; Huntzinger, D.N.; Reichstein, M.; Berthier, G.; Ciais, P.; Cook, R.B.; El-Masri, B.; et al. Impact of Large-Scale Climate Extremes on Biospheric Carbon Fluxes: An Intercomparison Based on MsTMIP Data. Glob. Biogeochem. Cycles 2014, 28, 585–600. [Google Scholar] [CrossRef]
  9. Forzieri, G.; Dakos, V.; McDowell, N.G.; Ramdane, A.; Cescatti, A. Emerging signals of declining forest resilience under climate change. Nature 2022, 608, 534–539. [Google Scholar] [CrossRef]
  10. Russell, A.E.; Parton, W.J., Jr. Modeling the Effects of Global Change on Ecosystem Processes in a Tropical Rainforest. Forests 2020, 11, 213. [Google Scholar] [CrossRef]
  11. Grace, J.; Lloyd, J.; McIntyre, J.; Miranda, A.; Meir, P.; Miranda, H.; Nobre, C.; Moncrieff, J.B.; Massheder, J.M.; Malhi, Y.; et al. Carbon dioxide uptake by an undisturbed tropical rain forest in south-west Amazonia, 1992 to 1993. Science 1995, 270, 778–780. [Google Scholar] [CrossRef]
  12. Phillips, O.L.; Aragao, L.; Lewis, S.L.; Fisher, J.B.; Lloyd, J.; Lopez-Gonzalez, G.; Malhi, Y.; Monteagudo, A.; Peacock, J.; Quesada, C.A.; et al. Drought sensitivity of the Amazon rainforest. Science 2009, 323, 1344–1347. [Google Scholar] [CrossRef]
  13. Ciais, P.; Piao, S.L.; Cadule, P.; Friedlingstein, P.; Chedin, A. Variability and recent trends in the African terrestrial carbon balance. Biogeosciences 2009, 6, 1935–1948. [Google Scholar] [CrossRef]
  14. Olchev, A.; Ibrom, A.; Panferov, O.; Gushchina, D.; Kreilein, H.; Popov, V.; Propastin, P.; June, T.; Rauf, A.; Gravenhorst, G.; et al. Response of CO2 and H2O fluxes in a mountainous tropical rainforest in equatorial Indonesia to El Niño events. Biogeosciences 2015, 12, 6655–6667. [Google Scholar] [CrossRef]
  15. Malhi, Y. The carbon balance of tropical forest regions, 1990–2005. Curr. Opin. Environ. Sustain. 2010, 2, 237–244. [Google Scholar] [CrossRef]
  16. Reichstein, M.; Bahn, M.; Ciais, P.; Frank, D.; Mahecha, M.D.; Seneviratne, S.I.; Zscheischler, J.; Beer, C.; Buchmann, N.; Frank, D.C.; et al. Climate extremes and the carbon cycle. Nature 2013, 500, 287–295. [Google Scholar] [CrossRef]
  17. Busman, N.A.; Melling, L.; Goh, K.J.; Imran, Y.; Sangok, F.E.; Watanabe, A. Soil CO2 and CH4 fluxes from different forest types in tropical peat swamp forest. Sci. Total Environ. 2023, 858, 159973. [Google Scholar] [CrossRef]
  18. Malhi, Y.; Baldocchi, D.D.; Jarvis, P.G. The carbon balance of tropical, temperate and boreal forests. Plant Cell Environ. 1999, 22, 715–740. [Google Scholar] [CrossRef]
  19. Wood, T.E.; Cavaleri, M.A.; Reed, S.C. Tropical Forest carbon balance in a warmer world: A critical review spanning microbial- to ecosystem-scale processes. Biol. Rev. 2012, 87, 912–927. [Google Scholar] [CrossRef]
  20. Alkama, R.; Cescatti, A. Biophysical climate impacts of recent changes in global forest cover. Science 2016, 351, 600–604. [Google Scholar] [CrossRef]
  21. Artaxo, P.; Hansson, H.C.; Machado, L.A.T.; Rizzo, L.V. Tropical forests are crucial in regulating the climate on Earth. PLoS Clim. 2022, 1, e0000054. [Google Scholar] [CrossRef]
  22. Andersen, A. Net photosynthesis as an indicator of plant response to environmental influence. Acta Hortic. 1976, 64, 133–138. [Google Scholar] [CrossRef]
  23. Schurr, U.; Walter, A.; Rascher, U. Functional dynamics of plant growth and photosynthesis—From steady-state to dynamics—From homogeneity to heterogeneity. Plant Cell Environ. 2006, 29, 340–352. [Google Scholar] [CrossRef] [PubMed]
  24. The Data Portal Serving the FLUXNET Community. Available online: https://fluxnet.org/data/ (accessed on 5 October 2022).
  25. Granier, A.; Reichstein, M.; Bréda, N.; Janssens, I.A.; Falge, E.; Ciais, P.; Grünwald, T.; Aubinet, M.; Berbigier, P.; Bernhofer, C.; et al. Evidence for soil water control on carbon and water dynamics in European forests during the extremely dry year: 2003. Agric. For. Meteorol. 2007, 143, 123–145. [Google Scholar] [CrossRef]
  26. Hiyama, T.; Ueyama, M.; Kotani, A.; Iwata, H.; Nakai, T.; Okamura, M.; Ohta, T.; Harazono, Y.; Petrov, R.E.; Maximov, T.C. Lessons learned from more than a decade of greenhouse gas flux measurements at boreal forests in eastern Siberia and interior Alaska. Polar Sci. 2021, 27, 100607. [Google Scholar] [CrossRef]
  27. Gatti, L.V.; Gloor, M.; Miller, J.B.; Doughty, C.E.; Malhi, Y.; Domingues, L.G.; Basso, L.S.; Martinewski, A.; Correia, C.S.C.; Borges, V.F.; et al. Drought sensitivity of Amazonian carbon balance revealed by atmospheric measurements. Nature 2014, 506, 76–80. [Google Scholar] [CrossRef] [PubMed]
  28. Doughty, C.; Metcalfe, D.B.; Girardin, C.A.J.; Amézquita, F.F.; Cabrera, D.G.; Huasco, W.H.; Silva-Espejo, J.E.; Araujo-Murakami, A.; da Costa, M.C.; Rocha, W.; et al. Drought impact on forest carbon dynamics and fluxes in Amazonia. Nature 2015, 519, 78–82. [Google Scholar] [CrossRef] [PubMed]
  29. Gushchina, D.; Zheleznova, I.; Osipov, A.; Olchev, A. Effect of various types of ENSO events on moisture conditions in the humid and sub-humid tropics. Atmosphere 2020, 11, 1354. [Google Scholar] [CrossRef]
  30. Lindroth, A.; Holst, J.; Linderson, M.-L.; Aurela, M.; Biermann, T.; Heliasz, M.; Chi, J.; Ibrom, A.; Kolari, P.; Klemedtsson, L.; et al. Effects of drought and meteorological forcing on carbon and water fluxes in Nordic forests during the dry summer of 2018. Philos. Trans. R. Soc. B Biol. Sci. 2020, 375, 20190516. [Google Scholar] [CrossRef]
  31. Gushchina, D.; Heimsch, F.; Osipov, A.; June, T.; Rauf, A.; Kreilein, H.; Panferov, O.; Olchev, A.; Knohl, A. Effects of the 2015–2016 El Niño event on energy and CO2 fluxes of a tropical rainforest in Central Sulawesi. Geogr. Environ. Sustain. 2019, 12, 183–196. [Google Scholar] [CrossRef]
  32. Zscheischler, J.; Reichstein, M.; Harmeling, S.; Rammig, A.; Tomelleri, E.; Mahecha, M.D. Extreme Events in Gross Primary Production: A Characterization across Continents. Biogeosciences 2014, 11, 2909–2924. [Google Scholar] [CrossRef]
  33. Beer, C.; Reichstein, M.; Tomelleri, E.; Ciais, P.; Jung, M.; Carvalhais, N.; Rödenbeck, C.; Arain, M.A.; Baldocchi, D.; Bonan, G.B.; et al. Terrestrial Gross Carbon Dioxide Uptake: Global Distribution and Covariation with Climate. Science 2010, 329, 834–838. [Google Scholar] [CrossRef]
  34. Mahecha, M.D.; Reichstein, M.; Carvalhais, N.; Lasslop, G.; Lange, H.; Seneviratne, S.I.; Vargas, R.; Ammann, C.; Arain, M.A.; Cescatti, A.; et al. Global Convergence in the Temperature Sensitivity of Respiration at Ecosystem Level. Science 2010, 329, 838–840. [Google Scholar] [CrossRef] [PubMed]
  35. Smith, M.D. An ecological perspective on extreme climatic events: A synthetic definition and framework to guide future research. J. Ecol. 2011, 99, 656–663. [Google Scholar] [CrossRef]
  36. Pennington, R.T.; Lehmann, C.E.R.; Rowland, L.M. Tropical savannas and dry forests. Curr. Biol. 2018, 28, R541–R545. [Google Scholar] [CrossRef] [PubMed]
  37. European Centre for Medium-Range Weather Forecasts. Available online: https://www.ecmwf.int/en/forecasts/datasets/reanalysis-datasets/era5 (accessed on 23 September 2022).
  38. Aubinet, M.; Vesala, T.; Papale, D. Eddy Covariance: A Practical Guide to Measurement and Data Analysis; Springer: Dordrecht, The Netherlands, 2012; p. 438. ISBN 9789400723504. [Google Scholar]
  39. Wutzler, T.; Lucas-Moffat, A.; Migliavacca, M.; Knauer, J.; Sickel, K.; Šigut, L.; Menzer, O.; Reichstein, M. Basic and extensible post-processing of eddy covariance flux data with REddyProc. Biogeosciences 2018, 15, 5015–5030. [Google Scholar] [CrossRef]
  40. Reichstein, M.; Falge, E.; Baldocchi, D.; Papale, D.; Aubinet, M.; Berbigier, P.; Bernhofer, C.; Buchmann, N.; Gilmanov, T.; Granier, A.; et al. On the separation of net ecosystem exchange into assimilation and ecosystem respiration: Review and improved algorithm. Glob. Chang. Biol. 2005, 11, 1424–1439. [Google Scholar] [CrossRef]
  41. Zheleznova, I.V.; Gushchina, D.Y. Variability of extreme air temperatures and precipitation in different natural zones in late XX and early XXI centuries according to ERA5 reanalysis data. Izv. Atmos. Ocean. Phys. 2023; in press. [Google Scholar]
  42. McCulley, R.L.; Boutton, T.W.; Archer, S.R. Soil Respiration in a Subtropical Savanna Parkland: Response to Water Additions. Soil Sci. Soc. Am. J. 2007, 7, 820–828. [Google Scholar] [CrossRef]
  43. Birch, H.F. Mineralisation of plant nitrogen following alternate wet and dry conditions. Plant Soil 1964, 20, 43–49. [Google Scholar] [CrossRef]
  44. Jarvis, P.; Rey, A.; Petsikos, C.; Wingate, L.; Rayment, M.; Pereira, J.; Banza, J.; David, J.; Miglietta, F.; Borghetti, M.; et al. Drying and Wetting of Mediterranean Soils Stimulates Decomposition and Carbon Dioxide Emission: The “Birch Effect”. Tree Physiol. 2007, 27, 929–940. [Google Scholar] [CrossRef]
  45. Roby, M.C.; Scott, R.L.; Biederman, J.A.; Smith, W.K.; Moore, D.J.P. Response of soil carbon dioxide efflux to temporal repackaging of rainfall into fewer, larger events in a semiarid grassland. Front. Environ. Sci. 2022, 10, 940943. [Google Scholar] [CrossRef]
  46. Devi Kanniah, K.; Beringer, J.; Hutley, L.B. The comparative role of key environmental factors in determining savanna productivity and carbon fluxes: A review, with special reference to northern Australia. Prog. Phys. Geogr. Earth Environ. 2010, 34, 459–490. [Google Scholar] [CrossRef]
  47. Hutley, L.B.; Beringer, J.; Fatichi, S.; Schymanski, S.J.; Northwood, M. Gross primary productivity and water use efficiency are increasing in a high rainfall tropical savanna. Glob. Chang. Biol. 2022, 28, 2360–2380. [Google Scholar] [CrossRef] [PubMed]
  48. Kutsch, W.L.; Hanan, N.; Scholes, B.; McHugh, I.; Kubheka, W.; Eckhardt, H.; Williams, C. Response of carbon fluxes to water relations in a savanna ecosystem in South Africa. Biogeosciences 2008, 5, 1797–1808. [Google Scholar] [CrossRef]
  49. Yu, J.-C.; Chiang, P.-N.; Lai, Y.-J.; Tsai, M.-J.; Wang, Y.-N. High Rainfall Inhibited Soil Respiration in an Asian Monsoon Forest in Taiwan. Forests 2021, 12, 239. [Google Scholar] [CrossRef]
  50. Stewart, I.T.; Maurer, E.P.; Stahl, K.; Joseph, K. Recent evidence for warmer and drier growing seasons in climate sensitive regions of Central America from multiple global datasets. Int. J. Climatol. 2022, 42, 1399–1417. [Google Scholar] [CrossRef]
  51. Ibrom, A.; Olchev, A.; June, T.; Ross, T.; Kreilein, H.; Falk, U.; Merklein, J.; Twele, A.; Rakkibu, G.; Grote, S.; et al. Effects of land-use change on matter and energy exchange between ecosystems in the rain forest margin and the atmosphere. In The Stability of Tropical Rainforest Margins-Linking Ecological, Economic and Social Constraints; Tscharntke, T., Leuschner, C., Zeller, M., Guhardja, E., Bidin, A., Eds.; Springer: Berlin, Germany, 2007; pp. 463–492. [Google Scholar] [CrossRef]
  52. Madani, N.; Kimball, J.S.; Parazoo, N.C.; Ballantyne, A.P.; Tagesson, T.; Jones, L.A.; Reichle, R.H.; Palmer, P.I.; Velicogna, I.; Bloom, A.A. Below-surface water mediates the response of African forests to reduced rainfall. Environ. Res. Lett. 2020, 15, 034063. [Google Scholar] [CrossRef]
  53. Li, L.; Fan, W.; Kang, X.; Wang, Y.; Cui, X.; Xu, C.; Griffin, K.L.; Hao, Y. Responses of Greenhouse Gas Fluxes to Climate Extremes in a Semiarid Grassland. Atmos. Environ. 2016, 142, 32–42. [Google Scholar] [CrossRef]
  54. Wu, J.; Wang, J.; Hui, W.; Zhao, F.; Wang, P.; Su, C.; Gong, W. Physiology of Plant Responses to Water Stress and Related Genes: A Review. Forests 2022, 13, 324. [Google Scholar] [CrossRef]
  55. Miller, S.D.; Goulden, M.L.; Hutyra, L.R.; Keller, M.; Saleska, S.R.; Wofsy, S.C.; Figueira, A.M.S.; da Rocha, H.R.; de Camargo, P.B. Reduced impact logging minimally alters tropical rainforest carbon and energy exchange. Proc. Natl. Acad. Sci. USA 2011, 108, 9431–9435. [Google Scholar] [CrossRef]
  56. Mills, M.B.; Malhi, Y.; Ewers, R.M.; Kho, L.K.; Teh, Y.A.; Both, S.; Burslem, D.F.R.; Majalap, N.; Nilus, R.; Huasco, W.H.; et al. Tropical forests post-logging are a persistent net carbon source to the atmosphere. Proc. Natl. Acad. Sci. USA 2023, 120, e2214462120. [Google Scholar] [CrossRef]
  57. Wild, B.; Teubner, I.; Moesinger, L.; Zotta, R.-M.; Forkel, M.; van der Schalie, R.; Sitch, S.; Dorigo, W. VODCA2GPP—A new, global, long-term (1988--2020) gross primary production dataset from microwave remote sensing. Earth Syst. Sci. Data 2022, 14, 1063–1085. [Google Scholar] [CrossRef]
  58. Yang, Z.; Luo, X.; Shi, Y.; Zhou, T.; Luo, K.; Lai, Y.; Yu, P.; Liu, L.; Olchev, A.; Bond-Lamberty, B.; et al. Controls and variability of soil respiration temperature sensitivity across China. Sci. Total Environ. 2023, 871, 161974. [Google Scholar] [CrossRef] [PubMed]
  59. Chen, X.; Eamus, D.; Hutley, L.B. Seasonal patterns of soil carbon dioxide efflux from a wet-dry tropical savanna of northern Australia. Aust. J. Bot. 2002, 50, 43–51. [Google Scholar] [CrossRef]
  60. Cernusak, L.A.; Hutley, L.B.; Beringer, J.; Holtum, J.A.M.; Turner, B.L. Photosynthetic physiology of eucalypts along a sub-continental rainfall gradient in northern Australia. Agric. For. Meteorol. 2011, 151, 1462–1470. [Google Scholar] [CrossRef]
  61. Martínez, B.; Sanchez-Ruiz, S.; Gilabert, M.A.; Moreno, A.; Campos-Taberner, M.; García-Haro, F.J.; Trigo, I.F.; Aurela, M.; Brümmer, C.; Carrara, A.; et al. Retrieval of daily gross primary production over Europe and Africa from an ensemble of SEVIRI/MSG products. Int. J. Appl. Earth Obs. Geoinf. 2018, 65, 124–136. [Google Scholar] [CrossRef]
  62. Hanke, H.; Borjeson, L.; Hylander, K.; Enfors-Kautsky, E. Drought Tolerant Species Dominate as Rainfall and Tree Cover Returns in the West African Sahel. Land Use Policy 2016, 59, 111–120. [Google Scholar] [CrossRef]
  63. Beringer, J.; Livesley, S.J.; Randle, J.; Hutley, L.B. Carbon dioxide fluxes dominate the greenhouse gas exchanges of a seasonal wetland in the wet–dry tropics of northern Australia. Agric. For. Meteorol. 2013, 182–183, 239–247. [Google Scholar] [CrossRef]
Figure 1. Location of the monitoring stations with the type of biome indicated by the color (see the map legend) and the available period of observations (indicated in the brackets).
Climate 11 00117 g001
Figure 2. The time series of daily net CO2 flux (NEE) anomaly and daily temperature anomalies (ac), daily precipitation amount (d,e) at flux monitoring station AU-Dry (Dry River) for the period January–July 2012. The days when the daily CO2 flux anomalies were greater (lower) than 1 STD of CO2 time series for this station are marked by red (blue) dots. The red (blue) shading is applied for the periods when the temperature exceeds the upper (lower) threshold: (a) 1 STD (−1 STD); (b) 90% (10%); (c) 95% (5%) PDF quantile. The red shaded column (blue triangle) is applied for the days when the precipitation daily amount exceeds the upper (lower) threshold: (d) 90% (10%); (e) 95% (5%) PDF quantile.
Climate 11 00117 g002
Figure 3. The percentage of the days when daily net CO2 flux (NEE) anomalies greater than 1 STD occurred simultaneously with extremely high (a), low (c) temperatures, and extremely high (b) and low (d) precipitation in savannas, grasslands, and permanent wetlands (see the text for the details).
Climate 11 00117 g003
Figure 4. The same as Figure 3 but for tropical evergreen, deciduous needle leaf, tropical rain, and dry or seasonal forests.
Climate 11 00117 g004
Figure 5. The percentage of the days when temperature anomalies (a,c) and daily precipitation rates (b,d), exceeding thresholds, occurred simultaneously with extremely positive (a,b) and negative (c,d) daily net CO2 flux (NEE) anomalies in savannas, grasslands, and permanent wetlands (see the text for the details).
Climate 11 00117 g005
Figure 6. The same as Figure 5 but for tropical evergreen, deciduous needle leaf, tropical rain, and dry or seasonal forests.
Climate 11 00117 g006
Figure 7. The percentage of the days with daily net CO2 flux (NEE) anomalies, exceeding STD, observed during the periods of extremely hot/wet (a), cold/wet (b), hot/dry (c), and cold/dry (d) conditions.
Climate 11 00117 g007
Table 1. Correlation coefficients between daily temperature anomalies, daily precipitation amounts above thresholds and daily net CO2 flux anomalies.
Types of Tropical EcosystemsStationsCorrelation Coefficients between Daily
Temperature, Precipitation, and CO2 Fluxes
T STDT Q90T Q95P Q90P Q95
SavannasAU-Ade−0.17−0.080.110.140.27
AU-Dry0.120.040.110.140.17
AU-RDF0.33−0.40−0.320.160.17
CG-Tch−0.070.020.050.140.20
SD-Dem−0.070.250.340.06−0.03
SN-Dhr−0.18−0.23−0.300.180.14
Evergreen broadleaf forestsBR-Sa1−0.140.040.040.160.23
AU-Rob0.340.390.010.710.81
GH-Ank−0.100.290.25−0.14−0.21
MY-PSO−0.30−0.11−0.140.330.37
GrasslandsAU-Stp0.04−0.040.06−0.09−0.11
Permanent wetlandsAU-Fog−0.13−0.41−0.320.090.11
PE-QFR−0.330.07−0.170.170.23
Deciduous needleleaf forestBR-CST−0.51−0.17−0.170.160.31
Tropical rain forestBNS0.12−0.050.070.07−0.03
Tropical season
deciduous forest
MKL−0.04−0.040.09−0.07−0.17
Zm-Mon−0.13−0.06−0.160.120.23
Statistically significant correlation coefficients (p < 0.05) are shown in bold.
Disclaimer/Publisher’s Note: The statements, opinions and data contained in all publications are solely those of the individual author(s) and contributor(s) and not of MDPI and/or the editor(s). MDPI and/or the editor(s) disclaim responsibility for any injury to people or property resulting from any ideas, methods, instructions or products referred to in the content.

