Article

Spatiotemporal Application of the Standardized Precipitation Index (SPI) in the Eastern Mediterranean

by
Demetrios E. Tsesmelis
1,*,
Ioanna Leveidioti
1,
Christos A. Karavitis
2,
Kleomenis Kalogeropoulos
3,
Constantina G. Vasilakou
2,
Andreas Tsatsaris
3 and
Efthimios Zervas
1
1
Laboratory of Technology and Policy of Energy and Environment, School of Applied Arts and Sustainable Design, Hellenic Open University, 26335 Patras, Greece
2
Department of Natural Resources Development and Agricultural Engineering, Agricultural University of Athens, 75 Iera Odos, 11855 Athens, Greece
3
Department of Surveying and Geoinformatics Engineering, University of West Attica, 28 Ag. Spiridonos, Egaleo, 12243 Athens, Greece
*
Author to whom correspondence should be addressed.
Climate 2023, 11(5), 95; https://doi.org/10.3390/cli11050095
Submission received: 11 March 2023 / Revised: 20 April 2023 / Accepted: 27 April 2023 / Published: 28 April 2023
(This article belongs to the Special Issue Flood and Drought Hazards under Extreme Climate)

Abstract

:
The ever-increasing need for water, the alteration in the climate, and its observed changes over recent years have triggered a lot of research studies associated with the phenomenon of drought. Within the wider geographical region of the Mediterranean, the relevant scientific subject seems to be of great interest, since it is undoubtedly related to a number of severe socio-economic consequences. This present effort focuses on the evolution of this particular phenomenon over time, within the borders of nine different countries in the Eastern Mediterranean (Athens, Greece—Europe; Constantinople, Turkey—Asia; Nicosia, Cyprus—Europe; Jerusalem, Israel—Asia; Amman, Jordan—Asia; Damascus, Syria—Asia; Beirut, Lebanon—Asia; Cairo, Egypt—Africa; and Tripoli Libya—Africa). By applying the Standard Precipitation Index (SPI), examining precipitation data at the month level (January 1901 to December 2020), and utilizing the Inverse Distance Weighted (IDW) method, the spatio–temporal variability of drought events in the Eastern Mediterranean area was studied. In Jerusalem, long-term droughts presented a higher than usual volume, in accordance with applying the 12- and 24-month SPI, starting from the mid-20th century. Similarly, the region of Damascus presented a similar pattern to those in Beirut, Amman, and Jerusalem. An upward trend in the frequency of extreme drought events was observed for the last thirty years. The same trend seems to be true in terms of the duration of dry periods. Drought events have also been observed in the central, southern, and eastern regions of Turkey. A downward trend was observed in Cairo based on a trend analysis of its monthly precipitation.

1. Introduction

High spatial and temporal variability are the main aspects of the observed precipitation trends in the Mediterranean region, but the simulation of meteorological data using climate models reveals decreasing trends for precipitation in the coming years [1,2]. The Mediterranean region, due to its specific morphological, climatic, and atmospheric conditions, is classified as a moderate- and high-emitting region, revealing a strong response to global climate variability [3,4,5]. Moreover, its periods of low rainfall coincide with periods of high temperatures and high water demand, which further complicates the situation [6,7,8,9,10,11,12,13]. Drought is an insidious natural hazard that takes place when the relevant precipitation rate is below the average value for a region for more than one period, resulting in insufficient water supplies for both human activities and environmental standards to be sufficiently covered [10,14,15,16,17,18]. Temperature, humidity, and wind speed can contribute to the severity and duration of a drought episode, particularly temperature, because of its increasing importance in a warming world [19,20]. Drought in itself is not a disaster. It is a natural hazard that encompasses a range of meteorological, hydrological, and biophysical processes, which are natural phenomena with very serious socio-economic impacts. The local conditions, population, environment, and levels of resilience to an extended period of reduced rainfall determine when it becomes a disaster [10,21,22,23,24]. The observed increase in the global temperature accompanied by increased evaporation rates and decreasing average precipitation are the main factors triggering the occurrence of droughts [6,25,26,27,28,29,30]. The use of fossil fuels in production systems is one of the reasons for greenhouse gas emissions and climate variabilities, and it has been reported that extreme weather events negatively impact these production systems [31,32,33,34].
Several studies have been conducted in the Mediterranean and eastern Mediterranean region, in particular on the variability of precipitation and its relationship with large-scale atmospheric circulation [35]. The location of the Mediterranean Sea in the transition zone between subtropical and mid-latitude regions is the cause of its high climate variability on multiple time scales and the strong seasonal variability in its precipitation in many regions [36]. These factors make the Mediterranean region a “hot spot” of climate variabilities and it is classified as a moderate and high emission-responding region, giving a strong response to global changes [37,38]. This classification of the Mediterranean region is related to both its response to changes in various climate parameters and the vulnerability of the region to climate variabilities [10,39,40,41,42,43,44,45]. Over the last 40 years, the annual total rainfall in the Mediterranean region has decreased by, on average, between 5 and 50 mm [46]. In addition, the Mediterranean region is facing other problems, such as desertification and soil degradation to a large extent, and is likely to experience this to a greater extent in the future. Desertification is not only related to the climate but also to the decisions made about land use [47,48,49]. The number of complex warm events and the simultaneous occurrence of warm periods and extreme droughts, both in absolute values and in terms of their season of occurrence, has increased significantly in the Mediterranean region over the last 40 years. These events increase significantly in late spring, which has detrimental effects on ecosystems and agriculture [50].
Drought is a complex and multifaceted phenomenon that poses significant challenges for policymakers, water managers, and other stakeholders. Effective drought management requires a comprehensive understanding of the physical, social, economic, and environmental factors that contribute to drought, as well as the development of appropriate tools and strategies for monitoring and mitigating its impacts. Drought indices have emerged as a critical tool for this drought management, providing a standardized and quantitative means of assessing a drought’s severity and its potential impacts on various sectors. However, the selection and application of the appropriate drought indices require careful consideration of the specific characteristics and needs of the region or system being analyzed. Therefore, this study aims to analyze the SPI and its application in southeastern Mediterranean countries, with the goal of identifying drought events (frequency of intensity and severity) and the development of an effective drought tool that can be tailored to the specific needs of different regions and systems. In the current work, the inter-annual (1901–2020) evolution of drought is examined in nine countries bordering the southeastern Mediterranean Sea (Cyprus, Egypt, Greece, Jordan, Israel, Lebanon, Libya, Syria, and Turkey). Using the Standardized Precipitation Index (SPI) and the available monthly rainfall data of past years, the spatiotemporal variability of drought in the study area is investigated. A spatial analysis is deemed necessary for several reasons: the study area presents a variety of climatic types and morphological features, and drought is a phenomenon that occupies a large area.

2. Materials and Methods

Based on a literature study, analyses of drought assessment are using the SPI more frequently. In Europe, there is a plethora of works examining the 3-, 6-, and 12-month scales for drought patterns (seasonal and annual). The outputs of these works show contradictory results due to variations in the monthly scales. An SPI3 selection depicts eastern Europe and increasing tendencies over southern and eastern Europe, while central Europe and some parts of eastern Europe represent the transition zone. On the contrary, using monthly steps above 6 months depicts more drought events in central and northern Europe [26,51,52,53,54,55].
Using this drought index with 6- and 12-month scales may demonstrate irregular water resources and extremely low-level reservoir storage (hydrological droughts) [7,26,40,56,57]. For every climatic zone in Europe, SPI values of time scales of 6 months or above are more suitable for drought characterization than time scales of 3 months or below. Thus, the selection in the current work is 3-, 6-, 12-, and 24-time scales for the drought characterization and time series analyses.
This study examines two parameters: the first is the number of extreme drought events (an SPI value less than −2.0) and the second is the duration/length of these events with the maximum number of continuous months where the SPI value is less than −1.0. Based on the above, the drought characteristics are estimated for the southeastern Mediterranean countries from 1901 to 2020. The data were performed in Python language using the library standard_precip for the time steps of 3, 6, 9, 12, and 24 months. Drought maps for the drought lengths and the months of extreme droughts were generated using the Inverse Distance Weighted Interpolation Method (IDW) in ArcGIS Pro ver. 2.9 (ESRI, Redlands, CA, USA).

2.1. Study Area—Climatic Data

A case study was conducted in the eastern Mediterranean region, which includes countries such as Greece, Turkey, Cyprus, Israel, Jordan, Syria, Lebanon, Egypt, and Libya, to assess the analysis of drought events. The study focused on the impact of tempo–spatial drought event patterns on the region, which is known for its arid and semi-arid climate. Additionally, it examined the relationship between the precipitation patterns and drought events in the region. It found that changes in precipitation patterns, such as an increased intensity of rainfall events and longer dry periods, have contributed to the occurrence and severity of the drought events in the region. The selected study area provided valuable insights into the impact of drought events and precipitation patterns on the eastern Mediterranean region, and highlighted the urgent need for effective adaptation measures to mitigate the impacts of these drought events on vulnerable communities in the region.
The Climate Research Unit (CRU) gridded time series is a widely used dataset that provides long-term records of temperature and precipitation for different regions around the world. This dataset is based on observations from weather stations and other sources and has been developed and maintained by the CRU at the University of East Anglia in the United Kingdom. The CRU gridded time series is a high-resolution dataset that provides spatially explicit information on temperature and precipitation for each grid cell. The grid cells are typically around 0.5 degrees in latitude and longitude and cover the entire globe. The dataset is updated regularly and includes data from the early 20th century up to the present day. The data in the CRU gridded time series are interpolated from weather station observations, and the interpolation method takes into account factors such as altitude, latitude, and proximity to large bodies of water, which can influence the temperature and precipitation patterns. The dataset is widely used for climate research, including studies on climate change and its impacts, as well as for monitoring and assessing climate variability and extreme events. A set of meteorological data, specifically monthly precipitation data, was used from version 4.05 of the CRU TS (Climate Research Unit gridded Time Series) for the period of January 1901–December 2020 from nine countries of the eastern Mediterranean (Greece, Turkey, Cyprus, Israel, Jordan, Syria, Lebanon, Egypt, Libya, and Syria). The data were obtained from 1637 points. The Climate Research Unit provides monthly climate data on a high-resolution 0.5° × 0.5° grid spanning all the land areas of the world except Antarctica (0.50-degree of spatial resolution). The time series data sets are available on the CRU website [58]. Figure 1 portrays the mean annual precipitation from 1901 to 2020 in the study area.

2.2. Precipitation Statistical Analysis

A time series trend analysis is a statistical method used to identify the patterns and trends in data over time. This approach is commonly applied in various scientific fields, including economics, climatology, and ecology, to investigate the long-term behavior of complex systems. Several statistical methods are used to analyze time series data, such as linear regression, moving averages, autoregressive integrated moving average (ARIMA), and time series decomposition [59]. These methods have been widely used in various studies to analyze time series data and identify significant trends and patterns. However, it is important to use appropriate statistical methods based on the nature of the data and the research in question. Additionally, the interpretation of the results should consider the limitations and uncertainties associated with the data, and a careful validation of the statistical models is necessary. Overall, a time series trend analysis is a powerful tool for understanding the behavior of complex systems over time. Precipitation is a key component of the hydrological cycle and its variability plays a crucial role in determining water availability, flood frequency, and ecosystem services. In recent years, there has been growing interest in analyzing the trends in precipitation time series to understand the impacts of climate change on regional hydrology. Various statistical methods have been developed to detect these trends in precipitation, including the Mann–Kendall test, the Sen’s slope estimator, and the Theil-Sen estimator. These methods have been widely used in many studies to analyze the precipitation trends across different regions, including both natural and human-induced factors. However, caution is necessary when interpreting these trends due to the complex nature of precipitation variability and the potential for bias in the data. Therefore, it is important to carefully evaluate the statistical methods used and consider the uncertainties associated with the data [60,61,62,63,64].

2.3. Standardized Precipitation Index (SPI)

The SPI is a widely used tool for assessing and monitoring drought conditions. It provides a standardized and quantitative measure of precipitation anomalies over a particular time scale and can be applied to various spatial and temporal resolutions. The SPI is particularly useful in regions where precipitation is the main source of water supply and it has been applied in various sectors, including agriculture, hydrology, and water resource management. The SPI is widely used as a drought index because it has several advantages over other drought indices. One of the main advantages of the SPI is that it can be calculated using only precipitation data, which are readily available in many regions. This makes the SPI a convenient and cost-effective tool for monitoring and assessing drought conditions, particularly in data-sparse regions where other meteorological data, such as temperature and evapotranspiration, may not be available. Moreover, the SPI has a standardized and flexible approach, allowing for it to be calculated at different time scales (e.g., monthly, seasonal, and annual), which enables it to capture different types of drought events, from short-term droughts to long-term droughts. This flexibility also allows for a comparison of drought severity and frequency across different regions and time periods. However, the statistical properties of the SPI make it particularly suitable for detecting and characterizing drought events. Specifically, the SPI is based on a probability distribution function of precipitation, which allows for the identification of drought events and their severity based on their deviations from the long-term average precipitation [7,28,40,65,66,67]. While other drought indices exist, such as the Palmer Drought Severity Index (PDSI), Factual Drought Index (FDI), and Reconnaissance Drought Index (RDI), these indices require additional meteorological data, such as temperature and evapotranspiration, which are not always available or reliable in some regions [25,28,68]. Therefore, the SPI is often preferred over these other indices for its simplicity, flexibility, and reliability in capturing drought events [7,40,56,65].
The SPI is a useful tool for monitoring dry and wet periods at multiple time scales, thus identifying the type of drought (meteorological and hydrological, etc.) and comparing the climatic conditions of regions with different hydrological regimes [69]. The use of the SPI as a drought-monitoring tool has been specifically proposed for areas with a distinct dry season. It is an index that has been extensively proposed and tested and it is a powerful and well-established tool for describing drought patterns and severity [40,41,65,70].
The SPI is based on a probabilistic approach to rainfall and finds an application in monitoring both dry and wet periods. A drought event occurs when the index takes consistently negative values, less than or equal to unity, and lasts until the index takes positive values. The duration of an episode is determined by the length of time between the beginning and the end of that period. The measurement of the size of a drought episode is obtained by summing up the values of the indicator for all the months of the drought. When the index takes values greater than 2.00, it is considered as an extremely wet period, while when it takes values less than −2.00, it is considered as an extreme drought. Values between 0.99 and −0.99 indicate approximately normal conditions, as shown in Table 1 [67].
The SPI is calculated by fitting a probability density function to the rainfall frequency distribution as a sum outside the time interval of interest. This process is performed separately for each month or time scale from the rainfall data time series and for each location in the interval. Each probability density function is then transformed within the standard normal distribution. According to Thom (1958), climatic precipitation data follow a gamma distribution which is one of the most frequently occurring distributions in the field of technical hydrology. It is a positive asymmetric distribution defined only for the positive values of the variable [71].
The γ-distribution (Formula (1)) is determined by its frequency, or else the probability density function is defined as follows:
t = ln 1 1 H x 2
g x = 1 β α Γ α x a 1 e x β
where
  • α > 0 is the form factor,
  • β > 0 is the scale factor, and
  • x > 0 is the amount of rainfall.
The gamma function Γ(α) is given by the relation (Formula (3)):
Γ α = 0 y α 1 e y d y
To fit the distribution to the data, α and β must be estimated. It was suggested by Edwards and Mckee (1997) that these parameters can be estimated using Thom’s (1958) maximum likelihood approach, as follows [71,72]:
α ^ = 1 4 A 1 + 1 + 4 A 3
β ^ = x ¯ α ^  
where, for a number of n observations:
A = ln x ¯ ln x n
The resulting parameters will then be used to find the cumulative probability of a rainfall event for a given month and time scale (one month, three, and six, etc.). For each point, the cumulative probability is calculated from the following relationship:
G x = 0 x g x d x = 1 β ^ α ^ Γ α ^ = 0 x x α ^ 1 e x β d x
Replacing t with x/β in the above relationship results in the form of the incomplete gamma function.
Because the gamma distribution for x = 0 is indeterminate and because a rainfall distribution can contain zeros, the cumulative probability is [51]:
H x = q + 1 q G x
where q is the zero probability of precipitation.
H(x) is then transformed into the standard normal random variable Z, with a mean of 0 and a variance of 1, which is the value of the SPI. Hughes and Saunders (2002), following Edwards and Mckee (1997), followed an approximate transformation as an alternative suggested by Ambramowitz and Stegum (1965) [51,72,73]:
Ζ = S P I = t c 0 + c 1 t + c 2 t 2 1 + d 1 t + d 2 t 2 + d 3 t 3
For 0 < H(x) < 0.5
Ζ = S P I = + t c 0 + c 1 t + c 2 t 2 1 + d 1 t + d 2 t 2 + d 3 t 3
For 0.5 < H(x) < 1
t = ln 1 H x 2
For 0 < H(x) < 0.5
t = ln 1 1 H x 2
For 0 < H(x) < 1
Additionally, C0 = 2.515517, C1 = 0.802853, C2 = 0.010308, d1 = 1.432788, d2 = 0.189269, and d3 = 0.001308.

2.4. Drought Maps

Drought maps are graphical representations of drought conditions and their severity across a geographic region. These maps typically use various colors or shading to indicate the level of drought intensity, ranging from normal conditions to severe drought. The drought maps were produced using the Inverse Distance Weighted Interpolation Method (IDW) to downscale the gridded data. Additionally, the maps captured the index results and provided a uniform distribution of the frequency and intensity of the drought events in the study area. The IDW method is classified as a local precision interpolation method and the measured values that are closer to the prediction location have a higher weight than those that are further away, i.e., the points that are closer to the prediction location have a higher weight and this decreases as a function of distance. This method is widely used because of its simplicity of application, the speed of its calculation, the ease of its programming, and its reasonable results for various types of data [74].
For the construction of the maps, the respective files were created with the requests of the ArcGIS Pro ver. 2.9 (ESRI, Redlands). After these files were completed, the map of the study area was edited so that it could be imported into the specific software and the boundaries where the IDW method would be applied were created. After all the above were compiled, the data entry started; the data of the indicators and the coordinates of the sampling points were entered first for each month and each indicator separately. Next, the parameters file and map of the study area were imported into GIS software, which generated maps for the following session using the IDW method to index the mapping.

3. Results and Discussion

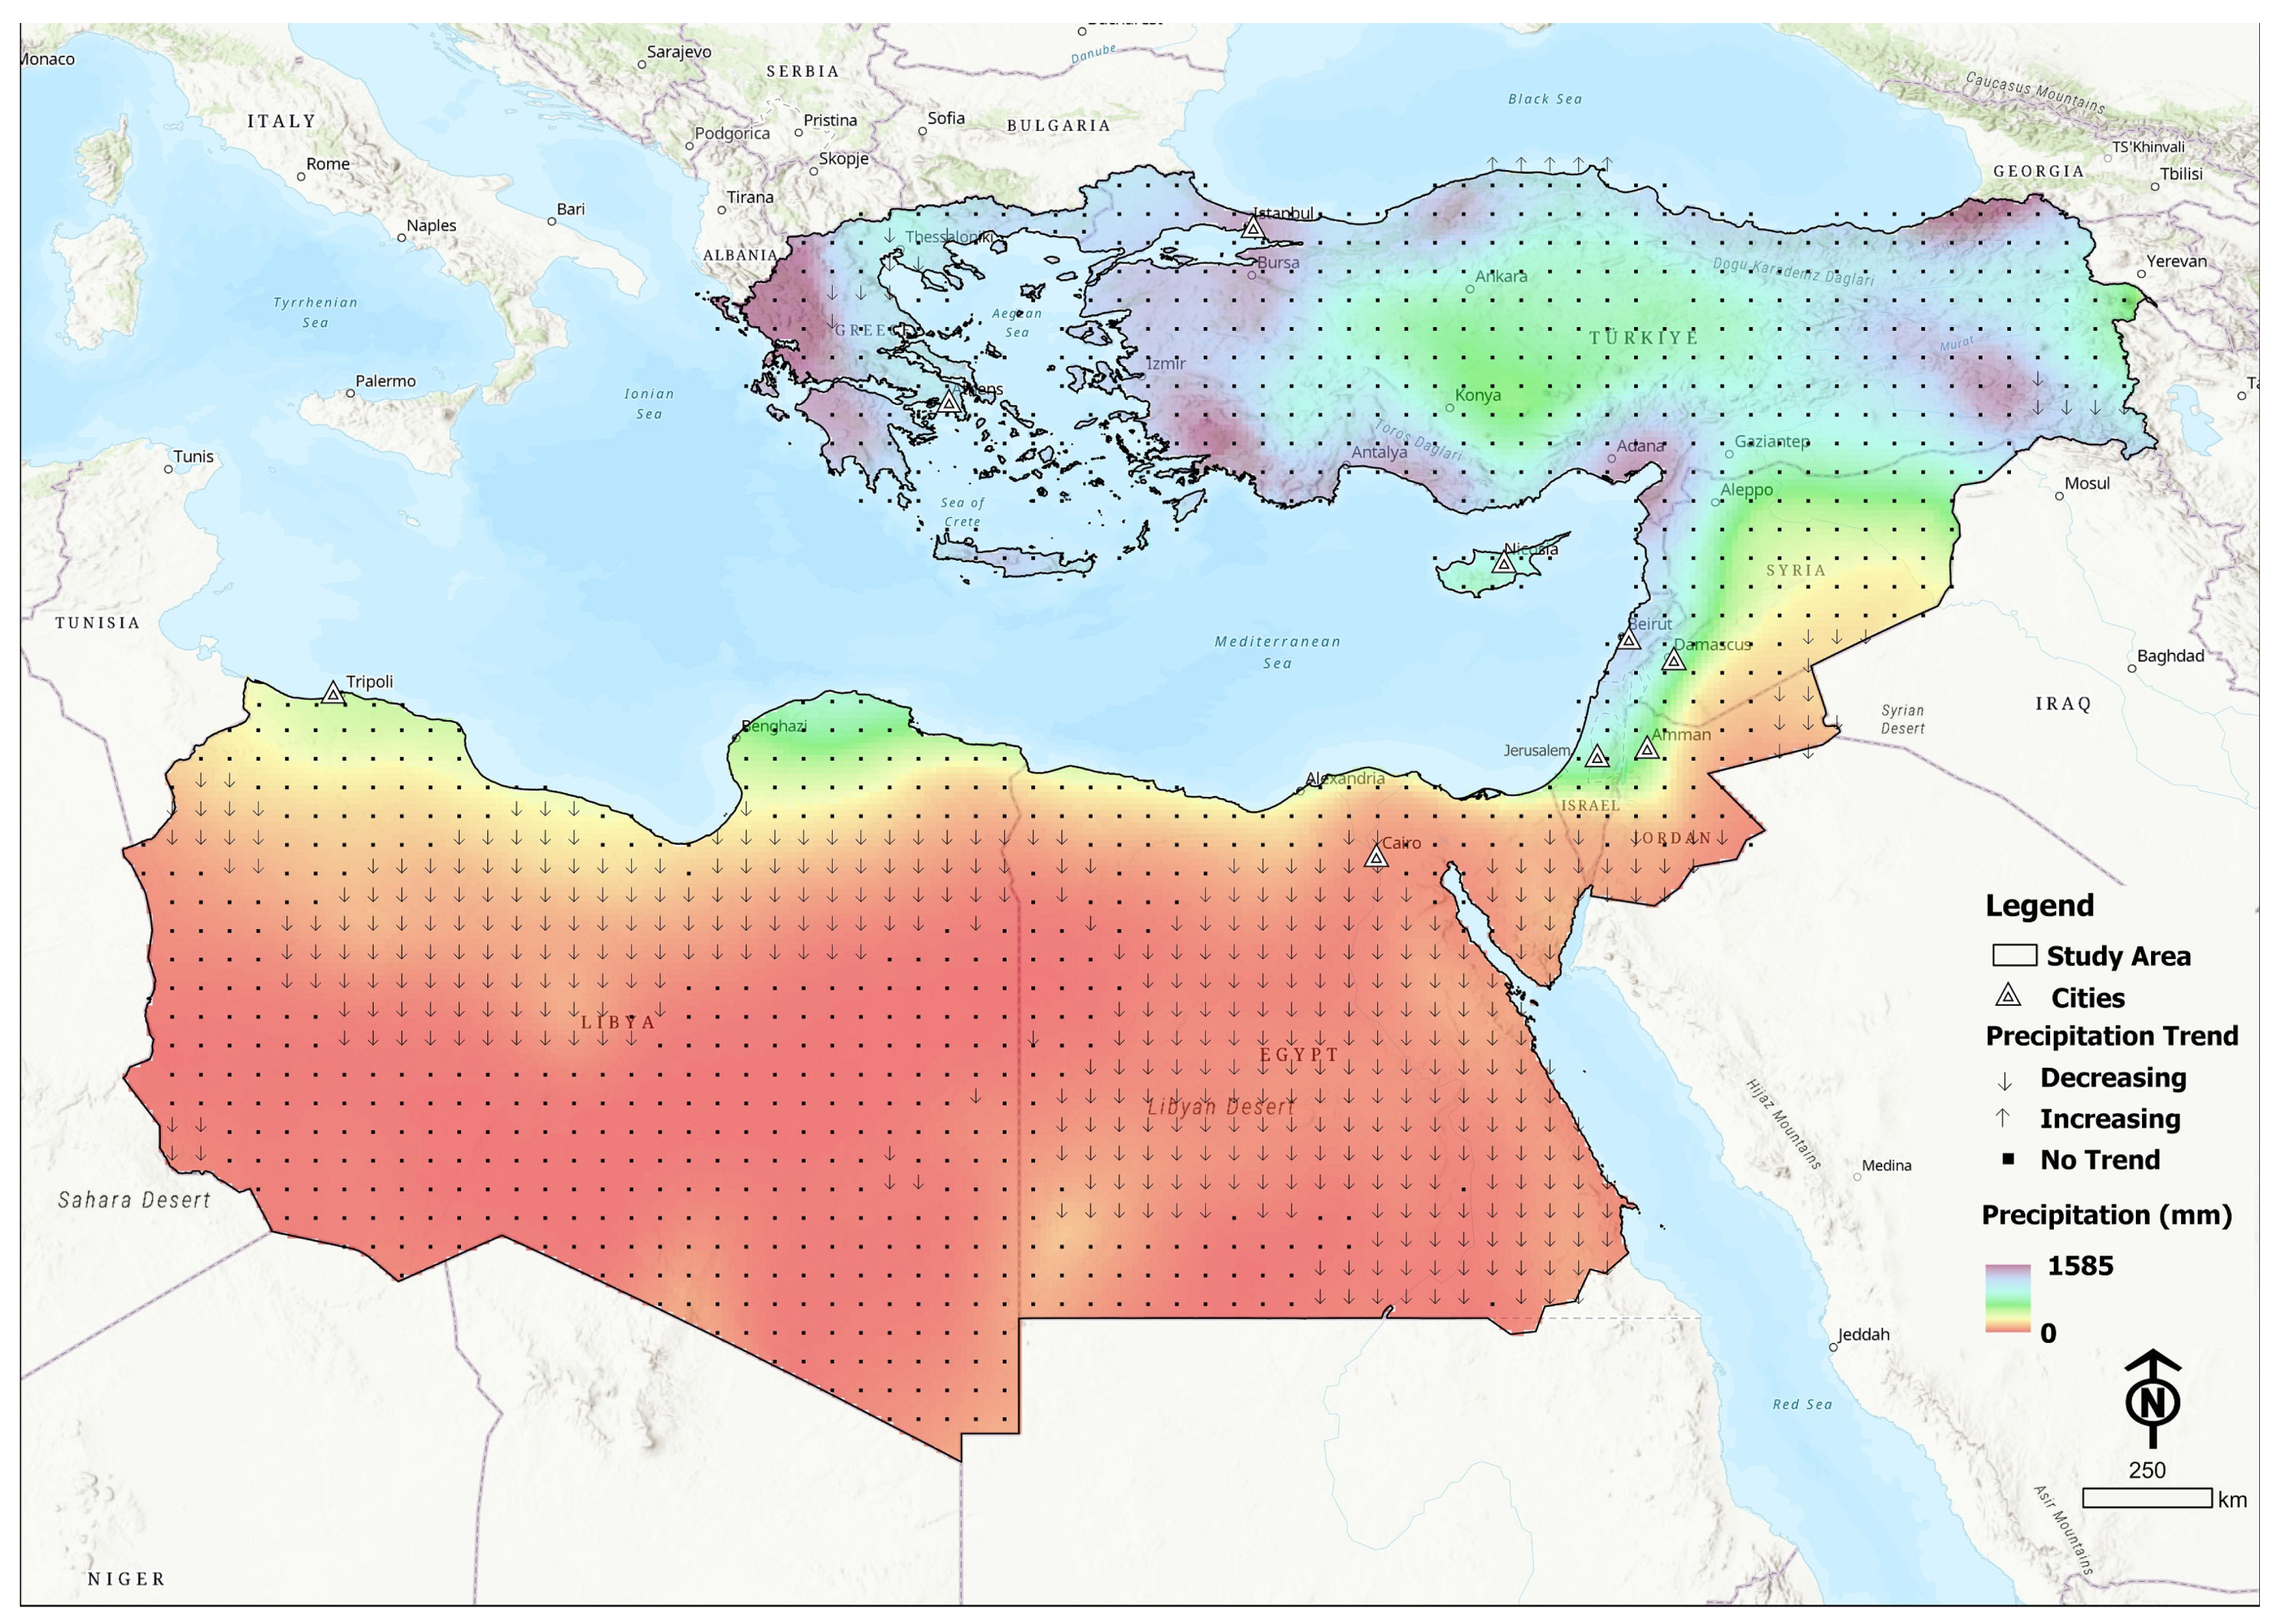
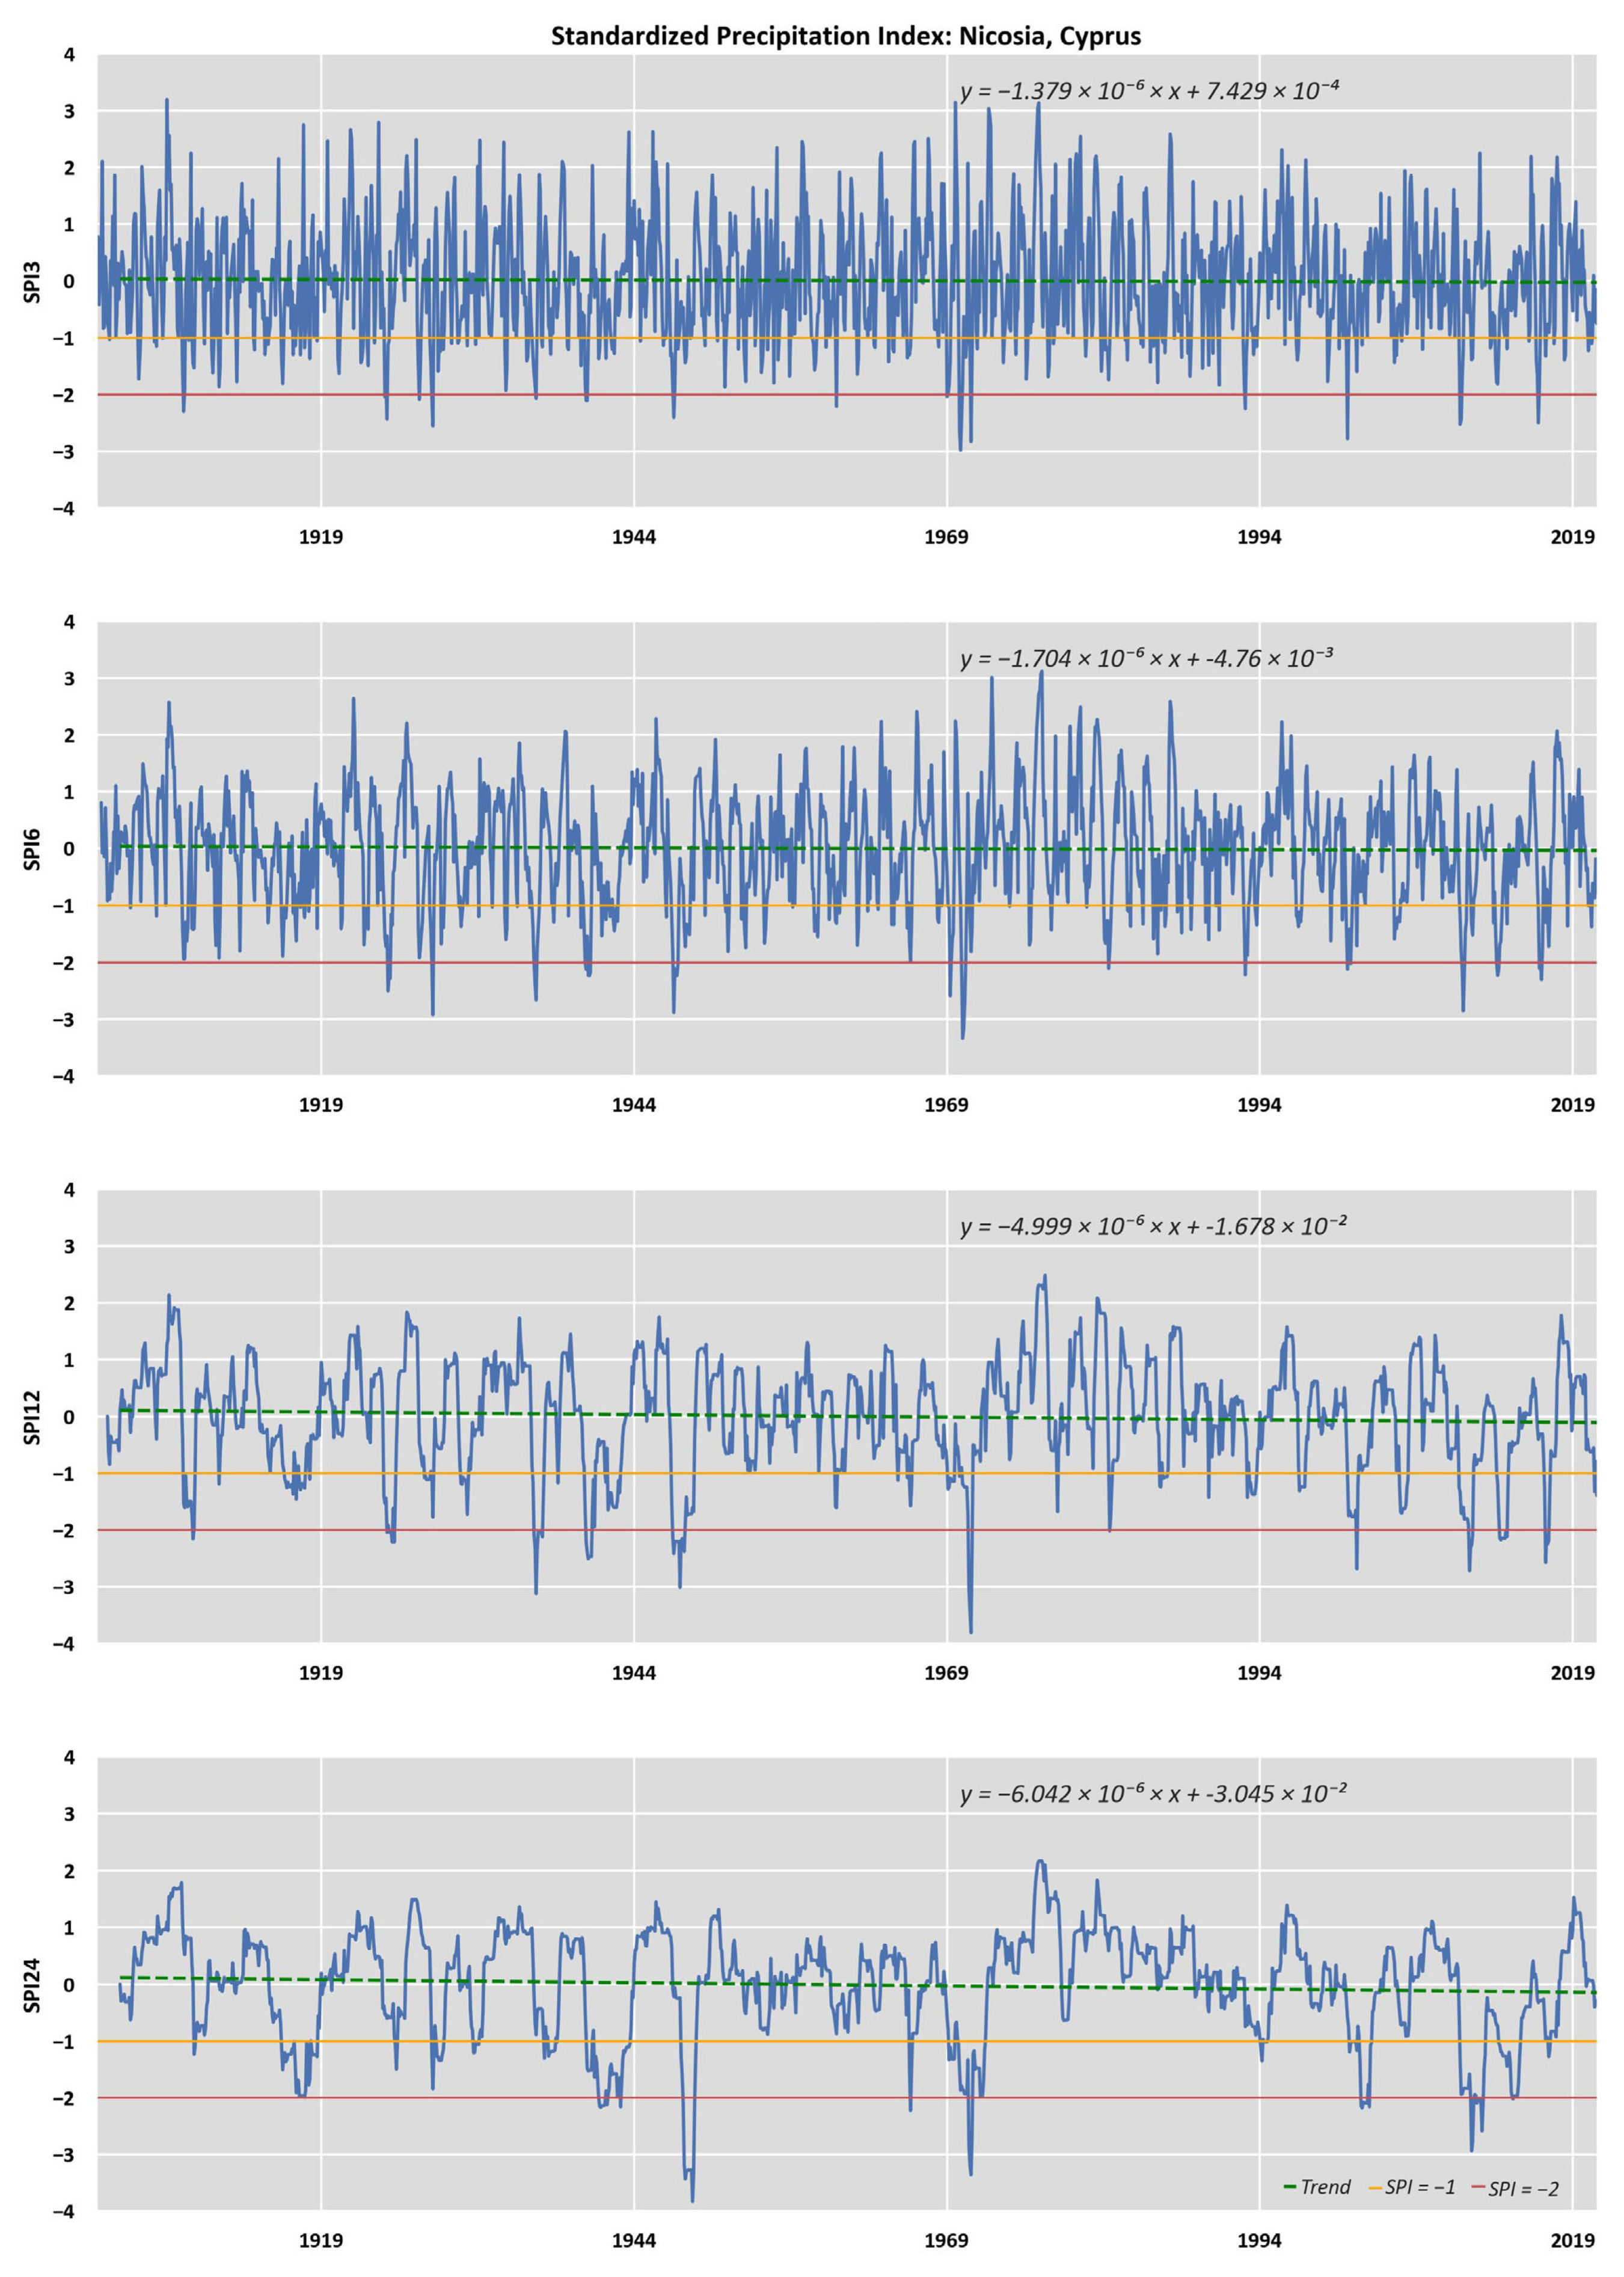
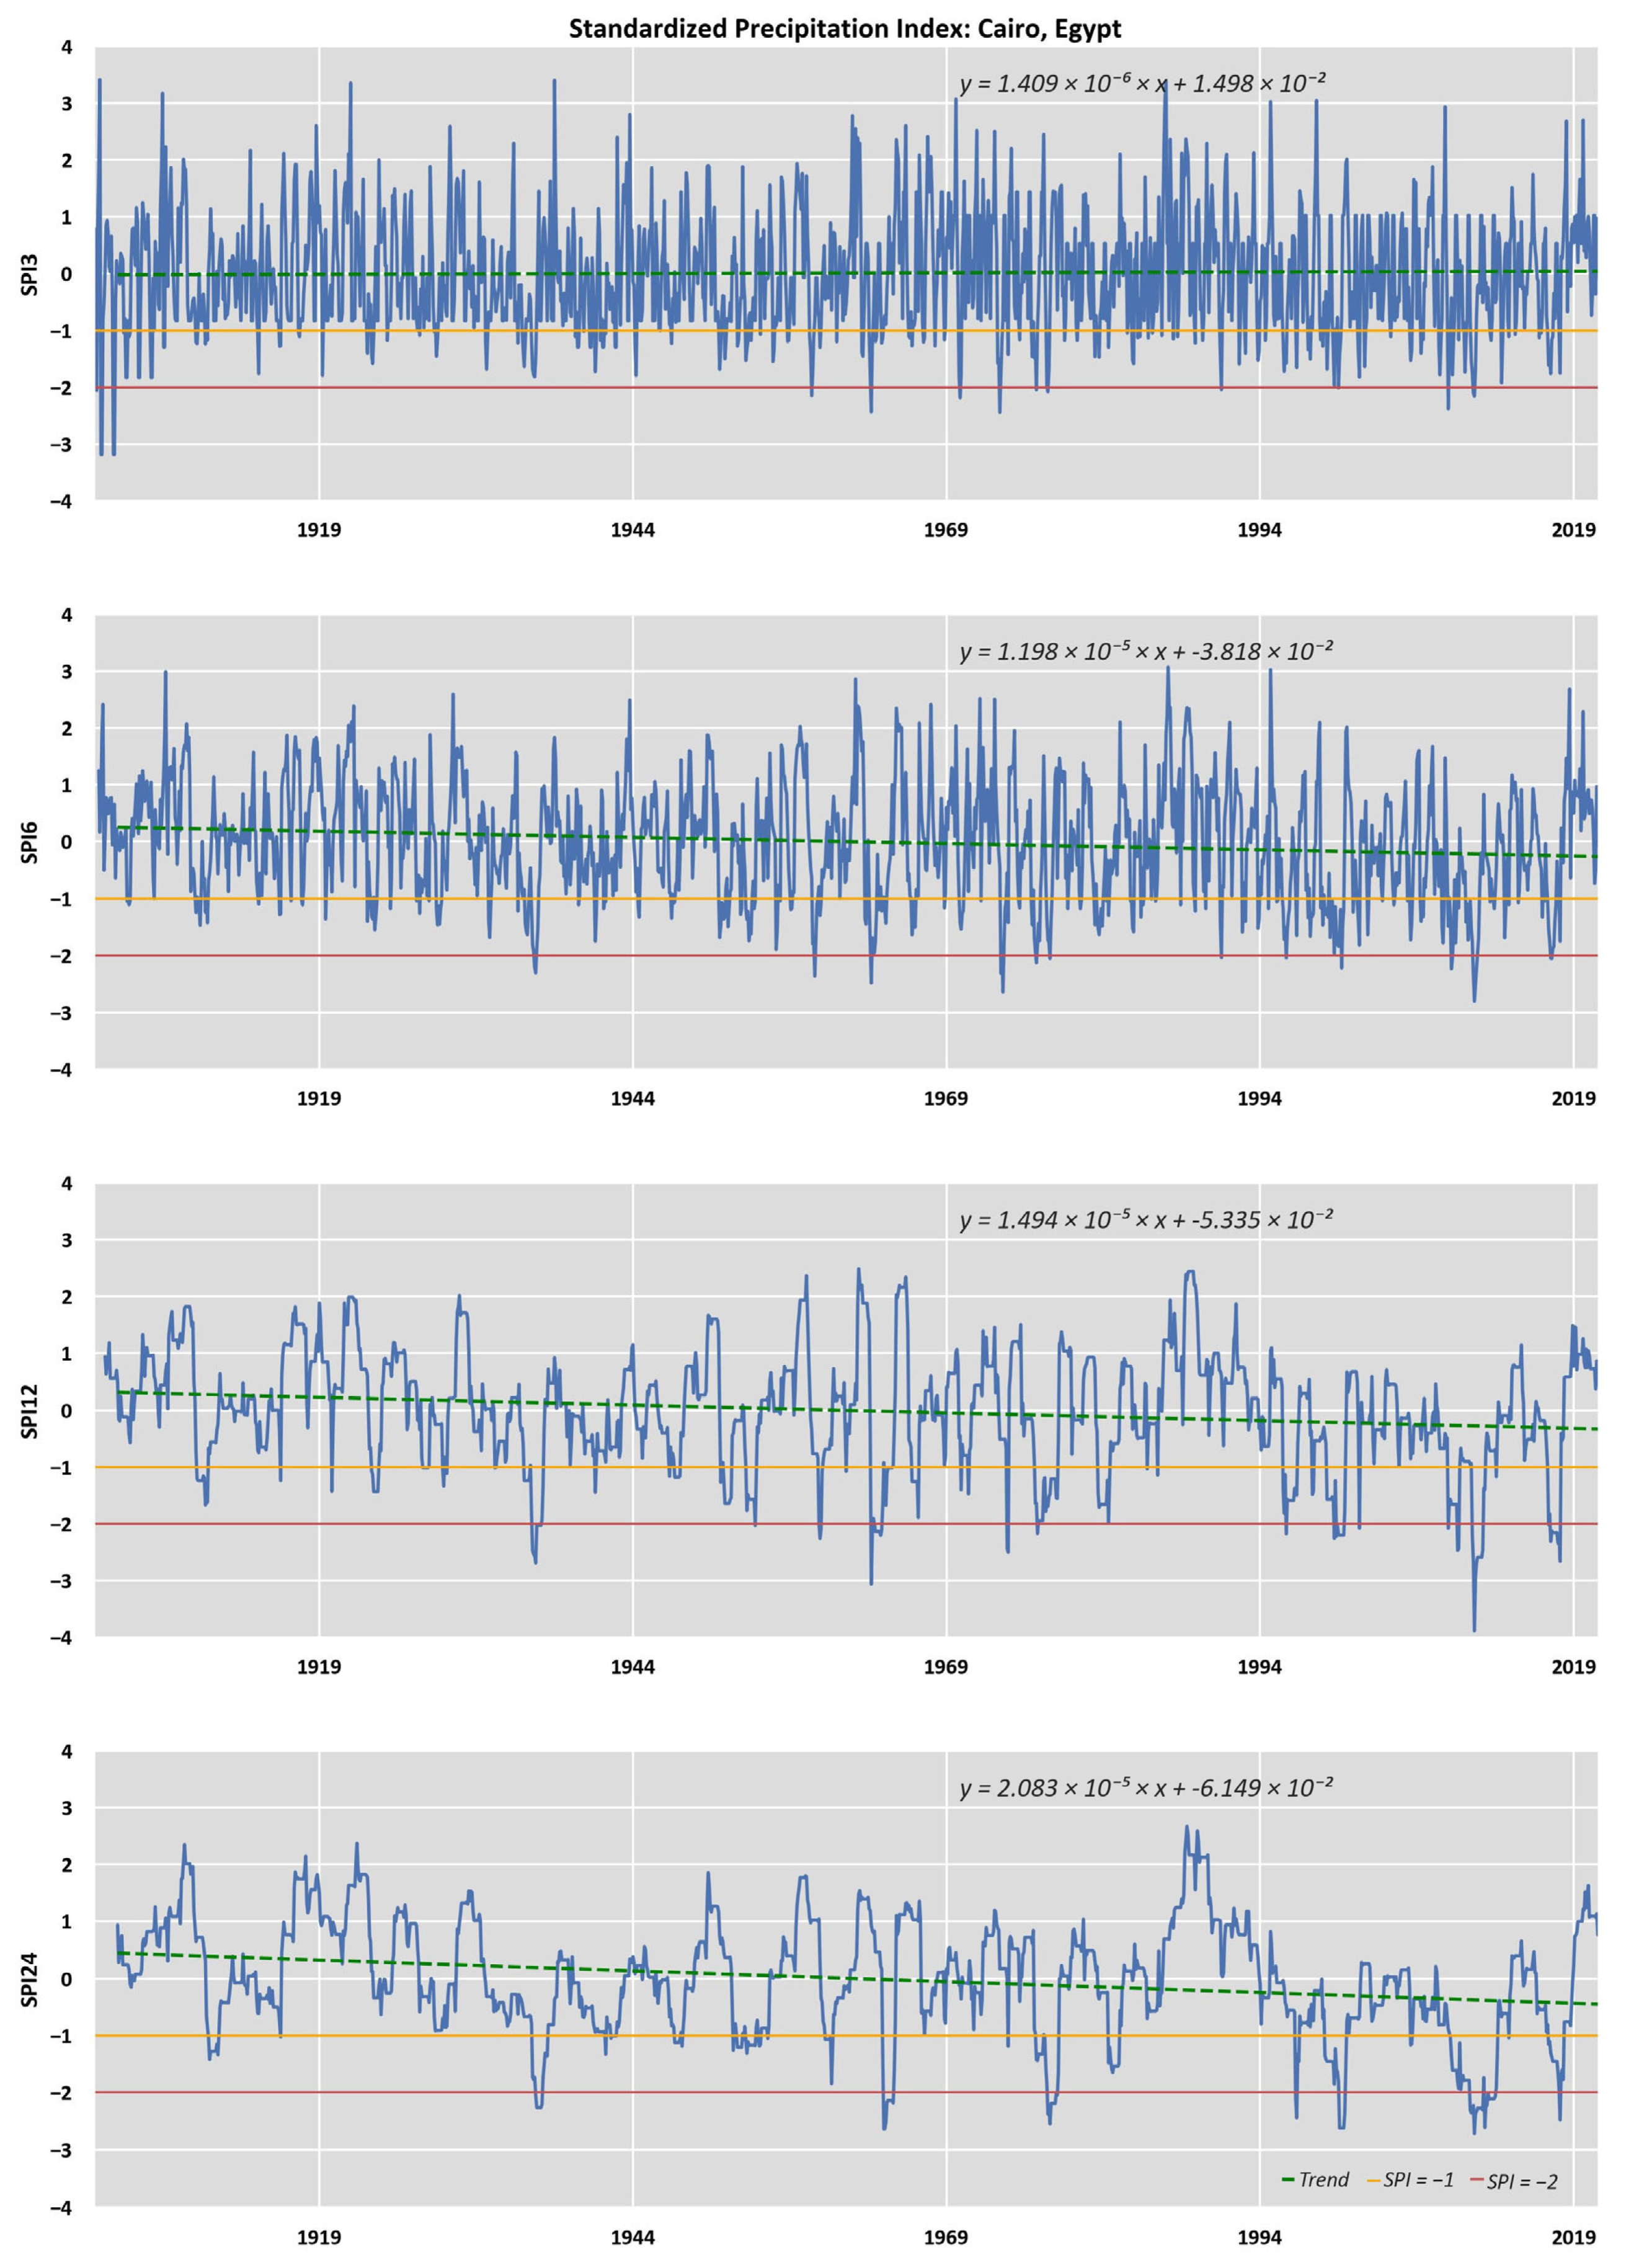
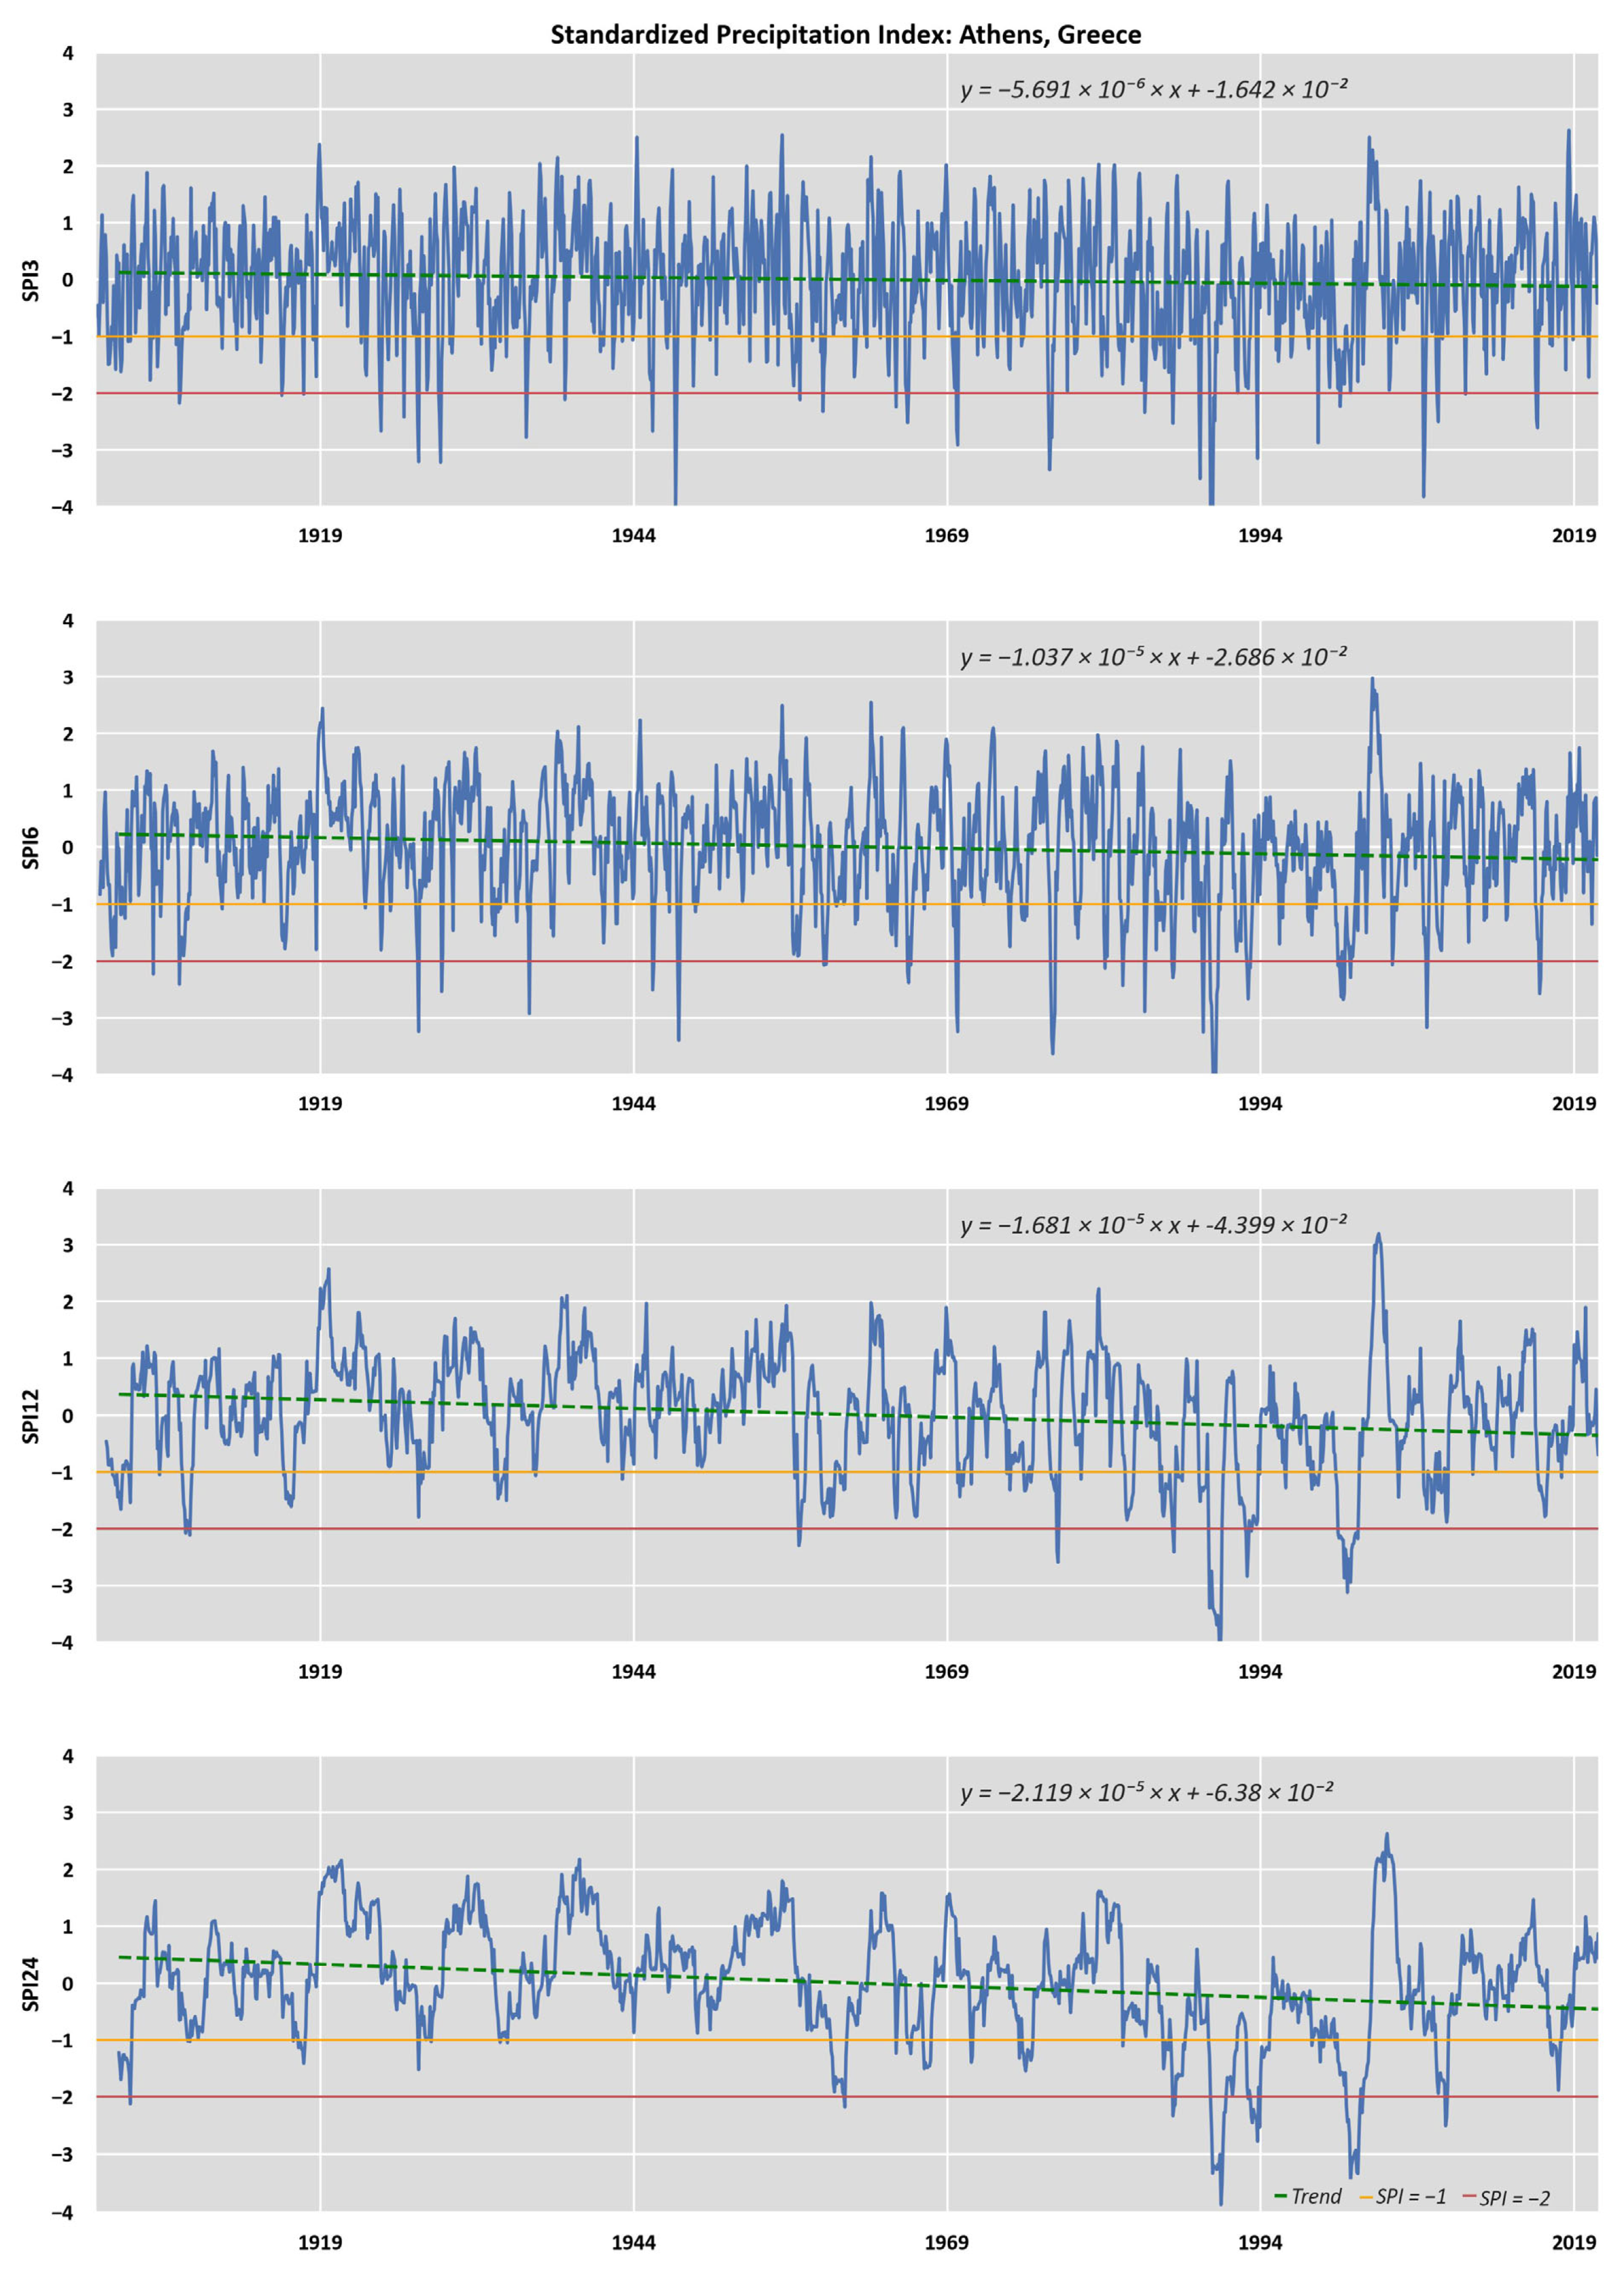
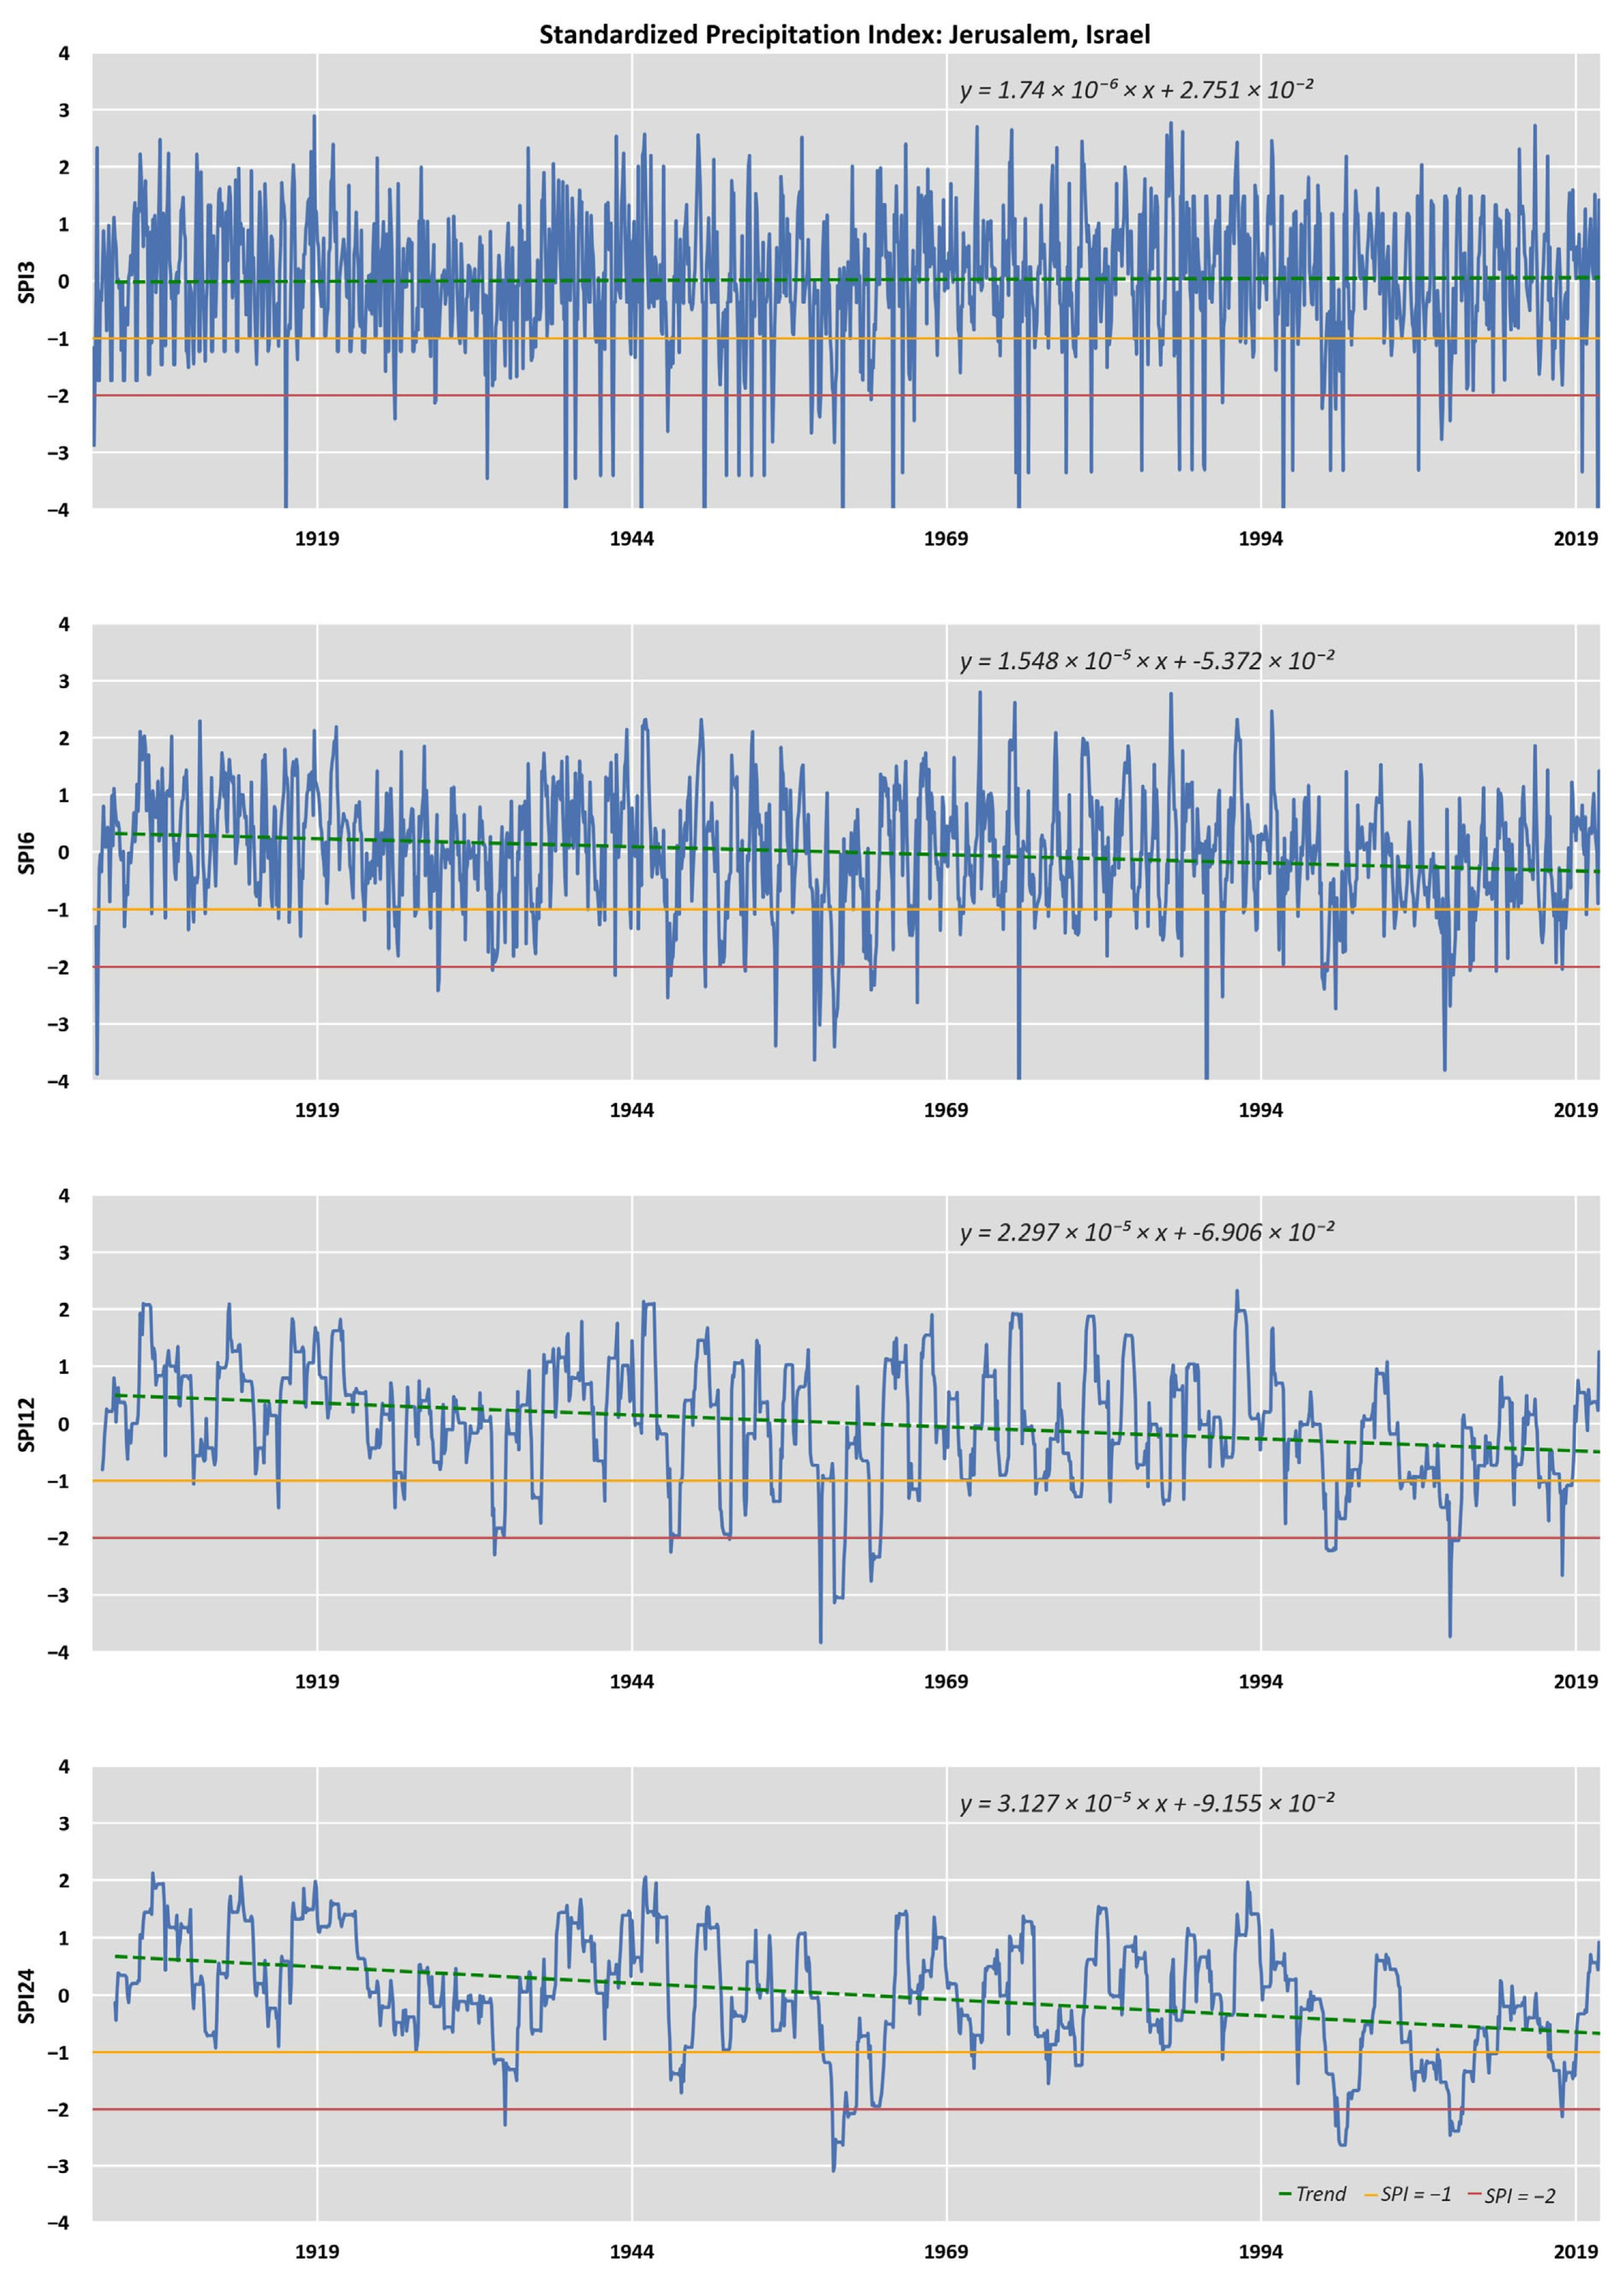
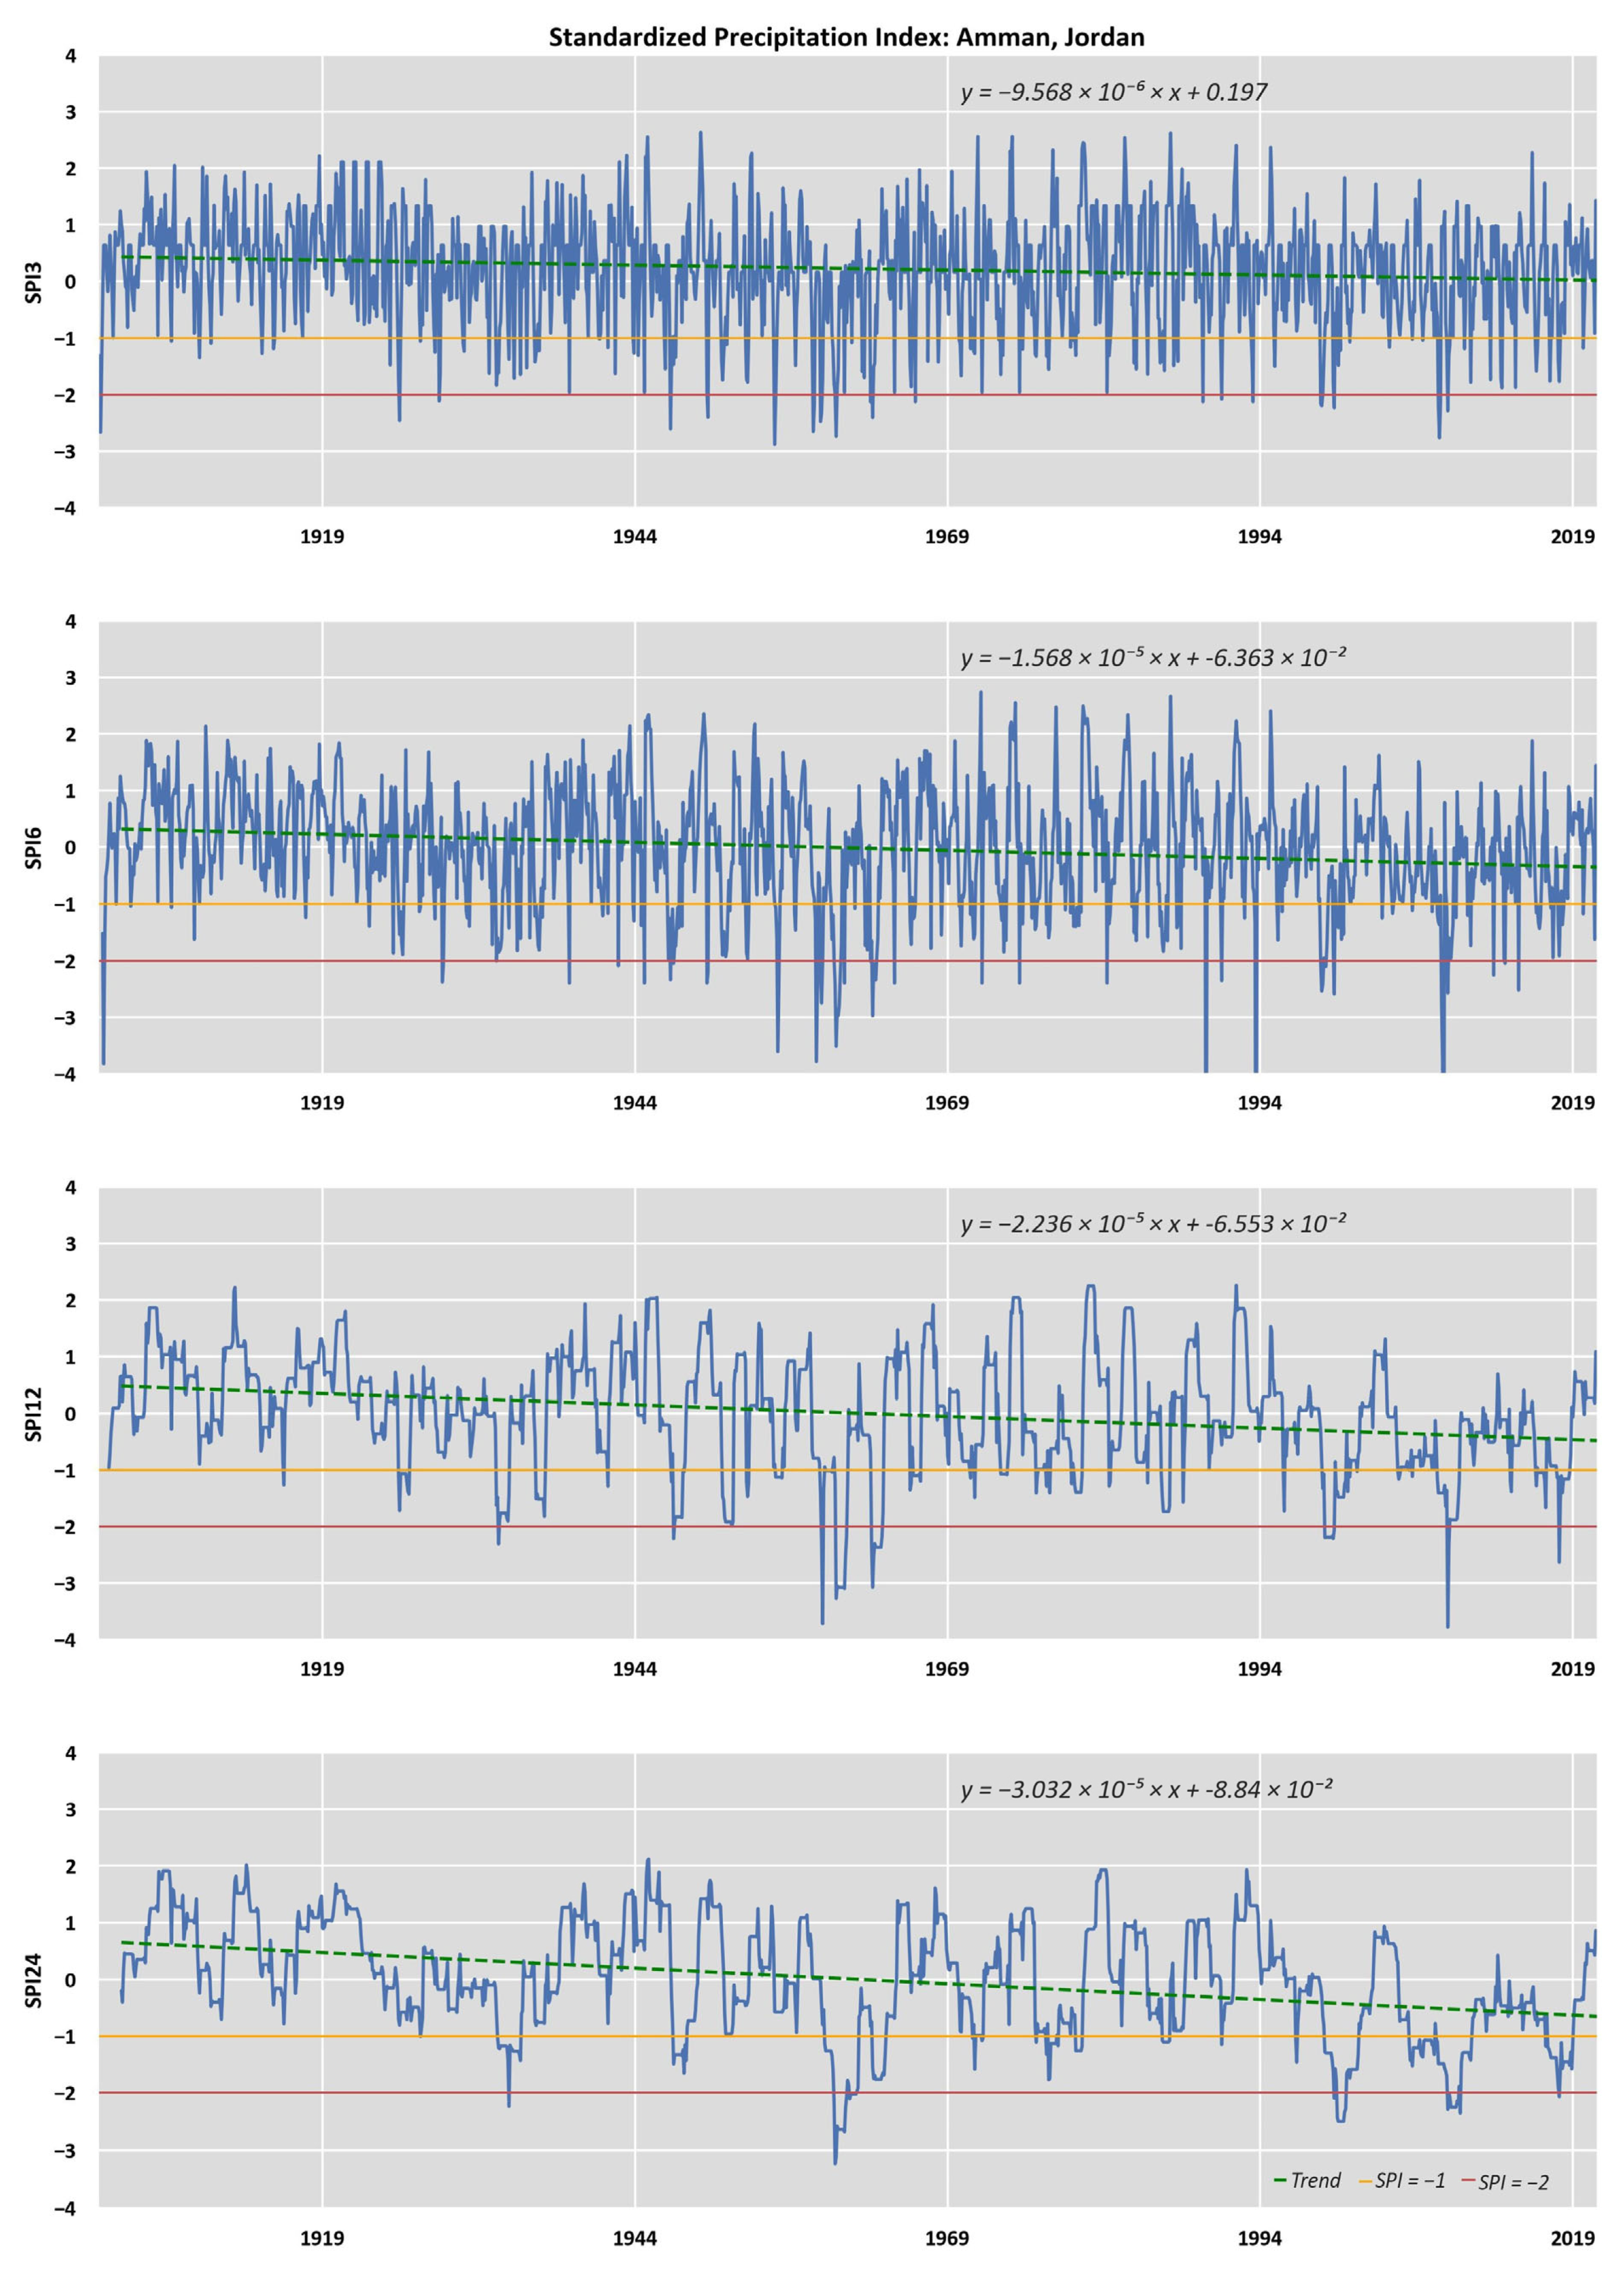
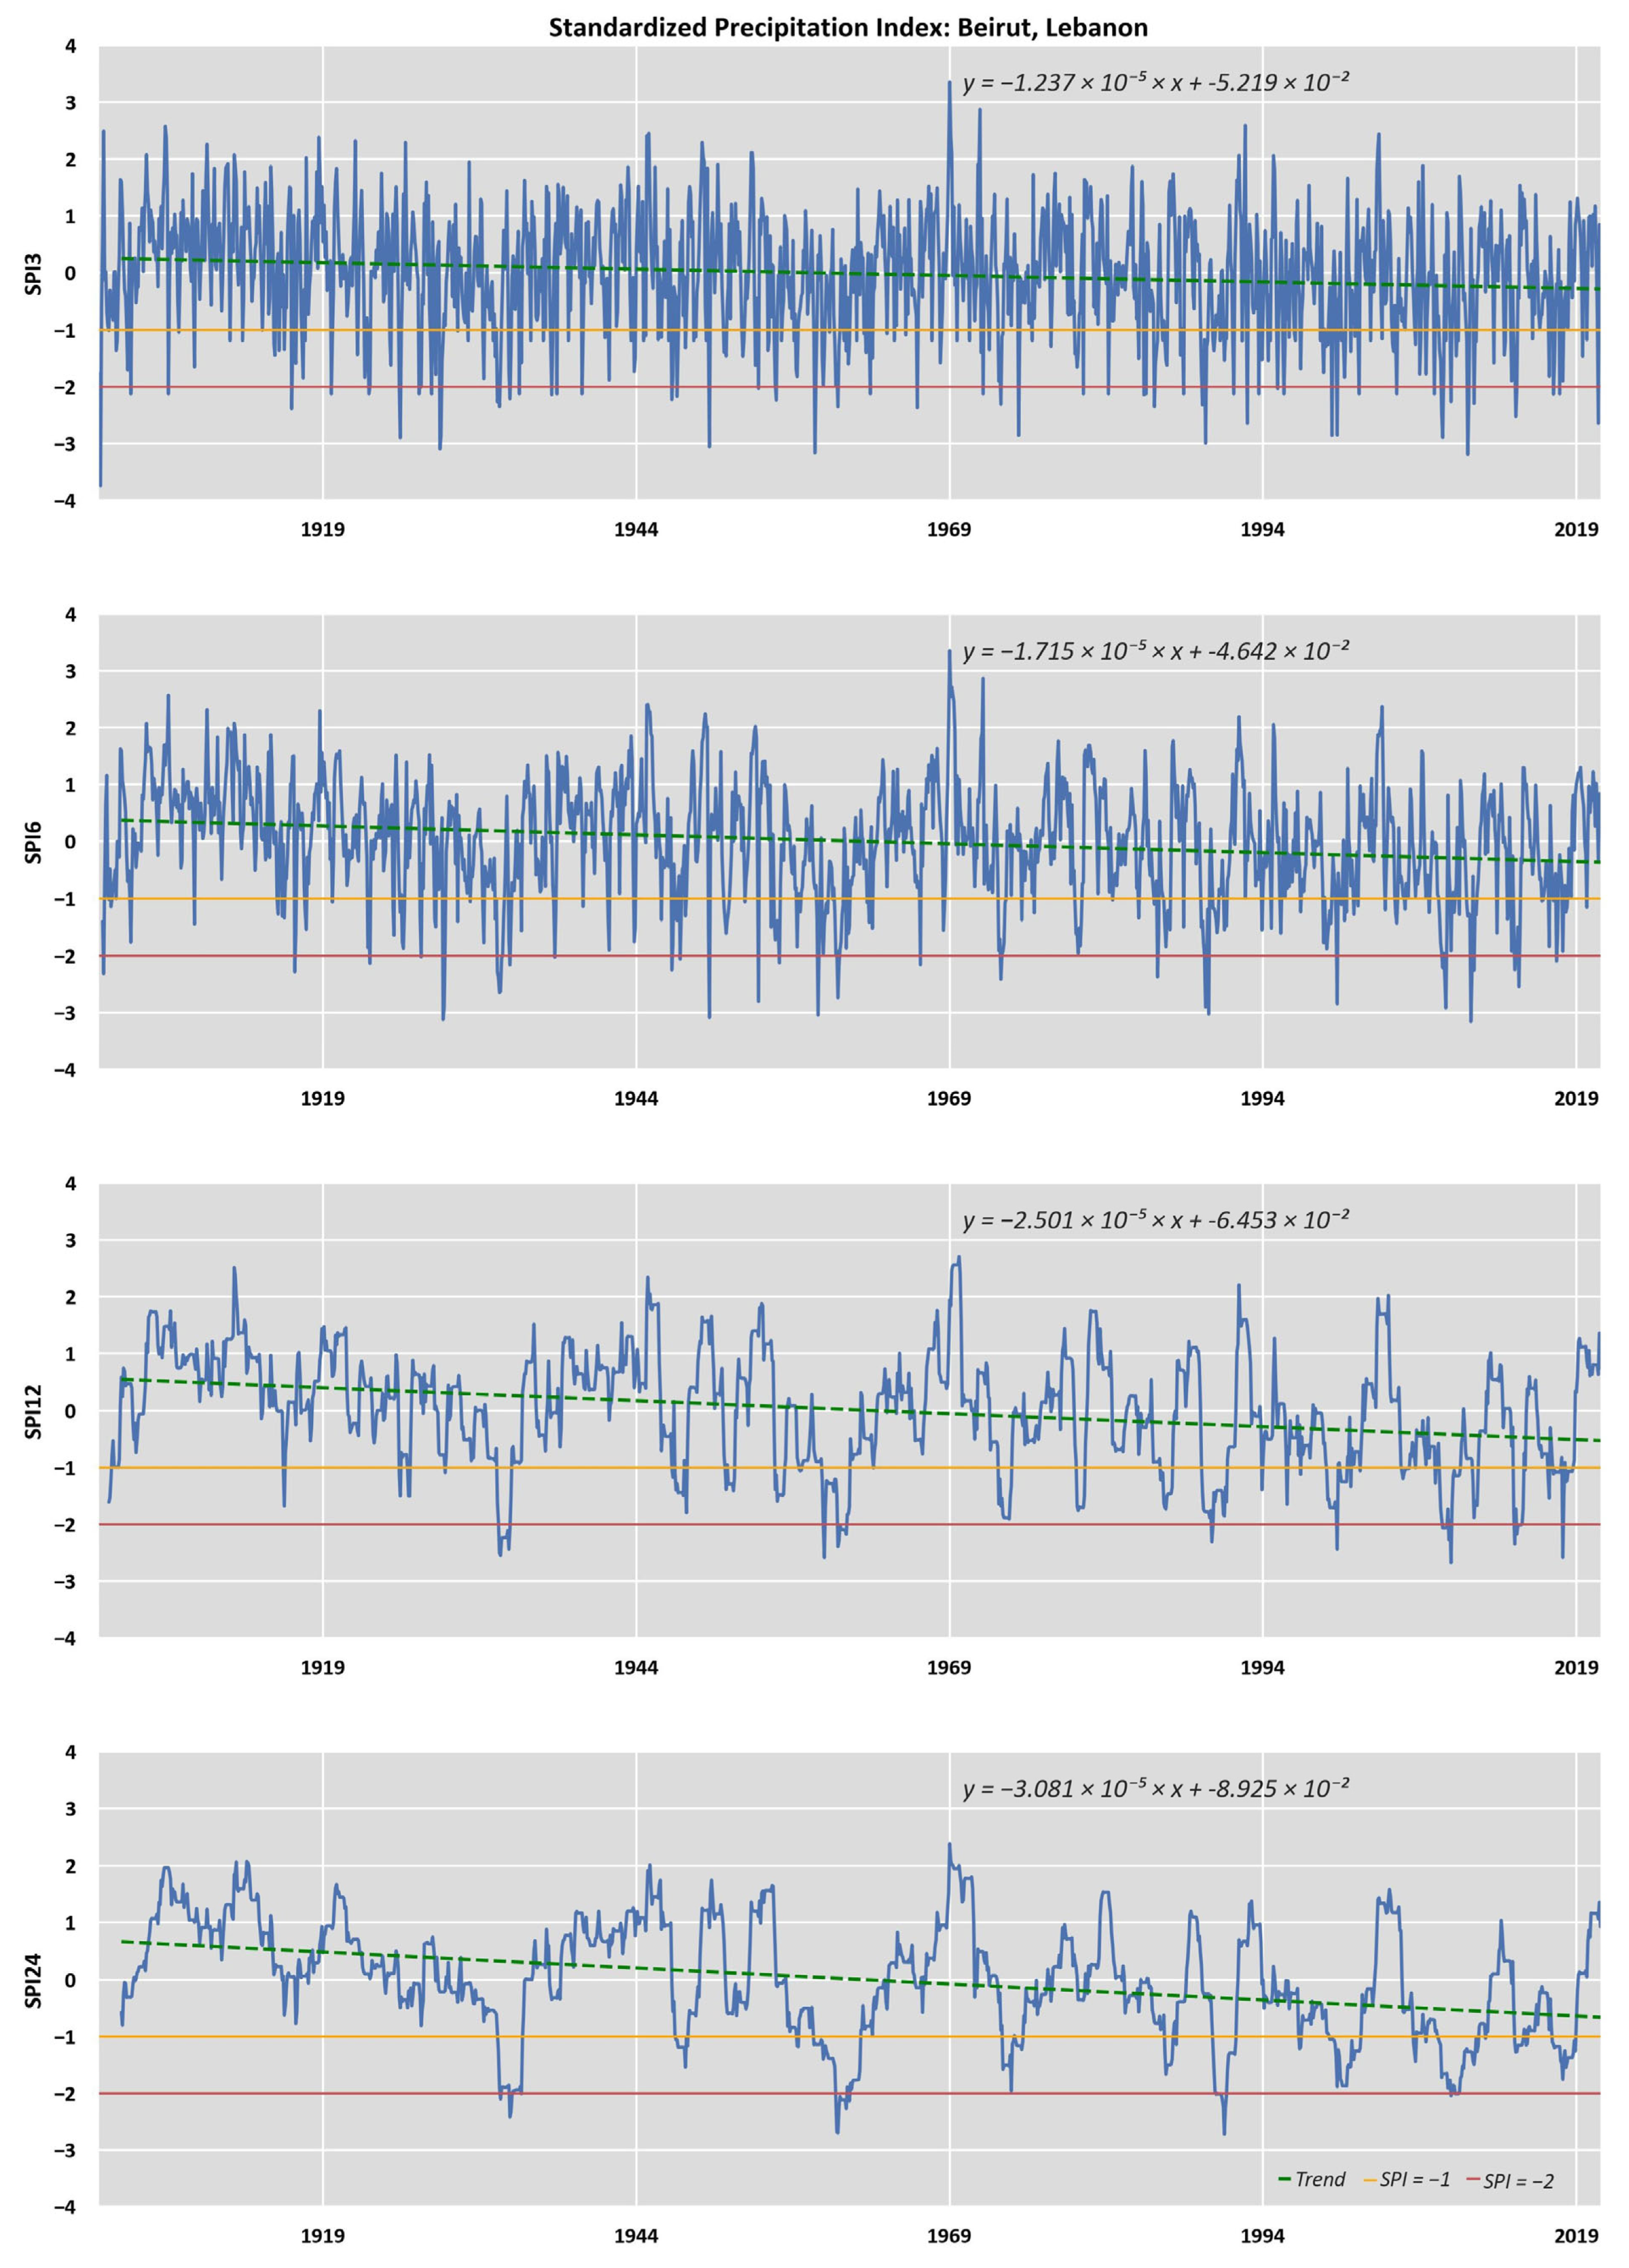
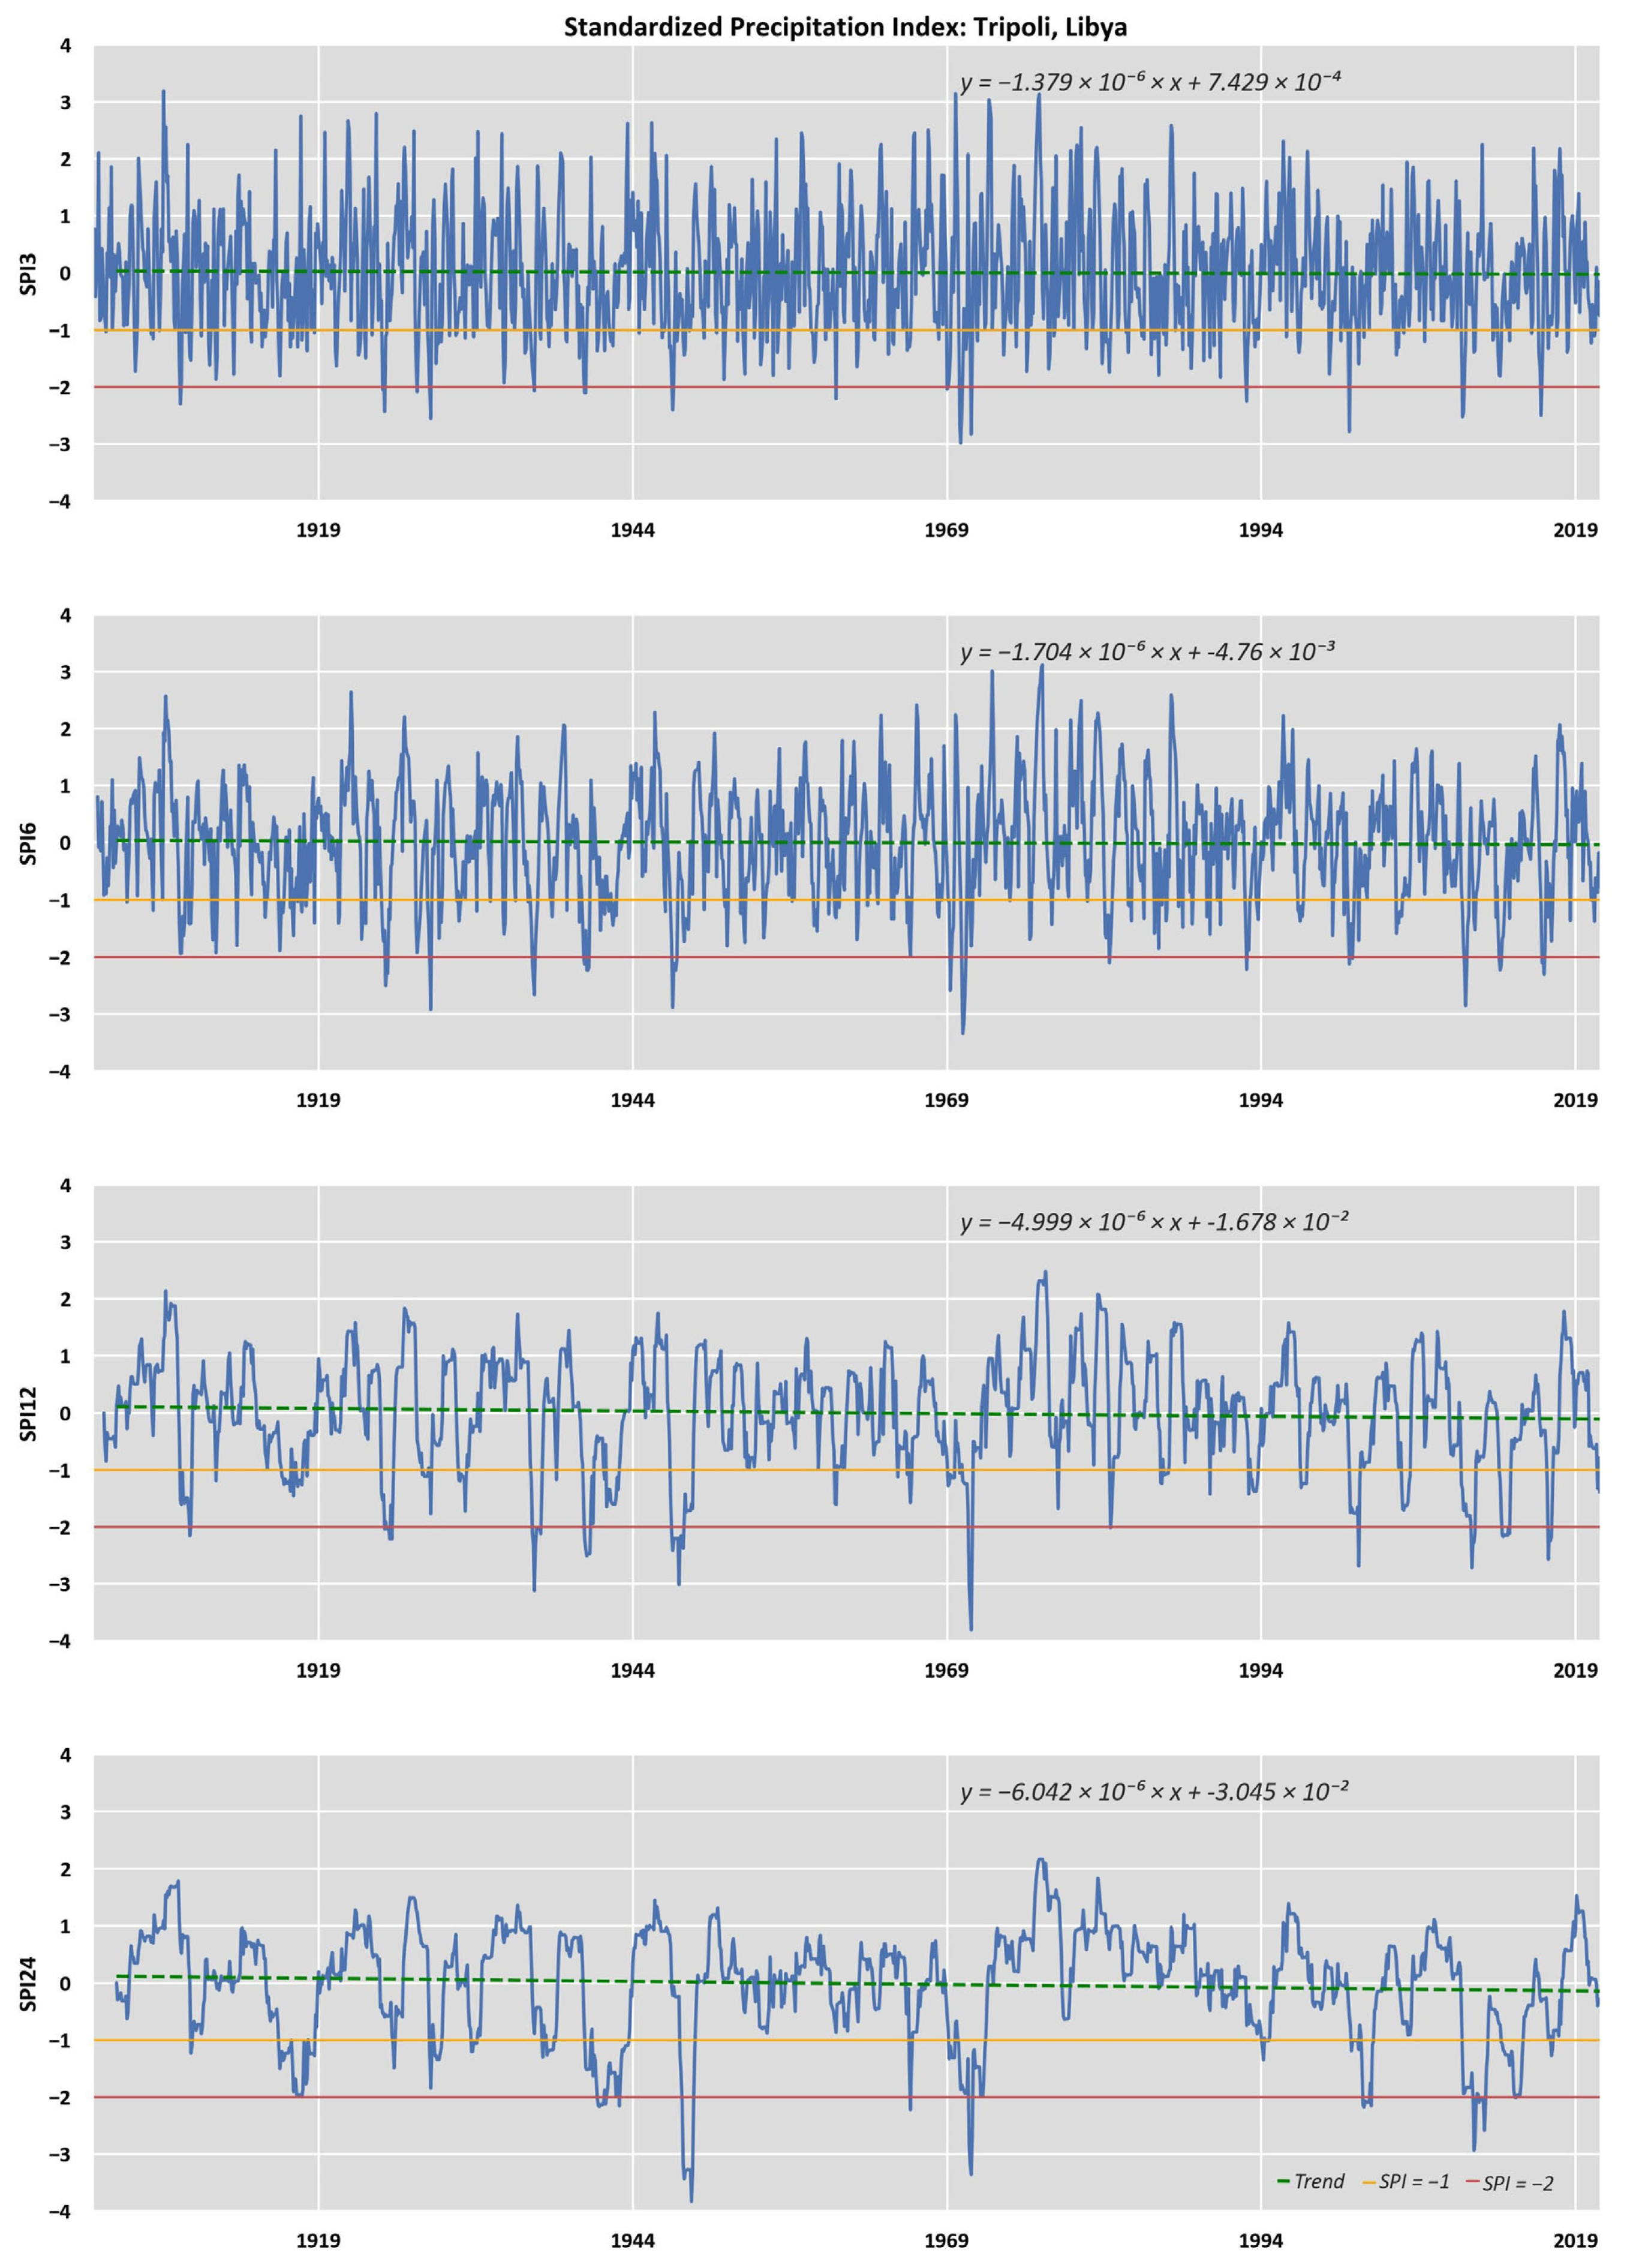
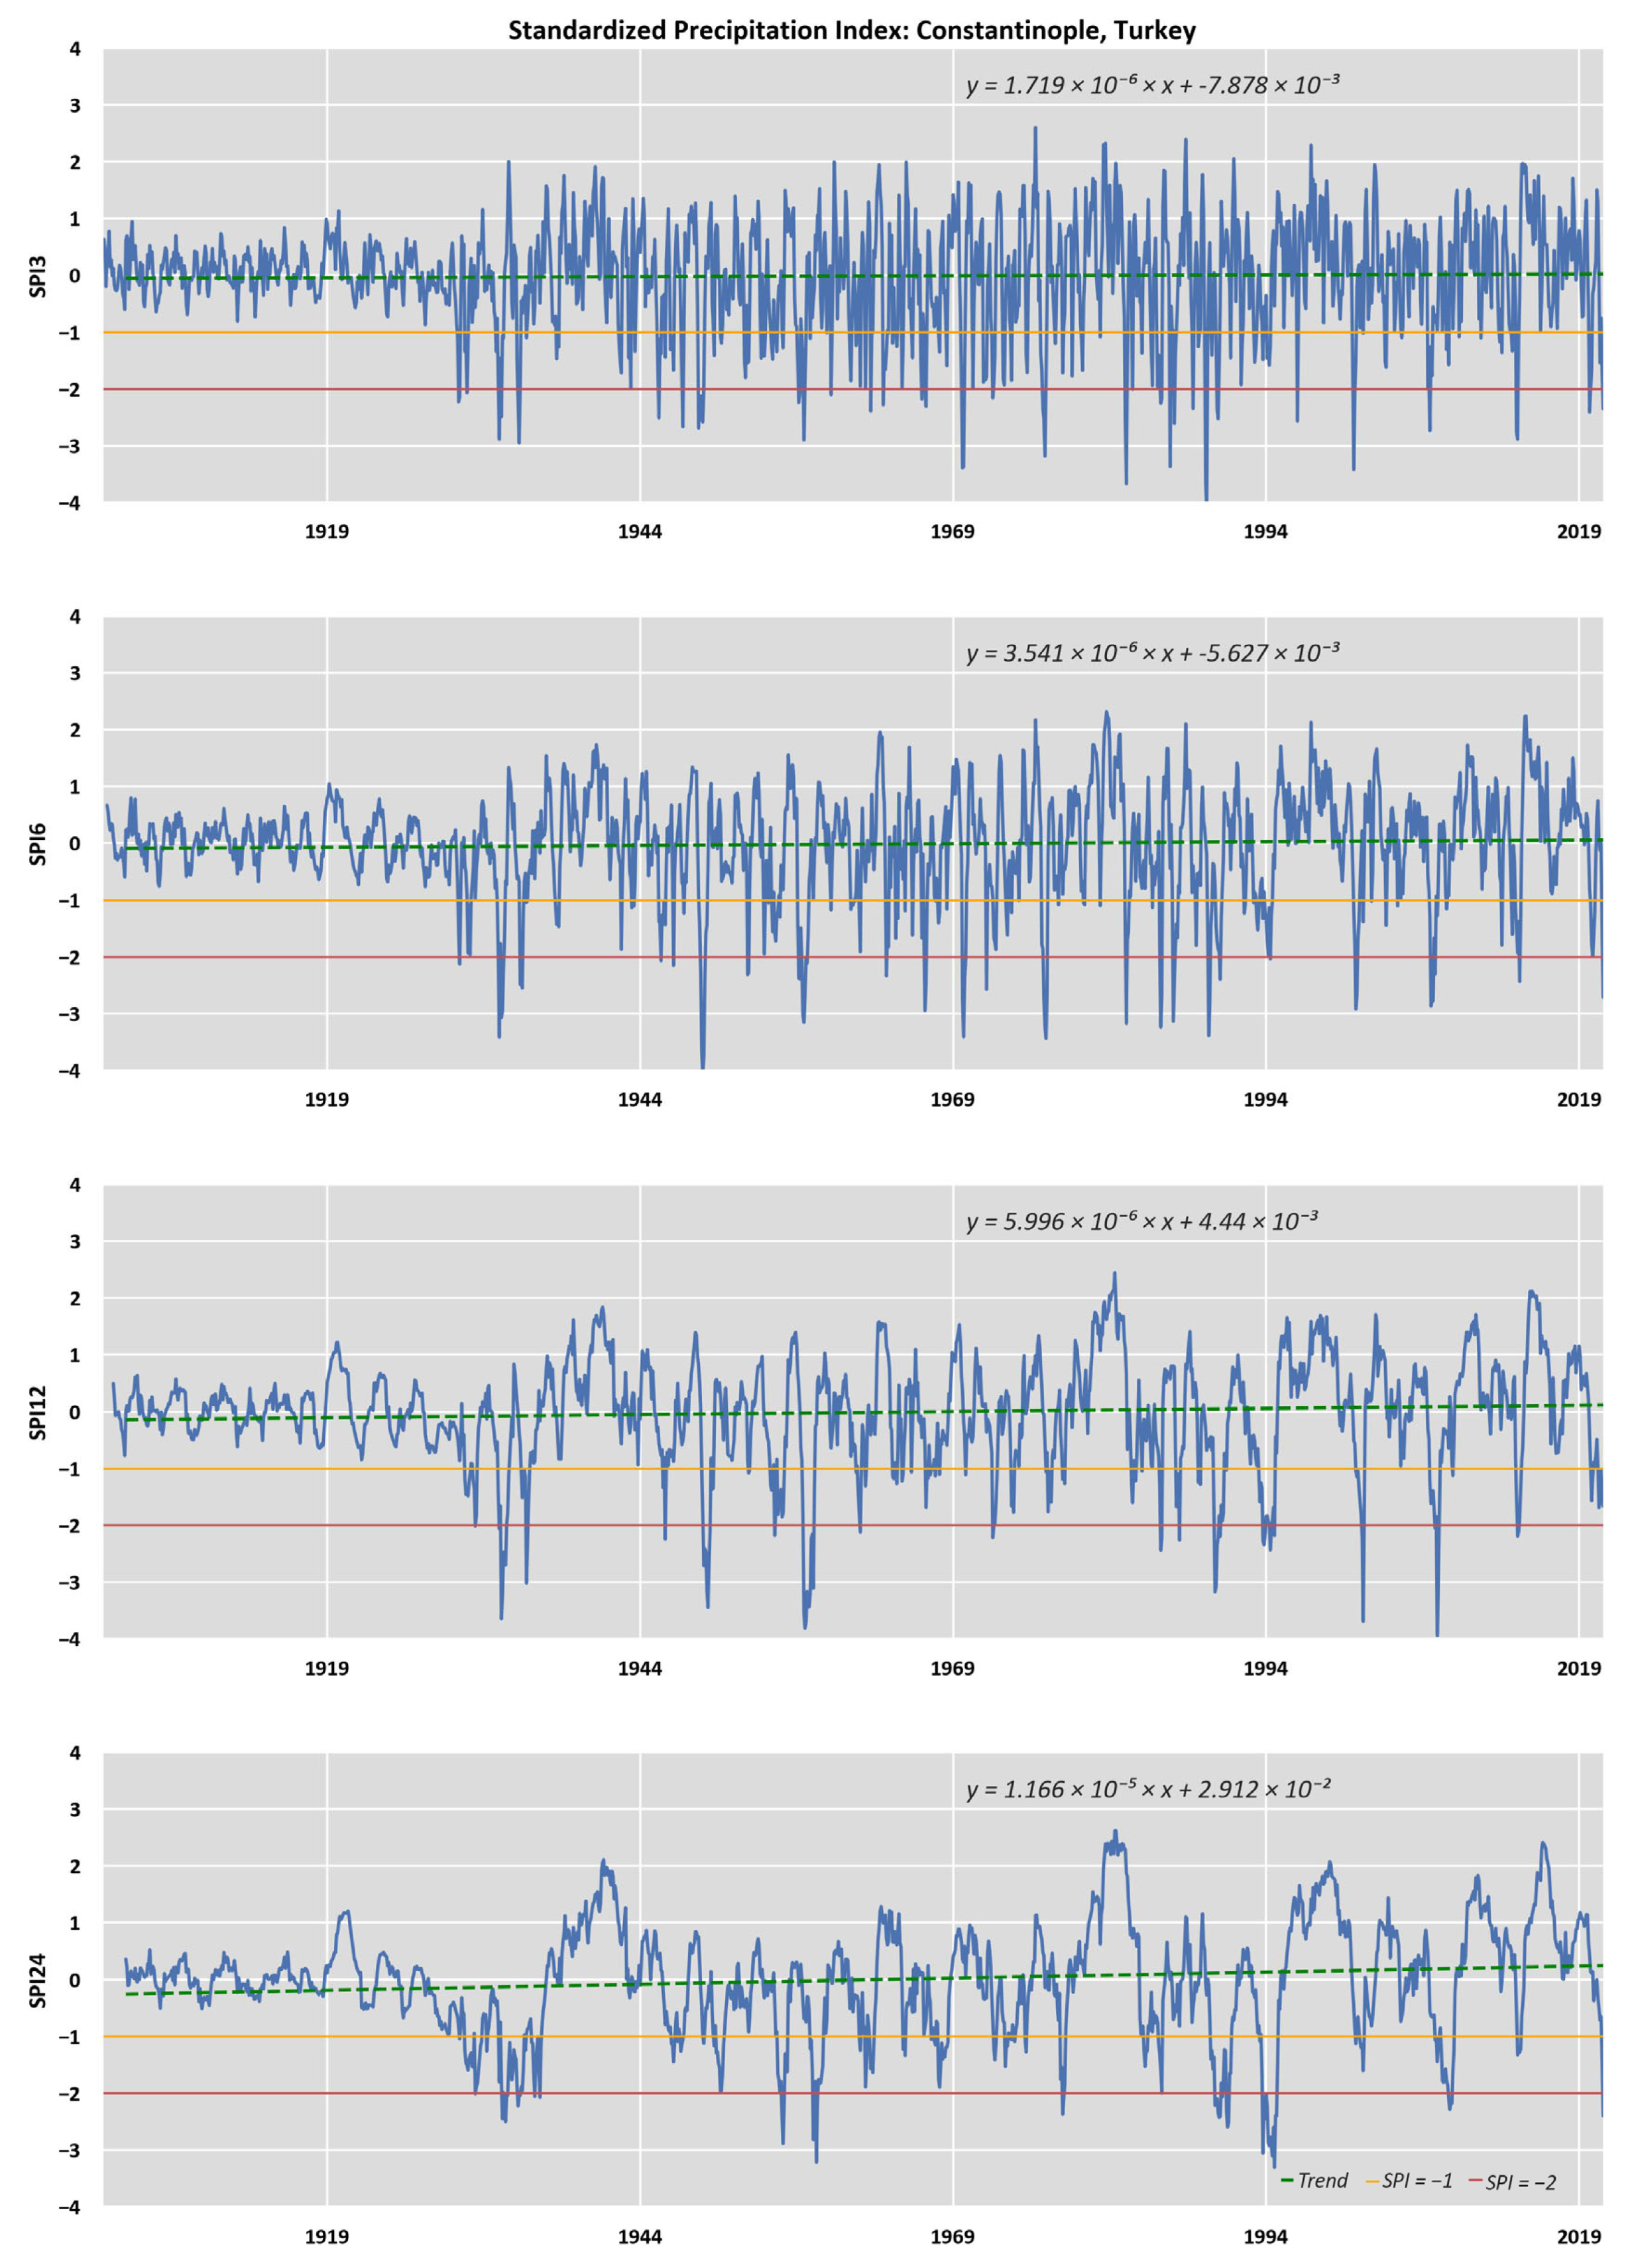
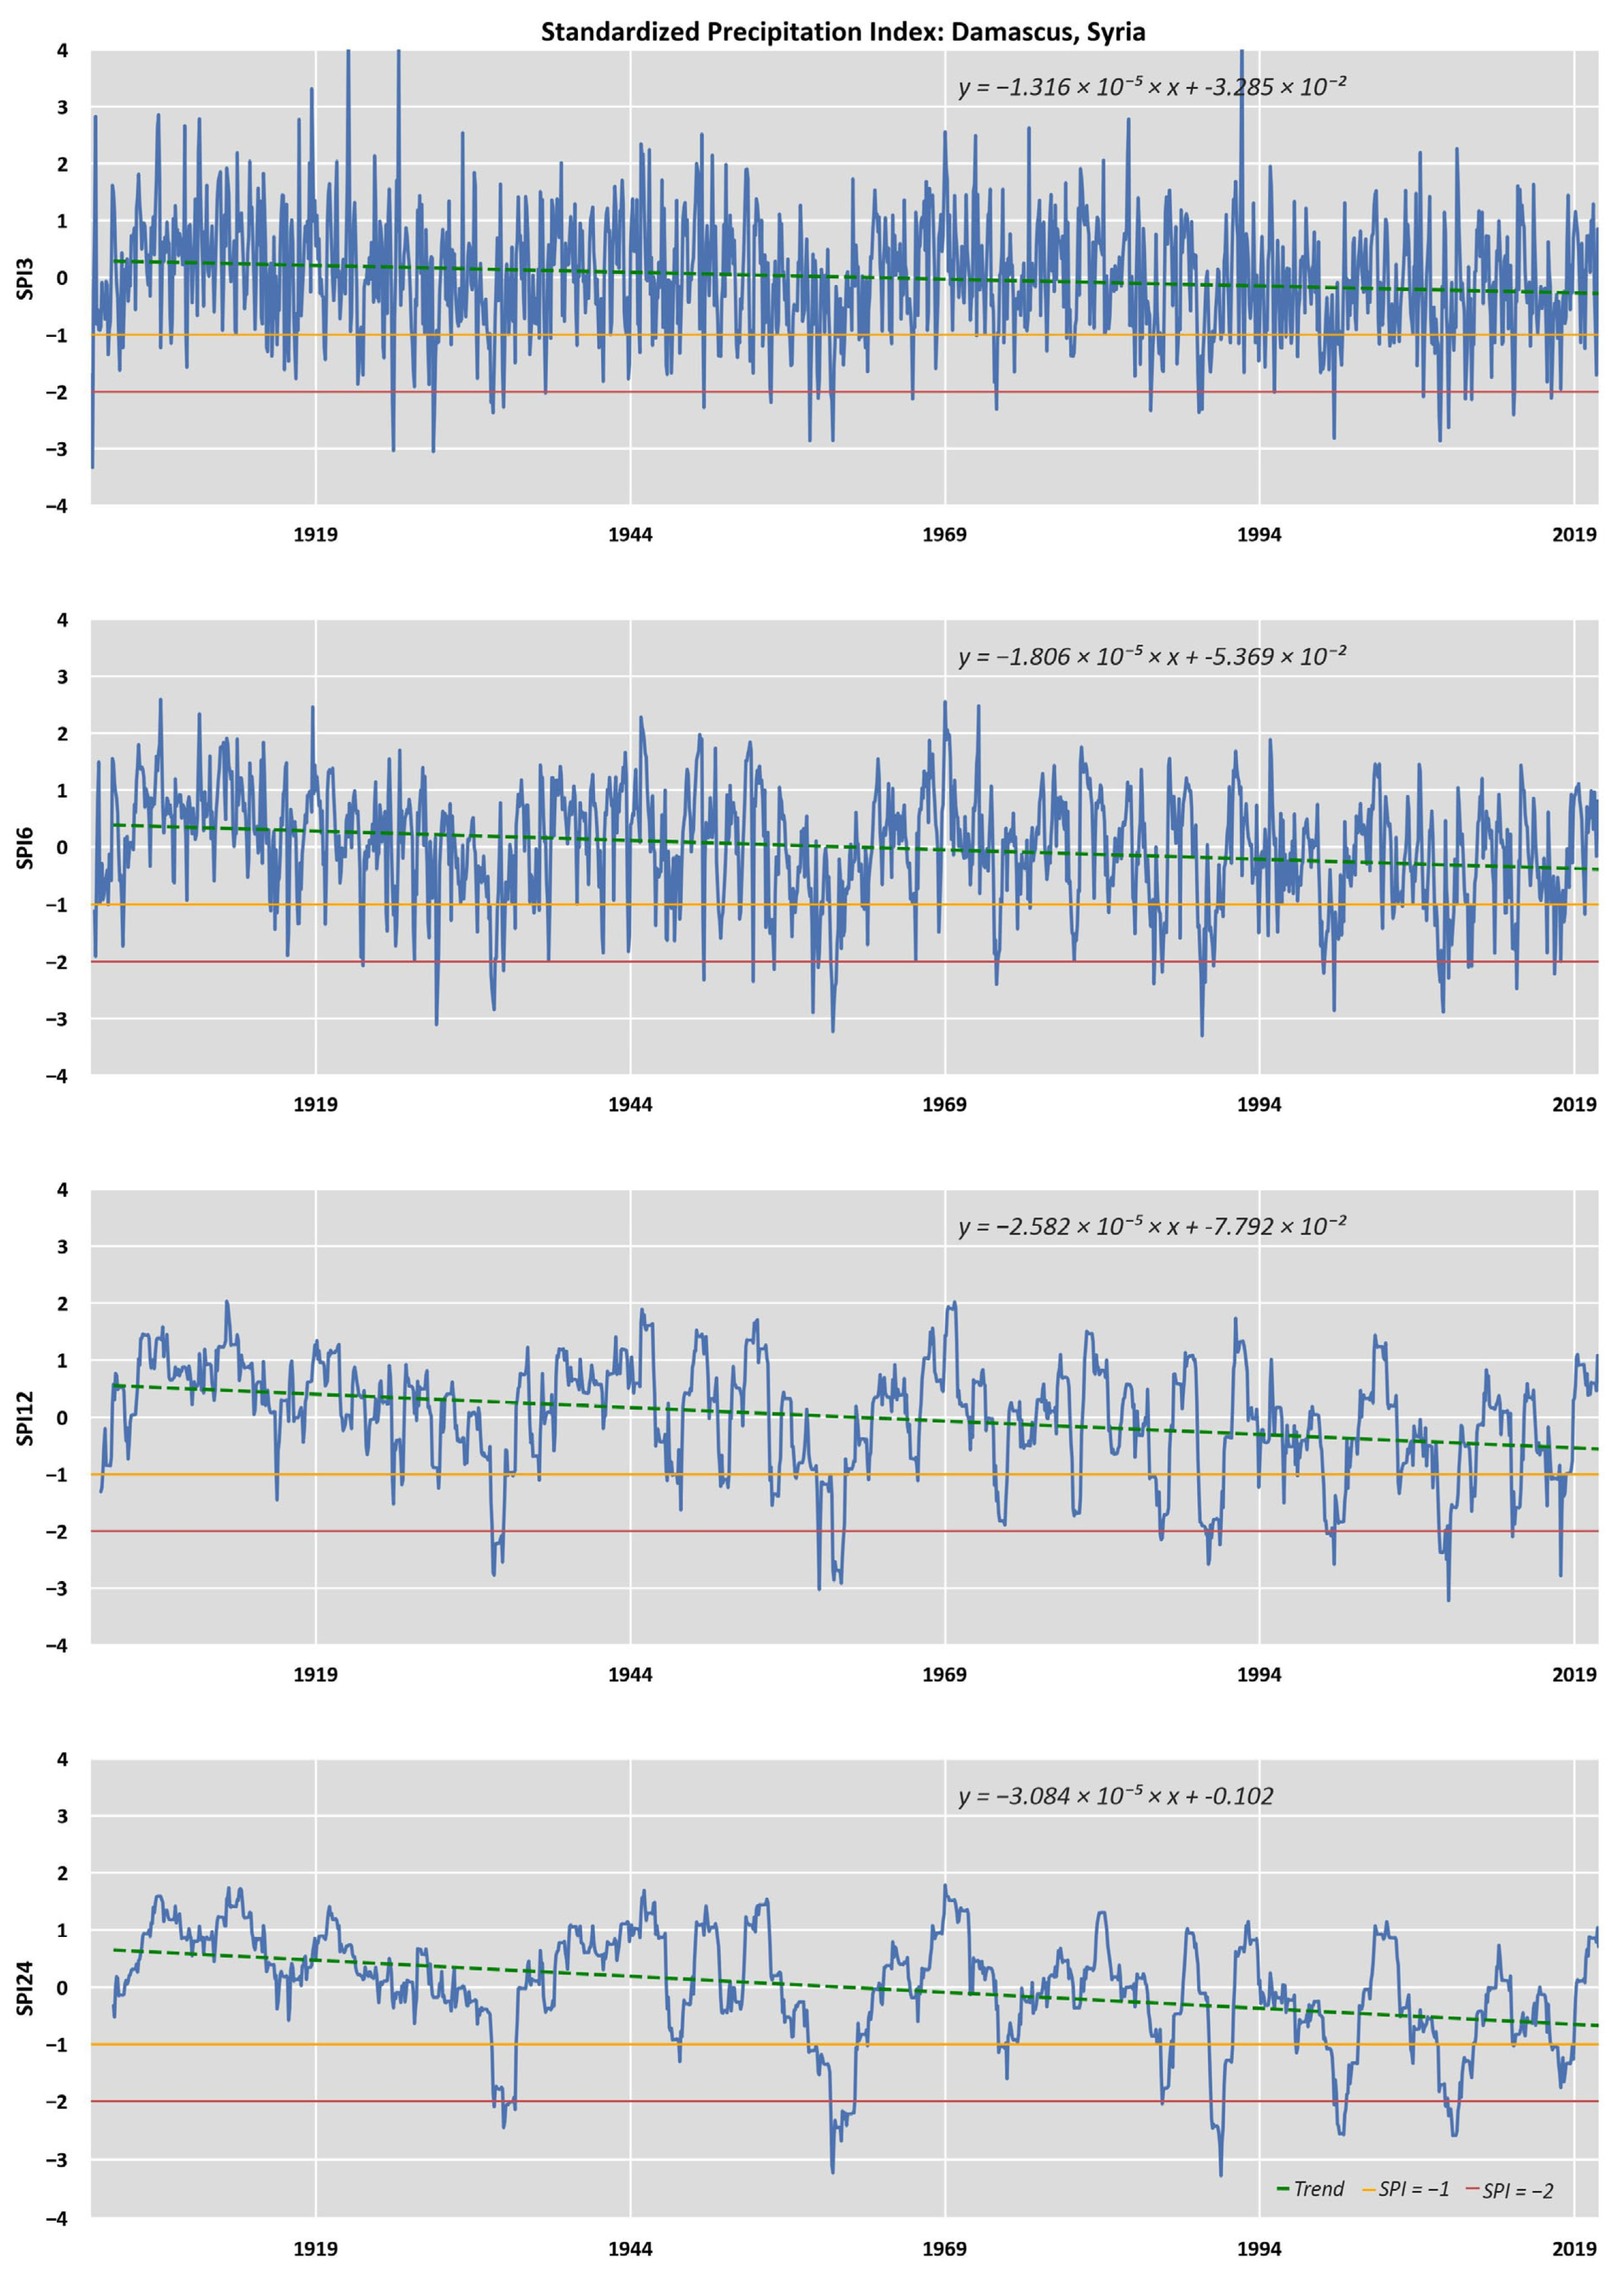
3.1. Precipitation Trend Analysis

The statistical analysis for the trend of the monthly precipitation from 1901–2020 for all the points, including the cities (Table 2 and Figure 1), was based on the Mann–Kendall test. These analyses were performed in Python language using the library pymannkendall. Additionally, the null hypothesis was tested at a 5% level of significance. For the cities examined, as the results in Table 1 depict, only Cairo had a downward trend, while the rest of the cities had a stable trend. According to the results of the monthly values, no significant changes in the precipitation were observed in several places. However, in its largest territory, Egypt experienced decreases in its precipitation values, especially in drier regions. Similar but smaller conditions occurred in Libya. Similarly, the dry regions of Jordan, Israel, and Syria showed a similar pattern of decline. Greece and Turkey did not show significant differences and it should be mentioned that, in northern Turkey and especially in the coastal areas of the Sinope area, they appeared with an increasing trend.

3.2. Evolution of the Drought Events over Time

The results were presented by creating line graphs for the SPI values calculated for the various time steps to show the trends over time. The graphs were generated for all the time steps of the SPI, for each of the nine major or capital cities of the countries in the study area. Figure 2 depicts the plots of SPI12 and the 24-month time evolution for the sampling point corresponding to the Nicosia area (Cyprus). Observing this graph, it can be seen that the minimum value of SPI12 (−4.05) occurred in September 1973. Values corresponding to extremely wet conditions, according to this graph, have not been recorded since 1969. During the period of 1980–2000, negative values prevailed. However, in the last 20 years, with the exception of the period of 2005–2009, when the index took negative values, positive values have prevailed, although a downward trend is evident. In all the charts for Nicosia, the major droughts that affected the northern part of the island in the periods of 1981–1985, 1995–1999, and 2005–2009 are distinct. These results are in line with those of a similar work implemented in Cyprus [75]. Additionally, from 1970 onwards, we observe that the SPI24 index remained negative for long periods of time [75,76,77,78].
For the time series of Cairo, Egypt (Figure A1), during the last decades and according to SPI3, there was an increase in the time intervals with negative values of the index. According to SPI24, no extremely wet conditions have occurred from 1990 until today, and, since 1950, extreme droughts have occurred more frequently, with the exception of the decade of 1985–1995 (Figure A1). From the mid-20th century onwards, extreme water scarcity seems to have occurred more frequently, except in the 1985–1995 decade, when mostly wet conditions prevailed, according to SPI12 and the 24-month time evolution. In Athens, Greece, during the last two decades of the 20th century, there were many dry periods with several extreme droughts according to both SPI12 and the 24-month time evolution, while in the first two decades of the 21st century, several wet periods were observed, mainly, but also more clearly, according to SPI24 (Figure A2). These results are in agreement with similar studies using the SPI for Greece [7,40,65].
For the time series data of (Constantinople) Istanbul, Turkey, the trend lines of both the SPI values (3, 6, 12, and SPI24) differed significantly from those of the other cities, as they show an increasing trend for the indicators (Figure A7). The SPI24 charts show that, over the last decades in Beirut, Damascus, Cairo, Athens, Amman, Jerusalem, and Nicosia, the index values have decreased, indicating adverse impacts on the underground aquifer. The same pattern is observed in the SPI12 graphs, except that the downward trend of the index over time is slightly lower than that of the SPI24 for all the above capitals, except Athens, where the downward trend of both indices is approximately the same [79,80,81].

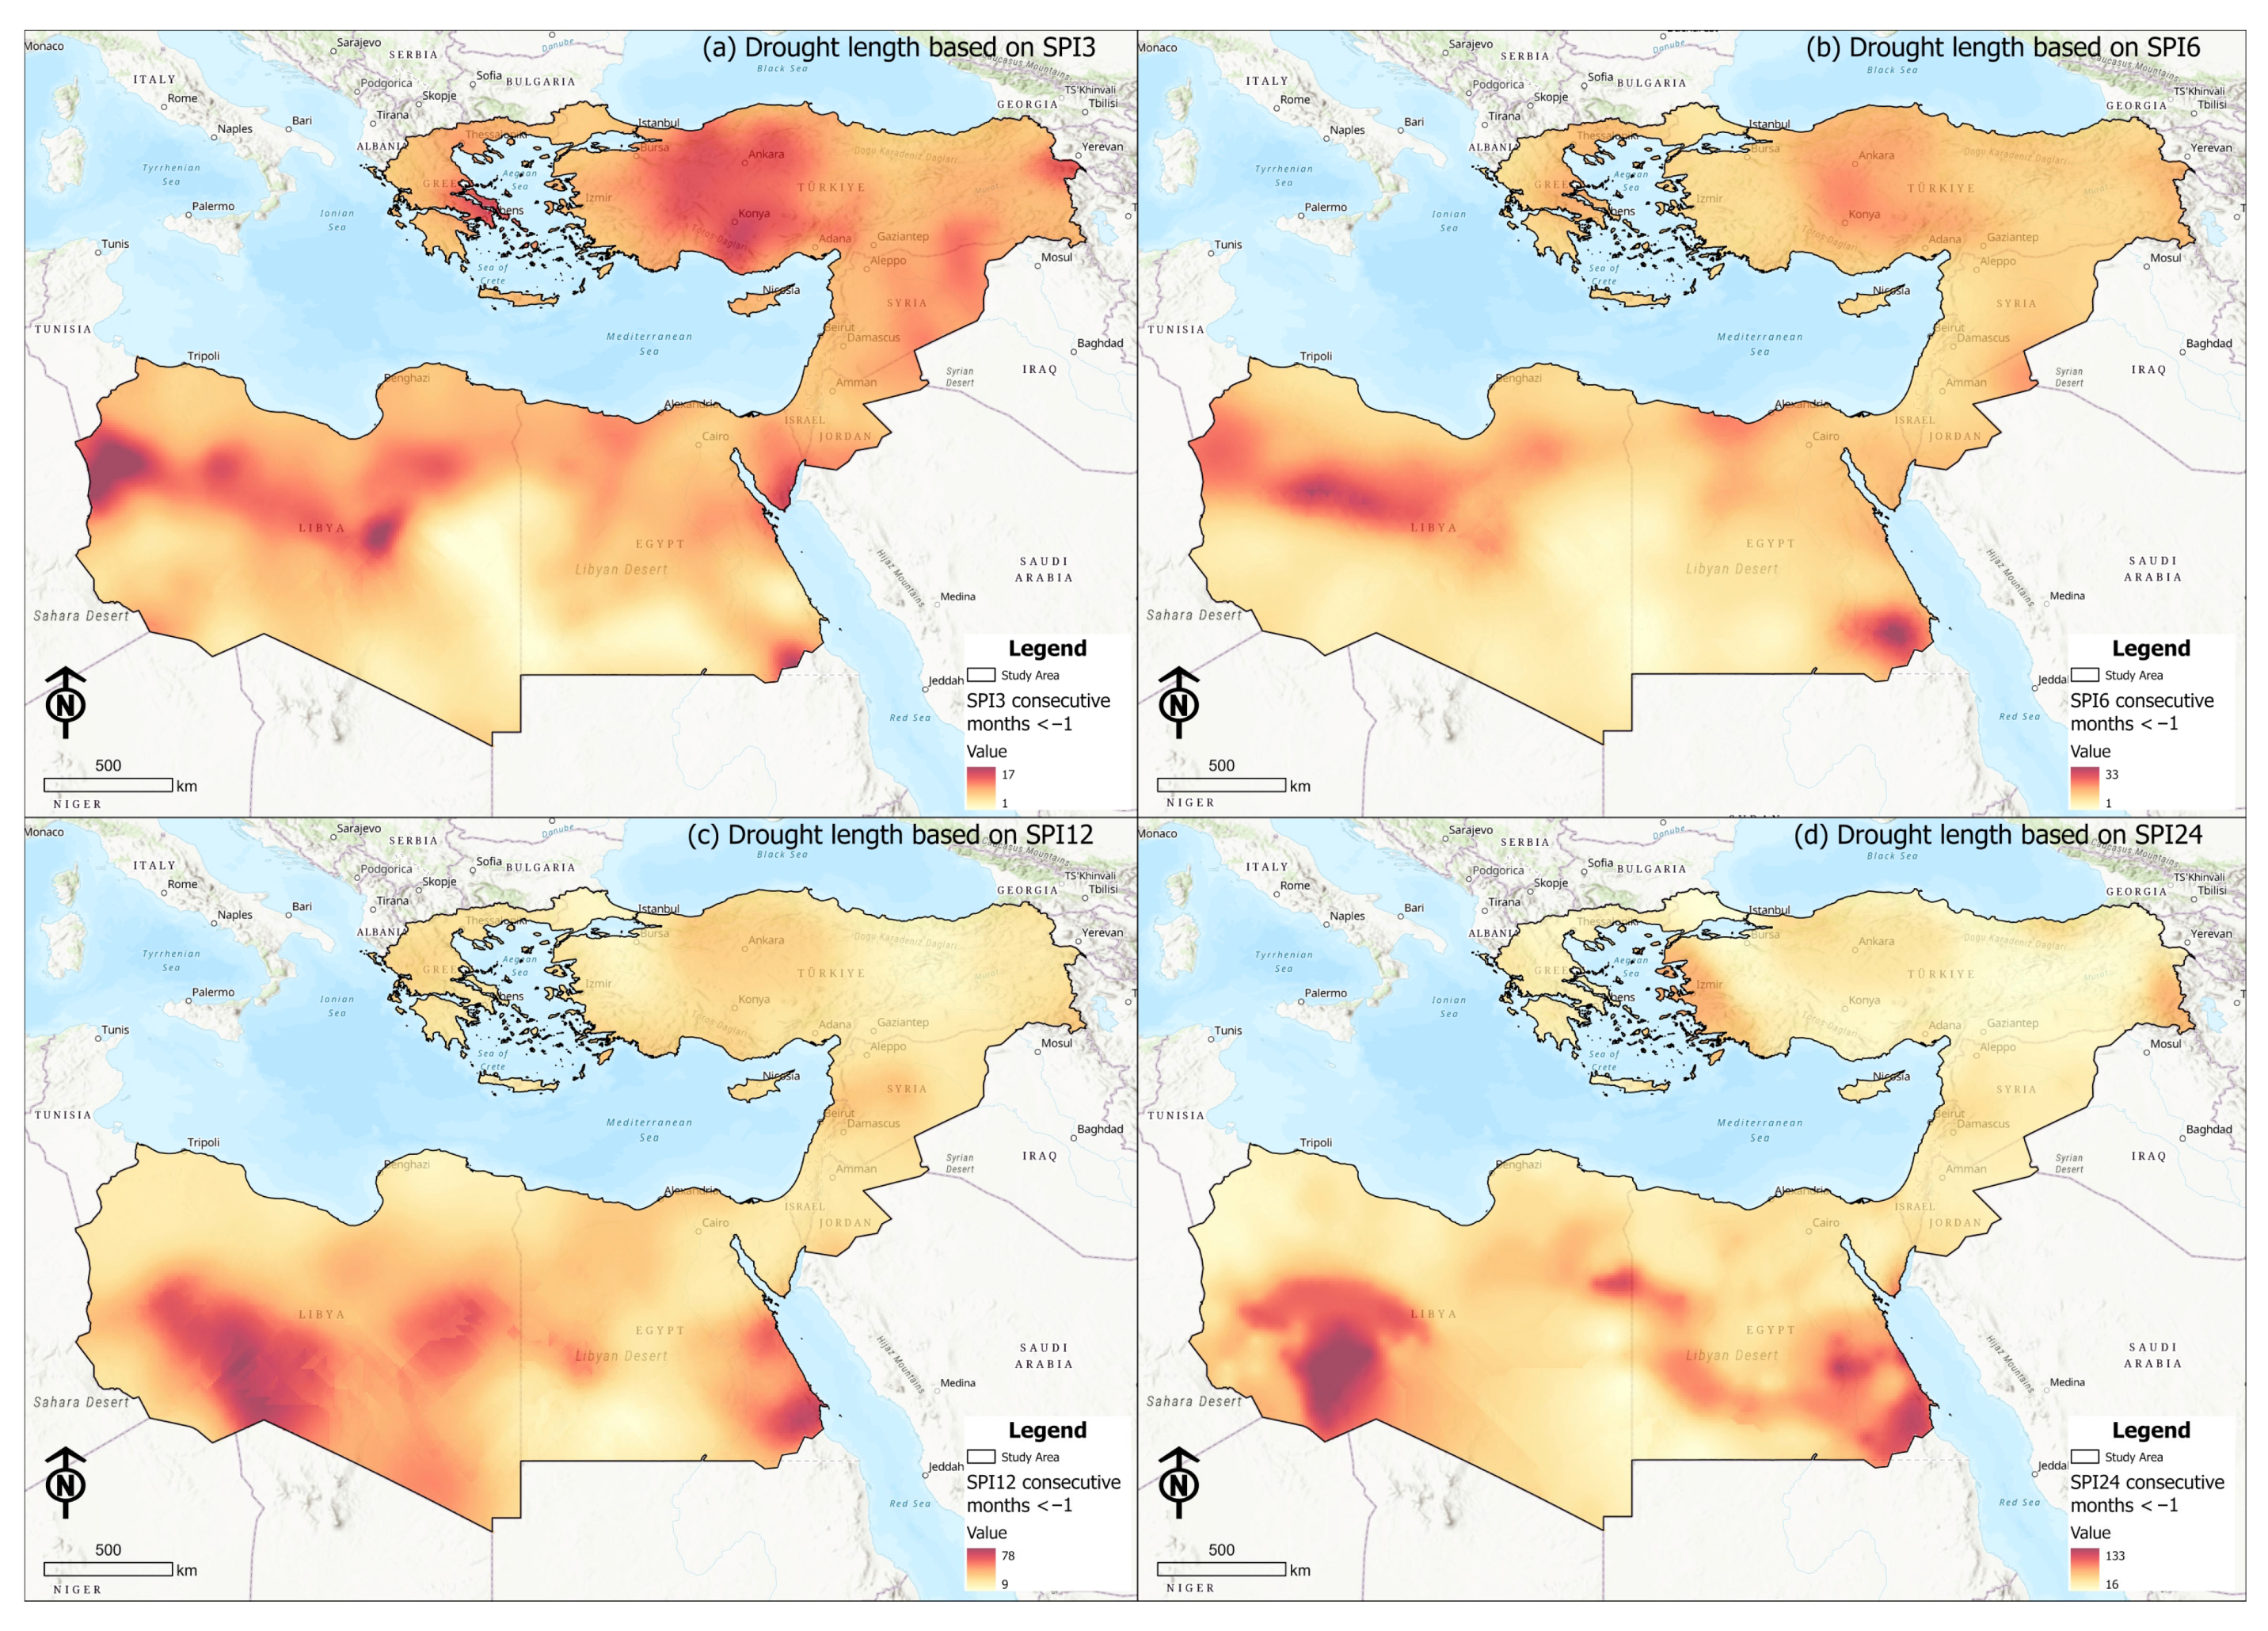
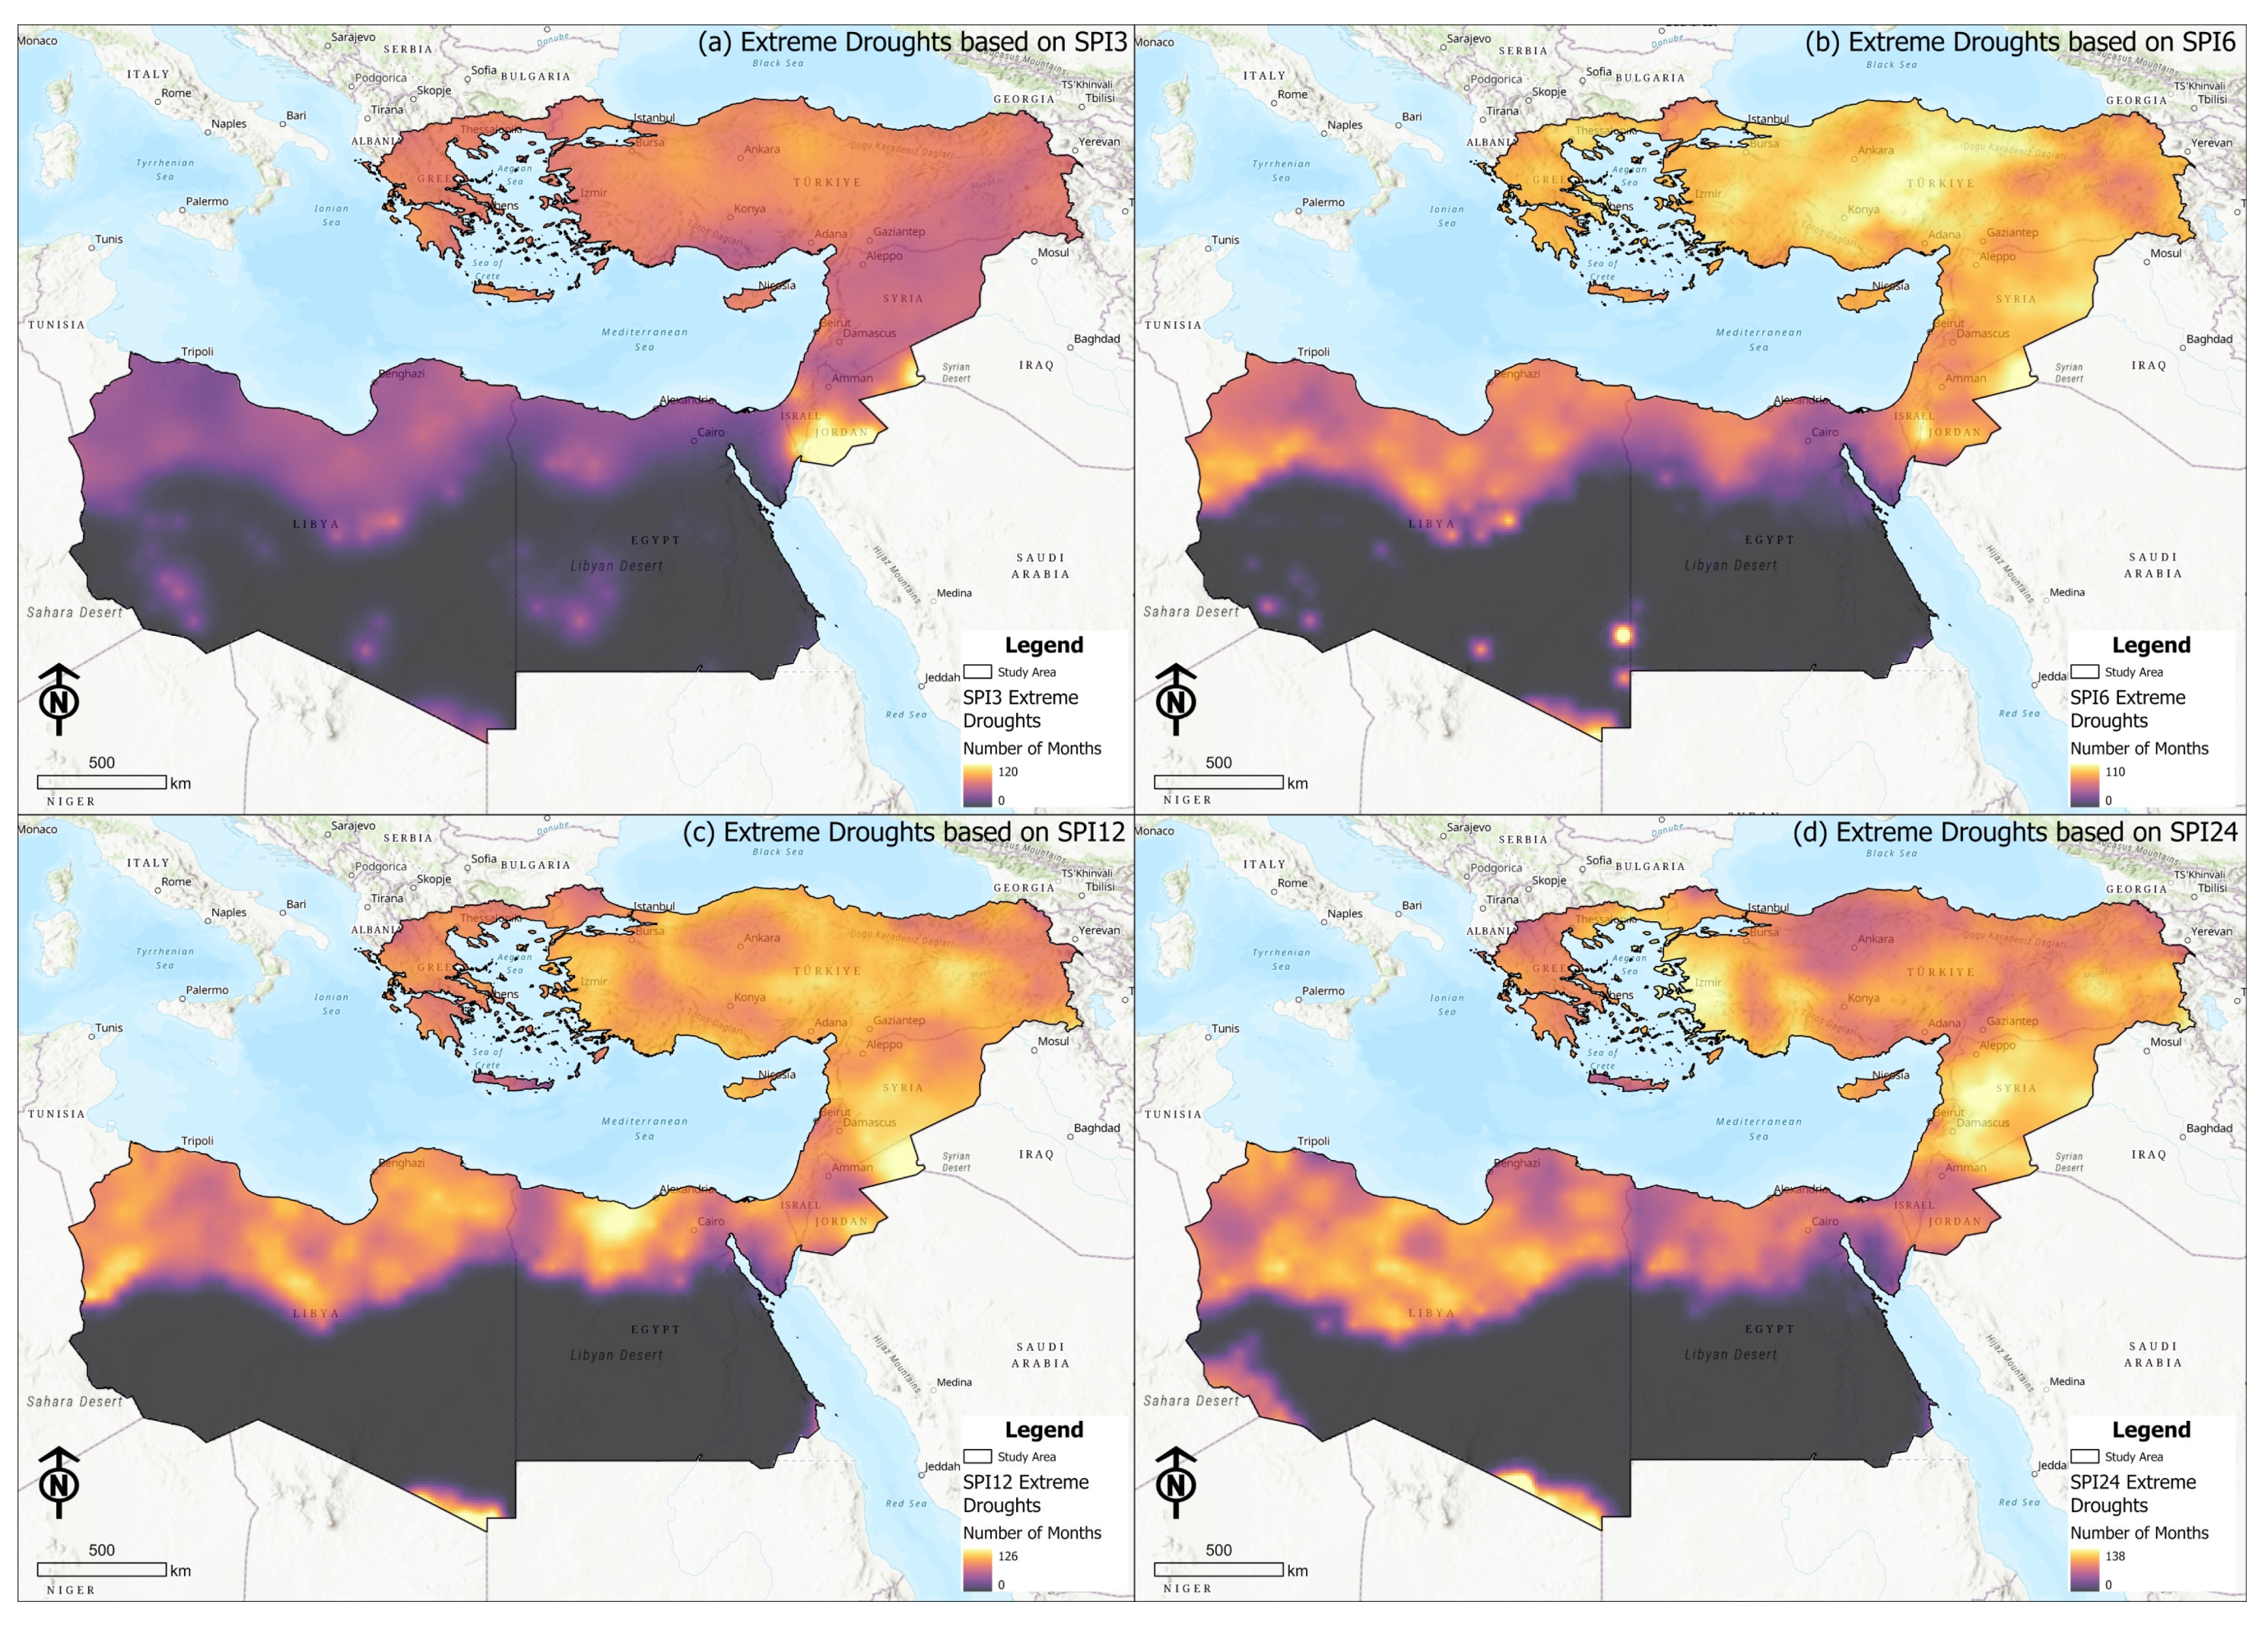
3.3. Spatial Drought Analysis

A spatial drought analysis is a method used to assess drought conditions across a geographic region. It involves analyzing various spatial factors, including precipitation, temperature, soil moisture, and vegetation, to determine the severity and extent of a drought. A spatial drought analysis can provide valuable insights into the spatial and temporal variability of a drought. In this current study, several maps were created, two for each time step of the SPI. The first one shows the number of occurrences of index values less than −2 for each sampling point, while the second one shows the number of consecutive months of drought where the index value was less than −1. The colors chosen for the number of SPI values lower than −2.0 are: grey for a zero number, yellow for the maximum number, cyan for the first one or two consecutive months of drought with an index value of less than −1.0, and dark red for the maximum number of consecutive months. Figure 3 depicts the map of the consecutive months of drought according to SPI12. This map shows that the southern coastal part of Turkey is more vulnerable to prolonged droughts. This result is consistent with the conclusion of a study conducted in this region for the period of 1959–2016 [82].
In addition, Figure 4 shows a higher number of extreme droughts according to SPI3 in Greece, Cyprus, Turkey, Jordan, Syria, Lebanon, and Israel compared to Libya and Egypt. In the map showing the number of values <−2 for SPI6, an opposite result between the Libya–Egypt land border zone and desert zone (zero rainfall) is discernible. By increasing the time scale of the SPI from 3 to 6 months, an increase in the number of occurrences of index values less than −2 is observed.
In the northern part of Libya, it appears that, as the SPI time step increases, the number of occurrences of values corresponding to extreme drought increases. The number of occurrences of extreme droughts according to SPI24 seems very clearly to be higher, indicating that this region seems to experience a higher number of long-term droughts (Figure 3). In the eastern Turkey region, as well as in the Levant countries, a high number of occurrences of extreme droughts according to SPI24 is observed. In the entire territorial area of Syria, there is a significant increase in the number of occurrences of extreme drought values according to SPI24. This result is consistent with the results of the work for the period of 1961–2012 [81]. Within the eastern continental part of Greece, as well as within the interior of Turkey, a higher number of consecutive months of drought with values of less than −1 for SPI3 was recorded. This reflects the opposite contradictory result between the desert and the Mediterranean parts of Libya and Egypt. Based on these results, it could be stated that, in dry areas, it portrayed frequent mild and moderate drought phenomena with longer periods, in opposition to areas with higher precipitation values (Greece, Syria, and Turkey) presenting shorter drought periods with a greater intensity (extreme droughts).

4. Conclusions

In general, it appears that numerous periods of drought occurred in the study area during the 20th century, according to both SPI3 and SPI6. During the first two decades of the 21st century, the SPI remained negative for periods of one year or more in some capitals. Beirut recorded long periods with negative values for SPI6 and there were several extreme droughts according to SPI3 and the 6-month time evolution, and a prevalence of dry periods in the last two decades according to SPI24. In the Cairo area, in the 1985–1995 decade, wet conditions according to SPI12 and the 24-month time evolution prevailed, but several dry periods and a gradual decrease in the minimum values of SPI6 were observed. Greece, eastern Turkey, the Mediterranean coasts of Libya, Egypt, and Cyprus, and the Middle Eastern countries included in the study area of this paper show a trend towards more intense, long-lasting, and larger spatially extended drought events in the later decades of the 20th century and the first two decades of the 21st century. The examination of the drought phenomenon and its coherence in such a large area with particular climatic characteristics revealed that many drought events of varying severity, frequency, and duration, as well as with different spatial extents and impacts, have taken place. Integrated water resource management will be a matter of concern for these eastern Mediterranean countries in the coming years. The use of drought indicators will be a valuable tool for detecting changes in the drought characteristics and contingency planning for mitigating their effects. The results of this study may contribute to the development of water resource management studies, the development of forecasting systems, the adoption of mitigation measures, and the change in agricultural practices in the study area, where the climate crisis has made its appearance. The presented effort examined an interannual approach (1901–2020) and these droughts may have a very high probability of occurrence in the near future. Nevertheless, the produced results suggest that any unexpected fluctuations in water availability may cause the area’s vulnerability to follow similar patterns and inflict severe impacts on the area. Therefore, the drought vulnerability issues in the region should be taken under constant consideration and incorporated into all water resource planning and management efforts. All in all, the results underline the realization of the increasing complexity, volatility, and vulnerability of water resources in a fast-changing socio-economic and environmental context, and point towards the need for the application of an integrated drought management framework in vulnerable countries, especially the Mediterranean countries.

Author Contributions

D.E.T. and I.L. conceived and designed the experiments; D.E.T., I.L. and K.K. performed the experiments, analyzed the data; D.E.T. and I.L. wrote the paper; D.E.T., I.L., E.Z., C.A.K., C.G.V., K.K. and A.T. reviewed the paper. All authors have read and agreed to the published version of the manuscript.

Funding

This research received no external funding.

Data Availability Statement

Not applicable.

Conflicts of Interest

The authors declare no conflict of interest.

Appendix A. SPI Diagrams of Cities of the Study Area

Figure A1. Timeseries of SPI (3, 6, 12, and 24 months) for the CRU sampling point with trendline corresponding to Cairo, Egypt.
Climate 11 00095 g0a1
Figure A2. Timeseries of SPI (3, 6, 12, and 24 months) for the CRU sampling point with trendline corresponding to Athens, Greece.
Climate 11 00095 g0a2
Figure A3. Timeseries of SPI (3, 6, 12, and 24 months) for the CRU sampling point with trendline corresponding to Jerusalem, Israel.
Climate 11 00095 g0a3
Figure A4. Timeseries of SPI (3, 6, 12, and 24 months) for the CRU sampling point with trendline corresponding to Amman, Jordan.
Climate 11 00095 g0a4
Figure A5. Timeseries of SPI (3, 6, 12, and 24 months) for the CRU sampling point with trendline corresponding to Beirut, Lebanon.
Climate 11 00095 g0a5
Figure A6. Timeseries of SPI (3, 6, 12, and 24 months) for the CRU sampling point with trendline corresponding to Tripoli, Libya.
Climate 11 00095 g0a6
Figure A7. Timeseries of SPI (3, 6, 12, and 24 months) for the CRU sampling point with trendline corresponding to Constantinople, Turkey.
Climate 11 00095 g0a7
Figure A8. Timeseries of SPI (3, 6, 12, and 24 months) for the CRU sampling point with trendline corresponding to Damascus, Syria.
Climate 11 00095 g0a8

References

  1. Deitch, M.J.; Sapundjieff, M.J.; Feirer, S.T. Characterizing Precipitation Variability and Trends in the World’s Mediterranean-Climate Areas. Water 2017, 9, 259. [Google Scholar] [CrossRef]
  2. Giannakopoulos, C.; Le Sager, P.; Bindi, M.; Moriondo, M.; Kostopoulou, E.; Goodess, C.M. Climatic Changes and Associated Impacts in the Mediterranean Resulting from a 2 °C Global Warming. Glob. Planet. Chang. 2009, 68, 209–224. [Google Scholar] [CrossRef]
  3. Moe, J.; Bennion, H.; Cid, N.; Solheim, A.L.; Noges, P.; Adrian, R.; Cardoso, A.C.; Brucet, S.; Tuvikene, L.; Persson, J. Implications of Climate Change for Ecological Reference Conditions, Thresholds and Classification Systems for European Lakes; UCL Faculty of S&HS: London, UK, 2014. [Google Scholar]
  4. Abdel-Hameed, A.M.; Abuarab, M.E.-S.; Al-Ansari, N.; Mehawed, H.S.; Kassem, M.A.; He, H.; Gyasi-Agyei, Y.; Mokhtar, A. Winter Potato Water Footprint Response to Climate Change in Egypt. Atmosphere 2022, 13, 1052. [Google Scholar] [CrossRef]
  5. Kalogeropoulos, K.; Chalkias, C. Modelling the Impacts of Climate Change on Surface Runoff in Small Mediterranean Catchments: Empirical Evidence from Greece: Modelling the Impacts of Climate Change on Surface Runoff. Water Environ. J. 2013, 27, 505–513. [Google Scholar] [CrossRef]
  6. Tsesmelis, D.E.; Karavitis, C.A.; Kalogeropoulos, K.; Zervas, E.; Vasilakou, C.G.; Skondras, N.A.; Oikonomou, P.D.; Stathopoulos, N.; Alexandris, S.G.; Tsatsaris, A.; et al. Evaluating the Degradation of Natural Resources in the Mediterranean Environment Using the Water and Land Resources Degradation Index, the Case of Crete Island. Atmosphere 2022, 13, 135. [Google Scholar] [CrossRef]
  7. Tsesmelis, D.E.; Vasilakou, C.G.; Kalogeropoulos, K.; Stathopoulos, N.; Alexandris, S.G.; Zervas, E.; Oikonomou, P.D.; Karavitis, C.A. Chapter 46—Drought Assessment Using the Standardized Precipitation Index (SPI) in GIS Environment in Greece. In Computers in Earth and Environmental Sciences; Pourghasemi, H.R., Ed.; Elsevier: Amsterdam, The Netherlands, 2022; pp. 619–633. ISBN 978-0-323-89861-4. [Google Scholar]
  8. Tsesmelis, D.E.; Karavitis, C.A.; Oikonomou, P.D.; Alexandris, S.; Kosmas, C. Assessment of the Vulnerability to Drought and Desertification Characteristics Using the Standardized Drought Vulnerability Index (SDVI) and the Environmentally Sensitive Areas Index (ESAI). Resources 2019, 8, 6. [Google Scholar] [CrossRef]
  9. Karavitis, C.A. Drought and Urban Water Supplies: The Case of Metropolitan Athens. Water Policy 1998, 1, 505–524. [Google Scholar] [CrossRef]
  10. Karavitis, C.A.; Tsesmelis, D.E.; Skondras, N.A.; Stamatakos, D.; Alexandris, S.; Fassouli, V.; Vasilakou, C.G.; Oikonomou, P.D.; Gregorič, G.; Grigg, N.S.; et al. Linking Drought Characteristics to Impacts on a Spatial and Temporal Scale. Water Policy 2014, 16, 1172–1197. [Google Scholar] [CrossRef]
  11. Soulis, K.X.; Tsesmelis, D.E. Calculation of the Irrigation Water Needs Spatial and Temporal Distribution in Greece. Eur. Water 2017, 59, 247–254. [Google Scholar]
  12. Karavitis, C.A.; Alexandris, S.G.; Fassouli, V.P.; Stamatakos, D.V.; Vasilakou, C.G.; Tsesmelis, D.E.; Skondras, N.A.; Gregoric, G. Assessing Drought Vulnerability under Alternative Water Demand Deficit Scenarios in South-Eastern Europe. In Proceedings of the 8th International Conference of EWRA “Water Resources Management in an Interdisciplinary and Changing Context”, Porto, Portugal, 26–29 June 2013. [Google Scholar]
  13. Kalogeropoulos, K.; Stathopoulos, N.; Psarogiannis, A.; Pissias, E.; Louka, P.; Petropoulos, G.P.; Chalkias, C. An Integrated GIS-Hydro Modeling Methodology for Surface Runoff Exploitation via Small-Scale Reservoirs. Water 2020, 12, 3182. [Google Scholar] [CrossRef]
  14. AghaKouchak, A.; Feldman, D.; Hoerling, M.; Huxman, T.; Lund, J. Water and Climate: Recognize Anthropogenic Drought. Nat. News 2015, 524, 409. [Google Scholar] [CrossRef]
  15. Grigg, N.S.; Vlachos, E.C. Drought Water Management; Colorado State University: Fort Collins, CO, USA, 1990. [Google Scholar]
  16. Karavitis, C.A. Regional Water Transfers and Drought Management Strategies. In Transboundary Water Resources Management; Ganoulis, J., Duckstein, L., Literathy, P., Bogardi, I., Eds.; Nato ASI Series; Springer: Berlin/Heidelberg, Germany, 1996; pp. 451–457. ISBN 978-3-642-64843-4. [Google Scholar]
  17. Karavitis, C. Drought Management Strategies for Urban Water Supplies: The Case of Metropolitan Athens. Ph.D. Dissertation, Department of Civil Engineering, Colorado State University, Fort Collins, CO, USA, 1992. [Google Scholar]
  18. Vlachos, E.C. Drought Management Interfaces; ASCE: Las Vegas, NV, USA, 1982; p. 15. [Google Scholar]
  19. Orimoloye, I.R.; Belle, J.A.; Orimoloye, Y.M.; Olusola, A.O.; Ololade, O.O. Drought: A Common Environmental Disaster. Atmosphere 2022, 13, 111. [Google Scholar] [CrossRef]
  20. Wilhite, D.A. Chapter 1 Drought as a Natural Hazard: Concepts and Definitions; Drought Mitigation Center Faculty Publications: Lincoln, NE, USA, 2000. [Google Scholar]
  21. Liu, X.; Wang, Y.; Peng, J.; Braimoh, A.K.; Yin, H. Assessing Vulnerability to Drought Based on Exposure, Sensitivity and Adaptive Capacity: A Case Study in Middle Inner Mongolia of China. Chin. Geogr. Sci. 2013, 23, 13–25. [Google Scholar] [CrossRef]
  22. Oikonomou, P.D.; Tsesmelis, D.E.; Waskom, R.M.; Grigg, N.S.; Karavitis, C.A. Enhancing the Standardized Drought Vulnerability Index by Integrating Spatiotemporal Information from Satellite and In Situ Data. J. Hydrol. 2019, 569, 265–277. [Google Scholar] [CrossRef]
  23. Wilhite, D.; Pulwarty, R.S. Integrating Science, Management, and Policy, 2nd ed.; CRC Press: Boca Raton, FL, USA, 2017; ISBN 978-1-315-26555-1. [Google Scholar]
  24. Tsesmelis, D.; Zervas, E.; Karavitis, C. Vulnerability Assessment to Desertification in Greece Using Composite Indicators. In Proceedings of the 6th Conference Economics of Natural Resources & the Environment, Online, 11–12 June 2021. [Google Scholar]
  25. Tsakiris, G.; Pangalou, D.; Vangelis, H. Regional Drought Assessment Based on the Reconnaissance Drought Index (RDI). Water Resour. Manag. 2007, 21, 821–833. [Google Scholar] [CrossRef]
  26. Oikonomou, P.D.; Karavitis, C.A.; Tsesmelis, D.E.; Kolokytha, E.; Maia, R. Drought Characteristics Assessment in Europe over the Past 50 Years. Water Resour Manag. 2020, 34, 4757–4772. [Google Scholar] [CrossRef]
  27. Tsatsaris, A.; Kalogeropoulos, K.; Stathopoulos, N.; Louka, P.; Tsanakas, K.; Tsesmelis, D.E.; Krassanakis, V.; Petropoulos, G.P.; Pappas, V.; Chalkias, C. Geoinformation Technologies in Support of Environmental Hazards Monitoring under Climate Change: An Extensive Review. ISPRS Int. J. Geo-Inf. 2021, 10, 94. [Google Scholar] [CrossRef]
  28. Fassouli, V.P.; Karavitis, C.A.; Tsesmelis, D.E.; Alexandris, S.G. Factual Drought Index (FDI): A Composite Index Based on Precipitation and Evapotranspiration. Hydrol. Sci. J. 2021, 66, 1638–1652. [Google Scholar] [CrossRef]
  29. Bucur, D. Advanced Evapotranspiration Methods and Applications; BoD—Books on Demand: London, UK, 2019; ISBN 978-1-78985-811-2. [Google Scholar]
  30. Li, J.; Wang, Z.; Wu, X.; Xu, C.-Y.; Guo, S.; Chen, X. Toward Monitoring Short-Term Droughts Using a Novel Daily Scale, Standardized Antecedent Precipitation Evapotranspiration Index. J. Hydrometeorol. 2020, 21, 891–908. [Google Scholar] [CrossRef]
  31. Abbas, A.; Waseem, M.; Ahmad, R.; Khan, K.A.; Zhao, C.; Zhu, J. Sensitivity Analysis of Greenhouse Gas Emissions at Farm Level: Case Study of Grain and Cash Crops. Env. Sci. Pollut. Res. 2022, 29, 82559–82573. [Google Scholar] [CrossRef]
  32. Abbas, A.; Zhao, C.; Ullah, W.; Ahmad, R.; Waseem, M.; Zhu, J. Towards Sustainable Farm Production System: A Case Study of Corn Farming. Sustainability 2021, 13, 9243. [Google Scholar] [CrossRef]
  33. Elahi, E.; Khalid, Z.; Tauni, M.Z.; Zhang, H.; Lirong, X. Extreme Weather Events Risk to Crop-Production and the Adaptation of Innovative Management Strategies to Mitigate the Risk: A Retrospective Survey of Rural Punjab, Pakistan. Technovation 2022, 117, 102255. [Google Scholar] [CrossRef]
  34. Elahi, E.; Khalid, Z.; Zhang, Z. Understanding Farmers’ Intention and Willingness to Install Renewable Energy Technology: A Solution to Reduce the Environmental Emissions of Agriculture. Appl. Energy 2022, 309, 118459. [Google Scholar] [CrossRef]
  35. Xoplaki, E.; González-Rouco, J.; Gyalistras, D.; Luterbacher, J.; Rickli, R.; Wanner, H. Interannual Summer Air Temperature Variability over Greece and Its Connection to the Large-Scale Atmospheric Circulation and Mediterranean SSTs 1950–1999. Clim. Dyn. 2003, 20, 537–554. [Google Scholar] [CrossRef]
  36. Lionello, P. The Climate of the Mediterranean Region: From the Past to the Future; Elsevier: Amsterdam, The Netherlands, 2012; ISBN 978-0-12-416042-2. [Google Scholar]
  37. Zappa, G. Regional Climate Impacts of Future Changes in the Mid–Latitude Atmospheric Circulation: A Storyline View. Curr. Clim. Chang. Rep. 2019, 5, 358–371. [Google Scholar] [CrossRef]
  38. Darmaraki, S.; Somot, S.; Sevault, F.; Nabat, P.; Cabos Narvaez, W.D.; Cavicchia, L.; Djurdjevic, V.; Li, L.; Sannino, G.; Sein, D.V. Future Evolution of Marine Heatwaves in the Mediterranean Sea. Clim. Dyn. 2019, 53, 1371–1392. [Google Scholar] [CrossRef]
  39. Giorgi, F. Climate Change Hot-Spots. Geophys. Res. Lett. 2006, 33, 10–14. [Google Scholar] [CrossRef]
  40. Karavitis, C.A.; Chortaria, C.; Alexandris, S.; Vasilakou, C.G.; Tsesmelis, D.E. Development of the Standardised Precipitation Index for Greece. Urban Water J. 2012, 9, 401–417. [Google Scholar] [CrossRef]
  41. Tsesmelis, D.E.; Karavitis, C.A.; Kalogeropoulos, K.; Tsatsaris, A.; Zervas, E.; Vasilakou, C.G.; Stathopoulos, N.; Skondras, N.A.; Alexandris, S.G.; Chalkias, C.; et al. Development and Application of Water and Land Resources Degradation Index (WLDI). Earth 2021, 2, 515–531. [Google Scholar] [CrossRef]
  42. Gan, T.Y.; Ito, M.; Hülsmann, S.; Qin, X.; Lu, X.X.; Liong, S.Y.; Rutschman, P.; Disse, M.; Koivusalo, H. Possible Climate Change/Variability and Human Impacts, Vulnerability of Drought-Prone Regions, Water Resources and Capacity Building for Africa. Hydrol. Sci. J. 2016, 61, 1209–1226. [Google Scholar] [CrossRef]
  43. Iglesias, C.A.; Garrote, L.; Cancelliere, A.; Cubillo, F.; Wilhite, D.A. Coping with Drought Risk in Agriculture and Water Supply Systems: Drought Management and Policy Development in the Mediterranean; Springer Science & Business Media: Madrid, Spain, 2009; ISBN 978-1-4020-9045-5. [Google Scholar]
  44. Proutsos, N.; Tigkas, D. Growth Response of Endemic Black Pine Trees to Meteorological Variations and Drought Episodes in a Mediterranean Region. Atmosphere 2020, 11, 554. [Google Scholar] [CrossRef]
  45. Kalogeropoulos, K.; Tsanakas, K.; Stathopoulos, N.; Tsesmelis, D.E.; Tsatsaris, A. Cultural Heritage in the Light of Flood Hazard: The Case of the “Ancient” Olympia, Greece. Hydrology 2023, 10, 61. [Google Scholar] [CrossRef]
  46. Polade, S.D.; Gershunov, A.; Cayan, D.R.; Dettinger, M.D.; Pierce, D.W. Precipitation in a Warming World: Assessing Projected Hydro-Climate Changes in California and Other Mediterranean Climate Regions. Sci. Rep. 2017, 7, 10783. [Google Scholar] [CrossRef]
  47. Geeson, N.A.; Brandt, C.J.; Thornes, J.B. Mediterranean Desertification: A Mosaic of Processes and Responses; John Wiley & Sons: Hoboken, NJ, USA, 2003; ISBN 978-0-470-85686-4. [Google Scholar]
  48. Kosmas, C.S.; Danalatos, N.G. Climate Change, Desertification and the Mediterranean Region. In Soil Responses to Climate Change; Rounsevell, M.D.A., Loveland, P.J., Eds.; Springer: Berlin/Heidelberg, Germany, 1994; pp. 25–38. ISBN 978-3-642-79220-5. [Google Scholar]
  49. Hoffman, M.T. Water Scarcity, Land Degradation and Desertification in the Mediterranean Region: Environmental and Security Aspects. Afr. J. Range Forage Sci. 2009, 26, 193–194. [Google Scholar] [CrossRef]
  50. Vogel, J.; Paton, E.; Aich, V.; Bronstert, A. Increasing Compound Warm Spells and Droughts in the Mediterranean Basin. Weather Clim. Extrem. 2021, 32, 100312. [Google Scholar] [CrossRef]
  51. Lloyd-Hughes, B.; Saunders, M.A. A Drought Climatology for Europe. Int. J. Climatol. 2002, 22, 1571–1592. [Google Scholar] [CrossRef]
  52. Spinoni, J.; Naumann, G.; Vogt, J.V.; Barbosa, P. The Biggest Drought Events in Europe from 1950 to 2012. J. Hydrol. Reg. Stud. 2015, 3, 509–524. [Google Scholar] [CrossRef]
  53. Spinoni, J.; Naumann, G.; Carrao, H.; Barbosa, P.; Vogt, J. World Drought Frequency, Duration, and Severity for 1951–2010. Int. J. Climatol. 2014, 34, 2792–2804. [Google Scholar] [CrossRef]
  54. Ionita, M.; Nagavciuc, V. Changes in Drought Features at the European Level over the Last 120 Years. Nat. Hazards Earth Syst. Sci. 2021, 21, 1685–1701. [Google Scholar] [CrossRef]
  55. Ekolu, J.; Dieppois, B.; Sidibe, M.; Eden, J.M.; Tramblay, Y.; Villarini, G.; Peña-Angulo, D.; Mahé, G.; Paturel, J.-E.; Onyutha, C.; et al. Long-Term Variability in Hydrological Droughts and Floods in Sub-Saharan Africa: New Perspectives from a 65-Year Daily Streamflow Dataset. J. Hydrol. 2022, 613, 128359. [Google Scholar] [CrossRef]
  56. Tsakiris, G.; Vangelis, H. Towards a Drought Watch System Based on Spatial SPI. Water Resour. Manag. 2004, 18, 1–12. [Google Scholar] [CrossRef]
  57. González-Hidalgo, J.C.; Vicente-Serrano, S.M.; Peña-Angulo, D.; Salinas, C.; Tomas-Burguera, M.; Beguería, S. High-Resolution Spatio-Temporal Analyses of Drought Episodes in the Western Mediterranean Basin (Spanish Mainland, Iberian Peninsula). Acta Geophys. 2018, 66, 381–392. [Google Scholar] [CrossRef]
  58. Harris, I.; Osborn, T.J.; Jones, P.; Lister, D. Version 4 of the CRU TS Monthly High-Resolution Gridded Multivariate Climate Dataset. Sci. Data 2020, 7, 109. [Google Scholar] [CrossRef] [PubMed]
  59. Hamed, K.H. Trend Detection in Hydrologic Data: The Mann–Kendall Trend Test under the Scaling Hypothesis. J. Hydrol. 2008, 349, 350–363. [Google Scholar] [CrossRef]
  60. Sen, P.K. Estimates of the Regression Coefficient Based on Kendall’s Tau. J. Am. Stat. Assoc. 1968, 63, 1379–1389. [Google Scholar] [CrossRef]
  61. Theil, H. A Rank-Invariant Method of Linear and Polynomial Regression Analysis. In Henri Theil’s Contributions to Economics and Econometrics: Econometric Theory and Methodology; Raj, B., Koerts, J., Eds.; Advanced Studies in Theoretical and Applied Econometrics; Springer: Dordrecht, The Netherlands, 1992; pp. 345–381. ISBN 978-94-011-2546-8. [Google Scholar]
  62. Wilson, G.T. Time Series Analysis: Forecasting and Control, 5th ed.; George, E.P.B., Gwilym, M.J., Gregory, C.R., Greta, M.L., Eds.; John Wiley and Sons Inc.: Hoboken, NJ, USA, 2015; p. 712. ISBN 978-1-118-67502-1. [Google Scholar] [CrossRef]
  63. Chatfield, C. The Analysis of Time Series: An Introduction, 6th ed.; Chapman and Hall/CRC: New York, NY, USA, 2003; ISBN 978-0-429-20870-6. [Google Scholar]
  64. Hyndman, R.J.; Athanasopoulos, G. Forecasting: Principles and Practice; OTexts: Melbourne, Australia, 2018. [Google Scholar]
  65. Karavitis, C.A.; Alexandris, S.; Tsesmelis, D.E.; Athanasopoulos, G. Application of the Standardized Precipitation Index (SPI) in Greece. Water 2011, 3, 787–805. [Google Scholar] [CrossRef]
  66. Guttman, N.B. Accepting the Standardized Precipitation Index: A Calculation Algorithm1. JAWRA J. Am. Water Resour. Assoc. 1999, 35, 311–322. [Google Scholar] [CrossRef]
  67. McKee, T.B.; Doesken, N.J.; Kleist, J. The Relationship of Drought Frequency and Duration to Time Scales; Colorado State University: Anaheim, CA, USA, 1993; pp. 179–184. [Google Scholar]
  68. Palmer, W.C. Keeping Track of Crop Moisture Conditions, Nationwide: The New Crop Moisture Index. Weatherwise 1968, 21, 156–161. [Google Scholar] [CrossRef]
  69. Bordi, I.; Fraedrich, K.; Petitta, M.; Sutera, A. Large-Scale Assessment of Drought Variability Based on NCEP/NCAR and ERA-40 Re-Analyses. Water Resour. Manag. 2006, 20, 899–915. [Google Scholar] [CrossRef]
  70. Capra, A.; Scicolone, B. Spatiotemporal Variability of Drought on a Short–Medium Time Scale in the Calabria Region (Southern Italy). Appl Clim. 2012, 110, 471–488. [Google Scholar] [CrossRef]
  71. Thom, H.C. A Note on the Gamma Distribution. Mon. Weather Rev. 1958, 86, 117–122. [Google Scholar] [CrossRef]
  72. Edwards, D.C.; McKee, T.B. Characteristics of 20th Century Drought in the United States at Multiple Time Scales (No. AFIT-97-051). Master’s Thesis, Air Force Inst Tech Wright-Patterson Afb Oh, Fort Collins, CO, USA, May 1997. [Google Scholar]
  73. Abramowitz, M.; Stegun, I.A. With Formulas, Graphs, and Mathematical Tables. Natl. Bur. Stand. Appl. Math. Series E 1965, 55, 953. [Google Scholar]
  74. Shepard, D. A Two-Dimensional Interpolation Function for Irregularly-Spaced Data. In Proceedings of the 1968 23rd ACM National Conference, New York, NY, USA, 27–29 August 1968; Association for Computing Machinery: New York, NY, USA, 1968; pp. 517–524. [Google Scholar]
  75. Payab, A.H.; Türker, U. Analyzing Temporal–Spatial Characteristics of Drought Events in the Northern Part of Cyprus. Env. Dev. Sustain. 2018, 20, 1553–1574. [Google Scholar] [CrossRef]
  76. Pashiardis, S.; Michaelides, S. Implementation of the Standardized Precipitation Index (SPI) and the Reconnaissance Drought Index (RDI) for Regional Drought Assessment: A Case Study for Cyprus. Eur. Water 2008, 23, 57–65. [Google Scholar]
  77. Michaelides, S.; Pashiardis, S. Monitoring Drought in Cyprus during the 2007-2008 Hydrometeorological Year by Using the Standardized Precipitation Index (SPI). Eur. Water 2008, 23, 123–131. [Google Scholar]
  78. Katsanos, D.; Retalis, A.; Tymvios, F.; Michaelides, S. Study of Extreme Wet and Dry Periods in Cyprus Using Climatic Indices. Atmos. Res. 2018, 208, 88–93. [Google Scholar] [CrossRef]
  79. Sirdas, S.; Sen, Z. Spatio-Temporal Drought Analysis in the Trakya Region, Turkey. Hydrol. Sci. J. 2003, 48, 809–820. [Google Scholar] [CrossRef]
  80. Mathbout, S.; Lopez-Bustins, J.A.; Royé, D.; Martin-Vide, J. Mediterranean-Scale Drought: Regional Datasets for Exceptional Meteorological Drought Events during 1975–2019. Atmosphere 2021, 12, 941. [Google Scholar] [CrossRef]
  81. Mathbout, S.; Lopez-Bustins, J.A.; Royé, D.; Martin-Vide, J.; Bech, J.; Rodrigo, F.S. Observed Changes in Daily Precipitation Extremes at Annual Timescale Over the Eastern Mediterranean During 1961–2012. Pure Appl. Geophys. 2018, 175, 3875–3890. [Google Scholar] [CrossRef]
  82. Cavus, Y.; Aksoy, H. Spatial Drought Characterization for Seyhan River Basin in the Mediterranean Region of Turkey. Water 2019, 11, 1331. [Google Scholar] [CrossRef]
Figure 1. Study area with the CRU centroid points precipitation trend analysis and the mean annual precipitation 1901–2020.
Climate 11 00095 g001
Figure 2. Timeseries of SPI (3, 6, 12, and 24 months) the CRU sampling point with trendline corresponding to Nicosia, Cyprus.
Climate 11 00095 g002
Figure 3. Map showing consecutive months of drought with values less than −1 for SPI 3, 6, 12, and 24.
Climate 11 00095 g003
Figure 4. Capture maps of the number of occurrences of values less than −2 for SPI 3, 6, 12, and 24.
Climate 11 00095 g004
Table 1. Classification of drought according to SPI values [67].
SPIClass
>2Extremely wet
1.50–1.99Very wet
1.00–1.49Moderately wet
0.50–0.99Mildly wet
−0.49–0.49Normal conditions
−0.50–−0.99Mild drought
−1.00–−1.49Moderate drought
−1.50–−1.99Severe drought
<−2.00Extreme drought
Table 2. Trend analysis of monthly precipitation for the CRU sampling points—cities (1901–2020).
CountriesCitiesΤrendp-ValueNormalized Test Statistics
CyprusNicosiano trend0.814−0.235
EgyptCairodecreasing0.018−2.375
GreeceAthensno trend0.430−0.788
IsraelJerusalemno trend0.251−1.148
JordanAmmanno trend0.308−1.019
LebanonBeirutno trend0.167−1.383
LibyaTripolino trend0.371−0.894
SyriaDamascusno trend0.150−1.439
TurkeyConstantinopleno trend0.687−0.402
Disclaimer/Publisher’s Note: The statements, opinions and data contained in all publications are solely those of the individual author(s) and contributor(s) and not of MDPI and/or the editor(s). MDPI and/or the editor(s) disclaim responsibility for any injury to people or property resulting from any ideas, methods, instructions or products referred to in the content.

