Article

Temperature, Humidity and Air Pollution Relationships during a Period of Rainy and Dry Seasons in Lagos, West Africa

by
Nwabueze Emekwuru
1,* and
Obuks Ejohwomu
2
1
School of Mechanical Engineering, Coventry University, Coventry CV1 5FB, UK
2
School of Mechanical, Aerospace and Civil Engineering, The University of Manchester, Manchester M13 9PL, UK
*
Author to whom correspondence should be addressed.
Climate 2023, 11(5), 113; https://doi.org/10.3390/cli11050113
Submission received: 24 March 2023 / Revised: 12 May 2023 / Accepted: 17 May 2023 / Published: 21 May 2023
(This article belongs to the Section Weather, Events and Impacts)

Abstract

:
Air pollution is a concern in the West Africa region where it is known that meteorological parameters such as ambient temperature and humidity can affect the particulate matter loading through atmospheric convection and dry deposition. In this study, we extend the investigation of these relationships to particulate matter less than 1 µm in diameter (PM1), nitrogen dioxide (NO2), nitrogen monoxide (NO) and ozone (O3), for a complete period of rainy and dry seasons in Lagos. Regression analysis of the results indicate that there is a negligible to weak correlation (r < 0.39) between the temperature, humidity and air pollutants during the year, except for NO2 and O3 which respond moderately to humidity during the dry season, an observation previously unreported. The mean monthly values for all the air pollutants are lower during the rainy season compared to the dry season, indicating a potential higher contribution of the transport of pollutants from the north-eastern desert regions and the reduction of the wet removal of particles during the dry season. The World Health Organization air quality guidelines are mostly exceeded for fine particles with diameters less than 2.5 µm (PM2.5), supporting previous studies, as well as for the NO2 concentration levels. As PM2.5 contributes to at least 70% of the particulate matter pollution throughout the year, policy guidelines could be enacted for people with chronic respiratory issues during the January/February months of intense high air pollution, high temperature but low humidity values.

1. Introduction

Air pollution has been shown to be detrimental to human health, including on occupational health in West Africa [1]. Air pollutants can be classed as primary (e.g., nitrogen oxides (NOx); particulate matter (PM)), or as secondary if they are as consequences of chemical reactions in the lower atmosphere (e.g., ozone (O3)) [2]. The atmosphere is a medium in which air pollutants are dispersed away from their sources [3] and as meteorological parameters such as temperature, and humidity vary daily, it is important to consider their relationship with air pollutants.
Several studies have presented the influence of meteorological parameters on air pollution. For instance, some studies have observed that temperature and sunshine duration had the strongest influence on the local surface O3 concentration while the impacts of relative humidity and precipitation were weak and the impact of wind speed varied greatly between the cities in the Shanxi Province in China [4]. In the study, if local surface O3 concentration in a city in the Shanxi Province was significantly correlated with meteorological parameters that impacted photochemical reactions (e.g., temperature and sunshine duration), then the O3 pollution was regarded to be mainly brought about by local photochemical build up; otherwise, regional wind direction and speed were the main attributes [4]. All the monitoring stations used for the study were located in urban areas, therefore the meteorological interactions between urban, and rural areas that affect the photochemical processes that determine the O3 production were not included in the results.
Studies on the association of PM concentration levels and the meteorological parameters are common as PM is considered impactful [5,6,7]. The results from the evaluation of the temperature and humidity effects on PM concentrations in Auckland, New Zealand showed that the temperature values had a negative correlation with the PM10 concentration values over a diurnal period and that the relative humidity generally presented a positive correlation with PM10, but this correlation ceased beyond the 75% relative humidity value [5]. The researchers posited that this is because with increasing humidity levels, moisture particles increasingly grow in size until they reach a threshold where dry deposition happens, therefore reducing the PM10 concentrations in the atmosphere. The natural deposition of PM is affected by relative humidity and atmospheric PM concentration increases as the moisture particles adhere to PM [5]; this study was carried out over an eight-week period. The influences of temperature, relative humidity, wind speed, and wind direction on PM10 concentrations were evaluated in a study in urban and rural environments in İzmir, Türkiye [6]. The levels of relative humidity were found to be the most influencing factors on the PM10 concentration levels in both the urban and rural environments, however the recorded temperature values were not found to have any statistically significant effect on the PM10 concentration levels. The researchers indicated that incorporating further meteorological parameters such as atmospheric pressure and precipitation would improve the regression models presented in the study [6].
Air pollution studies in West Africa have been carried out in the past, but fewer studies exist on the correlations between meteorological parameters and air pollution. In [8], the correlation between temperature, humidity and PM (PM1, PM2.5, PM10) was studied using data from five monitoring centres in five states (Osun, Kebbi, FCT, Delta, Lagos) in Nigeria, West Africa. One of the five stations was located further north of the country where there are short rainy seasons (four months), compared to one in the centre of the country (7 months of the rainy season) and the three of the stations in the south west of the country (8 months). The results indicated strong correlations between all the PM sizes (PM1, PM2.5, PM10) and relative humidity in Delta. However, for the other states, the correlations were weak. The studies presented weak correlations between the PM sizes (PM1, PM2.5, PM10) and the ambient temperature values for all five sites in the states [8]. The studies, however, were carried out over different periods at the five sites, ranging from 2 (Kebbi) to 7 months (Abuja).
The influences of the wind direction and speed, rainfall, ambient temperature and relative humidity on the PM2.5, and PM10 concentration values were presented in a study at an urban site in Port Harcourt, West Africa [9]. It was reported that the wind speed, rainfall and ambient temperature all significantly affected the PM2.5, and PM10 concentration values but with weak correlations. The observed relative humidity values showed a weak but significant correlation with PM10 concentration values and a weak but insignificant correlation with PM2.5 concentration values. The study was carried out over a period of 8 months. A similar study at Akure, West Africa [10] found weak correlations between the values of wind speed, humidity, temperature and the PM10 and PM2.5 concentration values. An earlier study at Ile-Ife, West Africa [11] had similar results but only 162 samples of PM (PM2.5, and PM10) were collected over 10 months of the study.
The results from the studies of the relationships between meteorological parameters and air pollution can aid the development of air quality management plans [9], especially in West Africa where there is a dearth of local air quality monitoring stations [8]. The present study contributes to these by evaluating the relationships between temperature and humidity for not just PM10 and PM2.5 concentrations but also the NO, NO2, O3, and PM1 concentrations which are air pollutants that have been uncommonly studied in the region. Secondly, the study uses hourly data covering the complete dry and rainy seasons over a period of 12 months; typically, previous studies in this region have not presented such complete continuous data. Lastly, the location (Akoka/Lagos, the largest city in West Africa [1]) and use of calibrated sensors allow for a robust assessment of the results. The next section presents the materials and methods used for the study. A detailed assessment of the results, including the measures of central tendency and the temporal evolution of the air pollution then follows. The comparison of the results to previous studies is presented next and the conclusions section also presents suggestions for future work in this area.

2. Materials and Methods

2.1. Study Location

The data for this study were gathered in Lagos, a metropolitan city in the south-western part of Nigeria in West Africa. Lagos was chosen as a research site because it represents typical population exposure as the largest and most populous city in West Africa. This study made use of a 1 year (2020–2021) rainy and dry seasons data series of NO, NO2, O3, PM1, PM2.5, and PM10 levels, as well as meteorological data (temperature in °C, humidity in %). The air quality monitoring and weather stations at the University of Lagos (6.52 N, 3.40 E) was used to collect the data (Figure 1).

2.2. Air Quality Data

Air quality data (NO, NO2, O3, PM1, PM2.5, and PM10) required for this study were obtained from two sensors in monitoring stations situated at the University of Lagos, Akoka, in Lagos. Akoka Lagos is an urban background station located on the western edge of the campus, with the Lagos Lagoon situated about 2.4 km east of, and the Atlantic Ocean, about 13 km south of the station. There are roads, trees and buildings within 10 m of the location. The altitude is about 4 m above sea level. Hourly mean values of the air quality data (NO, NO2, O3, PM1, PM2.5, and PM10) were collected for 7885 h from July 2020 to August 2021 (excluding ~720 h between October and November 2020 for maintenance and re-calibration) using Zephyr® air quality sensors [12] with some of the specifications presented in Table 1.

2.3. Temperature and Humidity Data

Hourly ambient temperature and ambient humidity data (for 7885 h, corresponding to the NO, NO2, O3, PM1, PM2.5, and PM10 data) from July 2020 to August 2021 were also collected from the University of Lagos, Akoka, monitoring stations housing the air quality sensors as stated above. This system had the advantage of collecting the air quality and metrological data from the same location.

2.4. Climate and Season Definitions

The definitions of the climate and seasons in Lagos were made using the Köppen-Geiger climate classification system [13]. The procedure is as presented in Figure 2 using data from Table 2. The precipitation and ambient temperature data (Table 2) for the classification were taken from available historical (2005–2015) annual weather averages [14]. Using the classification from [13], summer (winter) is taken as the six-month period that is hotter (colder) between April to September and October to March and both the historical [14] and collected data in this study suggest that the April to September period is the Winter season whilst the October to March period is the Summer season. These are called the rainy/wet (April to September; historical average precipitation 134.2 mm [14]) and the dry (October to March; historical average precipitation 84.9 mm [14]) seasons, respectively. Thus, using these classifications and procedures (see Figure 2) the climate at the University of Lagos, Akoka stations used for this study can be classified as Tropical Savannah [Aw].

2.5. Data Analysis

A simple linear regression model was used to determine the relationship between the hourly average ambient temperature and humidity values and the air pollution levels in Lagos, so as to draw attention to any possible correlation between the ambient temperature and humidity and the air pollutants during the rainy and wet seasons. The statistical analyses were performed using the Data Analysis Tool application in Microsoft Excel software [15]. The definitions of the correlation coefficient thresholds were adapted from [16] and presented in Table 3 below.
A null hypothesis is constructed for the analysis as follows:
H0. 
“There is no statistical significance between the independent meteorological variable and the air pollutant.”
where “independent meteorological variable” = (ambient temperature, ambient humidity) and “air pollutant” = (NO, NO2, O3, PM1, PM2.5, and PM10).
H0: r = 0
where r is the correlation coefficient.
To test the null hypothesis, a significance level of 5% is selected, in a two-tailed test. This choice of an alpha (α) value (significance level) of 0.05 is common and for the study presented here is based on arguments presented in [17,18] as being a reasonable cut-off for statistical significance. The null hypothesis is accepted if the p-value is greater than 0.05. The level of statistical significance attached to the relationships is described as presented in Table 4 below.

3. Results

3.1. Measures of Central Tendency of Air Pollutants, Temperature and Humidity

The results presented in this study cover the period between July 2020 and June 2021, encompassing a complete period of rainy and dry seasons. The data presented were collected over 4256 h over the rainy season and 3629 h during the dry season, for a total of 7885 h of data collection (Table 5 and Table 6).

3.1.1. Measured Air Pollutant Concentrations Levels and the WHO AQG

The measured mean values of the concentration of all the air pollutants (excluding O3), for both the rainy and dry seasons (Table 5 and Table 6), exceeded the World Health Organization (WHO) recommended Air Quality Guidelines (AQG) [19] levels, for both the annual and 24 h averaging times. For example, during the dry season, the AQG 24 h averaging time concentration level was exceeded 87.1% of the total number of hours for the study for PM2.5, 18.3% for PM10, and 89.0% for NO2. In contrast this was exceeded for just 1% of the period for O3 (Table 7). However, this is not unusual in the West Africa region, out of more than 20 air pollution monitoring sites reported in the region [8,9,10,11,20], only one, the monitoring site at Osun [8], recorded mean PM10 concentration levels (20.4 µg/m3 measured over 4 months) that were below the WHO AQG annual level of 45 µg/m3 indicating the seriousness of the levels of concentration of air pollutants in this region.

3.1.2. Descriptive Statistics of Temperature and Humidity

From Table 5 and Table 6, in both the rainy and dry seasons, the ambient temperature values ranged from 22.0 to 42.0 °C, though the mean and mode ambient temperature values were higher for the dry season (31.7 °C; 30.0 °C) compared to the rainy season (29.5 °C; 26.0 °C). These are similar to the mean ambient temperature values trends recorded over the 2005 to 2015 period by [14] in Ikeja/Lagos (see Table 2), where dry seasons were also hotter than the rainy seasons. A mean value of 33.4 °C, and a range of 26.7 to 42.8 °C (converted from the Fahrenheit scale data) were observed by [8] over a December to April (dry season) period from a site in Ikeja/Lagos which is ~15 km from the monitoring site presented in this study. In Akure, which is about 300 km south-west of Akoka Lagos, ambient temperature ranges of 22 to 27 °C (rainy season) and 33 to 35 °C (dry season) have been recorded [10]. The recorded ambient humidity values for the dry season (range 15.0 to 90.0%; mean 69.9%; mode 78.0%) were lower compared to those of the rainy season (range 35.0 to 97.0%; mean 76.6%; mode 87.0%). The dry season is characterized by prevailing north-easterly winds [21], including a period of “harmattan” from December to March bringing dry and dusty conditions across West Africa, therefore, there is a wider temperature range during the day (lower at night, higher during the day time) and lower humidity [22]. This is unlike winter seasons in which lower humidity values are accompanied by lower temperature values [22]. Others have recorded a mean relative humidity during a late December to April dry season period (corresponding incidentally to the harmattan phase of the season) in Lagos of 55.4% [8]. Thus, in this region, dry seasons present lower ambient humidity levels compared with the rainy seasons (see also [10]).

3.1.3. Descriptive Statistics of PM1/Coarse Particle Ratios

PM1 sized particles are more likely than PM2.5 or coarse (PM10) sized particles to pass through the nose and throat and enter the lungs and thus are of at least equal concern, hence they should be studied in this region. The observed mean PM1/coarse particle concentration ratios (PM1/PM10) for the rainy (0.53) and dry (0.62) seasons indicate that combustion and similar activities that produce very small particles contribute high proportions of the particulate concentrations in this area, more so during the dry season. A ratio of 0.63 was reported by [8], however this was during the dry season and for a duration of 2.5 months; these types of studies are rare in this region.

3.1.4. Descriptive Statistics of PM, and Fine/Coarse Particle Ratios

The mean fine/coarse particle concentration ratios (PM2.5/PM10) for both the rainy (0.72) and dry (0.70) seasons compare to another Lagos study (0.85 for 2.5 months during the dry season [8]), 0.87 over a week during the winter in New Zealand [5] and Akure [10] (ranging from 0.63 to 0.83 during the wet season and 0.65 to 0.73 during the dry season). However, in Port-Harcourt, this ratio ranges from 0.261 to 0.349 over 8 months [9].
Coarse particles are usually formed by mechanical activities, e.g., grinding or wind blowing, whereas fine particles are mostly formed in the atmosphere by chemical reactions and organic compounds. Thus, a high (PM2.5/PM10) ratio indicates significant contributions to the PM concentration from fine particles such as those from combustion sources, whereas a low (PM2.5/PM10) ratio indicates a higher contribution to the PM concentration from coarse particles such as those from re-suspended soil or road dust [23].
All the mean PM concentration values recorded during the dry season were at least ~1.3 times higher than those recorded during the rainy season (Table 5 and Table 6). The absence of intensive wet removal due to the rains [23] and long-range transport of pollutants from north-eastern desert regions [22] during this period may contribute to higher PM levels during the dry season. To test the later assumption, the directions and distances of the sources of the air parcel over the air pollutants measurement site in this study were computed using the Hybrid Single-Particle Lagrangian Integrated Trajectory (HYSPLIT) backward trajectory model [24,25], and the simulation results (Figure 3) indicate a contribution of north-eastern desert winds to the air mass over the site during the dry season. This seasonal variation of higher PM2.5 values during the dry season compared to lower ones during the rainy season was also observed at Ile Ife [11], about 210 km north-east of the Akoka Lagos site.

3.1.5. Descriptive Statistics of NO2, O3, and NO

The recorded mode values of the NO2, O3, and NO concentrations for the rainy season (30.0 µg/m3, 79.0 µg/m3, and 3.2 µg/m3, respectively) are similar to those of the dry season (30.0 µg/m3, 78.0 µg/m3 and 3.0 µg/m3, respectively), however the mean NO2 concentration value recorded during the rainy season (51.4 µg/m3) is higher than that recorded during the dry season (30.5 µg/m3), see also Figure 4, Figure 5 and Figure 6. This could be due to a period of 19 h in July 2020 in which the mean concentration values per hour of ~7000 (and for NO, ~450) µg/m3 were recorded and intense vehicular and other human activities occurred in preparation for an annual event close to the site, which might have contributed to these values. These values were within the measurement range of the sensors used for the study (Zephyr® [12] and Table 1: NO/NO2: range 0 to 20,000 µg/m3, estimated accuracy ±5 µg/m3) and these were co-located and calibrated (Root Mean Square Error (RMSE) 3.677 µg/m3) with reference units before the start of the data collection. The recorded mean O3 and NO concentration values were ~11% higher during the dry season compared to the rainy season (Table 5 and Table 6).

3.2. Temporal Variation of Air Pollutants, Temperature and Humidity

The temporal variation trends observed in Figure 4 and Figure 5 corroborate the observations presented in the “Measurements of central tendency” section. The mean monthly temperature versus air pollutant concentration values for both seasons are shown in Figure 4. For 3 (July to September) of the 6 months during the rainy season, the recorded mean monthly values fell below 30.0 °C, with the highest mean monthly value of 32.5 °C in April during the season, whereas during the dry season all the six months recorded mean temperature values above 30.0 °C with the hottest month being February (32.8 °C). Similarly for 3 (July to September) months of the 6 months of the rainy season, the recorded humidity levels were all above 80%, whereas during the dry season, the recorded values where all ~70%.
Generally, the monthly mean concentration values of the air pollutants are higher during the dry season compared to the rainy season (Figure 6) and as discussed in Section 3.1.3, Section 3.1.4, Section 4 and Section 5, these could have implications for human respiratory health. The monthly mean air pollutants concentration values remain relatively constant throughout the dry season except for spikes for the NO concentration in November (40.2 µg/m3), and for PM10 in January and February (42.8 µg/m3 and 42.1 µg/m3, respectively). For the rainy season the monthly mean air pollutants concentration values also remained relatively constant, although the monthly mean concentration of NO2 for July was 213.5 µg/m3 and the monthly mean concentration NO values fell in August and September (3.6 µg/m3 and 3.5 µg/m3, respectively). From Figure 6, it can be seen that the WHO AQG concentration level for PM2.5 was exceeded most of the time during the study year (see Section 3.1.1).

3.3. Temperature, Humidity and Air Pollution Relationships during the Rainy and Dry Seasons

From the details presented in Table 8, over the period covered in this study, the mean concentration value of NO2 was statistically significantly less (p < 0.0001) during the dry season than during the rainy season. Conversely, the mean concentration value of O3 was statistically significantly more (p < 0.0001) during the dry season than during the rainy season. There were no statistically significant differences in the mean concentration values, between the dry and rainy seasons, for NO (p = 0.3598), PM1 (p = 0.3528), PM2.5 (p = 0.3543), and PM10 (p = 0.1730).
The mean ambient temperature values were statistically more significant (p < 0.0001) during the dry season than during the rainy season. However, the ambient humidity values were statistically less significant (p < 0.0001) during the dry season compared to the rainy season (Table 8).

3.4. Correlation Analysis of Temperature, Humidity and Air Pollutants during the Rainy and Dry Seasons

Using linear regression analysis as described in the “Data Analysis” section, the relationships between the values of the concentrations of the air pollutants (NO2, O3, NO, PM1, PM2.5, PM10), and the measured ambient temperature and humidity values during the rainy and wet seasons are presented in Table 9 and Table 10, respectively. The results indicate that for the rainy season, most of the recorded values of the mean hourly concentration for the air pollutants are weakly correlated with the recorded hourly ambient temperature values and that these values are mostly statistically highly significant (Table 9). This observation is similarly observed during the dry season except for PM10 where negligible correlation with the ambient temperature values were observed (Table 10).
The results for the measured ambient humidity values from Table 9 and Table 10 during the rainy and dry seasons indicate that the mean hourly concentration for the air pollutants are, at most, moderately correlated with the recorded hourly ambient humidity values and that these values are mostly statistically highly significant.

3.4.1. Nitrogen Dioxide (NO2)

A negligible negative correlation exists between the mean concentration values of NO2 and the mean ambient temperature during the rainy season (Table 9) and this relationship is statistically significant (R2 = 0.0012; p = 0.021. (Table 11)). However, during the dry season (Table 10), there is a moderate positive correlation between the two parameters and the relationship is statistically highly significant (R2 = 0.3706; p = 0. (Table 11)). Thus, the variability of the NO2 concentration levels can be “explained” more by the ambient temperature values during the dry season than during the rainy season, for the periods the data were collected for this study. From Table 9, Table 10 and Table 11, the correlation between the mean hourly concentration of NO2 and the mean hourly ambient humidity levels is stronger during the dry season than during the rainy season and these are statistically highly significant (rainy season: R2 = 0.0034, p = 0.0001; dry season: R2 = 0.2339, p = <0.0001).

3.4.2. Ozone (O3)

Reviewing Table 9, Table 10 and Table 11, it is ascertained that a weak positive correlation exists between the mean concentration values of O3 and the mean ambient temperature during the rainy season and this relationship is statistically highly significant (R2 = 0.0432; p = <0.0001). The relationships during the dry season are similar (R2 = 0.0561; p = <0.0001). There is a moderate correlation (R2 = 0.2365) between the mean concentration of O3 and the mean humidity values across the dry season compared to weak correlation (R2 = 0.0241) for this relationship over the wet season. The relationship between both variables is statistically significant over both seasons (p = <0.0001).

3.4.3. Nitrogen Oxide (NO)

There is a weak correlation between the mean concentration values of NO (Table 9, Table 10 and Table 11) and the mean ambient temperature during the rainy and dry seasons and these relationships are statistically highly significant (rainy season: R2 = 0.0101, p = <0.0001; dry season: R2 = 0.0145, p = <0.0001). From Table 11, during the rainy season there is no statistical significance due to the weak correlation between the mean concentration of NO and the mean humidity levels (R2 = 0.0003, p = 0.298). Over the duration of the dry season, the weak relationship (R2 = 0.0305) between both variables does have a statistically high significance (p = <0.0001).

3.4.4. Particulate Matter (PM1, PM2.5, PM10)

Again, Table 9, Table 10 and Table 11 reveal that the correlation between the mean concentration values of PM1 and the mean ambient temperature during the rainy and dry seasons is weak and these relationships are statistically highly significant (rainy season: R2 = 0.0164, p = <0.0001; dry season: R2 = 0.0124, p = <0.0001).
The correlations between the mean concentration values of PM2.5 and PM10 and the mean ambient temperature during the rainy seasons are weak and statistically highly significant (PM2.5: R2 = 0.0584, p = <0.0001; PM10: R2 = 0.1364, p = <0.0001). During the rainy season the relationship between the PM10 concentration levels can be “explained” more by the ambient temperature values than that of the correlation between the PM2.5 concentration values and the ambient temperature, for the periods these were observed for this study.
During the dry season there is a negligible correlation between the mean PM2.5 concentration levels and the recorded ambient temperature and this is statistically highly significant (R2 = 0.0027; p = 0.0018). This relationship is similar for the mean PM10 concentration levels (R2 = 3.1 × 10⁻⁸; p = 0.9915), though it is not statistically significant.
There is a stronger relationship between the PM1 mean concentration values and the mean ambient humidity values during the rainy season (R2 = 0.0489) compared to that during the dry season (R2 = 0.0013). This trend is also observed for the cases of PM2.5 and PM10 for both seasons and the correlations are highly significant (Table 9, Table 10 and Table 11).

4. Discussion

The results of the analyses of the relationships between the values of the concentrations of the air pollutants (NO2, O3, NO, PM1, PM2.5, PM10), and the measured ambient temperature and humidity values during the rainy and wet seasons are compared to published work in this area in this section. Most of the work in literature has examined mainly PM2.5, and PM10 concentration values, thus there is limited data on correlations between ambient temperature and humidity values and NO2, O3, NO, and PM1 concentration values.
The results indicate that for the rainy season, the recorded values of the mean concentration for the air pollutants (NO2, O3, NO, PM1, PM2.5, PM10) are at best weakly correlated with both the recorded mean ambient temperature and humidity values and all of these values are at most statistically highly significant except for the correlation between NO and ambient humidity which is not statistically significant (Table 12). The study at Akure [10] is the closest comparison with the present work but only PM2.5, and PM10 concentration values were measured and these were determined to have a weak correlation with both the ambient temperature and humidity values and were all statistically insignificant. Thus, for the rainy season, the air pollutant concentration values in the present work and in published literature correlate weakly with both the ambient temperature and humidity.
The results for the dry season are less consistent (Table 12). For the air pollutants (O3, NO, PM1, PM2.5, PM10), the concentrations values are at most weakly correlated with the ambient temperature and humidity values and these are statistically highly significant at best, except for the correlation between O3 and ambient humidity (moderate) and the statistical significance of the relationship between PM10 and ambient temperature (insignificant). However, the concentration of NO2 responds moderately to changes in the ambient temperature and humidity and these are highly significant. A previous study in Lagos found weak correlations between the PM (PM1, PM2.5, PM10) concentrations and the ambient temperature and humidity values [8]. The observed PM (PM2.5, PM10) concentrations at Akure are also weakly correlated with the ambient temperature and humidity values and these are not statistically significant [10]. The relationship between the PM and humidity can depend on the rate of particulate absorption in the atmosphere, washout due to rainfall, and dry deposition of the particles due to high humidity [5,10,23]. The ambient temperature level can advance the photochemical reaction between particles and gases and atmospheric dispersion proceeds more effectively under hot air masses [10]. In summary for the dry season, the air pollutant concentrations present a weak correlation with the ambient temperature and humidity for the work presented here and for those published in literature, except for the observed NO2 concentration which correlate moderately with temperature and humidity.
Other studies exist in the literature which did not clearly delineate the rainy and dry seasons whilst evaluating the correlation effects of the meteorological parameters on the air pollutant concentrations. The studies at IIe-Ife showed that the concentration of PM2.5 is weakly correlated to both the ambient temperature and humidity values and these are not statistically significant [11]. For PM (PM2.5, PM10) concentrations in Port Harcourt [9], the relationship with ambient temperature and humidity is weak and statistically highly significant, however this is negligible and insignificant for ambient humidity and negligible and significant for PM10. Therefore, other studies from West Africa have shown that PM has a weak relationship with ambient temperature and humidity values (Table 12).

5. Conclusions

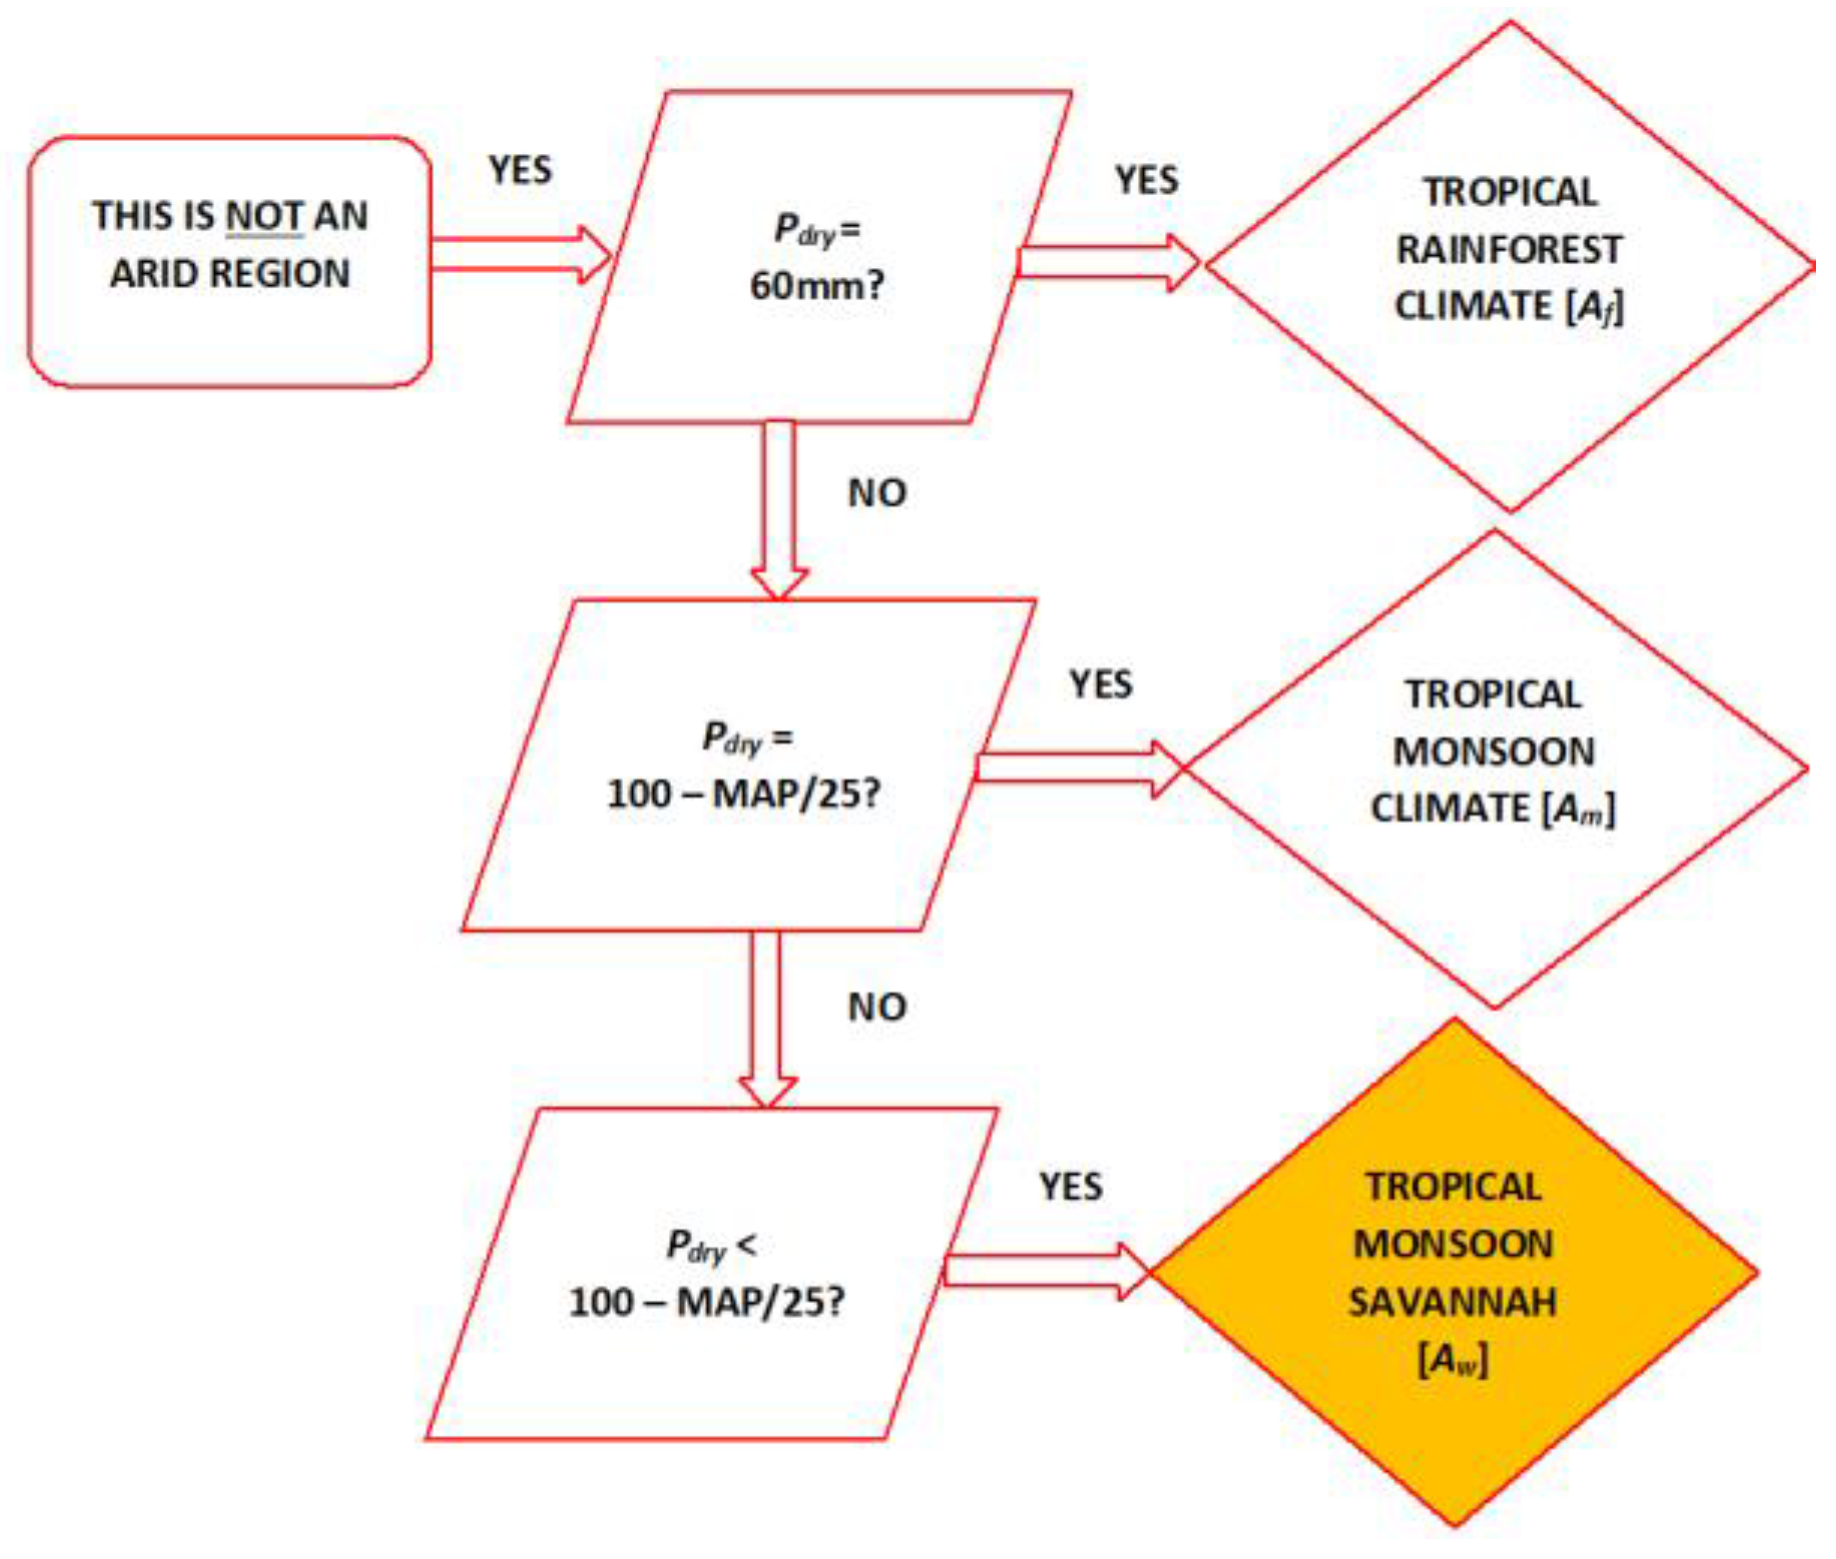
This work scrutinized the relationship between the ambient humidity, ambient temperature and air pollution during the rainy and dry seasons in Lagos, West Africa. The climate in Lagos was defined as Tropical Savannah, with the rainy (winter) season lasting from April to September and the dry (summer) season lasting from October to March.
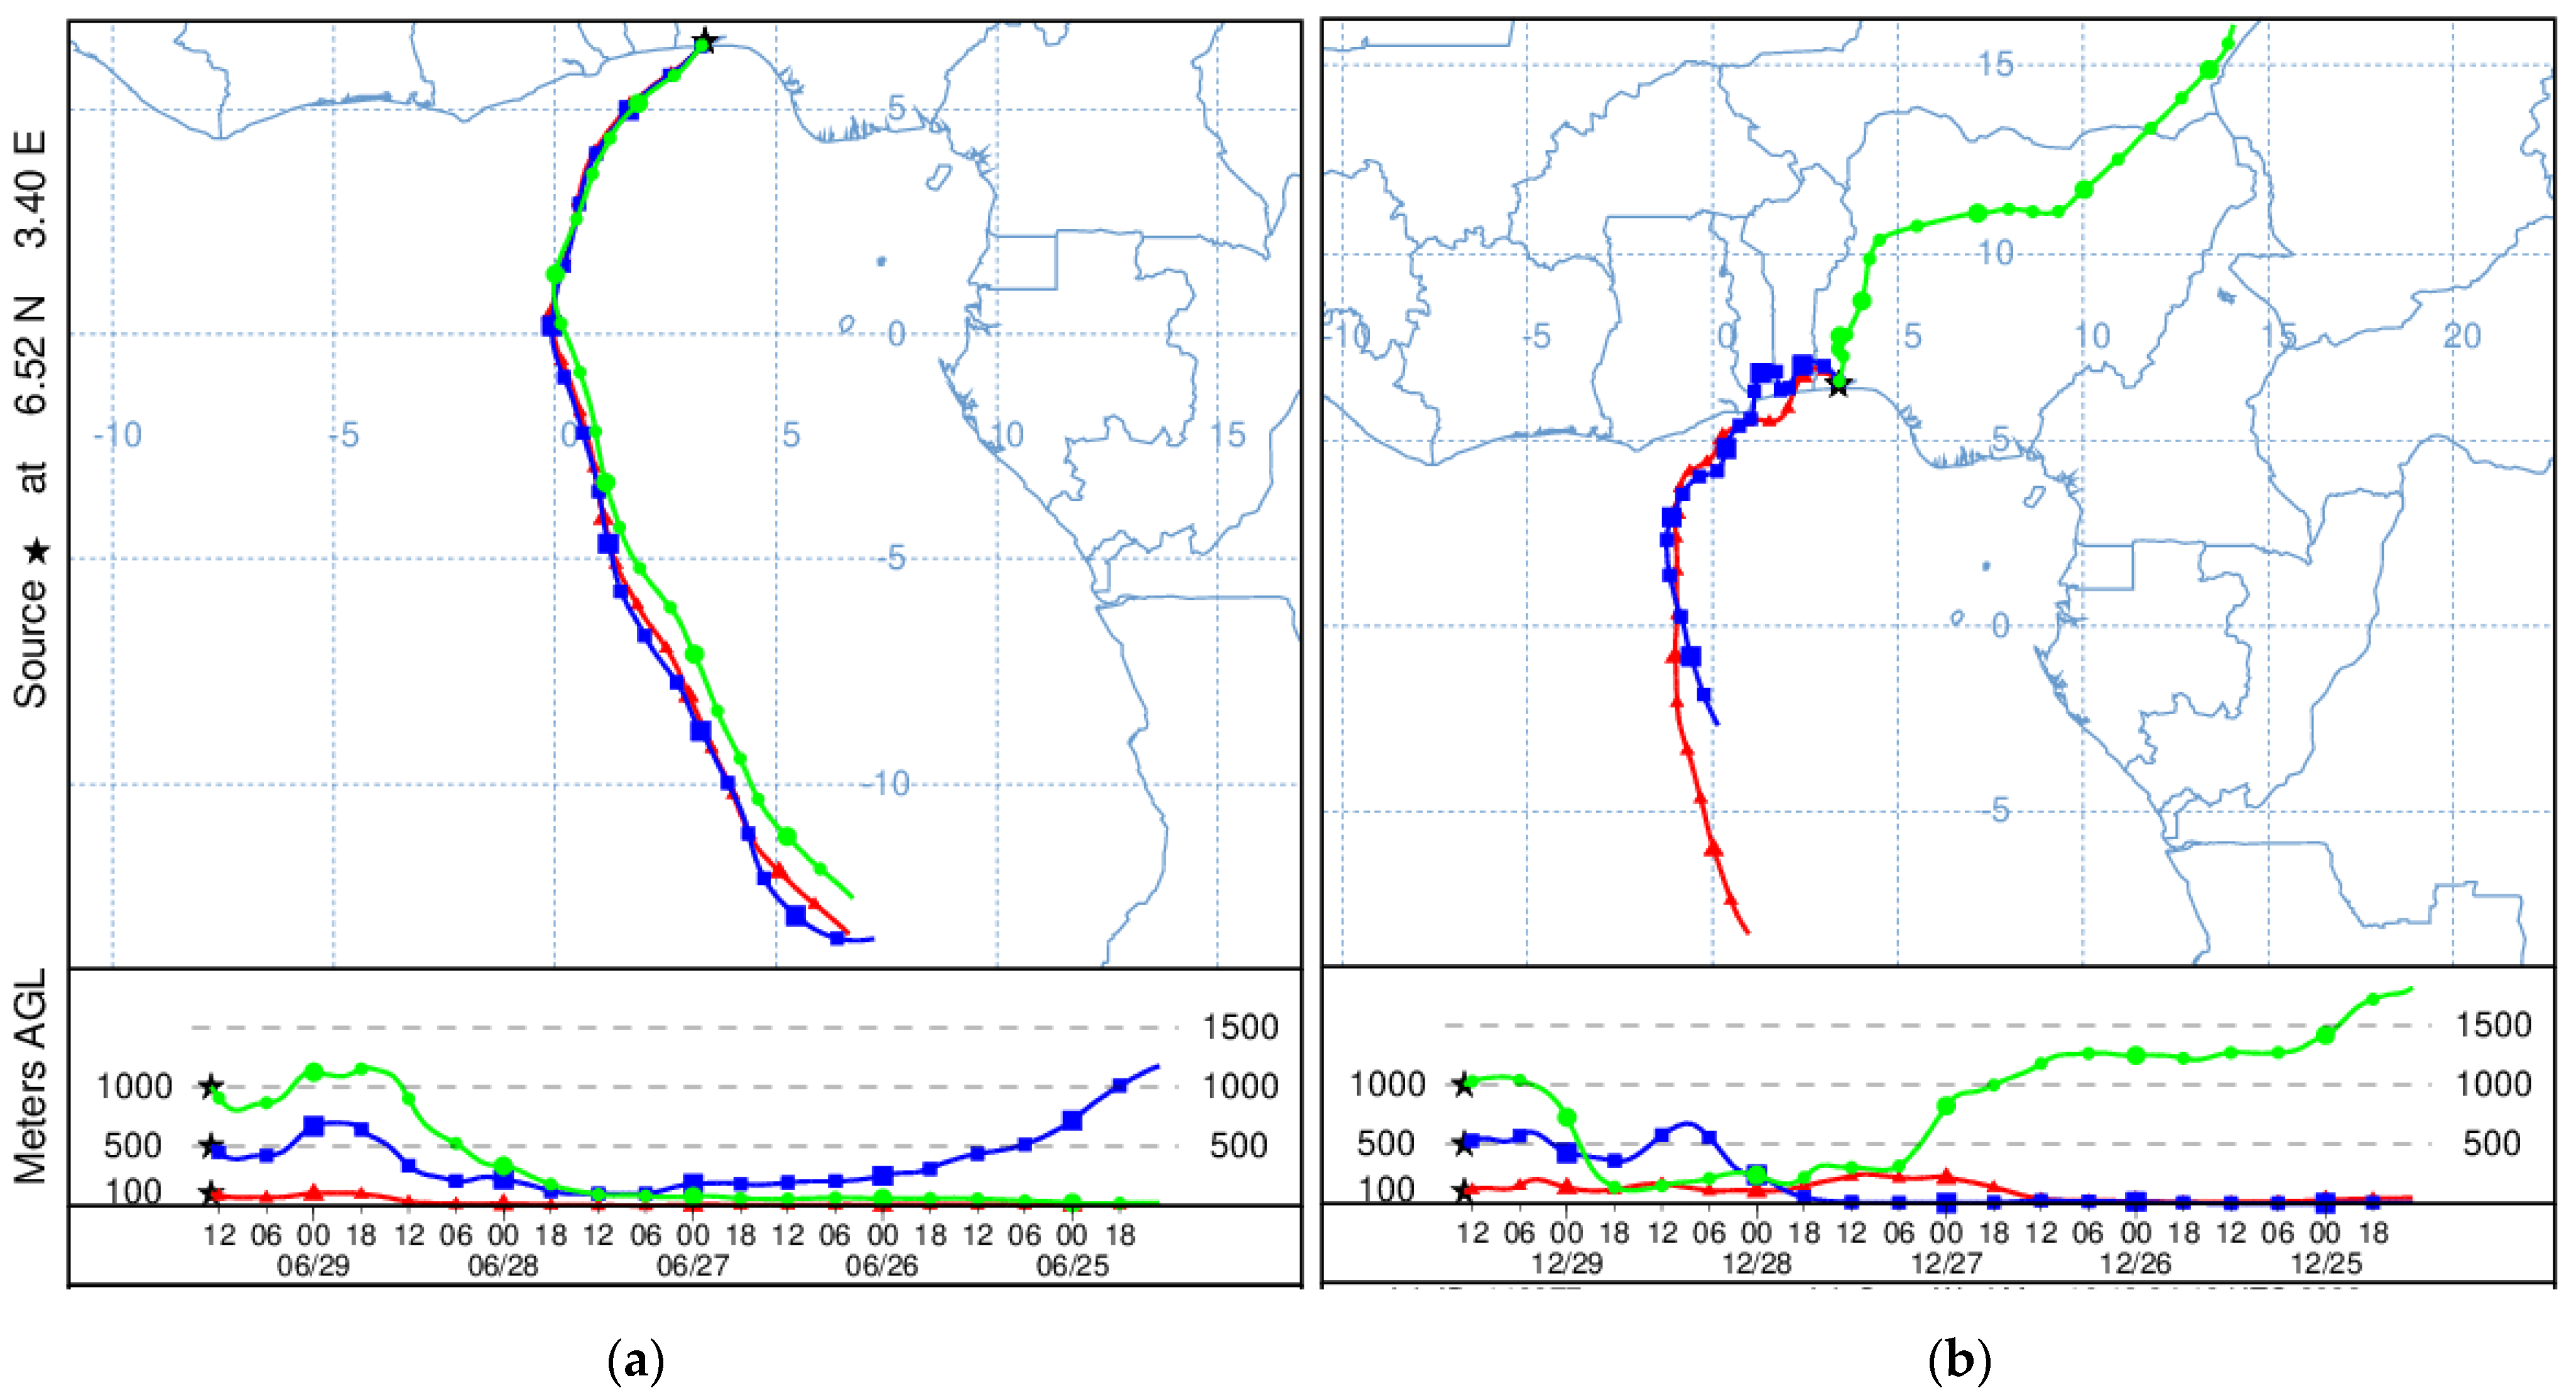
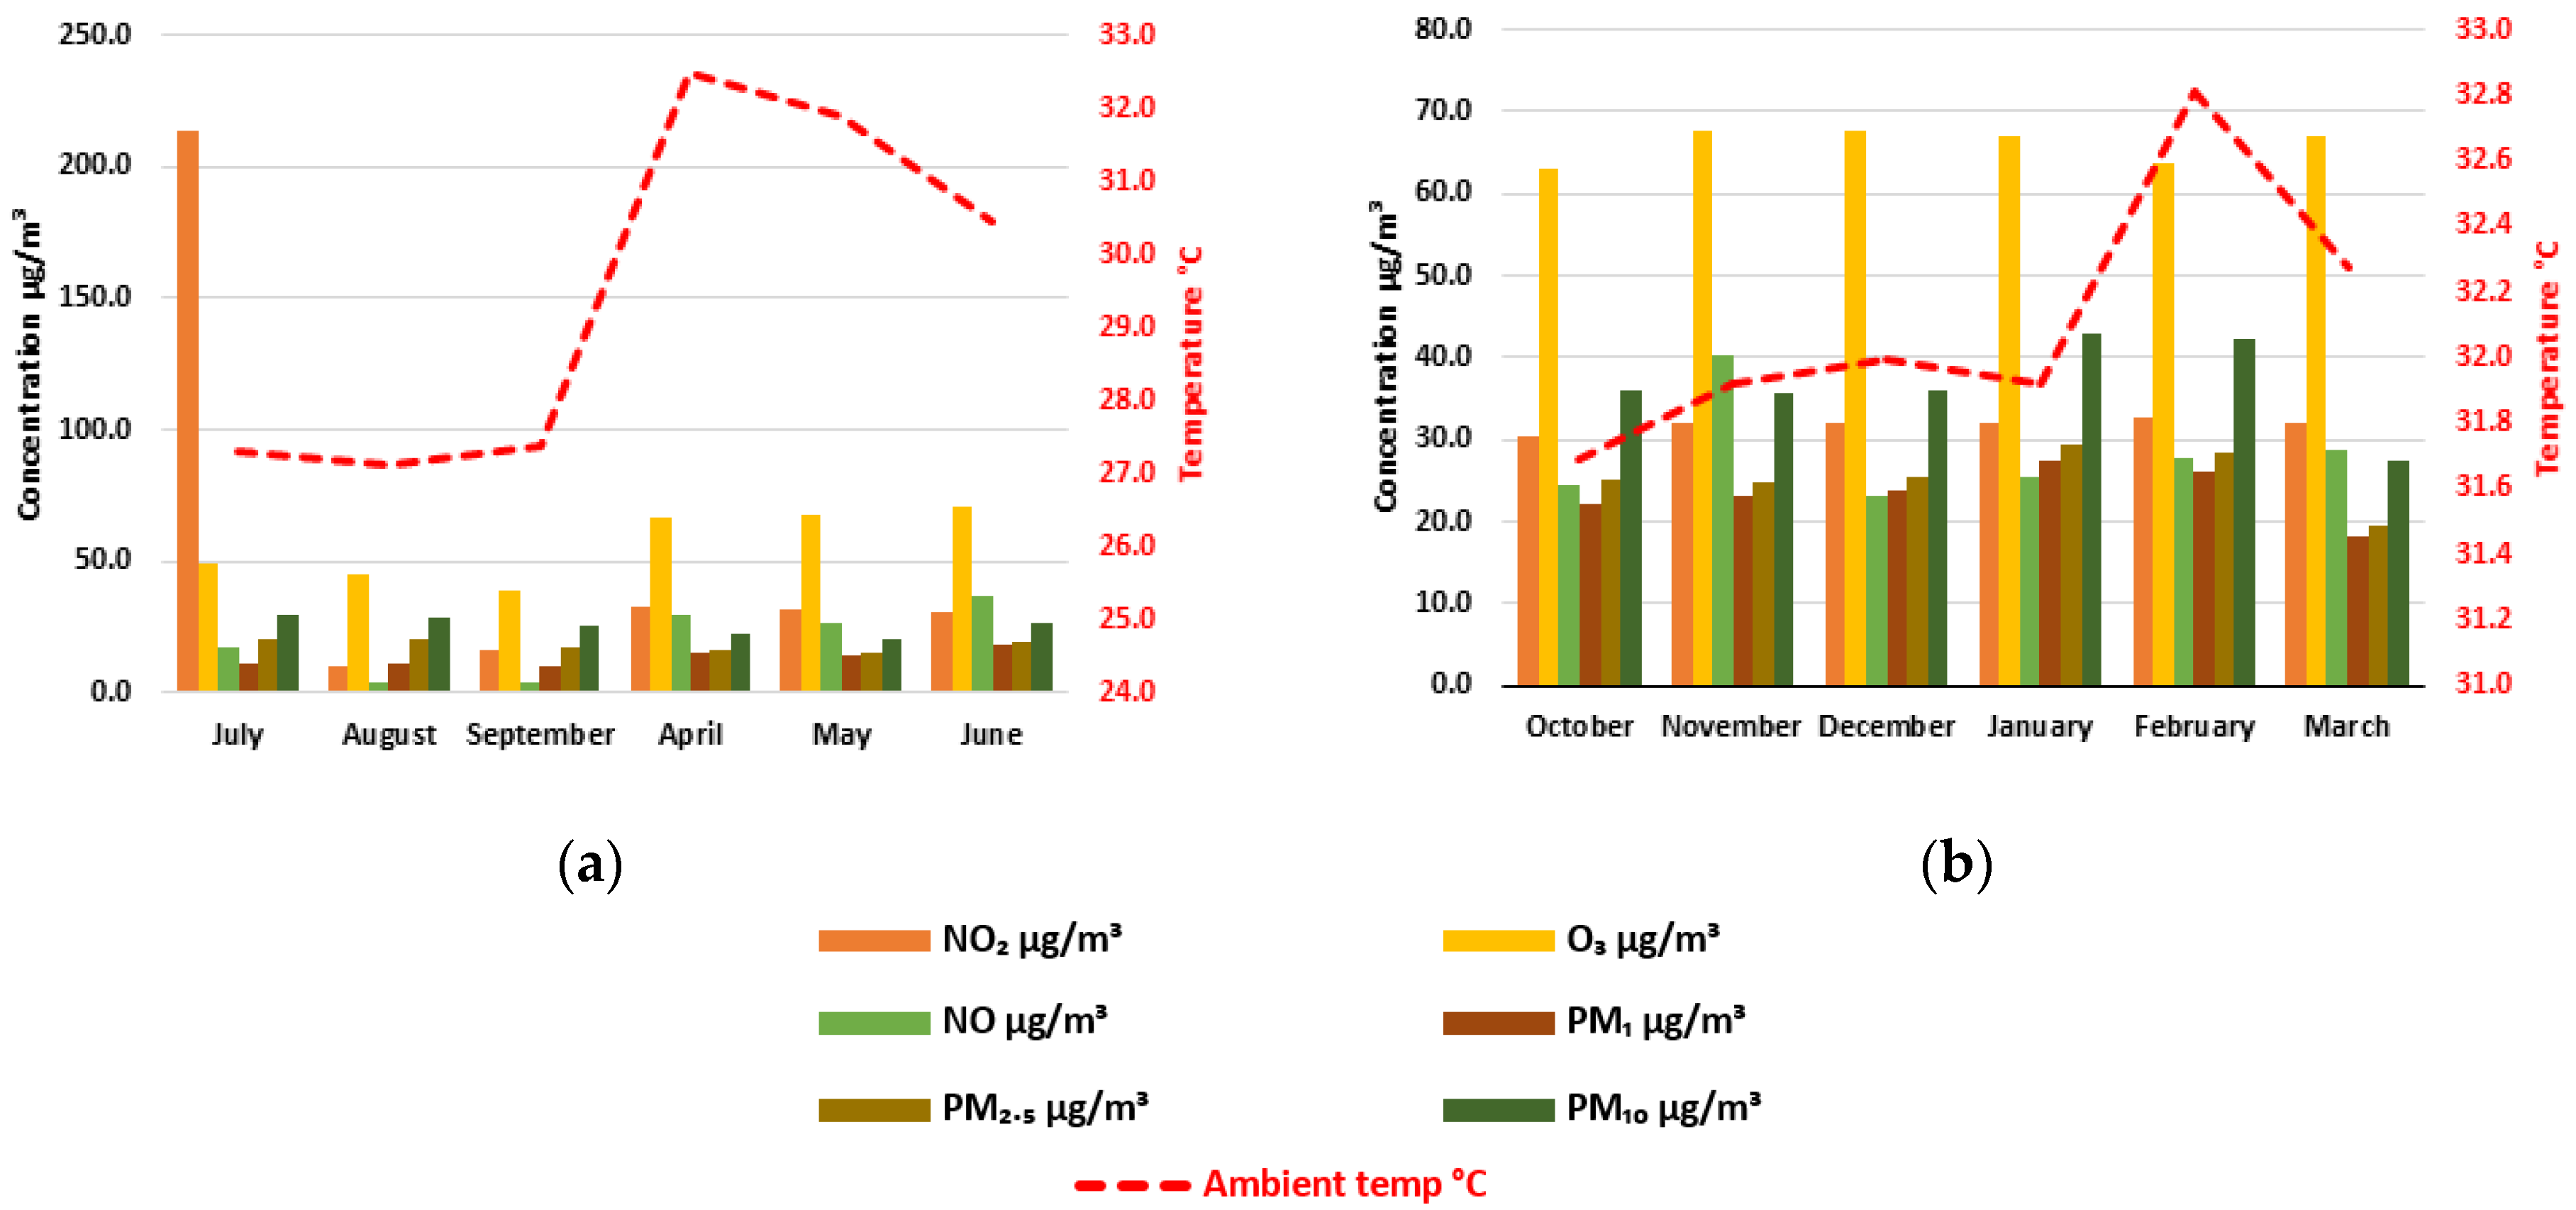
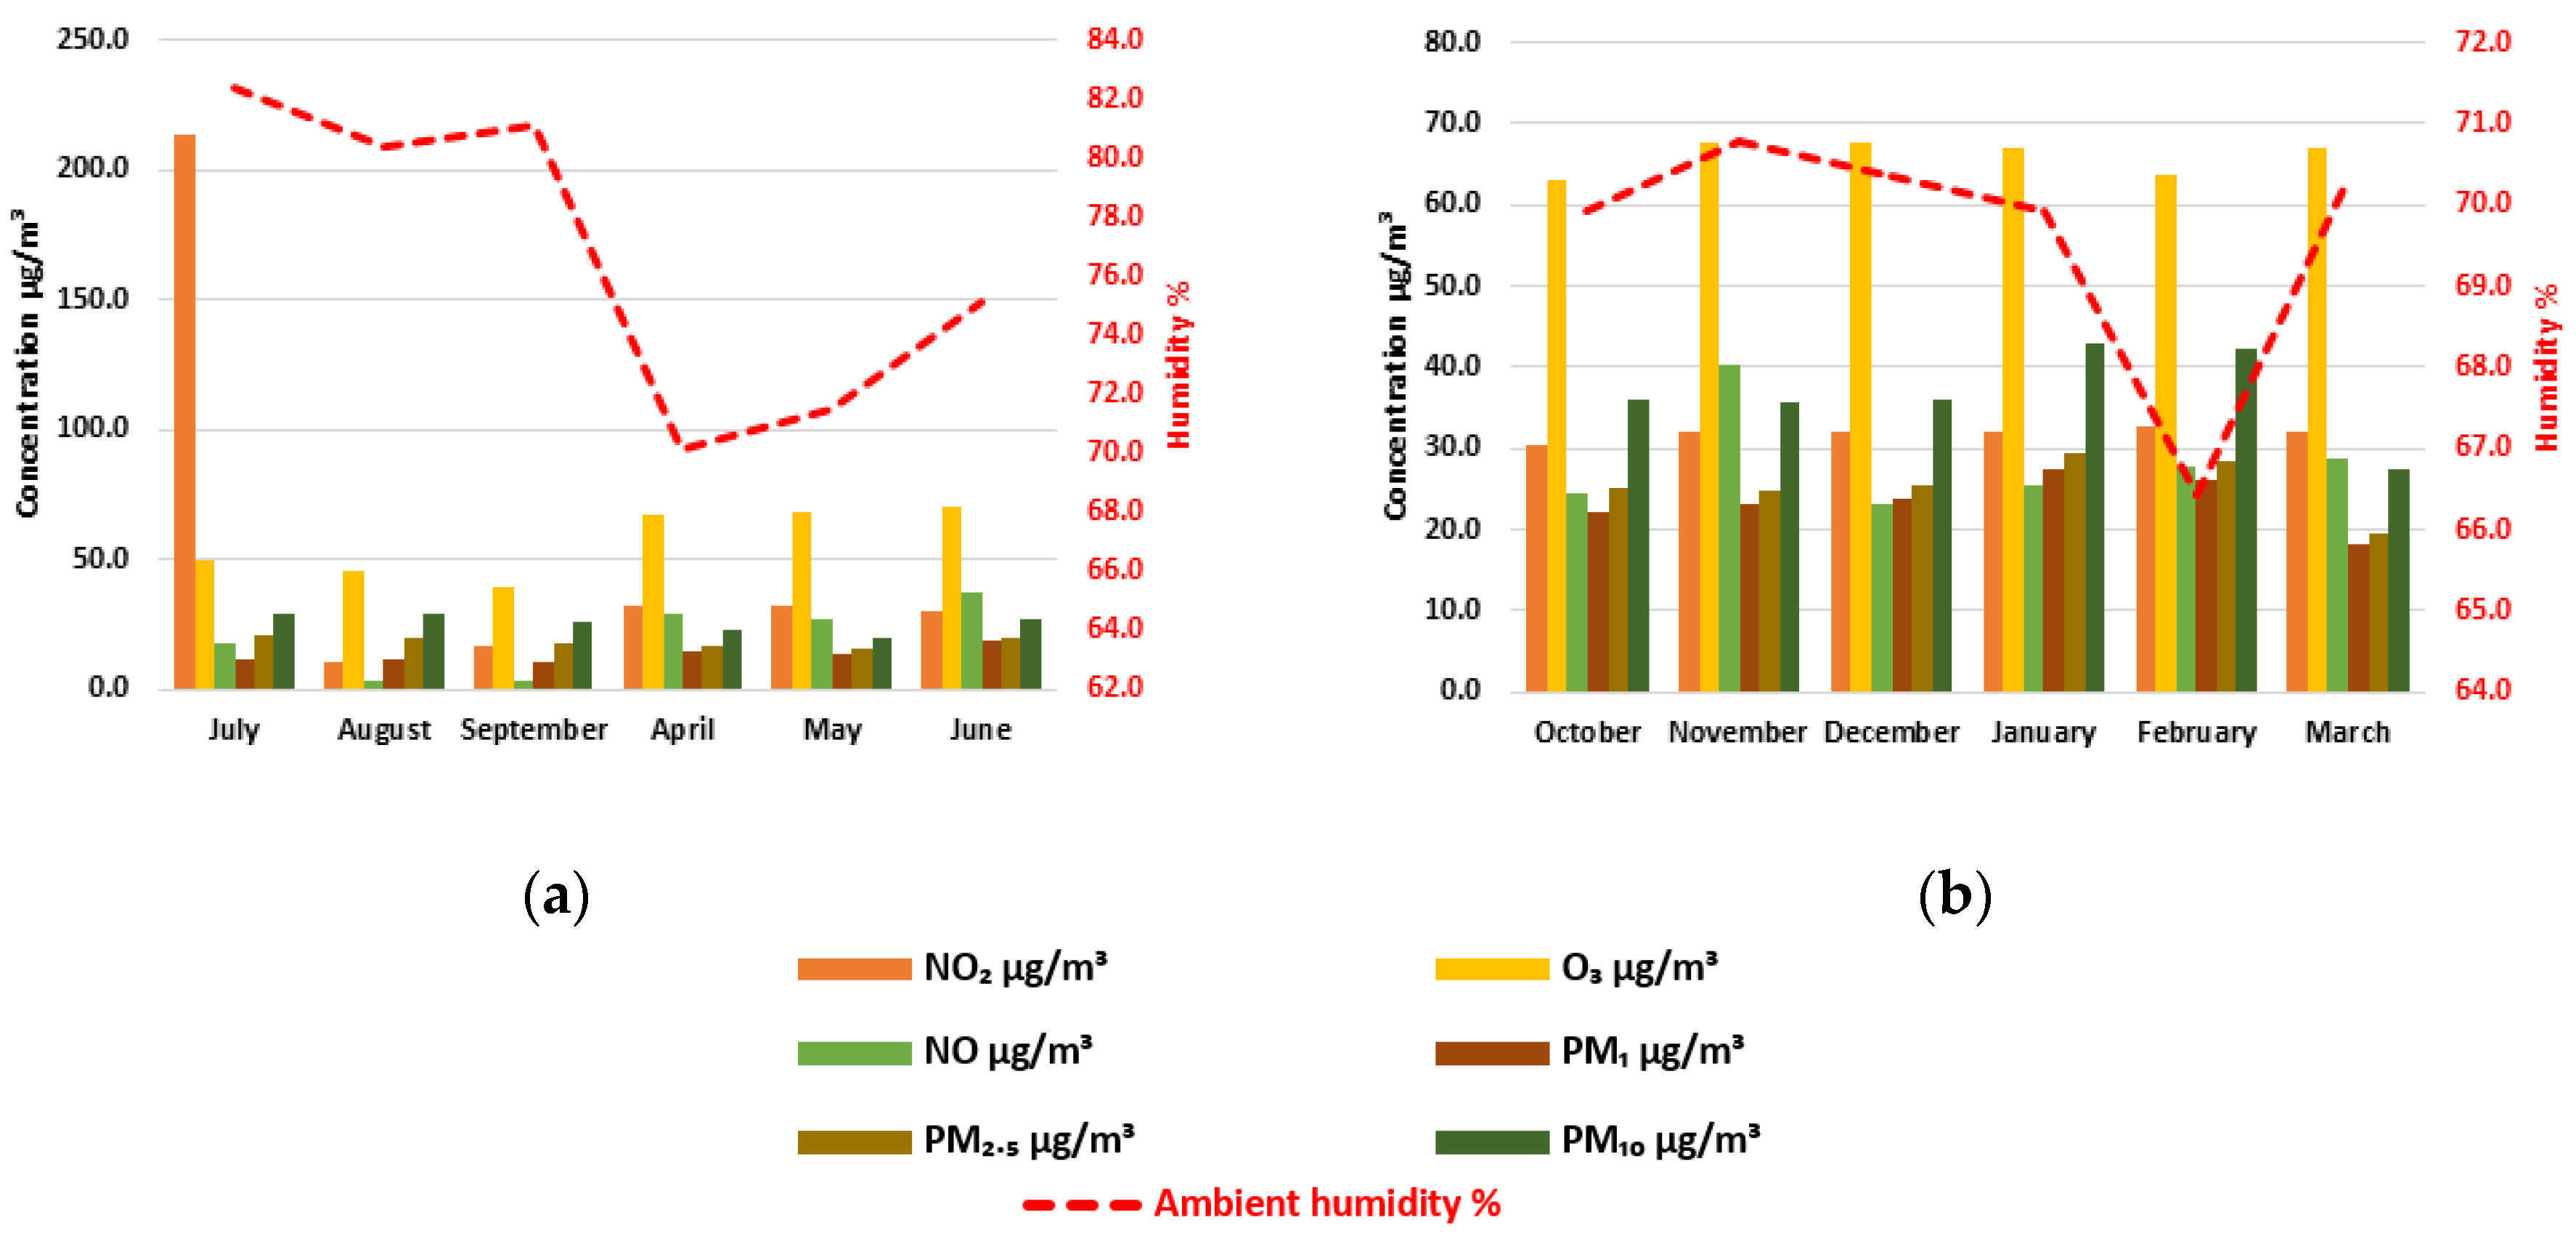
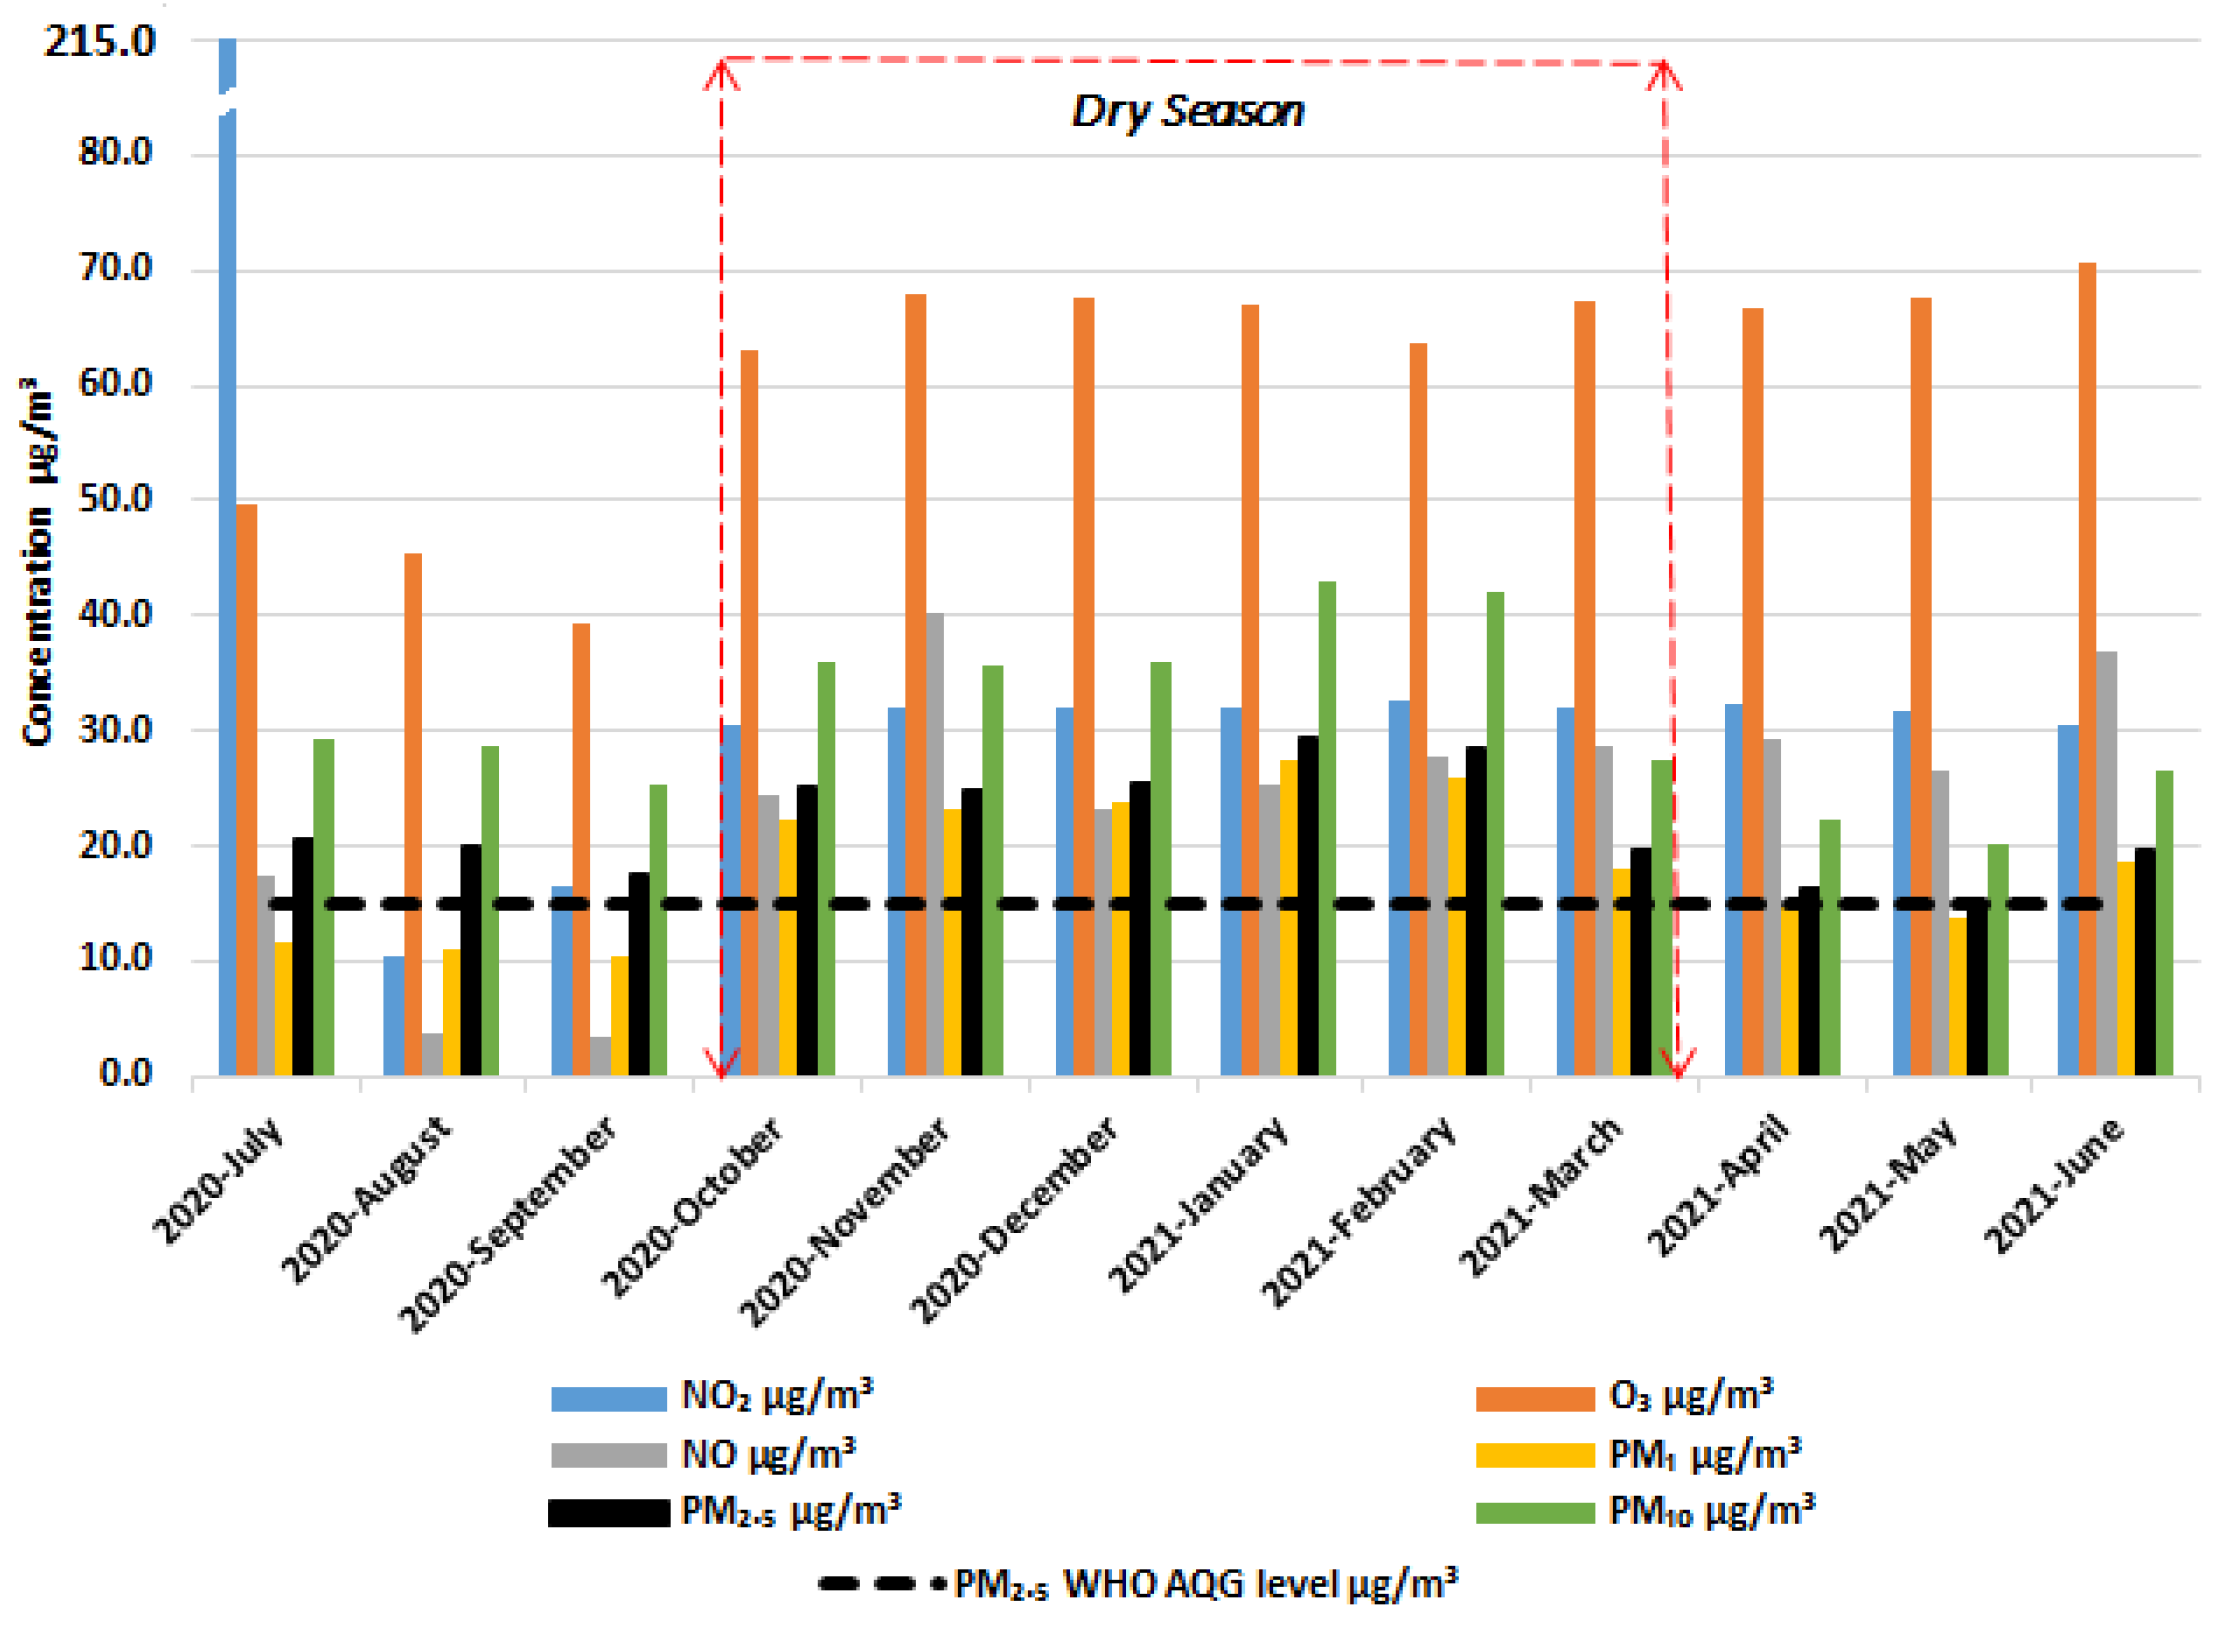
The results from the study indicate that the monthly mean concentration values of all the pollutants (NO2, O3, NO, PM1, PM2.5, PM10) are higher during the dry season than those during the rainy season. The lack of wet removal due to less rainfall and the dispersion of pollutants in the air parcels from the north-eastern desert regions during the dry season might account for some of these higher pollutant concentration levels.

5.1. Summary

In summary, during the year, the concentration of the air pollutants (NO2, O3, NO, PM1, PM2.5, PM10) tend to increase or decrease in response to the ambient temperature or humidity levels rather weakly, though during the dry season this response could be moderate for NO2, and O3. A high proportion (~70%) of the particulate matter pollutants concentrations is due to fine particles with diameters generally 2.5 µm or smaller. Thus, the PM2.5 and NO2 concentration levels exceeded those of the WHO air quality guidelines nearly 90% of the time during the test period.
The effects of NO2, O3, NO, and PM1 concentrations in this region have rarely been examined and this study adds to the knowledge.

5.2. Limitations of Study

A total of 7885 h of data over 12 months were used for this study, however a study over a longer period, possibly a decade, and including other meteorological parameters such as wind speed and rainfall patterns, might be needed to examine these relationships more extensively over several seasons. This is because sudden sustained high busts in emissions levels, unaccompanied by meteorological changes (as occurred in July 2020 for NO2 emissions during the study) can skew the data. The results would also inform air pollution dispersion models better.

5.3. Practical Implications

To use the results from these types of studies for policy development, care should be taken to avoid inferring causation from correlation; the details of the data must be examined. For example, as a consequence of the moderate (rather than negligible or weak) correlations indicated during the dry season, examinations of data from the months of January and February indicated consistently high ambient temperature values, low ambient humidity values and high concentration values of all air pollutants, and these could have implications for intervention measures for people with chronic respiratory conditions and or those prone to high temperature/dry environments.

Author Contributions

Conceptualization, N.E. and O.E.; methodology, N.E. and O.E.; software, N.E. and O.E.; validation, O.E.; formal analysis, N.E. and O.E.; investigation, N.E. and O.E.; resources, N.E. and O.E.; data curation, N.E. and O.E.; writing—original draft preparation, N.E.; writing—review and editing, N.E. and O.E.; visualization, N.E. and O.E.; supervision, N.E. and O.E.; project administration, N.E. and O.E.; funding acquisition, N.E. and O.E. All authors have read and agreed to the published version of the manuscript.

Funding

This research was funded by The University of Manchester’s Research England Global Challenges Research Fund (GCRF) QR grant.

Data Availability Statement

Not applicable.

Acknowledgments

This work described in this paper is part of SQUARE (Societal Value of Quality Low-Cost Urban Air Monitoring in Low Resource Environments) research project that was supported by The University of Manchester’s Research England Global Challenges Research Fund (GCRF) QR grant.

Conflicts of Interest

The authors declare no conflict of interest.

References

  1. Ejohwomu, O.A.; Oladokun, M.; Oshodi, O.S.; Bukoye, O.T.; Edwards, D.J.; Emekwuru, N.; Adenuga, O.; Sotunbo, A.; Uduku, O.; Alani, R.; et al. The exposure of workers at a busy road node to PM2.5: Occupational risk characterisation and mitigation measures. Int. J. Environ. Res. Public Health 2022, 19, 4636. [Google Scholar] [CrossRef] [PubMed]
  2. Gustafson, P.; Barregård, L.; Lindahl, R.; Sällsten, G. Formaldehyde levels in Sweden: Personal exposure, indoor, and outdoor concentrations. J. Expo. Sci. Environ. Epidemiol. 2005, 15, 252–260. [Google Scholar] [CrossRef] [PubMed]
  3. Kalisa, E.; Fadlallah, S.; Amani, M.; Nahayo, L.; Habiyaremye, G. Temperature and air pollution relationship during heatwaves in Birmingham, UK. Sustain. Cities Soc. 2018, 43, 111–120. [Google Scholar] [CrossRef]
  4. Chen, L.; Xiao, H.; Zhu, L.; Guo, X.; Wang, W.; Ma, L.; Guo, W.; He, J.; Wang, Y.; Nan, R.; et al. Characteristics of Ozone pollution and the impacts of related meteorological factors in Shanxi Province, China. Atmosphere 2022, 13, 1729. [Google Scholar] [CrossRef]
  5. Hernandez, G.; Berry, T.A.; Wallis, S.L.; Poyner, D. Temperature and humidity effects on particulate matter concentrations in a sub-tropical climate during winter. In Proceedings of the International Conference of the Environment, Chemistry and Biology (ICECB 2017), Queensland, Australia, 20–22 November 2017; pp. 20–22. [Google Scholar]
  6. Birim, N.G.; Turhan, C.; Atalay, A.S.; Gokcen Akkurt, G. The Influence of Meteorological Parameters on PM10: A Statistical Analysis of an Urban and Rural Environment in Izmir/Türkiye. Atmosphere 2023, 14, 421. [Google Scholar] [CrossRef]
  7. Ejohwomu, O.A.; Shamsideen Oshodi, O.; Oladokun, M.; Bukoye, O.T.; Emekwuru, N.; Sotunbo, A.; Adenuga, O. Modelling and forecasting temporal PM2.5 concentration using ensemble machine learning methods. Buildings 2022, 12, 46. [Google Scholar] [CrossRef]
  8. Abulude, F.O.; Abulude, I.A. Monitoring air quality in Nigeria: The case of Center for Atmospheric Research-National Space Research and Development Agency (CAR-NASRDA). Aerosol Sci. Eng. 2021, 5, 478–498. [Google Scholar] [CrossRef]
  9. Onuorah, C.U.; Leton, T.G.; Momoh, Y.O.L. Influence of meteorological parameters on particle pollution (PM2.5 and PM10) in the Tropical Climate of Port Harcourt, Nigeria. Arch. Curr. Res. Int. 2019, 19, 1–12. [Google Scholar] [CrossRef]
  10. Akinwumiju, A.S.; Ajisafe, T.; Adelodun, A.A. Airborne particulate matter pollution in Akure metro city, southwestern Nigeria, West Africa: Attribution and meteorological influence. J. Geovisualization Spat. Anal. 2021, 5, 11. [Google Scholar] [CrossRef]
  11. Owoade, O.K.; Olise, F.S.; Ogundele, L.T.; Fawole, O.G.; Olaniyi, H.B. Correlation between particulate matter concentrations and meteorological parameters at a site in Ile-Ife, Nigeria. Ife J. Sci. 2012, 14, 83–93. [Google Scholar]
  12. Earthsense Systems (2020). Zephyr® Air Quality Sensor [Apparatus]. Available online: https://www.et.co.uk/assets/resources/files/zephyr-air-quality-data-sheet-jan-2021et.pdf (accessed on 12 March 2023).
  13. Beck, H.E.; Zimmermann, N.E.; McVicar, T.R.; Vergopolan, N.; Berg, A.; Wood, E.F. Present and future Köppen-Geiger climate classification maps at 1-km resolution. Sci. Data 2018, 5, 180214. [Google Scholar] [CrossRef] [PubMed]
  14. Climate and Weather Averages in Lagos, Lagos, Nigeria. Available online: https://www.timeanddate.com/weather/nigeria/lagos/climate (accessed on 12 March 2023).
  15. Microsoft Corporation (2016). Microsoft Excel–Data Analysis Tool. Available online: https://office.microsoft.com/excel (accessed on 12 March 2023).
  16. Schober, P.; Boer, C.; Schwarte, L.A. Correlation coefficients: Appropriate use and interpretation. Anesth. Analg. 2018, 126, 1763–1768. [Google Scholar] [CrossRef] [PubMed]
  17. Di Leo, G.; Sardanelli, F. Statistical significance: p value, 0.05 threshold, and applications to radiomics—Reasons for a conservative approach. Eur. Radiol. Exp. 2020, 4, 18. [Google Scholar] [CrossRef] [PubMed]
  18. Andrade, C. The P value and statistical significance: Misunderstandings, explanations, challenges, and alternatives. Indian J. Psychol. Med. 2019, 41, 210–215. [Google Scholar] [CrossRef] [PubMed]
  19. World Health Organization. WHO Global Air Quality Guidelines: Particulate Matter (PM2.5 and PM10), Ozone, Nitrogen Dioxide, Sulfur Dioxide and Carbon Monoxide; World Health Organization: Geneva, Switzerland, 2021; ISBN 978-92-4-003422-8. Available online: https://apps.who.int/iris/handle/10665/345329 (accessed on 13 March 2023).
  20. Gnamien, S.; Yoboué, V.; Liousse, C.; Keita, S.; Bahino, J.; Siélé, S.; Diaby, L. Particulate pollution in Korhogo and Abidjan (Cote d’Ivoire) during the dry season. Aerosol Air Qual. Res. 2020, 21, 200201. [Google Scholar] [CrossRef]
  21. Seefeldt, M.W.; Hopson, T.M.; Warner, T.T. A characterization of the variation in relative humidity across West Africa during the dry season. J. Appl. Meteorol. Climatol. 2012, 51, 2077–2089. [Google Scholar] [CrossRef]
  22. Minka, N.S.; Ayo, J.O. Influence of cold–dry (harmattan) season on colonic temperature and the development of pulmonary hypertension in broiler chickens, and the modulating effect of ascorbic acid. Open Access Anim. Physiol. 2014, 6, 1–11. [Google Scholar] [CrossRef]
  23. Oanh, N.K.; Upadhyay, N.; Zhuang, Y.H.; Hao, Z.P.; Murthy, D.V.S.; Lestari, P.; Villarin, J.; Chengchua, K.; Co, H.; Lindgren, E.S.; et al. Particulate air pollution in six Asian cities: Spatial and temporal distributions, and associated sources. Atmos. Environ. 2006, 40, 3367–3380. [Google Scholar] [CrossRef]
  24. Stein, A.F.; Draxler, R.R.; Rolph, G.D.; Stunder, B.J.; Cohen, M.D.; Ngan, F. NOAA’s HYSPLIT atmospheric transport and dispersion modeling system. Bull. Am. Meteorol. Soc. 2015, 96, 2059–2077. [Google Scholar] [CrossRef]
  25. Rolph, G.; Stein, A.; Stunder, B. Real-time environmental applications and display system: READY. Environ. Model. Softw. 2017, 95, 210–228. [Google Scholar] [CrossRef]
Figure 1. Lagos, highlighted, south-western part of Nigeria showing a monitoring site at the University of Lagos [1]. Map adapted from Google Maps (accessed on 12 March 23).
Climate 11 00113 g001
Figure 2. The Köppen-Geiger climate classification procedure. Adapted from Beck et al. [13]. Definitions of variables: MAP = mean annual precipitation (mm/year); Pdry = precipitation in the driest month (mm/month); Af = tropical rainforest climate; Am = tropical monsoon climate; Aw = tropical monsoon savannah. Summer (winter) is the six-month period that is warmer (colder) between April-September and October-March. Using this procedure and the data from Table 2, the climate at Akoka Lagos can be classified as tropical monsoon savannah with rainy (April to September) and dry (October to March) seasons.
Climate 11 00113 g002
Figure 3. Simulated backward trajectories of the air mass, using the HYSPLIT [24,25] model, from the air pollutants measurements site in Lagos (Source). The air mass motions were simulated over three Above Ground Level (AGL) heights (red lines – 100 m, blue lines – 500 m, green lines - 1000 m) over 5 days. (a) Backward trajectories at 1300 UTC 29 June 2021 for the rainy season example. (b) Backward trajectories at 1300 UTC 29 December 2020 for the dry season example. These simulation results indicate a contribution of north-eastern desert winds to the air mass during the dry season (b) not seen during the rainy season (a). (a) Rainy season. (b) Dry season.
Climate 11 00113 g003
Figure 4. Mean temperature, and concentration values of air pollutants (NO2, O3, NO, PM1, PM2.5, PM10) during the rainy (July to September 2020, April to June 2021) and dry (October 2020 to March 2021) seasons. (a) Rainy season. (b) Dry season.
Climate 11 00113 g004
Figure 5. Mean humidity, and concentration values of air pollutants (NO2, O3, NO, PM1, PM2.5, PM10) during the rainy (July to September 2020, April to June 2021) and dry (October 2020 to March 2021) seasons. (a) Rainy season. (b) Dry season.
Climate 11 00113 g005
Figure 6. Concentration values of air pollutants (NO2, O3, NO, PM1, PM2.5, PM10) during the rainy (July to September 2020, April to June 2021) and dry (October 2020 to March 2021) seasons, with the recommended 24 h average PM2.5 WHO Air Quality Guidelines concentration level.
Climate 11 00113 g006
Table 1. Air quality sensor (Zephyr® [12]) specifications for the air pollutants (NO, NO2, O3, PM1, PM2.5, and PM10) used for the study.
Air Pollutant Type
NONO2PM1PM2.5PM10O3
Measurement Range 0–20,000 µg/m3
Estimated Accuracy ±5 µg/m3 ±8 µg/m3
Table 2. Mean precipitation and ambient temperature values obtained from the annual weather averages based on weather reports collected during 2005–2015 from a weather station at Ikeja/Lagos [14], 13 km north from Akoka/Lagos where the data for the present studies were collected. The shaded sections indicate the dry season months.
MonthAnnual Weather Averages From 2005 to 2015 [14]
Mean Ambient TemperatureMean Precipitation
[°C][mm]
January2849.4
February2951.7
March29.585.4
April2985.3
May28132
June27186.8
July26138.9
August2698.7
September26.5163.2
October27157.3
November28122
December2843.6
Wet Season:
April to September27.1134.2
Dry Season:
October to March28.384.9
Table 3. Definitions of the correlation coefficient (r) thresholds used for the study, adapted from [16].
Observed Correlation Coefficient, rInterpretation
0.00 to 0.10Negligible correlation
0.10 to 0.39Weak correlation
0.40 to 0.69Moderate correlation
0.70 to 0.89Strong correlation
0.90 to 1.00Very strong correlation
Table 4. Interpretation of the statistical significance of the relationships between the independent meteorological parameters and the air pollutants based on the calculated p-value.
Critical ValuesInterpretation
p > 0.05Not statistically significantAccept null hypothesis
p ≤ 0.05Statistically significantReject null hypothesis
p ≤ 0.01Highly statistically significant
Table 5. Temperature, humidity and concentration values of air pollutants (NO2, O3, NO, PM1, PM2.5, PM10) during the dry season (October 2020 to March 2021).
NO2O3NOPM1PM2.5PM10Ambient TempAmbient
Humidity
µg/m3µg/m3µg/m3µg/m3µg/m3µg/m3°C%
Mean51.456.819.513.418.225.229.576.6
Mode30.079.03.210.715.719.326.087.0
Minimum0.00.00.31.92.05.622.035.0
Maximum6963.9279.0452.3138.6398.7286.742.097.0
Hours 142564256425642564256425642564256
1 Number of complete hours of data collection.
Table 6. Temperature, humidity and concentration values of air pollutants (NO2, O3, NO, PM1, PM2.5, PM10) during the dry season (October 2020 to March 2021).
NO2O3NOPM1PM2.5PM10Ambient TempAmbient
Humidity
µg/m3µg/m3µg/m3µg/m3µg/m3µg/m3°C%
Mean30.562.924.422.325.135.831.769.9
Mode30.078.03.020.523.831.230.078.0
Minimum0.00.00.03.73.97.522.015.0
Maximum62.3259.6304.7139.3195.0225.142.090.0
Hours 136293629362936293629362936293629
1 Number of complete hours of data collection.
Table 7. Percentage of hours during the study in dry season in which the recommended WHO AQG levels [19] were exceeded for air pollutants (NO2, O3, PM2.5, PM10).
PollutantAveraging Time
[Hours]
Recommended WHO
AQG Level [µg/m3]
Hours WHO AQG Level
Was Exceeded during
The Study Period [%]
PM2.5241587.1
PM10244518.3
O381001.0
NO2242589.0
Table 8. The hourly mean temperature, humidity and concentration values of air pollutants (NO2, O3, NO, PM1, PM2.5, PM10) during the rainy (July to September 2020, April to June 2021) and dry (October 2020 to March 2021) seasons. For this table, 3629 complete hours of data collection for both seasons were used. α = 0.05.
Dry SeasonWet Season
MeanStandard DeviationMeanStandard Deviationp-Value
NO2 [µg/m3]30.57.155.0481.2<0.0001
O3 [µg/m3]62.922.154.425.2<0.0001
NO [µg/m3]24.418.616.734.10.3598
PM1 [µg/m3]22.311.612.77.20.3528
PM2.5 [µg/m3]25.113.318.011.90.3543
PM10 [µg/m3]35.816.725.112.00.1730
Ambient temp [°C]31.73.829.33.8<0.0001
Ambient humidity [%]69.913.676.911.9<0.0001
Table 9. Correlation matrix of mean temperature, humidity, and air pollutants (NO2, O3, NO, PM1, PM2.5, PM10) values during the rainy (July to September 2020, April to June 2021) season (n = 4256).
NO2O3NOPM1PM2.5PM10Ambient TempAmbient Humidity
NO21
O3−0.151
NO0.860.121
PM10.030.220.261
PM2.50.08−0.090.090.801
PM100.10−0.130.100.820.951
Ambient temp−0.040.210.10−0.13−0.24−0.371
Ambient humidity0.06−0.16[−0.02]0.220.260.37−0.941
The numbers in bold represent statistically highly significant associations, those in italics significant associations, and those in brackets no associations.
Table 10. Correlation matrix of mean temperature, humidity, and air pollutants (NO2, O3, NO, PM1, PM2.5, PM10) values during the dry (October 2020 to March 2021) season (n = 3629).
NO2O3NOPM1PM2.5PM10Ambient TempAmbient Humidity
NO21
O3−0.211
NO0.110.311
PM10.170.140.341
PM2.50.20−0.100.180.911
PM100.21−0.090.230.930.961
Ambient temp0.61−0.24−0.12−0.11−0.05[0.00]1
Ambient humidity−0.480.490.170.04−0.10−0.17−0.861
The numbers in bold represent statistically highly significant associations, those in italics significant associations, and those in brackets no associations.
Table 11. Calculated critical values for the mean temperature, humidity, and concentration values of air pollutants (NO2, O3, NO, PM1, PM2.5, PM10) during the rainy (July to September 2020, April to June 2021) and dry (October 2020 to March 2021) seasons. The null hypothesis is accepted for the relationships with p-values in bold figures.
p-Values
NO2O3NOPM1PM2.5PM10
Wet season
Ambient temp0.0210<0.0001<0.0001<0.0001<0.0001<0.0001
Ambient humidity0.0001<0.00010.2980<0.0001<0.0001<0.0001
Dry season
Ambient temp0.0000<0.0001<0.0001<0.00010.00180.9915
Ambient humidity<0.0001<0.0001<0.00010.0282<0.0001<0.0001
Table 12. Correlation and statistical significance of the mean temperature, humidity, and concentration values of air pollutants (NO2, O3, NO, PM1, PM2.5, PM10) during the rainy (July to September 2020, April to June 2021) and dry (October 2020 to March 2021) seasons, compared with results from published studies. The shaded sections indicate lack of data from the study for the pollutants.
NO2O3NOPM1PM2.5PM10
LocationCorrelationStatistical significanceCorrelationStatistical significanceCorrelationStatistical significanceCorrelationStatistical significanceCorrelationStatistical significanceCorrelationStatistical significanceDuration of study
Rainy season
Ambient tempLagos [Present study]negligliblesignificantweakhighly significantweakhighly significantweakhighly significantweakhighly significantweakhighly significant
6 months each (complete season)
Akure [10] negligiblenot significantnegligiblenot significantnot specified
Ambient humidity
Lagos [Present study]negligliblehighly significantweakhighly significantnegligliblenot significantweakhighly significantweakhighly significantweakhighly significant6 months each (complete season)
Akure [10] weaknot significantweaknot significantnot specified
Dry season
Ambient tempLagos [Present study]moderatehighly significantweakhighly significantweakhighly significantweakhighly significantweakhighly significantweaknot significant
6 months each (complete season)
Lagos [8] weak weak weak 2.5 months
Akure [10] weaknot significantweaknot significantnot specified
Ambient humidity
Lagos [Present study]moderatehighly significantmoderatehighly significantweakhighly significantnegligliblesignificantweakhighly significantweakhighly significant6 months each (complete season)
Lagos [8] weak weak weak 2.5 months
Akure [10] weaknot significantweaknot significantnot specified
Seasons not split
Ambient tempPort Harcourt [9] weakhighly significantweakhighly significant7 months (4 months rainy, 3 months wet)
Ile-Ife [11] weaknot significant 10 months (5 months each of rainy and dry season)
Ambient humidityPort Harcourt [9] negligliblenot significantnegligliblesignificant7 months (4 months rainy, 3 months wet)
Ile-Ife [11] weaknot significant 10 months (5 months each of rainy and dry season)
Disclaimer/Publisher’s Note: The statements, opinions and data contained in all publications are solely those of the individual author(s) and contributor(s) and not of MDPI and/or the editor(s). MDPI and/or the editor(s) disclaim responsibility for any injury to people or property resulting from any ideas, methods, instructions or products referred to in the content.

