Article

Evaluating Contemporary and Future-Scenario Substantial-Precipitation Events in the Missouri River Basin Using Object-Oriented Analysis

by
Brandon J. Fisel
,
Nathan E. Erickson
,
Colin R. Young
,
Ada L. Ellingworth
and
William J. Gutowski, Jr.
*
Department of Geological and Atmospheric Sciences, Iowa State University, Ames, IA 50014, USA
*
Author to whom correspondence should be addressed.
Climate 2023, 11(5), 112; https://doi.org/10.3390/cli11050112
Submission received: 2 March 2023 / Revised: 5 May 2023 / Accepted: 13 May 2023 / Published: 19 May 2023
(This article belongs to the Special Issue Extreme Precipitation in a Changing Climate)

Abstract

:
The Missouri River Basin is the largest single river basin in the United States, and, as such, it plays an important role in natural ecosystems as well as the country’s economy, through agriculture, hydroelectric power generation, and transportation. Episodes of heavy precipitation can have a substantial negative impact on all these aspects of the basin, so understanding how well these episodes are simulated and projected to change in the future climate is important. We analyzed contemporary and projected mid-century behavior of heavy-precipitation episodes using an object-oriented analysis to diagnose short-term (≥5-day) and extended-period (≥30-day) events with substantial precipitation, using PRISM gridded, observed precipitation and RegCM4 regional-climate simulations that used outputs from two different GCMs for boundary conditions. The simulations were produced for the North American portion of the CORDEX program. A 25 km grid was used for the simulations and for aggregated PRISM precipitation. Overall, the simulated contemporary-climate events compared favorably with the PRISM events’ frequency and duration. The simulated event areas tended to be larger than the areas in the PRISM events, suggesting that the effective resolution of the simulations is greater than 25 km. Event areas and durations change little going from contemporary to scenario climate. The short-term events increase in frequency by an amount commensurate with the increase in mean precipitation simulated for the basis. However, the extended-term events showed little change in frequency, despite the average precipitation increase. Roughly half the extended-period events overlapped with at least one short-term event in both the observations and the simulations. Extended-period events that overlap a short-term event generally have larger areas and longer durations compared to their counterparts with no overlapping short-term events. Understanding the climate dynamics yielding the two types of extended-period events could be useful for assessing future changes in the Missouri River Basin’s heavy precipitation events and their impact.

1. Introduction

The Missouri River Basin (Figure 1) is the largest single river basin in the United States. It includes over 25 Native American tribal lands and parts of 10 U.S. states and 2 Canadian provinces, with an area over 1.3 million km2 [1]. The Missouri River itself is over 4000 km (2500 miles) long from its nexus in Montana to the basin mouth at Hermann, Missouri, where its average monthly flow is approximately 2800 m3s1 [2]. The basin plays an important role in many natural and human systems, such as wetlands, waterfowl migration, agriculture, hydroelectric power, transportation, recreation, and general water resources, all of which contribute to the economic activities of the region. Agriculture in the basin, for example, provides nearly half of U.S. wheat production, as well as substantial amounts of corn and soybeans [1].
Figure 1. The Missouri River Basin. Basin shapefile courtesy of the U.S. Geological Survey [3].
Climate 11 00112 g001
Because of its geographic location, with proximity to mountain ranges, lakes, dry plains, and oceanic gulfs, as well as its temperate continental climate, the basin experiences substantial variability between drought and flooding conditions. In that context, episodes of heavy precipitation can have substantial impact through habitat degradation, flooding, crop loss, and other economic disruption. Although there is extensive literature on heavy precipitation for many parts of the world, including projected changes in future precipitation (e.g., [4] and references therein), there have been few comprehensive studies of the hydroclimate of this basin [2]. Seneveratne et al. [4] assessed the available literature on projected changes in heavy precipitation for North America as a whole and for the continent subdivided into six broad regions (their Table 11.20). However, these regions cross boundaries of large watersheds such as the Missouri River Basin and lack focus on the projected climate changes for this basin. In the work reported here, we contribute to filling the research shortcoming noted by Wise et al. [2] by examining the climatology of substantial-precipitation events in the contemporary and projected future climate.
Specifically, we examine short-term (≥5-day) and extended (≥30-day) periods of substantial precipitation, both of which can alter water flow and water resources in the basin. Such events may be viewed as climate-impact drivers, defined as “physical climate system conditions (e.g., means, events, extremes) that affect an element of society or ecosystems and are, thus, a priority for climate information provision” [5]. We achieve this by diagnosing short-term and extended-period precipitation events using an object-oriented methodology to identify the events. This type of analysis complements the more commonly reported regional percentile exceedances and intensity–duration–frequency curves [4]. The event-based analysis allows us to assess the frequency, spatial extent, duration, and other characteristics of these events in observations and regional climate simulations. We compare observed and simulated characteristics for a contemporary period to assess model performance and present changes in the event characteristics under a future scenario.

2. Data and Methods

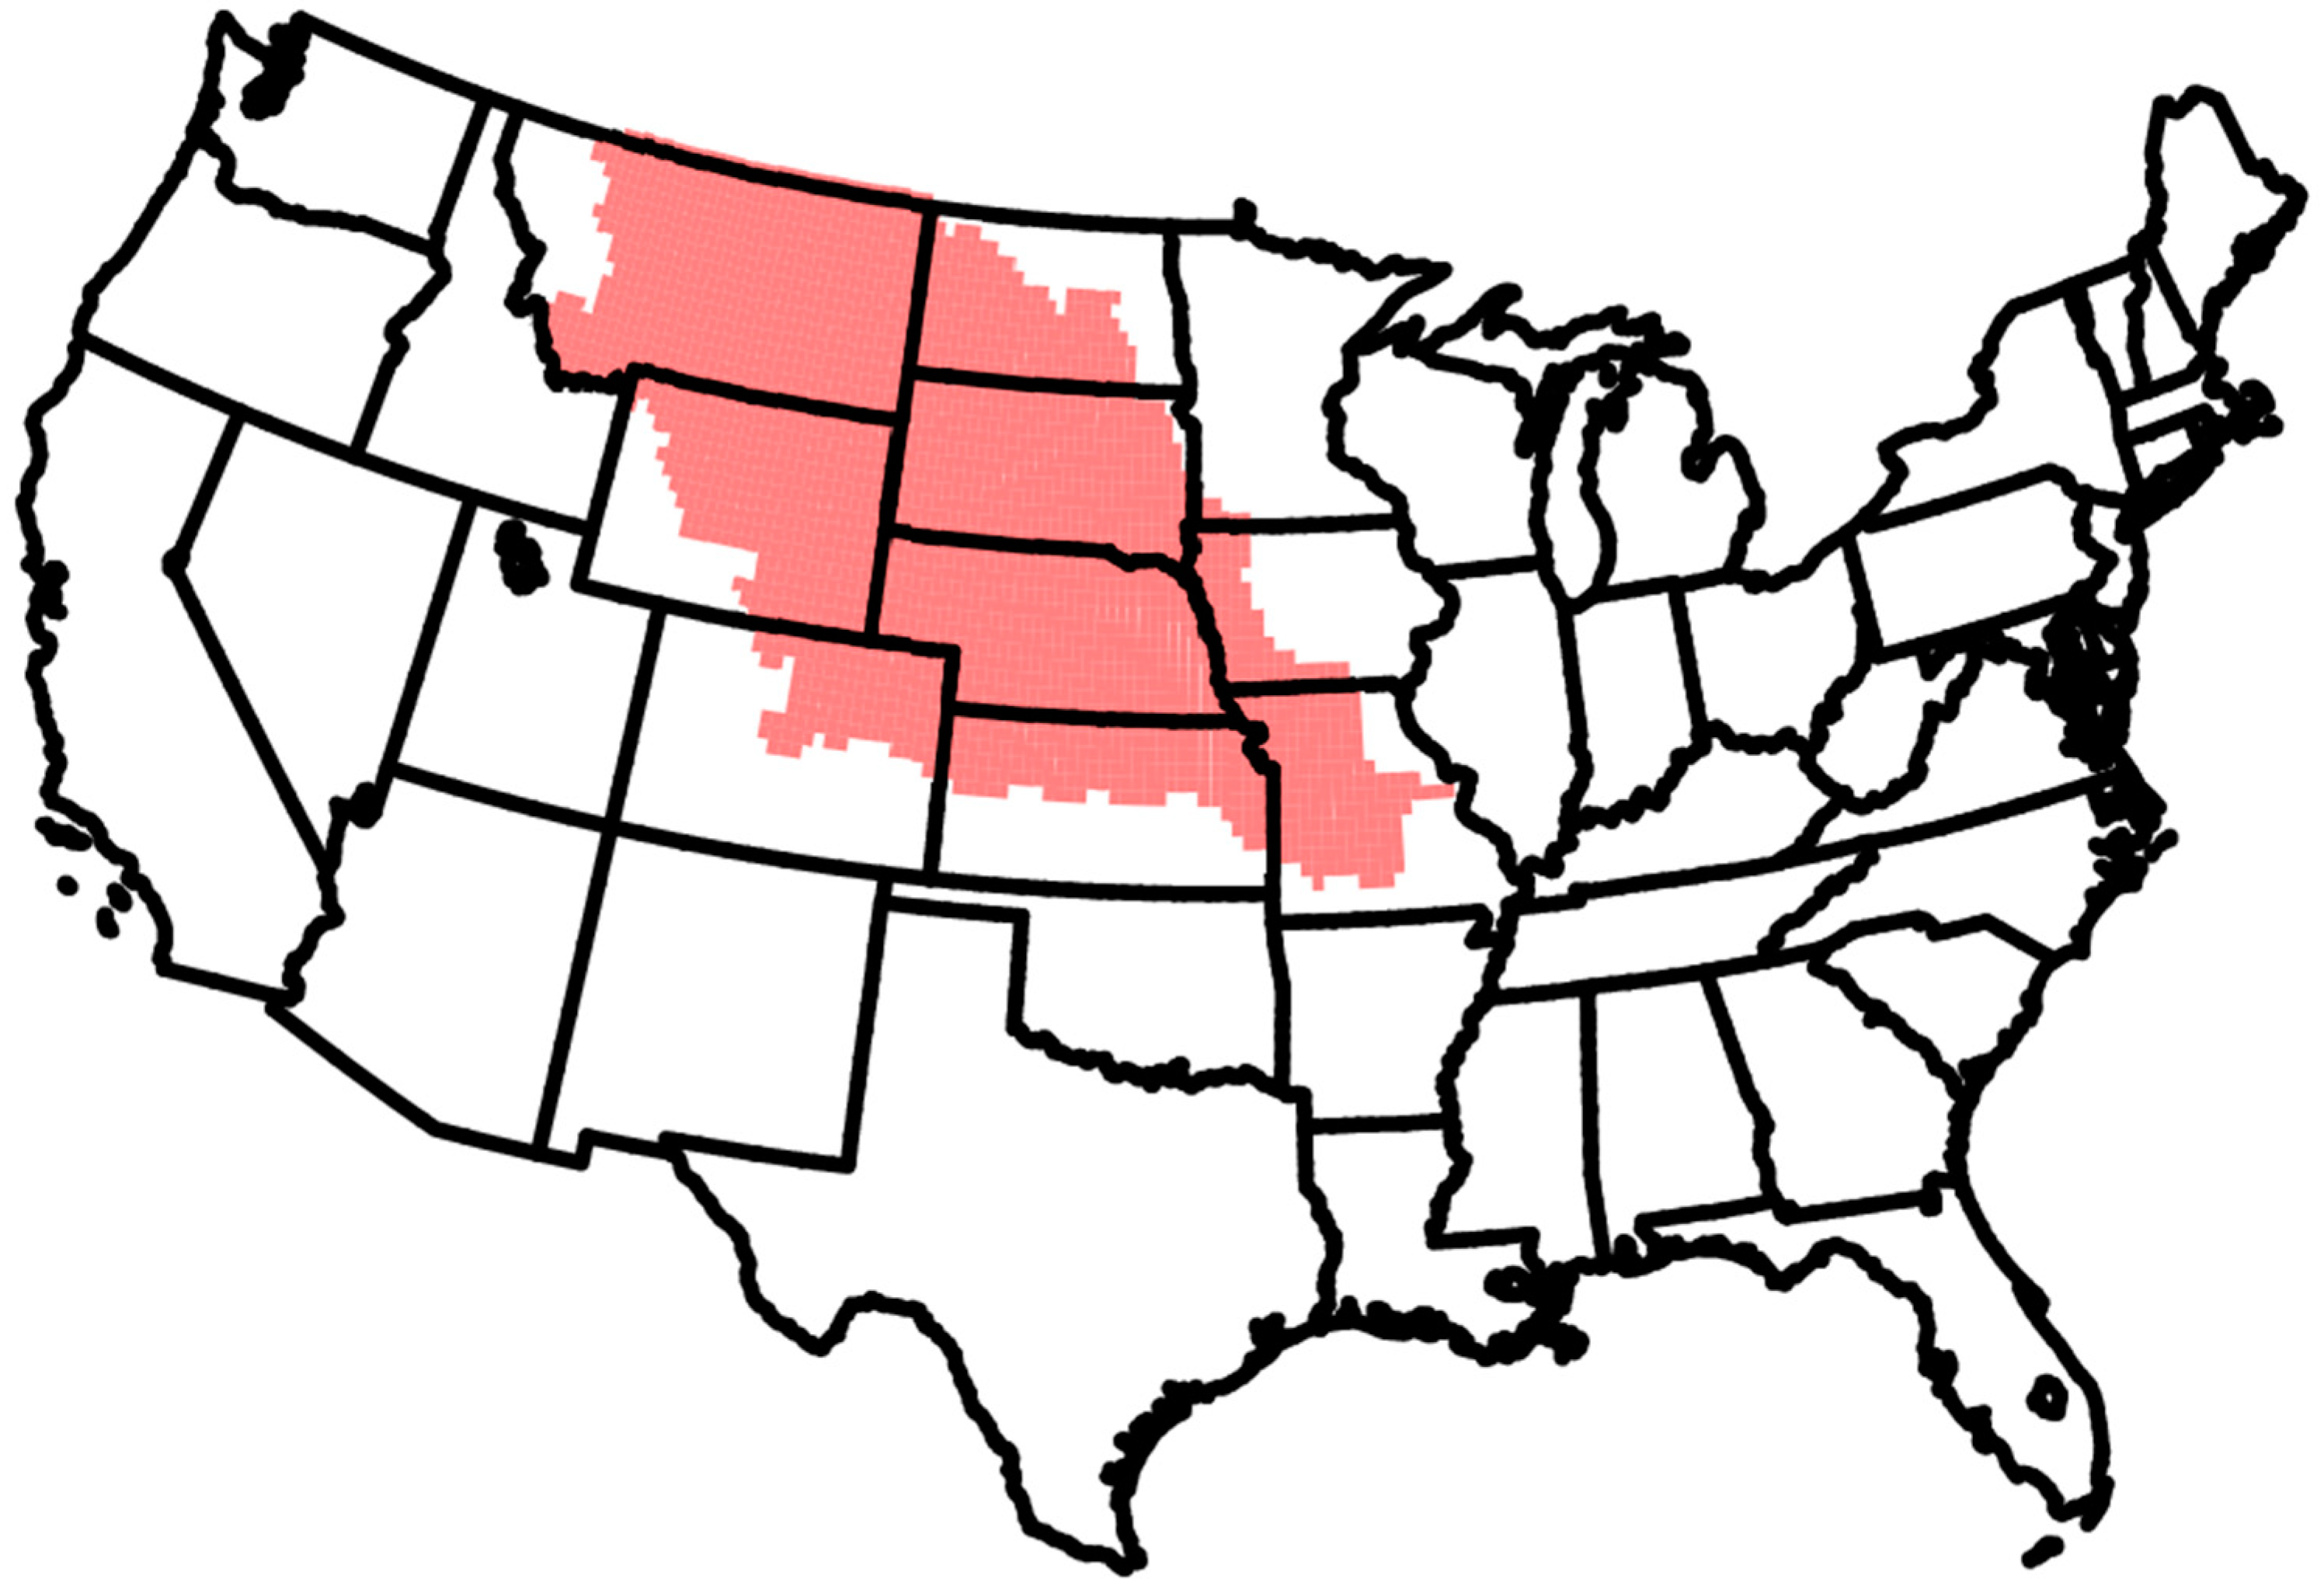
2.1. Observations and Simulations

For precipitation observations, we used the Parameter-elevation Regressions on Independent Slopes Model (PRISM; [6]) daily precipitation from January 1981 through December 2000 as our representation of the contemporary climate. We did not include more recent PRISM data, as the data set began to include radar-based estimates of precipitation starting in 2002 [6]. In diagnostics that include data from 2002 onward, we have observed a shift in results starting in 2002, suggesting an inhomogeneity from adding the radar estimates. We have, therefore, restricted our PRISM analysis to a period prior to that shift that uses only station-based observations. PRISM data are provided on a 4 km × 4 km grid. We aggregated the precipitation data to a 25 km grid to match the simulations’ grid spacing, using a mass-conserving aggregation scheme [7].
Our model output for daily precipitation comes from two combinations of global climate models (GCMs), driving a regional climate model (RCM) that produced simulations for the North American portion [8,9] of the Coordinated Regional Downscaling Experiment (CORDEX; [10,11]. The Geophysical Fluid Dynamics Laboratory (GFDL) and the Max Planck Institute for Meteorology (MPI) produced the GCM simulations, driving the RCMs under the CMIP5 program [12,13,14,15,16],. The Regional Climate Model, version 4 (RegCM4; [17]) produced the RCM simulations, using both GCMs. RegCM4 used 25 km grid spacing to simulate the period of 1950–2100. The simulation period of 2006–2100 used the RCP8.5 scenario [18].

2.2. Methods

Analysis focused on two twenty-year time periods: contemporary (1981–2000), as discussed above, and future scenario (2041-2060). We focused on a mid-century rather than end-of-century period, as planning horizons for much infrastructure and national security guidance is often within 20–50 years into the future (e.g., [19,20,21]), so the mid-century period evaluated here is appropriate from a decision-making perspective. In addition, some have raised doubts about the viability of an RCP 8.5 scenario through the final decades of the 21st century [22,23]). In addition, global temperature changes through the mid-century from a variety of RCP scenarios show less sensitivity to the specific scenario compared to changes toward the end of the century [24,25], suggesting that a focus on the mid-century is, thus, less dependent on the specific scenario used.
A primary goal of this study was to characterize the occurrence of short-term and extended-period events of substantial precipitation. We identified events using the object-oriented analysis Tempest Extremes (TE; [26]). TE was originally developed to track pointwise features such as topical and extratropical cyclones and tropical easterly waves. We have adapted TE to identify spatially and temporally continuous features in climate data that surpass a relevant threshold. We identified such features as events, and, in the present work, the relevant thresholds are precipitation above pre-defined levels, discussed in detail below. TE is sufficiently efficient [27] so that we can extract a substantial collection of events from multi-decadal data sets covering sizeable regions, such as the Missouri River Basin, and develop a climatology of the targeted events. Further details of TE’s formulation and coding appear in Ullrich and Zarzycki [26]. To our knowledge, such an approach has been used only infrequently to evaluate precipitation events of interest (e.g., [28,29]). An advantage of the approach is that it allows one to diagnose events based on regional climate characteristics, characteristics that potentially might be defined by stakeholder-relevant impactful events that do not clearly fit more standard hydroclimate metrics, such as return periods for extreme events or percentile exceedances.
To ensure that an object has some degree of space-time continuity that the models can resolve, we required an object to have at least four adjacent grid points in the space-time domain. We assumed that all diagnosed objects were events produced by the same hydroclimatic dynamics in the region. We can identify several characteristics for these events: location, duration, areal extent, and intensity above the pre-defined threshold. We examined the collection of all events for their frequency of occurrence and distribution of properties, thus arriving at a climatology of the targeted event types.
For our analysis of periods of substantial precipitation, we computed 5-day (short-term) running sums and 30-day (extended-term) running sums from our precipitation sources, using moving 5-day and 30-day windows that shifted the summation forward by 1 day to get a sequence of 5-day and 30-day sums. Here, we view the duration of an extended-period event as the number of successive days that the cumulative precipitation in the moving 30-day window exceeds a designated threshold. Similarly, the duration of a short-term event is the number of successive days that the cumulative precipitation in the moving 5-day window exceeds its designated threshold. Our focus is primarily on extended-term periods of substantial precipitation, but we included the short-term periods to assess the degree to which our extended-period events are the outcome of an accumulation of shorter, very wet periods.
Our threshold for identifying events in the 5-day sums was 50 mm and in 30-day sums was 150 mm. The 5-day threshold was in the upper 5% of precipitation intensity for 5-day periods with any precipitation in the observations diagnosed here. The 30-day threshold was above the 75th percentile of monthly precipitation values for the period of 1912–2011 in a Lower Missouri River Basin defined by Wise et al. [2], except for June, for which the 75th percentile was approximately 155 mm. Most other months in their data have at least occasional years exceeding 150 mm. The threshold is well above the 75th percentile for the Upper Missouri River Basin, defined by Wise et al. [2], though occasional outliers do exceed that level. Our moving, 30-day window also allowed identifying events that straddle monthly boundaries. For monthly diagnostics that we present here, we associate an event with the month containing the first day of the event’s duration.

3. Results

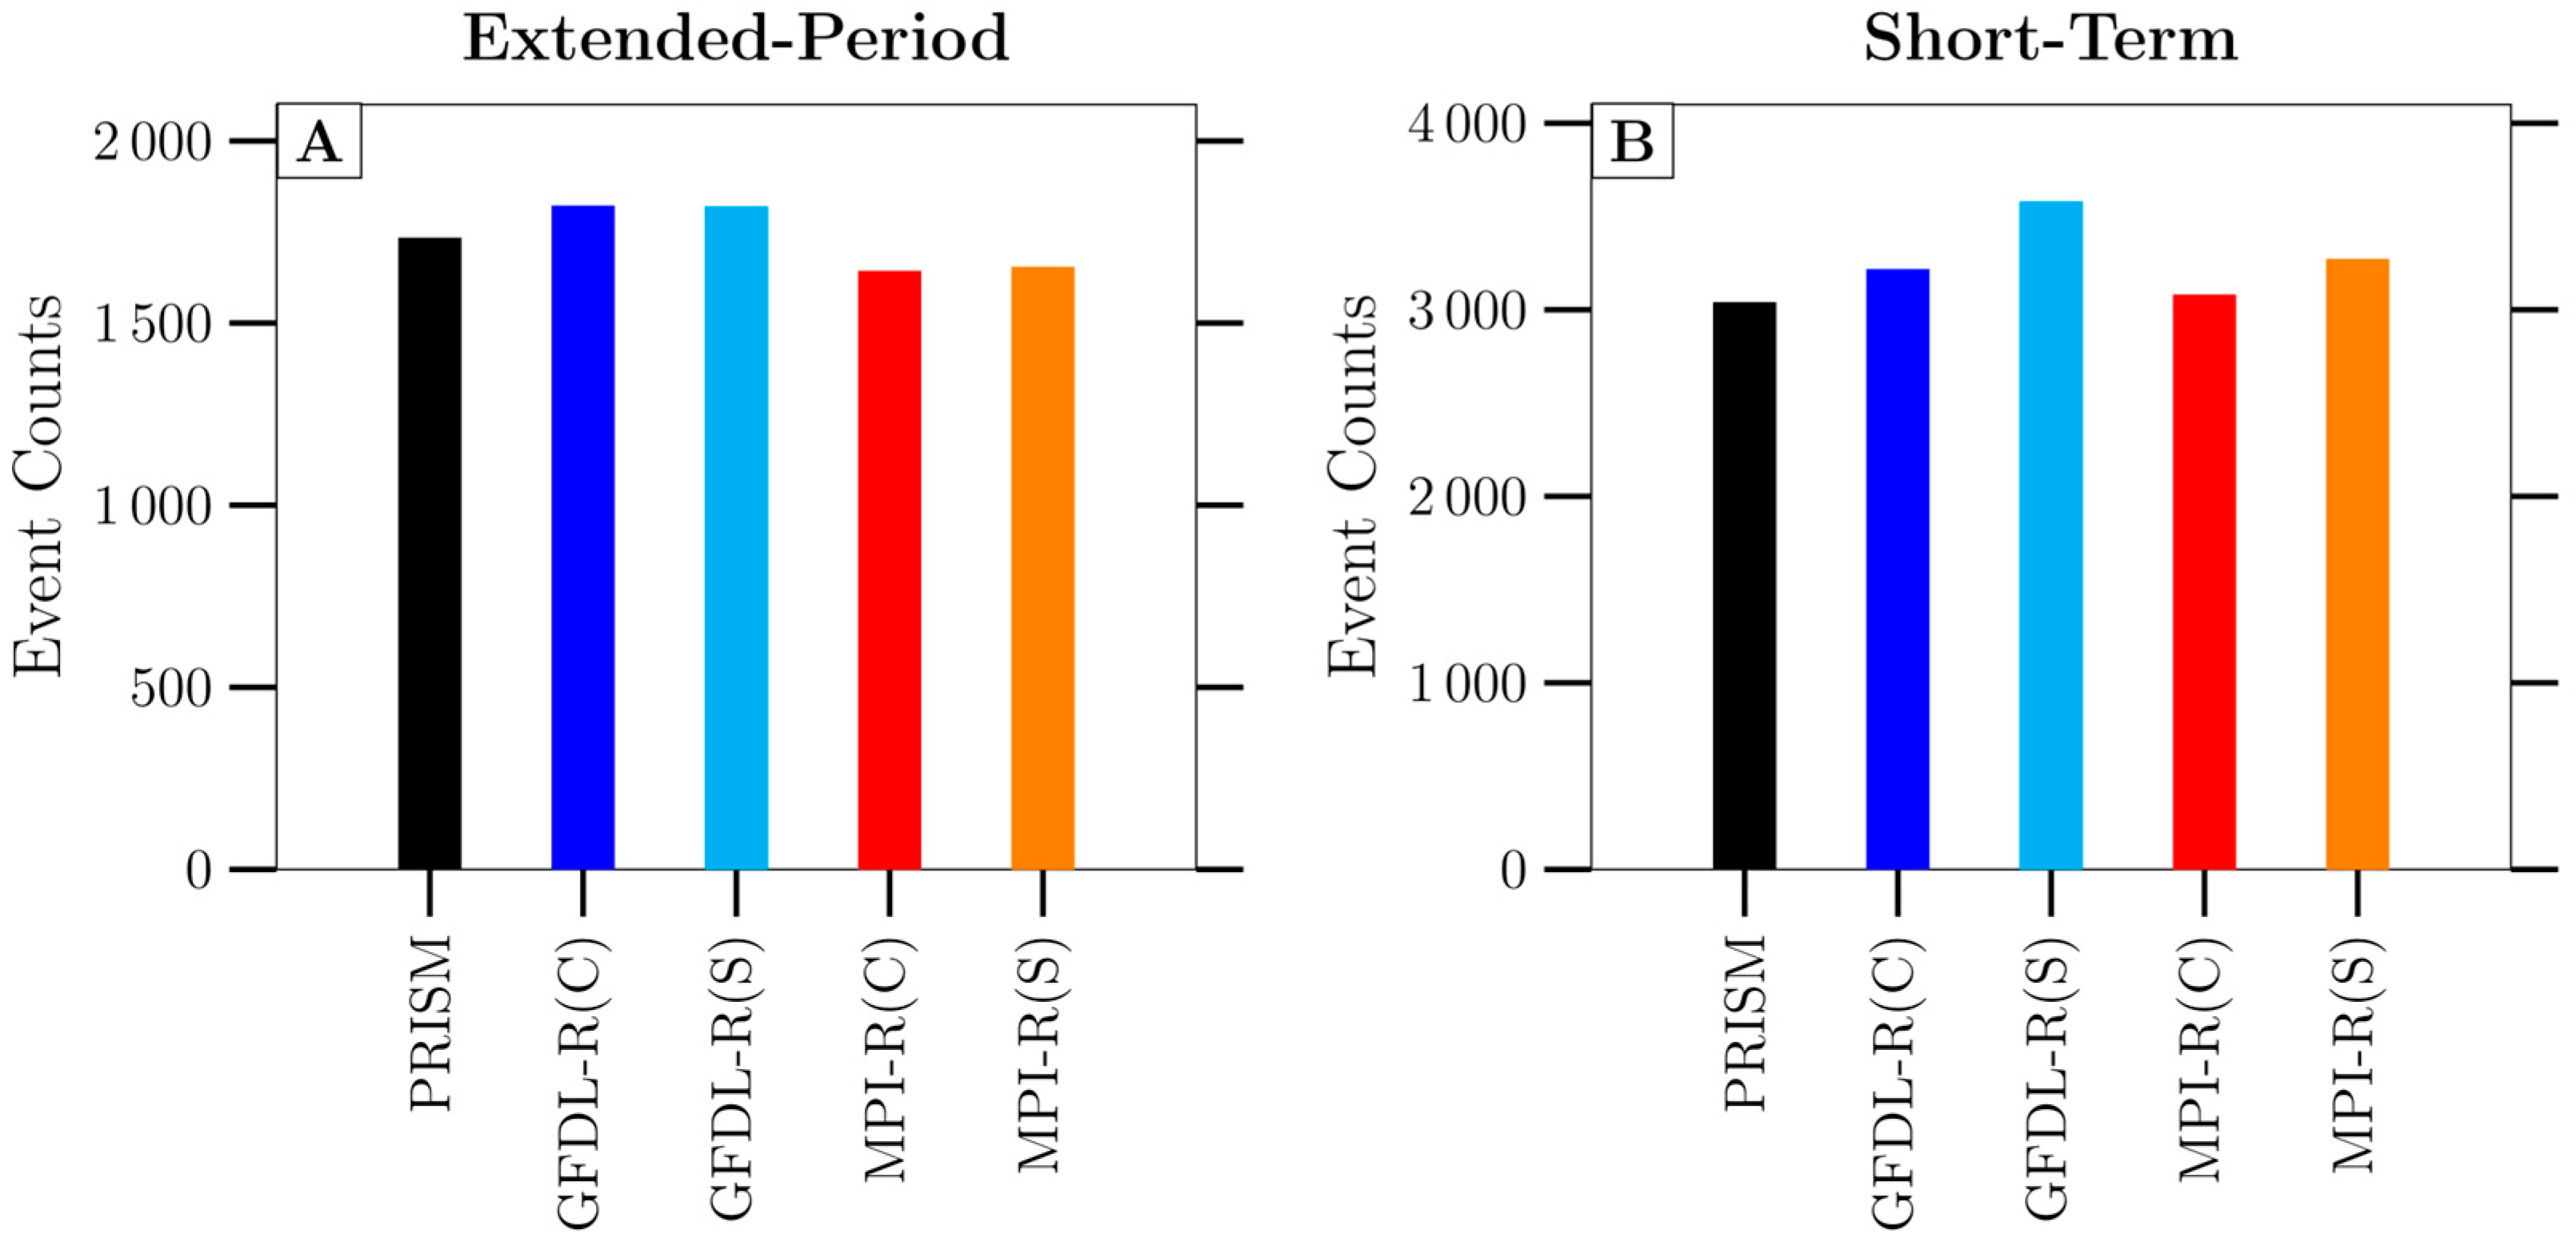
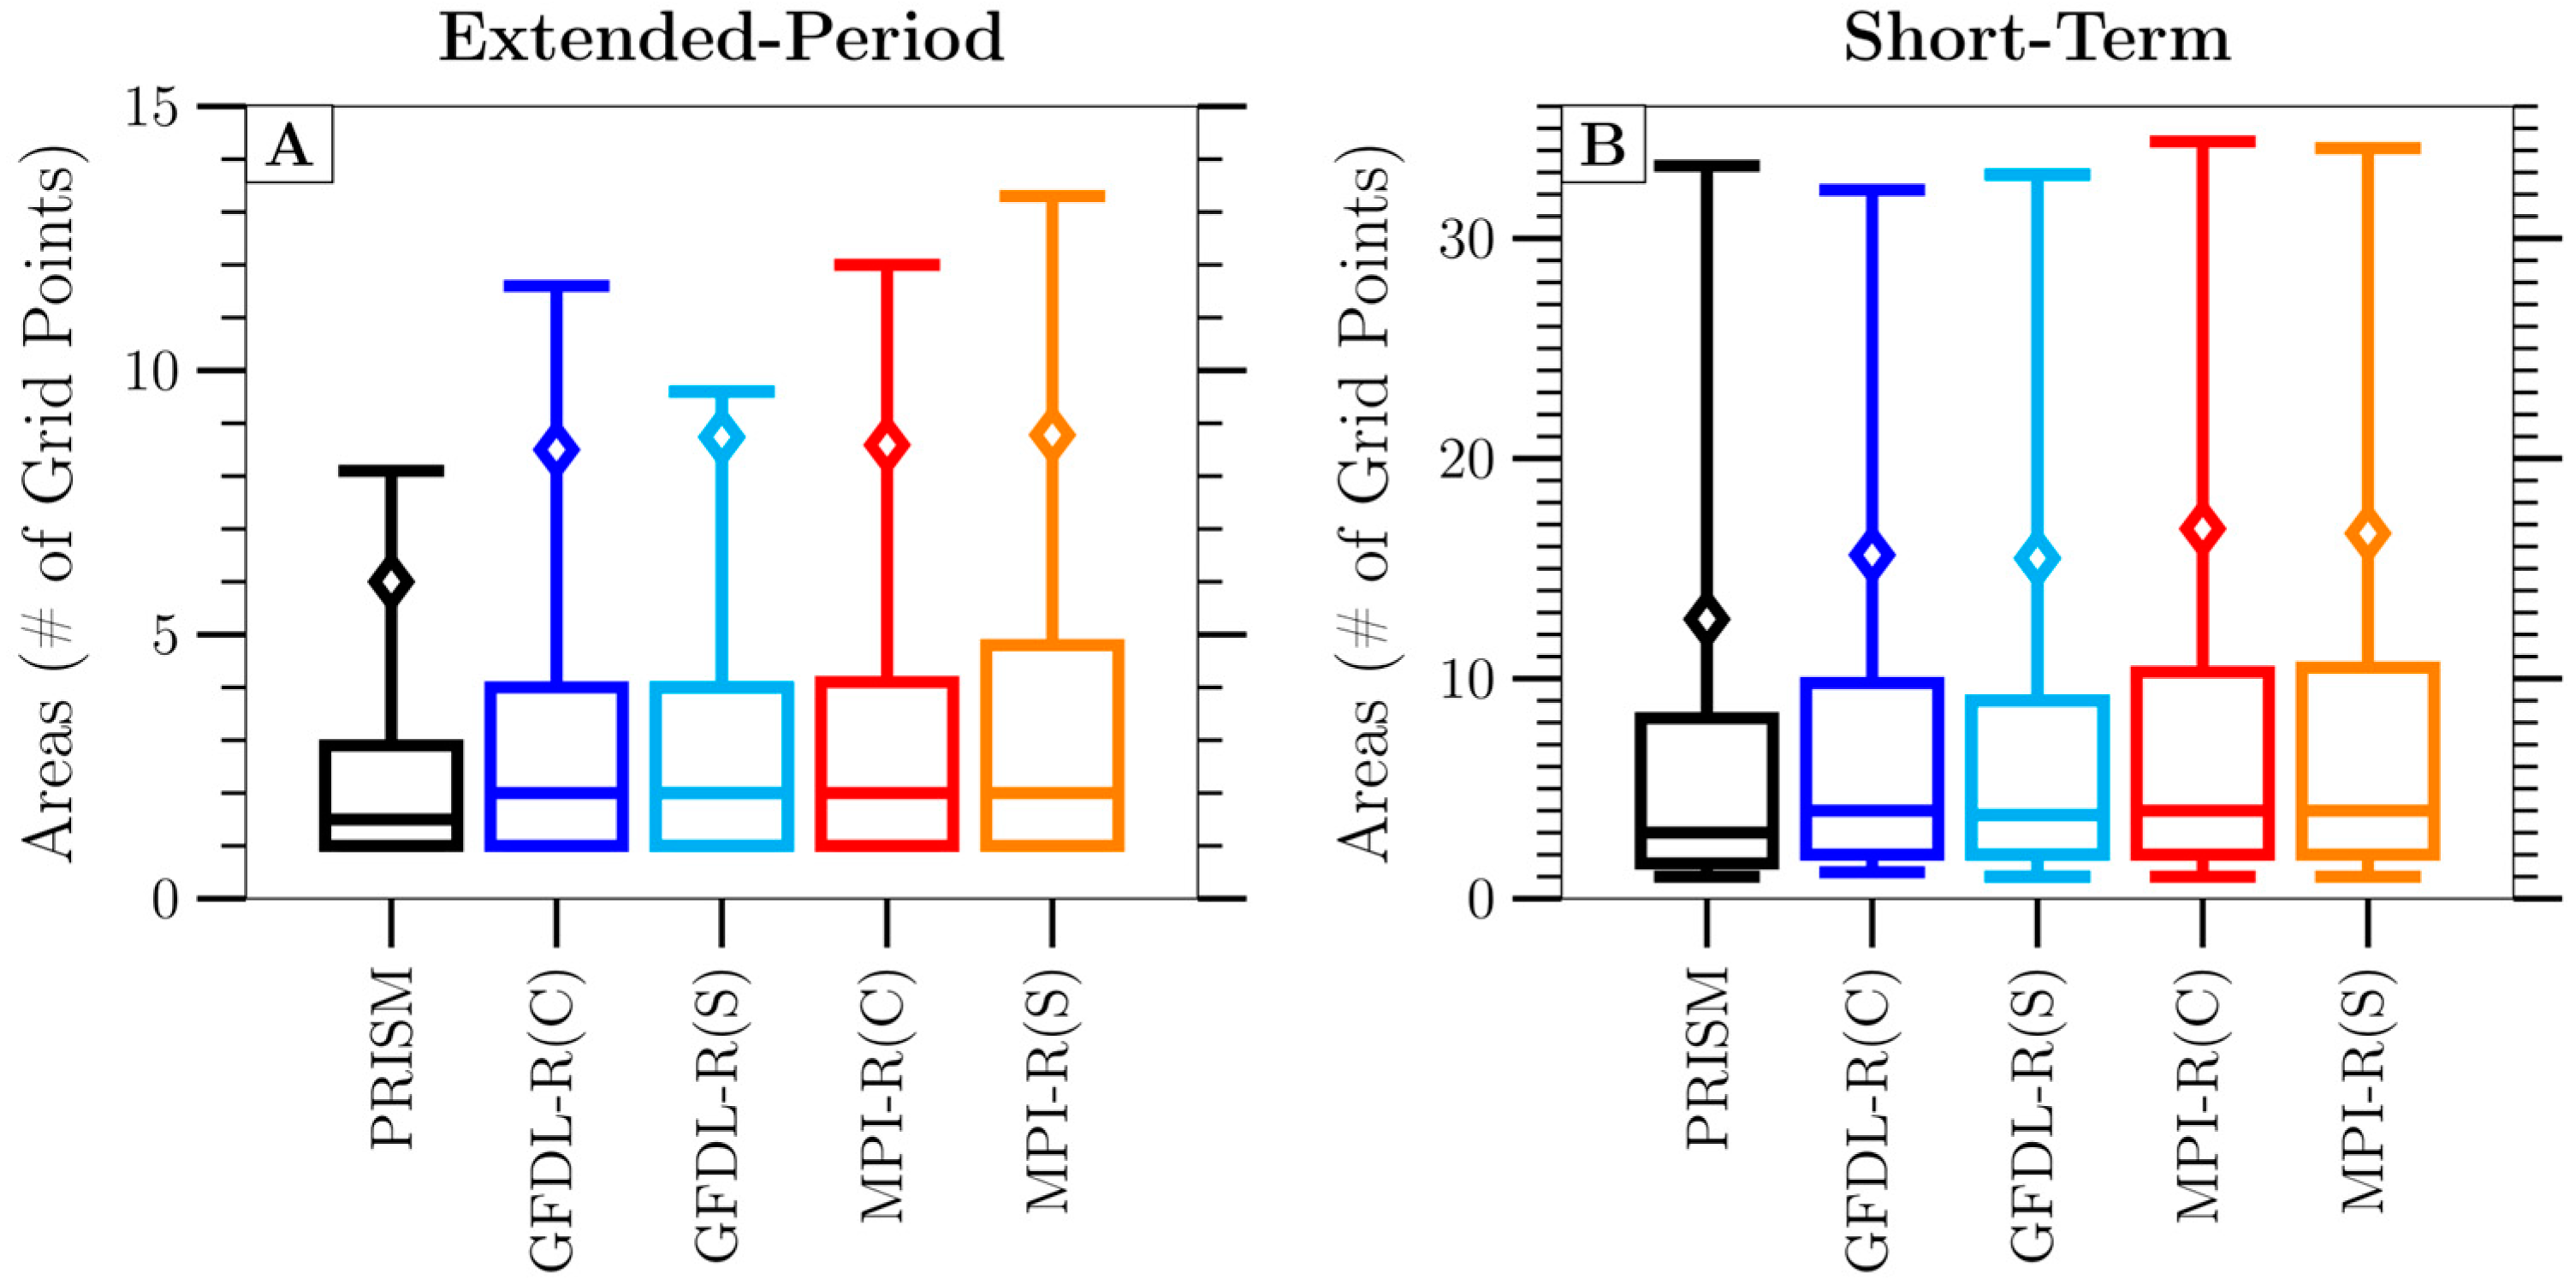
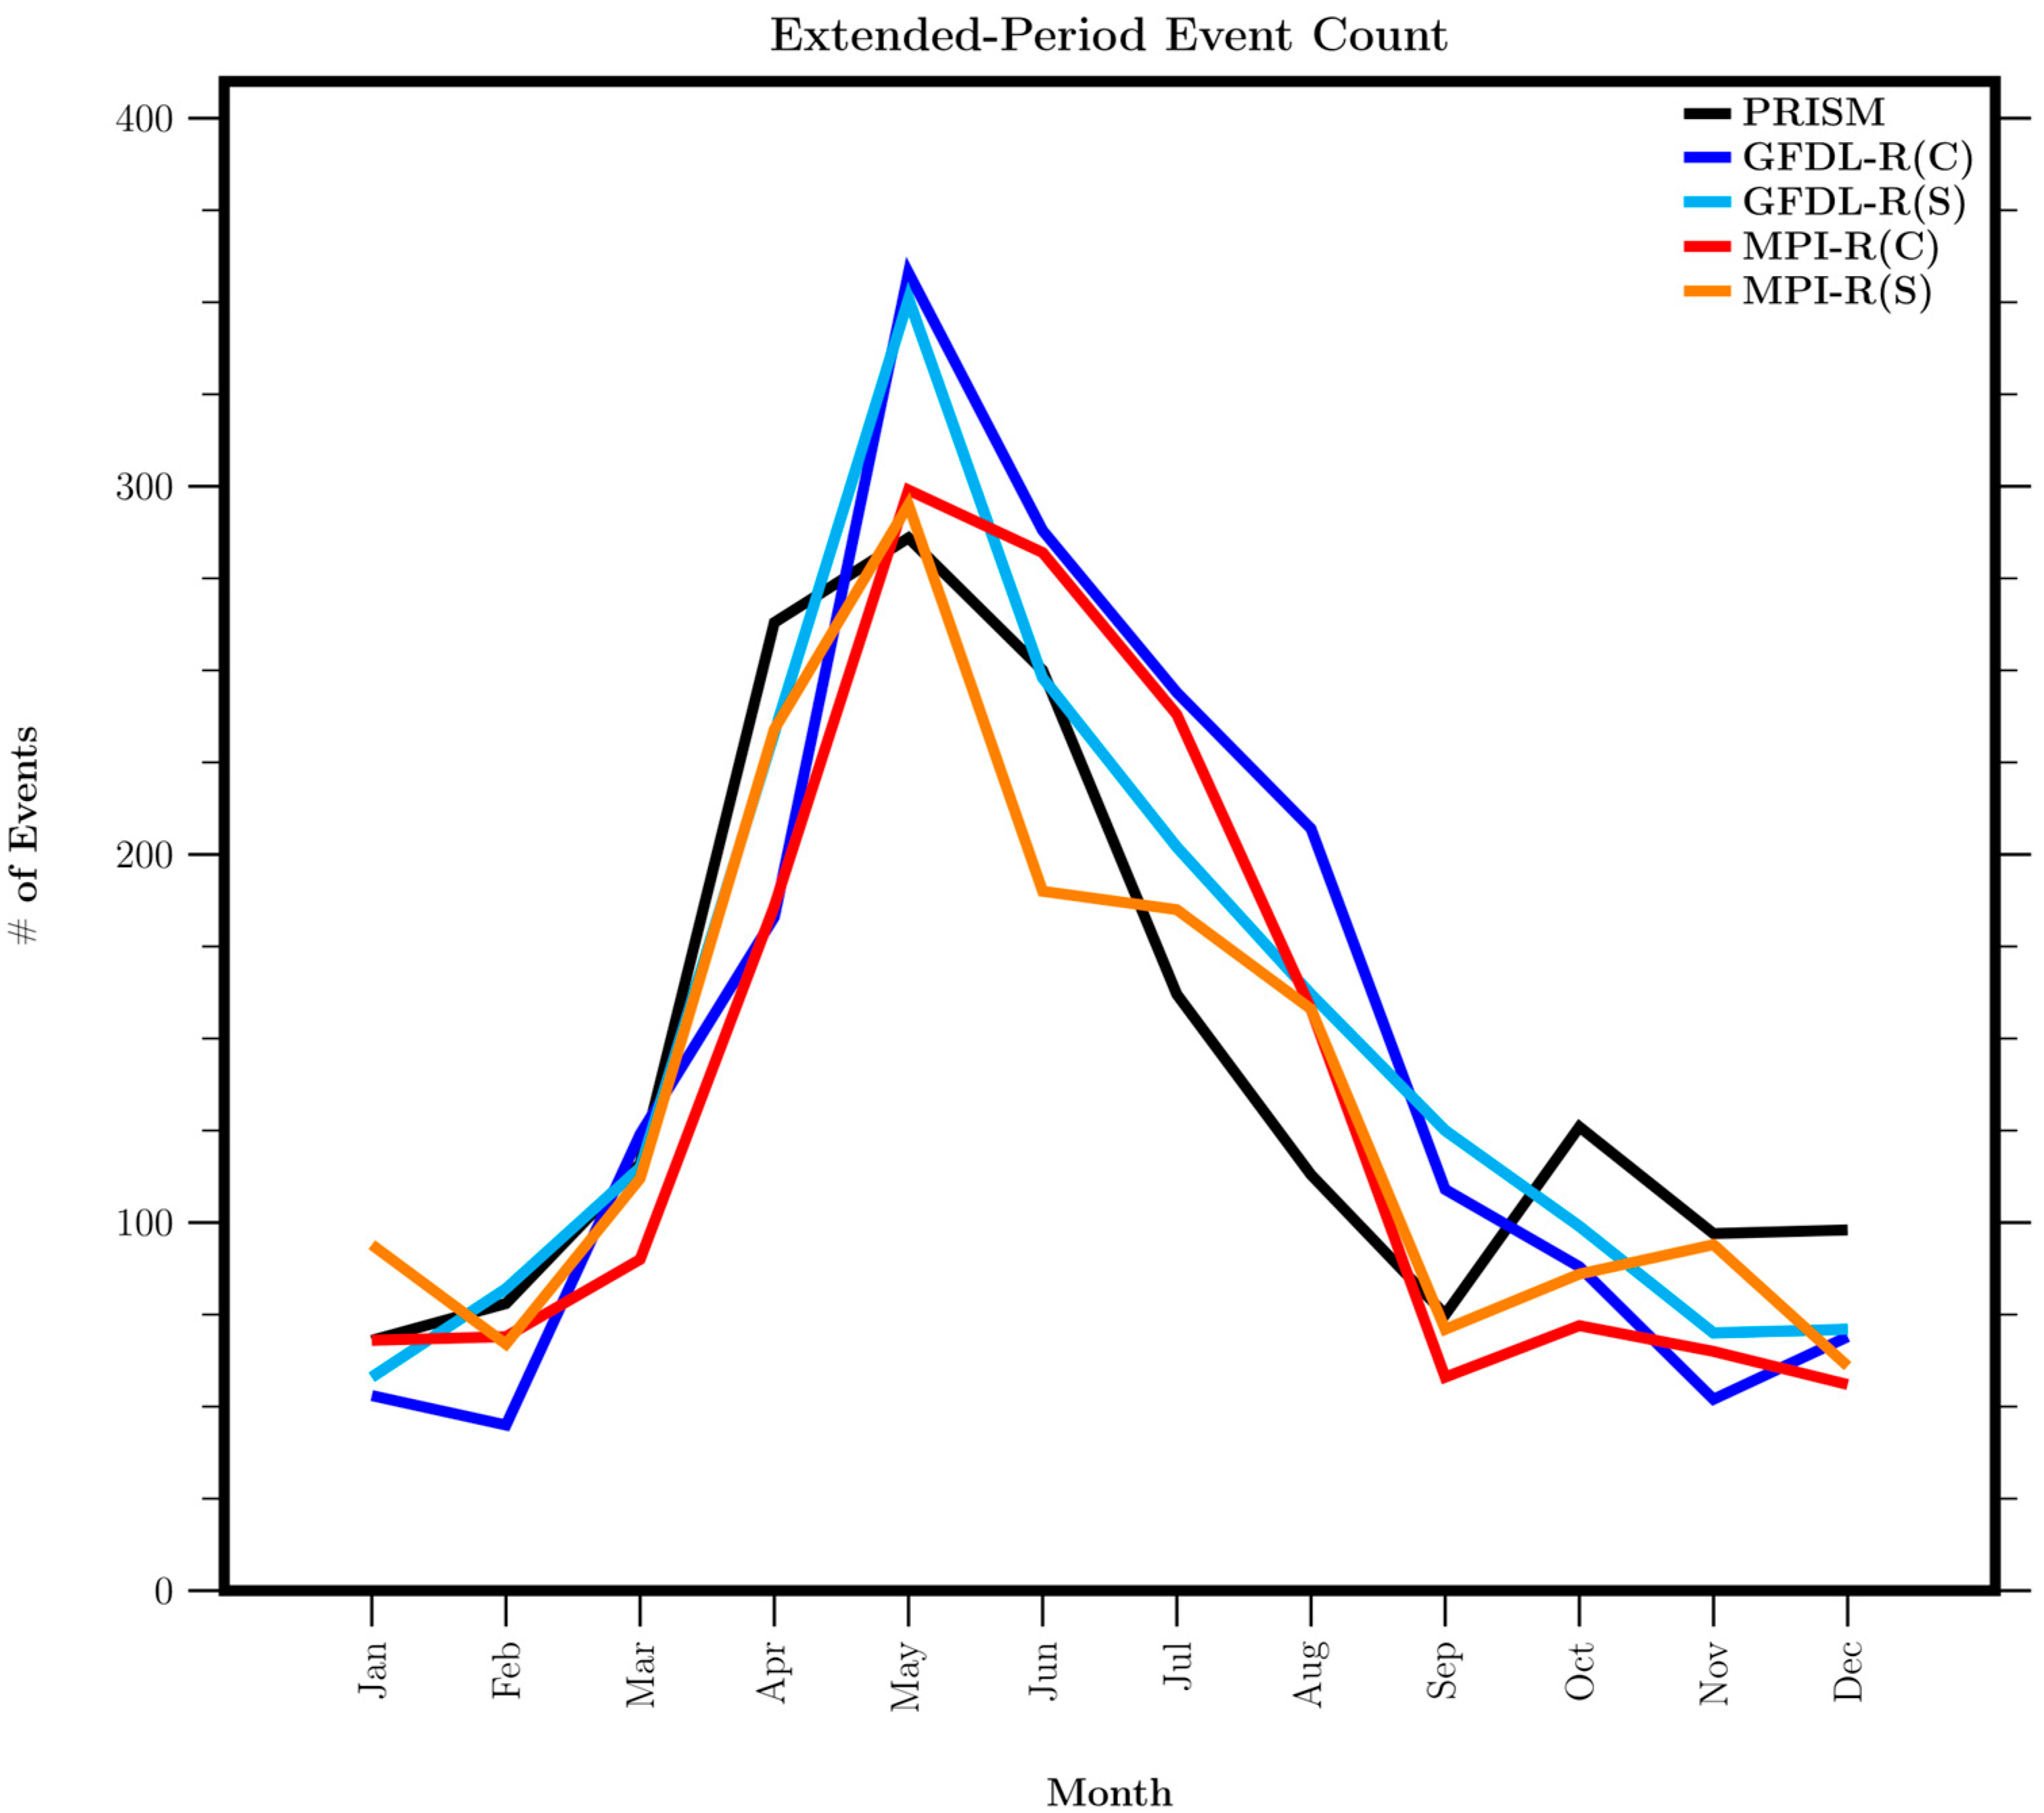
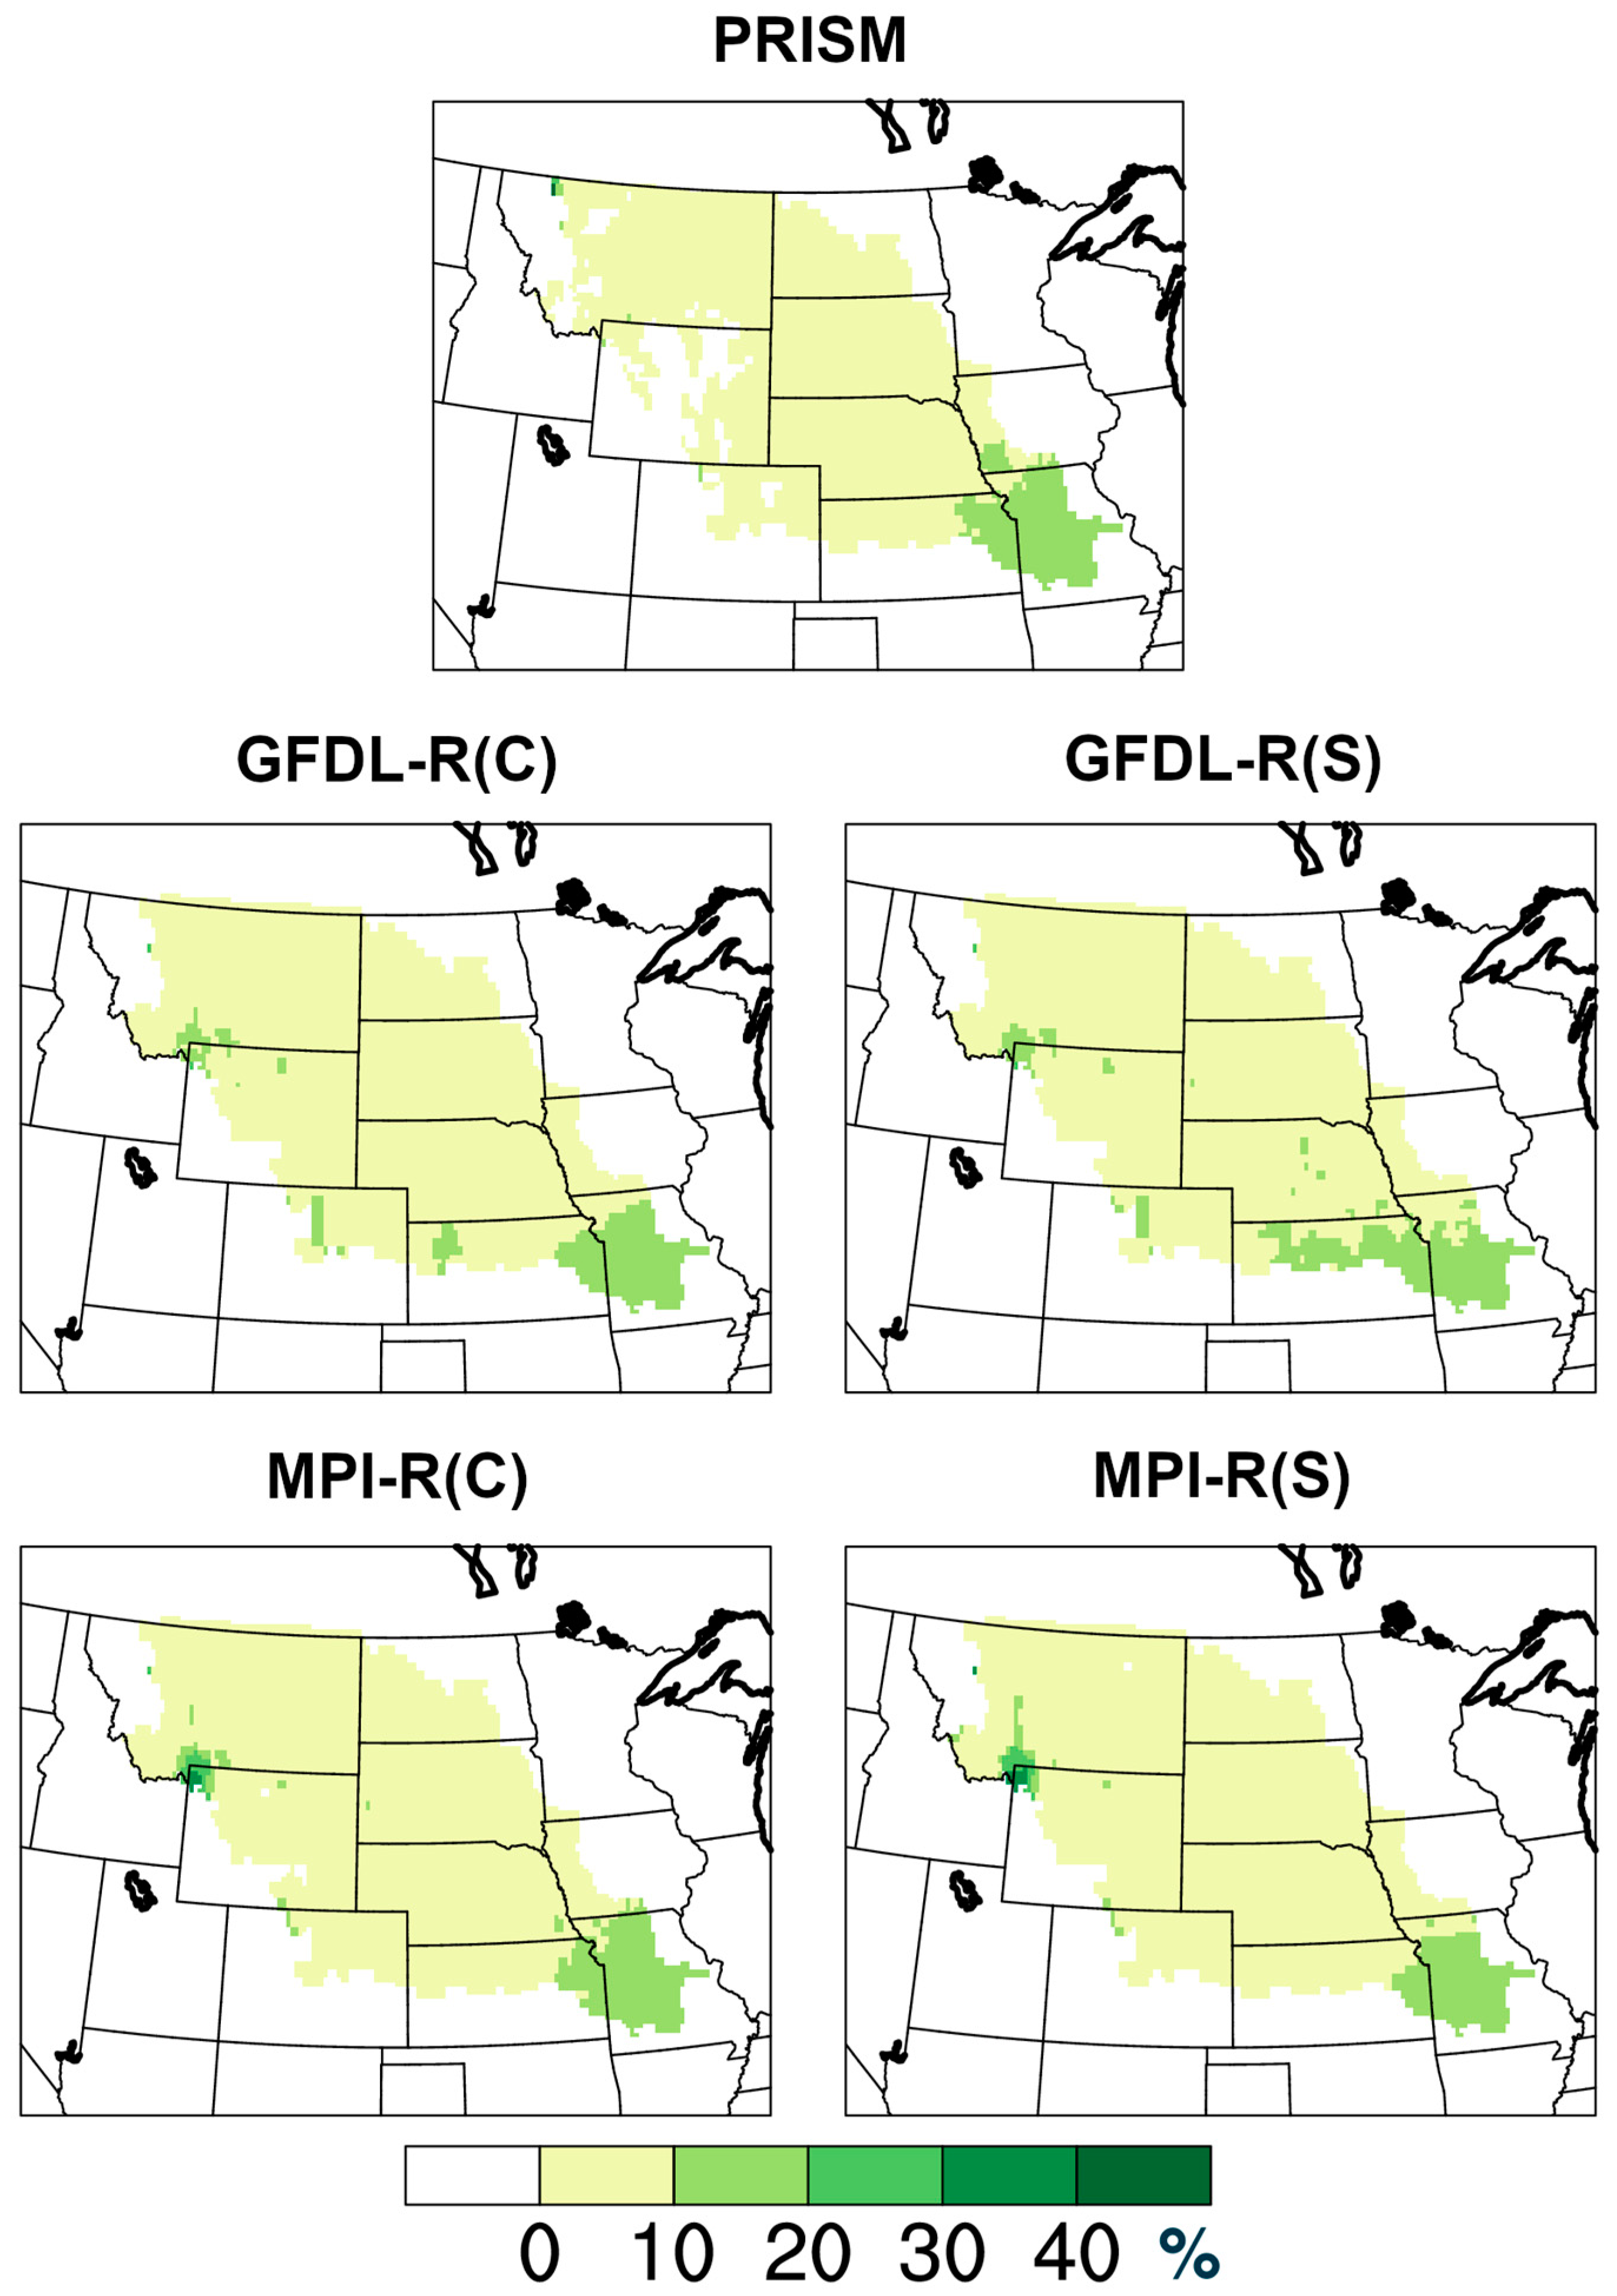
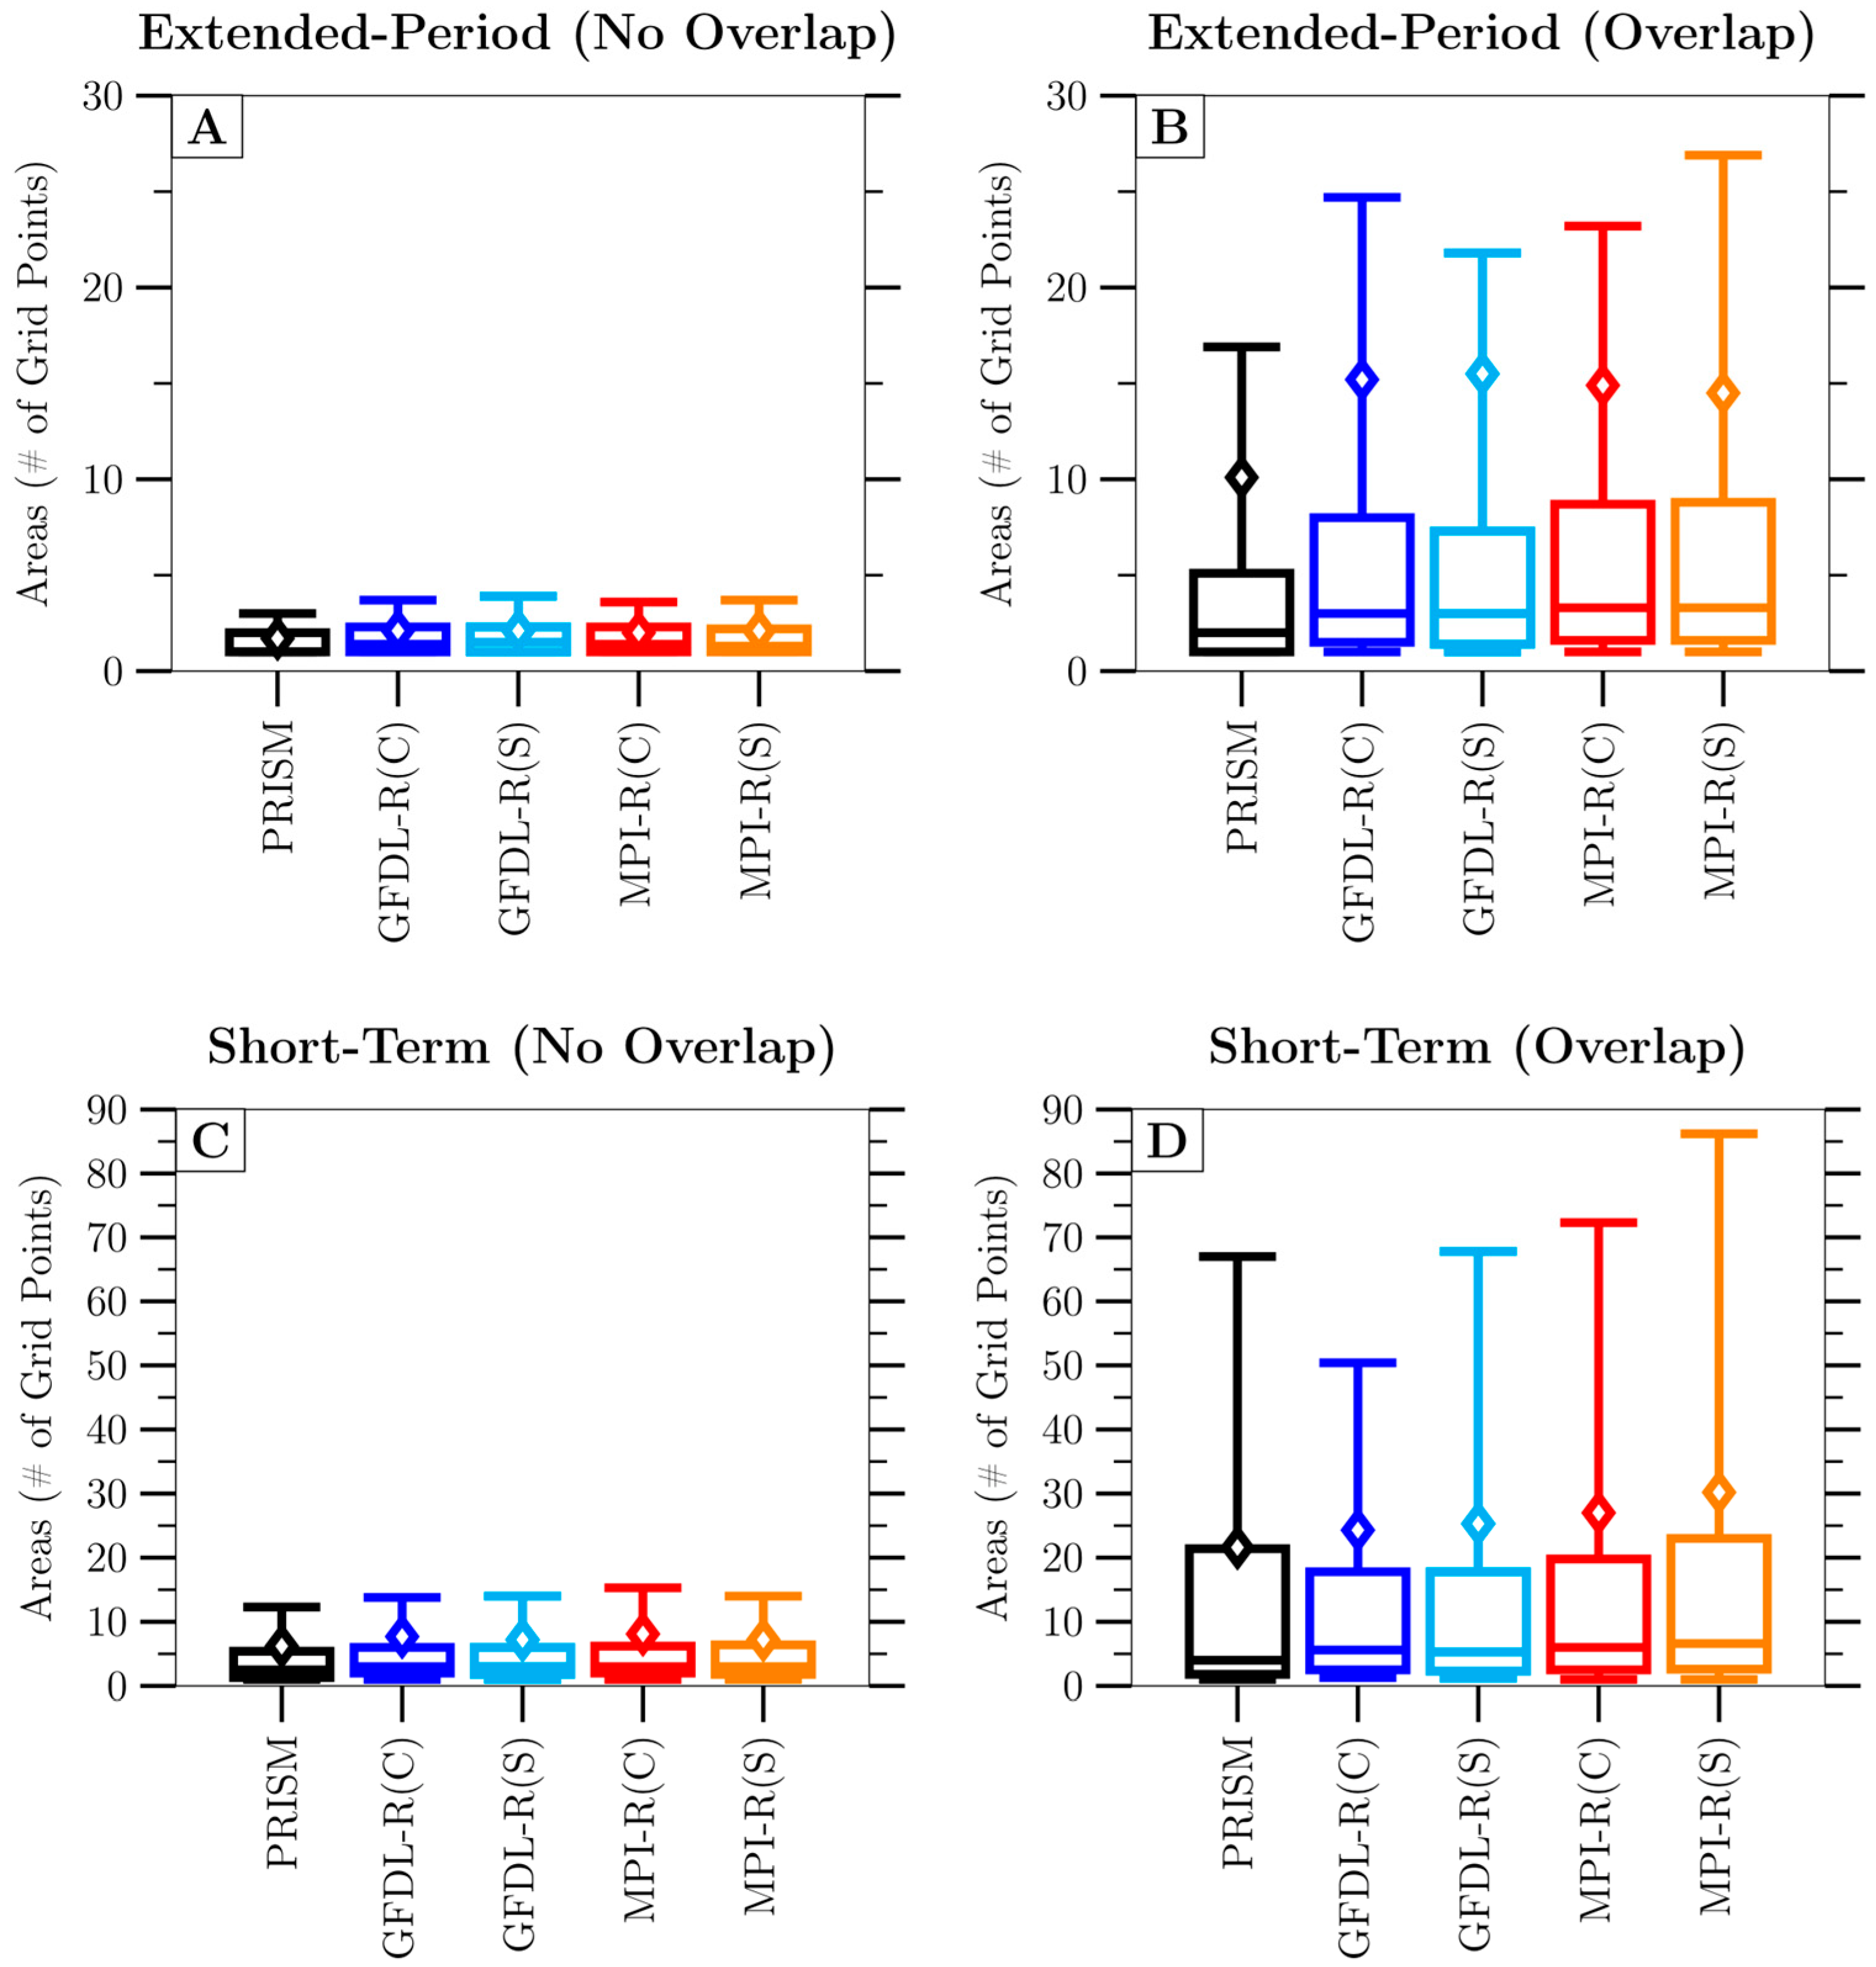
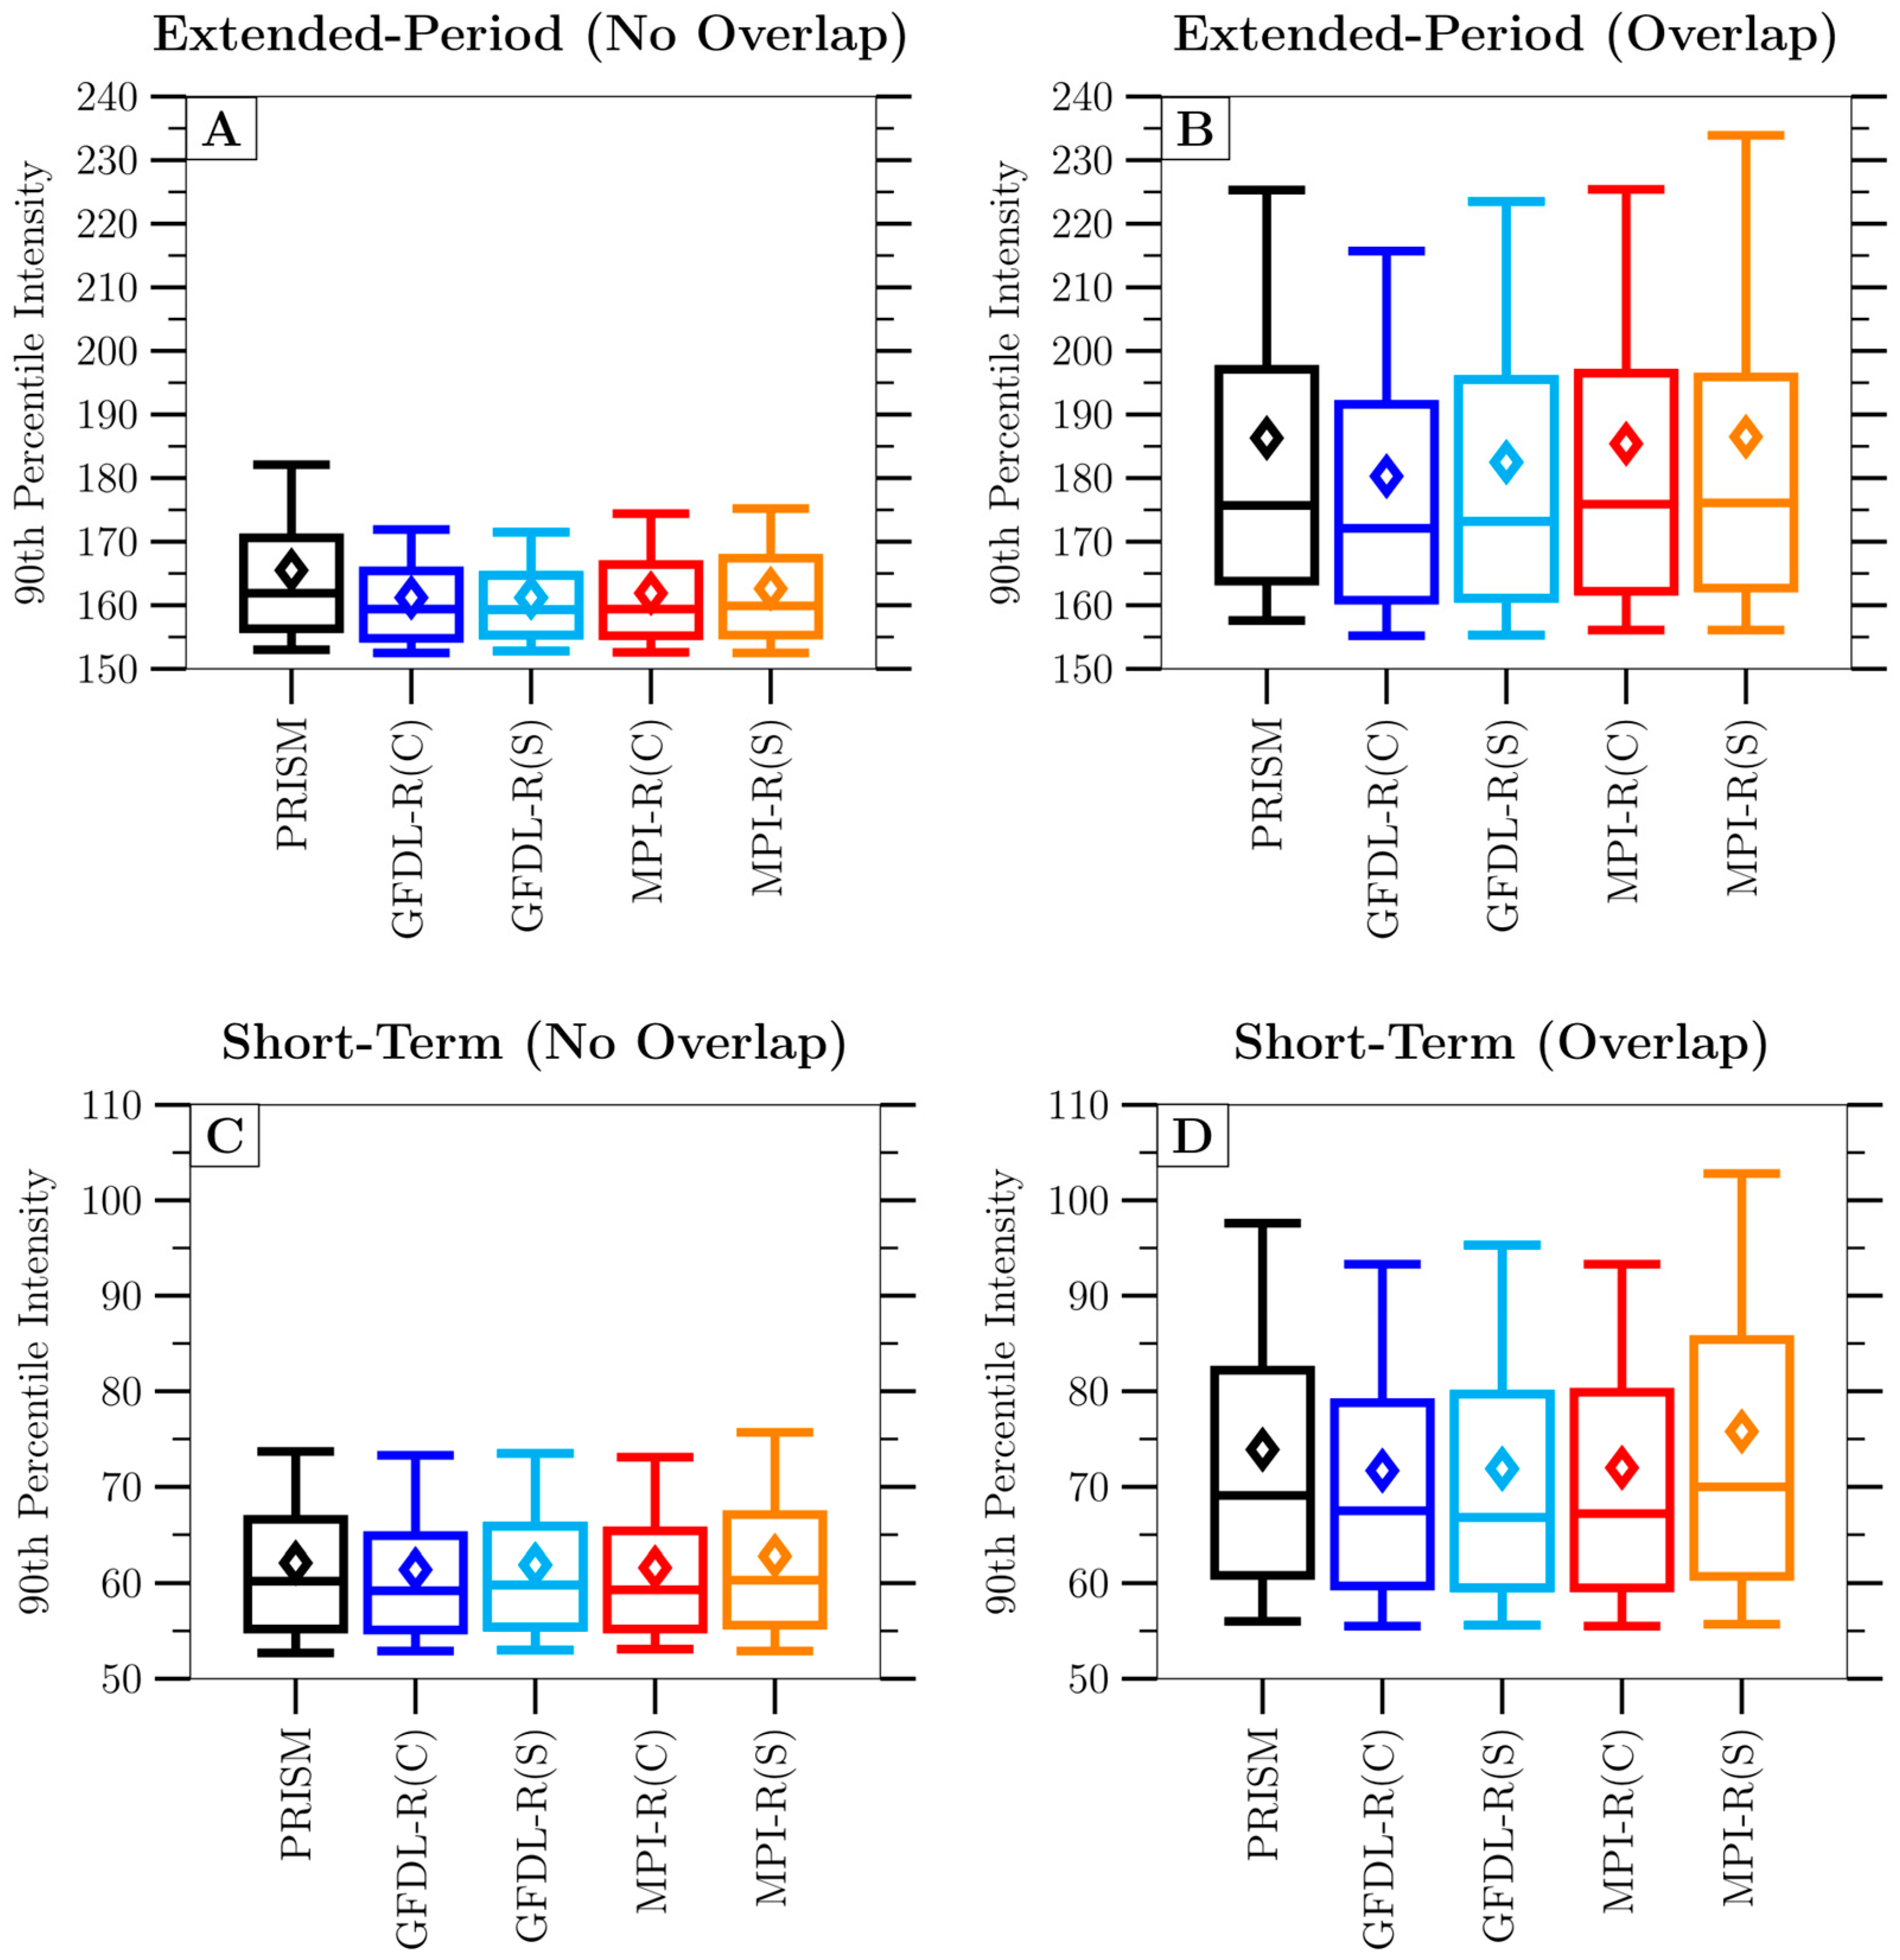
3.1. Extended-Period Events

Figure 2 shows the number of extended-period events for each of our 20-year periods and data sources. Simulation frequencies for the contemporary climate are similar to the PRISM frequencies, within ~5%. The frequencies changed little with the climate change. The simulations’ event areas in the contemporary climate are also similar to the PRISM areas (Figure 3). The simulations’ median areas are about 30% larger than the PRISM observation’s median area. The simulations also have a skewing toward larger areas at the 90% level compared to the PRISM observations. These features imply that the effective resolution of the simulations is somewhat larger than the 25 km grid spacing used by the regional model. As with event frequency, the distribution of median event areas changes little with the climate change examined here. Event durations in the simulations (not shown) agree to within a few percent with the durations of observed events and, again, with little change as the climate changes. The nearly unchanging event areas and durations in the scenario versus contemporary climates suggest that the driving dynamics for these events do not change with climate change.
The extended-period events have an annual cycle (Figure 4) that peaks in late spring (May) for the observations and all simulations. The frequencies decrease through the summer (June–August) and are relatively flat through autumn (September–November) and winter (December–February). The annual cycle of the extended-period events resembles the annual cycle of precipitation in the basin [2], though the overall precipitation peaks in June rather than May.
The spatial distribution of event frequencies appears in Figure 5, which shows the percentage time that a grid point is part of an extended-period event. Both the observations and the simulations show a skewing toward the southeast corner of the basin, which is the part of the basin closest to a major moisture source for the region, the Gulf of Mexico, and the portion of the basin that tends to have the warmest temperatures [30]. The contemporary-climate simulations show some areas of higher frequency that do not appear in the observations, most notably in the mountainous regions of the basin where the states of Idaho, Montana, and Wyoming meet. The reason for this discrepancy is not clear, though the higher frequencies of simulated events compared to observed frequencies in July and August suggests that persistent mountain-generated precipitation may be a cause. Figure 5 also shows no substantial change in event frequencies between contemporary and scenario climates in each model; the frequency patterns remain largely the same in the two climates. Because events are skewed toward the warmest location of the basin, it is noteworthy that a warmer climate with more overall precipitation for the basin in the future scenarios [8] does not yield more frequent extended-period events.

3.2. Short-Term Events

The short-term events show features similar in character to the extended-period events. The simulated contemporary frequencies are within a few percent of the observed frequency (Figure 2), though the short-term event frequencies do increase in the scenario climate by about 6–11%, unlike the extended-period events. This increase is similar to the increase in average precipitation across the basin for these two simulations [8]. Similar to the extended-period events, their median areas are about 30% larger than the observed median area, although, unlike the extended-period events, the short-term events do not show skewing toward larger areas at the 90th percentile relative to the PRISM areas. Similar to the extended-period events, the short-term median event areas change little going to the scenario climate. As with the extended-period events, short-term event durations in the simulations (not shown) agree to within a few percent with the durations of observed events and change little as the climate changes.

3.3. Overlapping Extended-Period and Short-Term Events

Of interest is how much the extended-period and short-term events might influence the occurrence and features of each other. The threshold for the short-term events, 50 mm, means that any short-term event provides at least one third of the precipitation that must accumulate over a 30-day period to yield an extended-period event. Any short-term event can thus provide a foundation for an extended-period event. The short-term events tend to have areas 2–3 times larger than extended-period events (Figure 3), so the occurrence of a 5-day event for some grid points does not guarantee the points will be embedded in an extended-period event. Instead, roughly half of the extended-period events overlap with at least one short-term event (Table 1). When overlap does occur, over three quarters of the time, only one short-term event contributes to the extended-period event (Table 1). There are, thus, two general categories, with roughly equal frequency, of extended-period events: those linked to a short-term event and those with no associated short-term event.
The extended-period events that overlap with a short-term event tend to have a substantially larger area and duration (Figure 6 and Figure 7). The foundation provided by the short-term event occurring during an extended-period event may be viewed as yielding larger and longer lasting extended-period precipitation events. About 45% of the short-term events have an overlap with the extended-period events, and these events also tend to be larger and longer lasting than the short-term events occurring independently of an extended-period event. The intensity of precipitation within the short-term and extended-period events with overlap is also substantially greater than in their corresponding events with no overlap (e.g., Figure 8). The overall behavior indicates that periods when the events overlap are periods with especially substantial precipitation that covers relatively larger areas. The annual cycle of overlap frequency (not shown) is similar to the annual cycle of extended-period events appearing in Figure 5, suggesting that the differences in event characteristics are not due to seasonal differences between episodes of overlapping events and episodes of non-overlapping events. Rather, the results suggest different hydroclimate dynamics are occurring when extended-period events have short-term events of high precipitation embedded in them.

4. Summary and Conclusions

We have used an object-oriented diagnostic method to analyze short-term and extended-period events with substantial precipitation in the Missouri River Basin for contemporary and future scenario climates simulated by the regional model RegCM4, using 2 different GCM simulations for boundary conditions and 25 km grid spacing. The object-oriented approach allows us to define specific object types that we then consider our events of interest. The short-term events occur when cumulative precipitation exceeds 50 mm in a 5-day window that moves forward with time in 1-day increments, and these events are in the upper 5% of precipitation intensity for 5-day periods with any precipitation. Similarly, the extended-period events occur when cumulative precipitation exceeds 150 mm in a 30-day window that moves forward with time in 1-day increments. The extended-period precipitation events are in the upper 25% of all precipitation events for the extended-period events, thus representing periods of substantial precipitation. This analysis includes comparisons with corresponding events produced by the observational PRISM data set, aggregated to a 25 km grid.
Events of both types produced by the simulations of the contemporary climate agree well with PRISM events for frequency and duration of the events, within about 5%. Simulated events in the contemporary climate have median areas that are ~30% larger than the PRISM events for both the short-term and extended-period events. The simulated contemporary events also tend to be skewed toward larger areas at higher percentiles, suggesting that the effective resolution of the RCM simulations is somewhat coarser than 25 km. Results using either driving GCM are similar, indicating that differences from the PRISM results are attributable to the RCM used rather than the GCM boundary conditions for the two GCMs used here.
Spatial distributions of the extended-period events are similar in observations and contemporary-climate simulations, except for some differences in the northwestern mountainous part of the basin. Otherwise, the highest frequencies are concentrated to the southeastern end of the basin, which is the part closest to a major source of atmospheric water, the Gulf of Mexico, and where temperatures are generally warmer, which can allow for more precipitable water. Despite this skewing toward the warmest part of the basin in both contemporary and scenario climates, and even though the warmer scenario climate has more overall precipitation for the basin, the extended-period events do not become more frequent.
The extended-period precipitation events are more frequent in observations and contemporary-climate simulations during the warmer months of April–September and substantially less frequent during the colder months of October–March. However, although the observations and the contemporary-climate simulations have similar frequencies, the simulations have a larger amplitude to their annual cycle than the observations; the simulations, thus, give more production of extended-period precipitation events in warmer conditions than do the observations, in contrast to a lack of frequency increase when the climate overall warms.
The short-term, heavy-precipitation events increase in frequency in the warmer scenario climate to an amount consistent with the mean precipitation in the simulations. This increase in such a climate-impact driver (as defined by [5]) indicates the potential for substantial impact on how water is managed in the basin in the future climate. Studies with surface hydrology and agriculture models could provide important guidance on appropriate responses to the changing climate in a watershed that makes substantial economic contributions. In addition, further exploration with more GCM-RCM combinations would help discern model-dependent event behavior, especially when projecting future changes. Using boundary conditions from multiple realizations by one GCM (so-called single-model initial condition large ensembles or SMILES; [31]) could help separate the climate change signal from a region’s unforced hydroclimate variability.
In contrast to the short-term events, the extended-period events are remarkable for showing no increase in frequency. A factor to be explored further would be why the frequency of these events is nearly constant, despite the increase in overall precipitation. For both the short-term and extended period events, event areas and durations change little with the climate change, indicating that the controlling dynamics for both remains the same as the climate changes.
Considering the relationship between the short-term events and the extended-period events, in both the observations and all simulations, about half of the extended-period events have at least one short-term event occurring in them. Most often, only one short-term event overlaps an extended-period event. Overlapping events generally have greater area and longer duration than their non-overlapping counterparts. The short-term and extended-period events that overlap indicate that both are products of periods with substantial precipitation. There is, thus, a contrast with the non-overlapping events, which are more spatially confined and endure for shorter periods. An analysis of the climate dynamics that might distinguish between overlapping and non-overlapping extended-period events might be useful for understanding how and why these 2 types of extended-period events with substantial precipitation, generally 75th percentile or greater, occur.

Author Contributions

B.J.F.: conceptualization, methodology, software, formal analysis, investigation, resources, writing—original draft, writing—review and editing, visualization, supervision. N.E.E.: conceptualization, methodology, formal analysis, investigation. C.R.Y.: formal analysis, investigation. A.L.E.: formal analysis, investigation. W.J.G.J.: conceptualization, methodology, software, formal analysis, investigation, resources, writing—original draft, writing—review and editing, visualization, supervision, project administration. All authors have read and agreed to the published version of the manuscript.

Funding

This research was funded by U.S. Department of Energy Office of Science Award DE-SC0016438. Additional support came from the Iowa State University First-Year Honors Program.

Data Availability Statement

The PRISM data analyzed here is available from the PRISM website: https://prism.oregonstate.edu/ (accessed on 8 July 2022). North America CORDEX simulation output is available at https://na-cordex.org/data.html (accessed on 19 September 2022).

Acknowledgments

The authors thank simulation groups at Iowa State and the U.S. National Center for Atmospheric Research (NCAR) for producing and archiving the North America CORDEX output used here. NCAR is sponsored by the U.S. National Science Foundation. The U.S. Department of Defense Environmental Security Technology Certification Program has provided additional support for the North American CORDEX archive.

Conflicts of Interest

The authors declare no conflict of interest.

References

  1. Mehta, V.M.; Knutson, C.L.; Rosenberg, N.J.; Olsen, J.R.; Wall, N.A.; Bernadt, T.K.; Hayes, M.J. Decadal Climate Information Needs of Stakeholders for Decision Support in Water and Agriculture Production Sectors: A Case Study in the Missouri River Basin. Weather Clim. Soc. 2013, 5, 27–42. [Google Scholar] [CrossRef]
  2. Wise, E.K.; Woodhouse, C.A.; McCabe, G.J.; Pederson, G.T.; St-Jacques, J.-M. Hydroclimatology of the Missouri River Basin. J. Hydrometeorol. 2018, 19, 161–182. [Google Scholar] [CrossRef]
  3. USGS. Access National Hydrography Products. Available online: https://www.usgs.gov/national-hydrography/access-national-hydrography-products (accessed on 11 January 2023).
  4. Seneviratne, S.I.; Zhang, X.; Adnan, M.; Badi, W.; Dereczynski, C.; Di Luca, A.; Ghosh, S.; Iskandar, I.; Kossin, J.; Lewis, S.; et al. Weather and Climate Extreme Events in a Changing Climate. In Climate Change 2021: The Physical Science Basis. Contribution of Working Group I to the Sixth Assessment Report of the Intergovernmental Panel on Climate Change; Masson-Delmotte, V., Zhai, P., Pirani, A., Connors, S.L., Péan, C., Berger, S., Caud, N., Chen, Y., Goldfarb, L., Gomis, M.I., et al., Eds.; Cambridge University Press: Cambridge, UK; New York, NY, USA, 2021; pp. 1513–1766. [Google Scholar]
  5. Ranasinghe, R.; Ruane, A.C.; Vautard, R.; Arnell, N.; Coppola, E.; Cruz, F.A.; Dessai, S.; Islam, A.S.; Rahimi, M.; Ruiz Carrascal, D.; et al. Climate Change Information for Regional Impact and for Risk Assessment. In Climate Change 2021: The Physical Science Basis. Contribution of Working Group I to the Sixth Assessment Report of the Intergovernmental Panel on Climate Change; Masson-Delmotte, V., Zhai, P., Pirani, A., Connors, S.L., Péan, C., Berger, S., Caud, N., Chen, Y., Goldfarb, L., Gomis, M.I., et al., Eds.; Cambridge University Press: Cambridge, UK; New York, NY, USA, 2021; pp. 1767–1926. [Google Scholar]
  6. PRISM Climate Group. PRISM Climate Data. 2022. Available online: https://prism.oregonstate.edu/ (accessed on 8 July 2022).
  7. Jones, P.W. First- and Second-Order Conservative Remapping Schemes for Grids in Spherical Coordinates. Mon. Weather. Rev. 1999, 127, 2204–2210. [Google Scholar] [CrossRef]
  8. Bukovsky, M.S.; Mearns, L.O. Regional climate change projections from NA-CORDEX and their relation to climate sensitivity. Clim. Chang. 2020, 162, 645–665. [Google Scholar] [CrossRef]
  9. McGinnis, S.; Mearns, L. Building a climate service for North America based on the NA-CORDEX data archive. Clim. Serv. 2021, 22, 100233. [Google Scholar] [CrossRef]
  10. Giorgi, F.; Gutowski, W.J. Regional Dynamical Downscaling and the CORDEX Initiative. Annu. Rev. Environ. Resour. 2015, 40, 467–490. [Google Scholar] [CrossRef]
  11. Gutowski, W.J.; Giorgi, F. Coordination of Regional Downscaling. In Oxford Research Encyclopedia of Climate Science; Oxford University Press: Oxford, UK, 2020. [Google Scholar] [CrossRef]
  12. Dunne, J.P.; John, J.G.; Adcroft, A.J.; Griffies, S.M.; Hallberg, R.W.; Shevliakova, E.; Stouffer, R.J.; Cooke, W.; Dunne, K.A.; Harrison, M.J.; et al. GFDL’s ESM2 Global Coupled Climate–Carbon Earth System Models. Part I: Physical Formulation and Baseline Simulation Characteristics. J. Clim. 2012, 25, 6646–6665. [Google Scholar] [CrossRef]
  13. Dunne, J.P.; John, J.G.; Shevliakova, E.; Stouffer, R.J.; Krasting, J.P.; Malyshev, S.L.; Milly PC, D.; Sentman, L.T.; Adcroft, A.J.; Cooke, W.; et al. GFDL’s ESM2 Global Coupled Climate–Carbon Earth System Models. Part II: Carbon System Formulation and Baseline Simulation Characteristics*. J. Clim. 2013, 26, 2247–2267. [Google Scholar] [CrossRef]
  14. Jungclaus, J.H.; Fischer, N.; Haak, H.; Lohmann, K.; Marotzke, J.; Matei, D.; Mikolajewicz, U.; Notz, D.; Storch, J.S. Characteristics of the ocean simulations in the Max Planck Institute Ocean Model (MPIOM) the ocean component of the MPI-Earth system model. J. Adv. Model. Earth Syst. 2013, 5, 422–446. [Google Scholar] [CrossRef]
  15. Stevens, B.; Giorgetta, M.; Esch, M.; Mauritsen, T.; Crueger, T.; Rast, S.; Salzmann, M.; Schmidt, H.; Bader, J.; Block, K.; et al. Atmospheric component of the MPI-M Earth System Model: ECHAM6. J. Adv. Model. Earth Syst. 2013, 5, 146–172. [Google Scholar] [CrossRef]
  16. Taylor, K.E.; Stouffer, R.J.; Meehl, G.A. An Overview of CMIP5 and the Experiment Design. Bull. Am. Meteorol. Soc. 2012, 93, 485–498. [Google Scholar] [CrossRef]
  17. Giorgi, F.; Anyah, R.O. The road towards RegCM4. Clim. Res. 2012, 52, 3–6. [Google Scholar] [CrossRef]
  18. Moss, R.H.; Edmonds, J.A.; Hibbard, K.A.; Manning, M.R.; Rose, S.K.; van Vuuren, D.P.; Carter, T.R.; Emori, S.; Kainuma, M.; Kram, T.; et al. The next generation of scenarios for climate change research and assessment. Nature 2010, 463, 747–756. [Google Scholar] [CrossRef] [PubMed]
  19. Department of Defense. Department of Defense Draft Climate Adaptation Plan. 2021. Available online: https://www.sustainability.gov/pdfs/dod-2021-cap.pdf (accessed on 24 July 2022).
  20. Schwartz, H.G., Jr.; Clark, A.C.; Dickey, G.E.; Eads, G.E.; Gallamore, R.E.; Giuliano, G.; Gutowski, W.J., Jr.; Iwasaki, R.H.; Jacob, K.H.; Karl, T.R.; et al. Potential Impacts of Climate Change on U.S. Transportation. 2008. Available online: https://onlinepubs.trb.org/onlinepubs/sr/sr290.pdf (accessed on 24 July 2022).
  21. Zeng, F.; Li, K.; Li, X.; Tollner, E.W. Impact of planning horizon on water distribution network design. Water Supply 2022, 22, 2863–2873. [Google Scholar] [CrossRef]
  22. Ho, E.; Budescu, D.V.; Bosetti, V.; van Vuuren, D.P.; Keller, K. Not all carbon dioxide emission scenarios are equally likely: A subjective expert assessment. Clim. Chang. 2019, 155, 545–561. [Google Scholar] [CrossRef]
  23. Ritchie, J.; Dowlatabadi, H. The 1000 GtC coal question: Are cases of vastly expanded future coal combustion still plausible? Energy Econ. 2017, 65, 16–31. [Google Scholar] [CrossRef]
  24. IPCC. Summary for Policymakers. In Climate Change 2013: The Physical Science Basis. Contribution of Working Group I to the Fifth Assessment Report of the Intergovernmental Panel on Climate Change; Stocker, T.F., Qin, D., Plattner, G.-K., Tignor, M., Allen, S.K., Boschung, J., Nauels, A., Xia, Y., Bex, V., Midgley, P.M., Eds.; Cambridge University Press: Cambridge, UK; New York, NY, USA, 2013; pp. 1–30. [Google Scholar]
  25. IPCC. Summary for Policymakers. In Climate Change 2021: The Physical Science Basis. Contribution of Working Group I to the Sixth Assessment Report of the Intergovernmental Panel on Climate Change; Masson-Delmotte, V., Zhai, P., Pirani, A., Connors, S.L., Péan, C., Berger, S., Caud, N., Chen, Y., Goldfarb, L., Gomis, M.I., et al., Eds.; Cambridge University Press: Cambridge, UK; New York, NY, USA, 2021; pp. 3–32. [Google Scholar]
  26. Ullrich, P.A.; Zarzycki, C.M. TempestExtremes: A framework for scale-insensitive pointwise feature tracking on unstructured grids. Geosci. Model Dev. 2017, 10, 1069–1090. [Google Scholar] [CrossRef]
  27. Zarzycki, C.M.; Ullrich, P.A. Assessing sensitivities in algorithmic detection of tropical cyclones in climate data. Geophys. Res. Lett. 2017, 44, 1141–1149. [Google Scholar] [CrossRef]
  28. Hitchens, N.M.; Baldwin, M.E.; Trapp, R.J. An Object-Oriented Characterization of Extreme Precipitation-Producing Convective Systems in the Midwestern United States. Mon. Weather. Rev. 2012, 140, 1356–1366. [Google Scholar] [CrossRef]
  29. Moore, B.J.; Mahoney, K.M.; Sukovich, E.M.; Cifelli, R.; Hamill, T.M. Climatology and Environmental Characteristics of Extreme Precipitation Events in the Southeastern United States. Mon. Weather Rev. 2015, 143, 718–741. [Google Scholar] [CrossRef]
  30. NCEI. U.S. Climate Atlas. Available online: https://www.ncei.noaa.gov/access/climateatlas/ (accessed on 14 January 2021).
  31. Doblas-Reyes, F.J.; Sörensson, A.A.; Almazroui, M.; Dosio, A.; Gutowski, W.; Haarsma, R.; Hamdi, R.; Hewitson, B.; Kwon, W.-T.; Lamptey, B.; et al. Linking Global to Regional Climate Change. In Climate Change 2021: The Physical Science Basis. Contribution of Working Group I to the Sixth Assessment Report of the Intergovernmental Panel on Climate Change; Masson-Delmotte, V., Zhai, P., Pirani, A., Connors, S., Péan, C., Berger, S., Caud, N., Chen, Y., Goldfarb, L., Gomis, M., et al., Eds.; Cambridge University Press: Cambridge, UK; New York, NY, USA, 2021; pp. 1363–1512. [Google Scholar]
Figure 2. The number of (A) extended-period events and (B) short-term events for each of the 20-year periods analyzed. The observation-based number from PRISM is in black. The numbers from GFDL-RegCM4 simulations are in blue, with contemporary climate in dark blue [GFDL-R(C)] and with scenario climate in light blue [GFDL-R(S)]. The numbers from MPI-RegCM4 simulations are in red, with contemporary climate in dark red [MPI-R(C)] and with scenario climate in light red [MPI-R(S)].
Climate 11 00112 g002
Figure 3. Box-and-whisker plots giving the distribution of areas for (A) extended-period events and (B) short-term events. Area is the number of grid points an event covers averaged over the event’s duration. The layout and color scheme for each of the data sources follows Figure 2. The median of a distribution gives the middle line in a box, with the 25% and 75% levels giving the lower and upper ends of a box. The lower whisker is the 10% level, and the upper whisker is the 90% level of the distribution.
Climate 11 00112 g003
Figure 4. The annual cycle of counts for the extended-period events. The color scheme for each of the data sources follows Figure 2.
Climate 11 00112 g004
Figure 5. The spatial distribution of event frequency at each analysis grid point, given as the % time a grid point is contained in an extended-period event. Upper row: PRISM frequencies. Middle row: GFDL-RegCM4 frequencies (contemporary climate left, scenario climate right). Bottom row: like the middle row but for MPI-RegCM4 frequencies.
Climate 11 00112 g005
Figure 6. The distribution of duration for events with no overlap (A,C) and for events with overlap (B,D). (A,B): extended-period events. (C,D): short-term events. In each panel, the layout and color scheme for the data sources follows Figure 2.
Climate 11 00112 g006
Figure 7. Similar to Figure 6 but for distribution of event areas. (A) Extended-Period (No Overlap); (B) Extended-Period (Overlap); (C) Short-Term (No Overlap); (D) Short-Term (Overlap).
Climate 11 00112 g007
Figure 8. Similar to Figure 6 but for distribution of 90th percentile level of precipitation intensity in each event. (A) Extended-Period (No Overlap); (B) Extended-Period (Overlap); (C) Short-Term (No Overlap); (D) Short-Term (Overlap).
Climate 11 00112 g008
Table 1. Extended-period events containing overlaps with short-term events.
SourceEvents with Overlap [%]Fraction of Events Overlapping Only 1 Short-Term Event [%]Fraction of Events Overlapping ≥2 Short-Term Events [%]
PRISM518020
GFDL-R(C)498020
GFDL-R(S)507822
MPI-R(C)517624
MPI-R(S)547624
Disclaimer/Publisher’s Note: The statements, opinions and data contained in all publications are solely those of the individual author(s) and contributor(s) and not of MDPI and/or the editor(s). MDPI and/or the editor(s) disclaim responsibility for any injury to people or property resulting from any ideas, methods, instructions or products referred to in the content.

