
Analysis of Hydrometeorological Trends and Drought Severity in Water-Demanding Mediterranean Islands under Climate Change Conditions

Laboratory of Mountainous Water Management and Control, School of Forestry and Natural Environment, Aristotle University of Thessaloniki, 54124 Thessaloniki, Greece
*
Author to whom correspondence should be addressed.
Climate 2023, 11(5), 106; https://doi.org/10.3390/cli11050106
Submission received: 1 April 2023
/
Revised: 1 May 2023
/
Accepted: 13 May 2023
/
Published: 15 May 2023
(This article belongs to the Special Issue Climate Change Impacts on Hydrologic Variables across Timescales and Spatial Scale)
Abstract
:Global climate change has emerged as a problem in recent years, and its effects will likely continue to increase in the future. Several scientific studies conducted in the Mediterranean region have demonstrated relatively stationary trends for annual precipitation and significant upward trends for mean annual temperature. These trends present several implications, especially in the Greek islands that serve as major summer tourist destinations where the population is already unable to meet their water demands. The aim of this study is to investigate both long- and short-term variations in temperature and precipitation on three Greek islands in the Mediterranean Sea (Mykonos, Naxos, and Kos). The temperature and rainfall trends, as well as their magnitudes at yearly, seasonal, and monthly time steps, were determined using the non-parametric Mann–Kendall trend test. The Standardized Precipitation Index (SPI) was employed to identify the drought periods. According to the results, precipitation slightly increased (almost stationary) in the three islands, although this rise was not statistically significant. All three islands experienced a sharp and statistically significant increase in their mean annual air temperatures. The region may experience drought episodes as a result of the high temperature increase, which would drastically reduce the amount of water, available for use due to the increased evapotranspiration. For the Mediterranean region, the necessity for a drought management strategy to stop or diminish the severity of drought episodes and their effects has grown into a matter of great concern. It is crucial to take measures and conduct relevant research in order to create the conditions for adaptation and mitigation of climate change consequences and the increased appearance of drought phenomena.
Keywords:
evapotranspiration; drought index; precipitation; temperature; SPI; water demand; water scarcity1. Introduction
The modern way of life has greatly impacted the quality and quantity of water resources mainly through the phenomena of urbanization, excessive consumption, continued population increase, imbalanced water use, the accelerating development of industry, the tertiary sector, especially tourism, and the intensification of agriculture and grazing [1,2]. During the past few decades, the amount of readily available water has progressively declined [3,4,5]. As a result, a constantly increasing competition for water resources has emerged. Since water constitutes a finite resource, meeting currently increasing water needs highlights the great necessity of regulating water consumption, especially considering that it is a resource of an abnormal spatial distribution. The issue of climate change presents broad implications to the entire planet and, unfortunately, it is expected to worsen in the future. The effects of climate change on global water resources have been thoroughly studied by a number of scientists all over the globe [6,7,8,9,10,11,12,13,14]. If the goal is to create the conditions for adaptation and also mitigation of climate change effects, it is crucial to focus research efforts on respective studies, investigating the trends of precipitation and temperature.
Analyzing long-term changes in climate variability is a fundamental task in climate change detection studies [15]. Along with the risk of intensified droughts, wildfires, floods, and soil erosion, global climate change may have an impact on long-term rainfall rates, which affect water availability [16]. The two key climatic factors are precipitation and temperature [17,18,19] since they determine the environmental conditions and affect the agricultural productivity of an area [20]. According to studies over the past few decades, droughts have occurred more frequently over the globe, presenting a considerably adverse impact on the economy, society, and the environment [7,21,22,23]. The phenomenon of drought is considered one of the most complex and, at the same time, least understood natural disasters on the planet [24,25,26,27].
As a result of this trend, many Greek islands, which are popular summer tourist destinations, seem to be unable to meet their water needs. There are previous studies conducted in Greece that investigated the temporal and spatial distribution trends of precipitation, providing a variety of findings and conclusions (e.g., [28,29,30,31,32,33]). Several scientific studies revealed a pattern of decreasing rainfall in the South Aegean region [34,35,36,37,38,39,40,41,42]. Concerning the temperature trends in Greece, the results of previous studies are clear and reveal that in most areas of the country there has been a statistically significant increase in temperature during recent decades (e.g., [43,44,45,46]. Characterized by the typical dry Mediterranean environment, the majority of Aegean islands have insufficient water sources [47,48]. Furthermore, the intrusion of seawater into the aquifer makes it even more challenging to locate drinking water, which has the consequence of reducing the amount of water resources available to meet the population’s needs [49,50]. This issue becomes considerably worse during the summer period when the demand for drinking water rises up to five times above average levels, which is attributed mainly to tourism [51].
According to the literature, the impact of climate change is widely acknowledged, while the impacts greatly vary at a regional vs. local scale. Such information is essential for the development of strategies to reduce and offset the effects of hydrological climate change at the local and regional levels. Within this context, the aim of this study was to examine the long- and short-term trends of temperature and rainfall data and the effect on water availability and drought severity in three typical Mediterranean islands (Mykonos, Naxos, Kos), which are characterized by a long dry-thermal period during the peak of the summer tourism period. Temperature and rainfall trends and their magnitudes at yearly, seasonal, and monthly time steps were investigated by applying the non-parametric Mann–Kendall trend test, while the drought periods were identified using the Standardized Precipitation Index (SPI).
2. Materials and Methods
2.1. Study Area
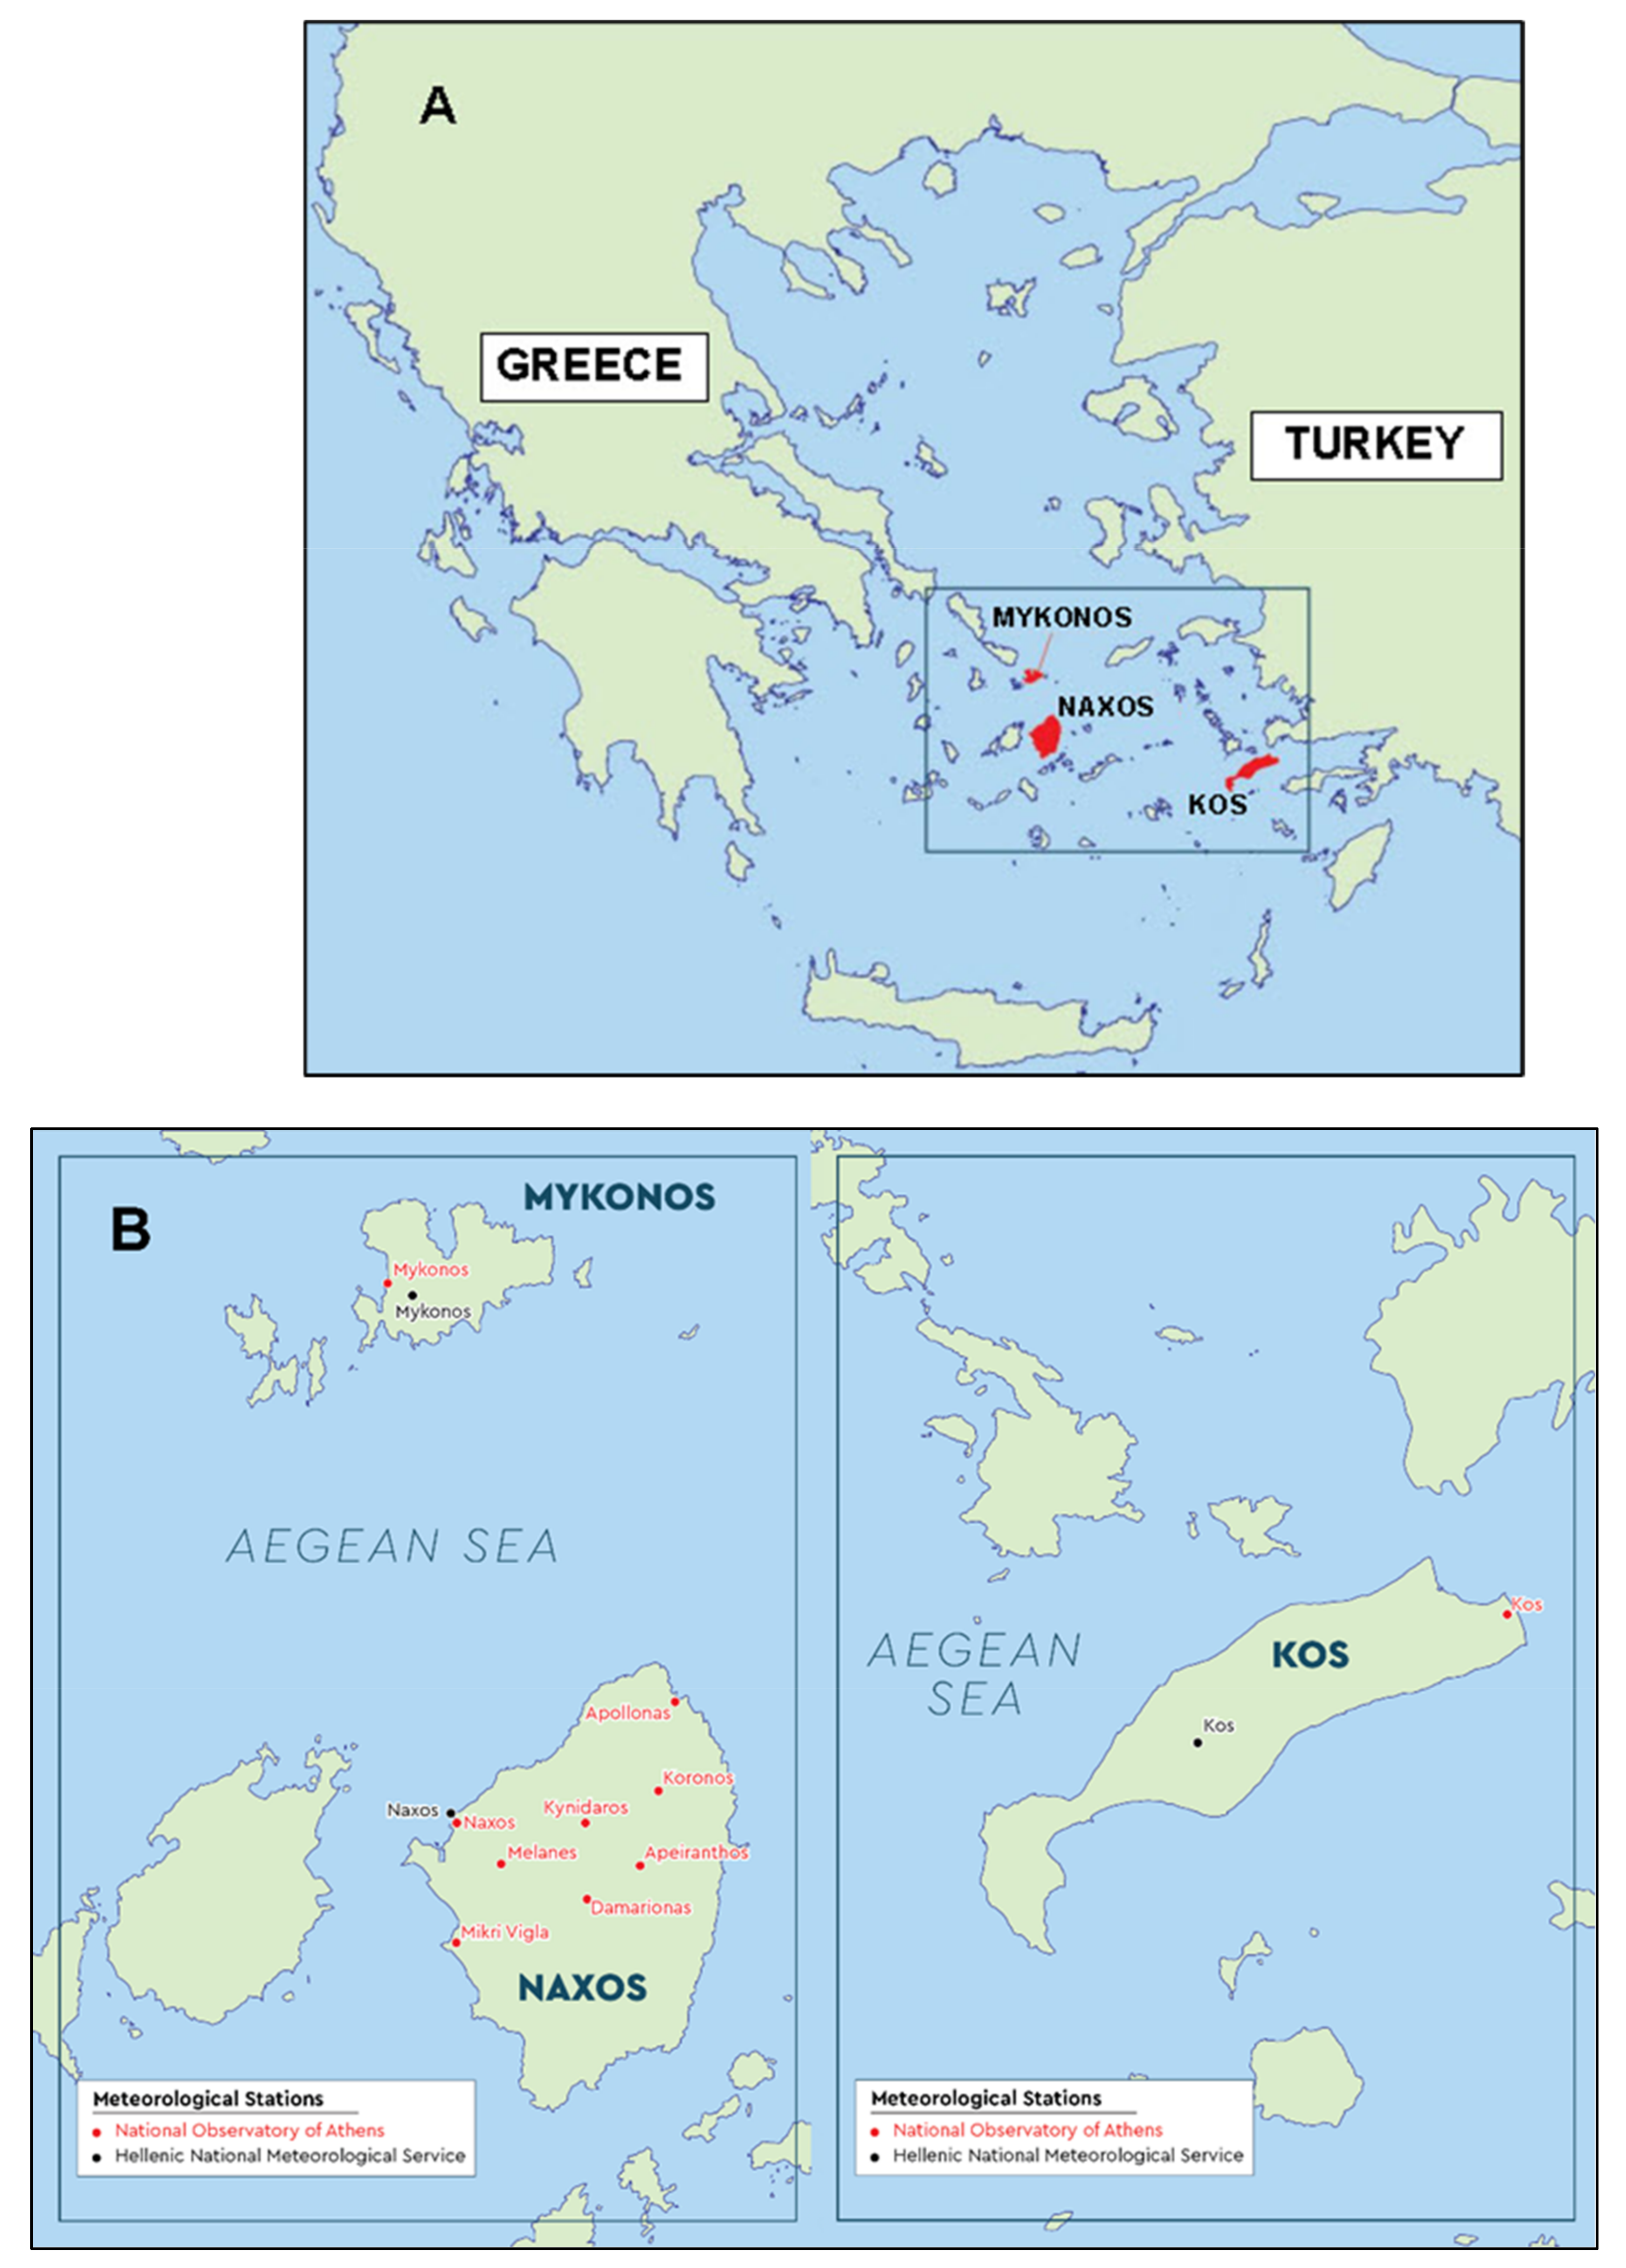
The research area consists of three typical islands of the South Aegean: Mykonos, Naxos, and Kos (Figure 1A). The island of Mykonos is located in the central part of the Cyclades, south of Tinos and it has an area of 85.5 km2. Mykonos is the island with the mildest topography in the study area, with a maximum elevation of 365 m and a mean elevation of 100 m. Additionally, it is almost exclusively lowland, while only a small part of its area is considered hilly. No forested areas can be detected, while most of the catchments are covered by agricultural crops (43.54%), pastures (37.64%), and a lower percentage is covered by settlements (16.99%) [52].
Naxos constitutes the largest and most fertile island of Cyclades, with an area of 430 km2, and is located south of Mykonos and east of Paros. The topography of Naxos is formed by Mount Zas, a low mountain range that crosses it from north to south, with the highest point to be Naxos Dias or Za (989 m), while it has a mean altitude of 263 m. Most of the research area is characterized as hilly, while there are several plains and some semi-mountainous areas. In the catchment areas of Naxos, there are no forested areas, most of it is covered by pastures–shrublands (64.15%) and agricultural crops (34.98%) [52].
The island of Kos, with a total area of 282.5 km2, has a particularly elongated shape consisting of a long and densely populated lowland zone in the north and a steep, uninhabited mountain range in the south. The mountainous masses of this section are arranged along the southern coast and the highest peak is Mount Dikaios (840 m), whose mean elevation is 127 m. Most of the study area is lowland, while it contains some hilly areas and a very small semi-mountainous section. Kos is the only island of the research area that appears to have some forested areas in its catchments (6.11%), while most of the catchments are covered by pastures and bush areas (48.89%), followed by agricultural crops (40.89%) and settlements to a slightly lower extent [52].
The climate of the research area, according to Koppen/Geiger climate classification, is the Mediterranean type characterized by a long dry summer and mild winter, while strong winds appear throughout the year [53]. In the study area, three meteorological stations (MSs) (Mykonos, Naxos, and Kos) are operated by the Hellenic National Meteorological Service (HNMS), with long observations, while in the last decade there have also been observation stations operated by the National Observatory of Athens (NOA) [54]. In Table 1, the names and details of the stations (altitude, observations, duration, etc.) are provided, while in Figure 1B their location in the research area map is presented. In the current research, the longest time series were further analyzed.
2.2. Timeseries Trends Analysis—Mann–Kendall Trend Test
To initially detect any rainfall and temperature time series upward/downward trends, the least square method was employed [38,53]. Specifically, the slope of the linear regression line was calculated using the following equation:
where Y is the dependent variable, hydrometeorological parameter (rainfall and temperature), and X is the independent variable of time. If “b” is positive there is an upward trend, while if “b” is negative there is a downward trend.
Y = a + b·Χ
The non-parametric test of Mann–Kendall was used to determine the level of significance of the time series trends [35,55,56,57]. This test determines the potential abrupt climate changes in the time series of the hydrometeorological parameters [57,58].
In a time series of N observations, x1, x2,… xn, the value of the 1st one (x1) is compared with all the subsequent values from the 2nd one (x2) to the n one (xn). This process is repeated by comparing the value of the second term (x2) with all the subsequent values and so on, and then, all the possible pairs of observations are examined, xi and xj with j > i, and the total number of pairs (P) is calculated to meet the relation xi > xj (P minimum when the time series is constantly ascending). Moreover, the normalized variable was examined:
where for random succession of the time series, the expected value is E(A) = 0, and the scatter is as follows:
A = [4P/((N·(N − 1)] − 1
Var(A) = 2· (2· (N + 5)/9·N· (N − 1)
The distribution of the parameter u(t) = A/Var(A)1/2 converges on the standard normal distribution as it grows [57].
The null hypothesis of the non-existence of a downward/upward trend is not rejected for some level of significance α, when –zα/2 ≤ u(t) ≤ zα/2, where zα/2 the normalized variable of normal distribution for the possibility of exceeding a/2.
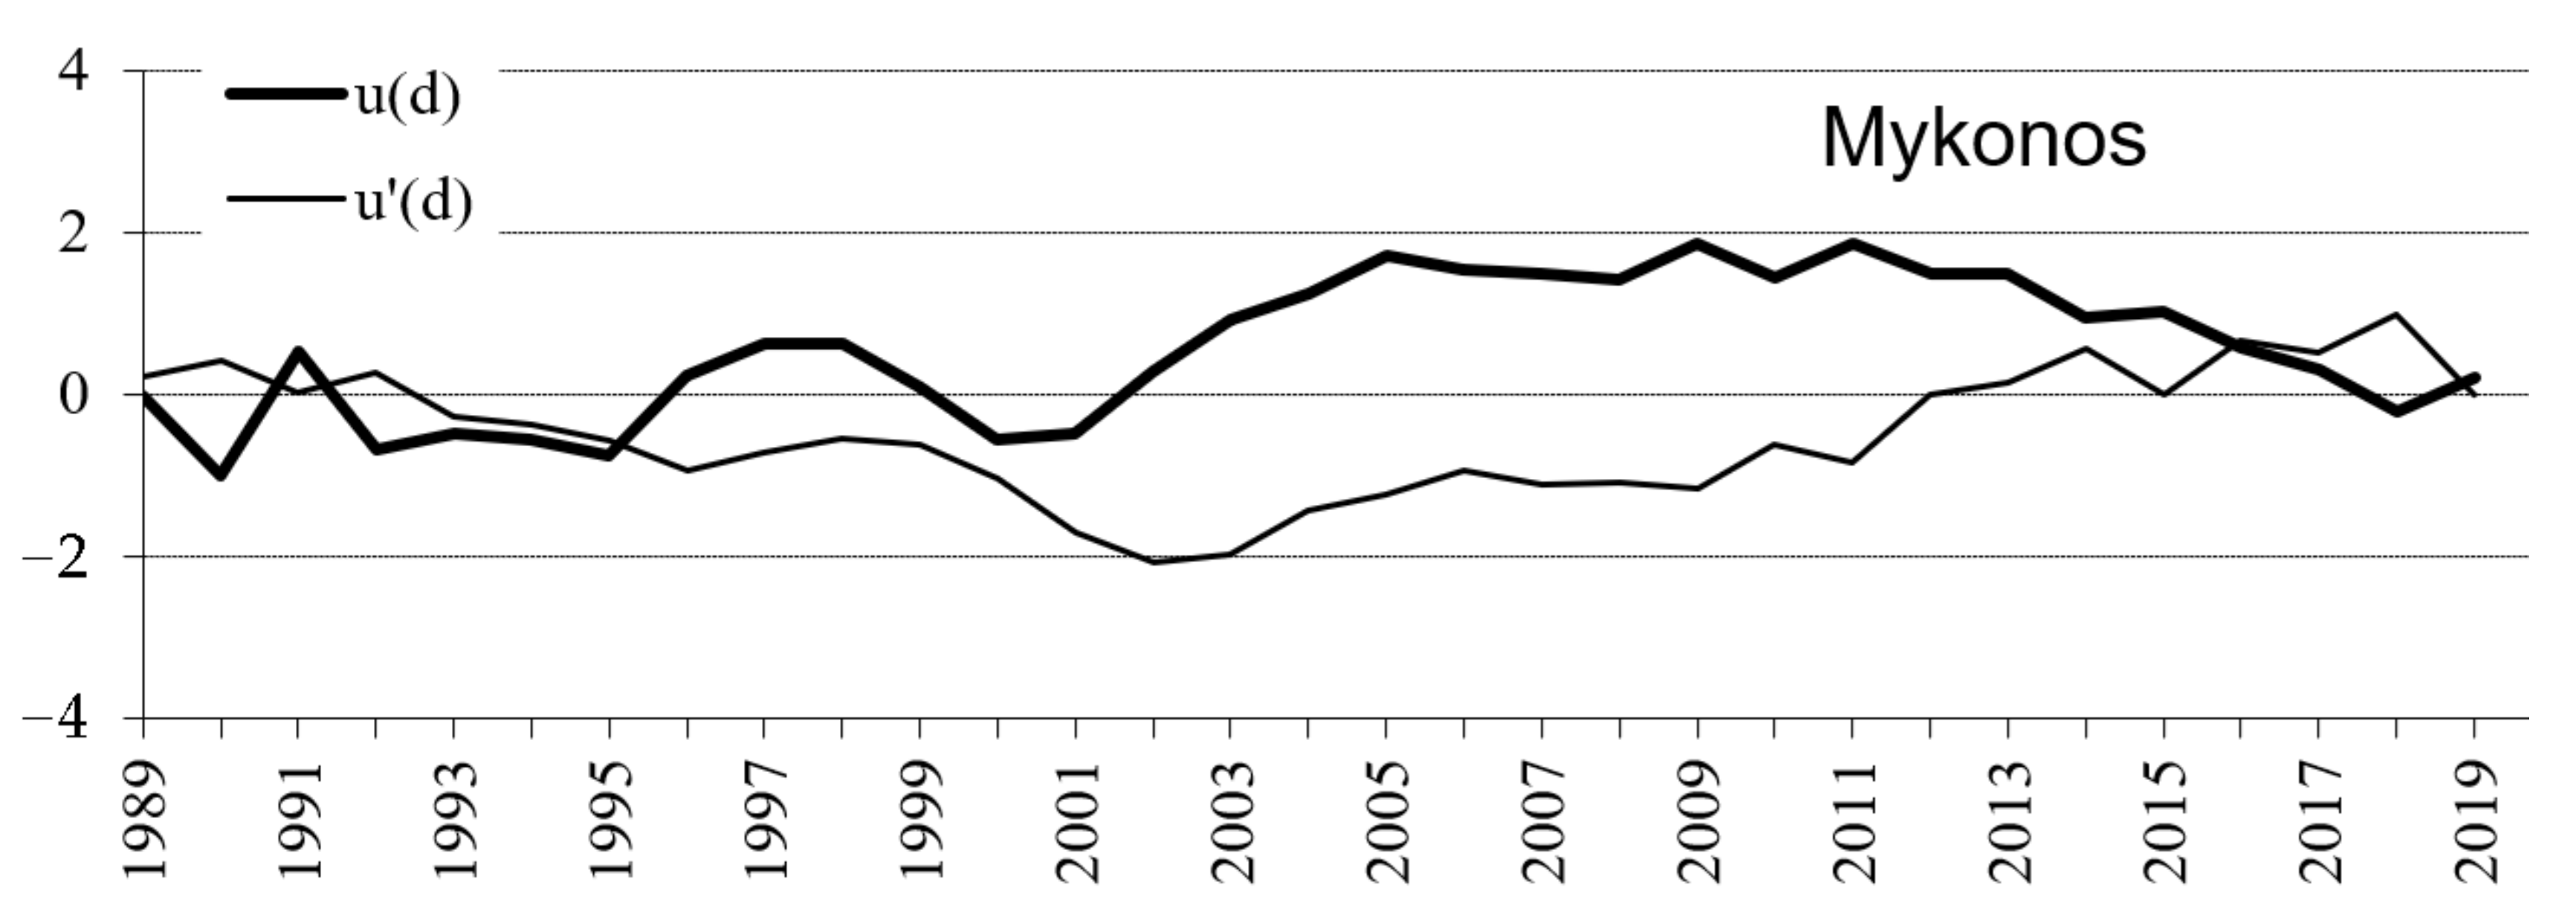
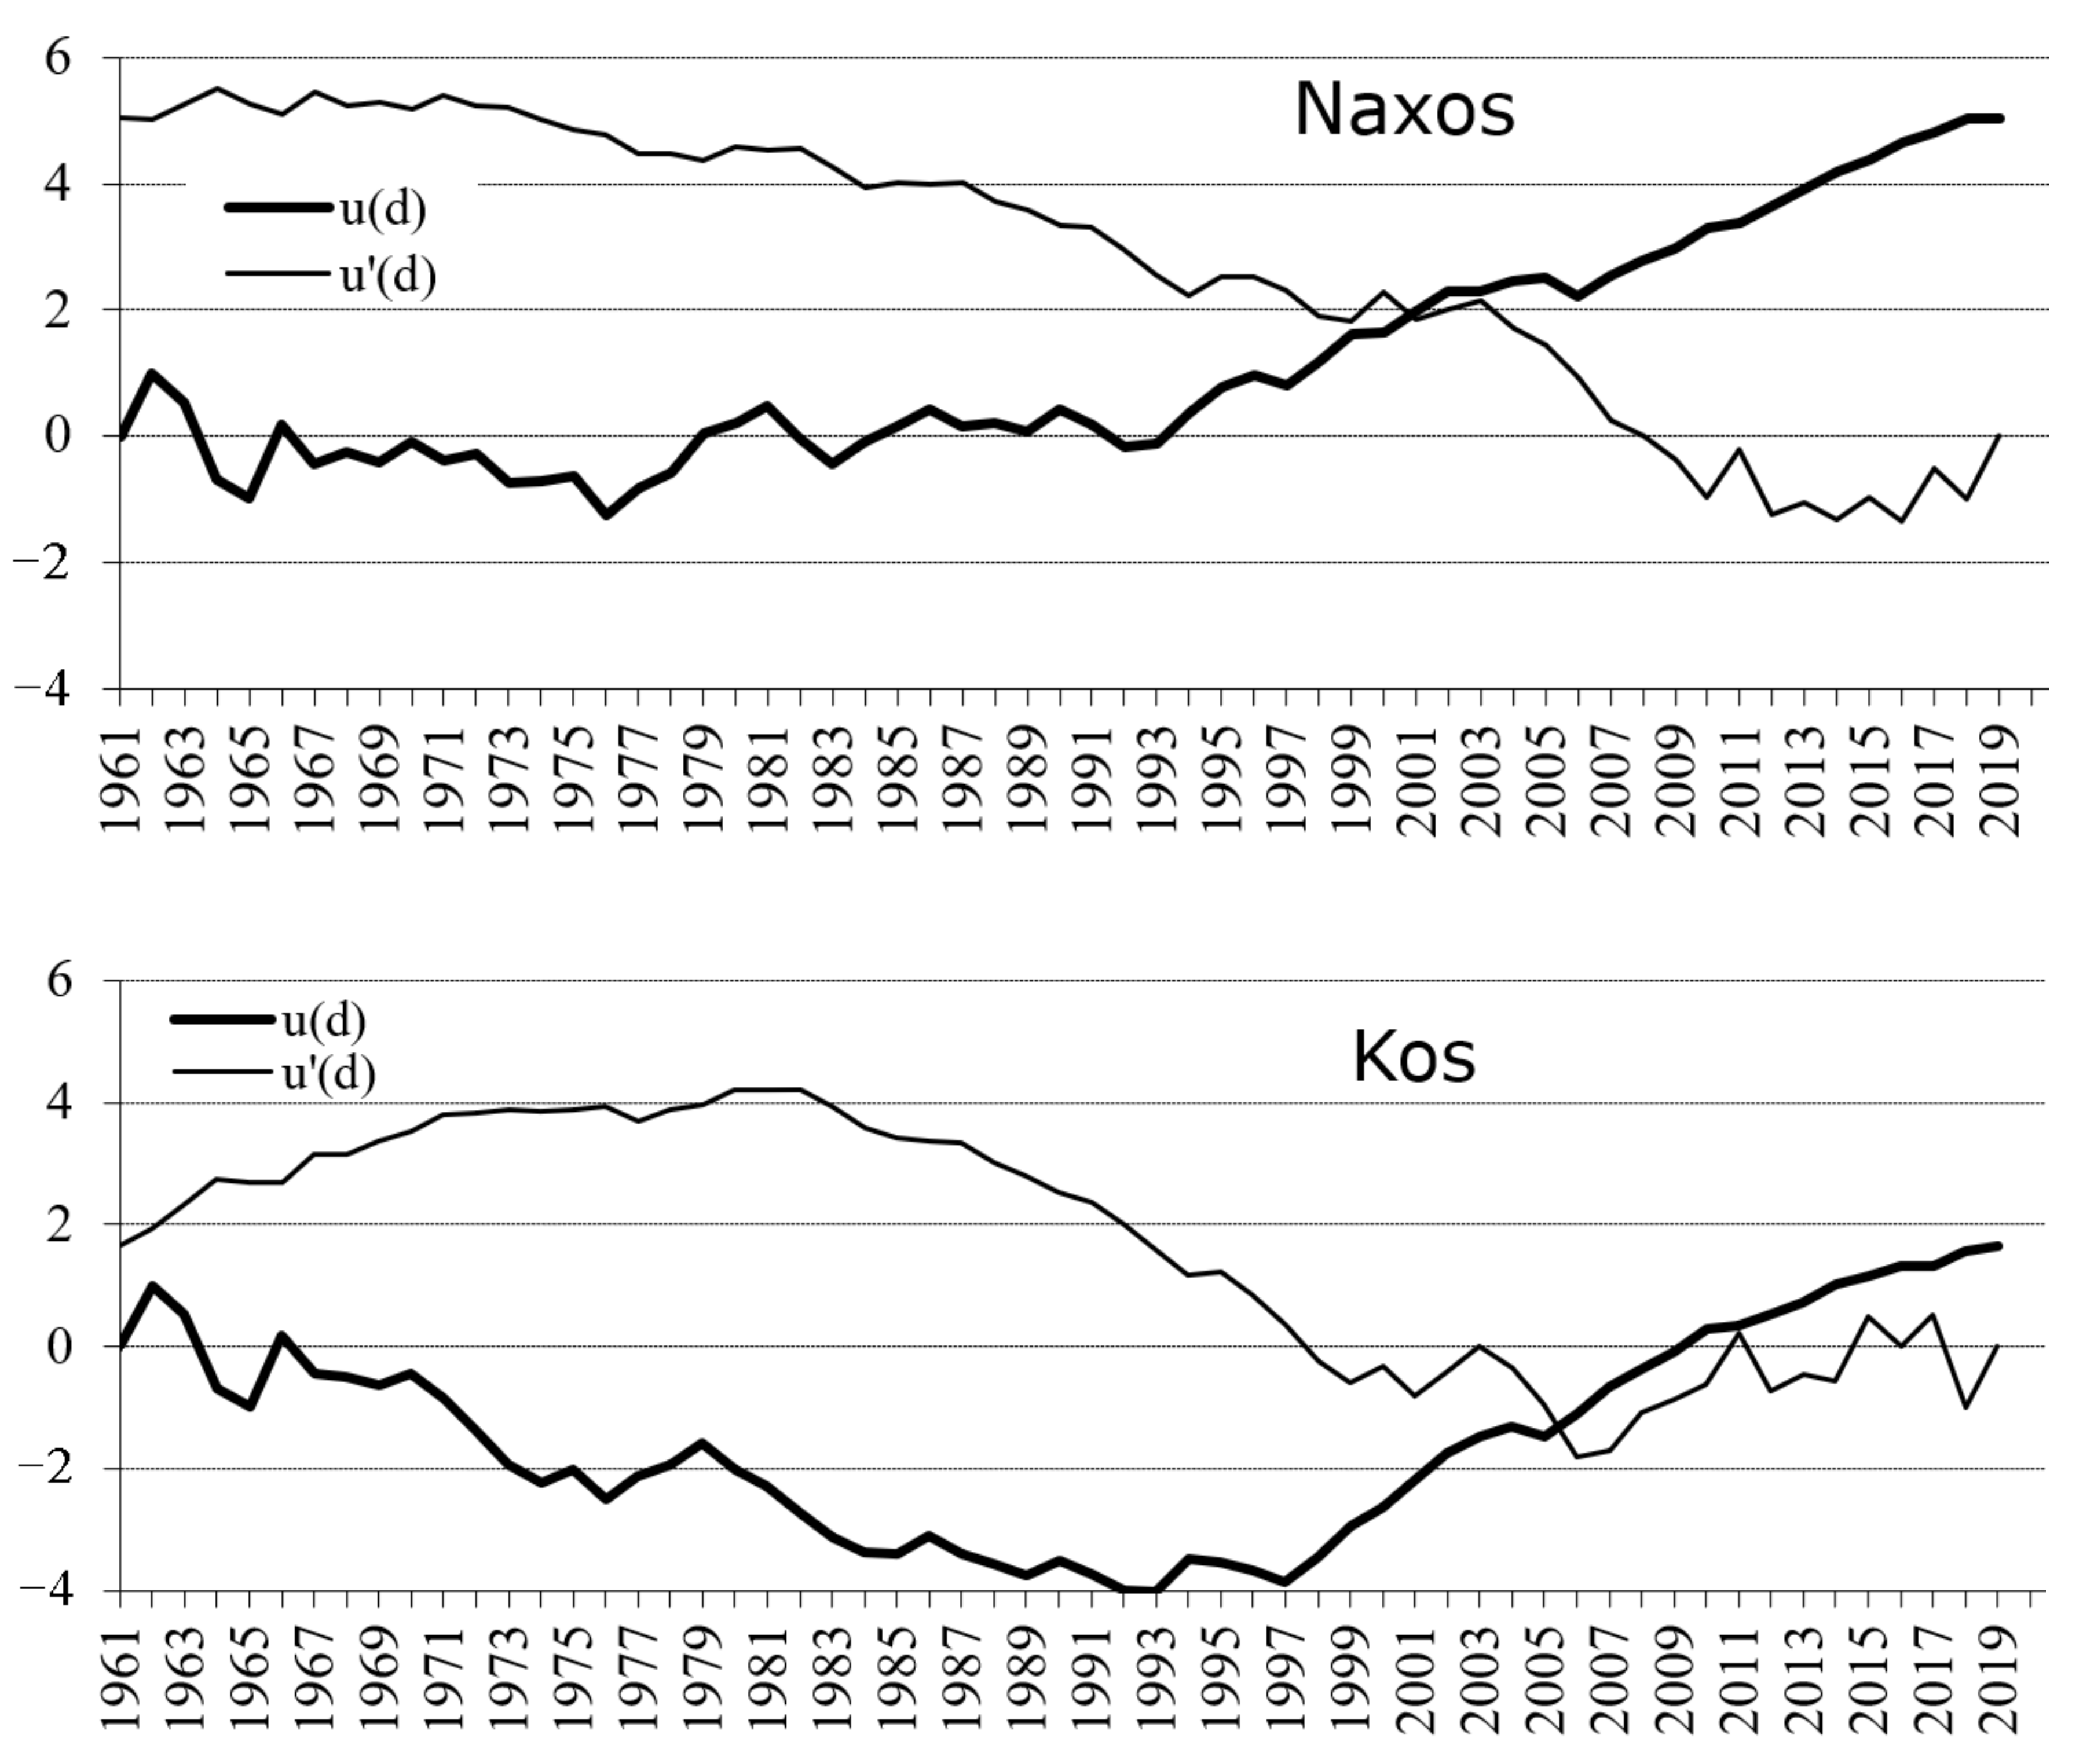
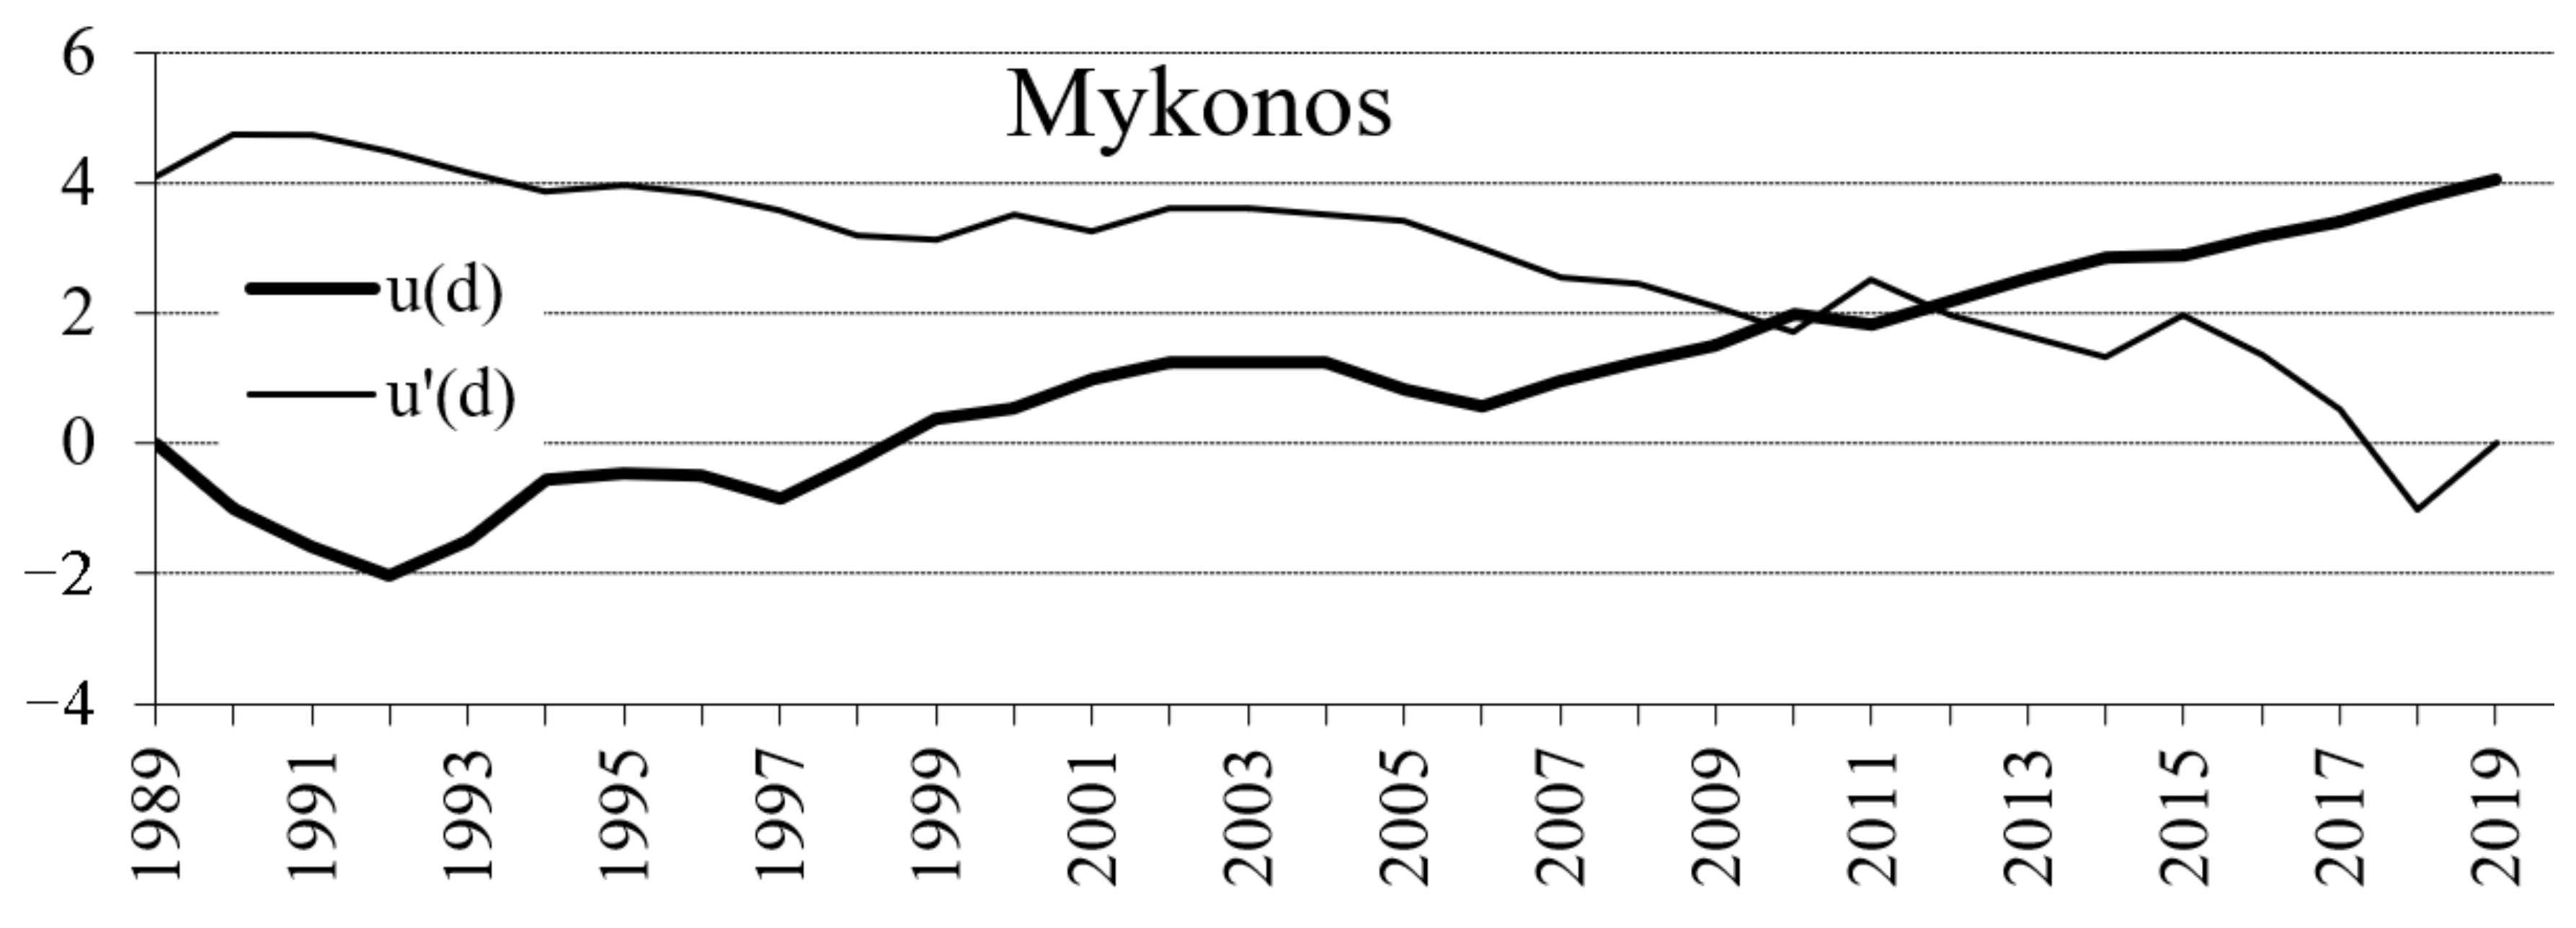
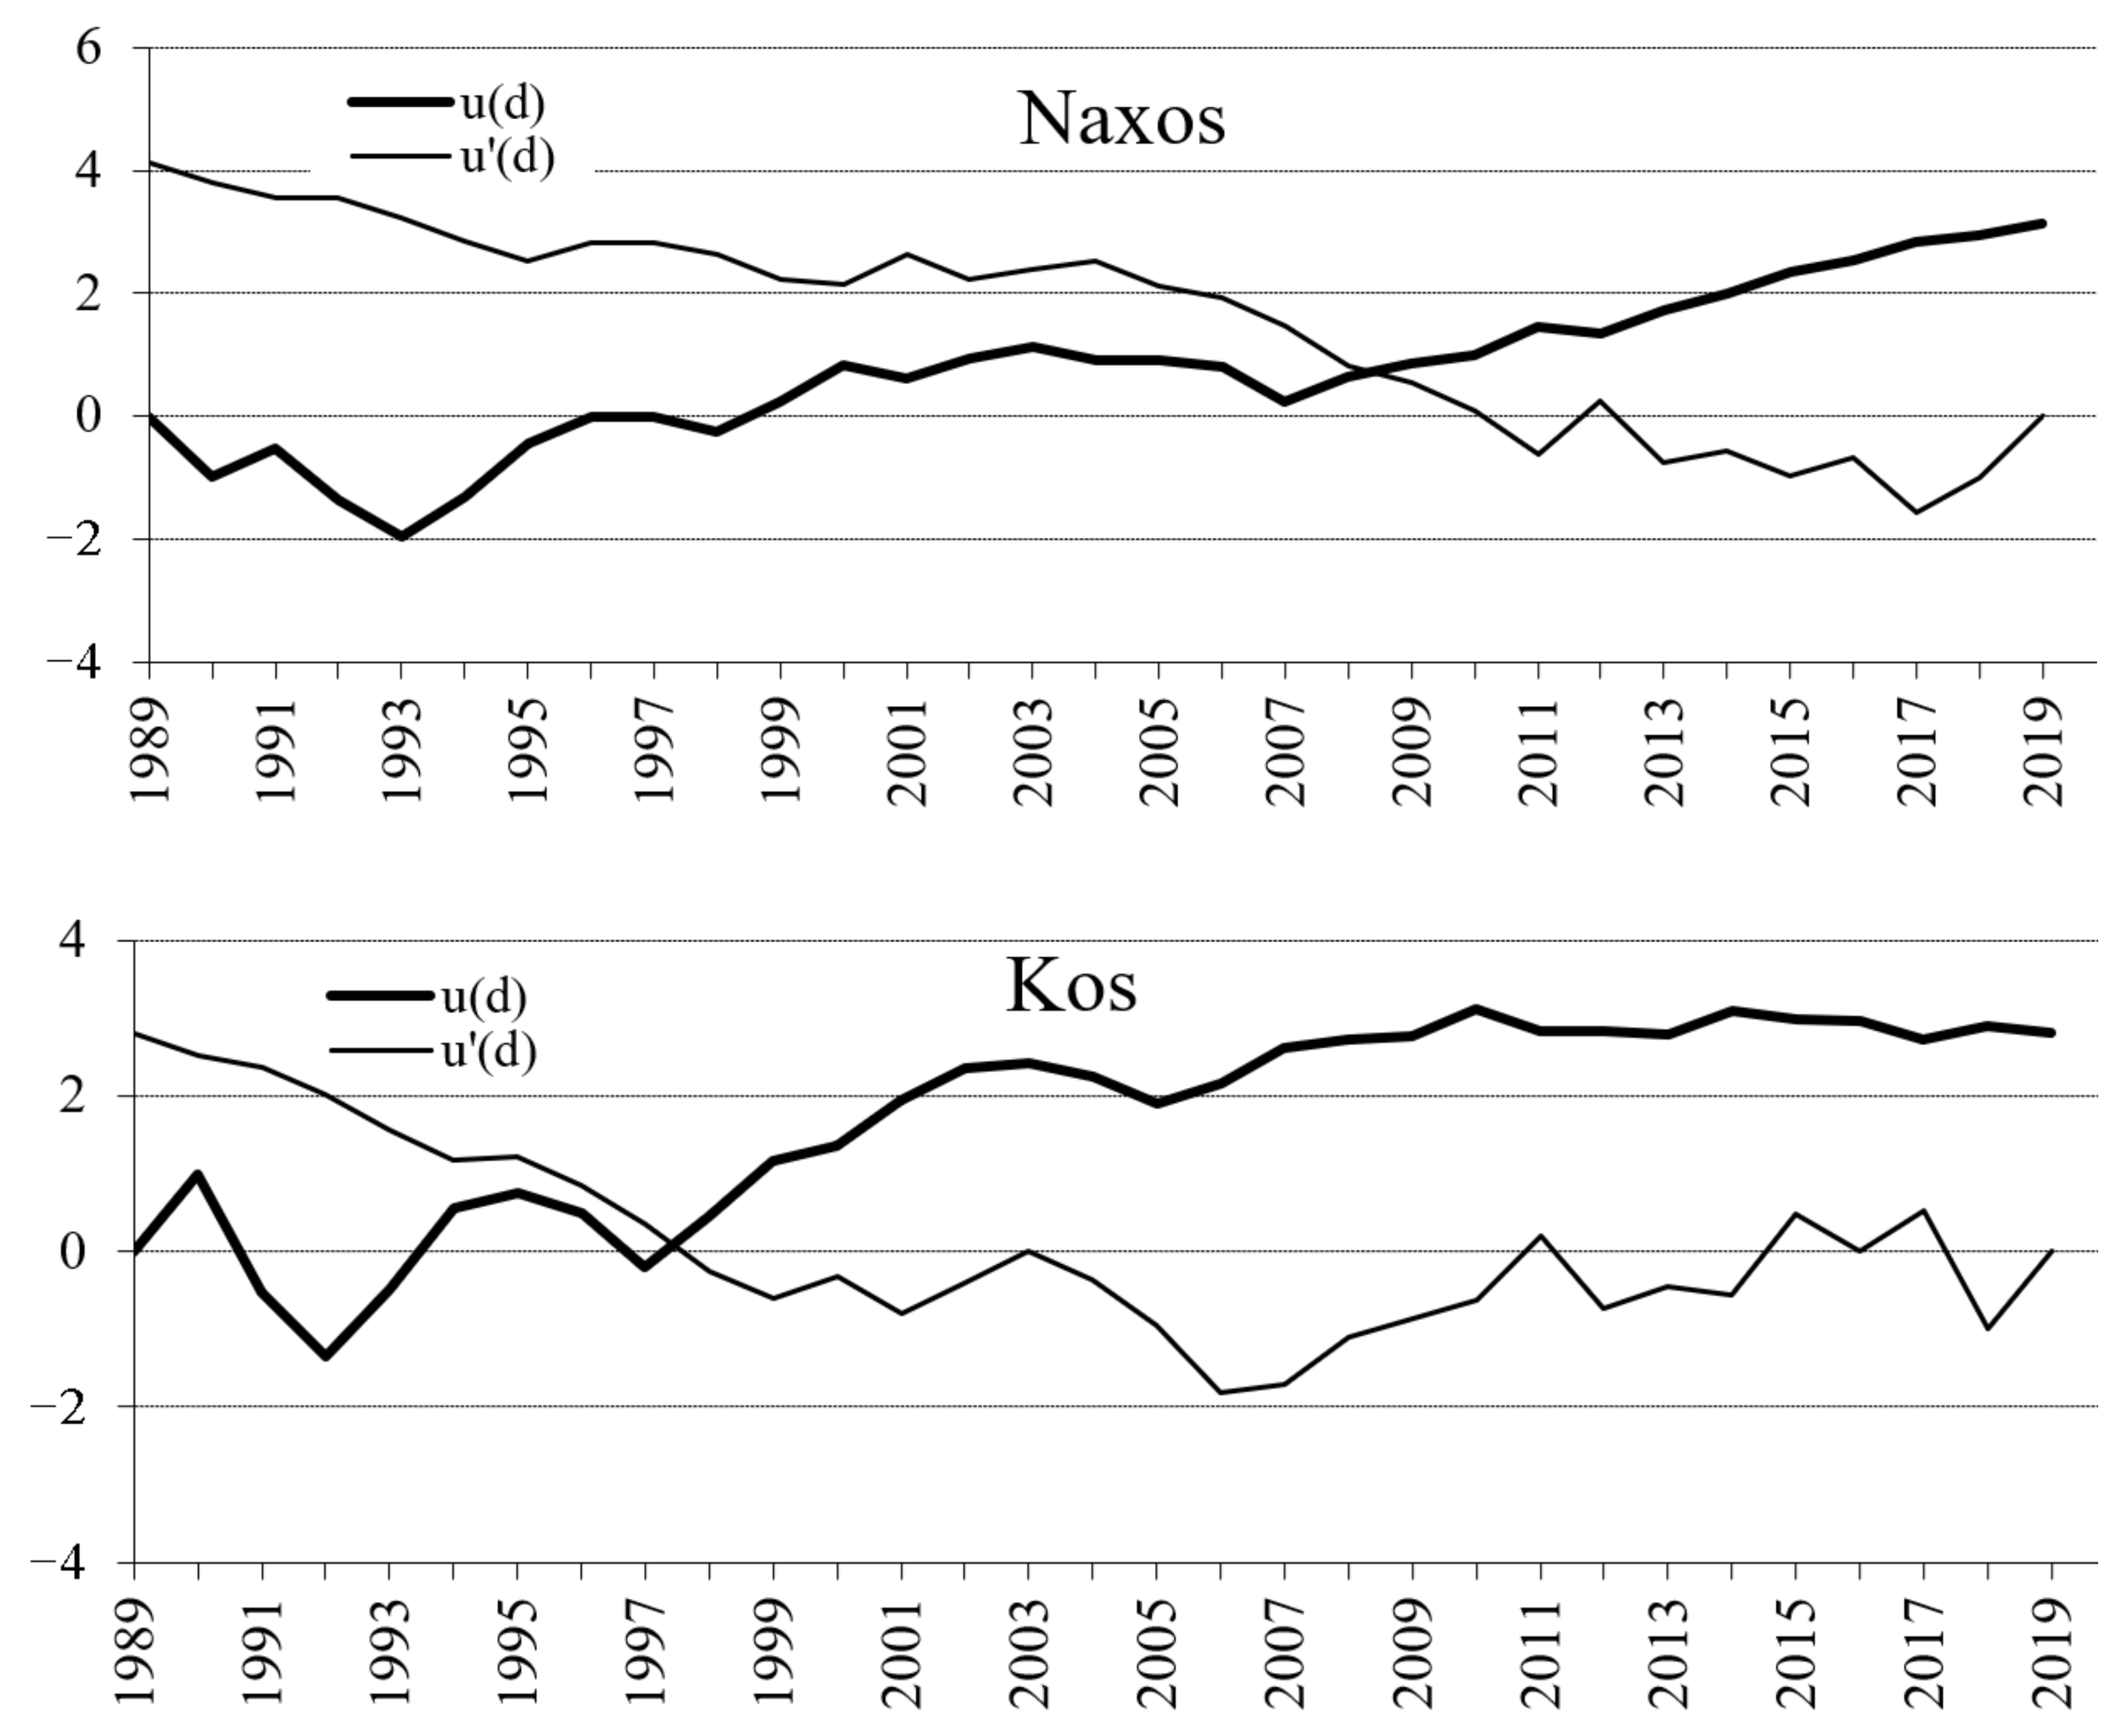
The abovementioned method is also resolved graphically and it was used in the present study. For this purpose, the final values of standardized variables u(t) were calculated, whose absolute value, if it is higher than |1.96|, shows the existence of a statistically significant trend (statistically significant at the level of 95%) in the studied time series. The same principle is applied to the reverse order of standardized variables u’(t). The intersection of the 2 curves, given that it lies among the critical values of the 95% significance level, determines the starting year of climate change.
2.3. Precipitation, Temperature, and Drought Analysis
The research examined the hydrometeorological characteristics of the study area and the drought severity. The study of drought phenomenon is mainly based on rainfall data, since in most areas, precipitation is usually the only available variable. Statistical indices are used to determine drought characteristics, such as intensity, duration, and spatial distribution [38,53,59,60,61,62,63,64,65,66].
To investigate the potential of water-storage works and irrigation works development for the management of water resources, apart from the annual precipitation height, the monthly rainfall is of particular importance. The variability of the annual rainfall was studied since its distribution among the months of the year is crucial for water management.
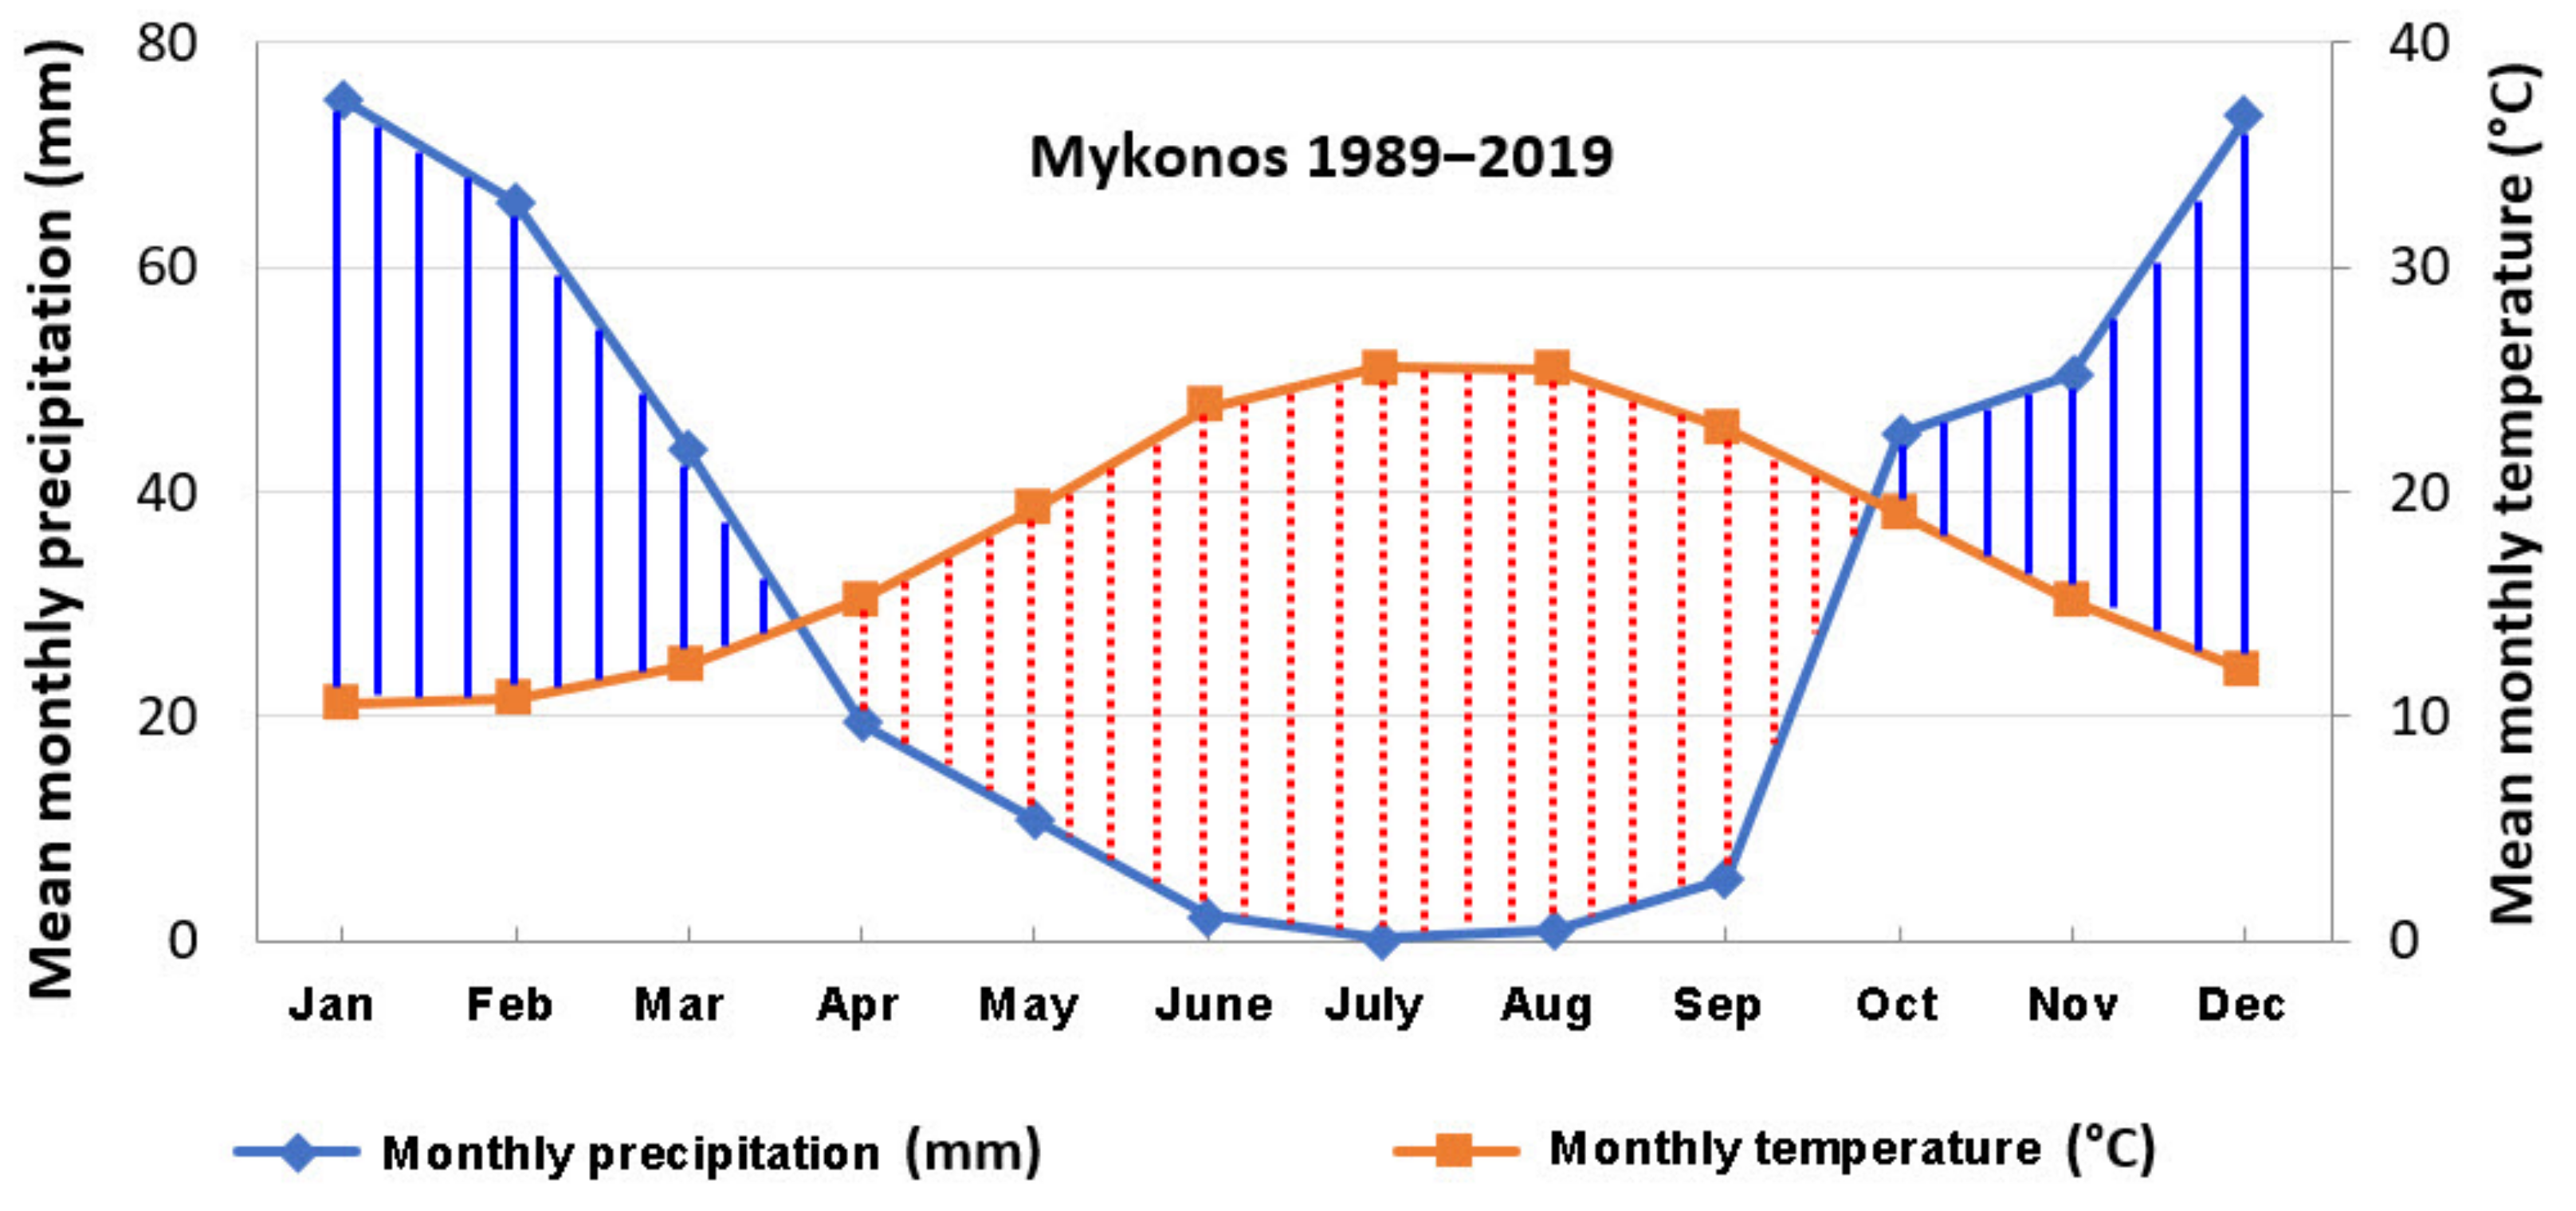
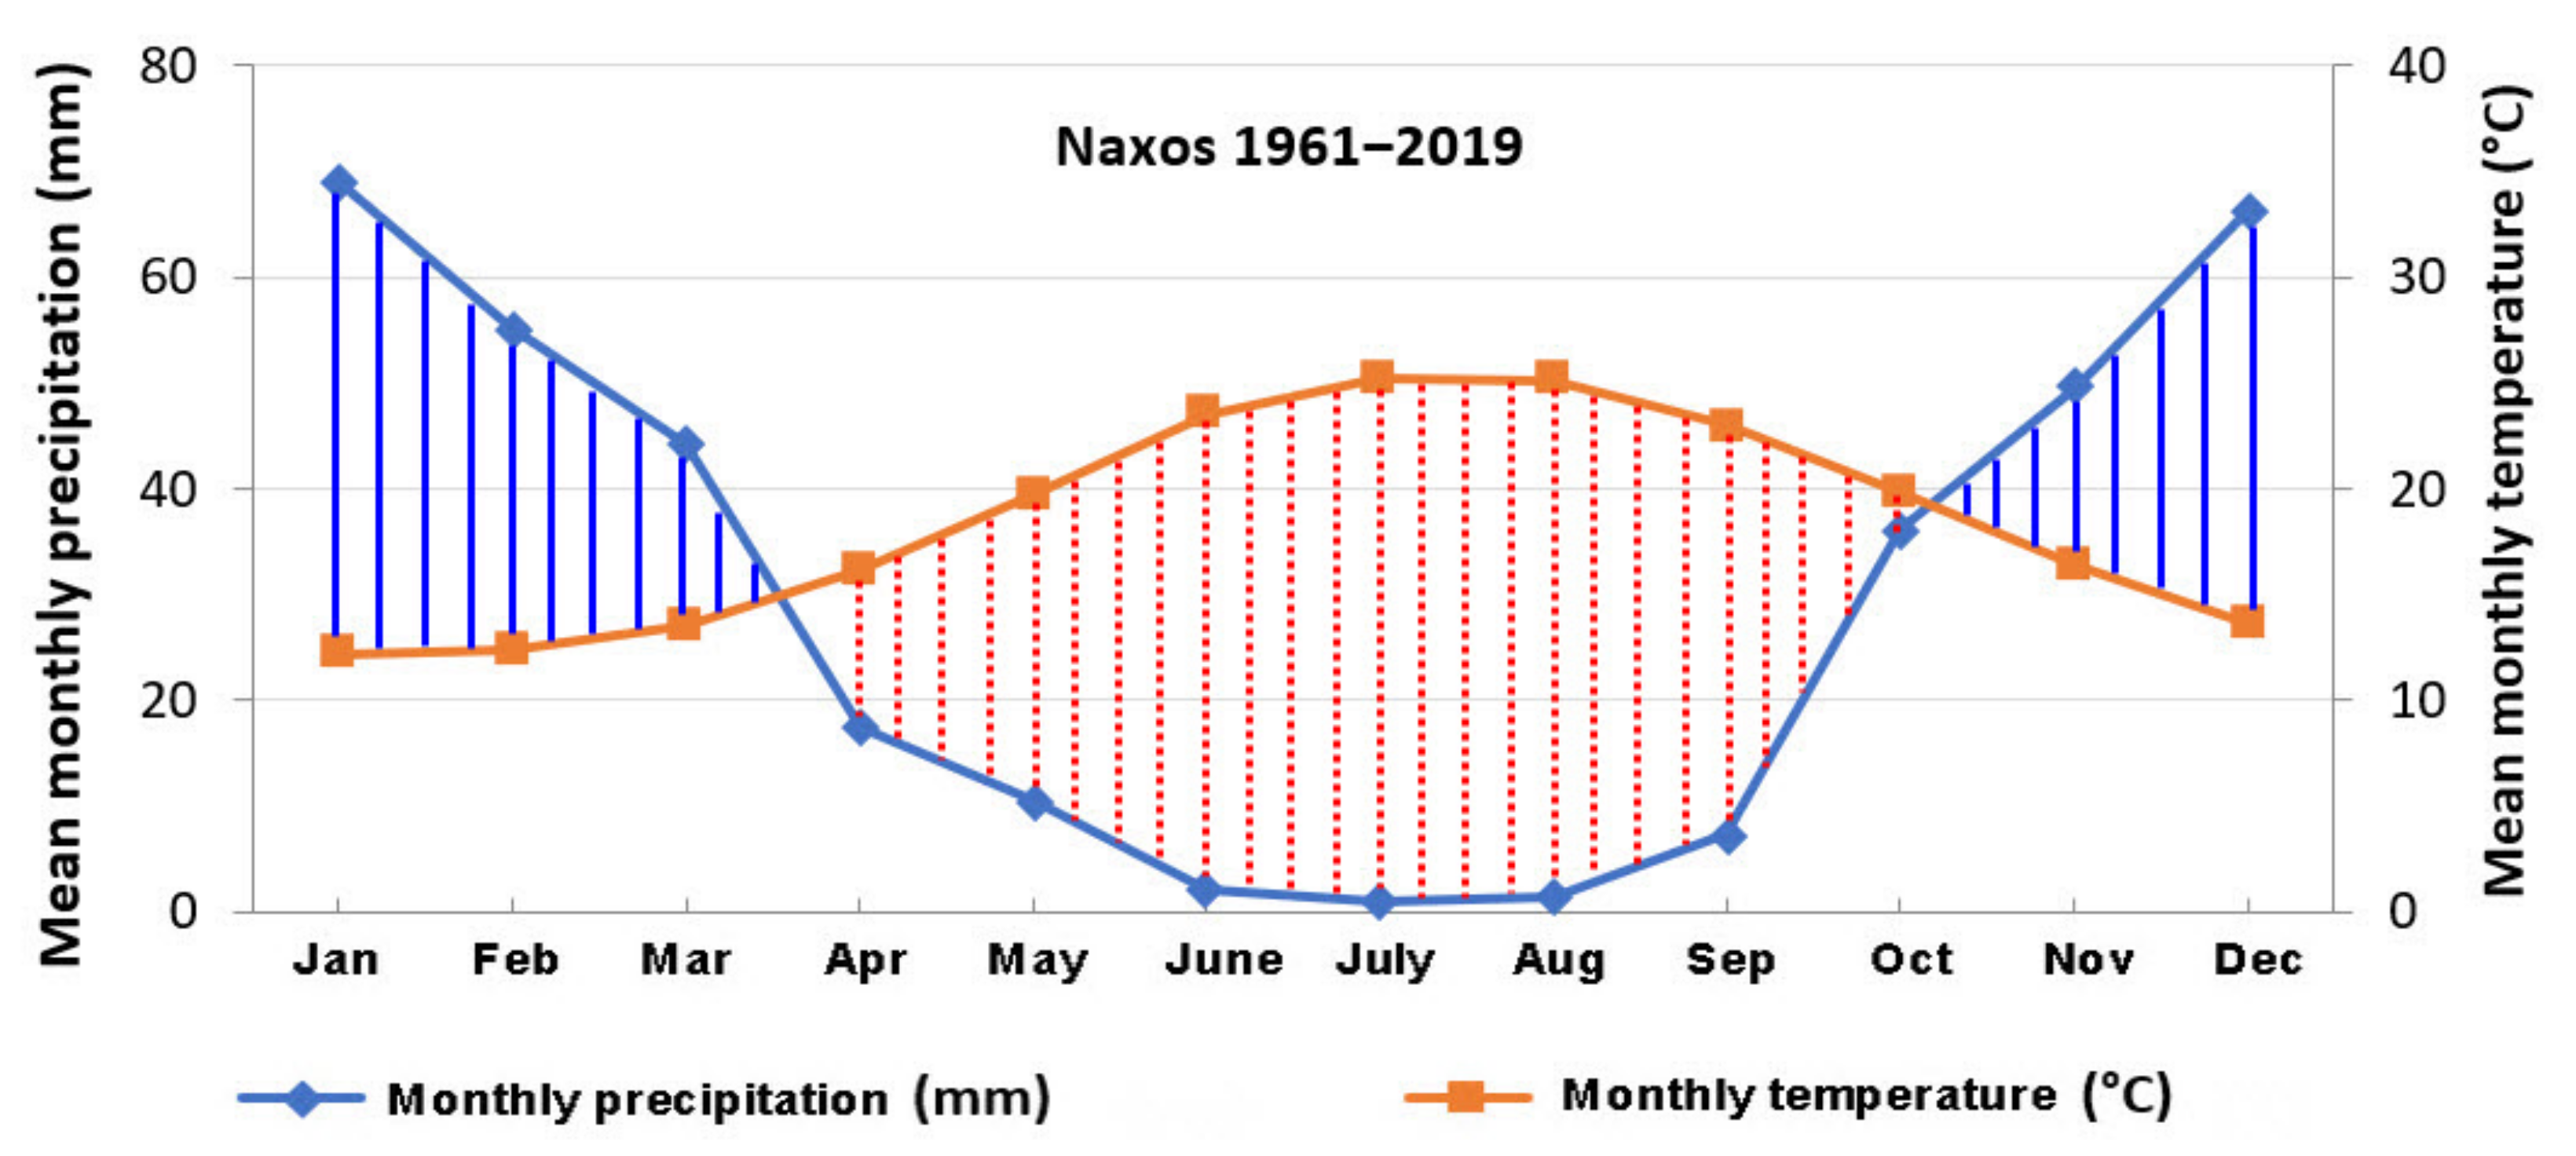
The dry-thermal index, which indicates the period of drought, is a crucial component of a region’s climate. The Bagnouls and Gaussen rain–temperature diagram creates a biological division between the climates that roughly corresponds to the number of ecologically dry days in a drought season. Drought period is considered when 1 month has a rain height (P) (mm) less than the double value of the mean air temperature (T) in °C; more specifically, when P < 2T. The rain–temperature diagram carries two curves: one presenting the mean monthly rainfall values and the other one providing the mean monthly temperature values.
2.4. Standard Precipitation Index (SPI)
In recent years, many researchers have based studies on the Standardized Precipitation Index (SPI) to facilitate the detection and systematic recording of drought episodes [67,68,69,70,71,72]. The SPI drought index has been widely employed owing to the simplicity of its calculation, its ability to be performed in different areas, and the fact that the only data required for its calculation are the monthly rainfall values. The nature of the SPI index allows to detect a rare drought episode or an extremely wet episode that can be observed in any area and at any time, as long as there are sufficient rainfall data. The main drawback of this index is that it does not take into account the temperature values.
Classification based on SPI values is presented in Table 2 [73]. In order to calculate the SPI, a long monthly precipitation time series of over 30 years is required. In the current study, the 12-month SPI was calculated for each MS that provided an adequate time series length. The index is calculated by taking the difference of precipitation from the mean value of a specific time scale and then dividing it by the standard deviation value according to the following equation:
where Χi is the precipitation of the period concerning the year iI, Χmean is the respective mean value, and σ is the standard deviation value of the period.
3. Results
3.1. Precipitation
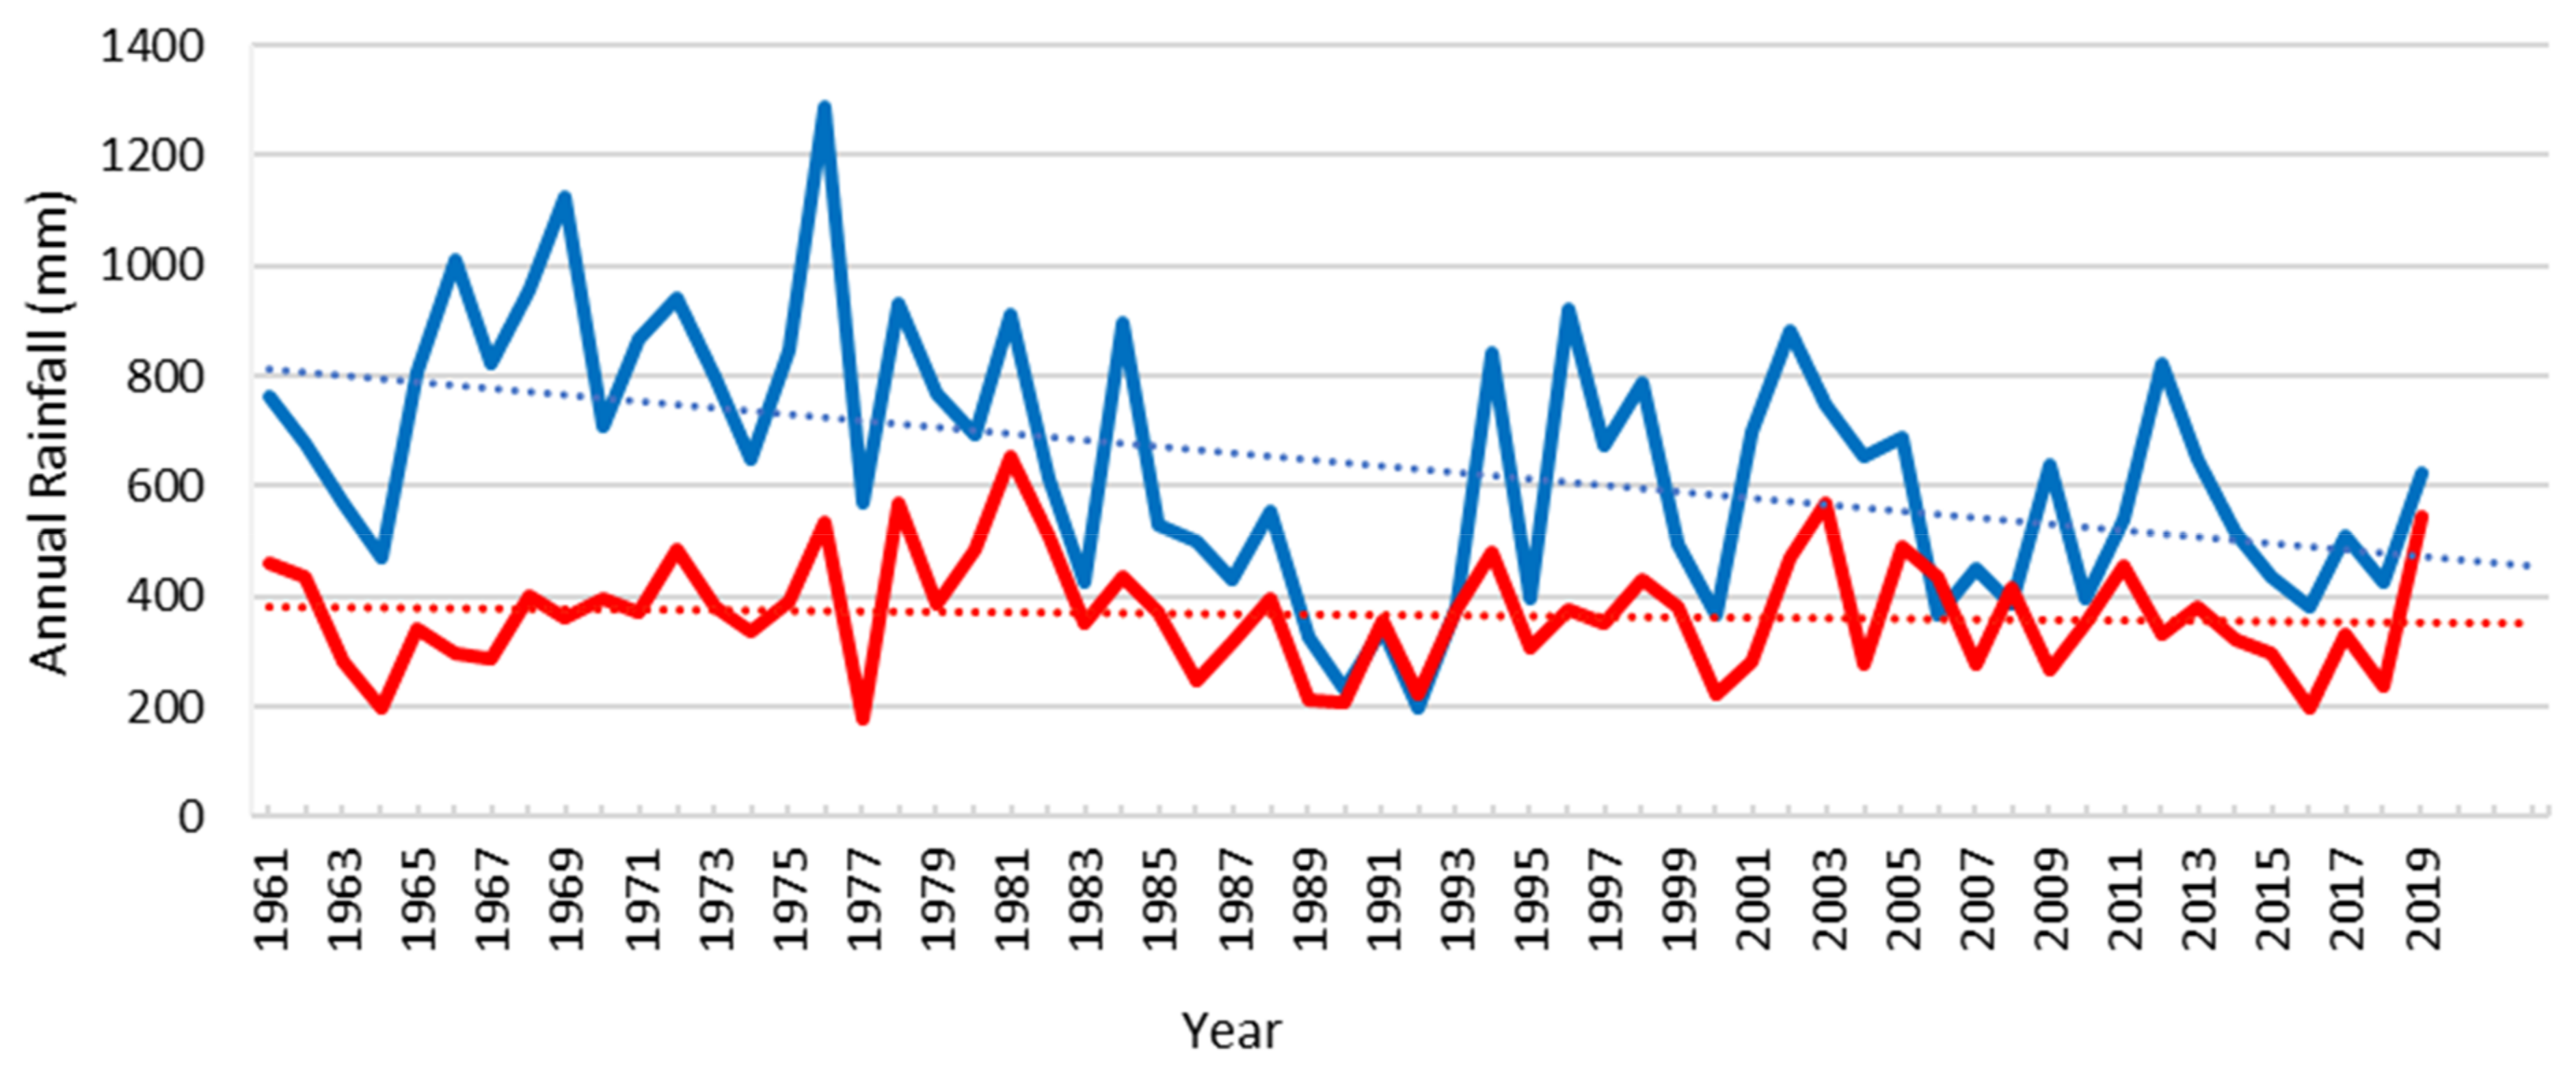
By applying the least square method, the relation of rainfall fluctuation with time was examined. The results of this work are presented in Table 3 and Figure 2 and Figure 3. Specifically, Table 3 presents the equations of the time series trends that express the change in the annual amount of rain over time, as well as the change in the annual amount of rain per decade for each of the MSs studied in the research area. It was found that in the 2 MSs with long-term time series (1961–2019), there was a downward trend of annual rainfall for both islands, Naxos and Kos (Figure 3).
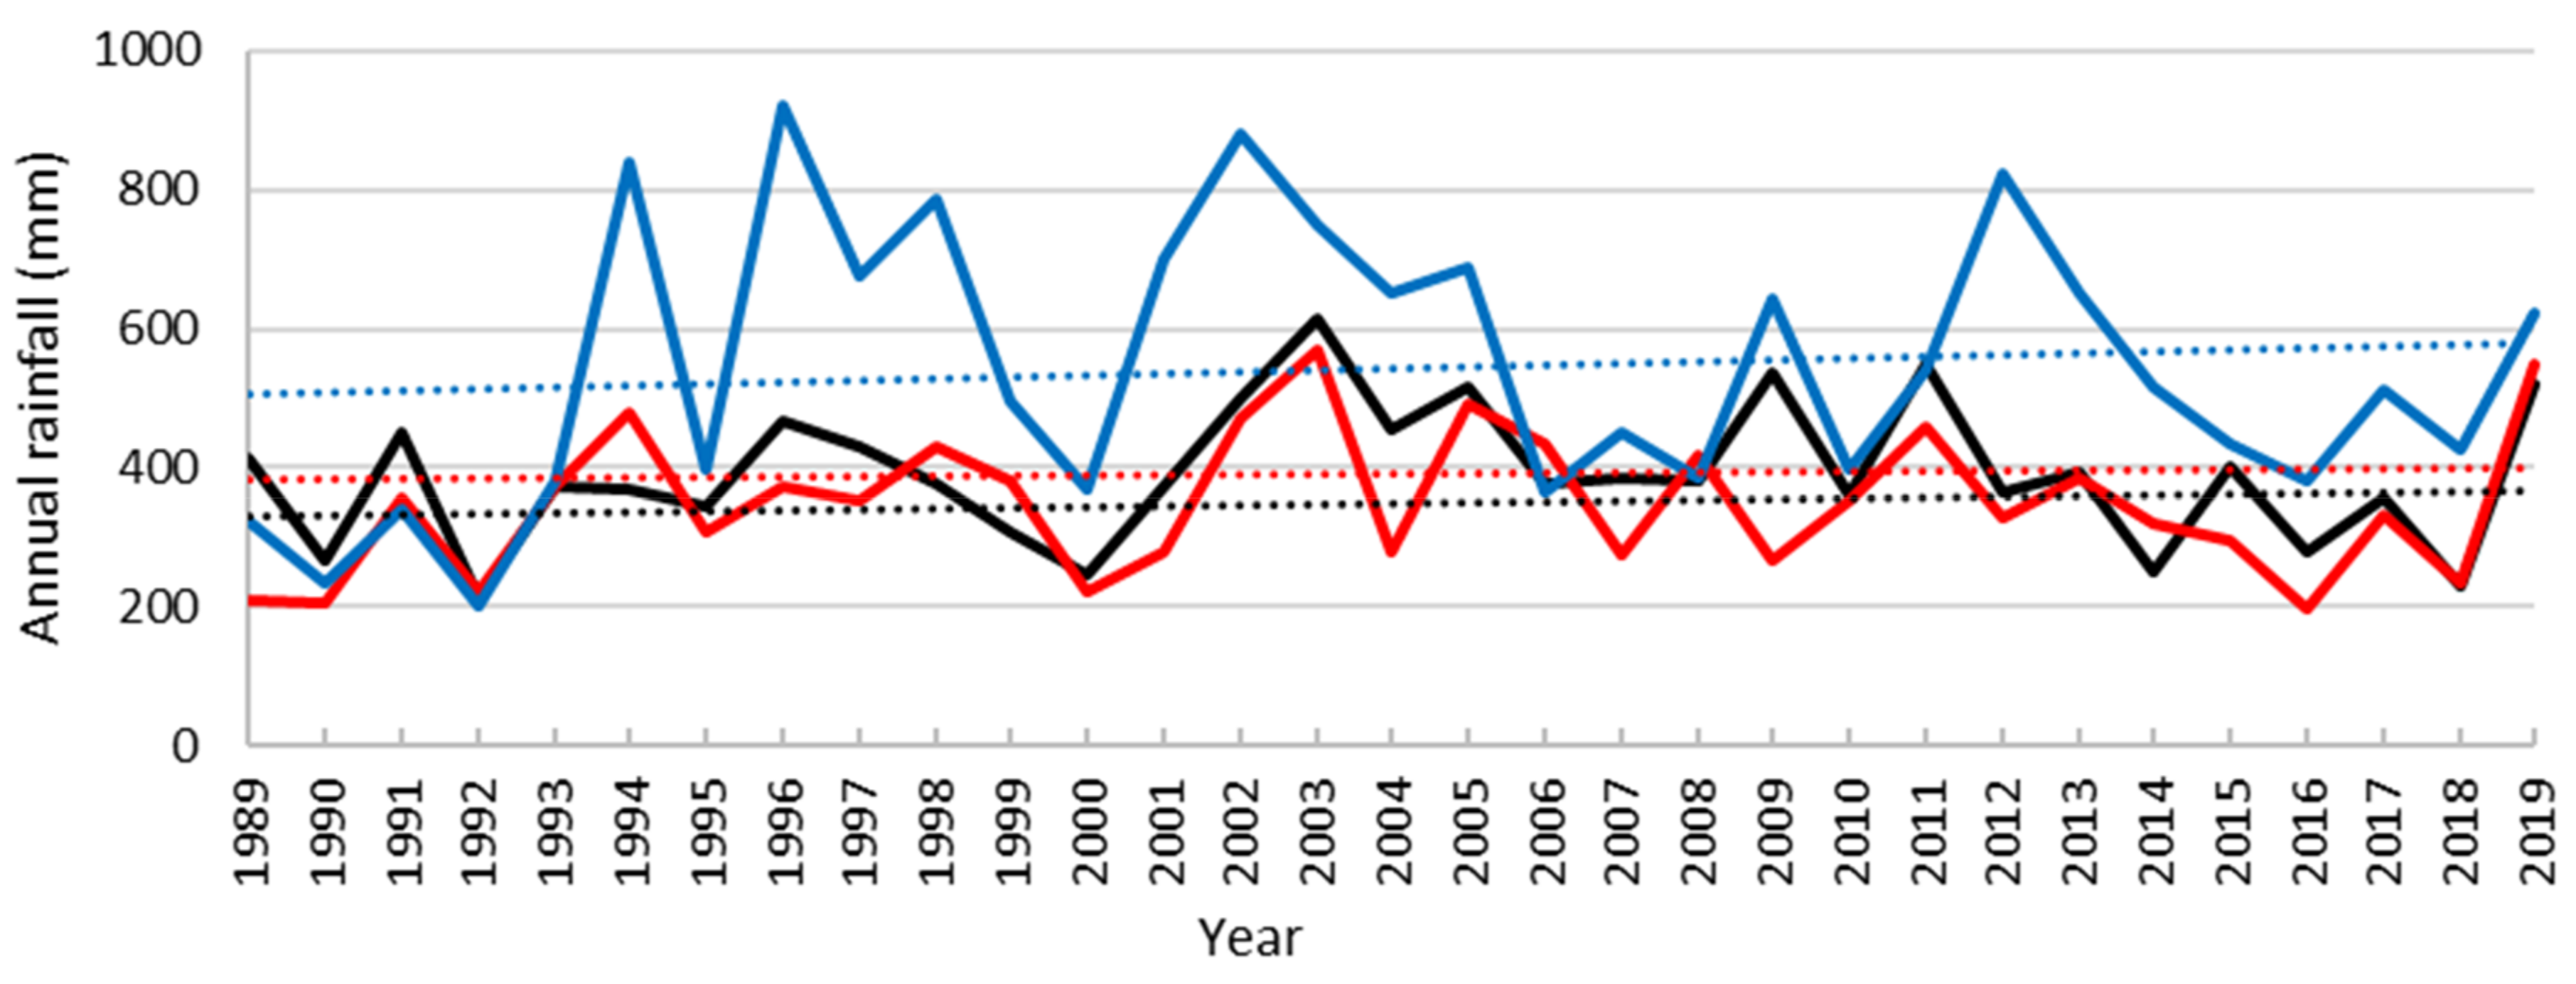
However, according to Table 3 and Figure 4, concerning the common operating period of the three stations, there is an increasing trend of rainfall for all of the stations. This change amounts to +5.9 mm/10 years in Mykonos, +12.1 mm/10 years in Naxos, and +24.6 mm/10 years in Kos.
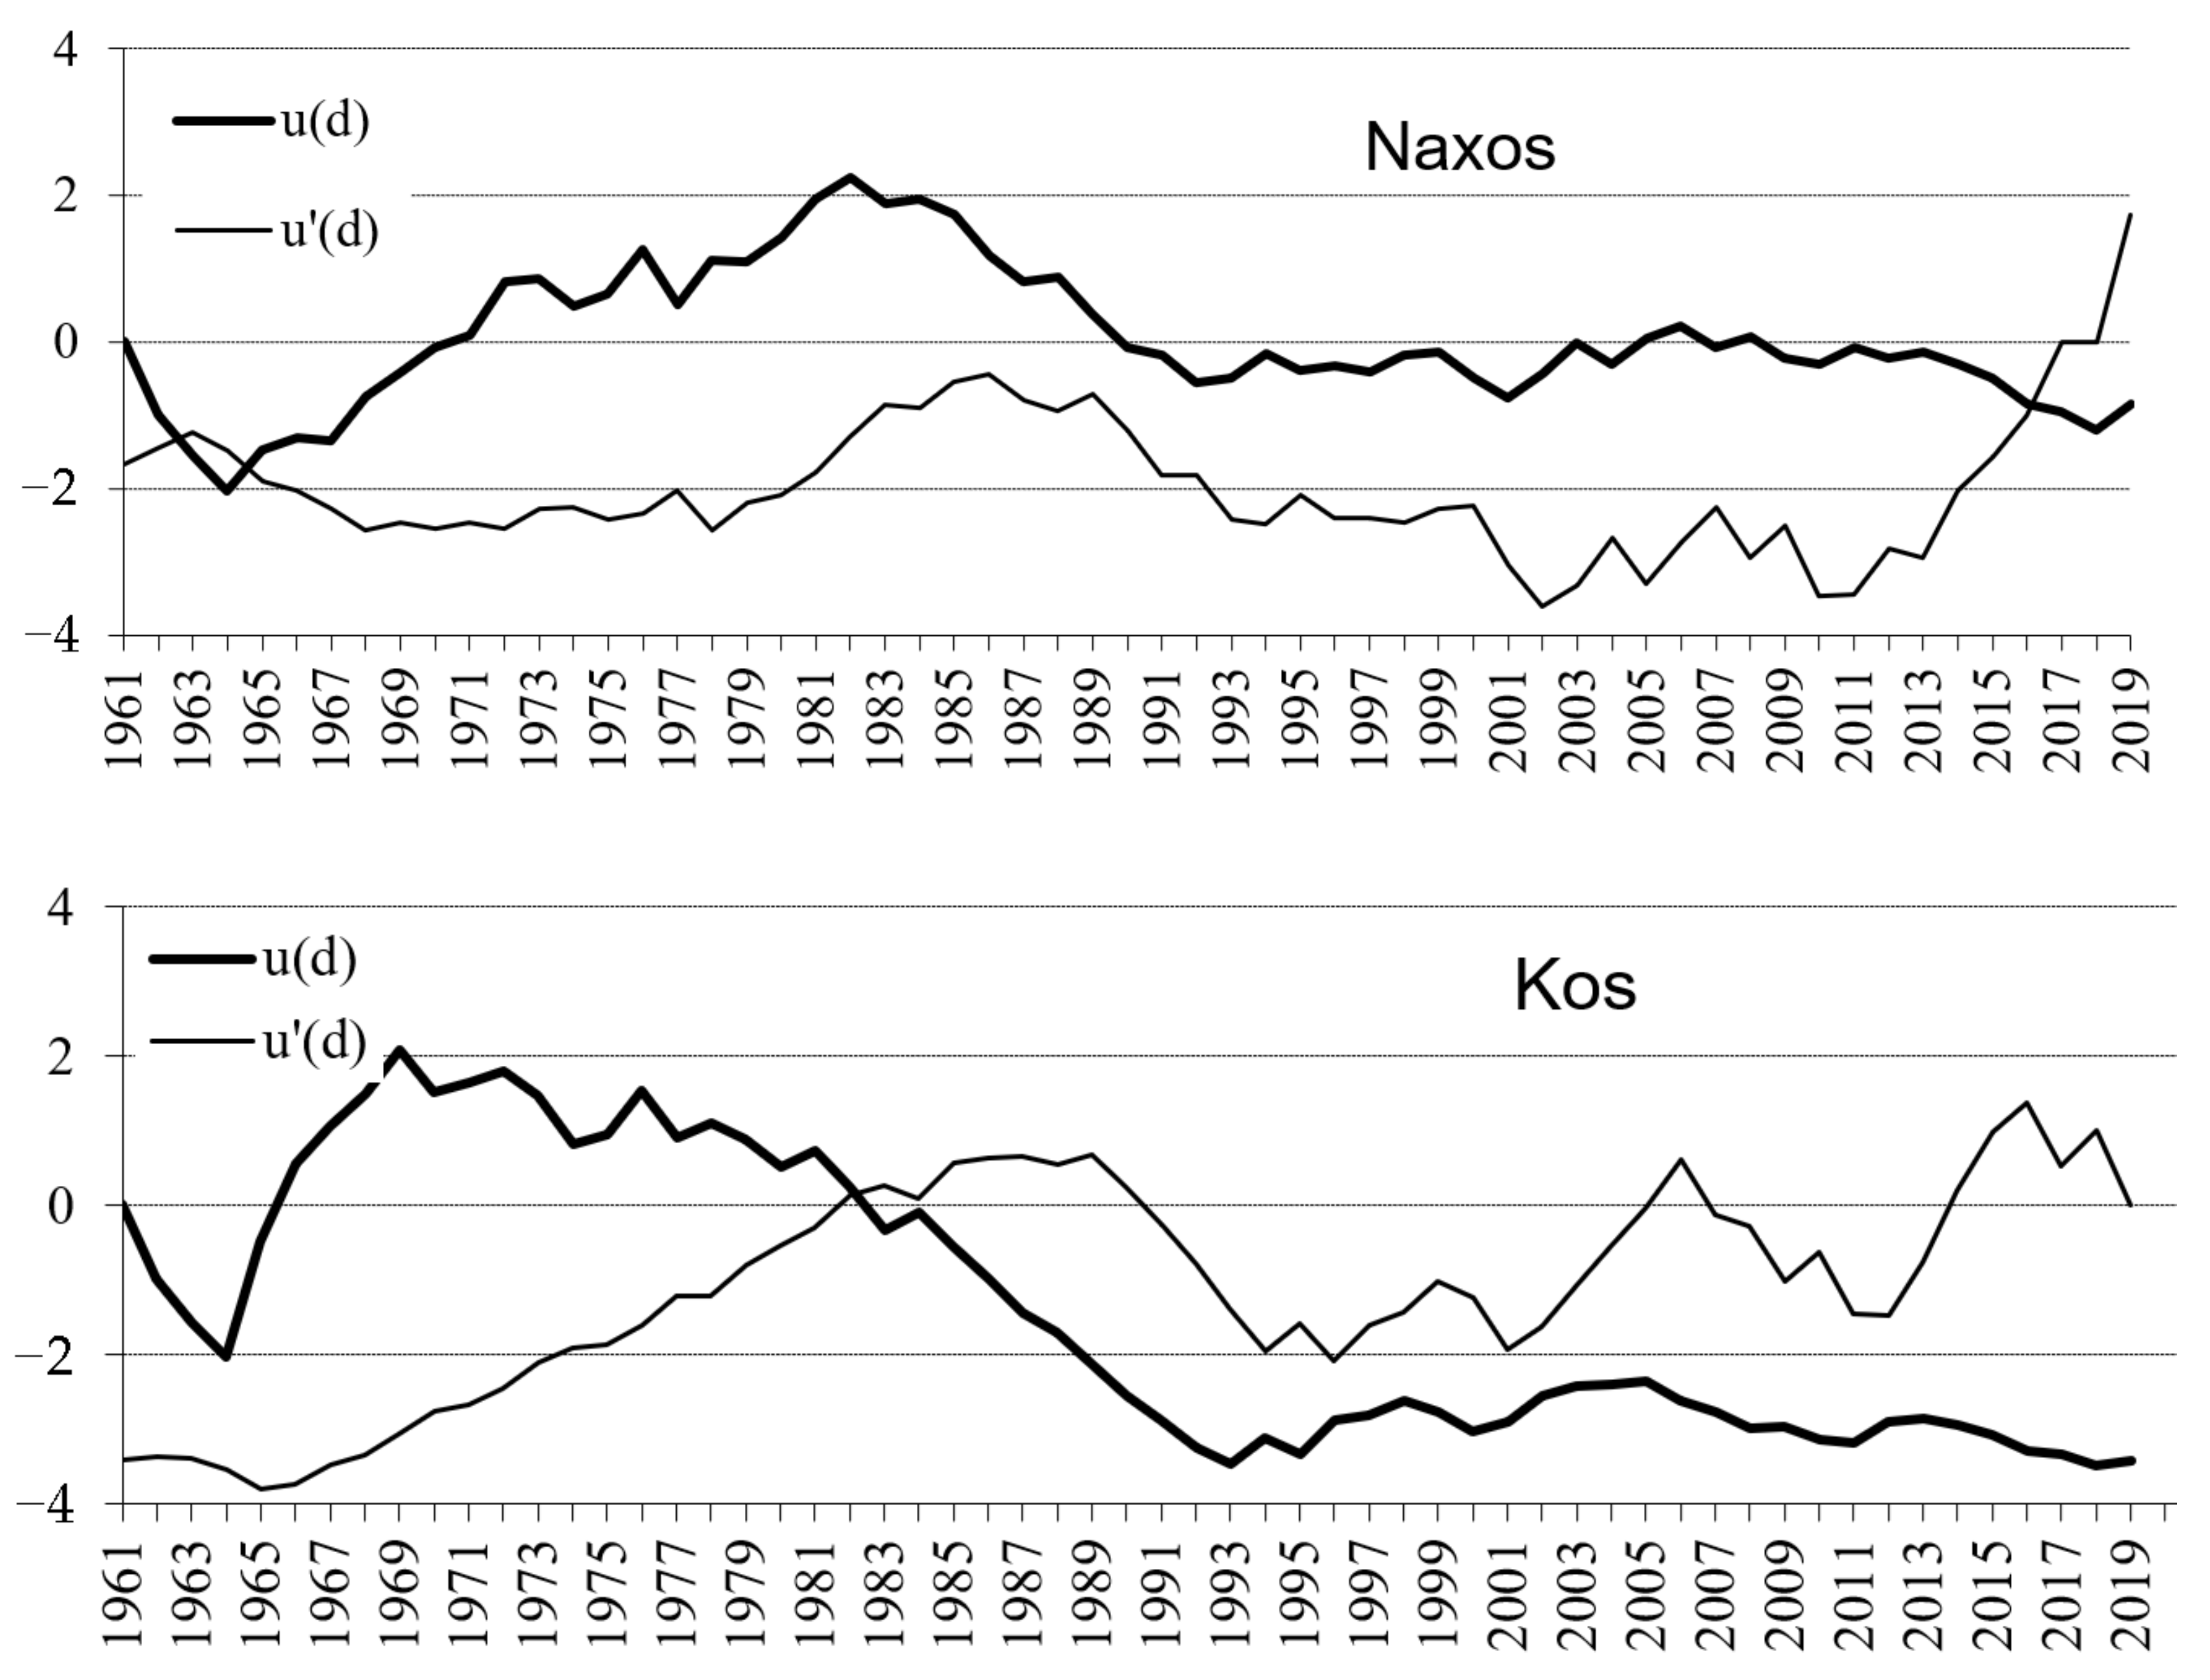
The Mann–Kendall trend test was used to investigate if there is an abrupt climate change in annual rainfall time series and whether this abrupt change is statistically significant (when the normal curve falls outside the confidence interval) for a 95% significance level. For the meteorological stations of Naxos and Kos, which have provided observations since 1961, the Mann–Kendall trend test was implemented for 2 periods, 1961–2019 and 1989–2019; the latter period constitutes the common period of observations for all 3 MSs of the study area. The results of this work are presented in Figure 4 and Figure 5.
According to the results shown in Figure 4, it appears that concerning the observation period of 1961–2019, the change for the Naxos MS is not statistically significant (sig. level 95%). In contrast, the downward trend of precipitation demonstrated in the Kos MS is statistically significant (95% sig. level). As can be evidenced in Figure 4, the change that appears in the time series of rainfall in Kos begins in the year 1982.
The Mann–Kendall trend test was also applied for the common period of observations (1989–2019) obtained from the 3 stations of the research area. The results of the analysis are exhibited in Figure 5. The MSs of Kos, Mykonos, and Naxos display a slightly downward trend. However, it is evident that during the observation period 1989–2019, the changes in precipitation time series are not statistically significant (sig. level 95%) for the 3 MSs. Several studies conducted in the Mediterranean region have analyzed precipitation time series trends and demonstrated ambiguous results. Most of these studies revealed a stationary precipitation trend, while few of them showed upward as well as downward, trends of precipitation; however, in a few studies, these trends were found to be statistically significant [41,74,75,76,77].
3.2. Air Temperature
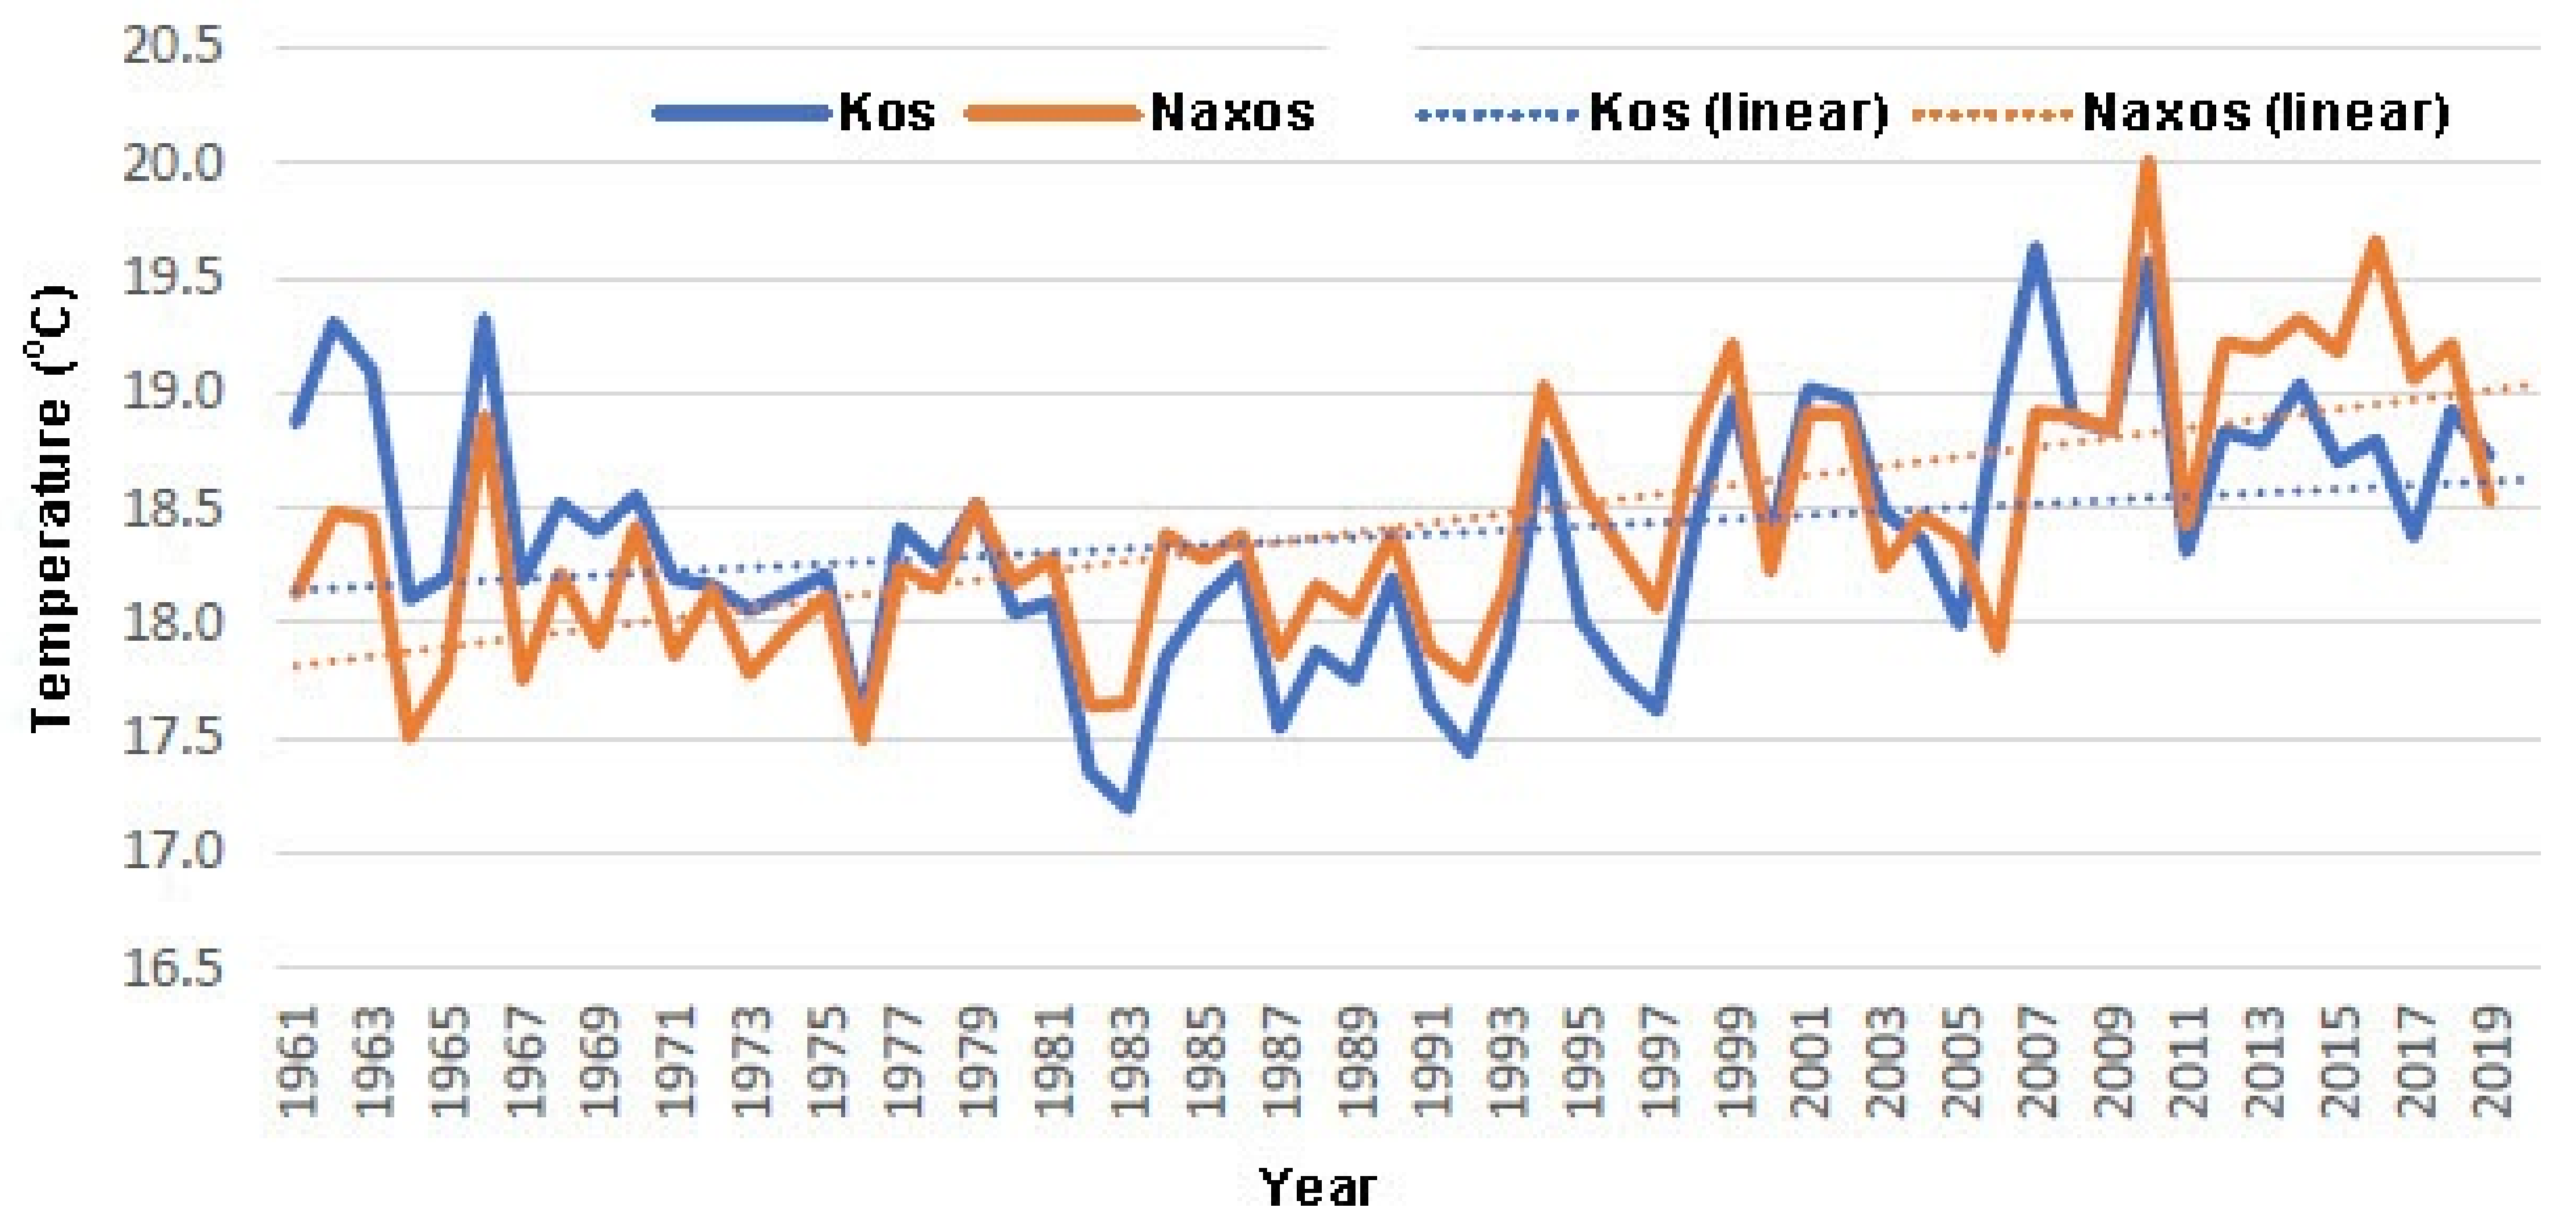
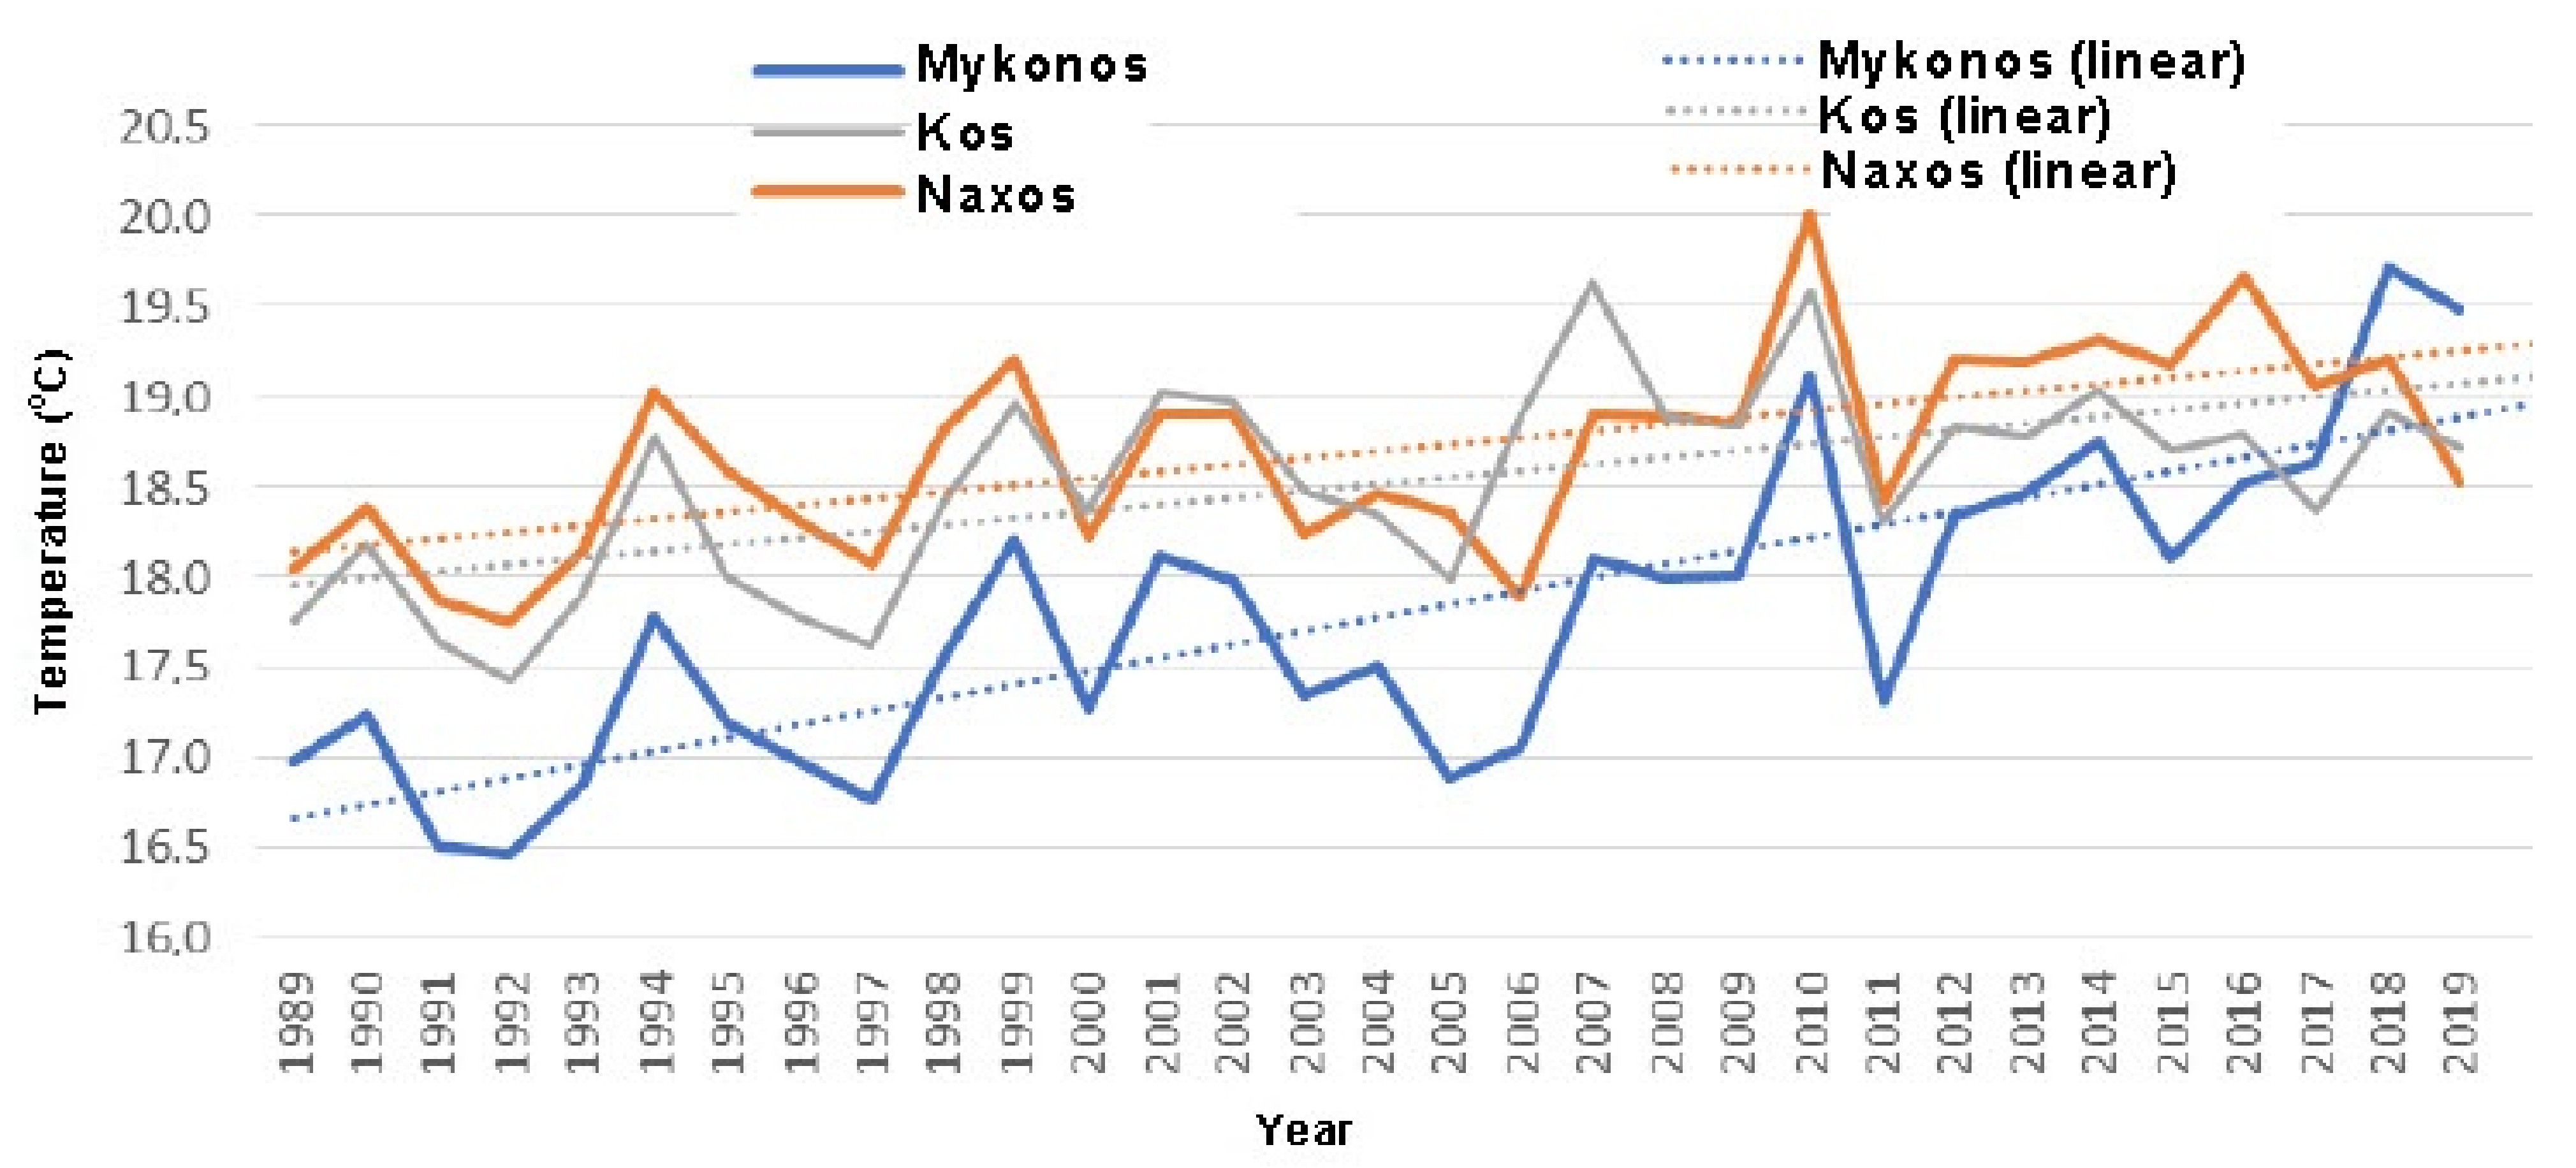
Table 4 and Figure 6 and Figure 7 present the time series trend equations expressing the change in the mean annual temperature as well as the change in mean annual temperature per decade for the MSs of the research area. According to Table 4, the temperature trend for the period of 1961–2019 for the MSs of Naxos and Kos, as well as for the common period for the 3 stations, is upward.
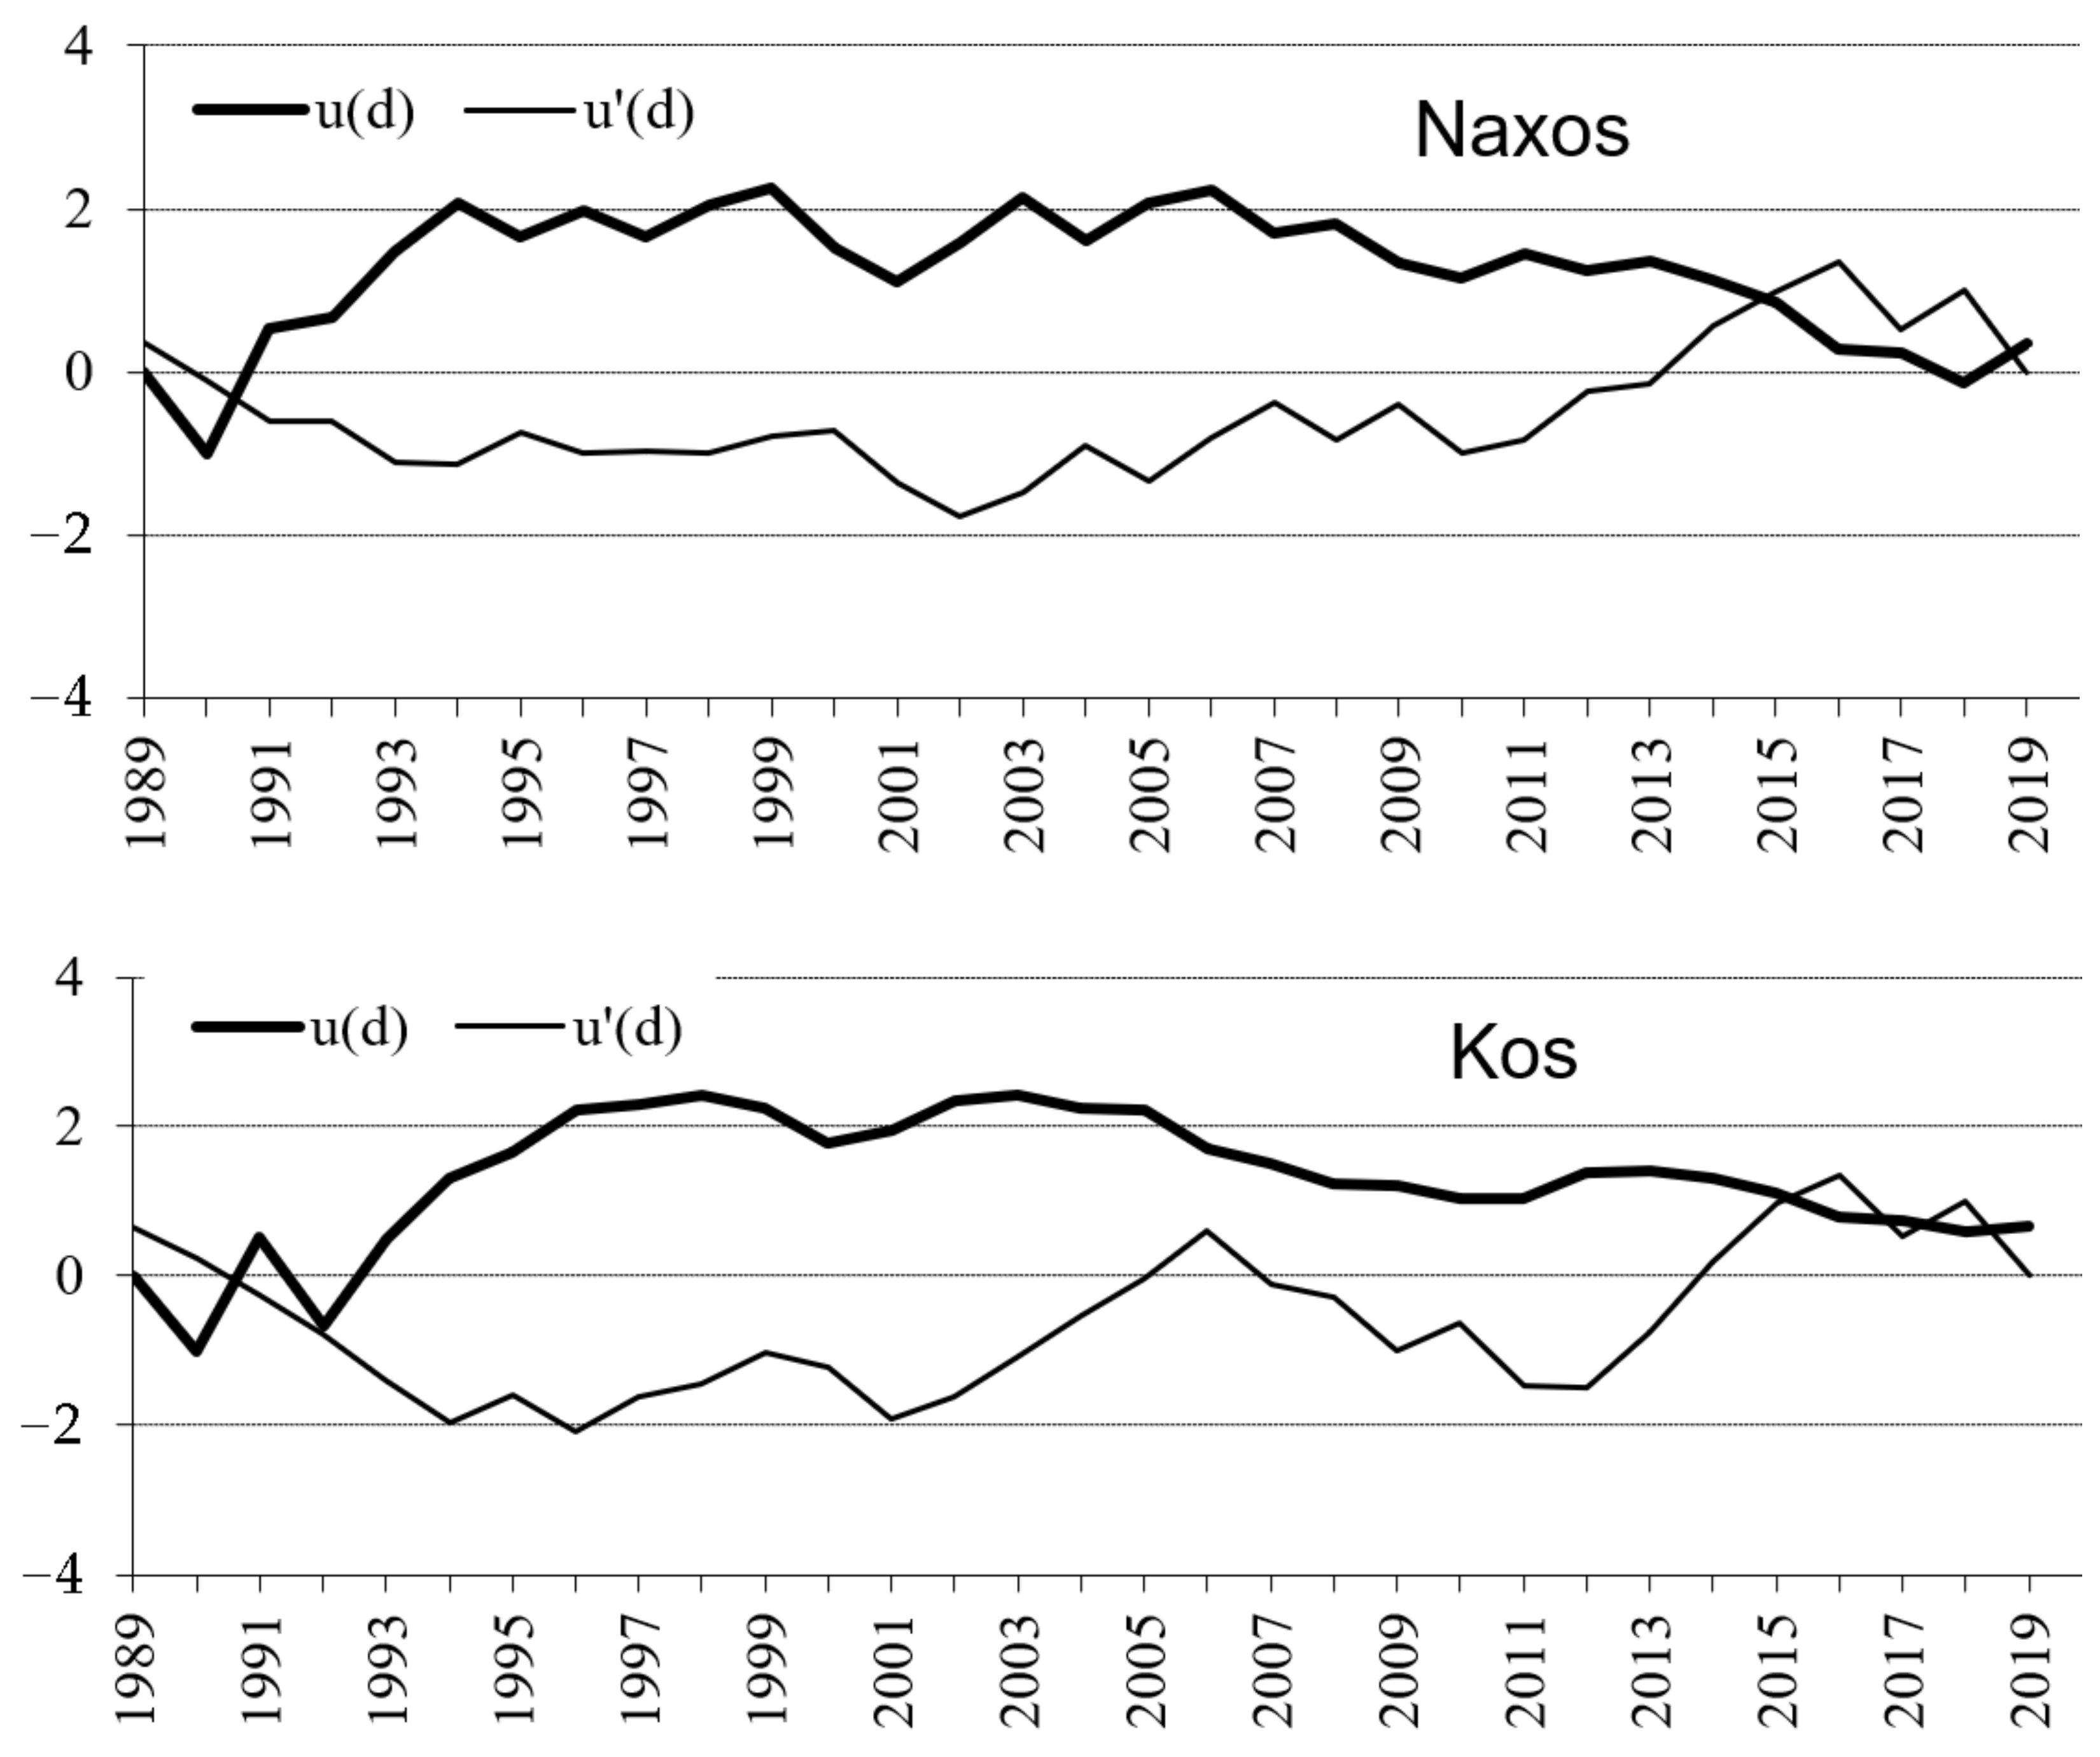
The Mann–Kendall trend analysis was used to investigate abrupt or non-climatic change in mean annual air temperatures, as well as whether this change is statistically significant (when the normal curve exits the confidence interval) for a 95% significance level. Figure 8 and Figure 9 show the findings of this research. Figure 8 demonstrates abrupt temperature increases, while during the observation period of 1961–2019 (for the Naxos and Kos MSs) the upward trends are statistically significant (95% sig. level). The change starts from the year 2001 for the Naxos station (upward trend) and for the Kos station (upward trend) in the year 2005.
The Mann–Kendall trend test was also applied for the common observation period 1989–2019 concerning the 3 MSs of the research area. The results of the analysis can be observed in the following Figure 9. According to this figure, an upward trend can be observed in the data of all MSs, and the change starts from the year 2010 for the MS of Mykonos, the year 2008 for the MS of Naxos, and the year 1997 for the MS of Kos, respectively. These changes were found to be statistically significant (95% sig. level) for all 3 MSs. Several studies in the Mediterranean region have also revealed a statistically significant increase in air temperature in recent decades [41,75,76,78,79].
3.3. Drought Analysis
3.3.1. Bagnouls and Gaussen Ombro-Thermal Diagrams
Using the monthly time series of rainfall and temperature, ombro-thermal diagrams were constructed, which clearly display the distribution of the amount of rainfall in each month of the year and can be observed in the following figures (Figure 10, Figure 11 and Figure 12). According to these figures, it is revealed that the month of the highest rainfall, concerning the study area, is January, followed by December and February for all three stations. Additionally, it is evident that there is a long and intense dry-thermal period, which is typical for the climate of the region. More specifically, Naxos is the island with the longest dry-thermal period (April–October) (Figure 11), i.e., over half the months of the year, followed by Mykonos (Figure 10) with half the months of the year (April–September) in a dry-thermal period, while Kos presents conditions of higher moisture, showing a dry-thermal period from May until September (Figure 12).
3.3.2. Standardized Precipitation Index (SPI)
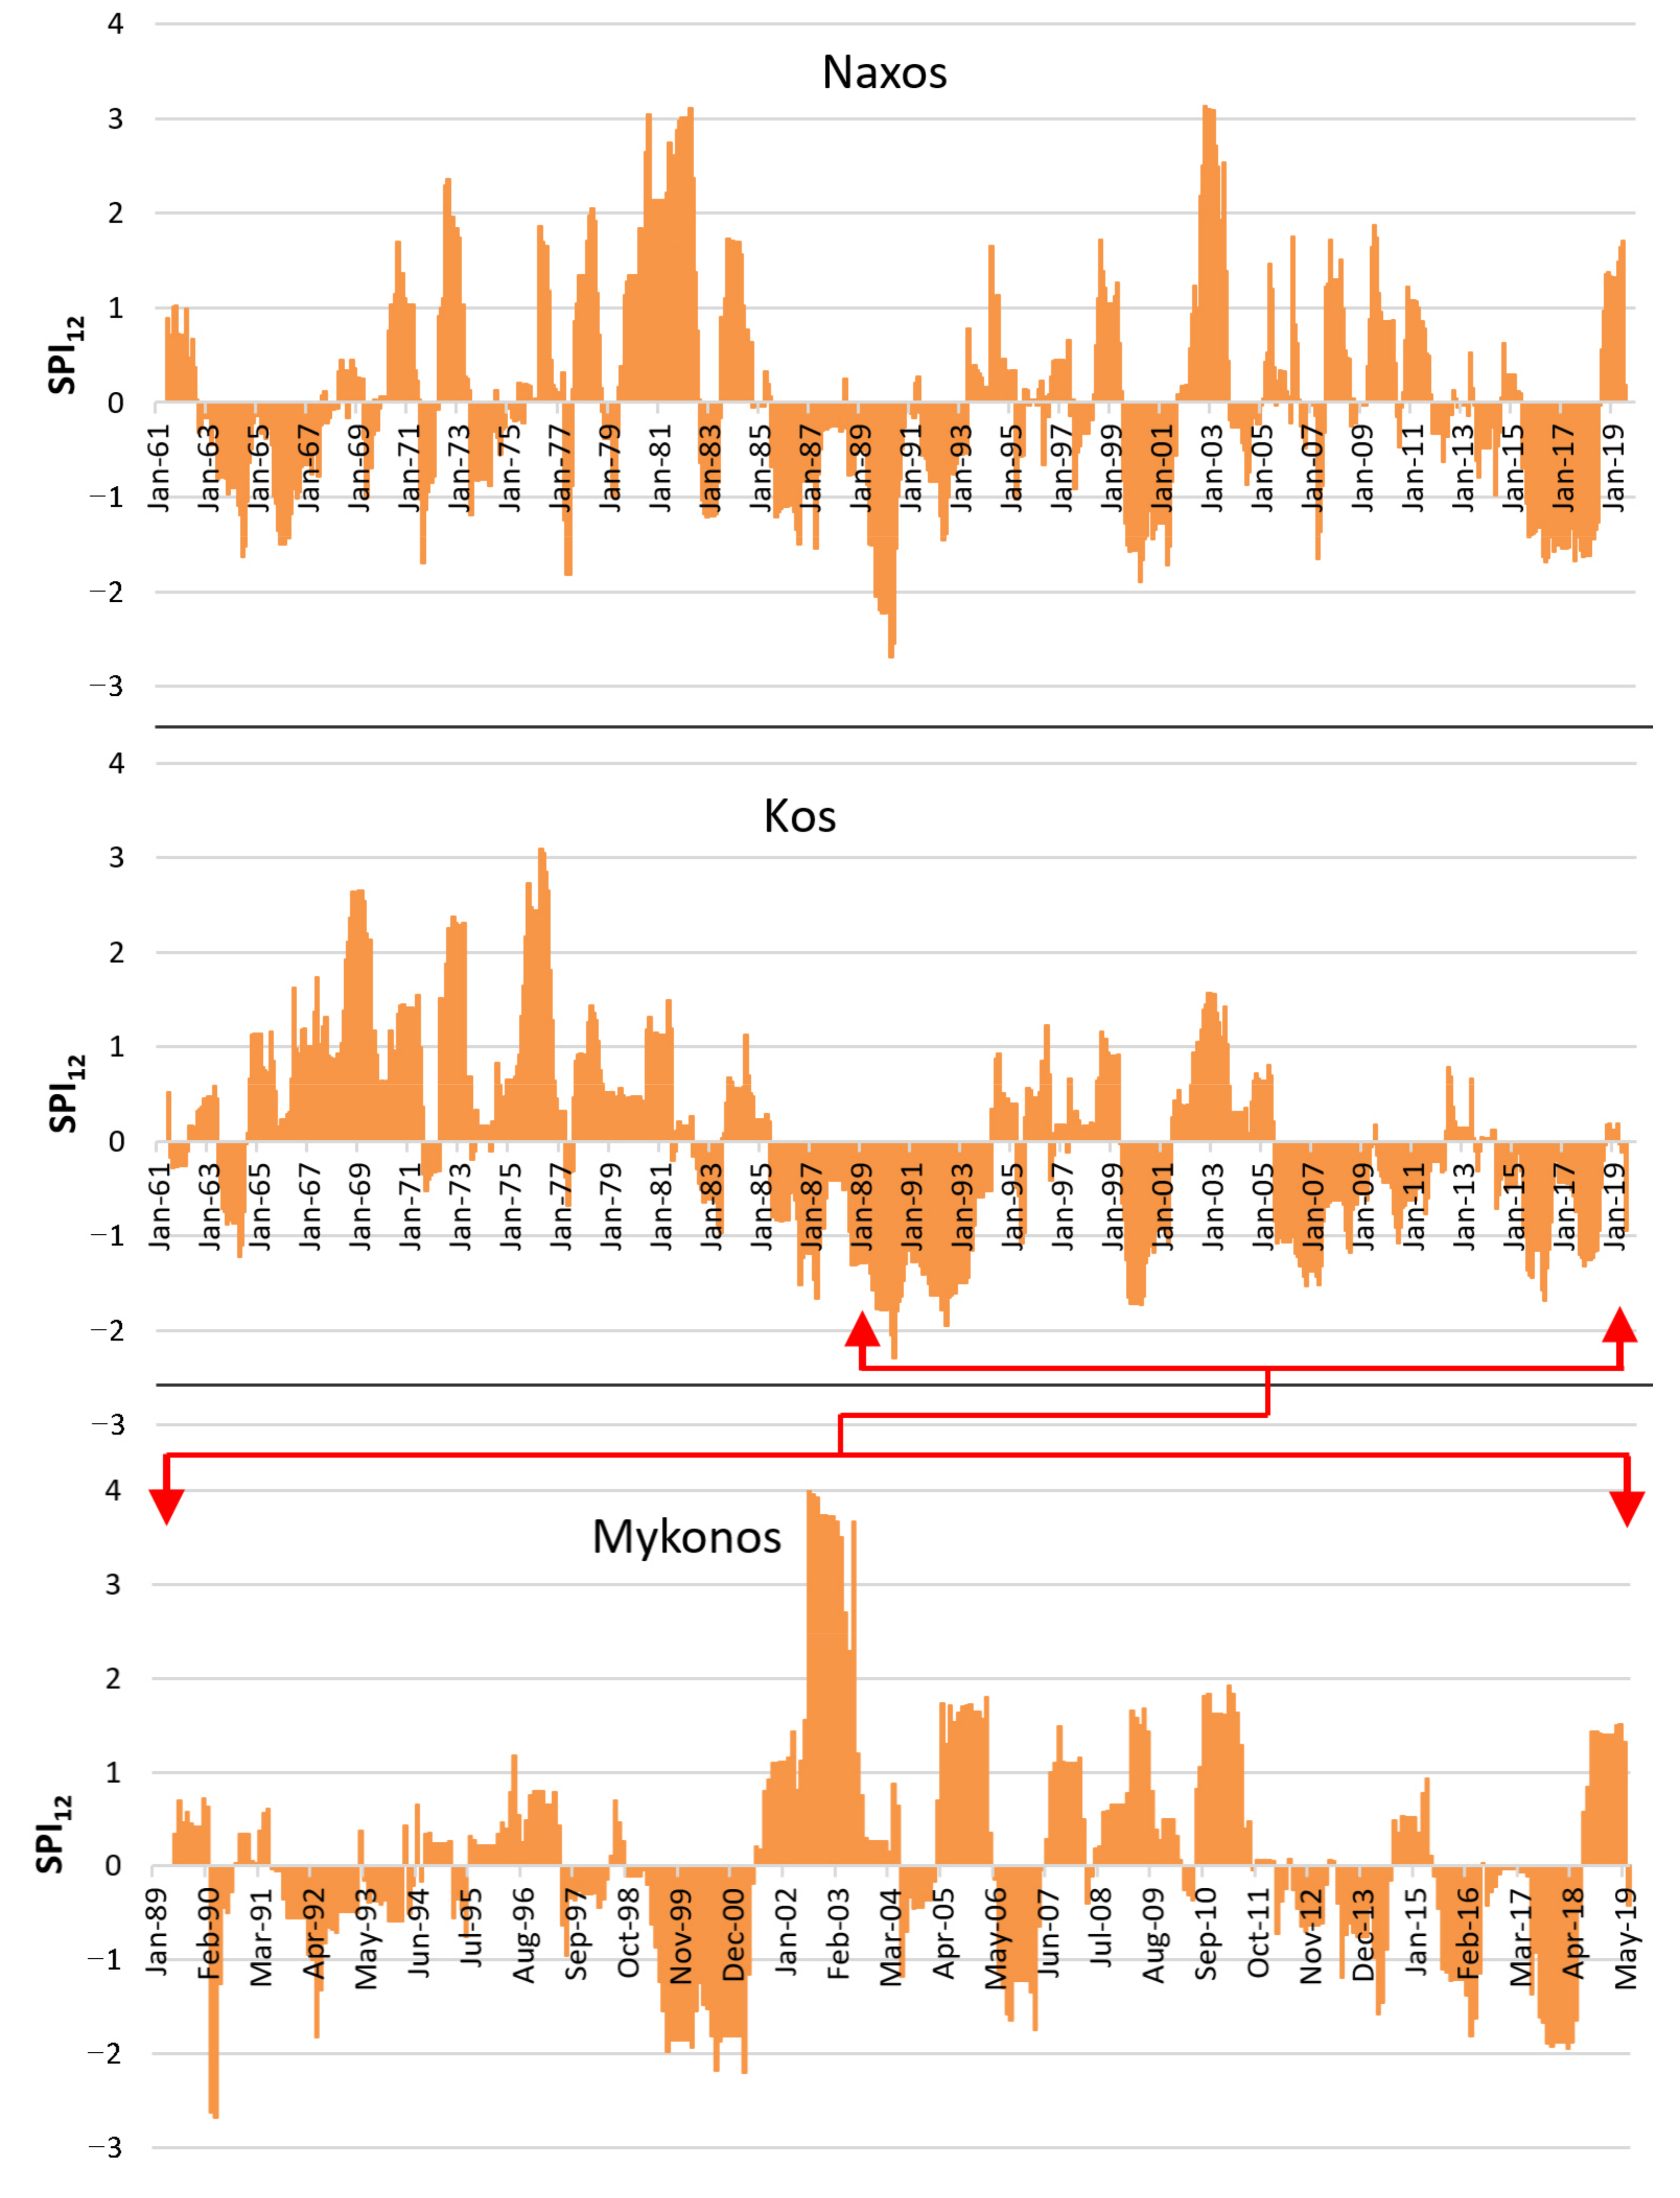
In the present study, the 12-month Standardized Precipitation Index (SPI12) was applied. SPI can be used as an indicator for immediate effects, such as decreased soil moisture, snowfall, and flow in tiny creeks, when it is computed for shorter accumulation periods (e.g., 1 to 3 months). Longer accumulation durations (e.g., 12 to 48 months) allow for the computation of SPI, which can be used as an indicator of decreased reservoir and groundwater recharge. The SPI12 index is more closely related to the water table height in a region, while soil moisture and surface stocks are even more closely related to SPI3 variation [80]. Table 5 exhibits the most significant drought episodes, while Figure 13 presents the evolution of the SPI12 index over time.
According to Table 5 and Figure 13, it can be seen that severe (−1.5 ≤ SPI ≤ −2) and extreme drought (SPI ≤ −2) episodes occurred in common relative periods with some variations in their characteristics. Thus, in the observation period of 1989–1991, a period of drought occurred for the entire area of Greece [8,81] as well as for the wider area of the eastern Mediterranean region [82,83,84]; the duration of the drought in Mykonos and Kos was found to be 2 months, while in Naxos it was 9 months. During the years 1999–2001, a significant drought was observed in all 3 islands with the longest duration in Mykonos (21 months), while in Naxos and Kos the duration was 8 months. Moreover, one month with characteristics of extreme drought was observed in Mykonos.
In the period of 2006–2007, Mykonos experienced a drought of 7 months, Naxos for 2 months, and Kos for a longer period (22 months). Finally, in the period from August 2015, Naxos faced a continuous drought of 36 months, while Mykonos during the same period presented 2 droughts of 10 months and Kos experienced 2 episodes of drought of 12 and 10 months, respectively.
Drought frequency and intensity are expected to have risen in the Mediterranean basin, and this area will likely be impacted from drought as a result of the intense global temperature rise [85] that could result in higher levels of drought [86,87,88]. The Aridity Index, which takes into account both rainfall and potential evapotranspiration, is expected to rise by up to 50% throughout most of the Eastern Mediterranean region [89]. Furthermore, climate change has already impacted water supply in the Mediterranean area [90]. The results revealed that the study area suffers from frequent drought episodes. However, the ancient Greek civilization was established and developed uninterruptedly on these islands for thousands of years, which proves that there was available water to support the population demand. Nowadays, the effect of climate change is mainly expressed by an intense increase in mean temperature, and it seems that the research area cannot cover the water needs. The lack of water is particularly high in the summer months, when the water demand reaches its maximum level due to tourism and irrigation needs. Thus, best management practices should be applied in order to increase the volume of water stored during the winter season, when the maximum volume of precipitation is concentrated. Taking into account the positive and negative aspects, such practices could be the construction of new surface water conservation projects (water reservoirs), installation of new desalination units, saving water in agriculture, saving water in the water supply, reduction in water supply/irrigation network losses, detecting illegal drilling/wells, and changes in pricing policy and the transport of water using water vessels.
4. Conclusions
The intense seasonal drought that prevails in the research area, characteristic of the uneven distribution of precipitation throughout the year, coincides with the highest water demand period since during summer the permanent population of the islands has increased water needs. There is also significant tourism activity as well as increased irrigation water requirements since most cultivated species present the greatest water demands during this period.
According to the current analyses, it emerged that there was no change in the amount of rain in the period of 1961–2019 for the Naxos station, while for the Kos station a decrease of 58.8 mm per decade was observed. The rainfall time series of the 3 MSs (for the common period 1989–2019) showed an increase of +5.9 mm/10 years for Mykonos, +12.1 mm/10 years for Naxos, and +24.6 mm/10 years for Kos but were not statistically significant. Concerning the mean annual air temperatures, an increase was observed for the observation period of 1961–2019 for both Naxos (+0.21 °C/10 years) and Kos (+0.08 °C/10 years), and the trends were statistically significant. The change appears to start from 2001 for the Naxos station (upward trend) and 2005 for the Kos station (upward trend). The SPI drought index estimation revealed that severe (−1.5 ≤ SPI ≤ −2) and extreme drought (SPI ≤ −2) episodes occurred in common relative periods with some slight variations in their characteristics among the 3 islands.
The relatively stationary annual precipitation combined with the significant increase in temperature could potentially increase the recurrence and intensity of drought phenomena as the evapotranspiration increases. The reduction in the available water and its consequences depend on the intensity of this phenomenon, as well as on the effectiveness of the mitigation measures that have been developed in the water supply systems and the socio-economic system of the region. In Mediterranean countries, water shortage phenomena are frequent and present serious socio-economic impacts related to the insufficient adaptation of water supply systems, agricultural systems, and society under water scarcity conditions. The negative effects are linked to the frequency of the phenomenon occurrence, the increasing water demands due to population growth and tourism activity, as well as irrigation needs. The great necessity for the development of a drought management strategy towards the prevention or mitigation of the extent of drought events and their consequences has been highlighted as a priority issue to be addressed in the Mediterranean region.
Author Contributions
Conceptualization, D.M. and E.S.; methodology, E.S. and A.K.; software, E.S.; validation, E.S.; formal analysis, E.S. and A.K.; investigation, E.S.; data curation, E.S.; writing—original draft preparation, E.S. and A.K.; writing—review and editing, E.S. and A.K.; visualization, A.K.; supervision, D.M. All authors have read and agreed to the published version of the manuscript.
Funding
This research received no external funding.
Data Availability Statement
The data that support the findings of this study are available from the corresponding author upon reasonable request.
Conflicts of Interest
The authors declare no conflict of interest.
References
- Anandharuban, P.; Elango, L. Spatio-Temporal Analysis of Rainfall, Meteorological Drought and Response from a Water Supply Reservoir in the Megacity of Chennai, India. J. Earth Syst. Sci. 2021, 130, 17. [Google Scholar] [CrossRef]
- Jellason, N.P.; Conway, J.S.; Baines, R.N.; Ogbaga, C.C. A Review of Farming Challenges and Resilience Management in the Sudano-Sahelian Drylands of Nigeria in an Era of Climate Change. J. Arid Environ. 2021, 186, 104398. [Google Scholar] [CrossRef]
- Beran, A.; Hanel, M.; Nesládková, M.; Vizina, A. Increasing Water Resources Availability under Climate Change. Procedia Eng. 2016, 162, 448–454. [Google Scholar] [CrossRef]
- Intergovernmental Panel on Climate Change (IPCC). Climate Change 2014: Synthesis Report; Contribution of Working Groups I, II and III to the Fifth Assessment Report of the Intergovernmental Panel on Climate Change; Pachauri, R.K., Meyer, L.A., Eds.; IPCC: Geneva, Switzerland.
- Intergovernmental Panel on Climate Change (IPCC). Summary for Policymakers. In Climate Change 2021: The Physical Science Basis. Contribution of Working Group I to the Sixth Assessment Report of the Intergovernmental Panel on Climate Change; Masson-Delmotte, V.P., Zhai, A., Pirani, S.L., Connors, C., Péan, S., Berger, N., Caud, Y., Chen, L., Goldfarb, M.I., Gomis, M., et al., Eds.; IPCC: Cambridge University Press: Cambridge, UK; New York, NY, USA, 2021; p. 2391. [Google Scholar]
- Karpouzos, D.K.; Kavalieratou, S.; Babajimopoulos, C. Trend Analysis of Precipitation Data in Pieria Region; Aristotle University of Thessaloniki: Thessaloniki, Greece, 2009. [Google Scholar]
- Mavromatis, T. Changes in Exceptional Hydrological and Meteorological Weekly Event Frequencies in Greece. Clim. Change 2012, 110, 249–267. [Google Scholar] [CrossRef]
- Myronidis, D.; Fotakis, D.; Ioannou, K.; Sgouropoulou, K. Comparison of Ten Notable Meteorological Drought Indices on Tracking the Effect of Drought on Streamflow. Hydrol. Sci. J. 2018, 63, 2005–2019. [Google Scholar] [CrossRef]
- Myronidis, D.; Ioannou, K.; Fotakis, D.; Dörflinger, G. Streamflow and Hydrological Drought Trend Analysis and Forecasting in Cyprus. Water Resour. Manag. 2018, 32, 1759–1776. [Google Scholar] [CrossRef]
- Myronidis, D.; Theofanous, N. Changes in Climatic Patterns and Tourism and Their Concomitant Effect on Drinking Water Transfers into the Region of South Aegean, Greece. Stoch. Environ. Res. Risk Assess. 2021, 35, 1725–1739. [Google Scholar] [CrossRef]
- Amer, R.A.-M.; Baahmed, D.; Cherif, E.-A.; Iddou, A. Trend Detection of Hydroclimatic Parameters in Central Coastal Basin of Oran in Algeria: Is There Any Impact on Water Resources? Arab. J. Geosci. 2021, 14, 1442. [Google Scholar] [CrossRef]
- UNESCO World Water Assessment Programme. The United Nations World Water Development Report 2020: Water and Climate Change; Paris, France. 2020. Available online: https://unesdoc.unesco.org/ark:/48223/pf0000372985 (accessed on 30 March 2023).
- Bahir, M.; Ouhamdouch, S.; Ouazar, D.; El Moçayd, N. Climate Change Effect on Groundwater Characteristics within Semi-Arid Zones from Western Morocco. Groundw. Sustain. Dev. 2020, 11, 100380. [Google Scholar] [CrossRef]
- Prosser, I.P.; Chiew, F.H.S.; Stafford Smith, M. Adapting Water Management to Climate Change in the Murray–Darling Basin, Australia. Water 2021, 13, 2504. [Google Scholar] [CrossRef]
- Kumar, V.; Jain, S.K.; Singh, Y. Analysis of Long-Term Rainfall Trends in India. Hydrol. Sci. J. 2010, 55, 484–496. [Google Scholar] [CrossRef]
- Pal, A.B.; Khare, D.; Mishra, P.K.; Singh, L. Trend Analysis of Rainfall, Temperature and Runoff Data: A Case Study of Rangoon Watershed in Nepal. Int. J. Stud. Res. Technol. Manag. 2017, 5, 21–38. [Google Scholar] [CrossRef]
- Margiorou, S.; Kastridis, A.; Sapountzis, M. Pre/Post-Fire Soil Erosion and Evaluation of Check-Dams Effectiveness in Mediterranean Suburban Catchments Based on Field Measurements and Modeling. Land 2022, 11, 1705. [Google Scholar] [CrossRef]
- Kastridis, A.; Stathis, D. The Effect of Rainfall Intensity on the Flood Generation of Mountainous Watersheds; Chalkidiki Prefecture, North Greece; Springer: Cham, Switzerland, 2017; pp. 341–347. [Google Scholar]
- Singh, O.; Arya, P.; Chaudhary, B.S. On Rising Temperature Trends at Dehradun in Doon Valley of Uttarakhand, India. J. Earth Syst. Sci. 2013, 122, 613–622. [Google Scholar] [CrossRef]
- Kumar, R.; Raj Gautam, H. Climate Change and Its Impact on Agricultural Productivity in India. J. Climatol. Weather. Forecast. 2014, 2, 1000109. [Google Scholar] [CrossRef]
- Anagnostopoulou, C. A Contribution to the Drought Analysis in Greece. Ph.D Thesis, Aristotle University of Thessaloniki, Thessaloniki, Greece, 2003. [Google Scholar]
- Kastridis, A.; Stathis, D.; Sapountzis, M.; Theodosiou, G. Insect Outbreak and Long-Term Post-Fire Effects on Soil Erosion in Mediterranean Suburban Forest. Land 2022, 11, 911. [Google Scholar] [CrossRef]
- Barmpoutis, P.; Stathaki, T.; Kamperidou, V. Monitoring of Trees’ Health Condition Using a UAV Equipped with Low-Cost Digital Camera. In Proceedings of the ICASSP, IEEE International Conference on Acoustics, Speech and Signal Processing, Brighton, UK, 12–17 May 2019; pp. 8291–8295. [Google Scholar]
- Tsakiris, G.; Vangelis, H. Towards a Drought Watch System Based on Spatial SPI. Water Resour. Manag. 2004, 18, 1–12. [Google Scholar] [CrossRef]
- Santos Pereira, L.; Cordery, I.; Iacovides, I. Coping with Water Scarcity; Springer: Dordrecht, The Netherlands, 2009; ISBN 978-1-4020-9578-8. [Google Scholar]
- Dalezios, N.R.; Angelakis, A.N.; Eslamian, S.S. Water Scarcity Management: Part 1: Methodological Framework. Int. J. Glob. Environ. Issues 2018, 17, 1. [Google Scholar] [CrossRef]
- Dalezios, N.R.; Dercas, N.; Eslamian, S.S. Water Scarcity Management: Part 2: Satellite-Based Composite Drought Analysis. Int. J. Glob. Environ. Issues 2018, 17, 262. [Google Scholar] [CrossRef]
- Pnevmatikos, J.D.; Katsoulis, B.D. The Changing Rainfall Regime in Greece and Its Impact on Climatological Means. Meteorol. Appl. 2006, 13, 331. [Google Scholar] [CrossRef]
- Varlas, G.; Stefanidis, K.; Papaioannou, G.; Panagopoulos, Y.; Pytharoulis, I.; Katsafados, P.; Papadopoulos, A.; Dimitriou, E. Unravelling Precipitation Trends in Greece since 1950s Using ERA5 Climate Reanalysis Data. Climate 2022, 10, 12. [Google Scholar] [CrossRef]
- Markonis, Y.; Batelis, S.C.; Dimakos, Y.; Moschou, E.; Koutsoyiannis, D. Temporal and Spatial Variability of Rainfall over Greece. Theor. Appl. Climatol. 2017, 130, 217–232. [Google Scholar] [CrossRef]
- Livada, I.; Charalambous, G.; Assimakopoulos, M.N. Spatial and Temporal Study of Precipitation Characteristics over Greece. Theor. Appl. Climatol. 2008, 93, 45–55. [Google Scholar] [CrossRef]
- Tolika, K.; Maheras, P. Spatial and Temporal Characteristics of Wet Spells in Greece. Theor. Appl. Climatol. 2005, 81, 71–85. [Google Scholar] [CrossRef]
- Amanatidis, G.T.; Paliatsos, A.G.; Repapis, C.C.; Bartzis, J.G. Decreasing Precipitation Trend in the Marathon Area, Greece. Int. J. Climatol. 1993, 13, 191–201. [Google Scholar] [CrossRef]
- Xoplaki, E.; González-Rouco, J.F.; Luterbacher, J.; Wanner, H. Wet Season Mediterranean Precipitation Variability: Influence of Large-Scale Dynamics and Trends. Clim. Dyn. 2004, 23, 63–78. [Google Scholar] [CrossRef]
- Feidas, H.; Makrogiannis, T.; Bora-Senta, E. Trend Analysis of Air Temperature Time Series in Greece and Their Relationship with Circulation Using Surface and Satellite Data: 1955–2001. Theor. Appl. Climatol. 2004, 79, 185–208. [Google Scholar] [CrossRef]
- Feidas, H.; Noulopoulou, C.; Makrogiannis, T.; Bora-Senta, E. Trend Analysis of Precipitation Time Series in Greece and Their Relationship with Circulation Using Surface and Satellite Data: 1955–2001. Theor. Appl. Climatol. 2007, 87, 155–177. [Google Scholar] [CrossRef]
- Nastos, P.T.; Zerefos, C.S. Decadal Changes in Extreme Daily Precipitation in Greece. Adv. Geosci. 2008, 16, 55–62. [Google Scholar] [CrossRef]
- Mavromatis, T.; Stathis, D. Response of the Water Balance in Greece to Temperature and Precipitation Trends. Theor. Appl. Climatol. 2011, 104, 13–24. [Google Scholar] [CrossRef]
- Kastridis, A.; Stathis, D. The Effect of Small Earth Dams and Reservoirs on Water Management in North Greece (Kerkini Municipality). Silva Balc. 2015, 16, 71–84. [Google Scholar]
- Zanis, P.; Katragkou, E.; Ntogras, C.; Marougianni, G.; Tsikerdekis, A.; Feidas, H.; Anadranistakis, E.; Melas, D. Transient High-Resolution Regional Climate Simulation for Greece over the Period 1960-2100: Evaluation and Future Projections. Clim. Res. 2015, 64, 123–140. [Google Scholar] [CrossRef]
- Kastridis, A.; Kamperidou, V.; Stathis, D. Dendroclimatological Analysis of Fir (A. Borisii-Regis) in Greece in the Frame of Climate Change Investigation. Forests 2022, 13, 879. [Google Scholar] [CrossRef]
- Sakalis, V.D. Trend Analysis of Annual and Seasonal Precipitation Data in Arcadia Region (Greece). Bull. Atmos. Sci. Technol. 2022, 3, 8. [Google Scholar] [CrossRef]
- Tzanis, C.G.; Koutsogiannis, I.; Philippopoulos, K.; Deligiorgi, D. Recent Climate Trends over Greece. Atmos. Res. 2019, 230, 104623. [Google Scholar] [CrossRef]
- Philandras, C.M.; Nastos, P.T.; Repapis, C.C. Air Temperature Variability and Trends over Greece. Glob. Nest J. 2008, 10, 273–285. [Google Scholar] [CrossRef]
- Tsiotas, G.; Mamara, A.; Argiriou, A.; Tsoukala, A. (Katerina) Testing Mean Air Temperature Trends in Southern Greece: A Bayesian Approach. Int. J. Climatol. 2022, 42, 4989–5015. [Google Scholar] [CrossRef]
- Stefanidis, K.; Varlas, G.; Papadopoulos, A.; Dimitriou, E. Four Decades of Surface Temperature, Precipitation, and Wind Speed Trends over Lakes of Greece. Sustainability 2021, 13, 9908. [Google Scholar] [CrossRef]
- Kaldellis, J.K.; Kondili, E.M. The Water Shortage Problem in the Aegean Archipelago Islands: Cost-Effective Desalination Prospects. Desalination 2007, 216, 123–138. [Google Scholar] [CrossRef]
- Nastos, P.T.; Evelpidou, N.; Vassilopoulos, A. Does Climatic Change in Precipitation Drive Erosion in Naxos Island, Greece? Nat. Hazards Earth Syst. Sci. 2010, 10, 379–382. [Google Scholar] [CrossRef]
- Baltas, E.A. Climatic Conditions and Availability of Water Resources in Greece. Int. J. Water Resour. Dev. 2008, 24, 635–649. [Google Scholar] [CrossRef]
- Baltas, E.; Mimikou, M.; Fragiskou, A. Hydrological Balance and Application of the MedWater Model on Naxos Island. Water Int. 2012, 37, 32–42. [Google Scholar] [CrossRef]
- Deyà Tortella, B.; Tirado, D. Hotel Water Consumption at a Seasonal Mass Tourist Destination. The Case of the Island of Mallorca. J. Environ. Manag. 2011, 92, 2568–2579. [Google Scholar] [CrossRef]
- EEA European Environment Agency. European Environment Agency; European Environment Agency: Copenhagen, Denmark, 2012. [Google Scholar]
- Myronidis, D. Hydrology and Hydraulics (in Greek); Tziolas Publications: Thessaloniki, Greek, 2011; ISBN 978-960-418-884-0. [Google Scholar]
- Lagouvardos, K.; Kotroni, V.; Bezes, A.; Koletsis, I.; Kopania, T.; Lykoudis, S.; Mazarakis, N.; Papagiannaki, K.; Vougioukas, S. The Automatic Weather Stations NOANN Network of the National Observatory of Athens: Operation and Database. Geosci. Data J. 2017, 4, 4–16. [Google Scholar] [CrossRef]
- Mann, H.B. Nonparametric Tests against Trend. Econometrica 1945, 13, 245–259. [Google Scholar] [CrossRef]
- Kendall, M.G. Rank Correlation Methods; Griffin: Oxford, UK, 1948. [Google Scholar]
- Sneyers, R. On the Statistical Analysis of Series of Observations; World Meteorological Organization: Geneva, Switzerland, 1991. [Google Scholar]
- Goossens, C.R.; Berger, A.L. Annual and Seasonal Climatic Variations over the Northern Hemisphere and Europe during the Last Century. Ann. Geophys. 1986, 4, 385–400. [Google Scholar]
- Abeysingha, N.S.; Singh, M.; Sehgal, V.K.; Khanna, M.; Pathak, H. Analysis of Trends in Streamflow and Its Linkages with Rainfall and Anthropogenic Factors in Gomti River Basin of North India. Theor. Appl. Climatol. 2016, 123, 785–799. [Google Scholar] [CrossRef]
- Akre, R.S.; Nagrale, G.S. A Study of Drought Situation in El-Niño Years over Central India Homogeneous Region. Mausam 2012, 63, 162–164. [Google Scholar] [CrossRef]
- Chatterjee, S.; Khan, A.; Akbari, H.; Wang, Y. Monotonic Trends in Spatio-Temporal Distribution and Concentration of Monsoon Precipitation (1901–2002), West Bengal, India. Atmos. Res. 2016, 182, 54–75. [Google Scholar] [CrossRef]
- Chandniha, S.K.; Meshram, S.G.; Adamowski, J.F.; Meshram, C. Trend Analysis of Precipitation in Jharkhand State, India. Theor. Appl. Climatol. 2017, 130, 261–274. [Google Scholar] [CrossRef]
- Livada, I.; Asimakopoulos, D. Individual Seasonality Index of Rainfall Regimes in Greece. Clim. Res. 2005, 28, 155–161. [Google Scholar] [CrossRef]
- Kundu, S.; Khare, D.; Mondal, A.; Mishra, P.K. Analysis of Spatial and Temporal Variation in Rainfall Trend of Madhya Pradesh, India (1901–2011). Environ. Earth Sci. 2015, 73, 8197–8216. [Google Scholar] [CrossRef]
- Mallya, G.; Mishra, V.; Niyogi, D.; Tripathi, S.; Govindaraju, R.S. Trends and Variability of Droughts over the Indian Monsoon Region. Weather. Clim. Extrem. 2016, 12, 43–68. [Google Scholar] [CrossRef]
- Myronidis, D.; Stathis, D.; Ioannou, K.; Fotakis, D. An Integration of Statistics Temporal Methods to Track the Effect of Drought in a Shallow Mediterranean Lake. Water Resour. Manag. 2012, 26, 4587–4605. [Google Scholar] [CrossRef]
- Caloiero, T.; Veltri, S.; Caloiero, P.; Frustaci, F. Drought Analysis in Europe and in the Mediterranean Basin Using the Standardized Precipitation Index. Water 2018, 10, 1043. [Google Scholar] [CrossRef]
- Hayes, M.J. Drought Indices. In Van Nostrand’s Scientific Encyclopedia; John Wiley & Sons, Inc.: Hoboken, NJ, USA, 2006. [Google Scholar]
- Hayes, M.J. Revising the SPI: Clarifying the Process. Drought Netw. News. Digit. Commons Univ. Neb. Linc. 2000, 12, 13–14. [Google Scholar]
- Maheras, P.; Patrikas, I.; Karacostas, T.; Anagnostopoulou, C. Automatic Classification of Circulation Types in Greece: Methodology, Description, Frequency, Variability and Trend Analysis. Theor. Appl. Climatol. 2000, 67, 205–223. [Google Scholar] [CrossRef]
- Tsakiris, G.; Pangalou, D. Drought Characterisation in the Mediterranean. In Coping with Drought Risk in Agriculture and Water Supply Systems; Springer: Dordrecht, The Netherlands, 2009; pp. 69–80. [Google Scholar]
- Vangelis, H.; Tigkas, D.; Tsakiris, G. The Effect of PET Method on Reconnaissance Drought Index (RDI) Calculation. J. Arid Environ. 2013, 88, 130–140. [Google Scholar] [CrossRef]
- McKee, T.B.; Doeskin, N.J.; Kleist, J. The Relationship of Drought Frequency and Duration to Time Scales. In Proceedings of the Eighth Conference on Applied Climatology, Anaheim, CA, USA, 17–22 January 1993; American Meteorological Society: Anaheim, CA, USA, 1993; pp. 179–184. [Google Scholar]
- Aalijahan, M.; Karataş, A.; Lupo, A.R.; Efe, B.; Khosravichenar, A. Analyzing and Modeling the Spatial-Temporal Changes and the Impact of GLOTI Index on Precipitation in the Marmara Region of Türkiye. Atmosphere 2023, 14, 489. [Google Scholar] [CrossRef]
- Mersin, D.; Tayfur, G.; Vaheddoost, B.; Safari, M.J.S. Historical Trends Associated with Annual Temperature and Precipitation in Aegean Turkey, Where Are We Heading? Sustainability 2022, 14, 13380. [Google Scholar] [CrossRef]
- Todaro, V.; D’Oria, M.; Secci, D.; Zanini, A.; Tanda, M.G. Climate Change over the Mediterranean Region: Local Temperature and Precipitation Variations at Five Pilot Sites. Water 2022, 14, 2499. [Google Scholar] [CrossRef]
- Philandras, C.M.; Nastos, P.T.; Kapsomenakis, J.; Douvis, K.C.; Tselioudis, G.; Zerefos, C.S. Long Term Precipitation Trends and Variability within the Mediterranean Region. Nat. Hazards Earth Syst. Sci. 2011, 11, 3235–3250. [Google Scholar] [CrossRef]
- Feidas, H. Trend Analysis of Air Temperature Time Series in Greece and Their Relationship with Circulation Using Surface and Satellite Data: Recent Trends and an Update to 2013. Theor. Appl. Climatol. 2017, 129, 1383–1406. [Google Scholar] [CrossRef]
- Mamara, A.; Argiriou, A.A.; Anadranistakis, M. Recent Trend Analysis of Mean Air Temperature in Greece Based on Homogenized Data. Theor. Appl. Climatol. 2016, 126, 543–573. [Google Scholar] [CrossRef]
- Copernicus, European Drought Observatory (E.D.O.). Standardized Precipitation Index (SPI); EDO Indicator Factsheet; European Commission: Ispra, Italy, 2020. [Google Scholar]
- Tsiros, I.X.; Nastos, P.; Proutsos, N.D.; Tsaousidis, A. Variability of the Aridity Index and Related Drought Parameters in Greece Using Climatological Data over the Last Century (1900–1997). Atmos. Res. 2020, 240, 104914. [Google Scholar] [CrossRef]
- Topuz, M.; Feidas, H.; Karabulut, M. Trend Analysis of Precipitation Data in Turkey and Relations to Atmospheric Circulation: (1955–2013). Ital. J. Agrometeorol. 2020, 2, 91–107. [Google Scholar] [CrossRef]
- Kadiolu, M. Regional Variability of Seasonal Precipitation over Turkey. Int. J. Climatol. 2000, 20, 1743–1760. [Google Scholar] [CrossRef]
- Ben Abdelmalek, M.; Nouiri, I. Study of Trends and Mapping of Drought Events in Tunisia and Their Impacts on Agricultural Production. Sci. Total Environ. 2020, 734, 139311. [Google Scholar] [CrossRef]
- Intergovernmental Panel on Climate Change (IPCC) The Physical Science Basis. Contribution of Working Group I to the Fifth Assessment Report of the Intergovernmental Panel on Climate Change; Stocker, T.F., Qin, D., Plattner, G.-K., Tignor, M., Allen, S., Boschung, J., Nauels, A., Xia, Y., Bex, V., Midgley, P., Eds.; IPCC: UK Cambridge University Press: Cambridge, UK; New York, NY, USA, 2013. [Google Scholar]
- Driouech, F.; ElRhaz, K.; Moufouma-Okia, W.; Arjdal, K.; Balhane, S. Assessing Future Changes of Climate Extreme Events in the CORDEX-MENA Region Using Regional Climate Model ALADIN-Climate. Earth Syst. Environ. 2020, 4, 477–492. [Google Scholar] [CrossRef]
- Dubrovský, M.; Hayes, M.; Duce, P.; Trnka, M.; Svoboda, M.; Zara, P. Multi-GCM Projections of Future Drought and Climate Variability Indicators for the Mediterranean Region. Reg. Env. Chang. 2014, 14, 1907–1919. [Google Scholar] [CrossRef]
- Asadi Zarch, M.A.; Sivakumar, B.; Malekinezhad, H.; Sharma, A. Future Aridity under Conditions of Global Climate Change. J. Hydrol. 2017, 554, 451–469. [Google Scholar] [CrossRef]
- Waha, K.; Krummenauer, L.; Adams, S.; Aich, V.; Baarsch, F.; Coumou, D.; Fader, M.; Hoff, H.; Jobbins, G.; Marcus, R.; et al. Climate Change Impacts in the Middle East and Northern Africa (MENA) Region and Their Implications for Vulnerable Population Groups. Reg. Environ. Chang. 2017, 17, 1623–1638. [Google Scholar] [CrossRef]
- García-Ruiz, J.M.; López-Moreno, J.I.; Vicente-Serrano, S.M.; Lasanta–Martínez, T.; Beguería, S. Mediterranean Water Resources in a Global Change Scenario. Earth Sci. Rev. 2011, 105, 121–139. [Google Scholar] [CrossRef]
Figure 1.
(A) The location of the three islands (Mykonos, Naxos, and Kos); (B) the positions of the meteorological stations used in the present study.
Figure 1.
(A) The location of the three islands (Mykonos, Naxos, and Kos); (B) the positions of the meteorological stations used in the present study.

Figure 2.
Annual rainfall trends of the Naxos (red solid and dotted lines) and Kos (blue solid and dotted lines) meteorological stations for the period of 1961–2019.
Figure 2.
Annual rainfall trends of the Naxos (red solid and dotted lines) and Kos (blue solid and dotted lines) meteorological stations for the period of 1961–2019.

Figure 3.
Annual rainfall trends of the research meteorological stations during 1989–2019. Mykonos (black solid and dotted lines), Naxos (red solid and dotted lines), and Kos (blue solid and dotted lines).
Figure 3.
Annual rainfall trends of the research meteorological stations during 1989–2019. Mykonos (black solid and dotted lines), Naxos (red solid and dotted lines), and Kos (blue solid and dotted lines).

Figure 4.
Graphical representation of the Mann–Kendall trend test of the annual rainfall time series (Naxos above; Kos below) for the period of 1961–2019.
Figure 4.
Graphical representation of the Mann–Kendall trend test of the annual rainfall time series (Naxos above; Kos below) for the period of 1961–2019.

Figure 5.
Graphical representation of the Mann–Kendall trend test of the annual rainfall time series for the common period of 1989–2019 concerning the Mykonos, Naxos, and Kos MSs.
Figure 5.
Graphical representation of the Mann–Kendall trend test of the annual rainfall time series for the common period of 1989–2019 concerning the Mykonos, Naxos, and Kos MSs.


Figure 6.
Annual temperature trends of Naxos and Kos stations for the period 1961–2019.

Figure 7.
Annual temperature trends of research stations for the common observation period of 1989–2019.
Figure 7.
Annual temperature trends of research stations for the common observation period of 1989–2019.

Figure 8.
Graphical representation of the Mann–Kendall trend test of the temperature time series (Naxos above; Kos below) for the period of 1961–2019.
Figure 8.
Graphical representation of the Mann–Kendall trend test of the temperature time series (Naxos above; Kos below) for the period of 1961–2019.

Figure 9.
Graphical representation of the Mann–Kendall trend test of the temperature time series for the period 1989–2019 for Mykonos, Naxos, and Kos.
Figure 9.
Graphical representation of the Mann–Kendall trend test of the temperature time series for the period 1989–2019 for Mykonos, Naxos, and Kos.


Figure 10.
Bagnouls and Gaussen ombro-thermal diagram. Distribution of monthly precipitation and temperature in Mykonos island. Red dotted lines indicate the dry-thermal period and blue vertical lines indicate the wet period.
Figure 10.
Bagnouls and Gaussen ombro-thermal diagram. Distribution of monthly precipitation and temperature in Mykonos island. Red dotted lines indicate the dry-thermal period and blue vertical lines indicate the wet period.

Figure 11.
Bagnouls and Gaussen ombro-thermal diagrams. Distribution of monthly precipitation and temperature in Naxos island. Red dotted lines indicate the dry-thermal period and blue vertical lines indicate the wet period.
Figure 11.
Bagnouls and Gaussen ombro-thermal diagrams. Distribution of monthly precipitation and temperature in Naxos island. Red dotted lines indicate the dry-thermal period and blue vertical lines indicate the wet period.

Figure 12.
Bagnouls and Gaussen ombro-thermal diagram. Distribution of monthly precipitation and temperature in Kos island. Red dotted lines indicate the dry-thermal period and blue vertical lines indicate the wet period.
Figure 12.
Bagnouls and Gaussen ombro-thermal diagram. Distribution of monthly precipitation and temperature in Kos island. Red dotted lines indicate the dry-thermal period and blue vertical lines indicate the wet period.

Figure 13.
Intertemporal variation in the drought index SPI12 in the research area.


Table 1.
Meteorological stations (MSs) in the research area.
| Meteorological Station | Coordinates | Operating Services | Altitude | Period | |
|---|---|---|---|---|---|
| X | Y | ||||
| Mykonos | 25.3458° | 37.4359° | HNMS | 122 | 1989–2019 |
| Naxos | 25.3728° | 37.1013° | HNMS | 11 | 1955–2019 |
| Kos (airport) | 27.0913° | 36.8012° | HNMS | 126 | 1961–2019 |
| Mykonos | 25.3260° | 37.4450° | NOA | 10 | 2012–2019 |
| Naxos | 25.3738° | 37.1014° | NOA | 19 | 2011–2019 |
| Kos | 27.3404° | 36.8772° | NOA | 37 | 2014–2019 |
| Apiranthos | 25.5200° | 37.0712° | NOA | 600 | 2012–2019 |
| Apollonas | 25.5549° | 37.1811° | NOA | 35 | 2012–2019 |
| Damarion | 25.4780° | 37.0510° | NOA | 310 | 2012–2019 |
| Koronas | 25.5355° | 37.1187° | NOA | 540 | 2012–2019 |
| Kynidaros | 25.4770° | 37.0990° | NOA | 410 | 2012–2019 |
| Melanes | 25.4379° | 37.0901° | NOA | 160 | 2012–2019 |
| Small Vigla | 25.3730° | 37.0240° | NOA | 12 | 2012–2019 |
Table 2.
Classification of the wet and dry periods according to the SPI index.
| Values of SPI Index | Characterization of Episodes |
|---|---|
| >2.0 | Extremely wet period |
| 1.5–1.99 | Very wet period |
| 1.0–1.49 | Wet period |
| −0.99–0.99 | Regular rainfall |
| −1.0–(−1.49) | Drought |
| −1.5–(−1.99) | Significant drought |
| <−2.0 | Extreme drought |
Table 3.
Linear trends of the annual rainfall in the research meteorological stations.
| Meteorological Stations | Altitude (m) | Trend Equation (R2) | Change in Annual Rainfall Height (mm/10 years) |
|---|---|---|---|
| Period 1961–2019 | |||
| Naxos | 11 | Y = 383.42 − 0.513·X (0.007) | −5.1 |
| Kos | 126 | Y = 819.28 − 5.886·X (0.2) | −58.8 |
| Period 1989–2019 | |||
| Mykonos | 122 | Y = 380.96 + 0.596·X (0.003) | +5.9 |
| Naxos | 11 | y = 330.76 + 1.212·Χ (0.011) | +12.1 |
| Kos | 126 | Y = 501.86 + 2.458·X (0.013) | +24.6 |
Table 4.
Linear trends of mean annual temperature values of research stations.
| Meteorological Station | Altitude (m) | Trend Equation (R2) | Change in Annual Air Temperature (°C/10 years) |
|---|---|---|---|
| Period of 1961–2019 | |||
| Naxos | 11 | Y = 17.792 + 0.021·X (0.42) | +0.21 |
| Kos | 126 | Y = 18.132 + 0.0082·X (0.065) | +0.08 |
| Period of 1989–2019 | |||
| Mykonos | 122 | Y = 16.849 + 0.0622·X (0.63) | +0.62 |
| Naxos | 11 | Y = 18.105 + 0.0372·X (0.47) | +0.37 |
| Κως | 126 | Y = 17.923 + 0.0370·X (0.37) | +0.37 |
Table 5.
Most significant drought episodes in the research area. The extreme drought episodes (SPI ≤ −2) are indicated with bold font.
Table 5.
Most significant drought episodes in the research area. The extreme drought episodes (SPI ≤ −2) are indicated with bold font.
| MYKONOS | NAXOS | KOS |
|---|---|---|
| March 90–May 90 (3 months) 2 months (March, April) | June 89–June 90 (13 months) 9 months (September–May) | June 89–June 90 (13 months) 2 months (April, May) |
| April 99–March 01 (21 months) 1 month (March) | June 99–June 00 (8 months) | Sept 99–April 00 (8 months) |
| June 06–March 07 (10 months) | April 07-May 07 (2 months) | Aug 05–April 07 (22 months) |
| Aug 15–March 16 (10 months) | Aug 15–July 18 (36 months) | July 15–June 16 (12 months) |
| Aug 17–May 18 (10 months) | Sept 17–June 18 (10 months) |
Disclaimer/Publisher’s Note: The statements, opinions and data contained in all publications are solely those of the individual author(s) and contributor(s) and not of MDPI and/or the editor(s). MDPI and/or the editor(s) disclaim responsibility for any injury to people or property resulting from any ideas, methods, instructions or products referred to in the content. |
© 2023 by the authors. Licensee MDPI, Basel, Switzerland. This article is an open access article distributed under the terms and conditions of the Creative Commons Attribution (CC BY) license (https://creativecommons.org/licenses/by/4.0/).
Share and Cite
MDPI and ACS Style
Stathi, E.; Kastridis, A.; Myronidis, D. Analysis of Hydrometeorological Trends and Drought Severity in Water-Demanding Mediterranean Islands under Climate Change Conditions. Climate 2023, 11, 106. https://doi.org/10.3390/cli11050106
AMA Style
Stathi E, Kastridis A, Myronidis D. Analysis of Hydrometeorological Trends and Drought Severity in Water-Demanding Mediterranean Islands under Climate Change Conditions. Climate. 2023; 11(5):106. https://doi.org/10.3390/cli11050106
Chicago/Turabian StyleStathi, Efthymia, Aristeidis Kastridis, and Dimitrios Myronidis. 2023. "Analysis of Hydrometeorological Trends and Drought Severity in Water-Demanding Mediterranean Islands under Climate Change Conditions" Climate 11, no. 5: 106. https://doi.org/10.3390/cli11050106
Note that from the first issue of 2016, this journal uses article numbers instead of page numbers. See further details here.