Article

Wind Characteristics and Temporal Trends in Eastern Paraná State, Brazil

by
Paulo Miguel de Bodas Terassi
1,*,
Washington Luiz Félix Correia Filho
2,
Emerson Galvani
1,
Antonio Carlos da Silva Oscar-Júnior
3,
Bruno Serafini Sobral
4,
Givanildo de Gois
5,
Vitor Hugo Rosa Biffi
6 and
José Francisco de Oliveira Júnior
7
1
Department of Geography, University of São Paulo, São Paulo 05508-000, Brazil
2
Institute of Mathematics, Statistics and Physics (IMEF), Federal University of Rio Grande (FURG), Rio Grande 96203-900, Brazil
3
Department of Geography, Rio de Janeiro State University, Rio de Janeiro 20550-900, Brazil
4
Land and Cartography Institute of Rio de Janeiro (ITERJ), State Secretary of Cities (SECID-RJ), Rio de Janeiro 20060-060, Brazil
5
Postgraduate Program in Environmental Science, Federal University of Acre, Rio Branco 69920-900, Brazil
6
Postgraduate Program in Geography, State University of Maringá, Maringá 87020-900, Brazil
7
Institute of Atmospheric Sciences, Alagoas Federal University, Maceió 57072-260, Brazil
*
Author to whom correspondence should be addressed.
Climate 2023, 11(3), 69; https://doi.org/10.3390/cli11030069
Submission received: 6 February 2023 / Revised: 10 March 2023 / Accepted: 12 March 2023 / Published: 15 March 2023
(This article belongs to the Special Issue Climatic Variability and Extreme Events in Urban-Natural Spaces)

Abstract

:
The wind is one of the most important and studied variables globally, essential to several sectors, for example, energy. Therefore, this study assesses the wind regime and analysis trends in three locations within the Paraná state, Brazil. The historical series were recorded between 1976 and 2010 at conventional meteorological stations belonging to the Brazilian National Institute of Meteorology. WRPLOT version 8.0.0 software was used for elaborating wind roses and histograms in the annual and seasonal scales. Detection of trends and temporal rupture points was performed using different statistical methods (Run, Mann–Kendall, Pettitt and Shapiro–Wilk tests) for all meteorological stations. All statistical tests were conducted using the R software version 3.3.2. On a seasonal scale, summer and spring present the highest wind speeds in the Curitiba and Paranaguá stations due to meteorological systems on different scales, such as the South Atlantic subtropical anticyclone and frontal systems. The Mann–Kendall test revealed that Castro presented statistical significance in reducing wind speed, with a decrease of 0.23 m/s per decade for the annual scale and 0.23 m/s per decade during the autumn season. These ruptures indicated a decrease in wind speed in Curitiba and Paranaguá for the spring season. The Pettitt test revealed a break point detection in the data series in Curitiba station, likely due to urban expansion that started in the 1980s, reducing wind speed, especially in winter and spring. These trends and ruptures revealed a significant reduction in wind speed, possibly due to the interaction between natural climate changes and the increase in surface roughness resulting from land use and urbanization changes.

1. Introduction

The wind is a meteorological variable that has two main attributes—direction and speed—and is fundamental in several strategic sectors, such as wind erosion [1,2], renewable energy production [3,4,5,6,7], and sanitation [8,9,10]. The knowledge of wind patterns makes it possible to identify areas of propagation of pests, forest fires, pollination, and windbreak practices [3,8,11].
In urban areas, it is worth mentioning that information on wind direction and speed enable the correct installation of industries in sectors with greater potential for dispersing pollutants in the atmosphere and, thus, avoid negatively affecting air quality [9,11]. Several factors influence the wind (speed and direction), such as aerodynamic roughness (z0), topography (altitude), vegetation, latitude, solar radiation, shoreline proximity, and continental characteristics [3,12]. In addition, there is the influence of the following meteorological systems on different scales: (a) synoptic, such as frontal systems (FS), the South Atlantic convergence zone (SACZ), and the South Atlantic subtropical anticyclone (SASA) [13,14]; (b) mesoscale, such as breeze circulations [15,16], and (c) local, by convection [15,17,18,19,20]
Most studies addressing wind characteristics in Brazil use short time series (5–10 years), as seen in reference [3] for Ituverava (São Paulo state), [13,21,22,23] for Rio de Janeiro state, and [9] for Southeast Brazil. This limitation of data in the time series is related to the absence of data motivated by data recording problems (delay in maintenance and calibration of the automatic anemometric stations). Using historical data series allows us to investigate variability and trend patterns of meteorological elements in a given study region [1,24].
Several methods are used for the detection of these patterns, such as multivariate analysis [9], quantile regression [14], and trend analysis based on the Mann–Kendall and Pettitt tests [25,26,27,28,29]. This study will use the statistical trend tests based on the Mann–Kendall (MK) and Pettitt methods. The detection and quantification of temporal trends in wind speeds within historical and contemporary climates support the evaluation of models used to estimate possible future wind speed regimes under global climate change scenarios [4,30].
The study region is the eastern (E) area of Paraná state, Brazil. It consists of a complex region if analyzed by its climatological aspects, mainly due to the influence of meteorological systems on several scales [31,32,33]. In addition to these factors, the Atlantic Ocean and the orography of the Serra do Mar and Escarpa Devoniana ridges are essential for interacting with local meteorological elements [34,35]. In order to fill this gap, this study aims to characterize the wind regime (speed and direction) of the Eastern region of Paraná state (Brazil), identifying the possible annual and seasonal trends based on a 35-year-long historical series of data.

2. Materials and Methods
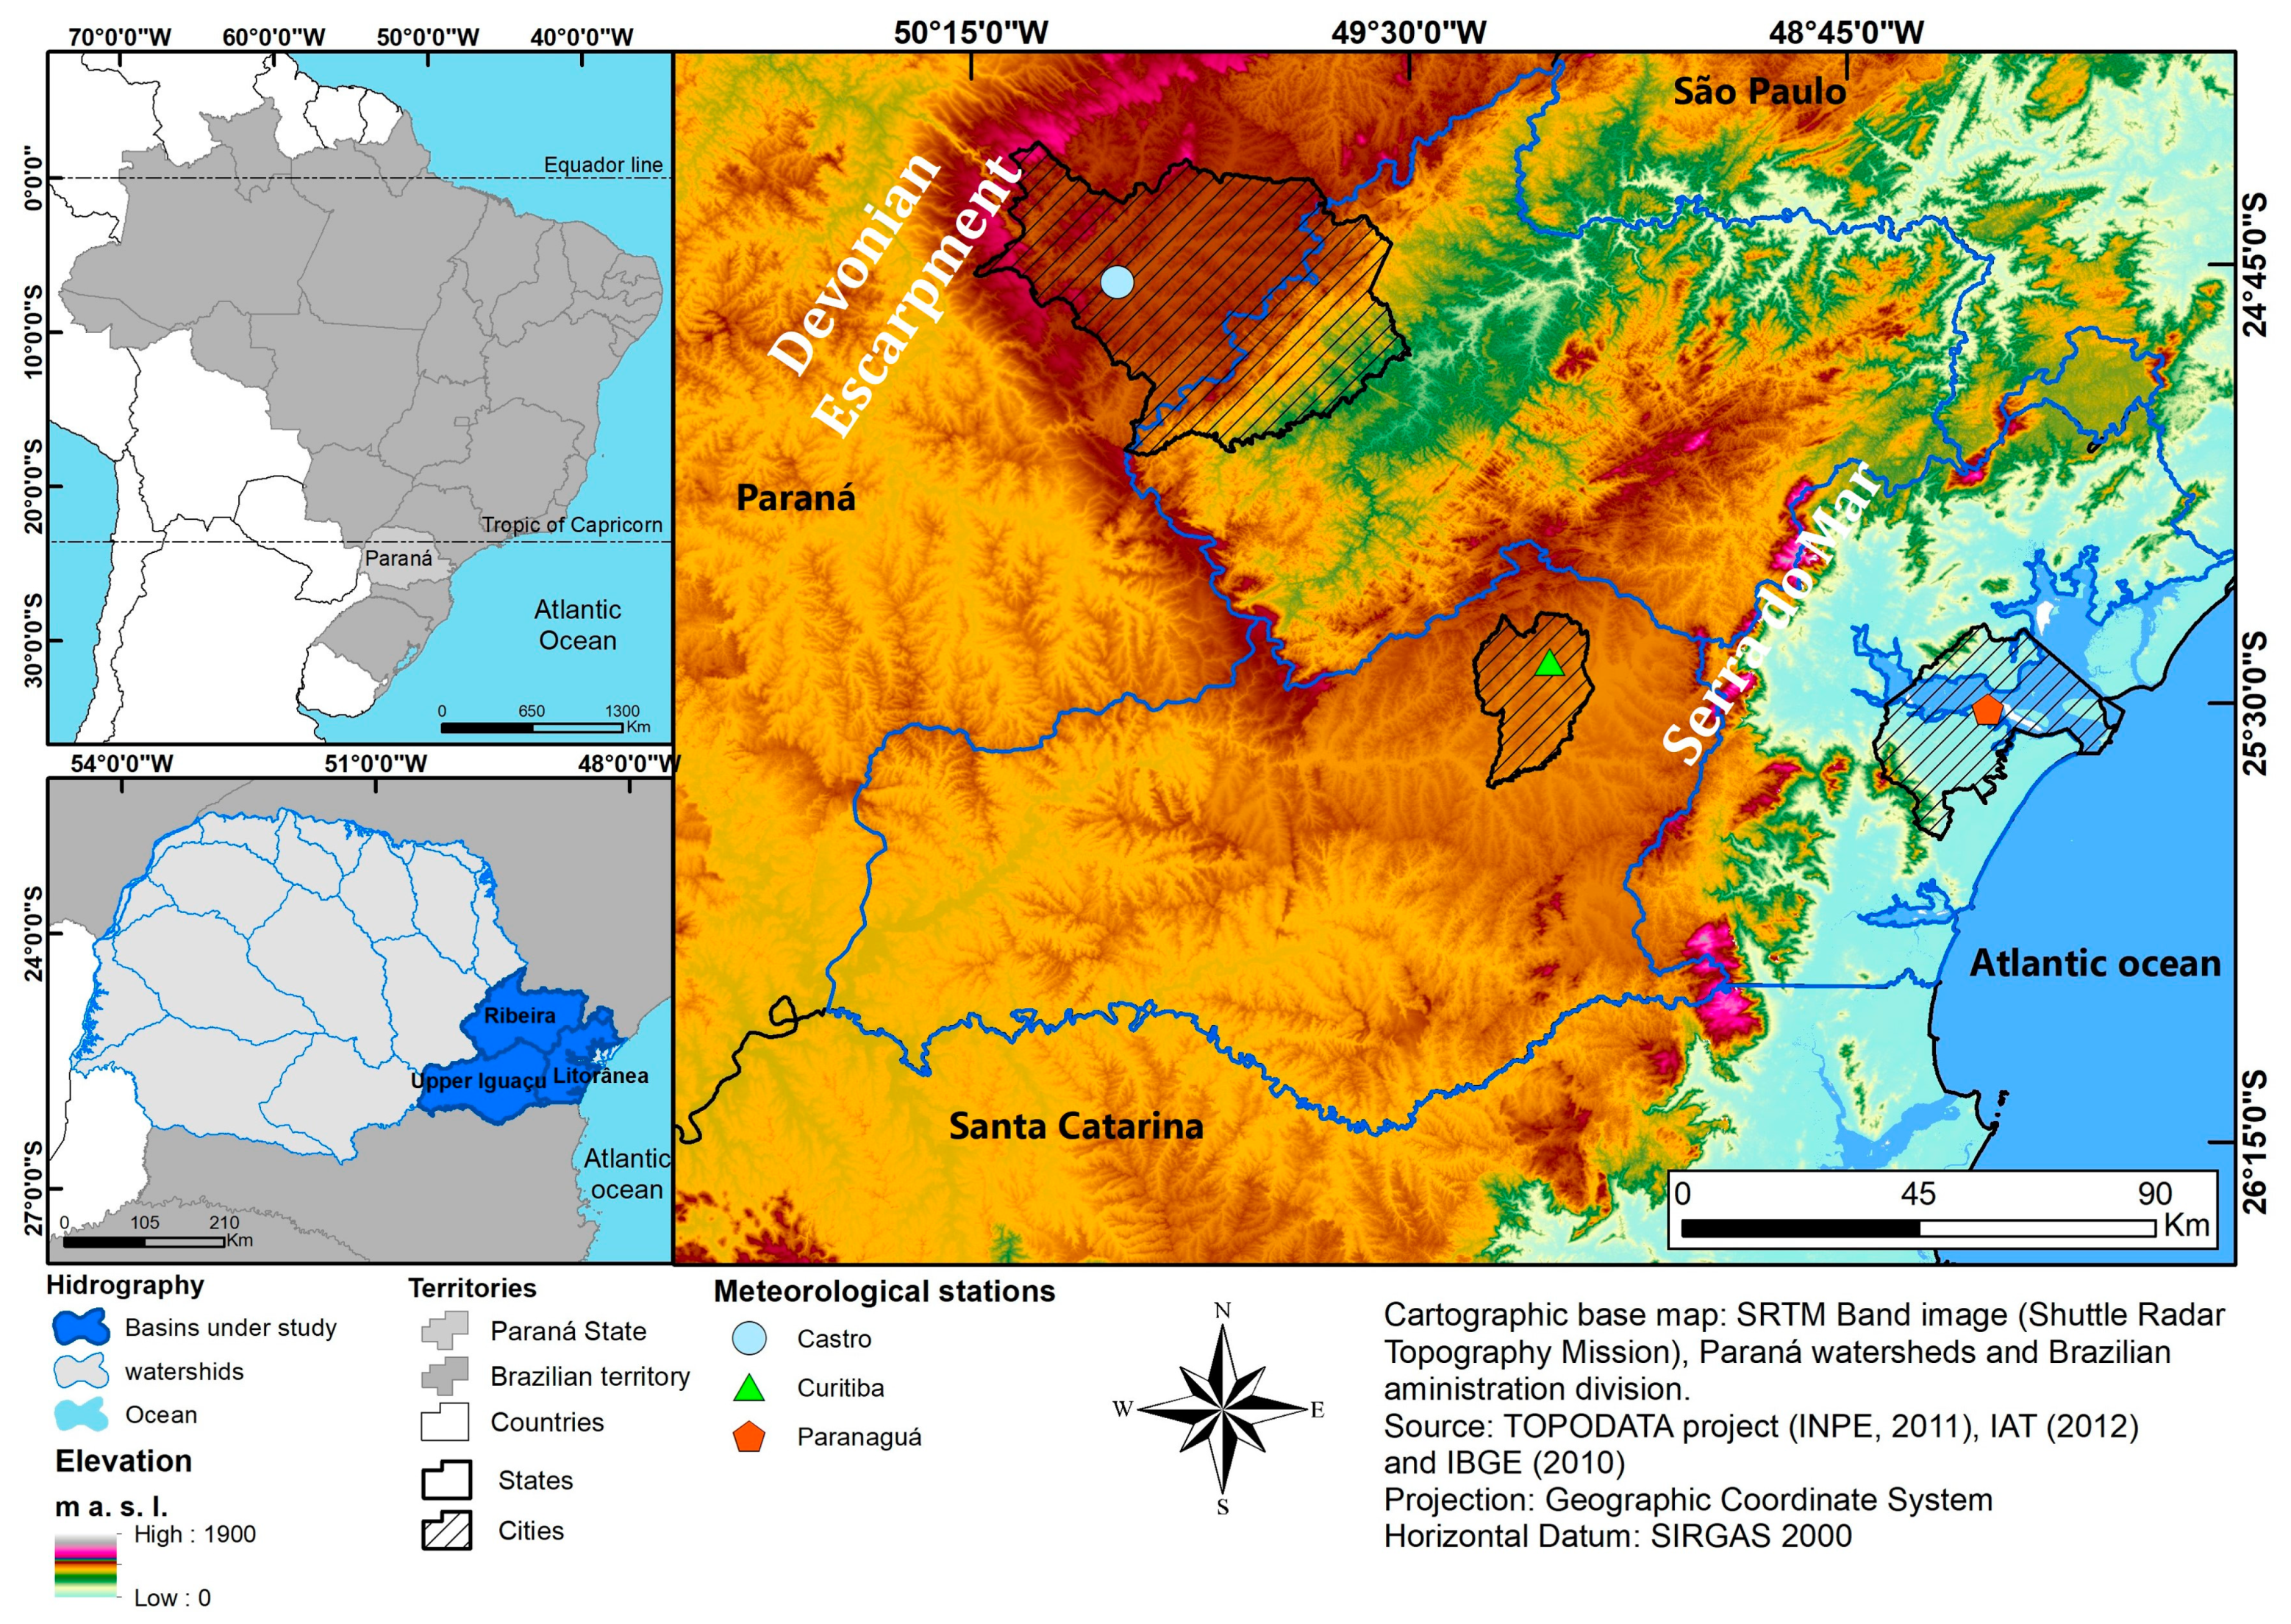
2.1. Study Area

The Castro, Curitiba, and Paranaguá cities are in the East sector of Paraná state, as shown in Figure 1. The city of Paranaguá differs from the other two municipalities for its location in the Coastal Plains region of the state. The average distance between the Atlantic Ocean and Curitiba in a straight line is approximately 75 km, while Castro is 170 km from the coast of Paraná [36].
In the state of Paraná, Serra do Mar ridge is the most prominent geomorphological feature [37], with altitudes above 1800 m and separating the Coastal Plain (Paranaguá) from the first Plateau of Paraná (Curitiba). Around the Castro region, the Devonian Escarpment divides the first from the second Plateau of Paraná and reaches altitudes above 1000 m in some stretches.
The study area corresponds to the most densely populated and urbanized sector of Paraná. In Curitiba, the state’s capital, the estimated population is over 1.9 million inhabitants, and its Metropolitan region has an estimated population of more than 3.8 million. The municipalities of Castro and Paranaguá have 72,125 and 157,378 inhabitants [38], respectively. For example, the population of Curitiba in the 1960s was 361,309 inhabitants, while Paranaguá was home to about 62,000 inhabitants in 1970. It was during the 1970s that the state of Paraná reached a primary urbanization rate, going from 36.1% in 1970 to 58.6% in 1980 [39]. In general terms, there was a dense and robust urban growth around the cities that currently host the weather stations presented in Figure 1.
According to the Brazilian National Institute of Meteorology [40], Castro and Curitiba present an average annual rainfall of 1469.9 mm and 1507.4 mm, respectively. Both cities present the same average annual temperature of 16.8 °C. According to [41], the Köppen climate classification scheme of these cities is type “Cfb” with mild subtropical humidity [35,36]. On the other hand, [33] described that Paranaguá city is characterized by an average annual rainfall and temperature of 2130.1 mm and 21.3 °C, respectively, and the Köppen climate classification scheme is type “Cfa”, being hot, humid subtropical [31].

2.2. Wind Temporal Series and Graphical Analysis

Wind speed data (1976–2010) was collected using three conventional meteorological stations’ anemometers. The wind records (direction and speed) were recorded on the 9th, 15th, and 21st local times (LT), totaling 38,352 records (115.056 total) for each station (Table 1). The selected stations have a long time series (35 years), representing different regional atmospheric dynamics in the study region. Data fault filling was not applied to preserve the recorded data because these missing data were below 11%.
The instrument used in conventional meteorological stations is the three-cup anemometer, which records three synoptic observations throughout the day, according to the World Meteorological Organization (WMO) standards. The National Institute of Meteorology (INMET) follows the standards established by the WMO, where conventional stations with wind direction and speed data are called climatological stations. The location of the weather stations did not change during the study period; thus, there is no interference from these aspects to the trends and ruptures identified by this study.
For the creation of the wind roses and histograms, direction (°) and wind speed (m/s) were plotted using WRPLOT software version 8.0.0 [42]. These wind roses and wind class histograms were divided into two scales: climatology and seasonal.

2.3. Analysis of Meteorological Systems and Nonparametric Tests Applied

Due to the eventual missing data, the Run test was applied to the annual wind series to select years with serial correlation. After identifying these years, the interaction between the meteorological systems and the wind regime was assessed based on the Climanálise climatological bulletin [43]. The Run test is a nonparametric test that evaluates whether a time series is randomly distributed, and its application in the scientific literature is common [15,44,45]. The Run test is usually used to verify normality in weather attributes, and its results are in the form of statistics which indicate whether the data set passes or fails the randomness test [46].
The test counts the number of oscillations high (coded 1) and low (coded 0) of the median values in a naturally ordered data series. The number of oscillations is called “run”, and one must test whether the observed value is within the normal range. A high run value indicates several changes, while low values indicate a deviation from the median during the recording period. Thus, if the sequence contains N1 symbols of one type and N2 symbols of another type (N1 and N2 are not very small), the sample distribution of the total number of runs can be approximated by a normal distribution with mean described by Equation (1), and the variance of the distribution based on Equation (2):
E ( u ) = 2 N 2 N 1 N 1 N 2 + 1
V a r ( u ) = 2 N 1 N 2   ( 2 N 1 N 2 N 1 N 2 ) ( N 1 N 2 ) 2   ( 2 N 1 N 2 1 )
In these equations, u represents the number of runs. Thus, the null Hypothesis (H0) that the symbol distribution usually occurs and that the sample is random can be tested based on the statistics described in Equation (3):
Z = u E ( u ) V a r   ( u )
The calculated value is comparable to Z values for normal distribution. For example, for the significance level of 10% probability, Z lies between the range −1.69 to 1.69 (Table 2). Therefore, if the calculated Z value exceeds the tabulated value, we reject H0. The Run test calculation used the randtests package of the R software version 3.3.2 [47].
The Mann–Kendall (MK) test was applied to analyze trends in wind patterns. This test uses the hypothesis that the sequence of values occurs independently in the stability of a time series, and the probability distribution must remain the same in a simple random series [11,25,29,48].
The Pettitt test [49] was applied to identify break point detection in the time series. This nonparametric test allows the confirmation of the stationarity of a historical series, highlighting random fluctuations, where the observations are invariant regarding the chronology of their occurrences. The Mann–Kendall and Pettitt test calculation used the randtests package of the R software version 3.3.2 [25,26,27,28,29,47].

2.4. Parametric Tests of Shapiro–Wilk (SW)

The SW test was applied to the time series according to a normal probability distribution. It consists of the ratio of two distinct estimators of variance. The numerator estimator is based on a linear combination of quantities related to the normal distribution. The conventional way obtained the estimator in the denominator, and the test statistic of SW (W) is defined by Equation (4):
W = [ i = 1 k a n i + 1 ( x n i + 1 y i ) ] 2 i = 1 n ( y i y ¯ ) 2 = [ i = 1 k a i   y ( i ) ] 2 i = 1 n ( y i y ¯ )
where i = 1, 2, n, is the sample size; yi = measurement value of the sample under analysis, ordered from lowest to highest; y ¯ = the average value of the measurement; ai = coefficient generated from variances and covariates of the statistical order of a sample of size n and a normal distribution.
Using X as the analyzed variable, we formulate the hypotheses:
H0. 
The wind data of the stations present residues with a normal distribution (Gaussian);
H1. 
The wind data of the stations do not present residues with a normal distribution (Gaussian).
The conditions for the data to be distributed according to a normal distribution at probability level α (10%) are:
For W c a l W t a b reject H0 to p_value α < 0.10 (significant—S);
For W c a l W t a b accept H1 to p_value α > 0.10 (non-significant—NS).

3. Results

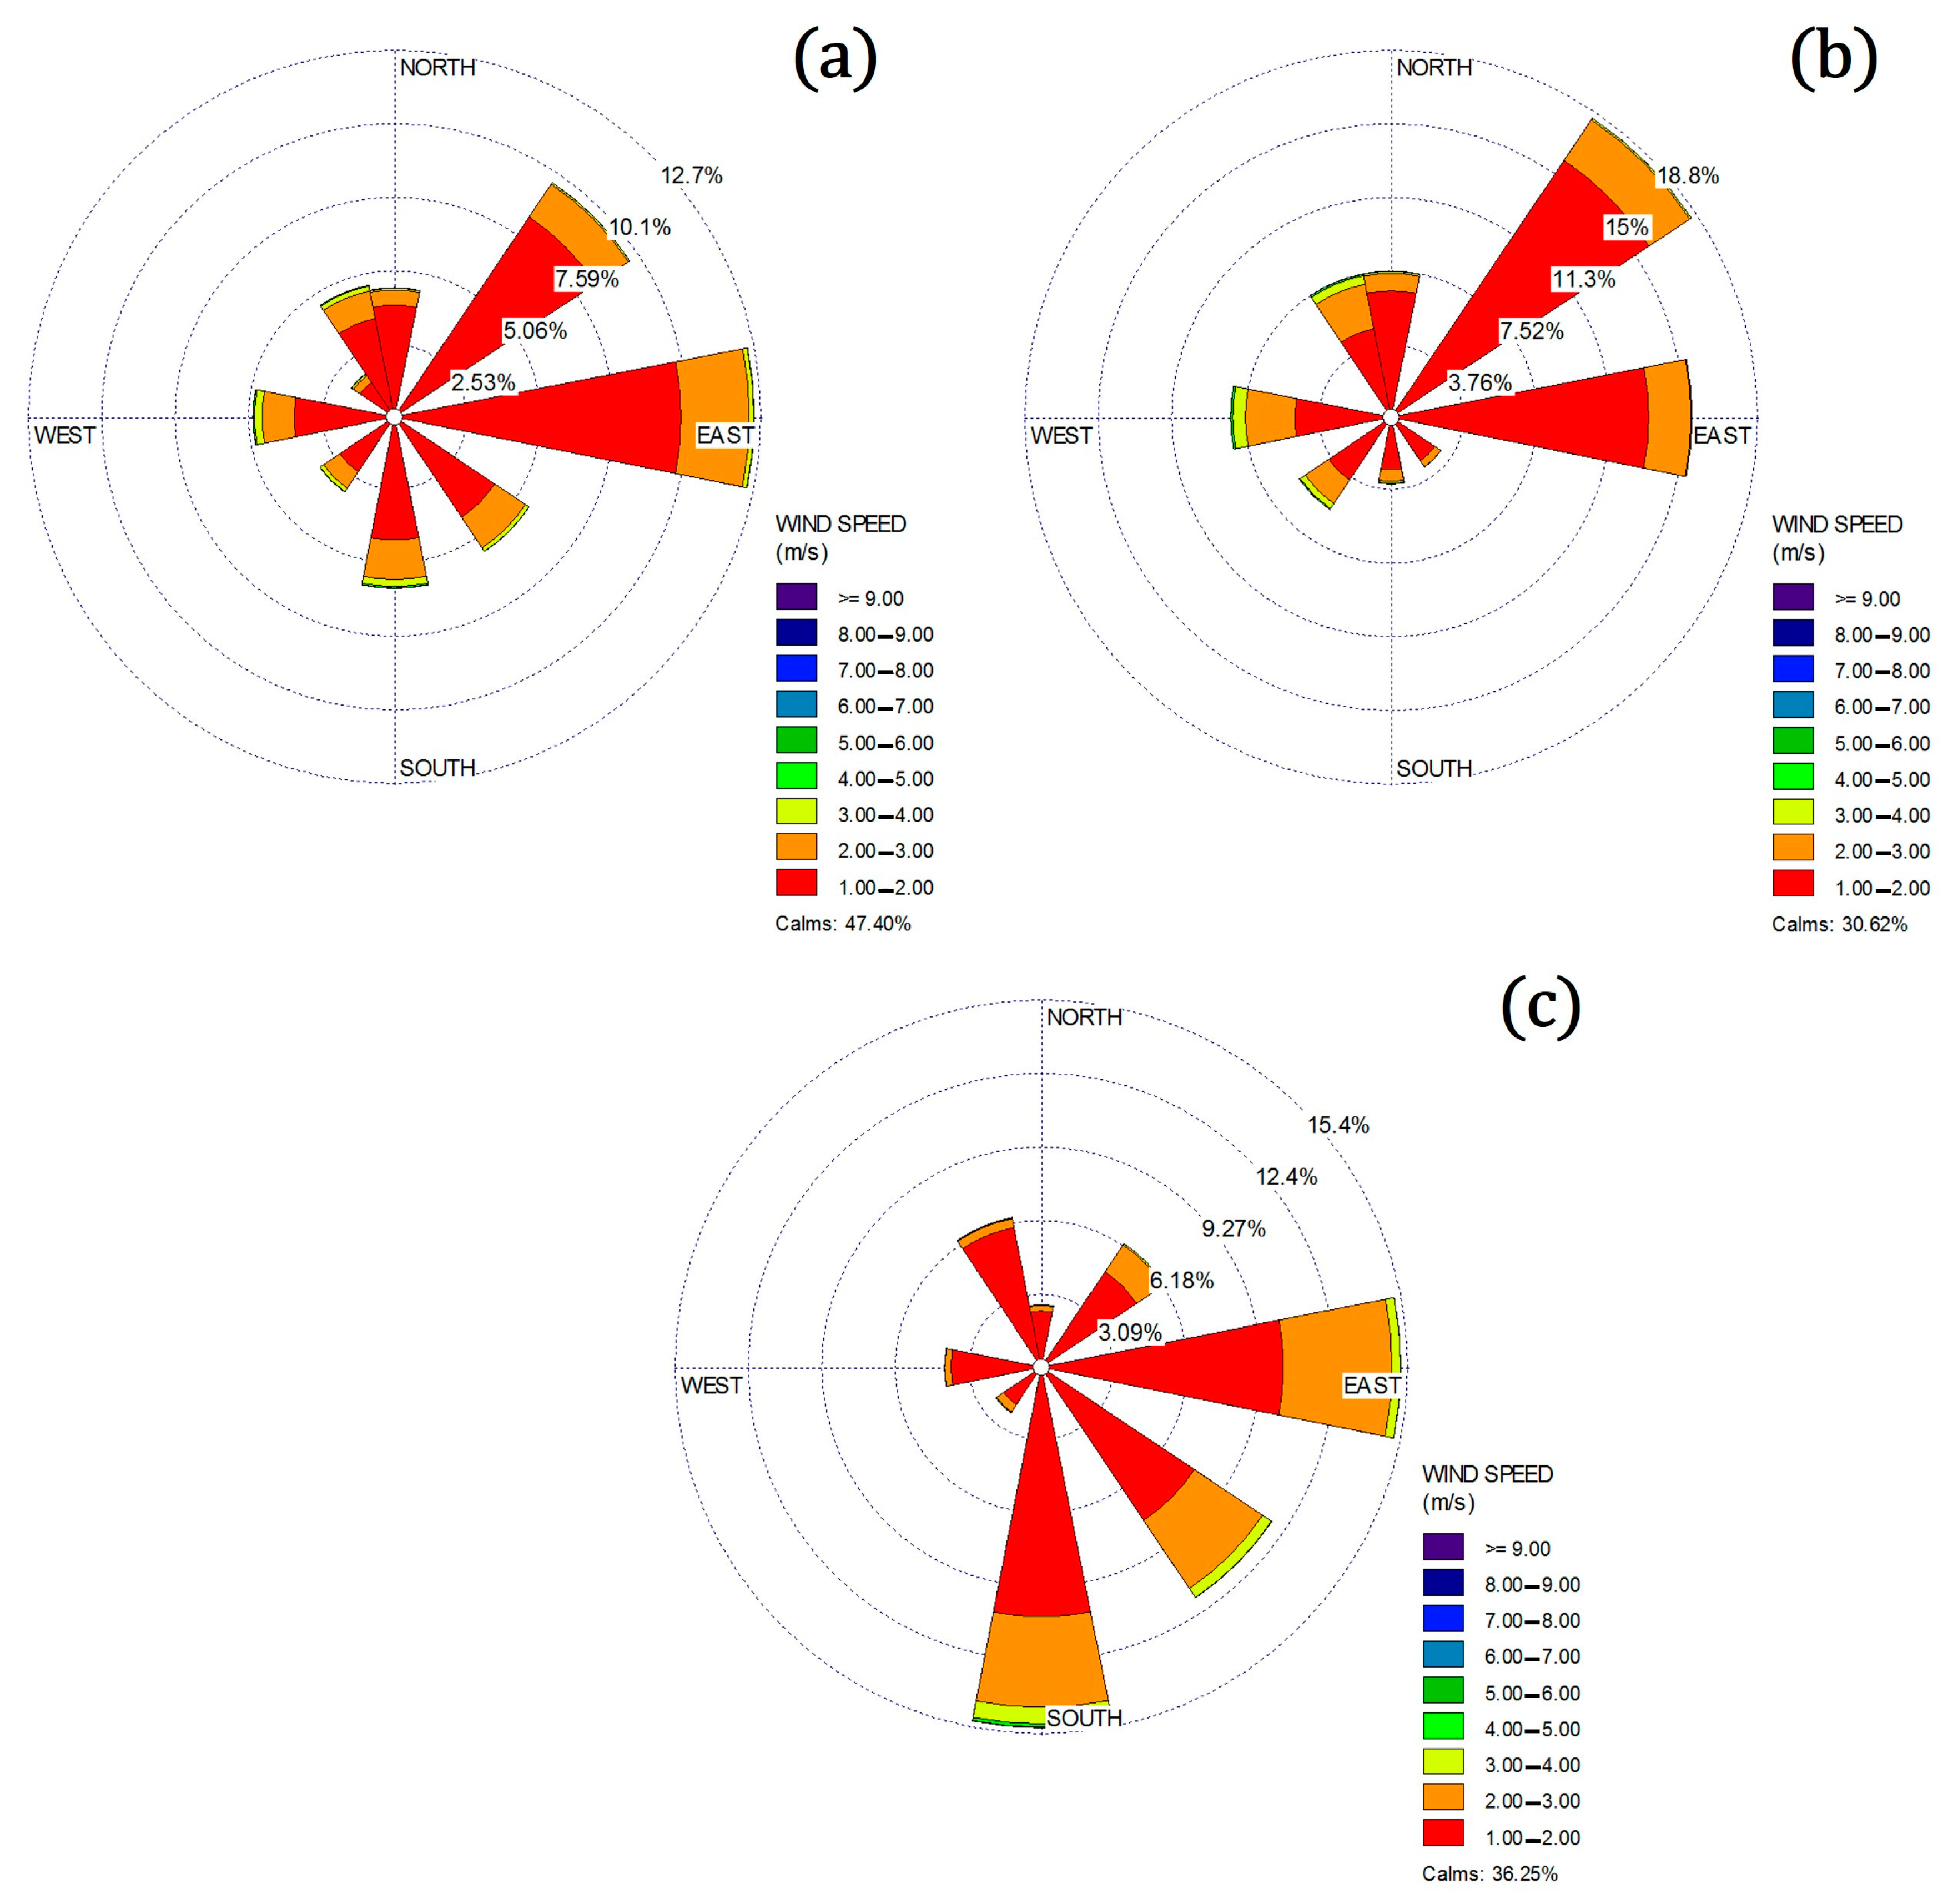
3.1. Spatio-Temporal Characterization

This topic presents the climatological wind patterns (Figure 2) for Castro, Paranaguá, and Curitiba stations, considering the period between 1976 and 2010. Analyzing the wind direction data recorded in the Castro (Figure 2a), it presents a predominance of calm winds (47.4%), while Curitiba and Paranaguá (Figure 2b,c) registered 30.6% and 32.6%, respectively. This different pattern verified in Castro occurs mainly due to topographic influence, as the city is close to the Serra Geral (>1500 m) ridge and where topography causes a lot of stagnation in the local wind regime [16,17].
The seasonal wind pattern presents a distinct behavior regarding direction and speed. The spring and summer (Figure 3) seasons present the highest wind speed averages, with the lowest percentage of calms during spring, and values of 70.6%, 21.6%, and 31.4% for Castro, Curitiba, and Paranaguá, respectively. It is noted that the highest wind speed percentage in the class relative to 2 m/s and 3 m/s occur during spring in Castro (9.8%) and Curitiba (15.8%), while in Paranaguá, it occurs during the summer, with 19.6%.
Conversely, the highest percentage of calm winds in Castro (78.6%) occurs during autumn, while in Curitiba (38.8%) and Paranaguá (44.3%), it occurs in the winter. However, calm winds are less frequent during autumn in Castro (2.2%) and Curitiba (9.4%) and during winter at Paranaguá (7.1%)—(Figure 4). Thus, the decrease in wind speed during autumn and winter is associated with FS incursion associated with a stationary mass of air, with the last one being usually responsible for the atmospheric stability and the lower rainfall totals in the region, especially in winter [9,32,50,51].
Curitiba presented prevailing winds of NE in all seasons, with higher frequencies during summer (20.1%) and spring (24.8%). On the other hand, in Castro, the prevailing winds of E predominate mainly during spring (10.9%) and autumn (5.1%), while during winter (5.9%) and summer (6.0%), NW winds prevail. As for wind speed, the western (W) to NW sector winds often prevail in these two seasons due to FS performance. Opposingly, in Paranaguá, the winds are more frequent and intense in the S direction during all seasons, especially in spring (17.7%), due to the prevalence of the sea–land breeze [9]. However, the highest prevailing wind of E occurs during the summer (19.2%), with more intense winds in this same season coming from the S (Figure 3 and Figure 4).

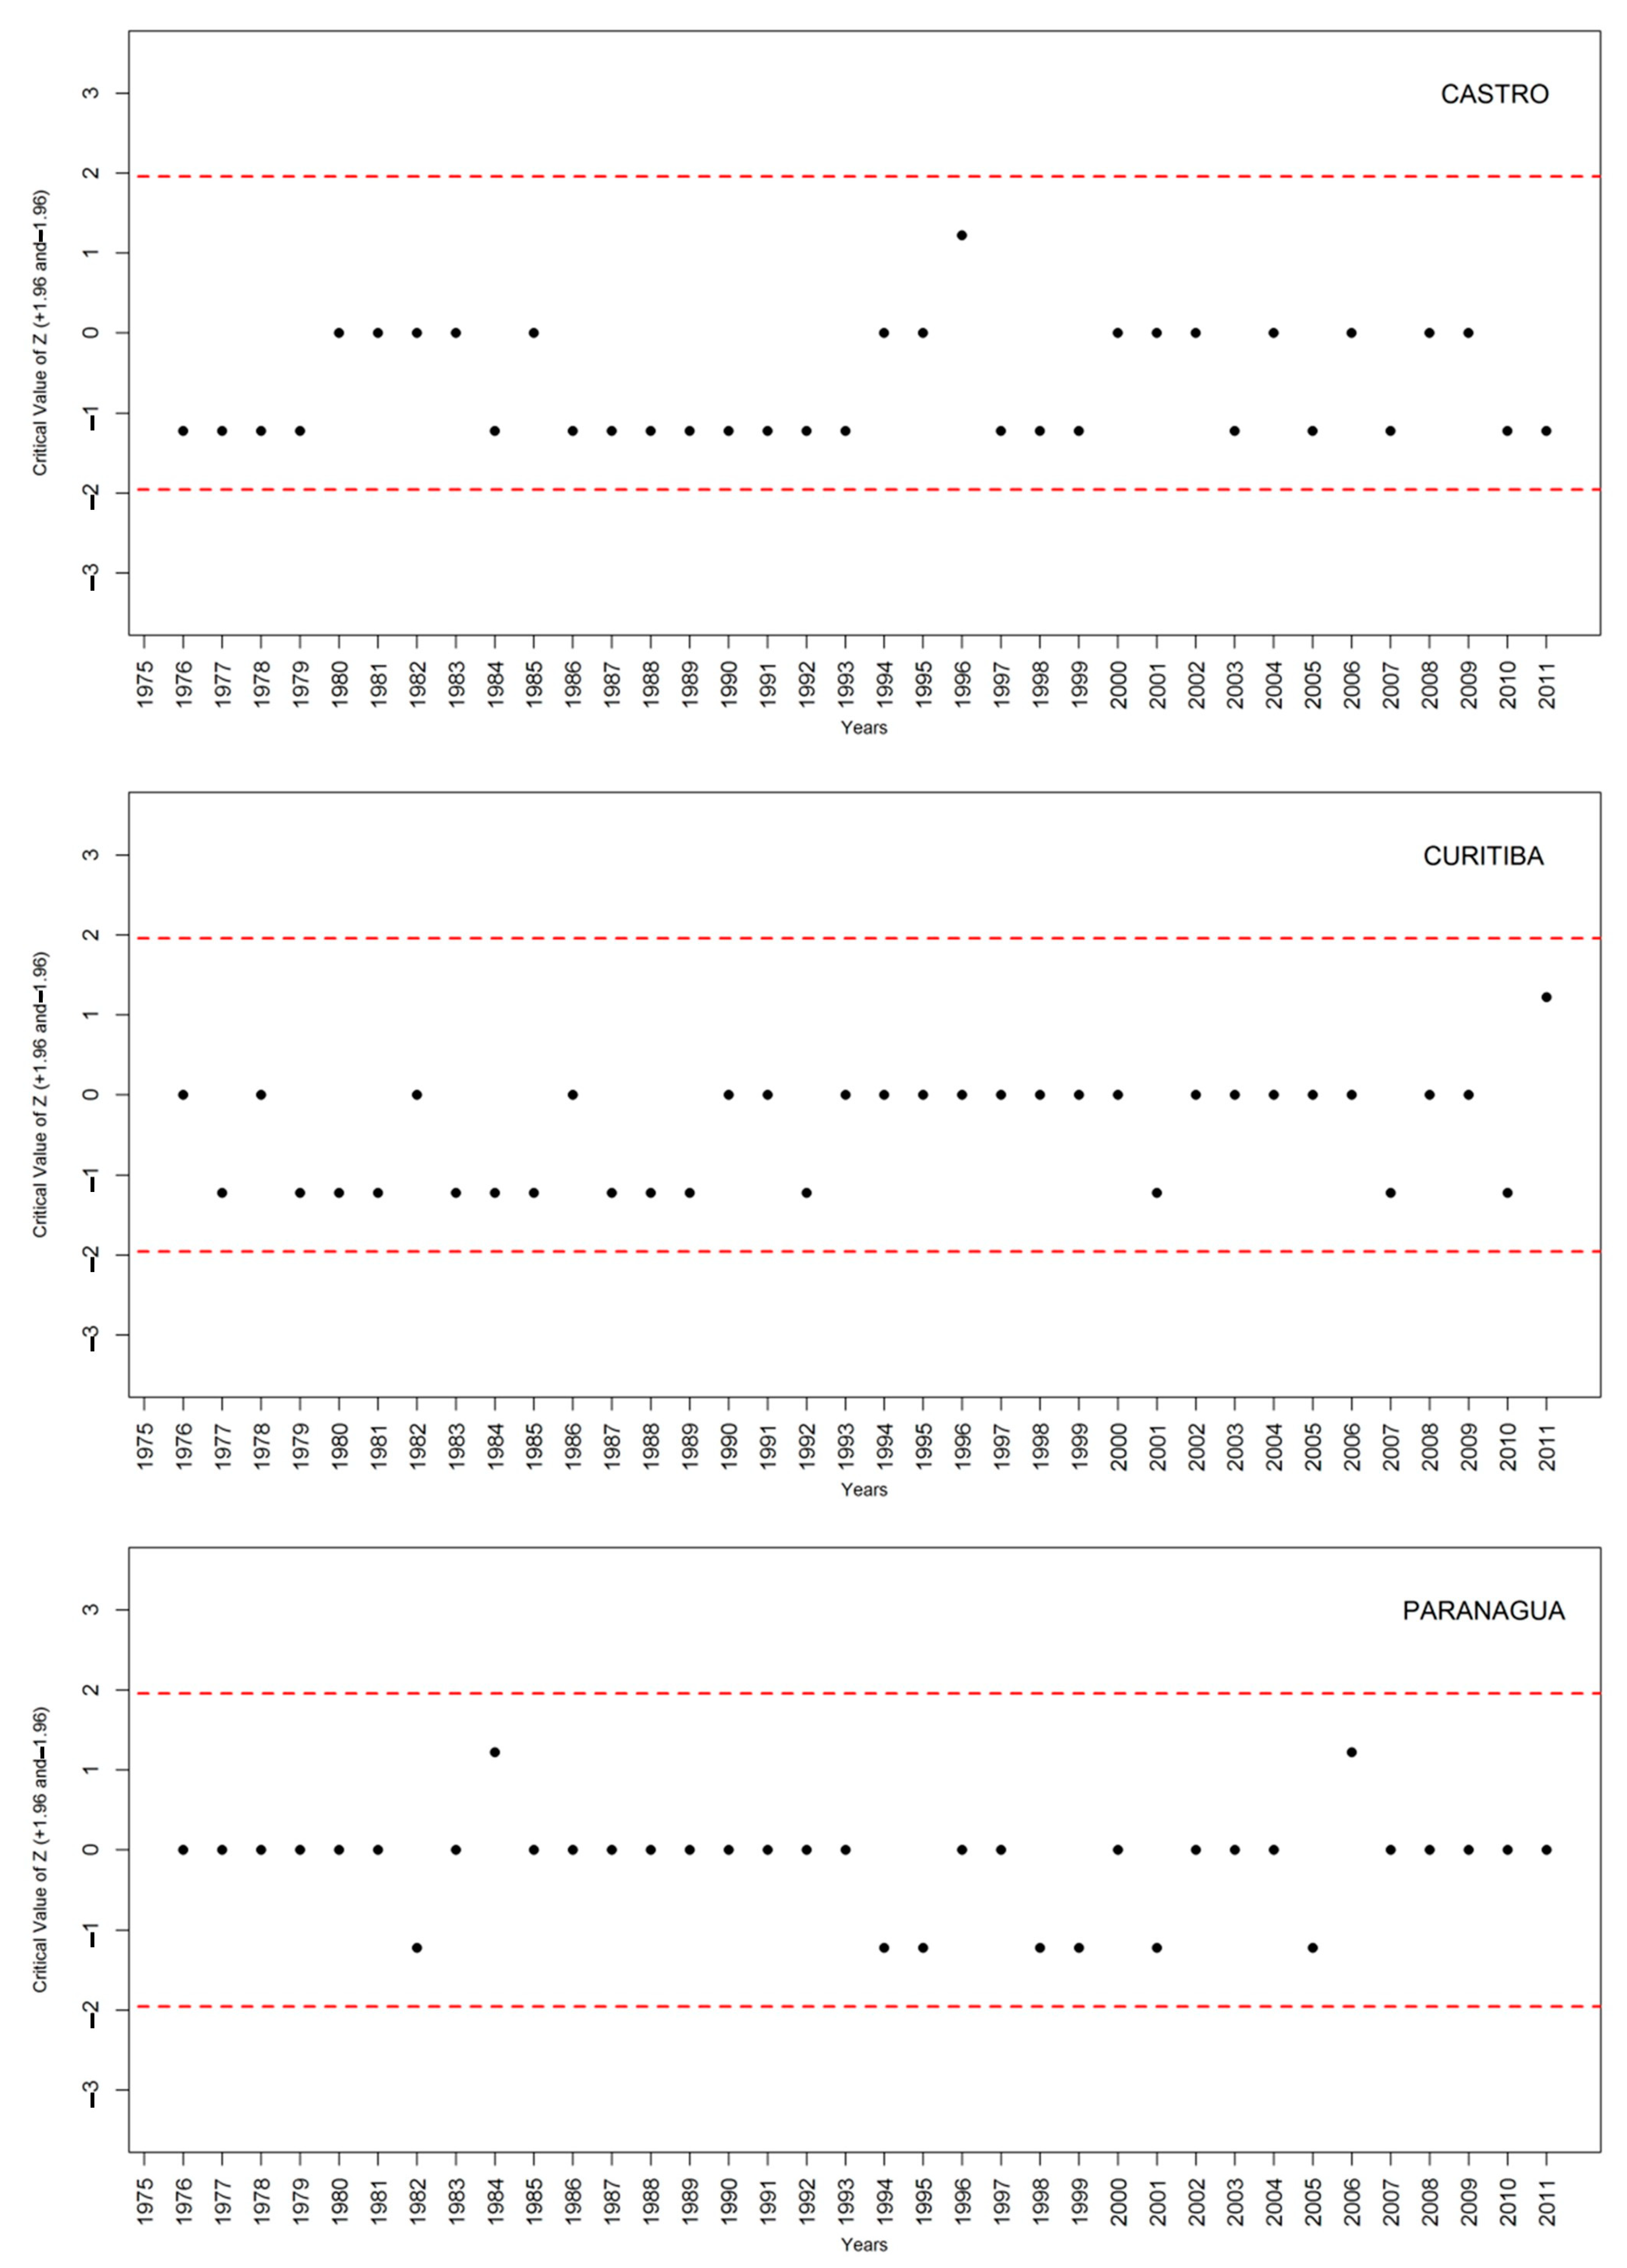
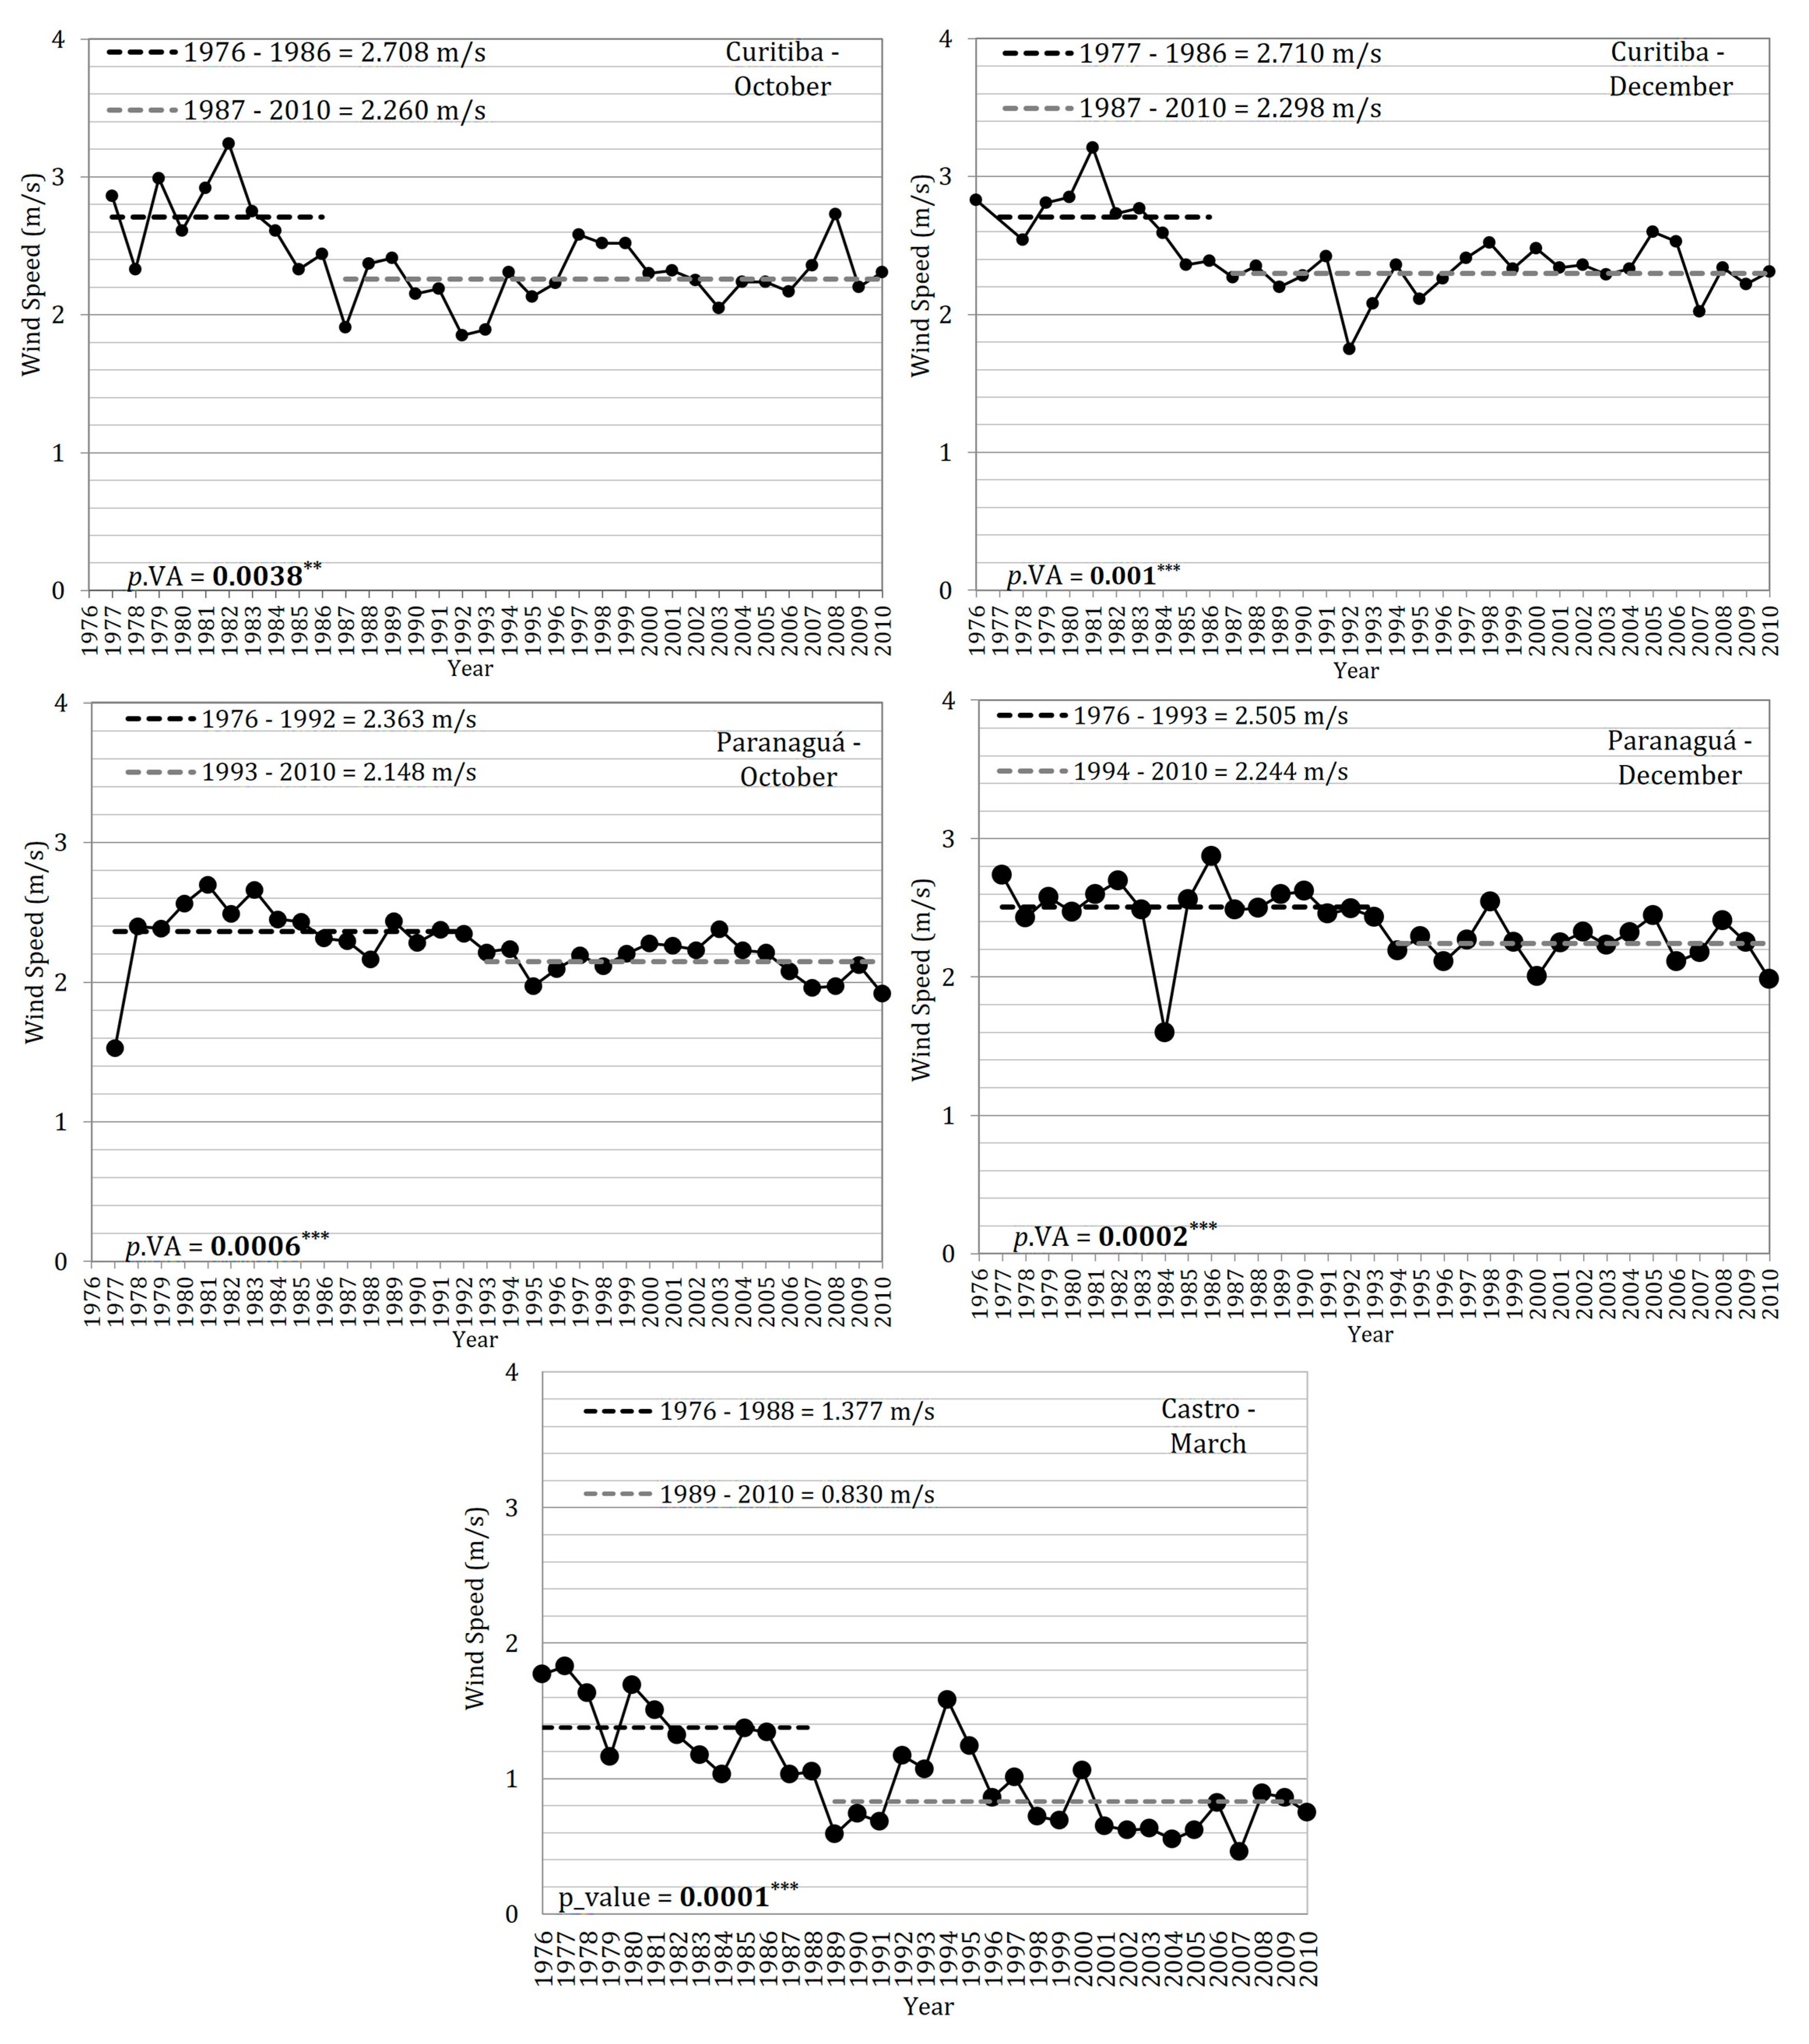
3.2. Temporal Trends

The Run test applied to the annual wind data indicated that, in Castro, the years with the lowest average speed in the time series were 1979, 1984, 1985, and 2008, with Z < −1.96. For Curitiba, the same parameter indicated a significant reduction greater than −1.96 in 1978, 1979, 1984, 1989, 1995, 1996, 2004, and 2005. However, the results of this test for the Paranaguá station indicated the predominance of years with Z < −1.96, with only 12 of the 35 years within the significant Z intervals, which corresponds to the highest variation among the time series (Figure 5). Although it presented representative variability, the seasonal scale’s run test results revealed that the time series were among the Z intervals (Figure 6).
Thus, the selected years of the Z interval are 2004 and 2005 for Curitiba, 2008 for Castro, and 2009 and 2010 for Paranaguá for meteorological systems analysis in the southern region of Brazil. As a result, FS were identified as the most active mechanisms and observed all year long, although it was commonly identified individually at 6.7% of the months (Table 3). The SASA is another active atmospheric system for the region, especially in 2004 and 2005, which influenced the atmospheric stability and rainfall reduction compared to normal climatological conditions. However, contrasting with the literature [51,52,53], these years were influenced by El Niño Southern Oscillation (ENSO), and even then, presented below-average rainfall and less frequent atmospheric disturbances. Other mechanisms occurred with high variability, in the interaction of two or more meteorological systems, especially in 2009 and 2010, where the influence of ENSO was verified at the end of the first year and the beginning of the second year, according to [52].
The MK and Pettitt tests revealed changes during the studied period. However, there was only one statistically significant trend (ZMK = 1.96, 95% significance) in Castro for reducing the annual winds by 0.23 m/s per year. At the same time, Curitiba and Paranaguá decreased with no statistical significance, equal to −1.59 and −1.14 (ZMK), respectively (Table 4). The break point detection identified by the Pettitt test occurred in January 1986 at Curitiba, February 1995 for Castro, and February 2006 for Paranaguá (Table 4). Thus, the first break point detection of the wind series in Curitiba is likely associated with urban expansion, which started between 1970 and 1980. Ref. [54] also observed these results of wind speed reduction in southwest Germany, confirming that these modifications are at least partially related to changes in surface roughness.
The MK test indicated that the Castro station decreased wind speed (m/s) in all seasons, especially in summer (ZMK = −1.90) and autumn (ZMK = −2.36), and with less intensity in winter (ZMK = −1.82) and spring (ZMK = −1.89), with reductions between 0.01 and 0.02 m/s per year. At the Curitiba station, there were significant wind decrease trends in spring (ZMK = −2.64), with a reduction of 0.01 m/s per year. During the summer, autumn and winter, trends did not reach the statistical significance threshold of 5% (ZMK = −1.96) for the MK test. For Paranaguá, the MK test revealed a significant reduction during spring (ZMK = −2.63), with a reduction of 0.01 m/s per year in wind speed, a minimal reduction during summer (ZMK = −0.56) and winter (ZMK = −0.42) and a non-significant increase throughout autumn (ZMK = 0.40) (Table 5).
The SWT results revealed a different distribution from the normal for the summer in Castro, a period in which the MKT identified a trend with 90% of statistical significance for the reduction in the average wind speed. There was a different distribution from the normal for the winter season in Curitiba, a result in line with the statistically significant rupture (99.9%) obtained by the Pettitt test for 1988, with a reduction in the subsequent period. In Paranaguá, the SWT revealed distributions within the normal range, and the results obtained by the SWT did not align with the ruptures and trends of decreasing wind speed observed throughout the spring (Table 5).
Statistically, significant ruptures were observed on the seasonal scale, especially for Curitiba and between 1986 and 1988. For the winter season, with 99.9% of statistical significance, the average wind speed reduction from 1976 to 1988 was 0.38 (2.41 to 2.03) m/s in the following period. A reduction in wind speed for spring was identified, passing from 2.75 m/s (1976 to 1988) to 2.33 m/s (1987 to 2010), with 99.9% statistical significance. There was a reduction in wind speed for Curitiba during autumn and summer, with 95% and 90% statistical significance, with a decrease from 2.18 m/s and 2.33 m/s to 1.87 m/s and 2.11 m/s, in that order. Moreover, a reduction in the wind speed for Paranaguá during the spring was revealed (90% of statistical significance), passing from 2.40 m/between 1976 and 1992 to 2.27 m/s in the second period, between 1993 and 2010 (Table 5; Figure 7).
Applying the MK test to the monthly scale, it was observed that the period between March and June is characterized by the most significant reductions in wind speed in Castro, with a decrease ranging from 0.013 to 0.023 m/s per year with statistical significance ranging from 90% to 99%. In Curitiba, trends of wind speed reduction between 0.0085 and 0.0134 m/s per year were observed with a significance between 90 and 99.9% in April, November, and December. In Paranaguá, trends of decreasing wind speed between 0.0124 and 0.0133 m/s per year were obtained, with a statistical significance of 99.9% for October and December. Therefore, while the most significant reductions in wind speed were more frequent in late summer and autumn in Castro, Curitiba and Paranaguá revealed more significant reduction trends during spring (Table 6).
The Pettitt test identified ruptures with statistical significance for Curitiba on the monthly scale during the 1985–1989 period, especially between June–December, February and May. The reduction in the average wind speed was verified, with 95% significance statistics, in 1985 for May and September, in 1986 for June and November, in 1987 for February and July, and in 1989 for August. Among these main ruptures, with 99 and 99.9% statistical significance, ruptures were obtained in October and December of 1986. In Paranaguá, rupture points with 99.9% of statistical significance were observed in October and December of 1992 and 1993. In Castro, the only rupture was obtained for March 1988, with 99.9% significance (Table 6).
The Shapiro–Wilk normality test (SWT) revealed a different distribution for January, March, September, and October in Castro. The result of this test follows the results obtained by the MKT, from which significant trends of wind speed reduction were observed in March and September, and by the Pettitt test in March, with a decrease in the period after 1997. In Curitiba, a different distribution from the normal was identified in March, June, July, September, and December, in agreement with what was shown for the MKT for December and with the ruptures verified in the 1980s for June, July, September, and December. Finally, in Paranaguá, the SWT identified the non-normality of the data referring to October and December, in which reductions in the average wind speed were verified with 99.9% of statistical significance for both the MKT and the Pettitt test (Table 7). The results that presented the non-significant trend of the Shapiro–Wilk test do not fit in a normal distribution and therefore cannot be estimated by this type of distribution.

4. Discussion

Regarding the annual wind direction, there is a predominance of E, NE, and South (S) winds for Castro (11.2%), Curitiba (18.5%), and Paranaguá (15.2%). In Castro and Curitiba, E and NE prevailing winds occur due to synoptic meteorological systems associated with SASA [24,55]. This result is similar to that of other research carried out in the southern and southeastern regions of Brazil as obtained [8] for the municipality of Lapa (Paraná state), and [16] for the Metropolitan Region of Rio de Janeiro (RMRJ). In Paranaguá, the prevailing winds are E and S due to interaction with the complex topography, such as the results presented by [15] for Rio de Janeiro city, [12] for Rio de Janeiro state, and [9] for southeast Brazil.
The seasonal results are approximately similar to those of [3] for Ituverava (São Paulo state, Brazil), who obtained the highest wind speed from August to November, particularly in early spring (September and October). Ref. [56] also stated that in the city of Seropédica (Rio de Janeiro, Brazil), a predominance of wind speed class between 2 to 3 m/s occurs from September to March (spring–summer). According to [57], in studies for the Brazilian territory, the highest frequencies of values above 4 m/s are found in the stations located in the subtropical and tropical zones and occur between spring and summer. The highest wind speeds identified in both seasons are influenced by synoptic (South Atlantic convergence zone—SACZ) and mesoscale (squall lines) systems and, mainly, by the tropical Atlantic air mass that intensifies the flow pattern in the region [9,12,33,35,50,52,53,54]. The prevailing Southern pattern observed in Paranaguá was also observed in Navegantes (Santa Catarina, Brazil) by [58], and for some sectors of the metropolitan region of Rio de Janeiro by [15,16], due to the sea–land breeze circulation in the wind formation, which is influenced by local and mesoscale meteorological systems.
The results obtained in this research agree with those obtained by [59] for the state of Paraná, as the application of the MK test revealed a tendency to decrease the average wind speed in several sectors of Paraná. According to the authors, the Pettitt test identified ruptures that prevailed between 1992 and 2001, with changes possibly associated with significant urbanization and modification in surface roughness due to land use modification. In Morretes, a locality on the coast of Paraná state and close to Paranaguá, the results revealed trends toward a decrease in the average wind speed in all months of the year and an 18% reduction in the average wind speed.
Ref. [14] found trends of increasing annual and seasonal wind speeds for the Equatorial climate region of the Brazilian territory. In contrast, Brazil’s central and southeastern regions revealed a significant (>95%) reduction in the average wind speed. Notably, the highest significant positive and negative spatial wind speed trends occurred for the upper percentiles (75% and 95%) and are possibly associated with changes in the development of the intertropical convergence zone and the South Atlantic subtropical anticyclone over Brazil. Furthermore, the decrease in wind speed in central-west and southeastern Brazil is related to temperature changes in the interior of Brazil since continental warming from the equatorial low weakens the pressure gradient force in these two regions [5].
Ref. [9] explain that the temporal trends of reduction in mean wind speed in the southeastern region of Brazil are related to changes in the dynamics of mid-latitudes observed during the last century. Using analyzes that covered a period (1980–2014) similar to that of this research, these authors identified that the mean climatological position of the South Atlantic anticyclone, also called the polar migratory anticyclone, changed from the south further to the east during the winter, and to the west in spring. This condition may account partly for the trends of wind speed reduction in the eastern sector of the state of Paraná.
The results described for eastern Paraná state are in line with those obtained by [60], with significant trends of wind speed reduction in southern sectors of South America and, notably, in the southern sector adjacent to Argentina. In addition, it was highlighted that the average wind speed is decreasing at a rate greater than 0.0005 m/s per month in the Atlantic Ocean region adjacent to Argentina, as well as some sectors of northern Argentina, Paraguay, in the west of southern Brazil, and the Brazilian state of Mato Grosso do Sul.
According to [61], over the last 30 years, observational data indicate a decline of about 0.3 m/s in wind speed from the earth’s surface in northern mid-latitudes. This pattern of wind speed reduction is supported by more recent research conducted in Europe [26,62,63,64] and Asia [65,66,67]. However, limited research makes this scenario less conclusive for the Southern Hemisphere and the oceans.
Ref. [4] analyzed data from two observational datasets (1973 to 2000 and 1973 to 2005) for the United States of America. They consistently identified significant negative trends across the entire US territory, with greater magnitudes in the eastern United States and the Midwest. Using time series from four meteorological stations on the west coast of Canada, with an analysis period between 1940 or 1950 to the mid-1990s, [68] measured the decrease in the average annual and winter wind speed, and concluded with the increase of calm winds and the decrease in the observations of high-speed winds.
Ref. [69] found significant trends in the reduction of average wind speed in Sweden, with a decrease of 0.06 m/s per decade from 1956 to 2013 and a decrease of 0.14 m/s per decade between 1979 to 2008. Seasonally, trends of reduced wind speed were observed throughout the spring, summer, and autumn, emphasizing the highest decreases on the coast and in the southern region of Sweden. Decreasing trends were found in 91.7% of the meteorological stations during the summer, while 58.3% exhibited decreasing trends in the winter.
Ref. [70] verified the reduction of the annual average speed of the winds in 88% of the Australian territory in the order of 0.09 m/s per decade, considering the period from 1975 to 2008. Ref. [30] revealed significant trends in the average wind speed at 2 m height between −0.10 and 0.03 m/s per year, between 1976 and 2006, and −0.36 and 0.04 m/s per year, considering the period between 1989 and 2006. Studies carried out by [71] for the city of Raipur, the Indian city capital of the state of Chhattisgarh, revealed that most of the monthly, seasonal, and annual series of wind speed in all periods confirm a downward trend with 95% of statistical significance between the period of 1990 to 1996 (at 2 m).
By analyzing wind speeds from 174 urban and 180 rural observation sites, [72] identified that urban stations tend to record weaker average annual wind speeds with a steep negative trend of average wind speed, between 1956 and 2004, due to the extensive urban development in China. They revealed that the main reason for the downward trend is that, under the effect of global warming and urbanization, the contrasts in sea level pressure and near-surface temperature between the Asian continent and the Pacific Ocean have become significantly smaller and slowed down the winds in most Chinese cities. In agreement with these results, [73] revealed that the wind speed near the surface decreased by approximately 0.11 m/s per decade between 1958 and 2015.
Most research attributes the decrease in wind speeds to increasing urbanization [26,74,75,76] and the change in land cover [62,77]. For example, [78] estimated that 25–60% of the decrease in surface wind trends found in the Northern Hemisphere are linked to an increase in the surface roughness of vegetation. Although these two factors are decisive in influencing the decrease in surface winds, other research points to the following factors: changes in macroscale atmospheric circulation [70,79,80], teleconnections and modes of ocean temperature and pressure variability [81,82]; surface temperature, solar radiation, and solar activity [75,83]; and evapotranspiration levels [84,85].
However, [66] highlights that those changes in nearby wind speeds are induced by the interaction between anthropogenic activities and natural climate change. Their bibliographic survey identified that the most abrupt changes occurred in the last 30 years in Central Asia and North America, with average linear trends of −0.11 m/s per decade. In Europe and South and East Asia, these changes were on average −0.08 m/s per decade.
Ref. [86] also emphasize that the decreasing average wind speed is also linked to changes in driving forces caused by changes in atmospheric circulation. Changes in drag forces are caused by external and internal friction in the atmosphere. In contrast, changes in surface friction are mainly caused by changes in surface roughness due to changes in land use and cover, including urbanization.

5. Conclusions

This study of the wind regime in eastern Paraná state analyzed wind speed and direction (at 2 m) during the period between 1976 to 2010. For all scales, Castro (the furthest station from the coastline) revealed a predominance of calm winds, while in Curitiba and Paranaguá, the wind speed is mainly from 1 to 2 m/s (calm winds). In Castro and Curitiba, the prevailing winds were of NE and E, respectively, likely due to the influence of the South Atlantic subtropical anticyclone. While in Paranaguá, the prevailing wind was of E and S. During spring, the seasonal cycle presented more intense winds in Castro and Curitiba, mainly prevailing in NW and W sectors, influenced by FS incursions. Paranaguá station increased the frequency of winds, mainly during summer from the S, due to the influence of topography, vegetation, and urbanization on the Brazilian coast.
The MKT revealed for the annual scale a decrease of 0.02 m/s per year (with 95% of statistical significance) in the average wind speed in Castro, which represents a reduction of 0.24 m/s per decade, with higher values when compared to the results obtained for Central Asia and North America by [86]. For the seasonal scale, a significant reduction was observed in all seasons of the year in Castro, emphasizing the reduction trend of 0.23 m/s per decade for autumn (95% significance). For Curitiba and Paranaguá, there was a tendency of reduced average wind speed between 0.11 and 0.12 m/s per decade, with 99% significance for the spring season. On a monthly analysis scale, trends of reduction in the average wind speed between the end of summer and the beginning of autumn were verified in Castro, with decreases from 0.23 to 0.22 m/s per decade in March and April, with 99% and 95% significance, respectively. With a marked pattern of reduction in the trend for the average wind speed throughout the spring in Curitiba and Paranaguá, a decrease between 0.12 m/s to 0.13 m/s per decade was observed, with more than 99% of statistical significance. Thus, the results presented by the Mann–Kendall test consistently revealed trends to reduce the average wind speed in these locations of Paraná state, which is in line with previous investigations carried out in this sector of the Brazilian territory.
The Pettitt test presented that the break point detection for Curitiba started during the 1980s due to the urban intensification, consequently reducing the local wind speed. In Curitiba, ruptures were identified in the time series of wind speed in all seasons of the year, between 1986 and 1988, especially during winter (from 2.6 to 2.0 m/s) and spring (from 2.7 to 2.4 m/s). In Paranaguá, only the spring season revealed a significant trend (90%) of wind speed reduction from 1992 onwards, decreasing from 2.4 to 2.3 m/s. For the monthly scale, significant trends (95% to 99.9%) of decrease in wind speed were shown between May and December for the city of Curitiba, with emphasis on the ruptures verified in October and December (1986). For the other locations, the ruptures were less robust and frequent when compared to Curitiba. In Castro, a rupture was observed only for March (1988) with 99.9% significance, and in Paranaguá, October and December presented a rupture followed by a significant decrease (99.9%) in the average wind speed.
It is important to emphasize that the trends and ruptures verified and measured by the MK and Pettitt tests, and partially validated by the Shapiro–Wilk test, are in line with the prevailing patterns for different regions of the world and the southern and southeastern sectors of South America. Among the factors identified, it is noteworthy that this region of the Brazilian territory encompasses a densely urbanized and anthropized area. This condition potentially modifies the roughness of the terrain and the energy balance responsible for the increase in surface temperature, as demonstrated [87] in the downtown area of Rio de Janeiro. Previous research pointed to a similar standard of wind speed reduction trends in Brazil [9,12,14]. Curitiba corresponds to one of Brazil’s largest cities and metropolitan regions, with approximately 4 million inhabitants. Therefore, it is assumed that the interaction between natural climate changes and human activities is the main factor responsible for the prevailing wind speed decrease identified and validated in this research. We assume that the trend of decreasing wind speed in the examined series was caused by the increase of urban areas, as well as the heating caused by more developed regions and the barrier produced by the building verticalization process.

Author Contributions

Conceptualization, P.M.d.B.T., W.L.F.C.F. and J.F.d.O.J.; methodology, P.M.d.B.T., W.L.F.C.F. and J.F.d.O.J.; formal analysis, P.M.d.B.T., W.L.F.C.F., J.F.d.O.J., B.S.S., E.G., G.d.G., A.C.d.S.O.-J. and V.H.R.B.; investigation, P.M.d.B.T., W.L.F.C.F., J.F.d.O.J. and E.G.; resources, P.M.d.B.T., W.L.F.C.F., J.F.d.O.J., G.d.G. and V.H.R.B.; data curation, P.M.d.B.T., W.L.F.C.F., J.F.d.O.J., G.d.G. and V.H.R.B.; writing—original draft preparation, P.M.d.B.T., J.F.d.O.J., G.d.G., E.G. and B.S.S.; writing—review and editing, P.M.d.B.T., W.L.F.C.F., J.F.d.O.J., E.G. and A.C.d.S.O.-J.; visualization, P.M.d.B.T.; supervision, J.F.d.O.J., E.G. and A.C.d.S.O.-J.; project administration, E.G. and J.F.d.O.J.; funding acquisition, E.G. and J.F.d.O.J. All authors have read and agreed to the published version of the manuscript.

Funding

The present work was done with the financial support of the National Program for Academic Cooperation of the Coordination of Improvement of Higher-Level Personnel (CAPES)—Call for Proposals 071/2013—process number 88881.068465/2014-01. The first author thanks the Coordination of Improvement of Higher-Level Personnel (CAPES) for granting the Doctorate Scholarship and thanks the Brazilian National Council for Scientific and Technological Development (CNPq) for the Post-Doctoral Grant (process number 65450/2020-7). The third author thanks the Brazilian National Council for Scientific and Technological Development (CNPq) for the Productivity Grant (Level 1D) (process number 304973/2017-3. The sixth author thanks CAPES for the Post-Doctoral Grant (Process 086/2013 CAPES/2017-PGTA). The seventh author thanks CAPES for the Doctorate scholarship (Process 086/2013-CAPES nº 16/2022-PPGCA/UFAC). The eighth author thanks the National Council for Scientific and Technological Development for the Productivity Research Grant (Level 1D) (process number 304973/2017-3).

Data Availability Statement

The data presented in this study are available on request from the corresponding author. The data are not publicly available according to the National Institute of Meteorology norms.

Acknowledgments

The fifth author thanks the following institutions: the Postgraduate Program in Biosystems Engineering (PGEB-UFF), the Land and Cartography Institute of Rio de Janeiro (ITERJ), and the State Secretary of the Cities (SECID-RJ) for the support in the publication of this article.

Conflicts of Interest

The authors declare no conflict of interest.

References

  1. Li, F.R.; Zhao, W.Z.; Liu, J.L.; Huang, Z.G. Degraded vegetation and wind erosion influence soil carbon, nitrogen and phosphorus accumulation in sandy grasslands. Plant Soil 2009, 317, 79–92. [Google Scholar] [CrossRef]
  2. Chi, W.; Zhao, Y.; Kuang, W.; He, H. Impacts of anthropogenic land use/cover changes on soil wind erosion in China. Sci. Total Environ. 2019, 668, 204–215. [Google Scholar] [CrossRef] [PubMed]
  3. Munhoz, F.C.; Garcia, A. Characterization of the predominant wind speed and wind direction at Ituverava, São Paulo State, Brazil. Rev. Bras. Meteorol. 2008, 23, 30–34. [Google Scholar] [CrossRef] [Green Version]
  4. Pryor, S.C.; Barthelmie, R.J.; Young, D.T.; Takle, E.S.; Arritt, R.W.; Flory, D.; Gutowski, W.J.; Nunes, A.; Roads, J. Wind speed trends over the contiguous United States. J. Geophys. Res. 2009, 114, D14105. [Google Scholar] [CrossRef]
  5. de Oliveira Santos, M.; Stosic, T.; Stosic, B.D. Long-term correlations in hourly wind speed records in Pernambuco, Brazil. Physica A 2012, 391, 1546–1552. [Google Scholar] [CrossRef] [Green Version]
  6. Adami, V.S.; Antunes Júnior, J.A.V.; Sellitto, M.A. Regional industrial policy in the wind energy sector: The case of the State of Rio Grande Do Sul, Brazil. Energ. Policy. 2017, 111, 18–27. [Google Scholar] [CrossRef]
  7. Wohland, J.; Omrani, N.; Witthaut, D.; Keenlyside, N.S. Inconsistent wind speed trends in current twentieth century reanalyses. J. Geophys. Res-Atmos. 2019, 124, 1931–1940. [Google Scholar] [CrossRef] [Green Version]
  8. Beruski, G.C.; Leite, M.D.L.; das Virgens Filho, J.S.; Adacheski, P.A.; de Oliveira, A.V. Probabilistic analysis of the average speed andcharacterization of the predominant wind direction in the cityof Lapa/PR. Raega-O Espaço Geográfico Análise 2009, 17. [Google Scholar] [CrossRef] [Green Version]
  9. Correia Filho, W.L.F.; Souza, P.H.A.; Oliveira-Júnior, J.F.; Santiago, D.B.; Lyra, G.B.; Zeri, M.; Cunha-Zeri, G. The wind regime over the Brazilian Southeast: Spatial and temporal characterization using multivariate analysis. Int. J. Climatol. 2022, 42, 1767–1788. [Google Scholar] [CrossRef]
  10. Coccia, M. The effects of atmospheric stability with low wind speed and of air pollution on the accelerated transmission dynamics of COVID-19. Int. J. Environ. Stud. 2021, 78, 1–27. [Google Scholar] [CrossRef]
  11. Gois, G.; Oliveira-Junior, J.F.; da Silva, E.B.; Maia, J.L.M.; Aleluia, I.S.S.; Teodoro, P.E. Carbon monoxide trend in the city of rio de janeiro via Mann-Kendall and cusum tests. Biosci. J. 2017, 33, 1332–1339. [Google Scholar] [CrossRef]
  12. Correia Filho, W.L.F.; Souza, P.H.A.; Oliveira-Júnior, J.F.; Terassi, P.M.B.; Gois, G.; Silva-Júnior, C.A.; Sobral, B.S.; Rangel, R.H.O.; Pimentel, L.C.G. Investigating the characteristics and predictability of measured wind speed data over Rio de Janeiro, Brazil. Pure Appl. Geophys. 2021, 178, 2333–2355. [Google Scholar] [CrossRef]
  13. Gilliland, J.M.; Keim, B.D. Position of the South Atlantic Anticyclone and its impact on surface conditions across Brazil. J. Appl. Meteorol. Climatol. 2018, 57, 535–553. [Google Scholar] [CrossRef]
  14. Gilliland, J.M.; Keim, B.D. Surface Wind speed: Trend and climatology of Brazil from 1980-2014. Int. J. Climatol. 2018, 38, 1060–1073. [Google Scholar] [CrossRef]
  15. Oliveira-Júnior, J.F.; Terassi, P.M.B.; Gois, G. Study of the wind circulation in Guanabara bay/RJ between 2003 to 2012. Rev. Bras. Climatol. 2017, 21. [Google Scholar] [CrossRef] [Green Version]
  16. Pimentel, L.C.G.; Marton, E.; da Silva, M.S.; Jourdan, P. Characterization of surface wind regime in the Metropolitan Area of Rio de Janeiro. Eng. Sanit. Ambient. 2014, 19, 121–132. [Google Scholar] [CrossRef] [Green Version]
  17. Yamartino, R.J. A comparison of several “single-pass” estimators of the standard deviation of wind direction. J. Appl. Meteorol. Clim. 1984, 23, 1362–1366. [Google Scholar] [CrossRef]
  18. Klink, K. Climatological mean and interannual variance of United States surface wind speed, direction and velocity. Int. J. Climatol. 1999, 19, 471–488. [Google Scholar] [CrossRef]
  19. Stivari, S.M.S.; Oliveira, A.P.; Soares, J. On the climate impact of the local circulation in the Itaipu Lake area. Clim. Change 2005, 72, 103–121. [Google Scholar] [CrossRef]
  20. Stivari, S.M.S.; de Oliveira, A.P.; Karam, H.A.; Soares, J. Patterns of local circulation in the Itaipu Lake area: Numerical simulations of lake breeze. J. Appl. Meteorol. 2003, 42, 37–50. [Google Scholar] [CrossRef]
  21. Oliveira, J.F.; Souza, J.C.S.; Dias, F.O.; Gois, G.; Gonçalves, I.F.S.; Silva, M.S. Characterization of wind regime in Seropedica, Rio de Janeiro State, Brazil (2001-2010). Floresta Ambiente 2013, 20, 447–459. [Google Scholar] [CrossRef]
  22. Sobral, B.S.; Oliveira-Júnior, J.F.; Gois, G.; Terassi, P.M.B.T.; Pereira, C.R. Wind Regime in Serra do Mar Ridge—Rio de Janeiro, Brazil. Rev. Bras. Meteorol. 2018, 33, 441–451. [Google Scholar] [CrossRef] [Green Version]
  23. Karl, T.R.; Knight, R.W.; Easterling, D.R.; Quayle, R.G. Indices of climate change for the United States. Bull. Am. Meteorol. Soc. 1996, 77, 279–292. [Google Scholar] [CrossRef]
  24. Terassi, P.M.B.; Oliveira-Júnior, J.F.; Galvani, E.; Correia Filho, W.L.F.; Gois, G.; Sobral, B.S.; Biffi, V.H.R. Wind regime in Curitiba and Paranaguá, Paraná. Rev. Bras. Climatol. 2019, 25, 241–265. [Google Scholar] [CrossRef] [Green Version]
  25. Kousari, M.R.; Ahani, H.; Hakimelahi, H. An Investigation of near Surface Wind Speed Trends in Arid and Semiarid Regions of Iran. Theor. Appl. Climatol. 2013, 114, 153–168. [Google Scholar] [CrossRef]
  26. Azorin-Molina, C.; Vicente-Serrano, S.M.; McVicar, T.R.; Jerez, S.; Sanchez-Lorenzo, A.; López-Moreno, J.-I.; Revuelto, J.; Trigo, R.M.; Lopez-Bustins, J.A.; Espírito-Santo, F. Homogenization and assessment of observed near-surface wind speed trends over Spain and Portugal, 1961-2011. J. Clim. 2014, 27, 3692–3712. [Google Scholar] [CrossRef]
  27. Azorin-Molina, C.; Rehman, S.; Guijarro, J.A.; McVicar, T.R.; Minola, L.; Chen, D.; Vicente-Serrano, S.M. Recent trends in wind speed across Saudi Arabia, 1978-2013: A break in the stilling. Int. J. Climatol. 2018, 38, e966–e984. [Google Scholar] [CrossRef]
  28. Lawin, A.E.; Manirakiza, C.; Lamboni, B. Trends and changes detection in rainfall, temperature and wind speed in Burundi. J. Wat. Clim. Change 2019, 10, 852–870. [Google Scholar] [CrossRef]
  29. Diao, W.; Zhao, Y.; Dong, Y.; Zhai, J.; Wang, Q.; Gui, Y. Spatiotemporal variability of surface wind speed during 1961–2017 in the Jing-Jin-Ji Region, China. J. Meteorol. Res-Prc. 2020, 34, 621–632. [Google Scholar] [CrossRef]
  30. Troccoli, A.; Muller, K.; Coppin, P.; Davy, R.; Russell, C.; Hirsch, A.L. Long-term wind speed trends over Australia. J. Clim. 2012, 25, 170–183. [Google Scholar] [CrossRef] [Green Version]
  31. Vanhoni, F.; Mendonça, F. The climate of the coast of the state of Paraná. Rev. Bras. Climatol. 2008, 3, 49–63. [Google Scholar] [CrossRef] [Green Version]
  32. Zandonadi, L.; Acquaotta, F.; Fratianni, S.; Zavattini, J.A. Changes in precipitation extremes in Brazil (Paraná River Basin). Theor. Appl. Climatol. 2016, 123, 741–756. [Google Scholar] [CrossRef] [Green Version]
  33. de Mello, Y.R.; Lopes, F.C.A.; Roseghini, W.F.F. Climatic characteristics and rhythmic analysis applied to extreme events of precipitation and temperatura in the city of Paranaguá, Paraná. Rev. Bras. Climatol. 2017, 20, 313–336. [Google Scholar] [CrossRef] [Green Version]
  34. Fritzons, E.; Mantovani, L.E.; Wrege, M.S.; Chaves Neto, A. Rainfall analysis to define homogeneous pluviometric areas in the State of Paraná. Raega-O Espaço Geográfico em Análise 2011, 23, 555–572. [Google Scholar] [CrossRef] [Green Version]
  35. Terassi, P.M.B.; Galvani, E. Identification of homogeneous rainfall regions in the eastern watersheds of the State of Paraná, Brazil. Climate 2017, 5, 53. [Google Scholar] [CrossRef] [Green Version]
  36. Terassi, P.M.B.; Oscar-Júnior, A.C.S.; Galvani, E.; Oliveira-Júnior, J.F.; Sobral, B.S.; Biffi, V.H.R.; Gois, G. Daily Rainfall Intensity and Temporal Trends in Eastern Paraná State—Brazil. Urban. Clim. 2022, 42, 101090. [Google Scholar] [CrossRef]
  37. Nascimento, E.R.; Salamuni, E.; Santos, L.J.C. Morphostructure of the Serra Do Mar, Paraná State, Brazil. J. Maps. 2016, 12, 63–70. [Google Scholar] [CrossRef] [Green Version]
  38. IBGE (Instituto Brasileiro de Geografia e Estatística). Cidades@. Available online: https://cidades.ibge.gov.br/brasil/pr/curitiba/panorama (accessed on 4 January 2022).
  39. Monteiro, R.R.; Nagy, A. The cartography of Paraná’s coast: Demography, university access, population density, sex ratio and general themes. Confins 2017, 33. [Google Scholar] [CrossRef]
  40. INMET—National Institute of Meteorology. Climatological graphics. 2018. Available online: http://www.inmet.gov.br/portal/index.php?r=clima/graficosClimaticos (accessed on 16 February 2018).
  41. Álvares, C.A.; Stape, J.L.; Sentelhas, P.C.; Moraes Gonçalves, J.L.; Sparovek, G. Köppen’s Climate Classification Map for Brazil. Meteorol. Z. 2013, 22, 711–728. [Google Scholar] [CrossRef]
  42. Lakes Environmental Software. Wind Rose Plots for Meteorological Data—WRPLOT View. 2017. Available online: http://www.weblakes.com/produts/wrplot/index.html (accessed on 20 March 2018).
  43. INPE/CPTEC (National Institute for Space Research/ Weather Forecast and Space Research Center). Boletim Climanálise 2018. Available online: www.cptec.inpe.br/products/climanalise (accessed on 18 May 2018).
  44. Back, Á.J. Aplicação de Análise Estatística Para Identificação de Tendências Climáticas. Pesqui. Agropecu. Bras. 2001, 36, 717–726. [Google Scholar] [CrossRef]
  45. Teodoro, P.E.; Oliveira-Júnior, J.F.; Cunha, E.R.; Correa, C.C.G.; Torres, F.E.; Bacani, V.M.; Gois, G.; Ribeiro, L.P. Cluster Analysis Applied to the Spatial and Temporal Variability of Monthly Rainfall in Mato Grosso do Sul State, Brazil. Meteorol. Atmos. Phys. 2016, 128, 197–209. [Google Scholar] [CrossRef]
  46. Vaheddoost, B.; Aksoy, H. Structural characteristics of annual precipitation in Lake Urmia Basin. Theor. Appl. Climatol. 2017, 128, 919–932. [Google Scholar] [CrossRef]
  47. R Development Core Team. R: A Language and Environment for Statistical Computing; R Foundation for Statistical Computing: Vienna, Austria; ISBN 3-900051-07-0. Available online: https://www.r-project.org (accessed on 13 March 2023).
  48. Hirsch, R.M.; Slack, J.R. A Nonparametric trend test for seasonal data with serial dependence. Water. Resour. Res. 1984, 20, 727–732. [Google Scholar] [CrossRef] [Green Version]
  49. Pettitt, A.N. A Non-parametric approach to the change-point problem. Appl. Stat. 1979, 28, 126. [Google Scholar] [CrossRef]
  50. Castelhano, F.J.; Roseghini, W.F.F. Characterization of wind dynamics in Curitiba-PR. GEOUSP: Espaço Tempo (Online) 2018, 22, 227–240. [Google Scholar] [CrossRef] [Green Version]
  51. Teixeira Nery, J.; Claudia Carfan, A. Re-Analysis of Pluvial Precipitation in Southern Brazil. Atmósfera 2014, 27, 103–115. [Google Scholar] [CrossRef] [Green Version]
  52. Terassi, P.M.B.; de Oliveira-Júnior, J.F.; de Góis, G.; Galvani, E. Standardized Precipitation Index Variability in the Northern Region of Paraná State Associated with the El Niño—Southern Oscillation. Rev. Bras. Meteorol. 2018, 33, 11–25. [Google Scholar] [CrossRef] [Green Version]
  53. Penalba, O.C.; Rivera, J.A. Precipitation response to El Niño/La Niña events in Southern South America—Emphasis in regional drought occurrences. Adv. Geosci. 2016, 42, 11–25. [Google Scholar] [CrossRef] [Green Version]
  54. Kohler, M.; Metzger, J.; Kalthoff, N. Trends in temperature and wind speed from 40 years of observations at a 200-m high meteorological tower in Southwest Germany. Int. J. Climatol. 2018, 38, 23–34. [Google Scholar] [CrossRef] [Green Version]
  55. Reboita, M.S.; Gan, M.A.; da Rocha, R.P.; Ambrizzi, T. Precipitation regimes in South America: A bibliography review. Rev. Bras. Meteorol. 2010, 25, 185–204. [Google Scholar] [CrossRef]
  56. Silva, D.G.; Lopes, R.P.; Carvalho, D.F. de Characterization of the power wind potential in Seropédica (RJ) region. Energ. Agric. 2013, 28, 185. [Google Scholar] [CrossRef] [Green Version]
  57. Siefert, C.A.C.; Dombrowski Netto, N.; Marangon, F.H.S.; Schultz, G.B.; Silva, L.M.R.; Fontenelle, T.H.; Santos, I. dos Evaluation of the Wind Speed Time Series from Climate Reanalysis for Brazil. Rev. Bras. Meteorol. 2021, 36, 689–701. [Google Scholar] [CrossRef]
  58. Truccolo, E.C. Assessment of the wind behavior in the Northern Coast of Santa Catarina. Rev. Bras. Meteorol. 2011, 26, 451–460. [Google Scholar] [CrossRef]
  59. Oliveira, D.; Borrozzino, E. Trends of wind speed change in the state of Paraná. Agrometeoros 2018, 26, 145–149. [Google Scholar] [CrossRef]
  60. Cardoso, L.F.N.; Silva, W.L.; da Silva, M.G.A.J. Long-term trends in near-surface wind speed over the Southern Hemisphere: A preliminary analysis. Int. J. Geosci. 2016, 07, 938–943. [Google Scholar] [CrossRef] [Green Version]
  61. Bichet, A.; Wild, M.; Folini, D.; Schär, C. Causes for decadal variations of wind speed over land: Sensitivity studies with a Global Climate Model. Geophys. Res. Lett. 2012, 39, L11701. [Google Scholar] [CrossRef]
  62. Laurila, T.K.; Sinclair, V.A.; Gregow, H. Climatology, Variability, and Trends in Near-surface Wind Speeds over the North Atlantic and Europe during 1979–2018 Based on ERA5. Int. J. Climatol. 2021, 41, 2253–2278. [Google Scholar] [CrossRef]
  63. Romanić, D.; Ćurić, M.; Jovičić, I.; Lompar, M. Long-term trends of the ‘Koshava’ wind during the period 1949-2010. Int. J. Climatol. 2015, 35, 288–302. [Google Scholar] [CrossRef]
  64. Yan, Z.; Bate, S.; Chandler, R.E.; Isham, V.; Wheater, H. Changes in extreme wind speeds in NW Europe simulated by generalized linear models. Theor. Appl. Climatol. 2006, 83, 121–137. [Google Scholar] [CrossRef]
  65. Wu, J.; Zha, J.; Zhao, D. Evaluating the effects of land use and cover change on the decrease of surface wind speed over China in recent 30 years using a statistical downscaling method. Clim. Dyn. 2017, 48, 131–149. [Google Scholar] [CrossRef] [Green Version]
  66. Kim, J.; Paik, K. Recent recovery of surface wind speed after decadal decrease: A focus on South Korea. Clim. Dyn. 2015, 45, 1699–1712. [Google Scholar] [CrossRef]
  67. You, Q.; Fraedrich, K.; Min, J.; Kang, S.; Zhu, X.; Pepin, N.; Zhang, L. Observed surface wind speed in the Tibetan Plateau since 1980 and its physical causes. Int. J. Climatol. 2014, 34, 1873–1882. [Google Scholar] [CrossRef]
  68. Tuller, S.E. Measured wind speed trends on the West Coast of Canada. Int. J. Climatol. 2004, 24, 1359–1374. [Google Scholar] [CrossRef]
  69. Minola, L.; Azorin-Molina, C.; Chen, D. Homogenization and assessment of observed near-surface wind speed trends across Sweden, 1956–2013. J. Clim. 2016, 29, 7397–7415. [Google Scholar] [CrossRef]
  70. McVicar, T.R.; van Niel, T.G.; Li, L.T.; Roderick, M.L.; Rayner, D.P.; Ricciardulli, L.; Donohue, R.J. Wind Speed Climatology and Trends for Australia, 1975-2006: Capturing the stilling phenomenon and comparison with near-surface reanalysis output. Geophys. Res. Lett. 2008, 35, L20403. [Google Scholar] [CrossRef] [Green Version]
  71. Jaiswal, R.K.; Lohani, A.K.; Tiwari, H.L. Statistical analysis for change detection and trend assessment in climatological parameters. Environ. Proc. 2015, 2, 729–749. [Google Scholar] [CrossRef] [Green Version]
  72. Jiang, Y.; Luo, Y.; Zhao, Z.; Tao, S. Changes in wind speed over China during 1956–2004. Theor. Appl. Climatol. 2010, 99, 421–430. [Google Scholar] [CrossRef]
  73. Zhang, R.; Zhang, S.; Luo, J.; Han, Y.; Zhang, J. Analysis of near-surface wind speed change in China during 1958-2015. Theor. Appl. Climatol. 2019, 137, 2785–2801. [Google Scholar] [CrossRef]
  74. Xiaomei, Y.; Zongxing, L.; Qi, F.; Yuanqing, H.; Wenlin, A.; Wei, Z.; Weihong, C.; Tengfei, Y.; Yamin, W.; Theakstone, W.H. The decreasing wind speed in southwestern China during 1969–2009, and possible causes. Quatern. Int. 2012, 263, 71–84. [Google Scholar] [CrossRef]
  75. Li, Z.; Yan, Z.; Tu, K.; Liu, W.; Wang, Y. Changes in wind speed and extremes in Beijing during 1960–2008 based on homogenized observations. Adv. Atmos. Sci. 2011, 28, 408–420. [Google Scholar] [CrossRef]
  76. Guo, H.; Xu, M.; Hu, Q. Changes in near-surface wind speed in China: 1969-2005. Int. J. Climatol. 2011, 31, 349–358. [Google Scholar] [CrossRef]
  77. Wever, N. Quantifying trends in surface roughness and the effect on surface wind speed observations. J. Geophys. Res.-Atmos. 2012, 117, D11104. [Google Scholar] [CrossRef] [Green Version]
  78. Vautard, R.; Cattiaux, J.; Yiou, P.; Thépaut, J.-N.; Ciais, P. Northern hemisphere atmospheric stilling partly attributed to an increase in surface roughness. Nat. Geosci. 2010, 3, 756–761. [Google Scholar] [CrossRef]
  79. Dadaser-Celik, F.; Cengiz, E. Wind speed trends over Turkey from 1975 to 2006. Int. J. Climatol. 2014, 34, 1913–1927. [Google Scholar] [CrossRef]
  80. Lin, C.; Yang, K.; Qin, J.; Fu, R. Observed coherent trends of surface and upper-air wind speed over China since 1960. J. Clim. 2013, 26, 2891–2903. [Google Scholar] [CrossRef] [Green Version]
  81. Fu, G.; Yu, J.; Zhang, Y.; Hu, S.; Ouyang, R.; Liu, W. Temporal variation of wind speed in China for 1961–2007. Theor. Appl. Climatol. 2011, 104, 313–324. [Google Scholar] [CrossRef]
  82. Pryor, S.C.; Barthelmie, R.J. Climate change impacts on wind energy: A review. Renew. and Sust. Energ. Rev. 2010, 14, 430–437. [Google Scholar] [CrossRef]
  83. Romanic, D.; Hangan, H.; Ćurić, M. Wind climatology of toronto based on the NCEP/NCAR reanalysis 1 data and its potential relation to solar activity. Theor. Appl. Climatol. 2018, 131, 827–843. [Google Scholar] [CrossRef]
  84. Tang, B.; Tong, L.; Kang, S.; Zhang, L. Impacts of climate variability on reference evapotranspiration over 58 years in the Haihe river basin of north China. Agric. Water. Manag. 2011, 98, 1660–1670. [Google Scholar] [CrossRef]
  85. McVicar, T.R.; Roderick, M.L.; Donohue, R.J.; Li, L.T.; van Niel, T.G.; Thomas, A.; Grieser, J.; Jhajharia, D.; Himri, Y.; Mahowald, N.M.; et al. Global review and synthesis of trends in observed terrestrial near-surface wind speeds: Implications for evaporation. J. Hydrol. 2012, 416–417, 182–205. [Google Scholar] [CrossRef]
  86. Wu, J.; Zha, J.; Zhao, D.; Yang, Q. Changes in terrestrial near-surface wind speed and their possible causes: An overview. Clim. Dyn. 2018, 51, 2039–2078. [Google Scholar] [CrossRef] [Green Version]
  87. de Lemos, L.O.; Júnior, A.C.O.; Mendonça, F. Urban canyon in the CBD of Rio de Janeiro (Brazil): Thermal profile of Avenida Rio Branco during summer. Atmosphere 2021, 13, 27. [Google Scholar] [CrossRef]
Figure 1. Location of the study area.
Climate 11 00069 g001
Figure 2. Annual wind roses with wind speed (m/s) and direction for Castro (a), Curitiba (b), and Paranaguá (c).
Climate 11 00069 g002
Figure 3. Wind roses with wind speed (m/s) and direction (%) for spring and summer in Castro (a,d), Curitiba (b,e), and Paranaguá (c,f), respectively.
Climate 11 00069 g003
Figure 4. Wind roses with wind speed (m/s) and direction (%) for autumn and winter in Castro (a,d), Curitiba (b,e), and Paranaguá (c,f), respectively.
Climate 11 00069 g004
Figure 5. Run test results in the annual scale.
Climate 11 00069 g005
Figure 6. Run test results in the seasonal scale.
Climate 11 00069 g006
Figure 7. Representation of ruptures (Pettitt test) verified in time series of seasonal wind speed (m/s) in Curitiba and Paranaguá (Paraná, Brazil). Legend: *** = 99.9% significance; ** = 99% significance; p.VA = significance level. In bold the results with statistical significance.
Climate 11 00069 g007
Table 1. Geographic location, altitude, and failures of the meteorological stations Castro, Curitiba, and Paranaguá.
OMM
Code
Meteorological StationsDistance to the Coastline (km)Lat.
(S)
Lon.
(W)
Altitude
(m)
Missing Data (%)
83813Castro18024.7849.99994.710.0
83842Curitiba7525.4349.269231.9
83844Paranaguá025.2348.514.510.5
Table 2. Classification of ZMK value in the 90% confidence interval.
CategoriesScales
Significant increasing trendZMK > +1.64
Non-significant increasing trendZMK < +1.64
No trendZMK = 0
Non-significant decreasing trendZMK > −1.64
Significant decreasing trendZMK < −1.64
Table 3. Distribution of the meteorological systems that influenced southern Brazil during 2004, 2005, 2008, 2009, and 2010.
Years/
Months
JanuaryFebruaryMarchAprilMayJuneJulyAugustSeptemberOctoberNovemberDecember
20041, 21, 21, 2, 6111, 21, 21, 21, 61, 31, 31, 2
20051, 21, 2, 41, 21, 21, 31, 51, 21, 2, 61, 61, 61, 21, 2
20081, 21, 6, 7, 81, 2, 81, 5, 6, 81, 61, 5, 61, 91, 91, 61, 51, 81, 2, 8
20091, 8, 91, 81, 2, 81, 2, 8, 91, 5, 81, 2, 611, 81, 91, 51, 5, 91, 5, 7
20101, 51, 51, 8, 911, 81, 5, 8, 91, 91, 21, 5, 81, 2, 5, 61, 2, 91, 5, 7, 9
Legend: 1—frontal systems, 2—SASA, 3—MCC (mesoscale convective complex), 4—AB (atmospheric blocks), 5—LLJ (low-level jets), 6—extratropical cyclones, 7—SACZ (South Atlantic convergence zone), 8—UTCV (upper tropospheric cyclonic vortex), 9—subtropical jet.
Table 4. Annual wind speed trend according to the Mann–Kendall test and break point detection (CPI) of the Pettitt test.
Meteorological StationsMann–Kendall TestPettitt Test
TAUp.VAAnnual ZMKKPOSp.VACPI
Castro−0.23360.0500 *−1.96160200.0614 +February—1995
Curitiba−0.18990.1117−1.59204110.0070 **January—1986
Paranaguá−0.13610.2559−1.1496310.5708February—2006
Legend: ** = 99% significance; * = 95% significance; + = 90% significance; TAU = curvature trend magnitude; p.VA = significance level; ZMK = parametrized statistical test; K = value that indicates the possibility of locating the point where the ruptures occurred in the series; POS = value that indicates the position of ruptures. In bold the results with statistical significance.
Table 5. Seasonal wind speed trend (ZMK) according to the Mann–Kendall test, change point detection (CPI) of the Pettitt test, and normality of the Shapiro–Wilk parametric test.
SeasonCastroCuritibaParanaguá
Mann–Kendall TestMann–Kendall TestMann–Kendall Test
TAUSeasonal ZMKTAUSeasonal ZMKTAUSeasonal ZMK
Summer−0.0169−1.90 +−0.0003−0.07−0.0018−0.56
Autumn−0.0230−2.36 *−0.0060−1.480.00100.40
Winter−0.0208−1.82 +−0.0060−1.40−0.0012−0.42
Spring−0.0143−1.89 +−0.0115−2.74 **−0.0105−2.63 **
SeasonPettitt testPettitt testPettitt test
Kp.VACPIKp.VACPIKp.VACPI
Summer1170.341819971470.0810 +19861020.67661999
Autumn1170.337819991770.0168 *1986780.68421985
Winter1240.251419962130.0014 **1988940.86122006
Spring1400.125819952270.0002 ***19861620.0574 +1992
SeasonShapiro–Wilk testShapiro–Wilk testShapiro–Wilk test
Wp.VAS or NS Wp.VAS or NS Wp.VAS or NS
Summer0.93500.1452NS0.76480.0000 ***S0.81670.0000 ***S
Autumn0.93610.0426 *S0.81410.0000 ***S0.74030.0000 ***S
Winter0.94370.0724 +S0.97930.7209NS0.59640.0000 ***S
Spring0.92820.0248 *S0.80650.0000 ***S0.70080.0000 ***S
Legend: *** = 99.9% significance; ** = 99% significance; * = 95% significance; + = 90% significance; TAU = curvature trend magnitude; p.VA = significance level; ZMK = parametrized statistical test; K = value that indicates the possibility of locating the point where the ruptures occurred in the series; POS = value that indicates the position of ruptures. Significant (S) and non-significant (NS). In bold the results with statistical significance.
Table 6. Monthly wind speed trend (ZMK) according to the Mann–Kendall test and break point detection (CPI) of Pettitt test.
MonthCastroCuritibaParanaguá
Mann–Kendall TestMann–Kendall TestMann–Kendall Test
TAUMensal ZMKTAUMensal ZMKTAUMensal ZMK
January−0.0139−1.460.00330.40−0.0040−0.80
February−0.0127−1.36−0.0019−0.560.00060.08
March−0.0233−3.22 **0.00060.10−0.0001−0.03
April−0.0224−2.07 *−0.0085−1.70 +0.00180.50
May−0.0140−1.84 +−0.0035−0.690.00190.57
June−0.0147−1.85 +−0.0047−0.940.00370.83
July−0.0146−1.20−0.0091−1.48−0.0001−0.01
August−0.0193−1.28−0.0034−0.420.00030.10
September−0.0199−1.66 +−0.0022−0.46−0.0032−0.72
October−0.0189−1.57−0.0133−2.66 **−0.0131−3.91 ***
November−0.0106−1.43−0.0103−2.27 *−0.0068−1.38
December−0.0131−1.16−0.0134−3.26 ***−0.0124−3.39 ***
MonthPettitt testPettitt testPettitt test
Kp.VACPIKp.VACPIKp.VACPI
January1120.399219961200.293019871040.55121984
February990.663819971660.0274 *1987770.73861990
March2380.0001 ***19881330.16981985640.37721981
April1290.206619991230.27302002570.20901985
May1180.332019951670.0238 *1985500.0848 +1987
June1270.211219971620.0346 *1986800.83341994
July990.661819961840.0108 *1987730.62802007
August1130.402019951720.0224 *1989740.66482006
September1190.311419951780.0128 *19851150.38282005
October1240.249019952000.0038 **19862220.0006 ***1992
November1170.359819951700.0230 *1986860.97421992
December700.554419872100.001 ***19862350.0002 ***1993
Legend: *** = 99.9% significance; ** = 99% significance; * = 95% significance; + = 90% significance; TAU = curvature trend magnitude; p.VA = significance level; ZMK = parametrized statistical test; K = value that indicates the possibility of locating the point where the ruptures occurred in the series. In bold the results with statistical significance. In bold the results with statistical significance.
Table 7. Shapiro–Wilk parametric test on the monthly scale for the meteorological stations.
MonthCastroCuritibaParanaguá
Wp.VAS or NSWp.VAS or NSWp.VAS or NS
January0.9620.240NS0.8450.000 ***S0.9320.030 *S
February0.9380.044 *S0.6670.000 ***S0.8690.001 ***S
March0.9690.396NS0.9510.109NS0.9050.005**S
April0.9330.031 *S0.6320.000 ***S0.8190.000 ***S
May0.8990.003 **S0.8490.000 ***S0.7410.000 ***S
June0.9240.016 *S0.9570.179NS0.8500.000 ***S
July0.9490.094 +S0.9520.118NS0.8550.000 ***S
August0.9260.020 *S0.8780.001 ***S0.7990.000 ***S
September0.9690.390NS0.9710.464S0.3140.000 ***S
October0.9640.290NS0.9440.068 +S0.9680.373NS
November0.9470.081 +S0.4150.000 ***S0.4460.000 ***S
December0.8790.001 **S0.9560.159NS0.9640.286NS
Legend: *** = 99.9% significance; ** = 99% significance; * = 95% significance; + = 90% significance; significant (S) and non-significant (NS). In bold the results with statistical significance.
Disclaimer/Publisher’s Note: The statements, opinions and data contained in all publications are solely those of the individual author(s) and contributor(s) and not of MDPI and/or the editor(s). MDPI and/or the editor(s) disclaim responsibility for any injury to people or property resulting from any ideas, methods, instructions or products referred to in the content.

