
Mediterranean Influence on the Climatic Regime over the Balkan Peninsula from 1901–2021

Department of Meteorology and Geophysics, Faculty of Physics, Sofia University St. Kliment Ohridski, 1504 Sofia, Bulgaria
*
Author to whom correspondence should be addressed.
Climate 2023, 11(3), 68; https://doi.org/10.3390/cli11030068
Submission received: 7 February 2023
/
Revised: 9 March 2023
/
Accepted: 11 March 2023
/
Published: 15 March 2023
(This article belongs to the Special Issue Climate Variability in the Mediterranean Region)
Abstract
:The Balkan Peninsula is a geographical region under various large-scale climatic influences, one of the most significant being the Mediterranean Sea in the southwest and the continent in the northeast. The novelty of this study is that the border between the zones with prevailing maritime or continental climate conditions is clearly identified by the month with the highest precipitation during the year. We use the gridded data product TS_4.06 of the Climatic Research Unit for monthly precipitation to identify the timing of the maximum rainfall at different locations. The grid boxes with highest precipitation in the cold part of the year (October to March) are considered to be under prevailing Mediterranean influences and, on the contrary, the ones with the highest precipitation are in the warm part of the year (April to September); these are climates with prevailing continental characteristics. In general, this border separates the zones with Cs and Dw types of climates. Its spatial variability at a decadal time-scale is discussed for the period from 1901–2021 and a general weakening of the Mediterranean influence over the Balkan Peninsula is found. However, for the last three decades, from 1991–2021, the tendency is the opposite. A periodicity of ~20 years is identified, suggesting that during the decade of 2020–2030, the Mediterranean influence in this region will dominate.
1. Introduction
The Balkan Peninsula is located in southeastern Europe in the area approximately closed between 15–30° E and 35–45° N. From a climatological point of view, this area lies in the transition between temperate and subtropical climatic zones; thus, the climate in the northern inland parts is classified as continental temperate, and the southern coastal parts are classified as maritime subtropical. According to the Köppen–Geiger climate classification, the two major climate classes are referred to as Cs and Dw [1,2].
There are two significant factors forming the precipitation regime in the Balkan Peninsula: the Mediterranean Sea’s influence, which is characterized by intense cyclonic activity and precipitation during winter (due to the seasonally enhanced Mediterranean depression in winter) and dry weather in summer; and, on the other hand, the Eurasian continental influence, leading to more rain in the warm part of the year (due to northern polar climatic front displacement and thermal convection) and cold stable conditions with less precipitation in winter.
However, the weight of these two factors varies over time; thus, the border between areas with Cs and Dw types of climate may experience significant spatial displacement. Located at the transition zone between these major climate classes, many locations will occasionally pass from a regime with highest precipitation in spring–summer to a regime with mostly rainfall (and snowfall) in autumn–winter. These are two very different seasonal variations and could impact the weather, agricultural activities, tourism, transport, and energy infrastructures in different manners. The objective of this paper is to analyze the fluctuations of this transition zone and to find regularities or long-term periods.
Most of the published studies of the precipitation in this region analyze the trends and variability in the annual amount of rainfall or extreme precipitation events [3,4,5,6,7,8,9,10,11,12,13,14]. In this work, we follow a different approach by investigating variations in the months when the highest and lowest monthly amount of precipitation is observed.
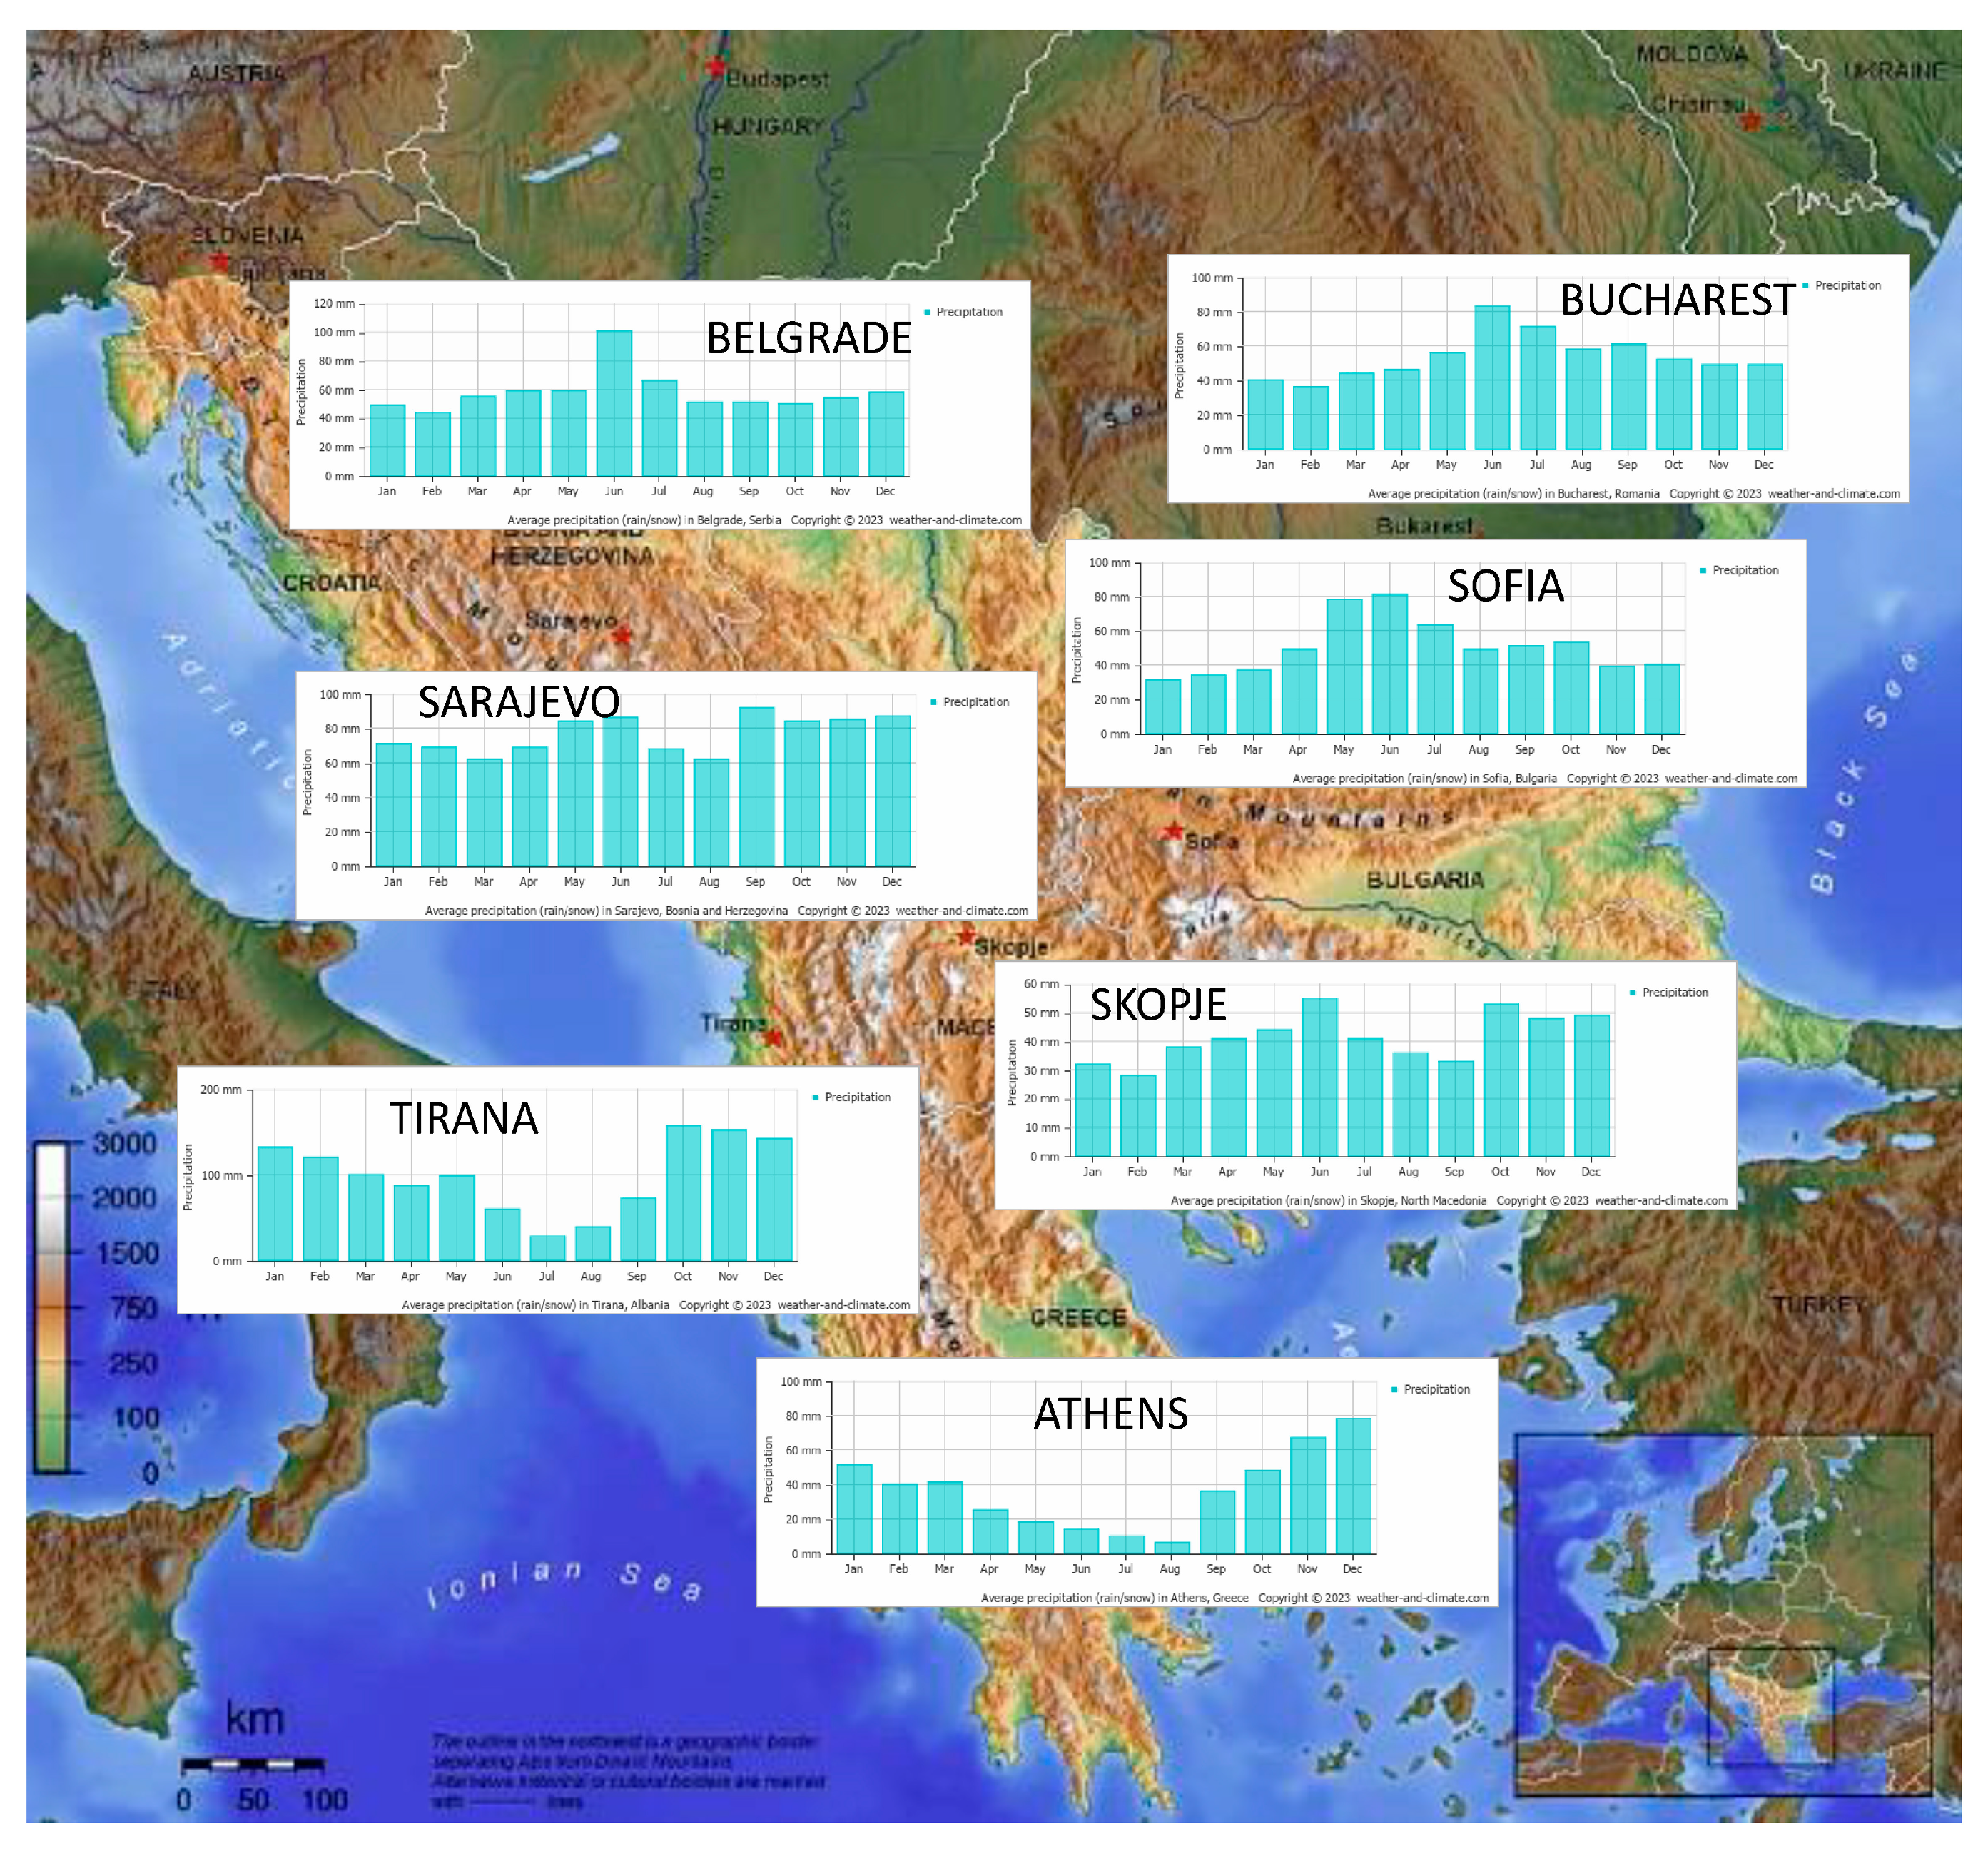
Figure 1 shows the geographical position of the Balkans, and the typical seasonal variations of precipitation are shown on the superimposed climographs of some of the largest cities with long records of observation: Bucharest, Belgrade, Sofia, Skopje, Sarajevo, Tirana, and Athens. The climographs are taken from the website www.weather-and-climate.com (accessed on 1 March 2023); they are based on the European Center for Medium-Range Weather Forecast products and refer to the period from 1991–2020.
It is seen that the month of highest precipitation varies across the Peninsula: for the locations near the Mediterranean Sea, it is late autumn–winter (November and December in Athens, Skopje, and Tirana); for the locations inland, it is during summer (June and July in Sofia, Belgrade, and Bucharest). There are also transition areas where the precipitation shows double concurrent maxima, both in summer and winter (such as Sarajevo, for example). On the other end is the month of lowest precipitation, which is very characteristic for the Mediterranean type of climate—a distinct minimum in summer months. Such a pronounced feature can be observed in the climographs of Athens and Tirana, but in other locations, the month of minimum precipitation varies and cannot be attributed to a concrete season.
Thus, it appears that the month with the highest precipitation could be used to define the extent of the Mediterranean Sea’s influence over the Balkans, and e.g., to distinguish between the areas with Cs and Dw types of climate. It is clear that the zones of winter and summer maximum of precipitation vary from year to year; this is indicative of the spread of the Mediterranean influence inland due to the Mediterranean cyclones’ intensity and trajectories. Most studies of the precipitation regime analyze the variability of the annual or seasonal amount of precipitation. We take a different approach focusing on the distribution of precipitation during the year; we use the month of maximal precipitation at different locations as an indicator of the penetration of Mediterranean influence toward the inland parts of the peninsula. Our analysis suggests that this border varies significantly from year to year; nevertheless, one can identify relatively long periods with broader and larger Mediterranean influence on the Balkans.
We complement this analysis with the annual temperature seasonal amplitude (the difference of the monthly mean temperature in the warmest and coldest months). This is known as Continentality Index (CI) and it is a good measure of the climate continentality: the larger the seasonal amplitude, the more continental the climate. In principle, in periods of intensified Mediterranean Sea influence, the seasonal amplitude of the temperature should decrease.
The maritime or continental characteristics are determined to a large extent by the general atmosphere circulation; thus, the role of the main climate centers of action in the region should also be considered.
2. Data Used in the Study
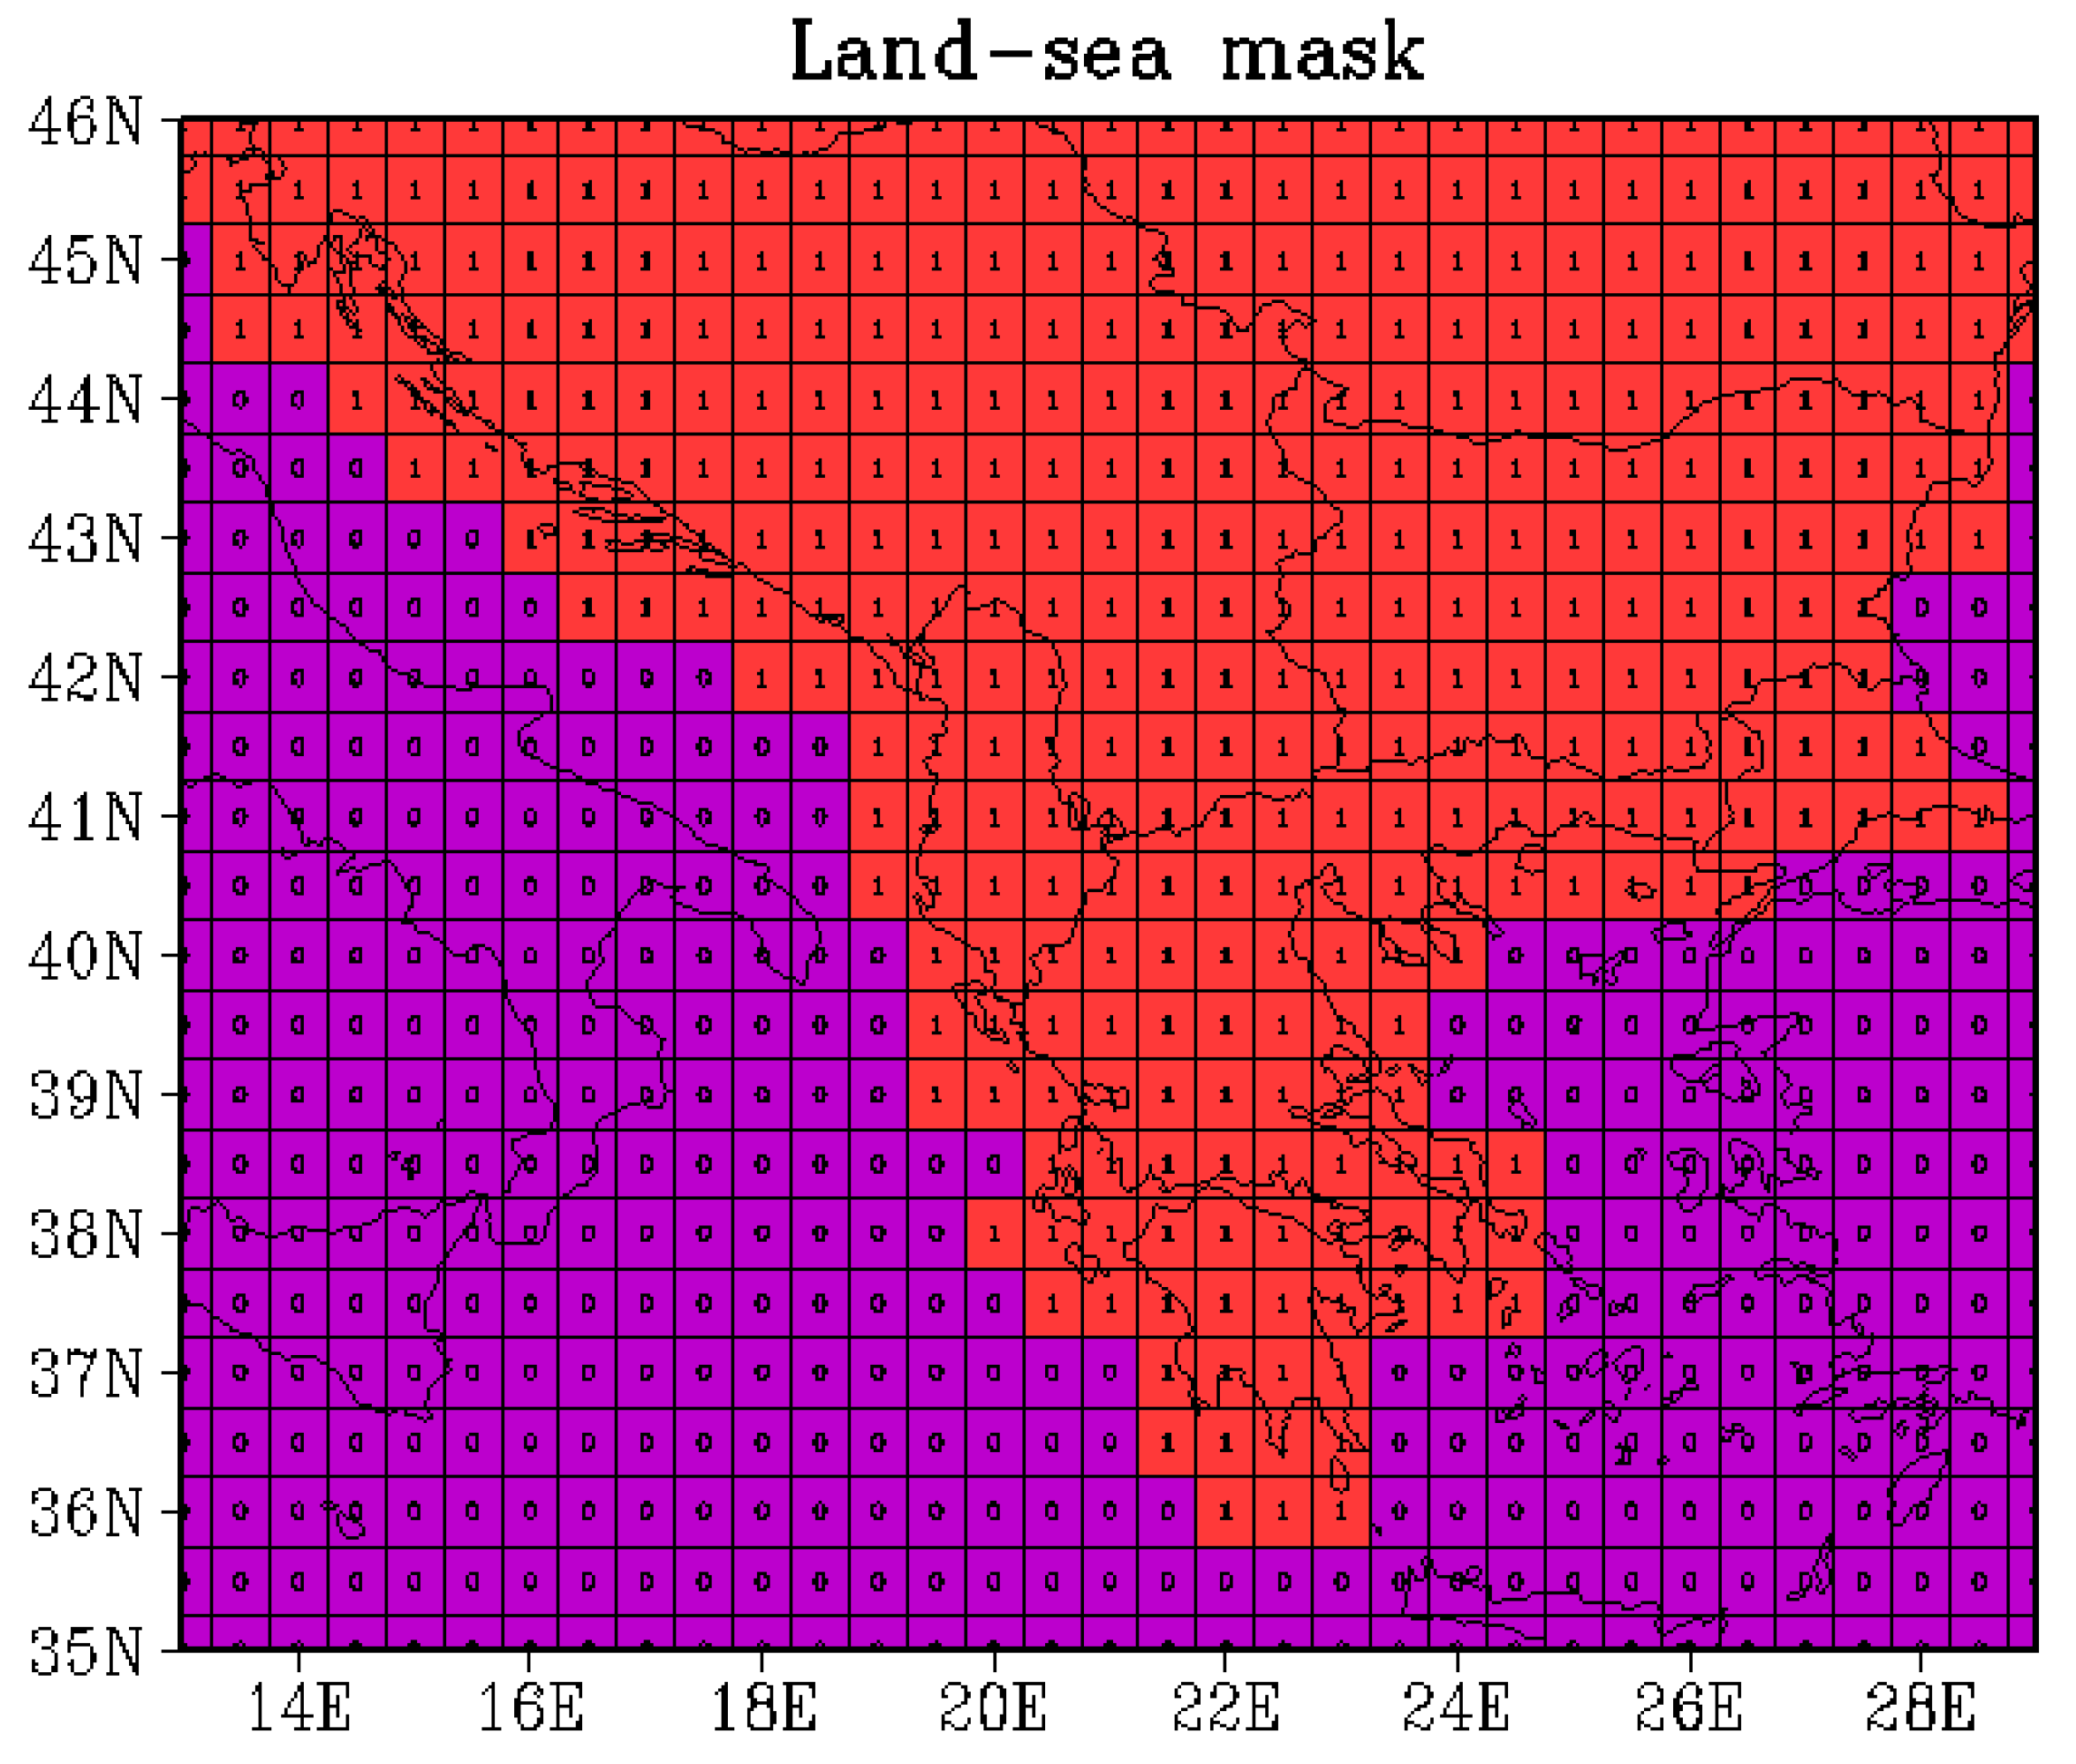
The main source of data used in this study is the Climatic Research Unit at the University of East Anglia (CRU) data product TS_4.06 [23]. It presents gridded data for the monthly mean 2 m air temperature and monthly precipitation for the period from January 1901–December 2021 globally on land with spatial resolution of 0.5°. From this global dataset, the data over the Balkan Peninsula are extracted (the land–sea mask of the used grid points is shown in Figure 2).
We validated the CRU TS.4.06 data product for the area of Bulgaria for the period from 1961–1990 using measurements from 135 stations in Bulgaria, provided by the Bulgarian National Institute of Meteorology and Hydrology (NIMH). These observation data are described in more detail in [24,25]. It was found that CRU data represent well the interannual variability of temperature and precipitation in Bulgaria, estimating the Pearson correlation coefficient between area mean annual temperature, annual sum of precipitation, and seasonal amplitude from both datasets to 0.96, 0.95, and 0.98, respectively. Similar comparisons have been performed by other authors in other regions [5,23]. Consequently, our conclusion is that these data are reliable for long-term analysis.
In order to identify the influence of the large-scale atmosphere circulation, we have used five general circulation indices. The data for the North Atlantic Oscillation (NAO) index, the Mediterranean Oscillation (MO) index, and the North Sea–Caspian Pattern (NSCP) are taken from the Climatic Research Unit of the University of East England [26]. The data for the Atlantic Multidecadal Oscillation (AMO) and the Scandinavian Pattern (SCA) are taken from the Physical Sciences Laboratory of the US National Oceanic and Atmospheric Administration [27].
3. Results
3.1. Averaged Maps of the Precipitation and CI for the Period of 1901–2021
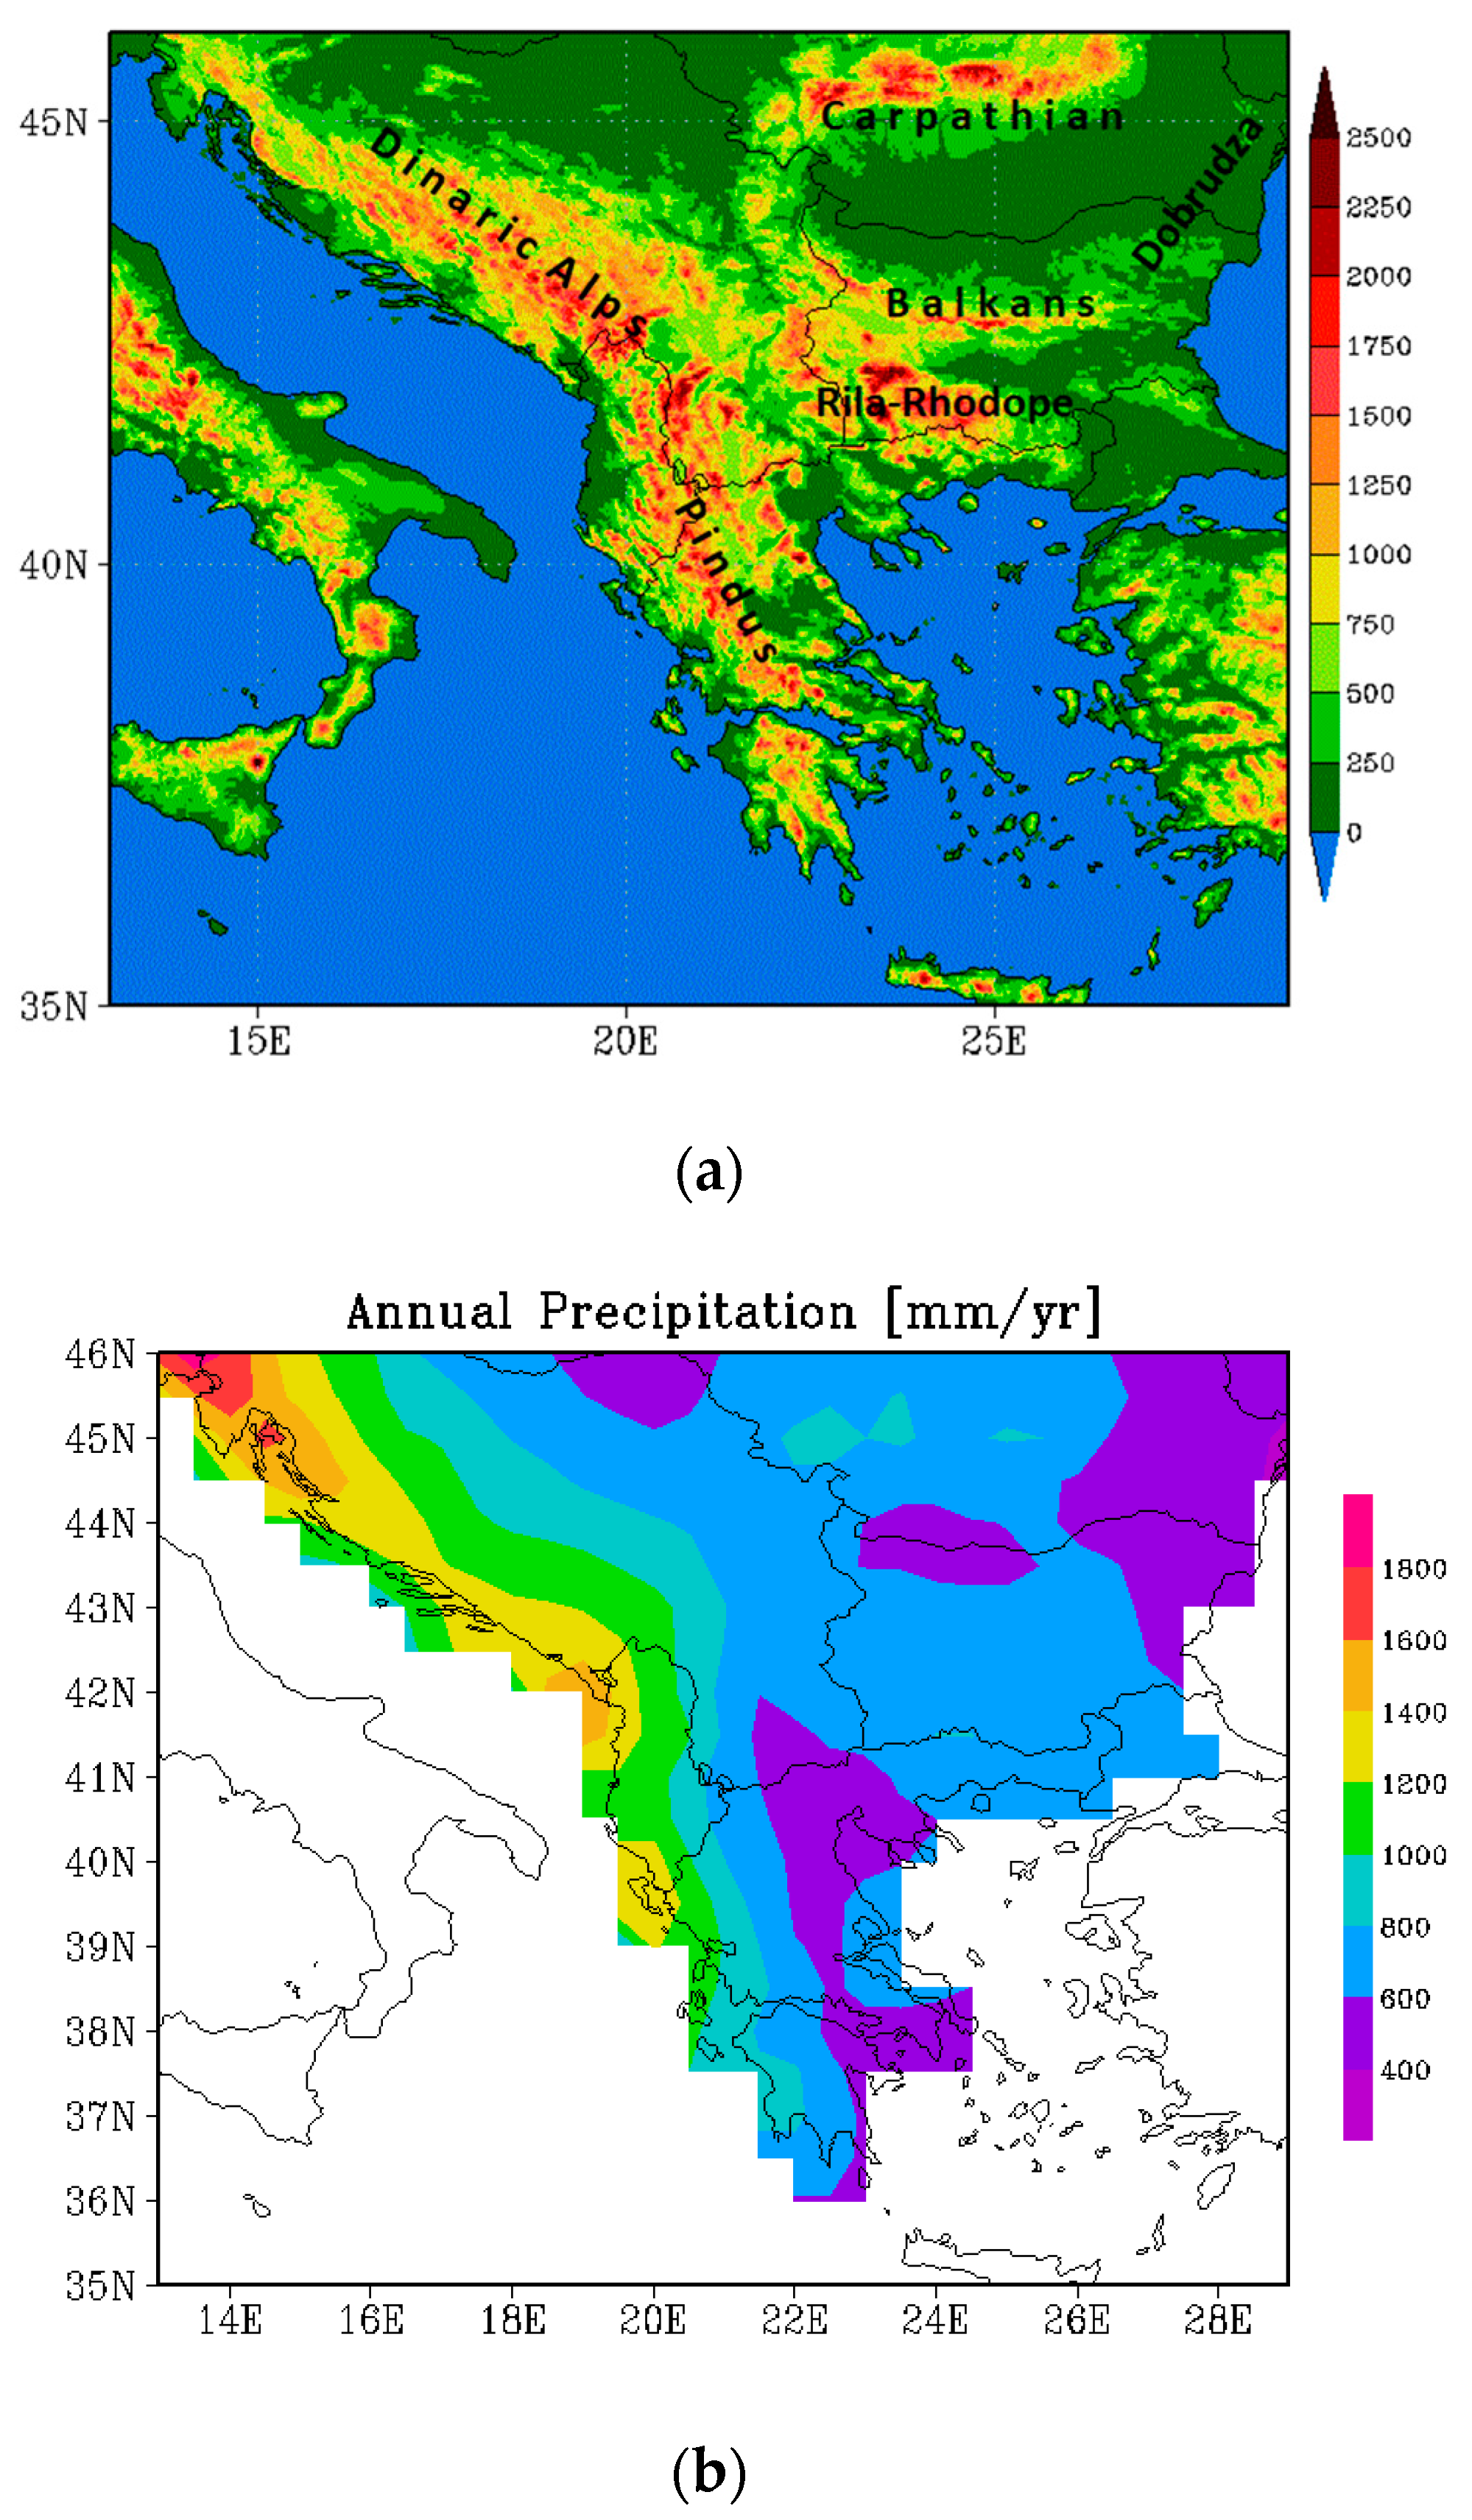
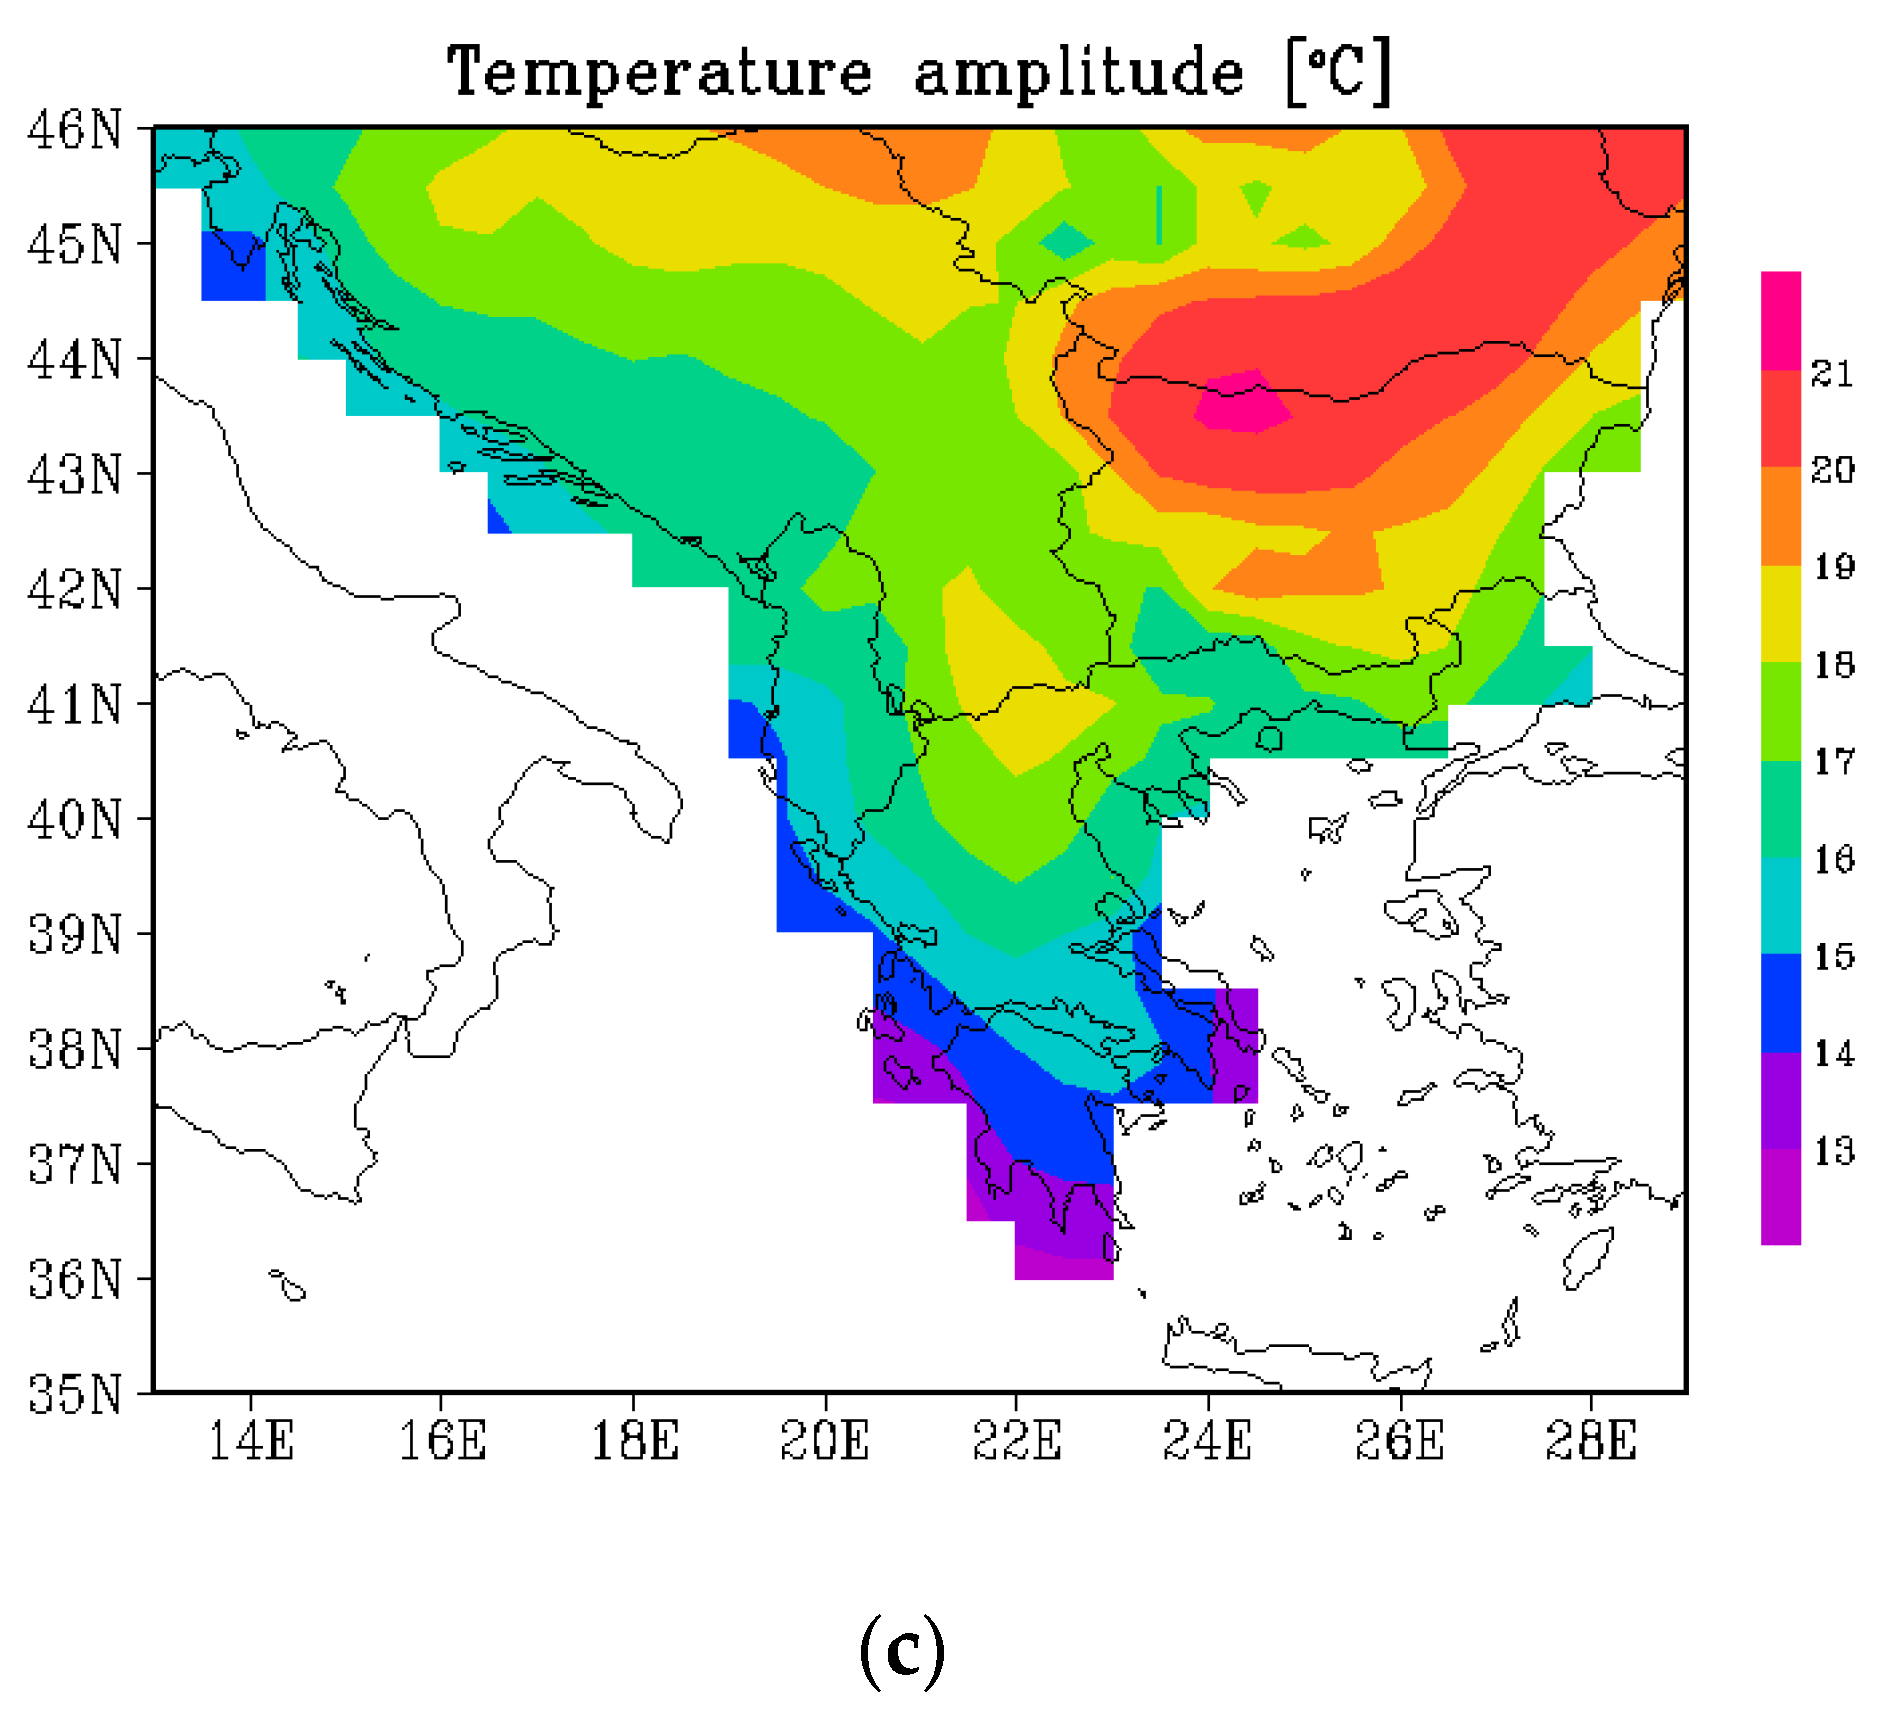
The averaged maps of the considered climate variables for the whole period of 1901–2021 are given in Figure 3 together with the surface elevation in order to check the orography influence. The annual sum of precipitation (Figure 3b) is highest over the Adriatic coast (>1000 mm/year) where the Dinar–Pindus Mountain chain favors the orography rainfall. Less precipitation is observed over northeastern parts in Dobrudza region and southeastern Greece (<400 mm/year). The annual amplitude of temperature (Figure 3b) is maximal in the inner northern parts and minimal over the Mediterranean coast, which reflects the tendency toward maritime or continental conditions.
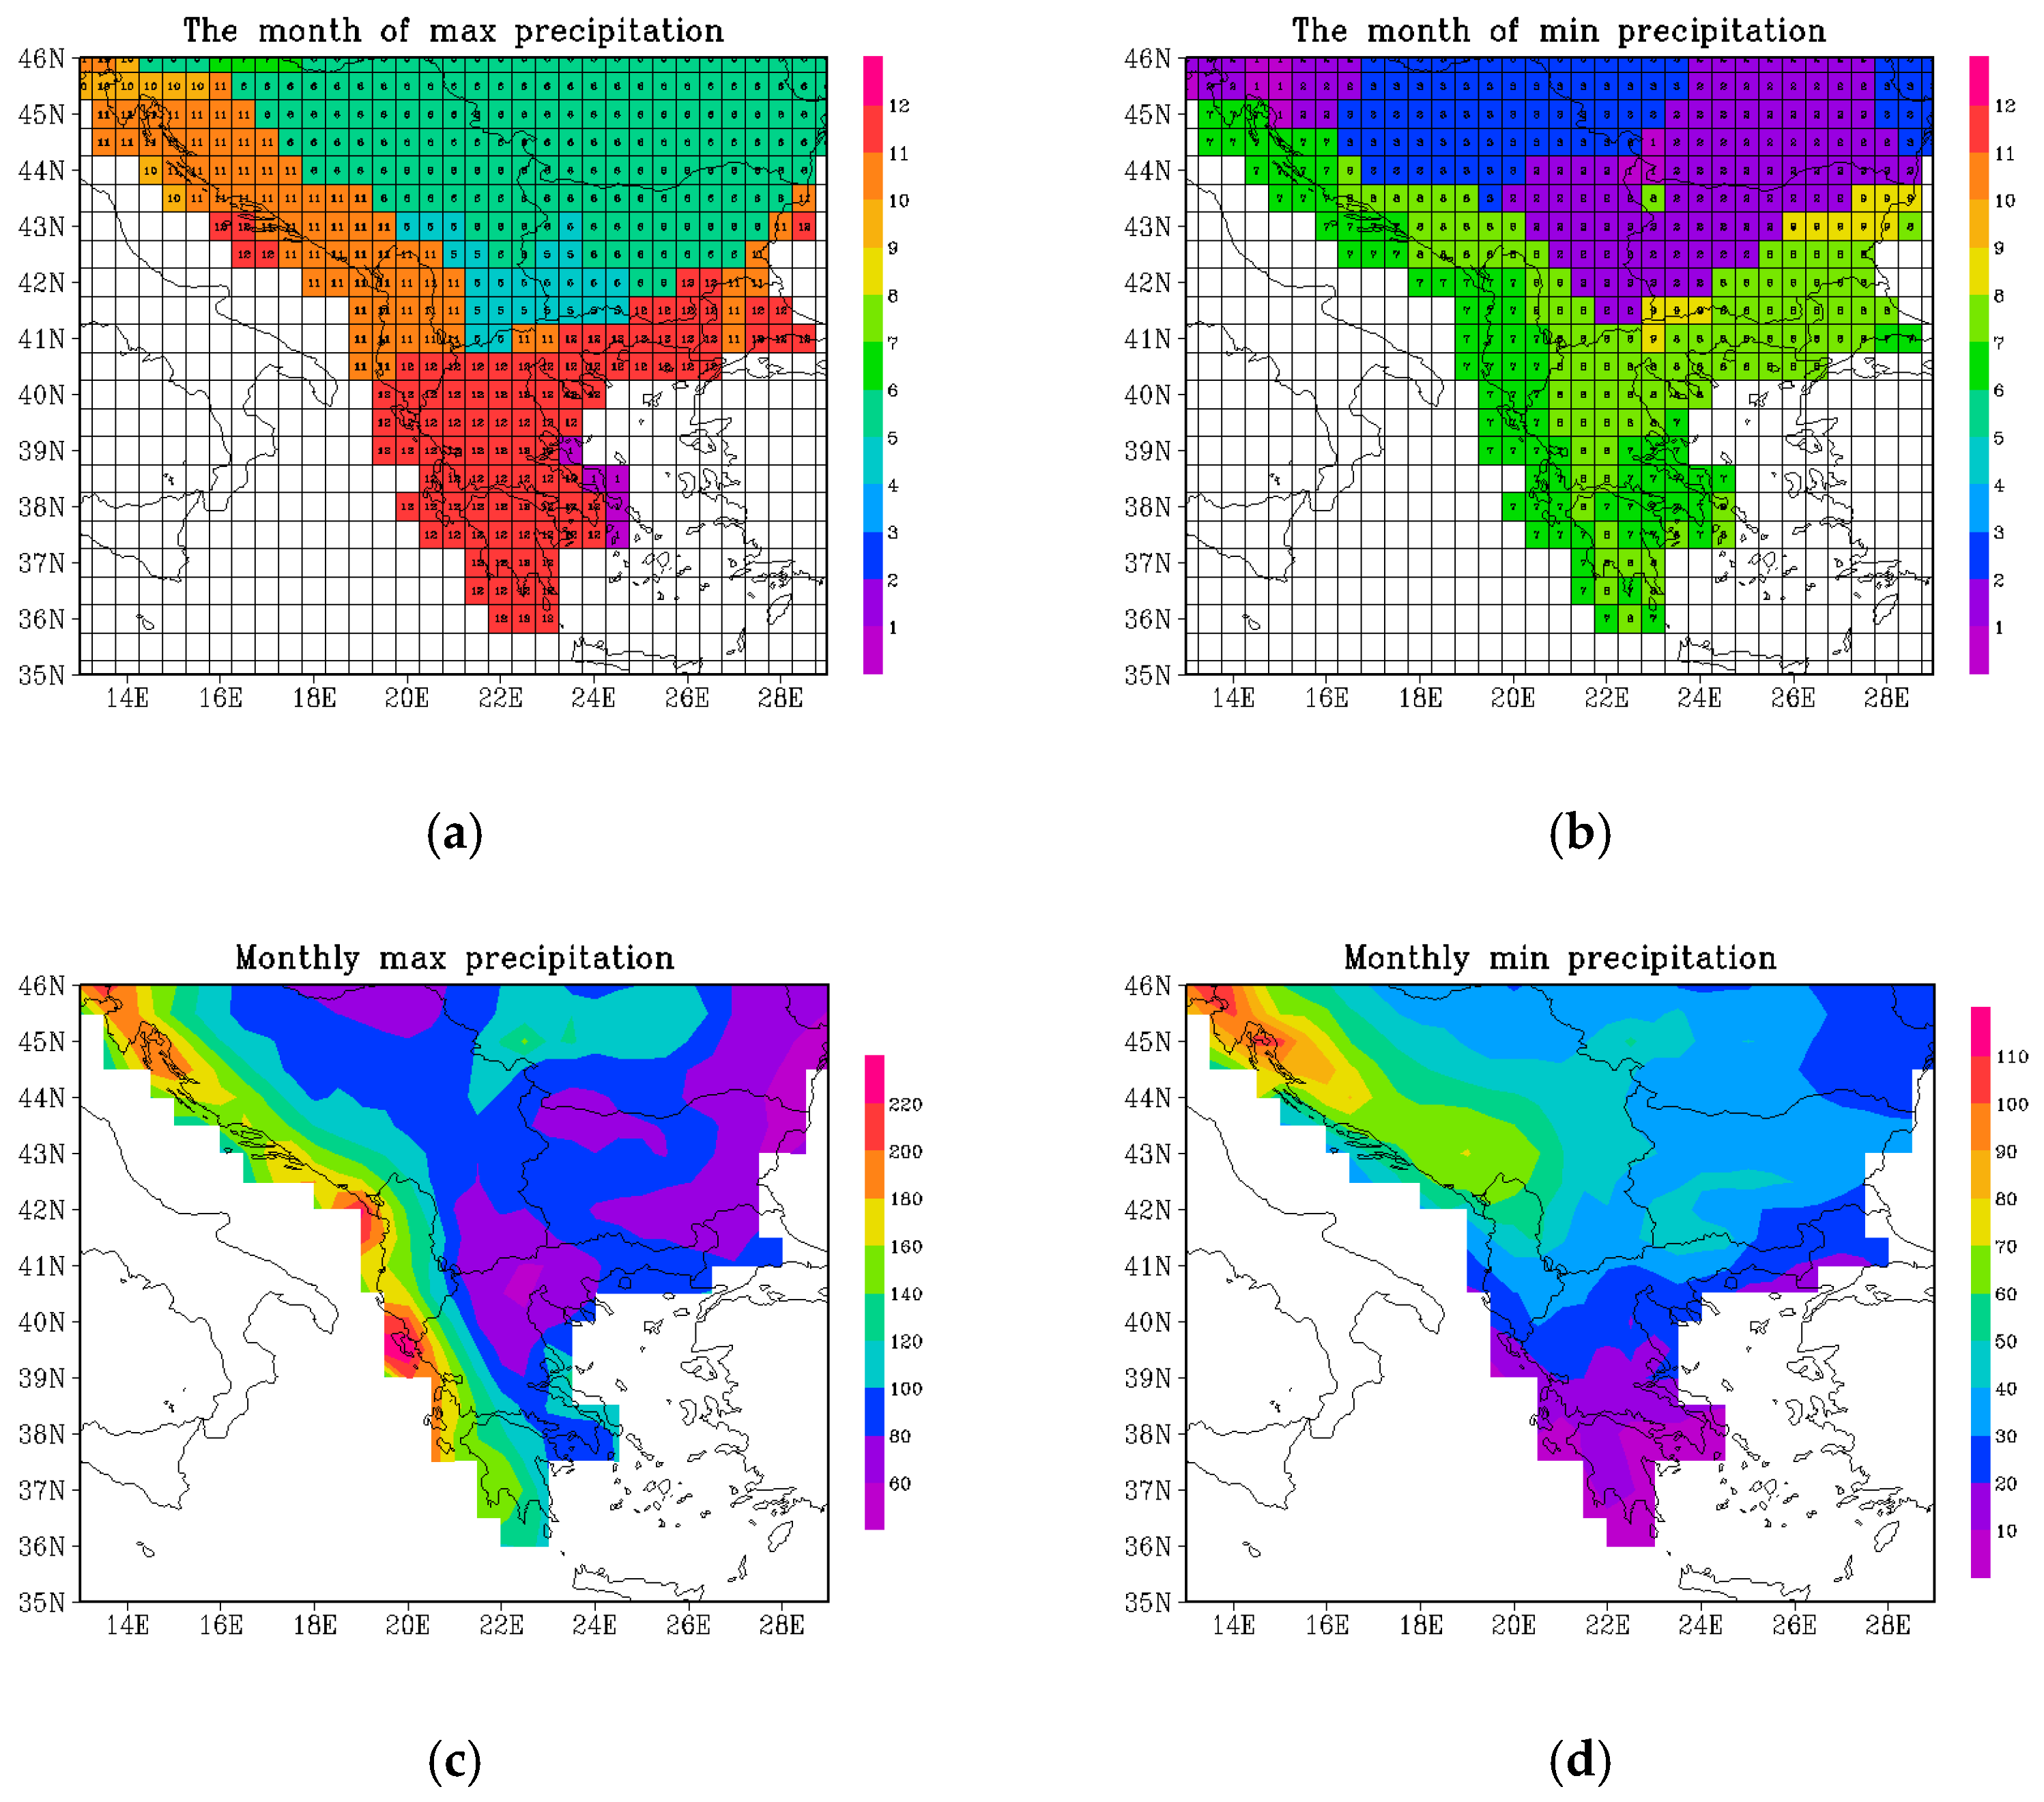
The next figure presents the characteristics of the seasonal variations in precipitation: the month of highest monthly precipitation (Figure 4a) and the lowest (Figure 4b). The months are indexed as they go in the year (1-January, 2-February, etc.). It is impressive to see the very clear border between zones where the rain is predominantly in the warm part of the year, and, respectively, in the cold part. The warm part is taken as the period between April and September, and the cold part is taken as the period between October and March. This border separates the Balkan Peninsula in two parts: southern with maximal precipitation during the year in late autumn–winter (10, 11, 12, 1, e.g., October, November, December, and January), and northern with maximal precipitation in spring–summer (5, 6, 7, 8, e.g., May, June, July, and August).
As for the month with minimal precipitation (Figure 4b), the border between zones with minimal precipitation in the warm and cold part of the year is similar to the one in Figure 4a. The south part presents the typical Mediterranean feature of minimum precipitation in the July, August, and September period (the numbers 7, 8, 9), and, on the contrary, in the northern part the least rain occurs during the months of January, February, and March (the numbers 1, 2, 3).
Basically, from these maps, the border between the zones with Cs and Dw types of climate in the Koppen–Geiger classification is well identified.
It is interesting to also analyze the amount of rain in the months of highest and lowest precipitation (Figure 4c,d). On the western coast, it rains significantly during the whole year (e.g., 200 vs. 100 mm/month for max and min value). The south of Greece is very dry in summer [28]; the region is known for a great number of wildfires in this part of the year [29].
The conclusion of this plot is that one can measure approximately the spatial extent of the Mediterranean Sea influence on the Balkan Peninsula by the time of the most precipitation in the year at different locations. The opposite characteristic, the month of minimum monthly precipitation, appears to be not so effective for this purpose, as it is much more variable and not a stable estimate.
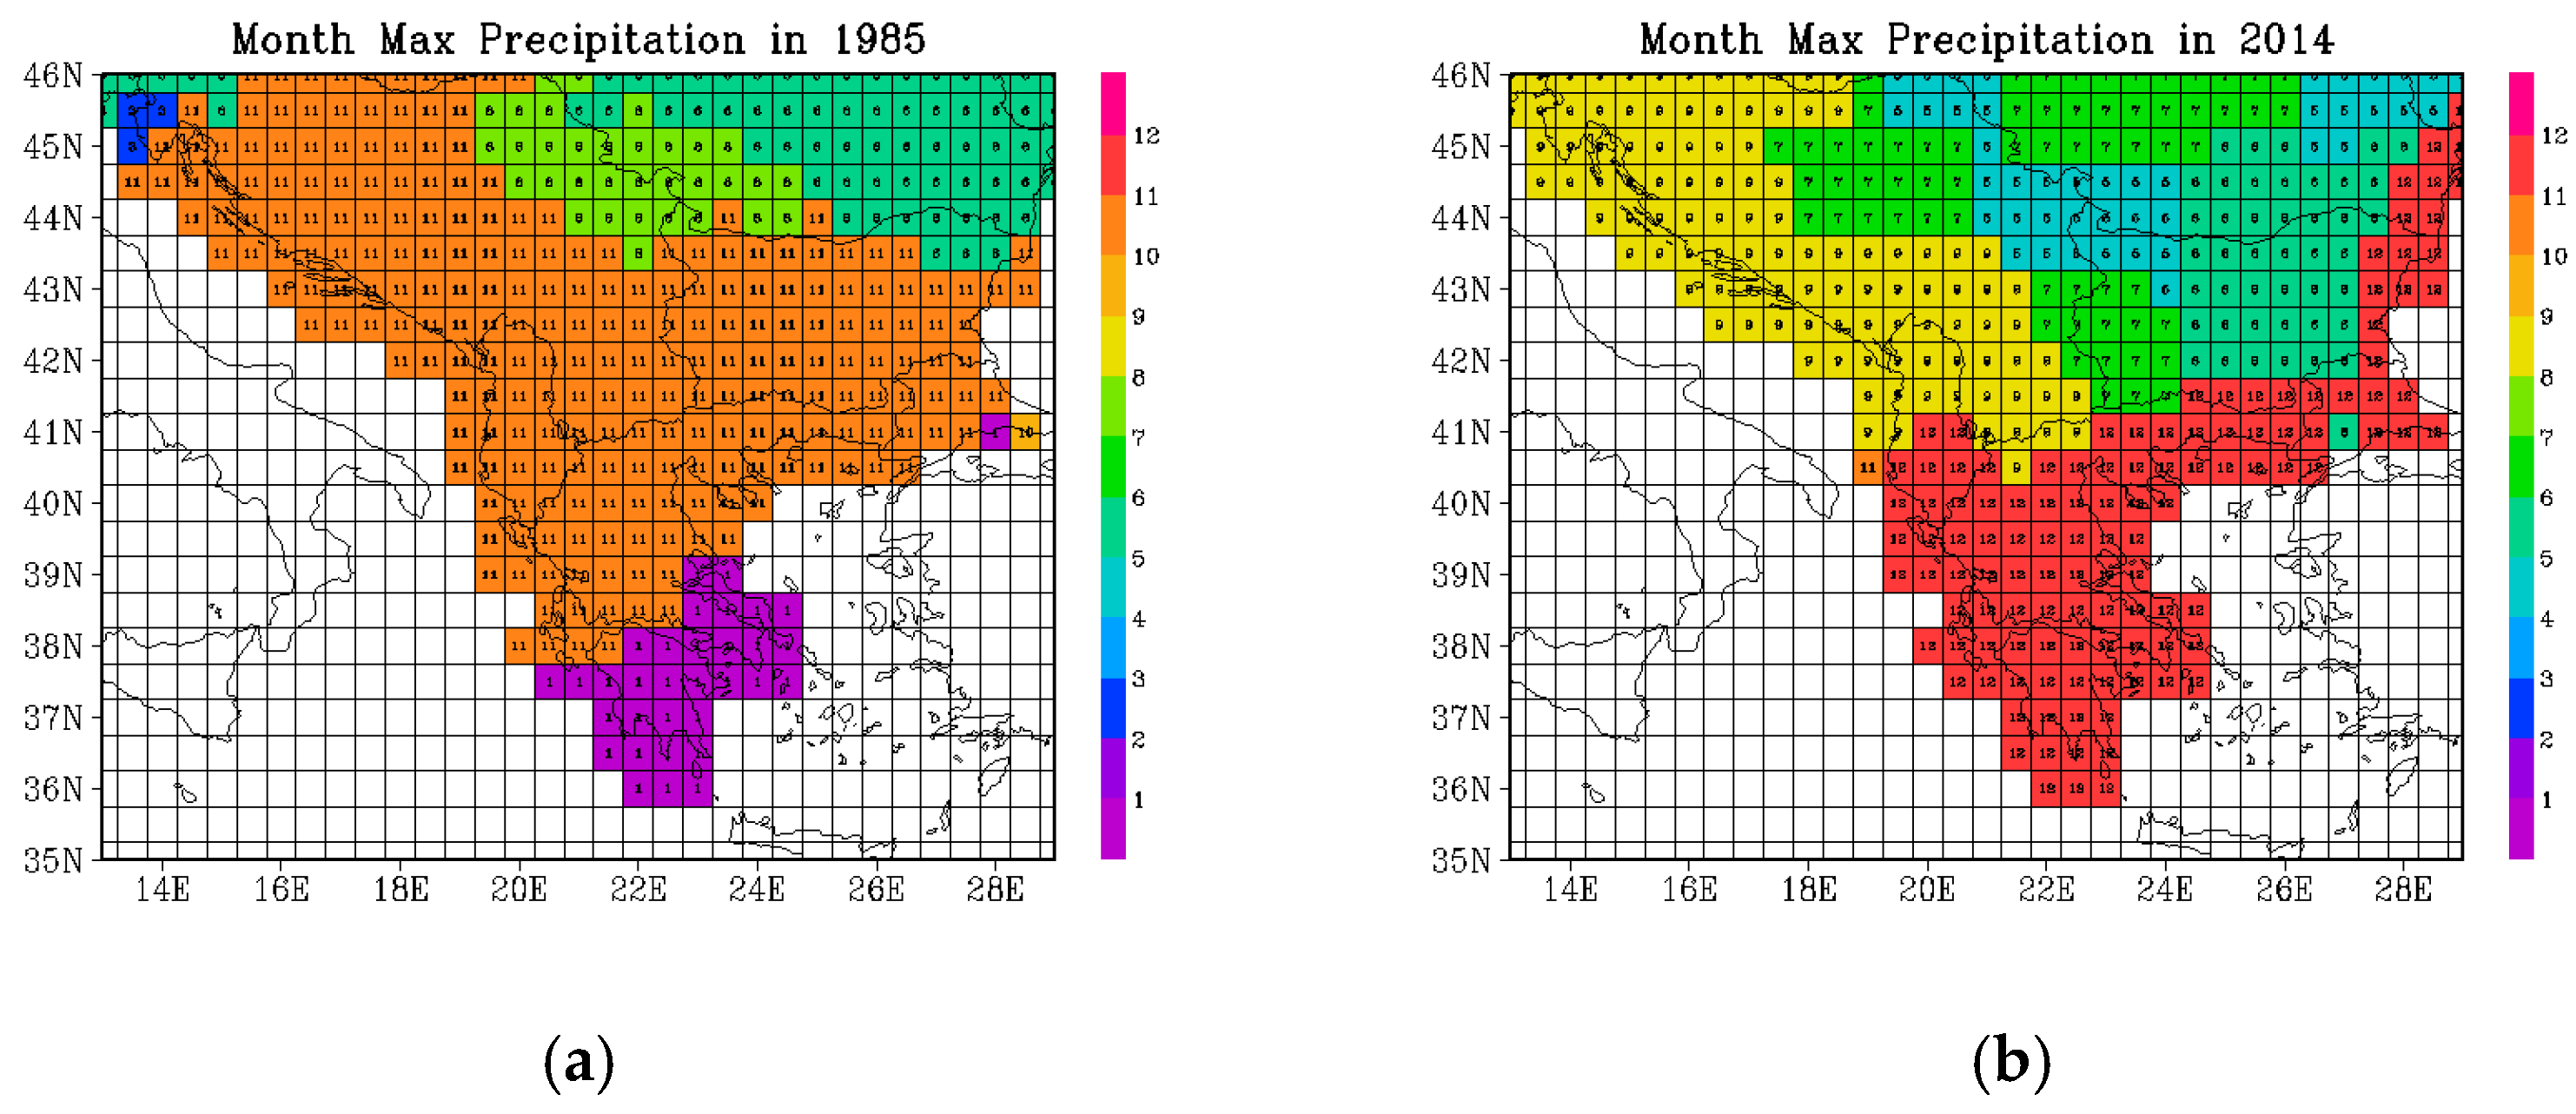
However, the border of highest winter and summer precipitation varies significantly from year to year, and our aim is to estimate its spatial variability. As an example, we show in Figure 5 two years with very different patterns, 1985 and 2014.
Both plots in Figure 5 present different positions of the zones with winter and summer maximum monthly precipitation. This border in 2014 is located more south than in 1985. One could conclude that in 1985, the Mediterranean influence was extended almost everywhere over the Balkans, and, on the contrary, in 2014 the continental influence was dominating.
3.2. Time Series of the Averaged Region Characteristics for the Period from 1901–2021
The aim of this paper is to investigate and find periodicity in the Mediterranean influence over the Balkan Peninsula climate; we will thus search for repeating patterns in the long-term series of the area mean estimates. We calculate the annual mean variables for each individual year and show the time series in Figure 6. For completeness, we have analyzed all available variables: annual mean 2 m temperature, the annual sum of precipitation, the temperature of the warmest and coldest months, the seasonal amplitude of temperature, the highest and lowest monthly precipitation, and the areas of winter maximum and summer minimum of precipitation. The most useful variables to indicate if the climate tends toward maritime or continental type are the seasonal temperature amplitude (Continentality Index) and the areas of winter maximum of the monthly precipitation.
Looking at the plots, there is obviously high and low frequency signal. In order to find decadal trends, we calculate the moving average with a window of nine years (shown with a red curve on the plots). This is performed to suppress the shorter period’s oscillations and to leave the signal of decadal scale. Then, we will be interested in the periodicity of these averaged time series.
The constructed time series are analyzed to detect linear trend and periodicity. In order to estimate the rate of linear tendencies and its significance, we use the Sen Slope estimator and the Mann–Kendall test. The statistical tests were carried out using the software R-3.6.0 and the R package Modifiedmk [30]. The periods are estimated from the spectral periodogram of the same software. The findings are summarized in Table 1. More details on the calculation of the linear trend and the spectral periodograms are given in the Supplementary Material Table S1 and Figure S1.
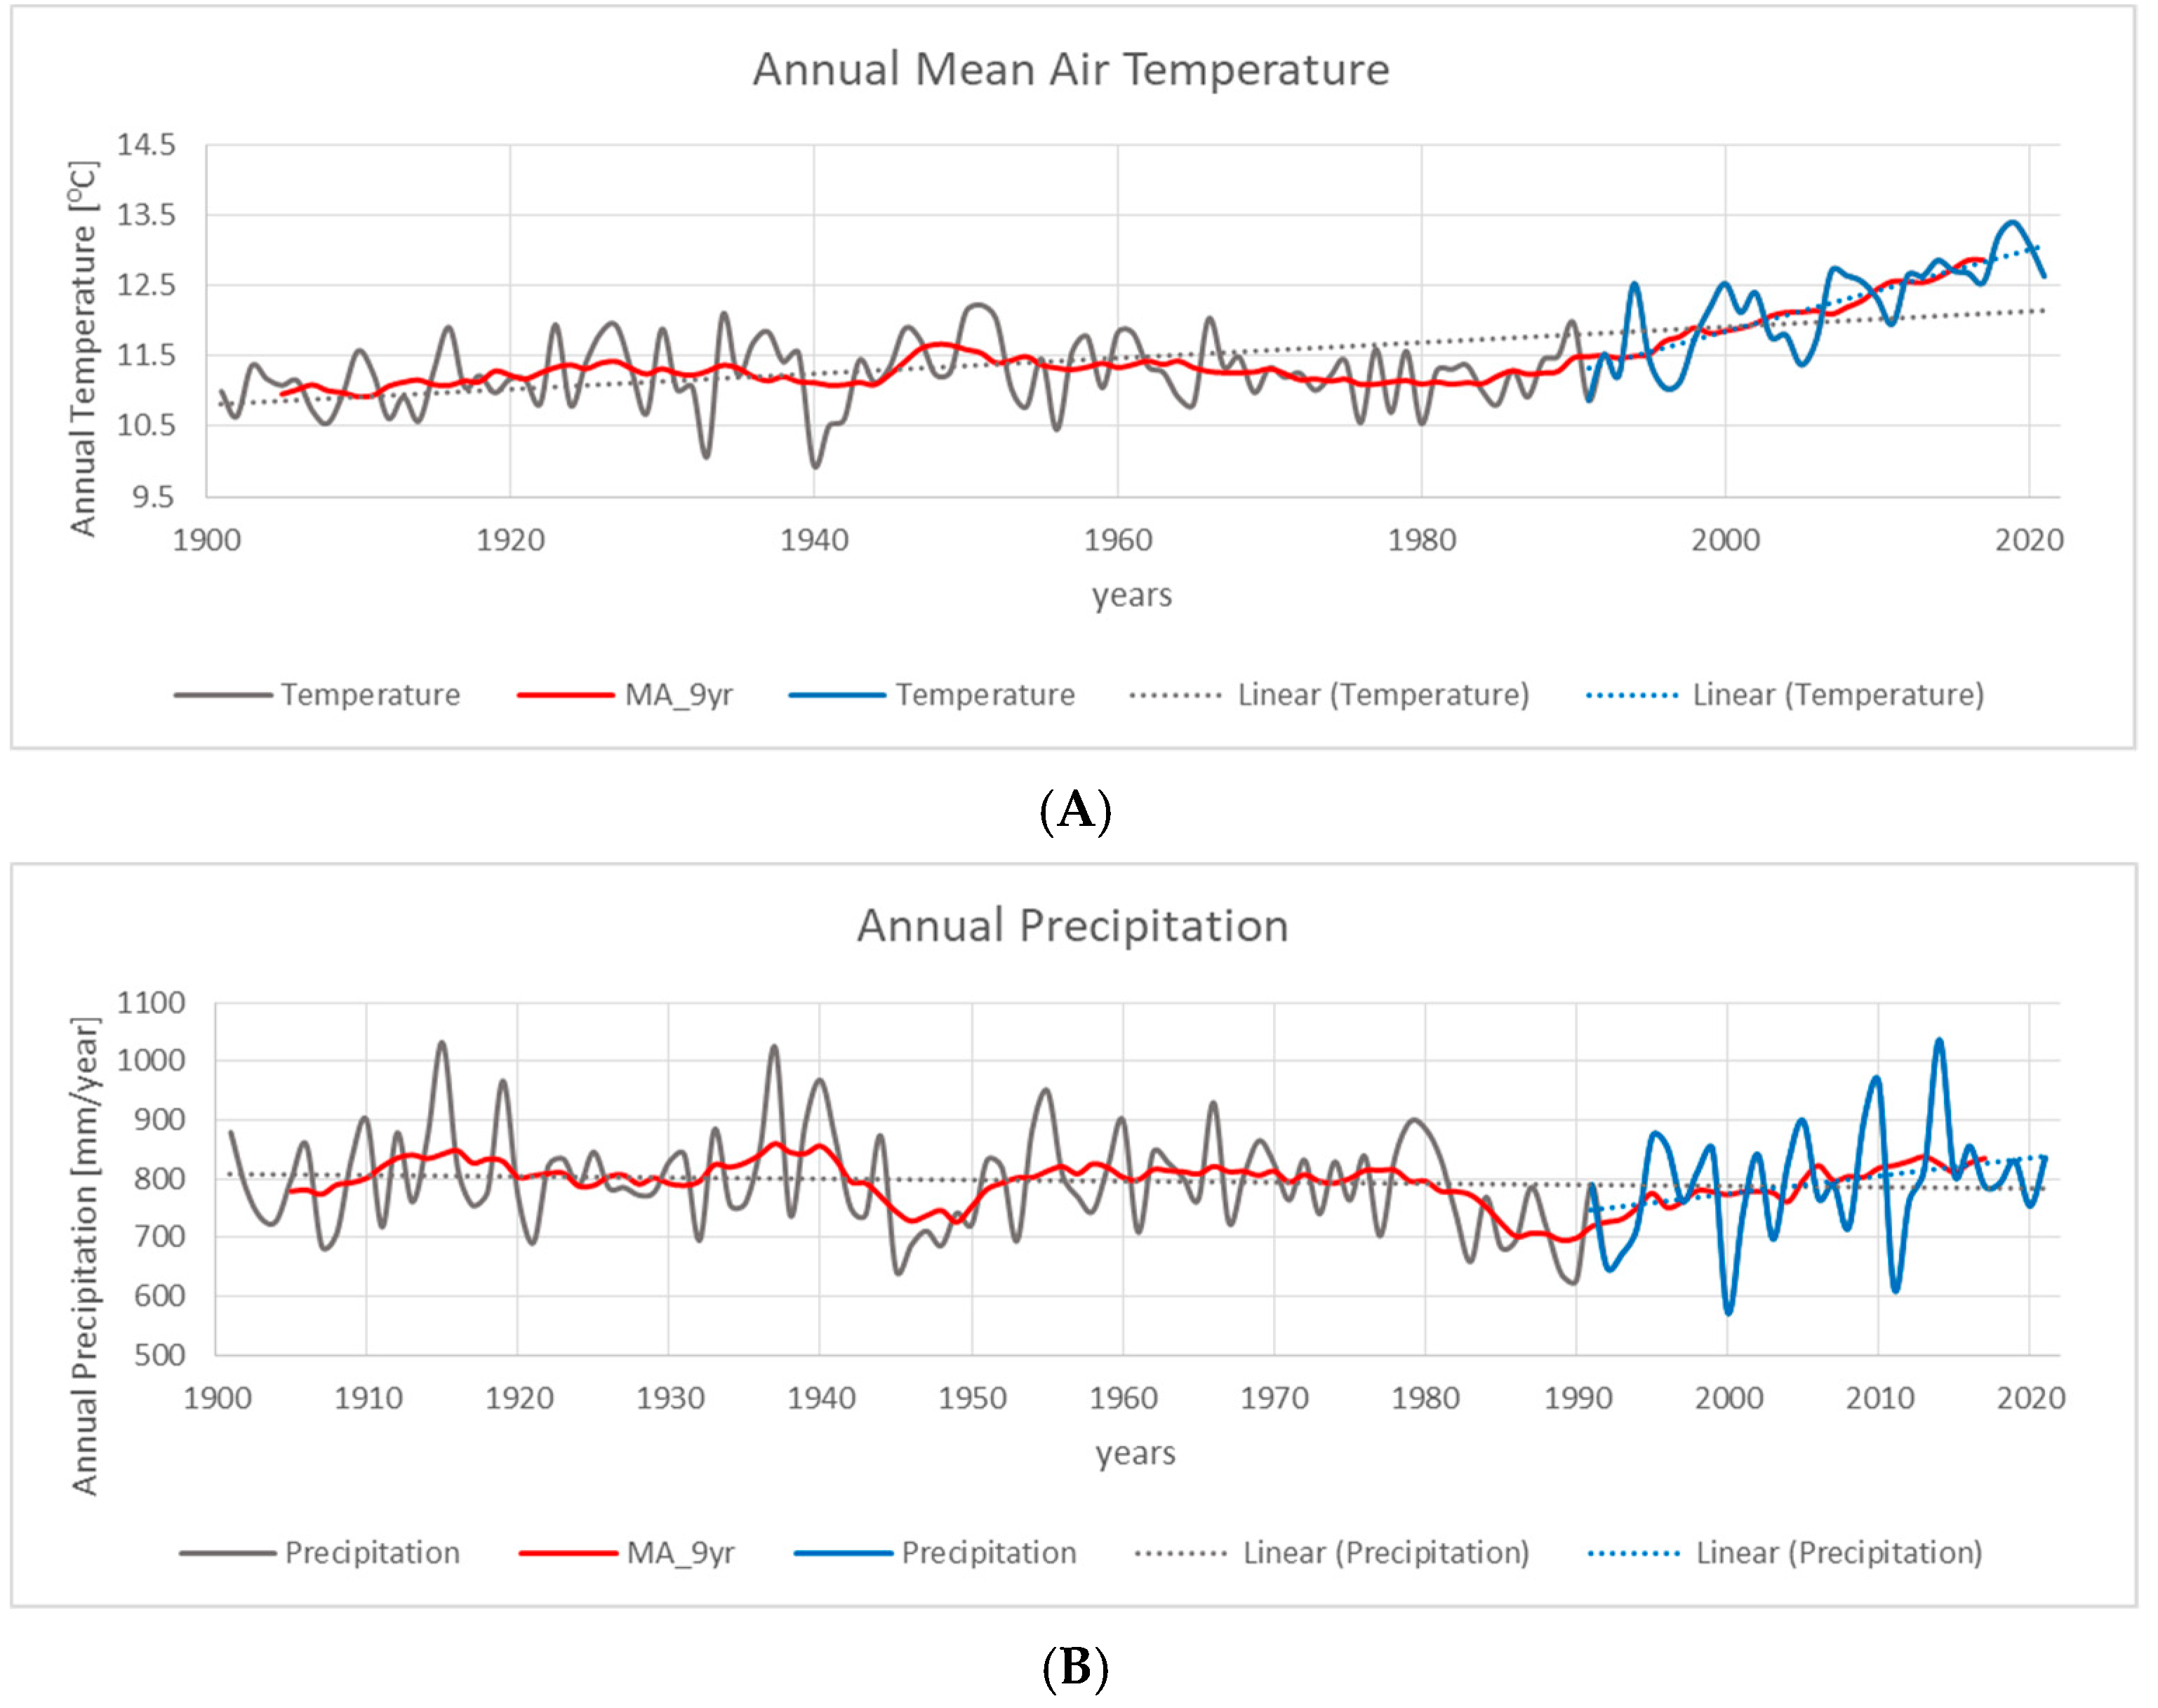
The first plot is the annual mean surface air temperature (Figure 6A) and the nine-year average is rather stable over time, constantly increasing in the last three decades. The results confirm the warming trend accelerating in the latest 30-year period, reported by other studies for Europe and for the region [3,6]. The stable average value indicates that the chosen moving average is reliable and could also be used for the other variables.
The annual sum of precipitation averaged for the area (Figure 6B) shows minima in the 1950s and 1990s of the last century and, since then, is generally increasing. The tendency for more rainfall in this region is even more evident in the last three decades. However, the estimated trend is not statistically significant at a confidence level of 95%. Other studies of the precipitation trend in the Mediterranean show a tendency for decrease in the annual precipitation in the majority of the Mediterranean regions (for example [3,5]). For most of Serbia [13], a positive trend was found in the annual precipitation.
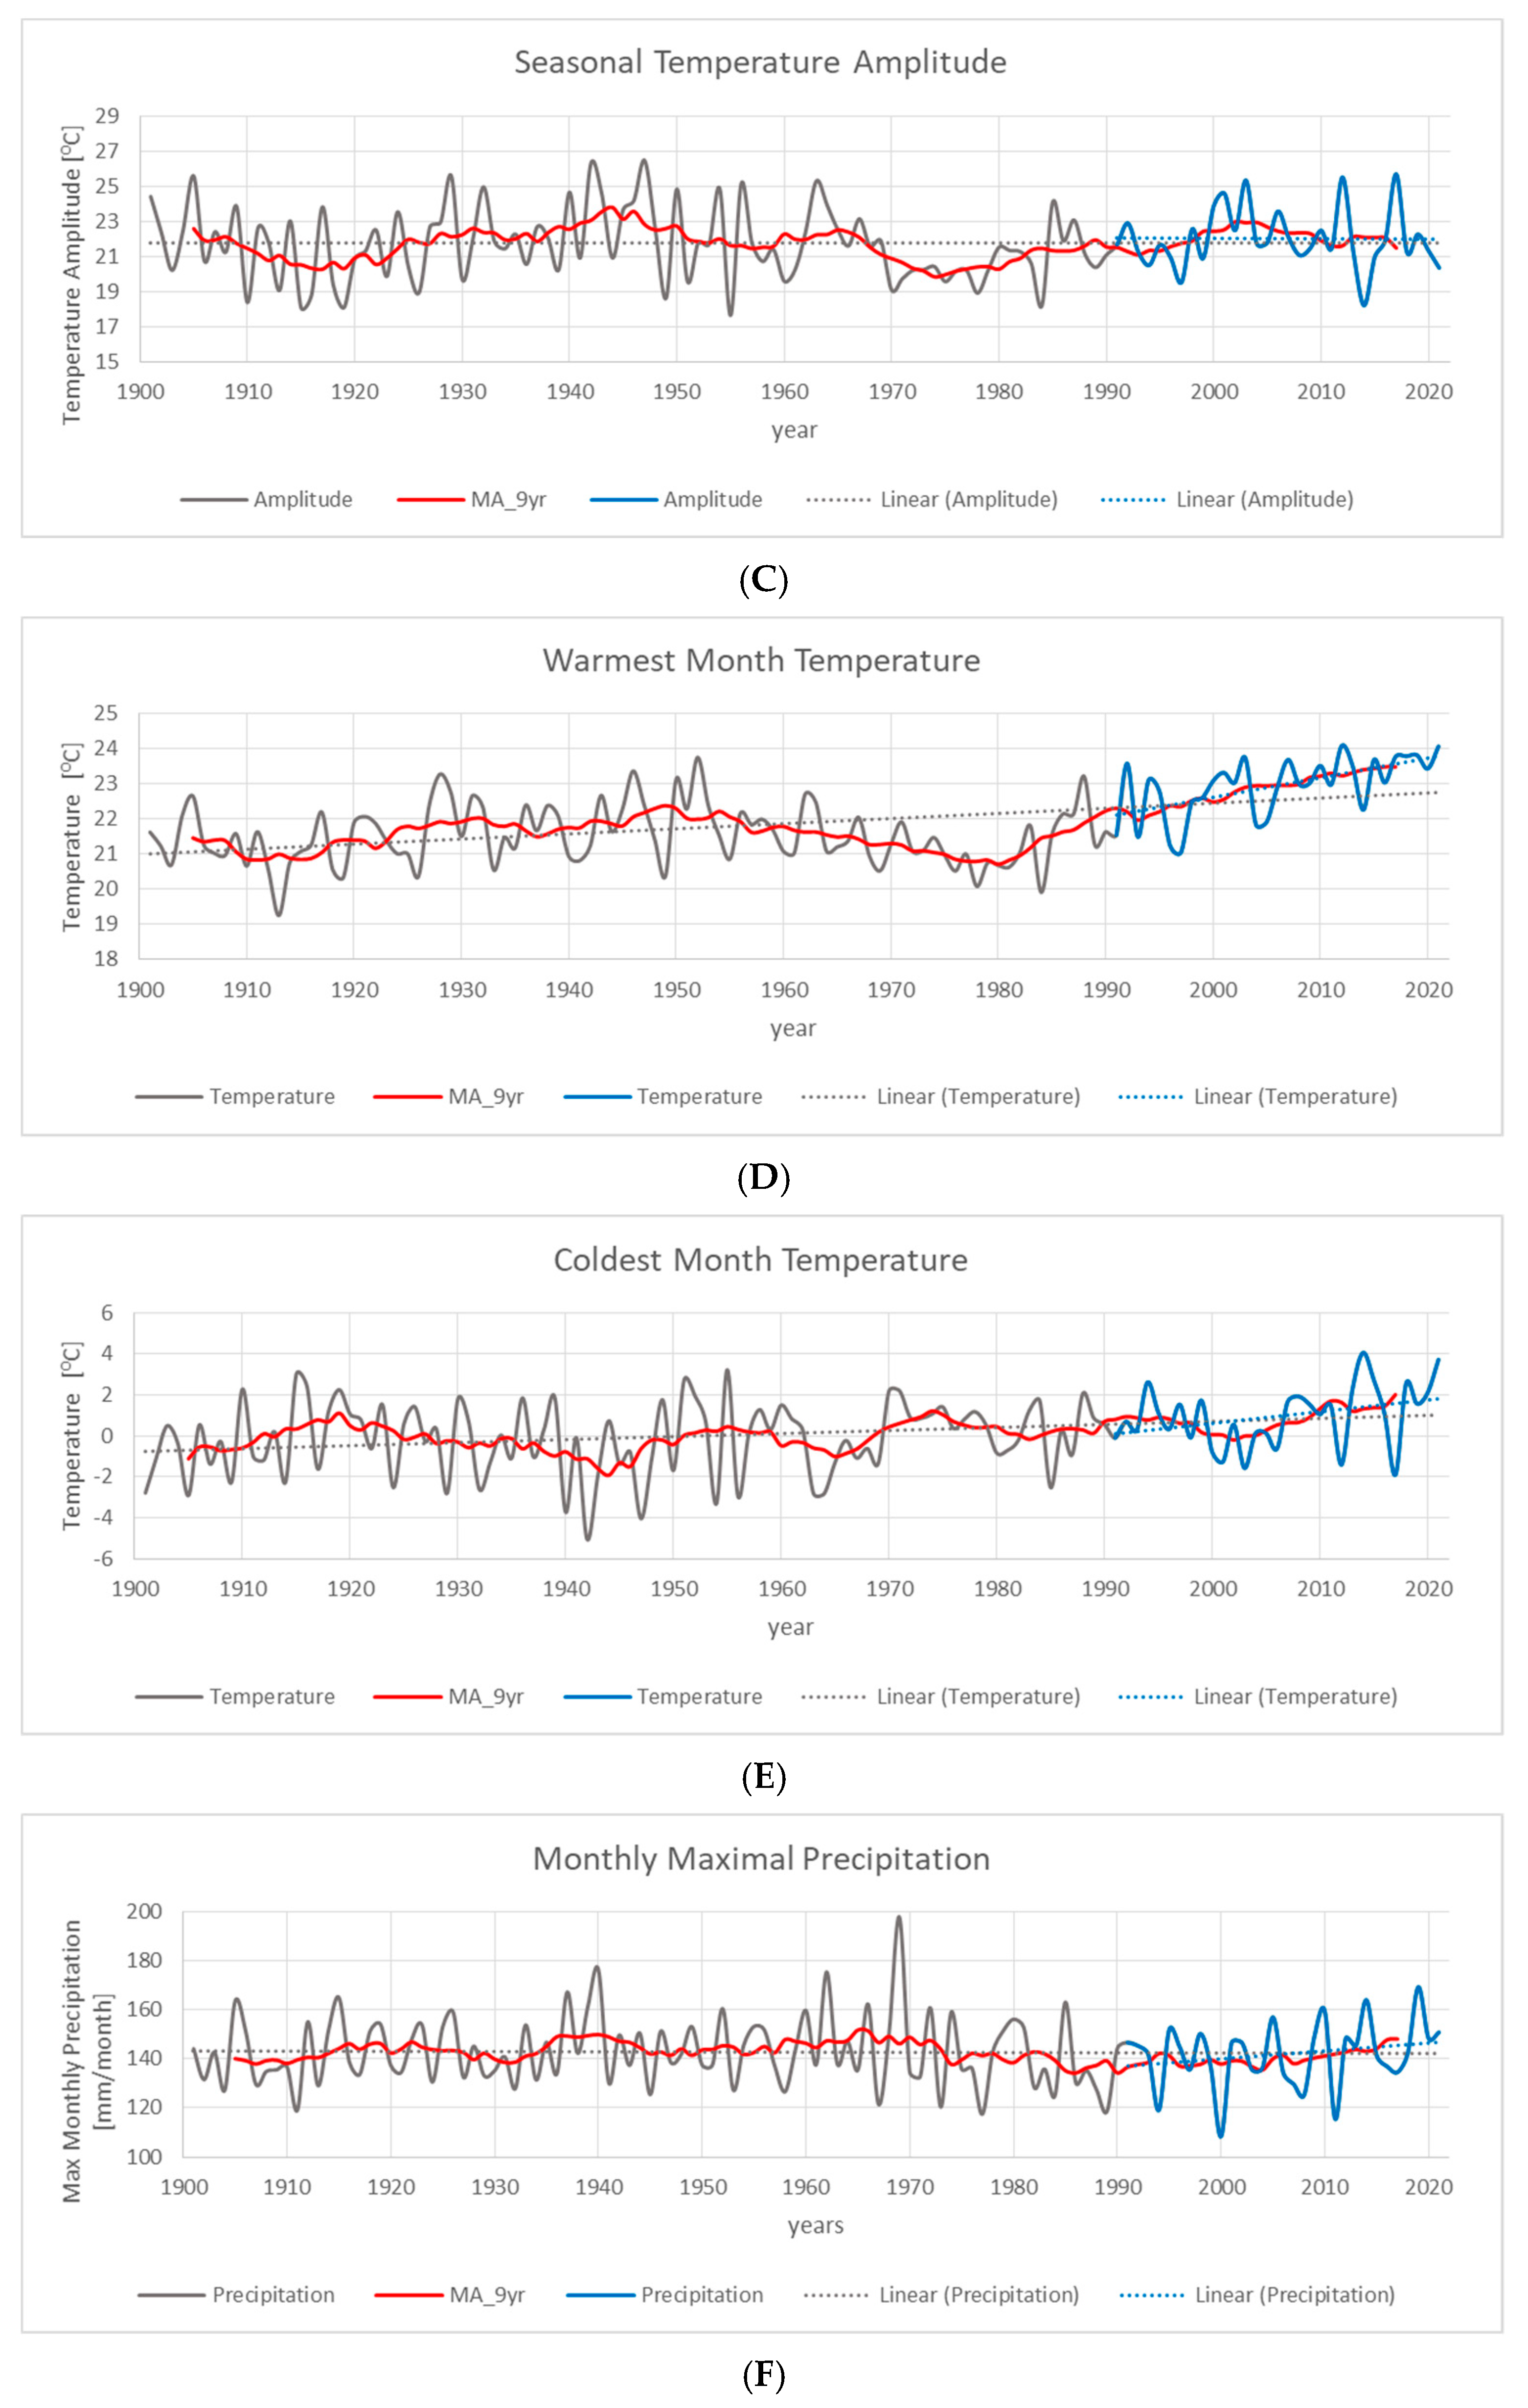
The seasonal temperature amplitude (the difference between the warmest and the coldest months) is shown in Figure 6C. A general linear tendency could not be noted, either for the whole period from 1901–2021 or for the period from 1991–2021. However, a clear oscillation is seen with a period of about 20 years after the local maximum in the beginning of 21st century, and it is followed by relatively lower values since 2010. The plots in Figure 6D,E suggest that this periodicity results from a variation in the temperature of the coldest month as the temperature of the warmest month is increasing stably.
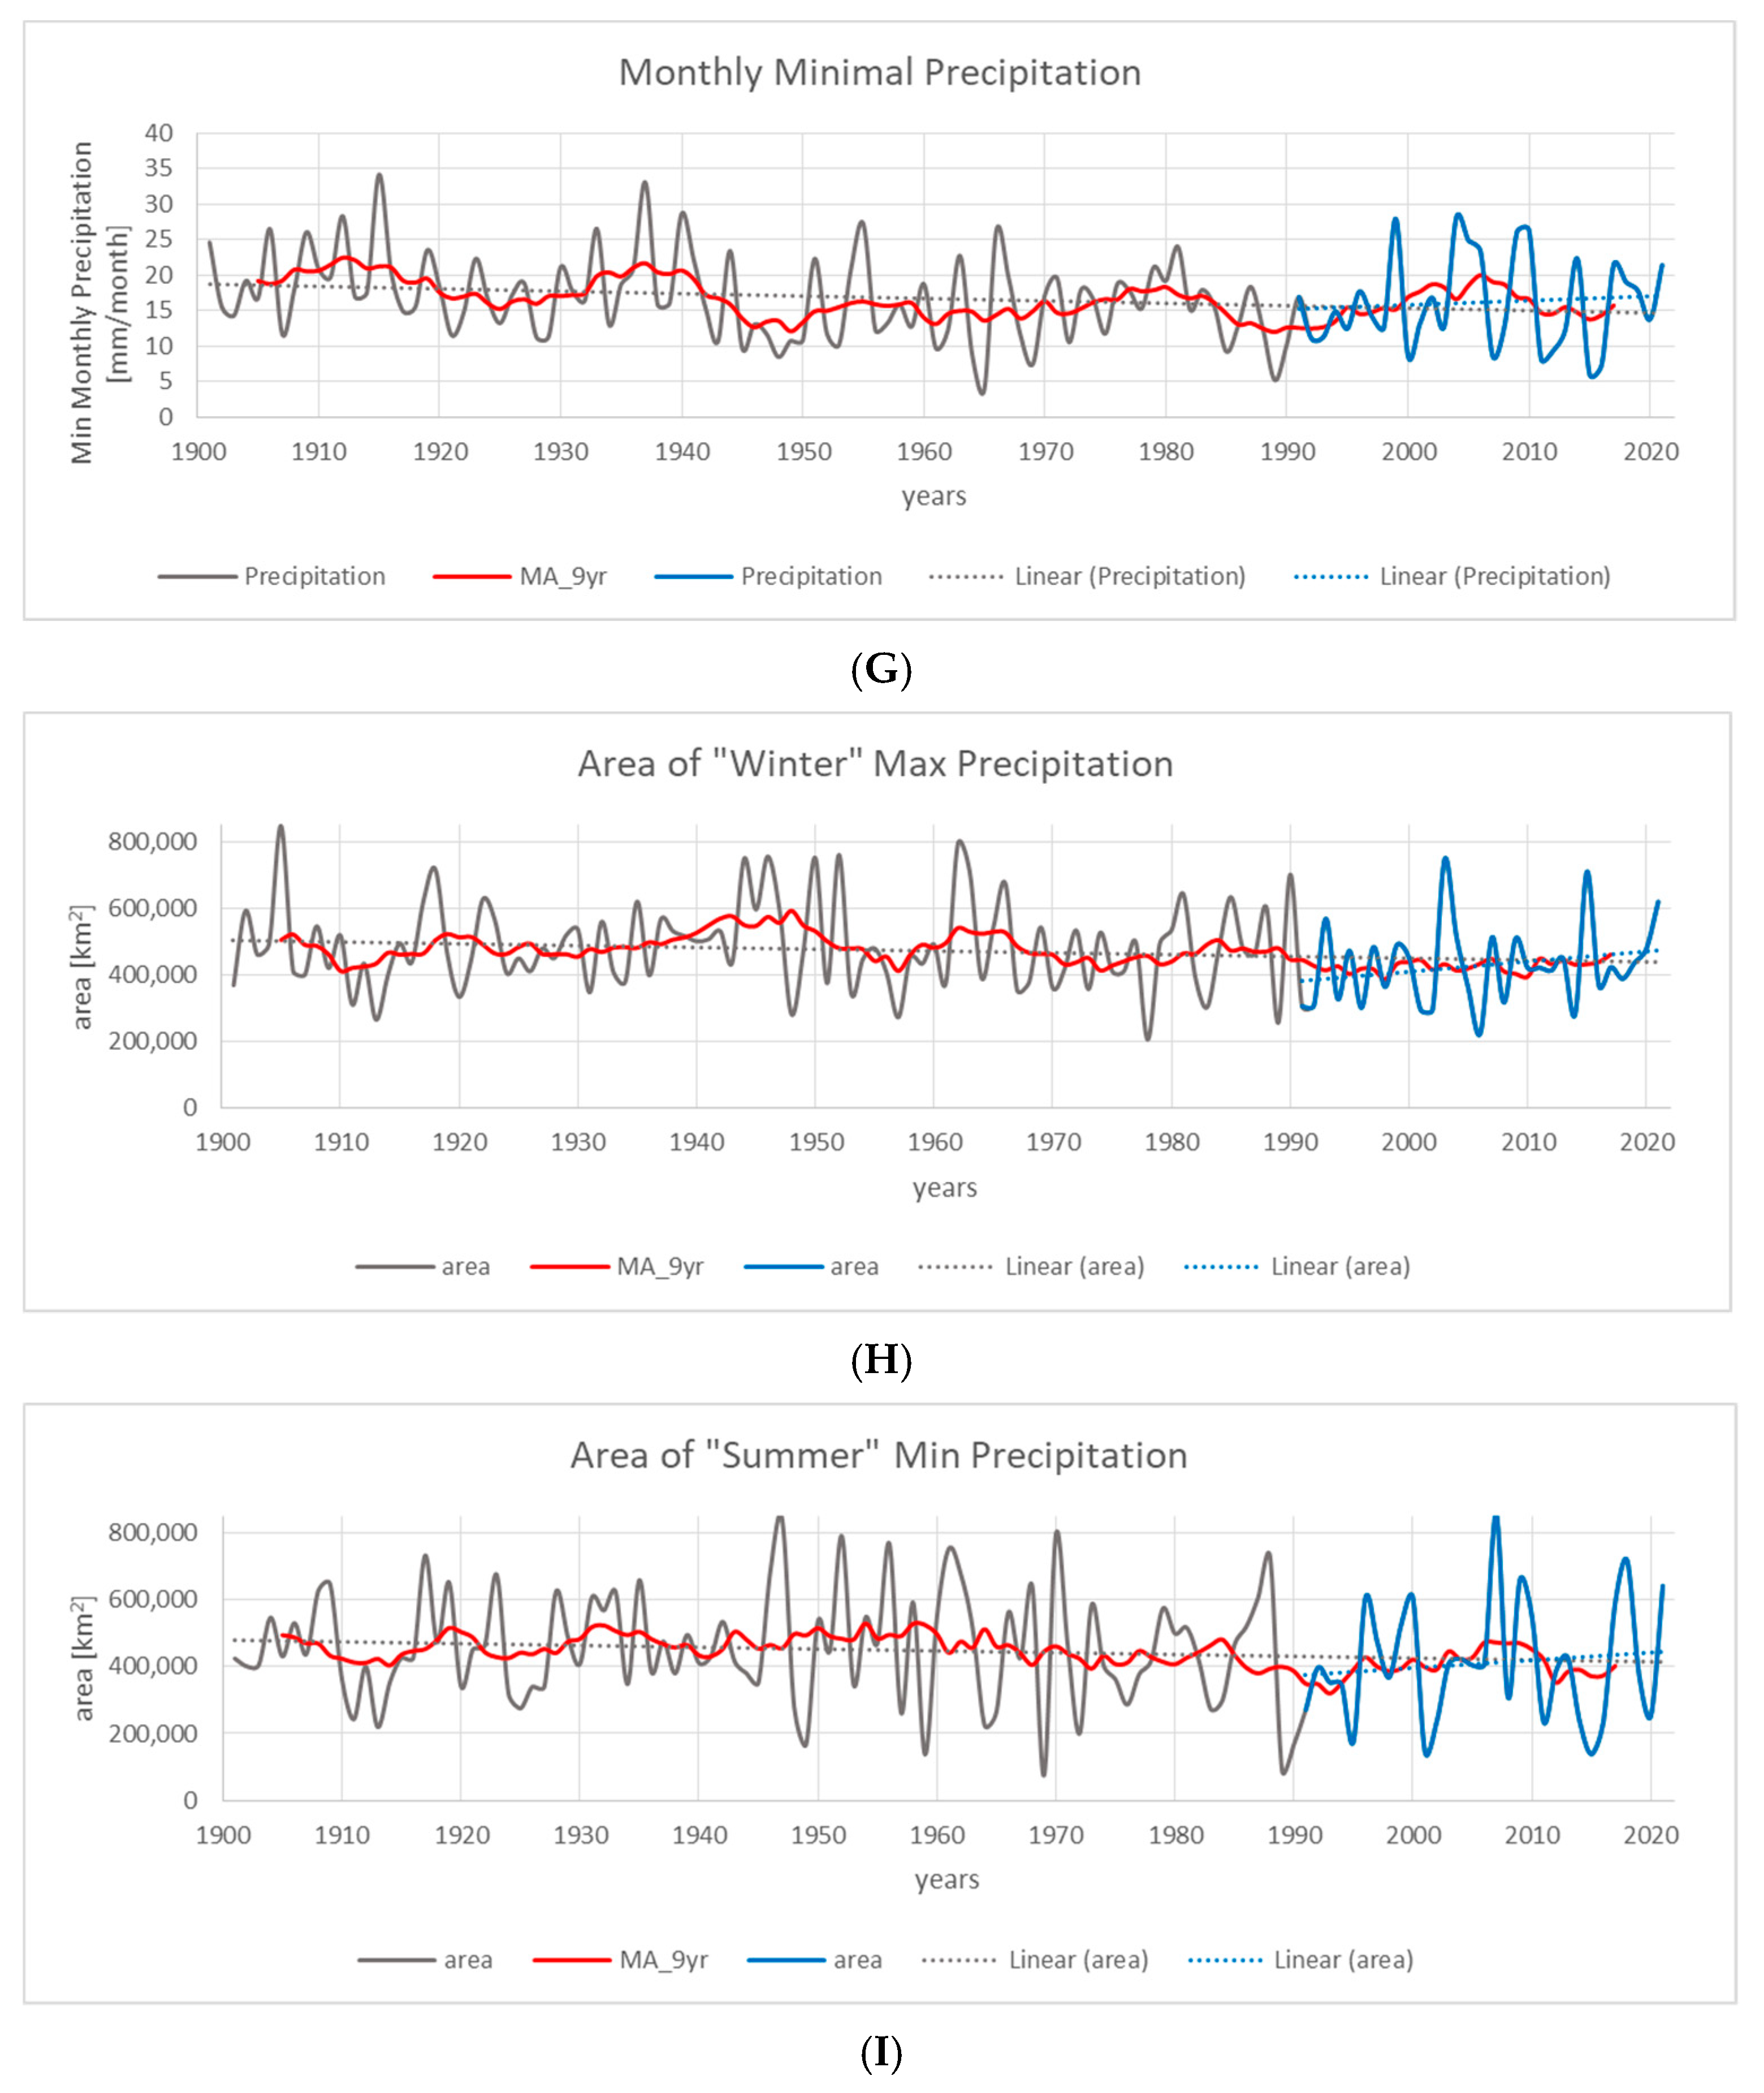
An interesting conclusion could be derived from Figure 6F,G, which gives the monthly precipitation in the months of lowest and highest rainfall. The monthly maximum precipitation varies with almost no trend for the whole period but increases in the last three decades. The monthly minimum precipitation varies over a period of ~20 years with low values in 2015. Compared to the plot of the annual sum in Figure 6B, one could speculate that the periodicity of variation is given by the minimum precipitation, and the latest decades’ increasing trend comes from the increase in the maximum monthly precipitation.
In the last two plots, we show for each individual year the calculated area of grid boxes with winter maximum (Figure 6H) and summer minimum (Figure 6I) of precipitation; we denote “winter” as the cold half of the year, e.g., the months of October to March, and “summer” as the warm half, the months of April to September. This would be indicative of the extent of the Mediterranean Sea influence over the peninsula. Both plots show general weakening (negative linear trend) of this influence for the period of 1901–2021 but an increase (positive linear trend) for the last three decades. However, we have to admit that the linear tendency is not statistically significant at a confidence level of 95%. The spectral periodogram reveals a period of about 20 years, with peaks of Mediterranean influence penetration over the Balkans in 1905, 1920, 1945, 1965, 1985, and 2005. On the contrary, the peninsula was under more intense continental influence in 1910, 1930, 1955, 1975, and 1995. Such a periodicity is found in the seasonal amplitude, the temperature of the coldest month, the annual precipitation, and the minimal monthly precipitation. It is a complex measure of the general circulation regimes in the region and integrates the influence of the main climate centers of action. A conclusion could be made that the decade from 2020–2030 will be marked by more maritime characteristics of the climate conditions in the region.
3.3. Relation to Global Circulation
A question regarding the origin of the found periodicity arises. The precipitation regime and the maritime and continental influences are determined by the atmosphere general circulation and the climate centers of action. In this region, it rains mainly due to the passing cyclones of North Atlantic and Mediterranean origin, as well as the thermal convection in summer. The topography of the region is variable; many mountains are present, and thus orographic rains are also favored.
We have tried to relate the time series shown in Figure 6 with several indices of the global circulation known to have significant impacts on the temperature and precipitation in the Balkans [31,32,33,34]—North Atlantic Oscillation, Mediterranean Oscillation, Scandinavian Pattern, and North Sea–Caspian Pattern, but the results are not convincing. References [35,36,37,38] found that the precipitation in the Mediterranean region is affected by the Atlantic Multidecadal Oscillation (AMO); however, we could not find a clear correlation with the AMO index.
The results from the performed cross-correlation analysis are summarized in Table 2. According to the coefficients, the annual precipitation is related to the Mediterranean Oscillation. It is seen that NSCP is related to some extent to the areas with winter maximum and summer minimum of precipitation. However, the found correlations could be considered weak to moderate.
4. Discussions and Conclusions
In this study, a new approach to analyze the influence of the Mediterranean Sea on the Balkan Peninsula climate is taken, focusing on the monthly precipitation distribution during the year. The data for the monthly precipitation come from the Climatic Research Unit product TS_4.06 and cover the period from 1901–2021.
The Balkan Peninsula is a geographic region on the transition between two large climatic zones (subtropical and temperate types, or Cs and Dw according to the Köppen–Geiger climate classification). It is impacted by the Mediterranean Sea in the southwest direction and the continent of Eurasia in the northeastern direction. We apply a method that shows rather precisely the border between the zones under domination of these two large-scale climate influences. The identification of the month when the monthly precipitation is highest in different locations clearly indicates the border position. The locations with highest precipitation in late autumn–winter (October to January) are considered to have a prevailingly maritime type of climate, and the ones with late spring–summer highest precipitation (May to July) are considered to have a prevailingly continental type of climate. This is a novel approach and, to our knowledge, the first of its kind in this region.
The found boundary could be regarded as the border between the two major types of climate in the Köppen–Geiger classification, Cs and Dw. It experiences significant spatial displacement, suggesting that the climate variations and the climate change also affect the climate type in some locations in the transition areas on the borders between the main climatic zones.
The constructed time series of areas with winter or summer maximum precipitation for each year of the record is a measure for the spatial penetration of the Mediterranean Sea influence over the Balkan Peninsula. We smooth the time series by a moving average with a window of nine years in order to identify variations and trends of decadal scale. Analyzing the obtained time series, it is found that the Mediterranean influence for the whole period of 1901–2021 generally weakens, but in the latest three decades it is increasing. However, the linear trend is not statistically significant at a confidence level of 95%. The reason could be that the chosen area and period are insufficient to describe the occurring process. An interesting study [39] analyzed paleo archives data in order to understand the influence of the Mediterranean climate on southeastern Europe during the past 350,000 years. The authors observed a general weakening of the Mediterranean climate influence with time. Nevertheless, the investigation methods and time-scale of that analysis are very different from this study. Our aim is to identify general trends and variations at a decadal scale.
A periodicity of ~20 years is found, suggesting that the decade from 2020–2030 will be characterized by a peak of Mediterranean influence: more intense winter precipitation and relatively colder winters, contrary to the decades of 2000–2020, characterized by more intense summer precipitation and mild winters.
Our attempt to relate the obtained time series to indices of the general circulation know to have an impact in the region (North Atlantic Oscillation, Mediterranean Oscillation, Atlantic Multidecadal Oscillation, Scandinavian Pattern, and North Sea–Caspian Pattern) identified weak to moderate correlations for some variables and indices. It showed that precipitation is influenced by the Mediterranean Oscillation and the North Sea–Caspian Pattern; thus, in our opinion, the matter requires more efforts and consideration intended for future work.
Nevertheless, these findings could support the planning of energetics, agriculture, tourism, and transport in the region. More pronounced Mediterranean influence could mean more intense winter precipitation which, over most of the Balkans, is predominantly snow, causing great problems for human activities and infrastructures; summer, on the other hand, would be dry and hot. More pronounced continental influence would mean summer with more intense precipitation, which is essential for plant growth and crop yield. As such, predicting such periods is important for agricultural activities; on the other hand, the winter would be colder with enhanced probability of freeze.
Supplementary Materials
The following supporting information can be downloaded at: https://www.mdpi.com/article/10.3390/cli11030068/s1, Table S1: Statistics for the linear trend of the considered time-series; Figure S1: Spectral periodograms of the considered time-series.
Author Contributions
Conceptualization, methodology, and supervision, E.P.; Investigation, data processing, and figure preparation, M.M.; Statistical analysis, M.T. All authors have read and agreed to the published version of the manuscript.
Funding
This research received no external funding.
Data Availability Statement
The climographs in Figure 1 are taken from [15]. The monthly mean 2 m air temperature and monthly precipitation for the period of 1901–2021 from the data product TS_4.06 of the Climatic Research Unit at the University of East Anglia, described in [23], is publicly available and was downloaded from the website [40]. The data for the global circulation indices of North Atlantic Oscillation, Mediterranean Oscillation, and North Sea–Caspian Pattern are publicly available and were downloaded from the website [26]. The data for the global circulation indices of Atlantic Multidecadal Oscillation and Scandinavian Pattern are publicly available and were downloaded from the website [27].
Acknowledgments
This work has been carried out in the framework of the National Science Program “Environmental Protection and Reduction of Risks of Adverse Events and Natural Disasters”, approved by the Resolution of the Council of Ministers 577/17.08.2018 and supported by the Ministry of Education and Science (MES) of Bulgaria (Agreement D01-363/17.12.2020).
Conflicts of Interest
The authors declare no conflict of interest.
References
- Geiger, R. Classification of climates according to W. Köppen. In Landolt-Börnstein—Numerical Values and Functions from Physics, Chemistry, Astronomy, Geophysics and Technology, Old Series; Springer: Berlin, Germany, 1954; Volume 3, pp. 603–607. (In German) [Google Scholar]
- Kottek, M.; Grieser, J.; Beck, C.; Rudolf, B.; Rubel, F. World map of the Köppen-Geiger climate classification updated. Meteorol. Z. 2006, 15, 259–263. [Google Scholar] [CrossRef] [PubMed]
- Schonwiese, C.; Rapp, J. Climate Trend Atlas of Europe Based on Observations 1891–1990; Kluwer Academic Publishers: Dordrecht, The Netherlands, 1997; 224p. [Google Scholar]
- Maheras, P.; Kolyva-Mahera, F. Temporal and Spatial characreristics of annual precipitation over Balkans in the twentieth century. Int. J. Climatol. 1990, 10, 495–504. [Google Scholar] [CrossRef]
- Philandras, C.M.; Nastos, P.T.; Kapsomenakis, J.; Douvis, K.C.; Tselioudis, G.; Zerefos, C.S. Long term precipitation trends and variability within the Mediterranean region. Nat. Hazards Earth Syst. Sci. 2011, 11, 3235–3250. [Google Scholar] [CrossRef] [Green Version]
- Luterbacher, J.; Xoplaki, E.; Casty, C.; Wanner, H.; Pauling, A.; Kiittel, M.; Rutishauser, T.; Bronnimann, S.; Fischer, E.; Fleitmann, D.; et al. Chapter 1, Mediterranean Climate Variability Over The Last Centuries: A Review. In The Mediterranean Climate: An Overview of the Main Characteristics and Issues; Lionello, P., Malanotte-Rizzoli, P., Boscolo, R., Eds.; Elsevier: Amsterdam, The Netherlands, 2005. [Google Scholar]
- Bartholy, J.; Pongrácz, R. Regional analysis of extreme temperature and precipitation indices for the Carpathian Basin from 1946 to 2001. Glob. Planet. Chang. 2007, 57, 83–95. [Google Scholar] [CrossRef]
- Bocheva, L.; Marinova, T.; Simeonov, P.; Gospodinov, I. Variability and trends of extreme precipitation events over Bulgaria (1961–2005). Atmos. Res. 2009, 93, 490–497. [Google Scholar] [CrossRef]
- Cazacioc, L. Spatial and temporal variability of extreme daily precipitation amounts in Romania. Rom. J. Meteorol. 2007, 9, 34–46. [Google Scholar]
- Chervenkov, H.; Slavov. NEX-GDDP Multimodel Ensemble vs. E-OBS—Evaluation of the Extreme Temperatures and Precipitation over Southeast Europe: Historical Comparison. Atmosphere 2022, 13, 581. [Google Scholar] [CrossRef]
- Gajic-Capka, M.; Cindric, K.; Pasaric, Z. Trends in precipitation indices in Croatia, 1961–2010. Theor. Appl. Climatol. 2014, 117, 3–4. [Google Scholar] [CrossRef]
- Hulme, M.; Osborn, T.J.; Johns, T.C. Precipitation sensitivity to global warming: Comparison of observations with HadCM2 simulations. Geophys. Res. Lett. 1998, 25, 3379–3382. [Google Scholar] [CrossRef]
- Milanovic, B.; Schuster, P.; Radovanovic, M.; Vakanjic, V.R.; Schneider, C. Spatial and temporal variability of precipitation in Serbia for the period 1961–2010. Theor. Appl. Climatol. 2017, 130, 687–700. [Google Scholar] [CrossRef]
- Vyshkvarkova, E.; Sukhonos, O. Compound Extremes of Air Temperature and Precipitation in Eastern Europe. Climate 2022, 10, 133. [Google Scholar] [CrossRef]
- Weather and Climate. Available online: www.weather-and-climate.com (accessed on 1 March 2023).
- Available online: https://weather-and-climate.com/uploads/average-rainfall-romania-bucharest.png (accessed on 1 March 2023).
- Available online: https://weather-and-climate.com/uploads/average-rainfall-bulgaria-sofia.png (accessed on 1 March 2023).
- Available online: https://weather-and-climate.com/uploads/average-rainfall-greece-athens.png (accessed on 1 March 2023).
- Available online: https://weather-and-climate.com/uploads/average-rainfall-albania-tirana.png (accessed on 1 March 2023).
- Available online: https://weather-and-climate.com/uploads/average-rainfall-serbia-belgrade.png (accessed on 1 March 2023).
- Available online: https://weather-and-climate.com/uploads/average-rainfall-macedonia-skopje.png (accessed on 1 March 2023).
- Available online: https://weather-and-climate.com/uploads/average-rainfall-bosnia-herzegovina-sarajevo.png (accessed on 1 March 2023).
- Harris, I.; Osborn, T.J.; Jones, P.; Lister, D. Version 4 of the CRU TS monthly high-resolution gridded multivariate climate dataset. Sci. Data 2020, 7, 109. [Google Scholar] [CrossRef] [PubMed] [Green Version]
- Koleva, E.K.; Krastev, L.; Peneva, L.E.; Stanev, E.V. Verification of high resolution climatic simulations for the area of Bulgaria. Part I: The state of the climate for the period 1960–1990. Bulg. J. Meteorol. Hydrol. 1996, 7, 73–83. [Google Scholar]
- Peneva, E.; Stanev, E.V.; Koleva, E.K.; Krastev, L.; Staneva, J.V. Verification of high resolution climatic simulations for the area of Bulgaria. Part II: Intercomparison between UKMO, HIRHAM and ARPEGE simulations and climatic data for the period 1961–1990. Bulg. J. Meteorol. Hydrol. 1996, 7, 84–102. [Google Scholar]
- Climatic Research Unit: Pressure and Circulation Indices. Available online: https://crudata.uea.ac.uk/cru/data/pci.htm (accessed on 1 March 2023).
- Physical Sciences Laboratory: Climate Indices: Monthly Atmospheric and Ocean Time Series. Available online: https://psl.noaa.gov/data/climateindices/list/ (accessed on 1 March 2023).
- Climate Atlas of Greece 1970–2000, Helenic National Meteorological Service. Available online: http://climatlas.hnms.gr/sdi/ (accessed on 1 March 2023).
- Karali, A.; Hatzaki, M.; Giannakopoulos, C.; Roussos, A.; Xanthopoulos, G.; Tenentes, V. Sensitivity and Evaluation of Current Fire Risk and Future Projections Due to Climate Change: The Case Study of Greece. Nat. Hazards Earth Syst. Sci. 2014, 14, 143–153. [Google Scholar] [CrossRef] [Green Version]
- Patakamuri, S.K.; O’Brien, N. Modifiedmk: Modified Versions of Mann Kendall and Spearman’s Rho Trend Tests; The R Project for Statistical Computing: Vienna, Austria, 2019. [Google Scholar]
- Lionello, P.; Malanotte-Rizzoli, P.; Boscolo, R. (Eds.) Mediterranean. In Developments in Earth and Environmental Sciences; Elsevier: Amsterdam, The Netherlands, 2006; Volume 4, pp. 27–148. [Google Scholar]
- Hatzaki, M.; Renguang, W. The south-eastern Europe winter precipitation variability in relation to the North Atlantic SST. Atmos. Res. 2015, 152, 61–68. [Google Scholar] [CrossRef]
- Feidas, H.; Noulopoulou, N.; Makrogiannis, T.; Bora-Senta, E. Trend analysis of precipitation time series in Greece and their relationship with circulation using surface and satellite data: 1955–2001. Theor. Appl. Climatol. 2007, 87, 155–177. [Google Scholar] [CrossRef]
- Kutiel, H.; Maheras, P.; Guika, S. Circulation and extreme rainfall conditions in the eastern Mediterranean during the last century. Int. J. Climatol. 1996, 16, 73–92. [Google Scholar] [CrossRef]
- Xoplaki, E.; González-Rouco, J.F.; Luterbacher, J.; Wanner, H. Wet season Mediterranean precipitation variability: Influence of large-scale dynamics and trends. Clim. Dynam. 2004, 23, 63–78. [Google Scholar] [CrossRef] [Green Version]
- Polonsky, A. Ocean’s Role in Climate Change; Cambridge Scholar Publishing: Newcastle upon Tyne, UK, 2019. [Google Scholar]
- Kaiwei, Z.; Guan, X.; Huang, J.; Wang, J.; Guo, S.; Cao, G. Precipitation over semi-arid regions of North Hemisphere affected by Atlantic Multidecadal Oscillation. Atmos. Res. 2021, 262, 105801. [Google Scholar]
- Zampieri, M.; Toreti, A.; Schindler, A.; Scoccimarro, S.; Gualdi, V. Atlantic multi-decadal oscillation influence on weather regimes over Europe and the Mediterranean in spring and summer. Glob. Planet. Chang. 2017, 151, 92–100. [Google Scholar] [CrossRef]
- Obrecht, I.; Zeeden, C.; Hambach, U.; Vere, D.; Markovic, B.S.; Bosken, J.; Svircev, Z.; Bacevic, N.; Gavrilov, B.M.; Lehmkuhl, F. Tracing the influence of Mediterranean climate on Southeastern Europe during the past 350,000 years. Sci. Rep. 2016, 6, 36334. [Google Scholar] [CrossRef] [Green Version]
- High-Resolution Gridded Datasets (and Derived Products). Available online: https://crudata.uea.ac.uk/cru/data/hrg/ (accessed on 1 March 2023).
Figure 1.
Balkan Peninsula location and climographs of Bucharest, Sofia, Belgrade, Athens, Tirana, Skopje, and Sarajevo (from [15,16,17,18,19,20,21,22]).

Figure 2.
Land–sea mask of the grid points covering the Balkan Peninsula in the product CRU TS_4.06.
Figure 2.
Land–sea mask of the grid points covering the Balkan Peninsula in the product CRU TS_4.06.

Figure 3.
(a) Topography of the considered region; (b) Annual precipitation for the period from 1901–2021; (c) Difference between the monthly mean temperature of the warmest and the coldest months.
Figure 3.
(a) Topography of the considered region; (b) Annual precipitation for the period from 1901–2021; (c) Difference between the monthly mean temperature of the warmest and the coldest months.


Figure 4.
Maps of averaged characteristics for the whole period of 1901–2021: (a) The month of highest monthly precipitation; (b) The month of lowest monthly precipitation; (c) Monthly highest precipitation [mm/month] for the respective month; (d) Monthly lowest precipitation [mm/month] for the respective month.

Figure 5.
(a) The month of highest monthly precipitation in 1985; (b) The month of highest monthly precipitation in 2014.
Figure 5.
(a) The month of highest monthly precipitation in 1985; (b) The month of highest monthly precipitation in 2014.

Figure 6.
Time series for the period of 1901-2021 of the area averaged: (A) Annual mean temperature; (B) Annual precipitation; (C) seasonal temperature amplitude; (D) warmest month temperature; (E) coldest month temperature; (F) monthly highest precipitation; (G) monthly lowest precipitation; (H) area with maximum precipitation in the cold part of the year (October to March); (I) area with minimum precipitation in the warm part of the year (April to September). In the plots, the grey curve is the variable, the red curve is the moving average with a 9-year window, and the dotted grey line is the linear trend of the variable; in addition, the latest period of 1991-2021 is given with a blue curve and its trend as blue line.


Table 1.
Summary of the time series main characteristics for the 9 variables presented in Figure 6. The bold values present statistically significant trends at confidence level 95%. More details on the calculated linear trend and the spectral periodograms are given in the Supplementary Material Table S1 and Figure S1.
| Variable | Linear Trend 1901–2021 | Linear Trend 1991–2021 | Periodicity |
|---|---|---|---|
| Annual mean temperature | positive 0.01 °/year | positive 0.06 °/year | - |
| Annual precipitation | negative −0.16 mm/month.year | positive 3 mm/month.year | ~20 years |
| Seasonal temperature amplitude | no | no | ~20 years |
| Warmest month temperature | positive 0.014 °/year | positive 0.05 °/year | - |
| Coldest month temperature | positive 0.015 °/year | positive 0.06 °/year | ~20 years |
| Monthly maximal precipitation | no | positive 0.18 mm/month.year | - |
| Monthly minimal precipitation | negative −0.04 mm/month.year | positive 0.05 mm/month.year | ~20 years |
| Area of winter precipitation maximum | negative −539 km2/year | positive 3298 km2/year | ~20 years |
| Area of summer precipitation minimum | negative −529 km2/year | positive 1721 km2/year | - |
Table 2.
Cross-correlation coefficients between the variables from Figure 6 and North Atlantic Oscillation index (NAO), Mediterranean Oscillation index (MO), Scandinavian Pattern (SCA), North Sea–Caspian Pattern (NSCP), and Atlantic Multidecadal Oscillation unsmoothed (AMO). Only the values above 0.2 are considered.
| Variable/Index | NAO | MO | SCA | NSCP | AMO |
|---|---|---|---|---|---|
| Annual mean temperature | 0.24 | ||||
| Annual precipitation | −0.26 | −0.53 | 0.24 | −0.26 | |
| Seasonal temperature amplitude | |||||
| Warmest month temperature | |||||
| Coldest month temperature | 0.2 | ||||
| Monthly maximal precipitation | |||||
| Monthly minimal precipitation | −0.21 | −0.38 | −0.29 | ||
| Area of winter precipitation maximum | −0.33 | ||||
| Area of summer precipitation minimum | −0.2 | −0.28 | −0.48 |
Disclaimer/Publisher’s Note: The statements, opinions and data contained in all publications are solely those of the individual author(s) and contributor(s) and not of MDPI and/or the editor(s). MDPI and/or the editor(s) disclaim responsibility for any injury to people or property resulting from any ideas, methods, instructions or products referred to in the content. |
© 2023 by the authors. Licensee MDPI, Basel, Switzerland. This article is an open access article distributed under the terms and conditions of the Creative Commons Attribution (CC BY) license (https://creativecommons.org/licenses/by/4.0/).
Share and Cite
MDPI and ACS Style
Peneva, E.; Matov, M.; Tsekov, M. Mediterranean Influence on the Climatic Regime over the Balkan Peninsula from 1901–2021. Climate 2023, 11, 68. https://doi.org/10.3390/cli11030068
AMA Style
Peneva E, Matov M, Tsekov M. Mediterranean Influence on the Climatic Regime over the Balkan Peninsula from 1901–2021. Climate. 2023; 11(3):68. https://doi.org/10.3390/cli11030068
Chicago/Turabian StylePeneva, Elisaveta, Mirna Matov, and Milen Tsekov. 2023. "Mediterranean Influence on the Climatic Regime over the Balkan Peninsula from 1901–2021" Climate 11, no. 3: 68. https://doi.org/10.3390/cli11030068
Note that from the first issue of 2016, this journal uses article numbers instead of page numbers. See further details here.