
Salinity Intrusion Trends under the Impacts of Upstream Discharge and Sea Level Rise along the Co Chien River and Hau River in the Vietnamese Mekong Delta


Abstract
:1. Introduction
2. Materials and Methods
2.1. Boundary Conditions
2.2. Hydraulic Simulation
2.3. Salinity Simulation
2.4. Model Calibration and Validation
2.5. Scenario Development
3. Results
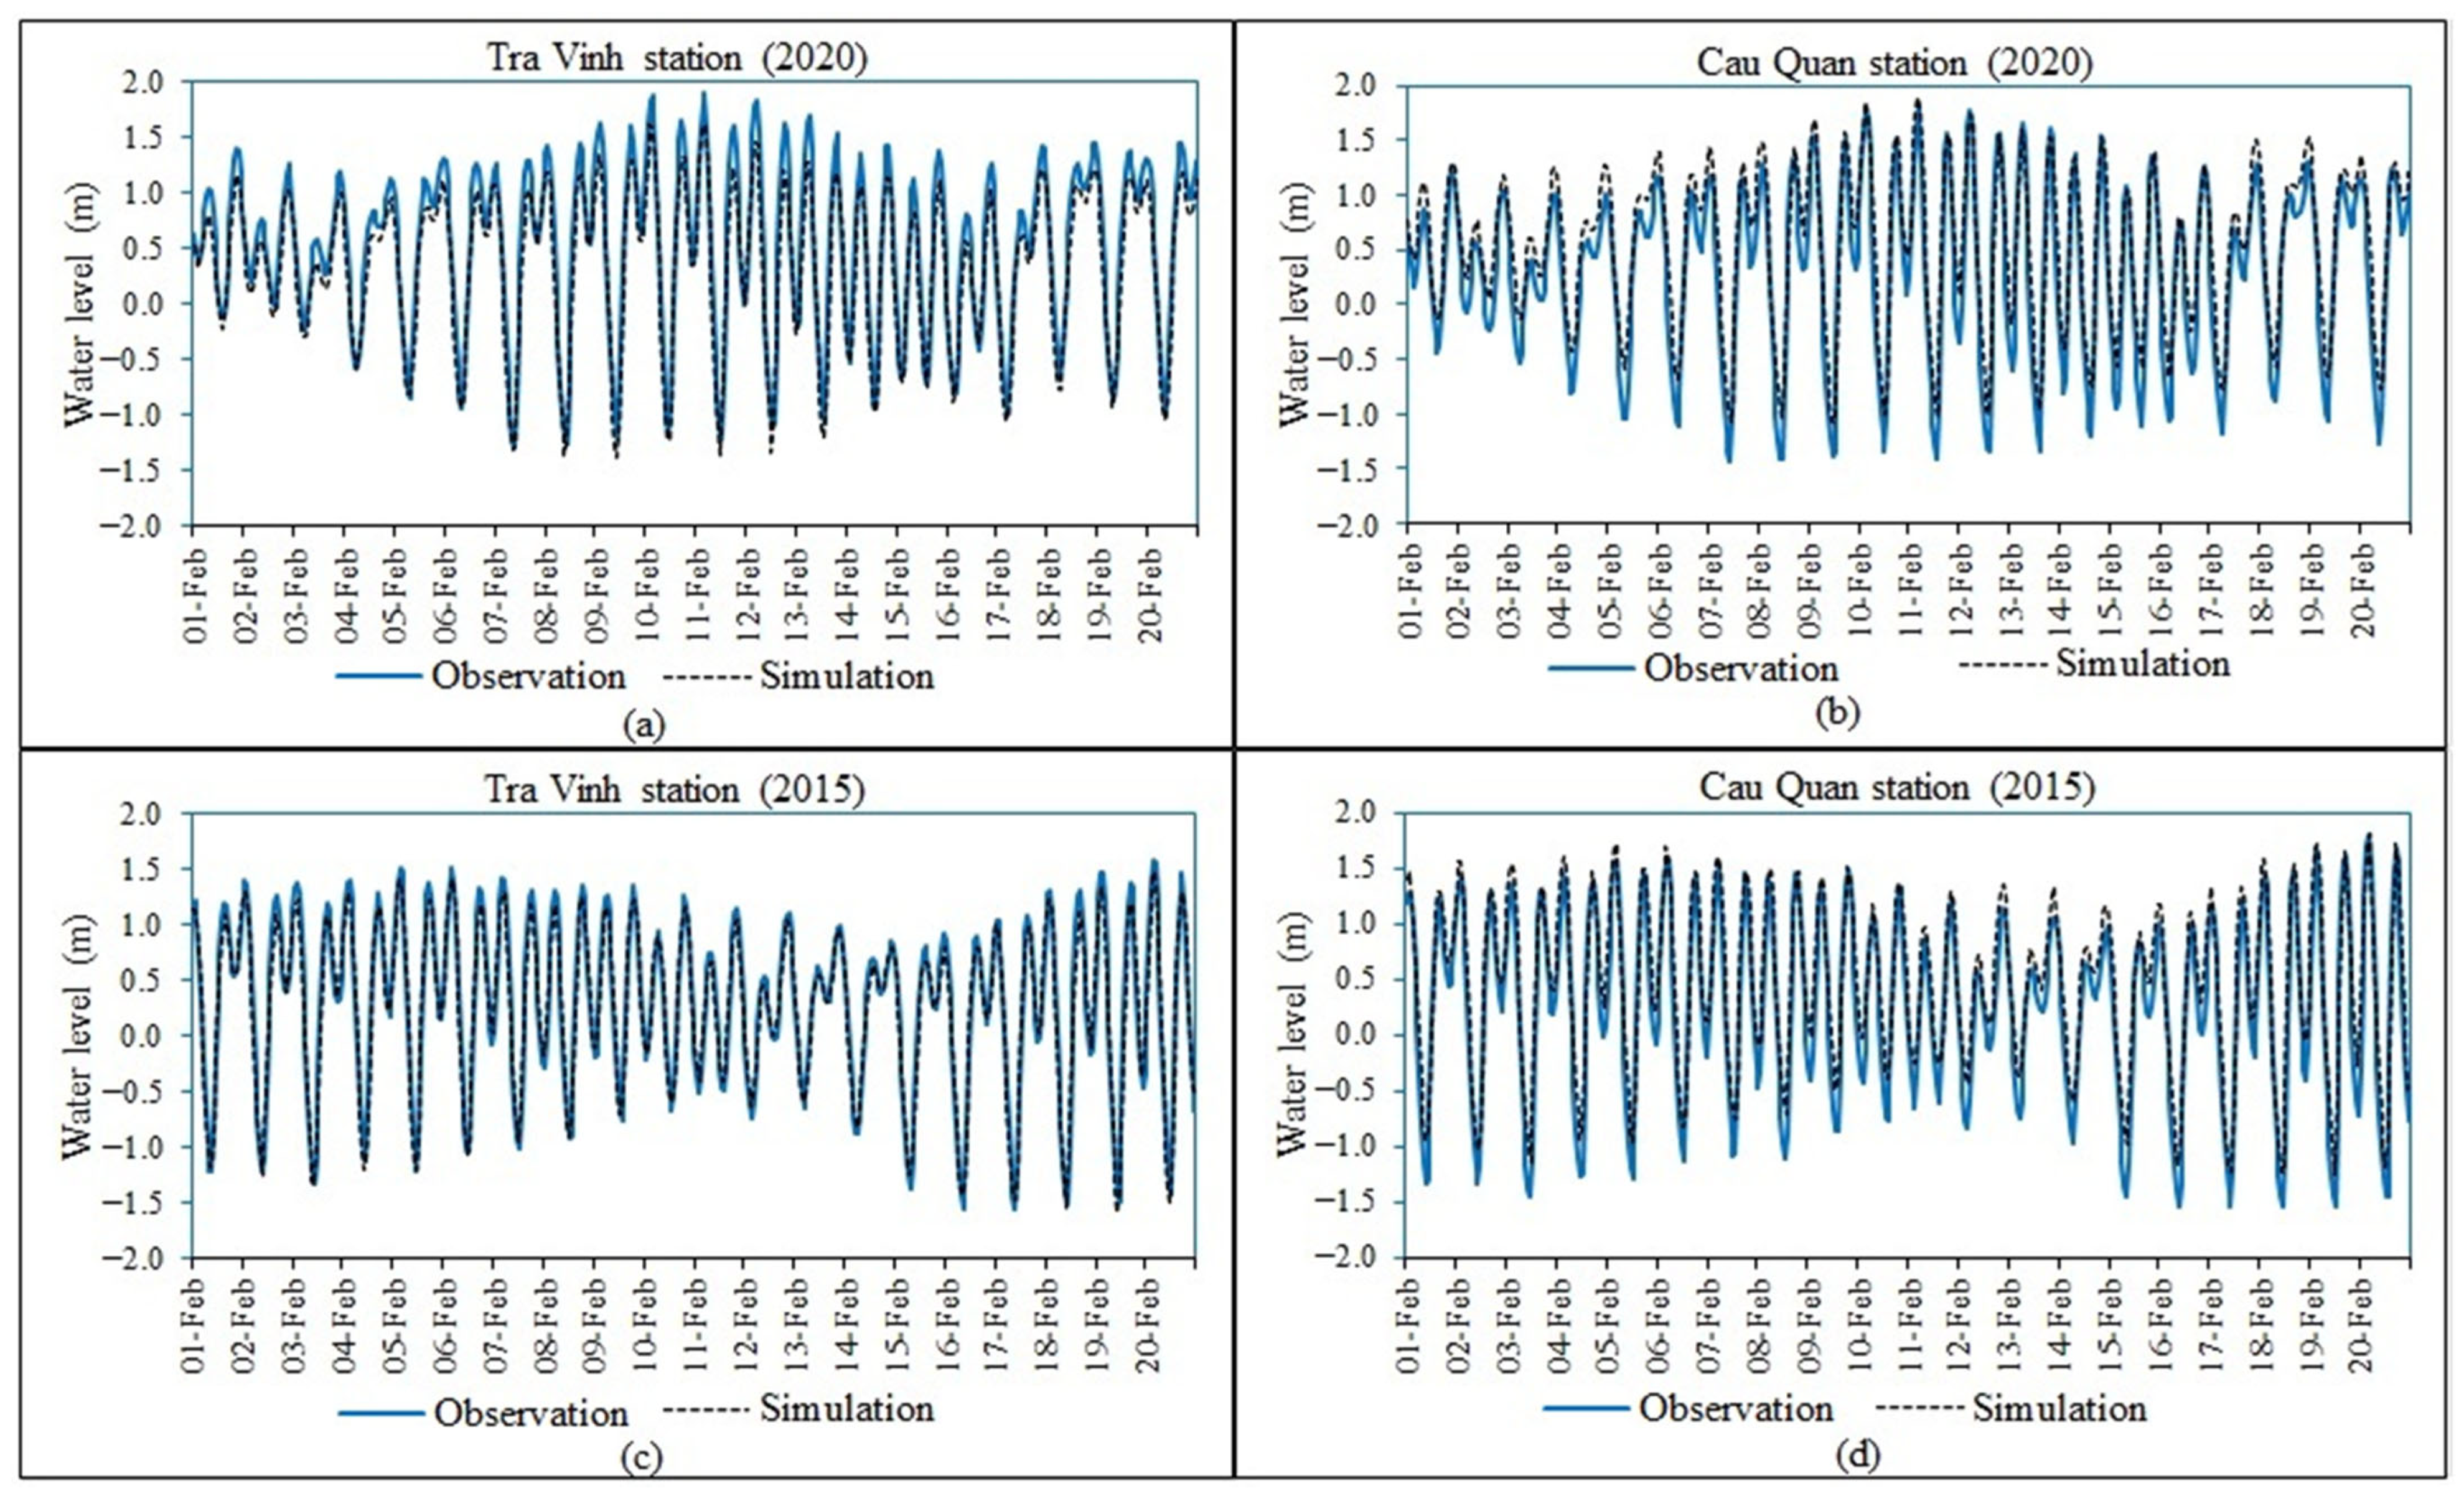
3.1. Hydraulic Calibration and Validation
3.2. Peak Salinity Delay
3.3. Salinity Calibration and Validation
3.4. Distribution of Average Discharge into the Co Chien River
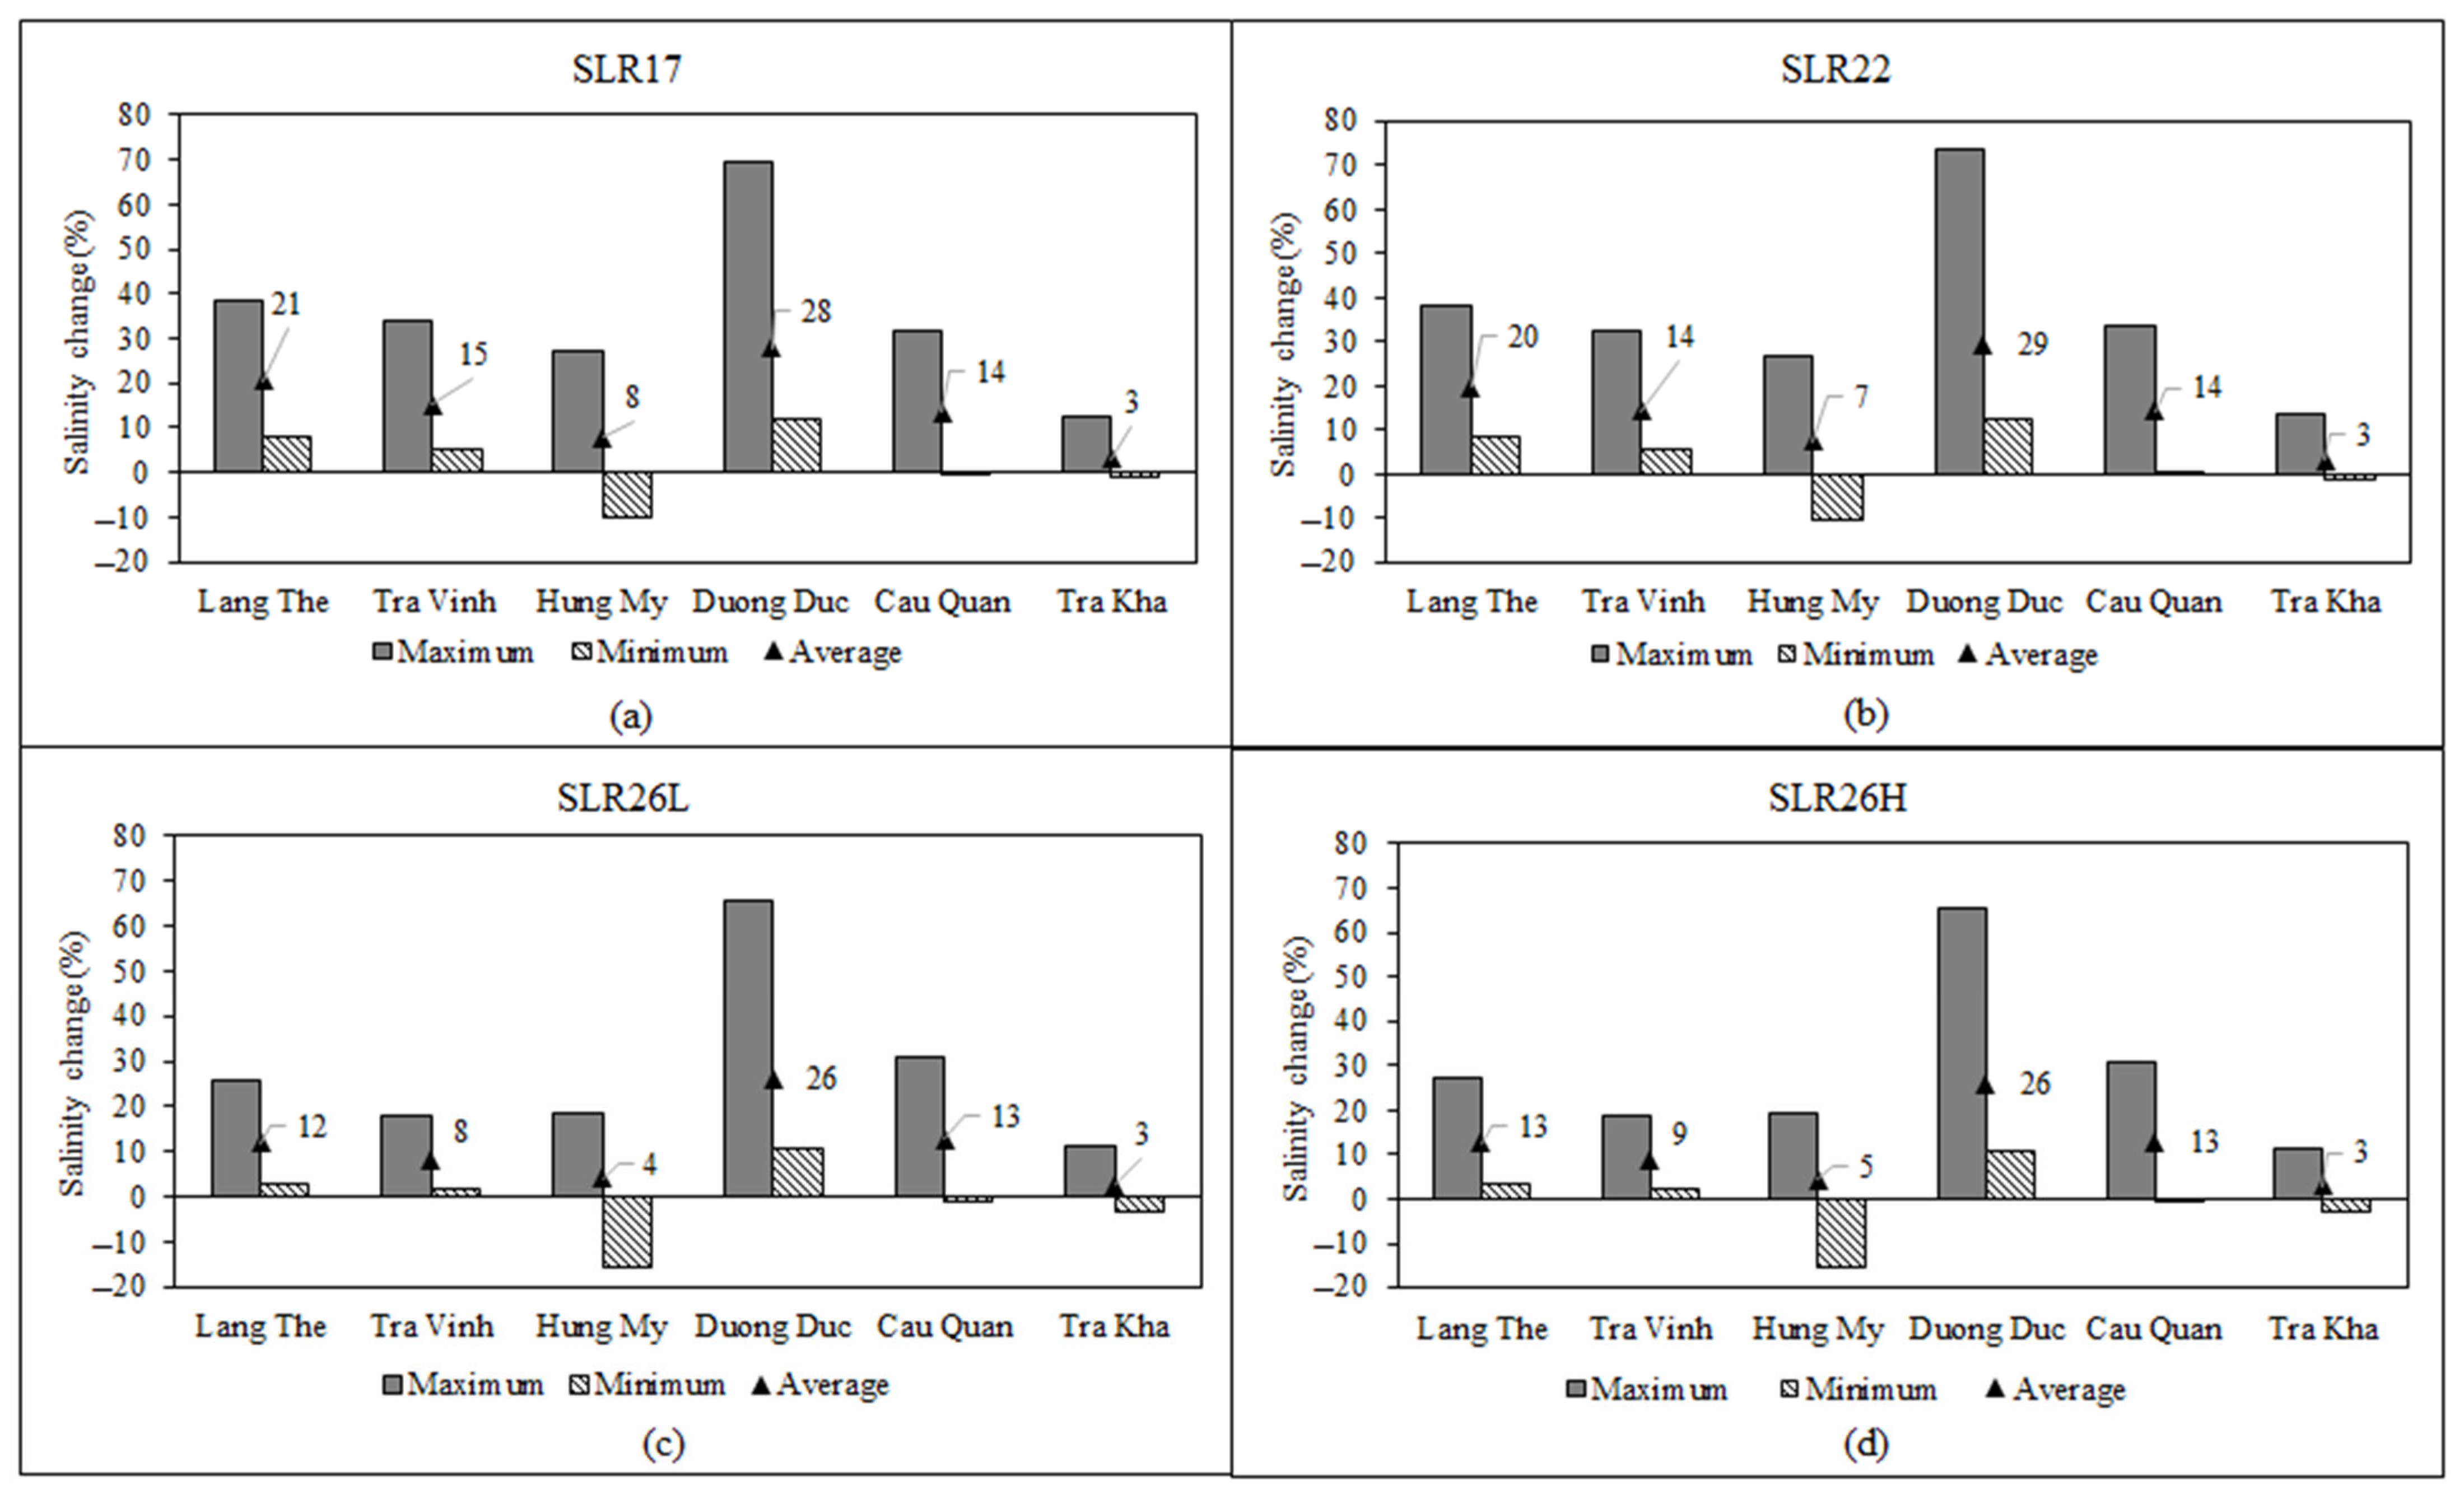
3.5. Salinity Changes under Future Scenarios
3.5.1. Impacts of Sea Level Rise under Climate Change Scenarios in Vietnam and Extreme Decrease of Upstream River Discharge
3.5.2. Impact of Extreme Sea Level Rise
4. Discussion
5. Conclusions
Author Contributions
Funding
Data Availability Statement
Acknowledgments
Conflicts of Interest
References
- IPCC. Working Group II: Impacts, Adaptation and Vulnerability; The Intergovernmental Panel on Climate Change (IPCC): Geneva, Switzerland, 2007. [Google Scholar]
- Axmann, H.B.; Soethoudt, J.M.; Thúy, V.D. Roadmap Post-Harvest Loss Reduction in Selected Vietnamese Value Chains: Phase 2; Wageningen Food & Biobased Research: Wageningen, The Netherlands, 2022. [Google Scholar]
- Truong, C.Q.; Drogoul, A.; Gaudou, B.; Taillandier, P.; Quang, N.H.; Brugière, A.; Nguyen, H.T.T.; Minderhoud, P.; Espagne, E. LUCAS-GEMMES: Integrated dynamics of adaptation strategies in the Vietnamese Mekong Delta. In The Mekong Delta Emergency Climate and Environmental Adaptation Strategies to 2050; Agence Française de Développement: Paris, France, 2022. [Google Scholar]
- Hoan, N.X.; Khoi, D.N.; Trung, L.D. Assessing the adaptive capacity of farmers under the impact of saltwater intrusion in the Vietnamese Mekong Delta. J. Environ. Plan. Manag. 2019, 62, 1619–1635. [Google Scholar] [CrossRef]
- Nguyen, N.A. Historic drought and salinity intrusion in the Mekong Delta in 2016: Lessons learned and response solutions. Vietnam. J. Sci. Technol. Eng. 2017, 59, 93–96. [Google Scholar] [CrossRef] [PubMed]
- CGIAR Research Program on Climate Change, Agriculture and Food Security. The Drought and Salinity Intrusion in the Mekong River Delta of Vietnam: Assessment Report; CGIAR: Washington, DC, USA, 2016. [Google Scholar]
- Dang, K.K.; Do, T.H.; Le, T.H.L.; Le, T.T.H.; Pham, T.D. Impacts of farmers’ adaptation to drought and salinity intrusion on rice yield in Vietnam’s Mekong Delta. J. Agribus. Dev. Emerg. Econ. 2021, 11, 27–41. [Google Scholar] [CrossRef]
- Tran, P.H. Assessment of Changes in the Structure Land Use in Tra Vinh Province Under the Scenarios of Climate Change and Sea Level Rise. Vietnam J. Sci. Technol. 2020, 58, 70. [Google Scholar] [CrossRef] [Green Version]
- Lin, Z.; Qi, J. Hydro-dam–A nature-based solution or an ecological problem: The fate of the Tonlé Sap Lake. Environ. Res. 2017, 158, 24–32. [Google Scholar] [CrossRef] [PubMed]
- Pachauri, R.K.; Allen, M.R.; Barros, V.R.; Broome, J.; Cramer, W.; Christ, R.; Church, J.A.; Clarke, L.; Dahe, Q.; Dasgupta, P. Climate Change 2014: Synthesis Report. Contribution of Working Groups I, II and III to the Fifth Assessment Report of the Intergovernmental Panel on Climate Change; IPCC: Geneva, Switzerland, 2014; ISBN 9291691437. [Google Scholar]
- Lindsey, R. Climate Change: Global Sea Level. Available online: https://www.climate.gov/news-features/understanding-climate/climate-change-global-sea-level (accessed on 14 August 2020).
- MONRE (Ministry of Natural Resources and Environment of Viet Nam). Climate Change Scenarios (Kịch bản biến đổi khí hậu); MONRE (Ministry of Natural Resources and Environment of Viet Nam): Ha Noi, Vietnam, 2021. [Google Scholar]
- Anh, D.T.; Hoang, L.P.; Bui, M.D.; Rutschmann, P. Modelling seasonal flows alteration in the Vietnamese Mekong Delta under upstream discharge changes, rainfall changes and sea level rise. Int. J. River Basin Manag. 2019, 17, 435–449. [Google Scholar] [CrossRef]
- Khai, H.V.; Trang, N.T.; Tu, V.H.; Hong, N.B. Environmental efficiency of transformed farming systems: A case study of change from sugarcane to shrimp in the vietnamese mekong delta. For. Res. Eng. Int. J. 2018, 2, 54–60. [Google Scholar]
- Wassmann, R.; Phong, N.D.; Tho, T.Q.; Hoanh, C.T.; Khoi, N.H.; Hien, N.X.; Vo, T.B.T.; Tuong, T.P. High-resolution mapping of flood and salinity risks for rice production in the Vietnamese Mekong Delta. Field Crops Res. 2019, 236, 111–120. [Google Scholar] [CrossRef]
- Chen, Z.; Liu, J.; Qian, Z.; Li, L.; Zhang, Z.; Feng, G.; Ruan, S.; Sun, G. Monitoring Land Degradation through Vegetation Dynamics Mathematical Modeling: Case of Jornada Basin (in the US). Remote Sens. 2023, 15, 978. [Google Scholar] [CrossRef]
- Wang, T.; Tu, X.; Singh, V.P.; Chen, X.; Lin, K.; Lai, R.; Zhou, Z. Socioeconomic drought analysis by standardized water supply and demand index under changing environment. J. Clean. Prod. 2022, 347, 131248. [Google Scholar] [CrossRef]
- Kim, S.; McDonald, B.C.; Seo, S.; Kim, K.; Trainer, M. Understanding the paths of surface ozone abatement in the Los Angeles Basin. J. Geophys. Res. Atmos. 2022, 127, e2021JD035606. [Google Scholar] [CrossRef]
- Mel, R.A.; Lo Feudo, T.; Miceli, M.; Sinopoli, S.; Maiolo, M. A coupled modelling system to assess the effect of Mediterranean storms under climate change. Nat. Hazards Earth Syst. Sci. Discuss. 2022, 1–31. [Google Scholar] [CrossRef]
- Nandi, S.; Gonela, V. Rainwater harvesting for domestic use: A systematic review and outlook from the utility policy and management perspectives. Util. Policy 2022, 77, 101383. [Google Scholar] [CrossRef]
- Brunner, G.W. HEC-RAS River Analysis System-Hydraulic Reference Manual, Version 5.0; USACE: Washington, DC, USA, 2016. [Google Scholar]
- Malik, S.; Pal, S.C. Potential flood frequency analysis and susceptibility mapping using CMIP5 of MIROC5 and HEC-RAS model: A case study of lower Dwarkeswar River, Eastern India. SN Appl. Sci. 2021, 3, 31. [Google Scholar] [CrossRef]
- Ghimire, E.; Sharma, S.; Lamichhane, N. Evaluation of one-dimensional and two-dimensional HEC-RAS models to predict flood travel time and inundation area for flood warning system. ISH J. Hydraul. Eng. 2022, 28, 110–126. [Google Scholar] [CrossRef]
- Ngo, H.; Bomers, A.; Augustijn, D.C.M.; Ranasinghe, R.; Filatova, T.; van der Meulen, B.; Herget, J.; Hulscher, S.J.M.H. Reconstruction of the 1374 Rhine river flood event around Cologne region using 1D-2D coupled hydraulic modelling approach. J. Hydrol. 2023, 617, 129039. [Google Scholar] [CrossRef]
- Malik, S.; Pal, S.C.; Chowdhuri, I.; Chakrabortty, R.; Roy, P.; Das, B. Prediction of highly flood prone areas by GIS based heuristic and statistical model in a monsoon dominated region of Bengal Basin. Remote Sens. Appl. Soc. Environ. 2020, 19, 100343. [Google Scholar] [CrossRef]
- Ruidas, D.; Saha, A.; Islam, A.R.M.T.; Costache, R.; Pal, S.C. Development of geo-environmental factors controlled flash flood hazard map for emergency relief operation in complex hydro-geomorphic environment of tropical river, India. Environ. Sci. Pollut. Res. 2022, 1–16. [Google Scholar] [CrossRef]
- Lee, J.; Ahn, J. Analysis of Bed Sorting Methods for One Dimensional Sediment Transport Model. Sustainability 2023, 15, 2269. [Google Scholar] [CrossRef]
- Salheddine, M.; André, P.; Mahmoud, H. A coupled 1-D/2-D model for simulating river sediment transport and bed evolution. J. Hydroinform. 2020, 22, 1122–1137. [Google Scholar] [CrossRef]
- Joshi, N.; Lamichhane, G.R.; Rahaman, M.M.; Kalra, A.; Ahmad, S. Application of HEC-RAS to study the sediment transport characteristics of Maumee River in Ohio. In Proceedings of the World Environmental and Water Resources Congress 2019: Hydraulics, Waterways, and Water Distribution Systems Analysis, Pittsburgh, PA, USA, 19–23 May 2019; American Society of Civil Engineers Reston: Reston, VA, USA, 2019; pp. 257–267. [Google Scholar]
- Gordillo, G.; Morales-Hernández, M.; García-Navarro, P. Finite volume model for the simulation of 1D unsteady river flow and water quality based on the WASP. J. Hydroinform. 2020, 22, 327–345. [Google Scholar] [CrossRef]
- Haddout, S.; Priya, K.L.; Adarsh, S. Investigation and comparison of one-dimensional (1-D) analytical models prediction for salt intrusion condition in two selected estuaries. Mar. Georesour. Geotechnol. 2020, 38, 374–384. [Google Scholar] [CrossRef]
- Nizar, Y.; Touazit, A.; Igouzal, M. Predicting the thermal regime of the Sebou river estuary (morocco) using a one-dimensional model (HEC-RAS 5.0). Nat. Environ. Pollut. Technol. 2022, 21, 883–890. [Google Scholar] [CrossRef]
- Pereira, D.A.; Shah, A.; Hasan, M.M.; Ahmad, A.; Alwi, A.T.; Affan, S.; Lazim, Z.M. Saline water intrusion through Rajang river network due to sea level rise. J. Mech. Civ. Eng. IOSR-JMCE 2019, 16, 55–65. [Google Scholar]
- Bui, L.T.; Le, D.T.M. Application of MIKE/SWAT for simulation the salt intrusion–a case study in Ve river, Quang Ngai province. Lowl. Technol. Int. 2020, 22, 258. [Google Scholar]
- Ho, B.Q.; Nguyen, K.D.; Vu, K.H.N.; Nguyen, T.T.; Nguyen, H.T.T.; Ngo, D.D.N.; Tran, H.T.H.; Le, P.H.; Nguyen, Q.H.; Ngo, Q.X. Apply MIKE 11 model to study impacts of climate change on water resources and develop adaptation plan in the Mekong Delta, Vietnam: A case of Can Tho city. Environ. Monit. Assess. 2022, 194, 765. [Google Scholar] [CrossRef] [PubMed]
- Haque, A.; Hossain, K.M.A.; Shadia, N. Coupled 1D hydrodynamic-water quality model of Kobadak-Sibsa River system for salinity. Int. J. Environ. Sci. Dev. 2021, 12, 311–315. [Google Scholar] [CrossRef]
- Islam, M.T. Environmental Flow Assessment of Gorai-Madhumati-Kaliganga-Balaswar River System. Master’s Thesis, Department of Water Resources Engineering (WRE), BUET, Dhaka, Bangladesh, 2019. [Google Scholar]
- Haddout, S.; Maslouhi, A. One-Dimensional Hydraulic Analysis of the Effect of Sea Level Rise on Salinity Intrusion in the Sebou Estuary, Morocco. Mar. Geod. 2018, 41, 270–288. [Google Scholar] [CrossRef]
- Hamdan, A.N.A.; Al-Mahdi, A.A.J.; Mahmood, A.B. Modeling the effect of sea water intrusion into Shatt Al-Arab River (Iraq). J. Univ. Babylon Eng. Sci. 2020, 28, 210–224. [Google Scholar]
- Farahani, N.D.; Shahraiyni, H.T.; Sheikhi, R. Water quality modeling for determination of suitability of water for shrimp farming in tidal rivers. Water Qual. Res. J. 2019, 54, 34–46. [Google Scholar] [CrossRef] [Green Version]
- Tran Anh, D.; Hoang, L.P.; Bui, M.D.; Rutschmann, P. Simulating future flows and salinity intrusion using combined one-and two-dimensional hydrodynamic modelling—The case of Hau River, Vietnamese Mekong delta. Water 2018, 10, 897. [Google Scholar] [CrossRef] [Green Version]
- Ha, N.T.T.; Trang, H.T.; Vuong, N.V.; Khoi, D.N. Simulating impacts of sea level rise on salinity intrusion in the Mekong Delta, Vietnam in the period 2015–2100 using MIKE 11. Naresuan Univ. Eng. J. 2016, 11, 21–24. [Google Scholar]
- Lam, N.T. Real-Time prediction of salinity in the Mekong River Delta. In Proceedings of the International Conference on Asian and Pacific Coasts, Hanoi, Vietnam, 25–28 September 2019; Springer: Berlin/Heidelberg, Germany, 2019; pp. 1461–1468. [Google Scholar]
- Thuy, N.T.D.; Phung, N.K.; Hoan, N.X.; Khoi, D.N. Assessing the impacts of the changes in upstream flow and sea level rise due to climate change on seawater intrusion in Ho Chi Minh City using the HEC-RAS 1D model. Vietnam. J. Hydrometeorol. 2018, 1, 64–69. [Google Scholar]
- Helal, E.; Taher El-Gamal, T.; Ezzat Zidane, A. Improving quantitative and qualitative equity of water distribution systems. Ain Shams Eng. J. 2023, 14, 101969. [Google Scholar] [CrossRef]
- Ismail, H.; Kamal, M.R.; Shanono, N.J.; Amin, S.A. Application of HEC-RAS model for adaptive water allocation in a Large-Scale Rice Irrigation Scheme. Alger. J. Eng. Technol. 2021, 5, 19–29. [Google Scholar]
- Pasquier, U.; He, Y.; Hooton, S.; Goulden, M.; Hiscock, K.M. An integrated 1D–2D hydraulic modelling approach to assess the sensitivity of a coastal region to compound flooding hazard under climate change. Nat. Hazards 2019, 98, 915–937. [Google Scholar] [CrossRef] [Green Version]
- Haddout, S.; Igouzal, M.; Maslouhi, A. Analytical and numerical study of the salinity intrusion in the Sebou river estuary (Morocco) – Effect of the “super Blood Moon” (total lunar eclipse) of 2015. Hydrol. Earth Syst. Sci. 2016, 20, 3923–3945. [Google Scholar]
- Saran, S.H.; Rahman, A.; Yunus, A. Simulation of Flow and Salinity in Rupsha-Passur River System. In Proceedings of the 4th International Conference on Civil Engineering for Sustainable Development (ICCESD 2018), Khulna, Bangladesh, 9–11 February 2018. [Google Scholar]
- Minh, H.V.T.; Tri, V.P.D.; Ut, V.N.; Avtar, R.; Kumar, P.; Dang, T.T.T.; Van Hoa, A.; Van Ty, T.; Downes, N.K. A Model-Based Approach for Improving Surface Water Quality Management in Aquaculture Using MIKE 11: A Case of the Long Xuyen Quadangle, Mekong Delta, Vietnam. Water 2022, 14, 412. [Google Scholar] [CrossRef]
- Montazeri, A.; Mazaheri, M.; Morid, S.; Mosaddeghi, M.R. Effects of upstream activities of Tigris-Euphrates River Basin on water and soil resources of Shatt al-Arab Border River. Sci. Total Environ. 2023, 858, 159751. [Google Scholar] [CrossRef]
- Alabyan, A.M.; Krylenko, I.N.; Lebedeva, S.V.; Panchenko, E.D. World Experience in Numerical Simulation of Flow Dynamics at River Mouths. Water Resour. 2022, 49, 766–780. [Google Scholar] [CrossRef]
- Darji, J.; Lodha, P.; Tyagi, S. Assimilative capacity and water quality modeling of rivers: A review. AQUA—Water Infrastruct. Ecosyst. Soc. 2022, 71, 1127–1147. [Google Scholar] [CrossRef]
- Haque, A.; Hossain, K.M.A.; Student, M.S.E.; Author, C. Salinity Modeling of Kobadak- Sibsa River System By Hec-RAS. In Proceedings of the 5th International Conference on Civil Engineering for Sustainable Development (ICCESD2020), Khulna, Bangladesh, 7–9 February 2020; pp. 1–11. [Google Scholar]
- Kulmart, K.; Pochai, N. Numerical simulation for salinity intrusion measurement models using the MacCormack finite difference method with lagrange interpolation. J. Interdiscip. Math. 2020, 23, 1157–1185. [Google Scholar] [CrossRef]
- Mohammadi, M.; Mohtadi, M. On the Hydraulic Simulation of River Simineh using HEC-RAS and ArcGIS Software. Hydrogeomorphology 2022, 9, 103–187. [Google Scholar]
- Vashist, K.; Singh, K.K. Minimisation of Overestimation of River Flows in 1D-hydrodynamic Modeling; Department of Civil Engineering, NIT: Kurukshetra, India, 2021. [Google Scholar]
- Doan, Q.T.; Nguyen, C.D.; Chen, Y.C.; Pawan, K.M. Modeling the influence of river flow and salinity intrusion in the Mekong River Estuary, Vietnam. Lowl. Technol. Int. 2014, 16, 14–25. [Google Scholar] [CrossRef] [Green Version]
- Yazdi, J.; Moridi, A. Interactive reservoir-watershed modeling framework for integrated water quality management. Water Resour. Manag. 2017, 31, 2105–2125. [Google Scholar] [CrossRef]
- Nash, J.E.; Sutcliffe, J.V. River flow forecasting through conceptual models part I—A discussion of principles. J. Hydrol. 1970, 10, 282–290. [Google Scholar] [CrossRef]
- Kantoush, S.; Van Binh, D.; Sumi, T.; Trung, L.V. Impact of Upstream Hydropower Dams and Climate Change on Hydrodynamics of Vietnamese Mekong Delta. J. Jpn. Soc. Civ. Eng. Ser. B1 (Hydraul. Eng.) 2017, 73, I_109–I_114. [Google Scholar] [CrossRef] [Green Version]
- Doyle, T.W.; Day, R.H.; Michot, T.C. Development of Sea Level Rise Scenarios for Climate Change Assessments of the Mekong Delta, Vietnam; USGS: Reston, VA, USA, 2016. [Google Scholar]
- Vu, H.T.D.; Trinh, V.C.; Tran, D.D.; Oberle, P.; Hinz, S.; Nestmann, F. Evaluating the impacts of rice-based protection dykes on floodwater dynamics in the vietnamese mekong delta using geographical impact factor (Gif). Water 2021, 13, 1144. [Google Scholar] [CrossRef]
- Kuo, A.Y.; Fang, C.S. A mathematical model for salinity intrusion. Coast. Eng. Proc. 1972, 126, 2275–2289. [Google Scholar]
- WUP-JICA. Vol. II: Supporting report, Paper VII: Maintenance of flows on the Mekong Mainstream. In The Study on Hydro-Meteorological Monitoring for Water Quantity Rules in Mekong River Basin; Mekong River Commission: Vientiane, Laos, 2004; Volume II, 184p. [Google Scholar]
- Nguyen, A.D.; Savenije, H.H.G.; Pham, D.N.; Tang, D.T. Using salt intrusion measurements to determine the freshwater discharge distribution over the branches of a multi-channel estuary: The Mekong Delta case. Estuar. Coast. Shelf Sci. 2008, 77, 433–445. [Google Scholar] [CrossRef]
- Brunier, G.; Anthony, E.J.; Goichot, M.; Provansal, M.; Dussouillez, P. Recent morphological changes in the Mekong and Bassac river channels, Mekong delta: The marked impact of river-bed mining and implications for delta destabilisation. Geomorphology 2014, 224, 177–191. [Google Scholar] [CrossRef]
- Jordan, C.; Tiede, J.; Lojek, O.; Visscher, J.; Apel, H.; Nguyen, H.Q.; Quang, C.N.X.; Schlurmann, T. Sand mining in the Mekong Delta revisited-current scales of local sediment deficits. Sci. Rep. 2019, 9, 17823. [Google Scholar] [CrossRef] [PubMed] [Green Version]
- Van Binh, D.; Kantoush, S.; Sumi, T. Changes to long-term discharge and sediment loads in the Vietnamese Mekong Delta caused by upstream dams. Geomorphology 2020, 353, 107011. [Google Scholar] [CrossRef]
- Gruel, C.-R.; Park, E.; Switzer, A.D.; Kumar, S.; Ho, H.L.; Kantoush, S.; Van Binh, D.; Feng, L. New systematically measured sand mining budget for the Mekong Delta reveals rising trends and significant volume underestimations. Int. J. Appl. Earth Obs. Geoinf. 2022, 108, 102736. [Google Scholar] [CrossRef]
- Vasilopoulos, G.; Quan, Q.L.; Parsons, D.R.; Darby, S.E.; Tri, V.P.D.; Hung, N.N.; Haigh, I.D.; Voepel, H.E.; Nicholas, A.P.; Aalto, R. Establishing sustainable sediment budgets is critical for climate-resilient mega-deltas. Environ. Res. Lett. 2021, 16, 064089. [Google Scholar] [CrossRef]
- Loc, H.H.; Van Binh, D.; Park, E.; Shrestha, S.; Dung, T.D.; Son, V.H.; Truc, N.H.T.; Mai, N.P.; Seijger, C. Intensifying saline water intrusion and drought in the Mekong Delta: From physical evidence to policy outlooks. Sci. Total Environ. 2021, 757, 143919. [Google Scholar] [CrossRef]
- Rentier, E.S.E.; Cammeraat, L.H.E. The environmental impacts of river sand mining. Sci. Total Environ. 2022, 838, 155877. [Google Scholar] [CrossRef]
- Hui, T.R.; Park, E.; Loc, H.H.; Tien, P.D. Long-term hydrological alterations and the agricultural landscapes in the Mekong Delta: Insights from remote sensing and national statistics. Environ. Chall. 2022, 7, 100454. [Google Scholar] [CrossRef]
- Tri, V.P.D.; Trung, P.K.; Trong, T.M.; Parsons, D.R.; Darby, S.E. Assessing social vulnerability to riverbank erosion across the Vietnamese Mekong Delta. Int. J. River Basin Manag. 2022, 1–12. [Google Scholar] [CrossRef]
- Le Huy, B.; Le, H.; Xuan, H.N. The Harmful Effect of the Hydro-Electric Dams Upstream of the Mekong River: Effect on the Ecosystems and Livelihoods of People in Mekong Delta, Vietnam. Water Conserv. Sci. Eng. 2022, 7, 1–20. [Google Scholar] [CrossRef]
- Tran, T.A.; Tortajada, C. Responding to transboundary water challenges in the Vietnamese Mekong Delta: In search of institutional fit. Environ. Policy Gov. 2022, 32, 331–347. [Google Scholar] [CrossRef]
- Park, E. Environmental issues in the Mekong Delta: Drivers, consequences, and management outlooks. Geogr. Dig. 2022, 1, 1. [Google Scholar]
- Feng, W.; Lei, Z.; Zhou, Z. Mekong River Basin International Cooperation: The Organizational and Geopolitical Mobilizations. In Proceedings of the 2021 International Conference on Public Art and Human Development (ICPAHD 2021), Kunming, China, 24–26 December 2021; Volume 638, pp. 323–328. [Google Scholar]
- Jordan, C.; Visscher, J.; Dung, N.V.; Apel, H.; Schlurmann, T. Impacts of human activity and global changes on future morphodynamics within the tien river, vietnamese mekong delta. Water 2020, 12, 2204. [Google Scholar] [CrossRef]
- Park, E.; Loc, H.H.; Van Binh, D.; Kantoush, S. The worst 2020 saline water intrusion disaster of the past century in the Mekong Delta: Impacts, causes, and management implications. Ambio 2022, 51, 691–699. [Google Scholar] [CrossRef]
- Van Tho, N. Salinity Intrusion in the Vietnamese Mekong Delta, a Threat: Possible Causes, Effects on People’s Life and Production, and Temporary Solutions and Adaptable Strategies. In Sustainable Development of Water and Environment; Springer: Berlin/Heidelberg, Germany, 2022; pp. 1–10. [Google Scholar]
- Pham, T.T.B.; Nguyen, V.T.; Pham, B.T.; Tran, H.D.; Duong, M.B.; Ngo, T.T.M.; Mai, T.D.; Pham, Q.M. Seawater Intrusion Processes Along the Tien River Mouth in the Period 2000–2020. In Proceedings of the International Conference on Geo-Spatial Technologies and Earth Resources, Hanoi, Vietnam, 13–14 October 2022; Springer: Berlin/Heidelberg, Germany, 2023; pp. 19–34. [Google Scholar]
- Le, H.-M.; Ludwig, M. The Salinization of Agricultural Hubs: Impacts and Adjustments to Intensifying Saltwater Intrusion in the Mekong Delta. In Beiträge zur Jahrestagung des Vereins für Socialpolitik 2022: Big Data in Economics; ZBW-Leibniz Information Centre for Economics: Kiel, Hamb, 2022. [Google Scholar]
- Chowdhury, M.M.A. Assessment of Sediment and Salinity in the Lower Mekong River Basin. Master’s Thesis, Virginia Tech, Blacksburg, VA, USA, 2023. [Google Scholar]
- Kang, H.; Sridhar, V.; Mainuddin, M.; Trung, L.D. Future rice farming threatened by drought in the Lower Mekong Basin. Sci. Rep. 2021, 11, 9383. [Google Scholar] [CrossRef]
- Lavane, K.; Kumar, P.; Meraj, G.; Han, T.G.; Ngan, L.H.B.; Lien, B.T.B.; Van Ty, T.; Thanh, N.T.; Downes, N.K.; Nam, N.D.G. Assessing the Effects of Drought on Rice Yields in the Mekong Delta. Climate 2023, 11, 13. [Google Scholar] [CrossRef]
- Van Binh, D.; Kantoush, S.A.; Saber, M.; Mai, N.P.; Maskey, S.; Phong, D.T.; Sumi, T. Long-term alterations of flow regimes of the Mekong River and adaptation strategies for the Vietnamese Mekong Delta. J. Hydrol. Reg. Stud. 2020, 32, 100742. [Google Scholar] [CrossRef]
- Kang, H.; Sridhar, V. A near-term drought assessment using hydrological and climate forecasting in the Mekong River Basin. Int. J. Climatol. 2021, 41, E2497–E2516. [Google Scholar] [CrossRef]
- Truong, Q.C.; Nguyen, T.H.; Tatsumi, K.; Pham, V.T.; Tri, V.P.D. A Land-Use Change Model to Support Land-Use Planning in the Mekong Delta (MEKOLUC). Land 2022, 11, 297. [Google Scholar] [CrossRef]
- Diep, N.T.H.; Trung, P.K.; Nhung, D.T.C.; Huong, N.T.T.; Vu, P.T.; Tuan, L.A. Adaptation to saline intrusion for agriculture farming transformation in the coastal Ben Tre province, Vietnam. In Proceedings of the 2nd International Conference on Environment, Resources and Earth Sciences (ICERES 2021), Ho Chi Minh City, Vietnam, 29 October 2021; Volume 964. [Google Scholar]
- Yen, B.T.; Son, N.H.; Amjath-Babu, T.S.; Sebastian, L. Development of a participatory approach for mapping climate risks and adaptive interventions (CS-MAP) in Vietnam’s Mekong River Delta. Clim. Risk Manag. 2019, 24, 59–70. [Google Scholar] [CrossRef]
- Yen, B.T. Protocol for Mapping Climate-Risks and Associated Adaptation Plans under Asian Mega-Deltas Initiative; IRRI: Hanoi, Vietnam, 2022. [Google Scholar]
- Tuu, N.T.; Lim, J.; Kim, S.; Pham Dang Tri, V.; Kim, H.; Kim, J. Surface water resource assessment of paddy rice production under climate change in the Vietnamese Mekong Delta: A system dynamics modeling approach. J. Water Clim. Chang. 2019, 11, 514–528. [Google Scholar] [CrossRef] [Green Version]
- Nguyen, T.T.V.; Nguyen, M.T.; Tran, H.H.; Loi, L.T.; Tri, V.P.D. Effectiveness of surface water resources management for agriculture and aquaculture in the context of saline intrusion in Ben Tre province. Can Tho Univ. J. Sci. 2021, 57, 82–92. [Google Scholar]
- Thanh, T.; Chi Sy, P.; Van, H.T.T.; Quy, N.D.; Buu, L.T.H.; Van Tan, L. Technology selection and potential application of IOT technology in the desalination system to supply domestic water to people in saline intrusion areas, Ben Tre provine. Vietnam J. Hydrometeorol. 2022, EME4, 370–381. [Google Scholar]
- Apel, H.; Khiem, M.; Quan, N.H.; Toan, T.Q. Brief communication: Seasonal prediction of salinity intrusion in the Mekong Delta. Nat. Hazards Earth Syst. Sci. 2020, 20, 1609–1616. [Google Scholar] [CrossRef]
- Do, P. Application of GIS to Evaluate Saltwater Intrusion on Agricultural Production in the Mekong Delta. Bachelor’s Thesis, University of Applied Sciences, Kouvola, Finland, 2021. [Google Scholar]
- Dangc, K.K.; Doan, M.T.; Le, T.H.L.; Nguyen, T.T.N.; Pham, D.T.; Do, H.T.; Ngo, S.D.; Vu, T.B.N.; Nguyen, P.A. Assessing the Performance of Climate Smart Rice Production Systems in the Upper Part of the Vietnamese Mekong River Delta. Asian J. Agric. Dev. 2021, 18, 16–29. [Google Scholar]
- Le, T.T.; Bui, T.Y.; Van Pham, T.; Nguyen, V.K.; Tran, T.M.H.; Nguyen, V.H.; Bernardo, E.; Celeridad, R. Guidebook on the Development of Climate-Smart Maps and Adaptation Plans (CS-MAP) for Rice Production in Viet Nam; CGIAR Research Program on Climate Change, Agriculture and Food Security (CCAFS): Hanoi, Vietnam, 2021. [Google Scholar]
- Van Tinh, T.; Ngoc Vang, N. The domestic rice value chain in the mekong delta. In White Gold: The Commercialisation of Rice Farming in the Lower Mekong Basin; Springer: Berlin/Heidelberg, Germany, 2020; pp. 375–395. [Google Scholar]
- Veliu, A.; Gessese, N.; Ragasa, C.; Okali, C. Gender Analysis of Aquaculture Value Chain in Northeast Vietnam and Nigeria. In Gender Analysis of Aquaculture Value Chain in Northeast Vietnam and Nigeria; World Bank: Washington, DC, USA, 2009. [Google Scholar]
- Lim, G. Value chain upgrading: Evidence from the Singaporean aquaculture industry. Mar. Policy 2016, 63, 191–197. [Google Scholar] [CrossRef]
- Quyen, N.T.K.; Hien, H.V.; NH, H. Value Chain Analysis in Domestic Aquaculture: Case Study of Swamp Eel (Monopterus Albus) Culture in An Giang Province, Vietnam. Int. J. Sci. Res. Publ. 2019, 9, 638–646. [Google Scholar]
- Tran, D.D.; Park, E.; Tuoi, H.T.N.; Thien, N.D.; Tu, V.H.; Ngoc, P.T.A.; Van, C.T.; Long, P.K.; Ho, H.L.; Quang, C.N.X. Climate change impacts on rice-based livelihood vulnerability in the lower Vietnamese Mekong Delta: Empirical evidence from Can Tho City and Tra Vinh Province. Environ. Technol. Innov. 2022, 28, 102834. [Google Scholar] [CrossRef]
- Van Binh, D.; Kantoush, S.A.; Ata, R.; Tassi, P.; Nguyen, T.V.; Lepesqueur, J.; Abderrezzak, K.E.K.; Bourban, S.E.; Nguyen, Q.H.; Phuong, D.N.L. Hydrodynamics, sediment transport, and morphodynamics in the Vietnamese Mekong Delta: Field study and numerical modelling. Geomorphology 2022, 413, 108368. [Google Scholar] [CrossRef]
- Ngo, K.D.; Lechner, A.M.; Vu, T.T. Land cover mapping of the Mekong Delta to support natural resource management with multi-temporal Sentinel-1A synthetic aperture radar imagery. Remote Sens. Appl. Soc. Environ. 2020, 17, 100272. [Google Scholar] [CrossRef]
- Nguyen Thanh, T.; Tri, V.P.D.; Kim, S.; Phuong, T.N.; Mong, T.L.; Tuan, P.V. A Subregional Model of System Dynamics Research on Surface Water Resource Assessment for Paddy Rice Production under Climate Change in the Vietnamese Mekong Delta. Climate 2020, 8, 41. [Google Scholar] [CrossRef] [Green Version]


| Scenarios | Sea Level Rise | Average River Discharge Change | References | |
|---|---|---|---|---|
| Can Tho | My Thuan | |||
| SLR17 | 17 cm | −128% (−2501 m3/s) | −117% (−2557 m3/s) | [12,42,61] |
| SLR22 | 22 cm | −128% (−2501 m3/s) | −117% (−2557 m3/s) | [12,42,61] |
| SLR26L | 26 cm | −100% (−1123 m3/s) | −80% (−1069 m3/s) | [13,42] |
| SLR26H | 26 cm | −100% (−1123 m3/s) | −83% (−1109 m3/s) | [13,42] |
| Station | 2020 (Calibration) | 2015 (Validation) | ||
|---|---|---|---|---|
| R2 | NSE | R2 | NSE | |
| Lang The | 0.80 | 0.62 | 0.88 | 0.56 |
| Tra Vinh | 0.86 | 0.73 | 0.92 | 0.81 |
| Hung My | 0.92 | 0.79 | 0.88 | −0.30 |
| Duong Duc | 0.80 | 0.60 | 0.82 | 0.53 |
| Cau Quan | 0.87 | 0.73 | 0.86 | 0.53 |
| Tra Kha | 0.96 | 0.79 | 0.86 | 0.48 |
| Scenario | 2020 | SLR17 | SLR22 | SLR26L | SLR26H |
|---|---|---|---|---|---|
| Distribution ratio (%) | 59 | 69 | 71 | 86 | 83 |
| Station | Scenario | |||
|---|---|---|---|---|
| SLR17 | SLR22 | SLR26L | SLR26H | |
| Lang The | +21% (+0.8 g/L) | +20% (+0.8 g/L) | +12% (+0.5 g/L) | +13% (+0.5 g/L) |
| Tra Vinh | +15% (+0.8 g/L) | +14% (+0.8 g/L) | +8% (+0.4 g/L) | +9% (+0.5 g/L) |
| Hung My | +8% (+0.7 g/L) | +7% (+0.6 g/L) | +4% (+0.4 g/L) | +5% (+0.4 g/L) |
| Duong Duc | +28% (+1.0 g/L) | +29% (+1.1 g/L) | +26% (+1.0 g/L) | +26% (+1.0 g/L) |
| Cau Quan | +14% (+0.9 g/L) | +14% (+0.9 g/L) | +13% (+0.8 g/L) | +13% (+0.8 g/L) |
| Tra Kha | +3% (+0.3 g/L) | +3% (+0.3 g/L) | +3% (+0.3 g/L) | +3% (+0.3 g/L) |
Disclaimer/Publisher’s Note: The statements, opinions and data contained in all publications are solely those of the individual author(s) and contributor(s) and not of MDPI and/or the editor(s). MDPI and/or the editor(s) disclaim responsibility for any injury to people or property resulting from any ideas, methods, instructions or products referred to in the content. |
© 2023 by the authors. Licensee MDPI, Basel, Switzerland. This article is an open access article distributed under the terms and conditions of the Creative Commons Attribution (CC BY) license (https://creativecommons.org/licenses/by/4.0/).
Share and Cite
Thanh, T.N.; Huynh Van, H.; Vo Minh, H.; Tri, V.P.D. Salinity Intrusion Trends under the Impacts of Upstream Discharge and Sea Level Rise along the Co Chien River and Hau River in the Vietnamese Mekong Delta. Climate 2023, 11, 66. https://doi.org/10.3390/cli11030066
Thanh TN, Huynh Van H, Vo Minh H, Tri VPD. Salinity Intrusion Trends under the Impacts of Upstream Discharge and Sea Level Rise along the Co Chien River and Hau River in the Vietnamese Mekong Delta. Climate. 2023; 11(3):66. https://doi.org/10.3390/cli11030066
Chicago/Turabian StyleThanh, Tuu Nguyen, Hiep Huynh Van, Hoang Vo Minh, and Van Pham Dang Tri. 2023. "Salinity Intrusion Trends under the Impacts of Upstream Discharge and Sea Level Rise along the Co Chien River and Hau River in the Vietnamese Mekong Delta" Climate 11, no. 3: 66. https://doi.org/10.3390/cli11030066