
D-SPARC: Rapid Field Albedo Measurement


1
Department of Civil Engineering, Indian Institute of Technology Gandhinagar, Gandhinagar 382355, Gujarat, India
2
Department of Civil and Environmental Engineering, University of Illinois at Urbana-Champaign, Urbana, IL 61801, USA
*
Author to whom correspondence should be addressed.
Climate 2023, 11(3), 64; https://doi.org/10.3390/cli11030064
Submission received: 1 February 2023
/
Revised: 8 March 2023
/
Accepted: 10 March 2023
/
Published: 11 March 2023
Abstract
:The albedo of surfaces in urban areas plays an important role in regulating the urban microclimate and needs to be measured. Artificial urban surfaces, e.g., pavements with lower albedo than natural surfaces such as grass or soil, are a key contributor to the Urban Heat Island (UHI) effect. However, widespread measurement of pavement albedo in the field remains challenging due to limited available daylight hours to record the measurements, the need for clear sky conditions, and slow data collection speed. A new portable system called Discrete SPectrAl RefleCtometer (D-SPARC) was developed to overcome these difficulties. D-SPARC was calibrated in the lab using 25 concrete specimens of known albedo and found to be accurate to within ±0.05, which is similar or better than recently developed aerial or satellite methods. The calibrated D-SPARC device was then used to acquire measurements on ten pavement sections during both the day and night and compared to the results from an albedometer. The RMSE during the day was 0.06 and during the night was 0.02. Each measurement with D-SPARC took about 4 min per test location as compared to 15 min with the albedometer. D-SPARC can be used to conveniently and rapidly measure pavement albedo over a road network with reasonable accuracy and minimal traffic disruption.
1. Introduction
The albedo of a surface is the fraction of incident solar radiation that is reflected by it, i.e., albedo is a ratio and hence has no units. Albedo plays an important role in regulating the urban microclimate through the development of the Urban Heat Island (UHI) effect, and is thus an important parameter that needs to be measured. The UHI effect results in higher air temperatures in urban areas as compared to adjacent rural areas. One of the main reasons for the development of UHI is the replacement of natural surfaces with artificial ones (including roofs, walls, and pavements), which have a lower albedo [1,2]. Due to the lower albedo, surfaces in urban areas absorb a greater fraction of incident solar radiation.
The additional radiation absorbed leads to a higher surface temperature, which in turn heats the air around the surface and hence develops the UHI effect. Qin et al. [3] showed that surface temperature linearly correlates with albedo, while Sen and Roesler [4] and Sen and Khazanovich [5] demonstrated through simulations that air temperature also increases with surface temperature within an urban canyon. The typical albedo of new asphalt pavements has been reported to be approximately 0.05–0.10, which increases to 0.15–0.20 within a year of construction [6,7], while that of new concrete pavements is 0.35–0.40 and older concrete is 0.20–0.30 [8]. However, significant variation in albedo has been observed in the field [6,9,10] and therefore, accurately characterizing the UHI effect requires rapid measurement of albedo at several points within a city.
Several techniques have been developed to measure the albedo of pavement surfaces. These can broadly be classified as either laboratory or field methods. There is one main laboratory method, described in ASTM E903 [11], which uses a spectrophotometer and integrating spheres to measure the spectral reflectance of a pavement material sample. The measured spectral reflectance is then averaged over a standard solar spectrum to calculate the material’s albedo. This method does not depend on outdoor conditions and can be used to evaluate laboratory samples quickly and accurately. However, this requires taking cores from pavements, which can be expensive and time-consuming, and the coring process generates slurry that can affect the albedo of the specimen.
Consequently, several field methods have been proposed in the literature. These can be sub-divided into two major categories: remote and ground-based sensing. Remote sensing methods typically use satellite-based measurements of radiation emitted by surfaces to calculate albedo [12,13,14,15]. They are useful in measuring the change in albedo over time, however, they are limited in their resolution, with high-resolution data sets capable of resolving the albedo of individual pavements being difficult and expensive to obtain. Ban-Weiss et al. [16] used such high-resolution spectral images from airplanes together with field calibration points to develop maps of individual roofs in seven cities in California. These airplanes fly at altitudes lower than satellites and provide better resolution than satellites, albeit at a higher cost. In comparison, Gaitani et al. [17] obtained spectral images from Unmanned Aerial Vehicles (UAVs). As UAVs fly at an even lower altitude than airplanes, they provide high-resolution data, but still require an expensive, high-resolution spectral camera.
Ground-based methods typically use either a portable reflectometer (as described in ASTM C1549 [18]) or a double pyranometer (also called an albedometer, as described in ASTM E1918 [19]). Portable reflectometers that cover the entire solar spectrum are expensive, hence most of the literature has focused on measuring albedo using an albedometer. Several studies [6,20,21,22,23,24] have directly applied ASTM E1918 to measure pavement albedo. This requires a pavement area of at least 4 m × 4 m size, which is difficult to practically construct in the laboratory and inconvenient to cordon off in the field. Thus, several studies have been published to enable albedometers to be used for surfaces of smaller size [25,26,27,28].
While methods using an albedometer have very high resolution with the ability to directly measure the albedo of individual surfaces, they take a long time to set up and move around, slowing down the pace at which measurements over a road network can be taken. Moreover, they typically require a traffic lane to be closed during testing, which increases costs and reduces the number of points that can be collected. Furthermore, these albedo measurements require clear skies, which makes planning difficult and less predictable for survey times. Finally, these methods are sensitive to the zenith angle of the sun and the available testing period is limited to a few hours a day (4–6 h depending on the season as recommended by ASTM E1918). In order to rapidly measure the albedo of road networks, especially in urban areas with ground-based techniques, it is critical that these three shortcomings be addressed while also ensuring a reasonable cost and time for each measurement. This paper describes the development of a new, low-cost instrument that addresses all of these concerns and provides a device that helps engineers to rapidly measure the albedo of pavements over a large area with reasonable accuracy.
Study Objectives
A new instrument, called the Discrete SPectrAl RefleCtometer (D-SPARC), was developed to measure pavement albedo. There were four primary goals during its development:
- The instrument should be capable of measuring albedo at any time of the day or night, and not just the 4–6 h permitted by ASTM E1918;
- The instrument should be able to measure albedo irrespective of the level of cloudiness in the sky;
- The instrument should be able to quickly and conveniently measure the albedo at many points along the pavement section; and
- The measured albedo should be reasonably accurate with respect to the “true” value measured using ASTM E1918.
In addition to these primary goals, two secondary goals were also considered important; the cost of the instrument should be as reasonable to enable it to be adopted by a wide user group, and easy to carry and operate by a single user. The principle of D-SPARC was to use a set of portable light sources to measure the light reflected by the surface of pavement at discrete wavelengths, and then estimate the overall albedo of the surface through a calibration process.
This paper describes the development, mechanism, calibration, and verification of D-SPARC. The aim was to demonstrate that the instrument met the aforementioned goals while also being simple and quick to use. In the following sections, the layout, data processing, and calibration process of the instrument are described, followed by its application to pavement surfaces in the field. The paper concludes by summarizing how the primary and secondary goals were met.
2. Methodology
2.1. Layout and Components
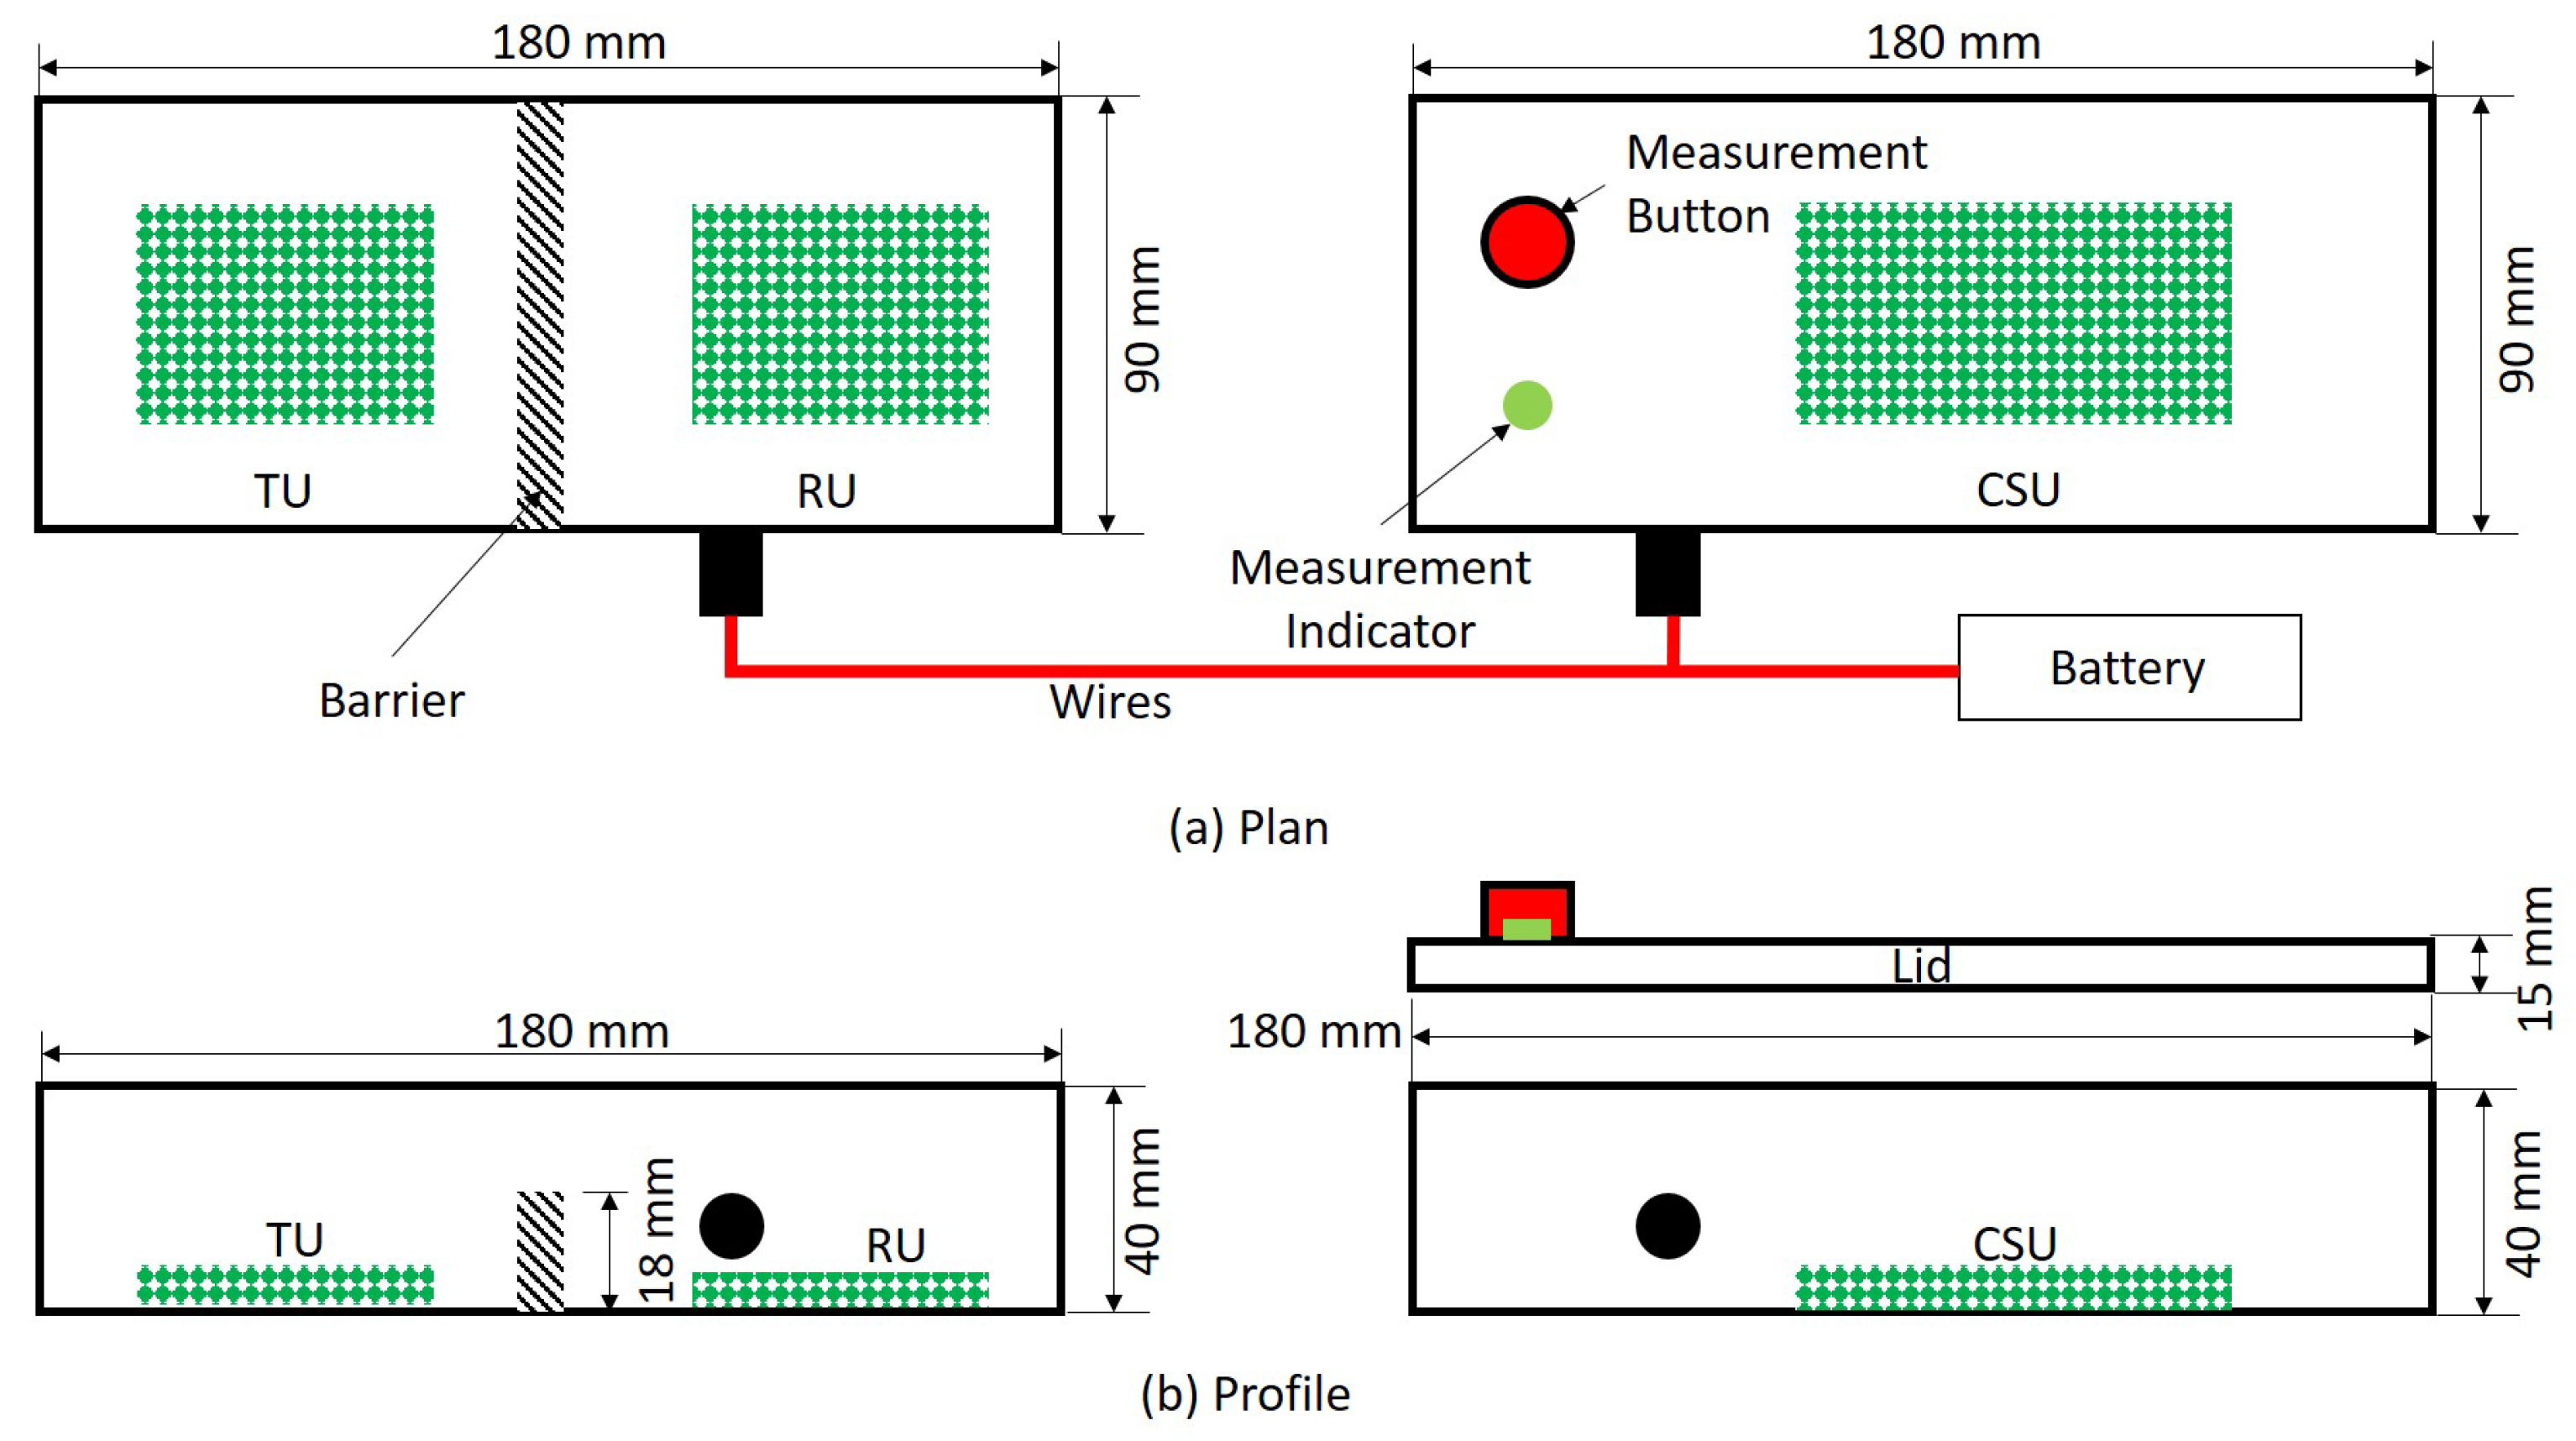
The D-SPARC instrument consisted of three units: Transmitter Unit (TU), Receiver Unit (RU), and Controller and Storage Unit (CSU). The TU would produce light in a specific bandwidth, which would be partially reflected from the pavement surface and be measured by the RU. The TU and RU were separated by an 18 mm high barrier to avoid light from being received directly. The CSU would trigger the lights in the TU, receive the reflected light data from the RU, and store the data for processing. The three units were organized into two 180 mm × 90 mm × 40 mm boxes that could be held and operated by a single operator. A schematic diagram showing the arrangement of these units is shown in Figure 1, while a picture of the instrument is shown in Figure 2. In addition to these three units, a 12 V battery, a measurement button that could be used by the operator to take a measurement, a measurement indicator to show when measurements were being taken, and connecting wires were also part of the setup. The button and indicator were housed on a lid that protected the CSU.
An important assumption made in developing D-SPARC was that pavements are perfectly diffuse reflectors that obey Lambertian reflectance. Thus, the bidirectional reflectance distribution function (BRDF) of light incident on the pavement from the TU was constant, and the exact angular position of the RU with respect to the TU did not affect the reflected light received by the RU. This assumption was also made in all the existing methods for measuring albedo discussed in the introduction and is generally correct.
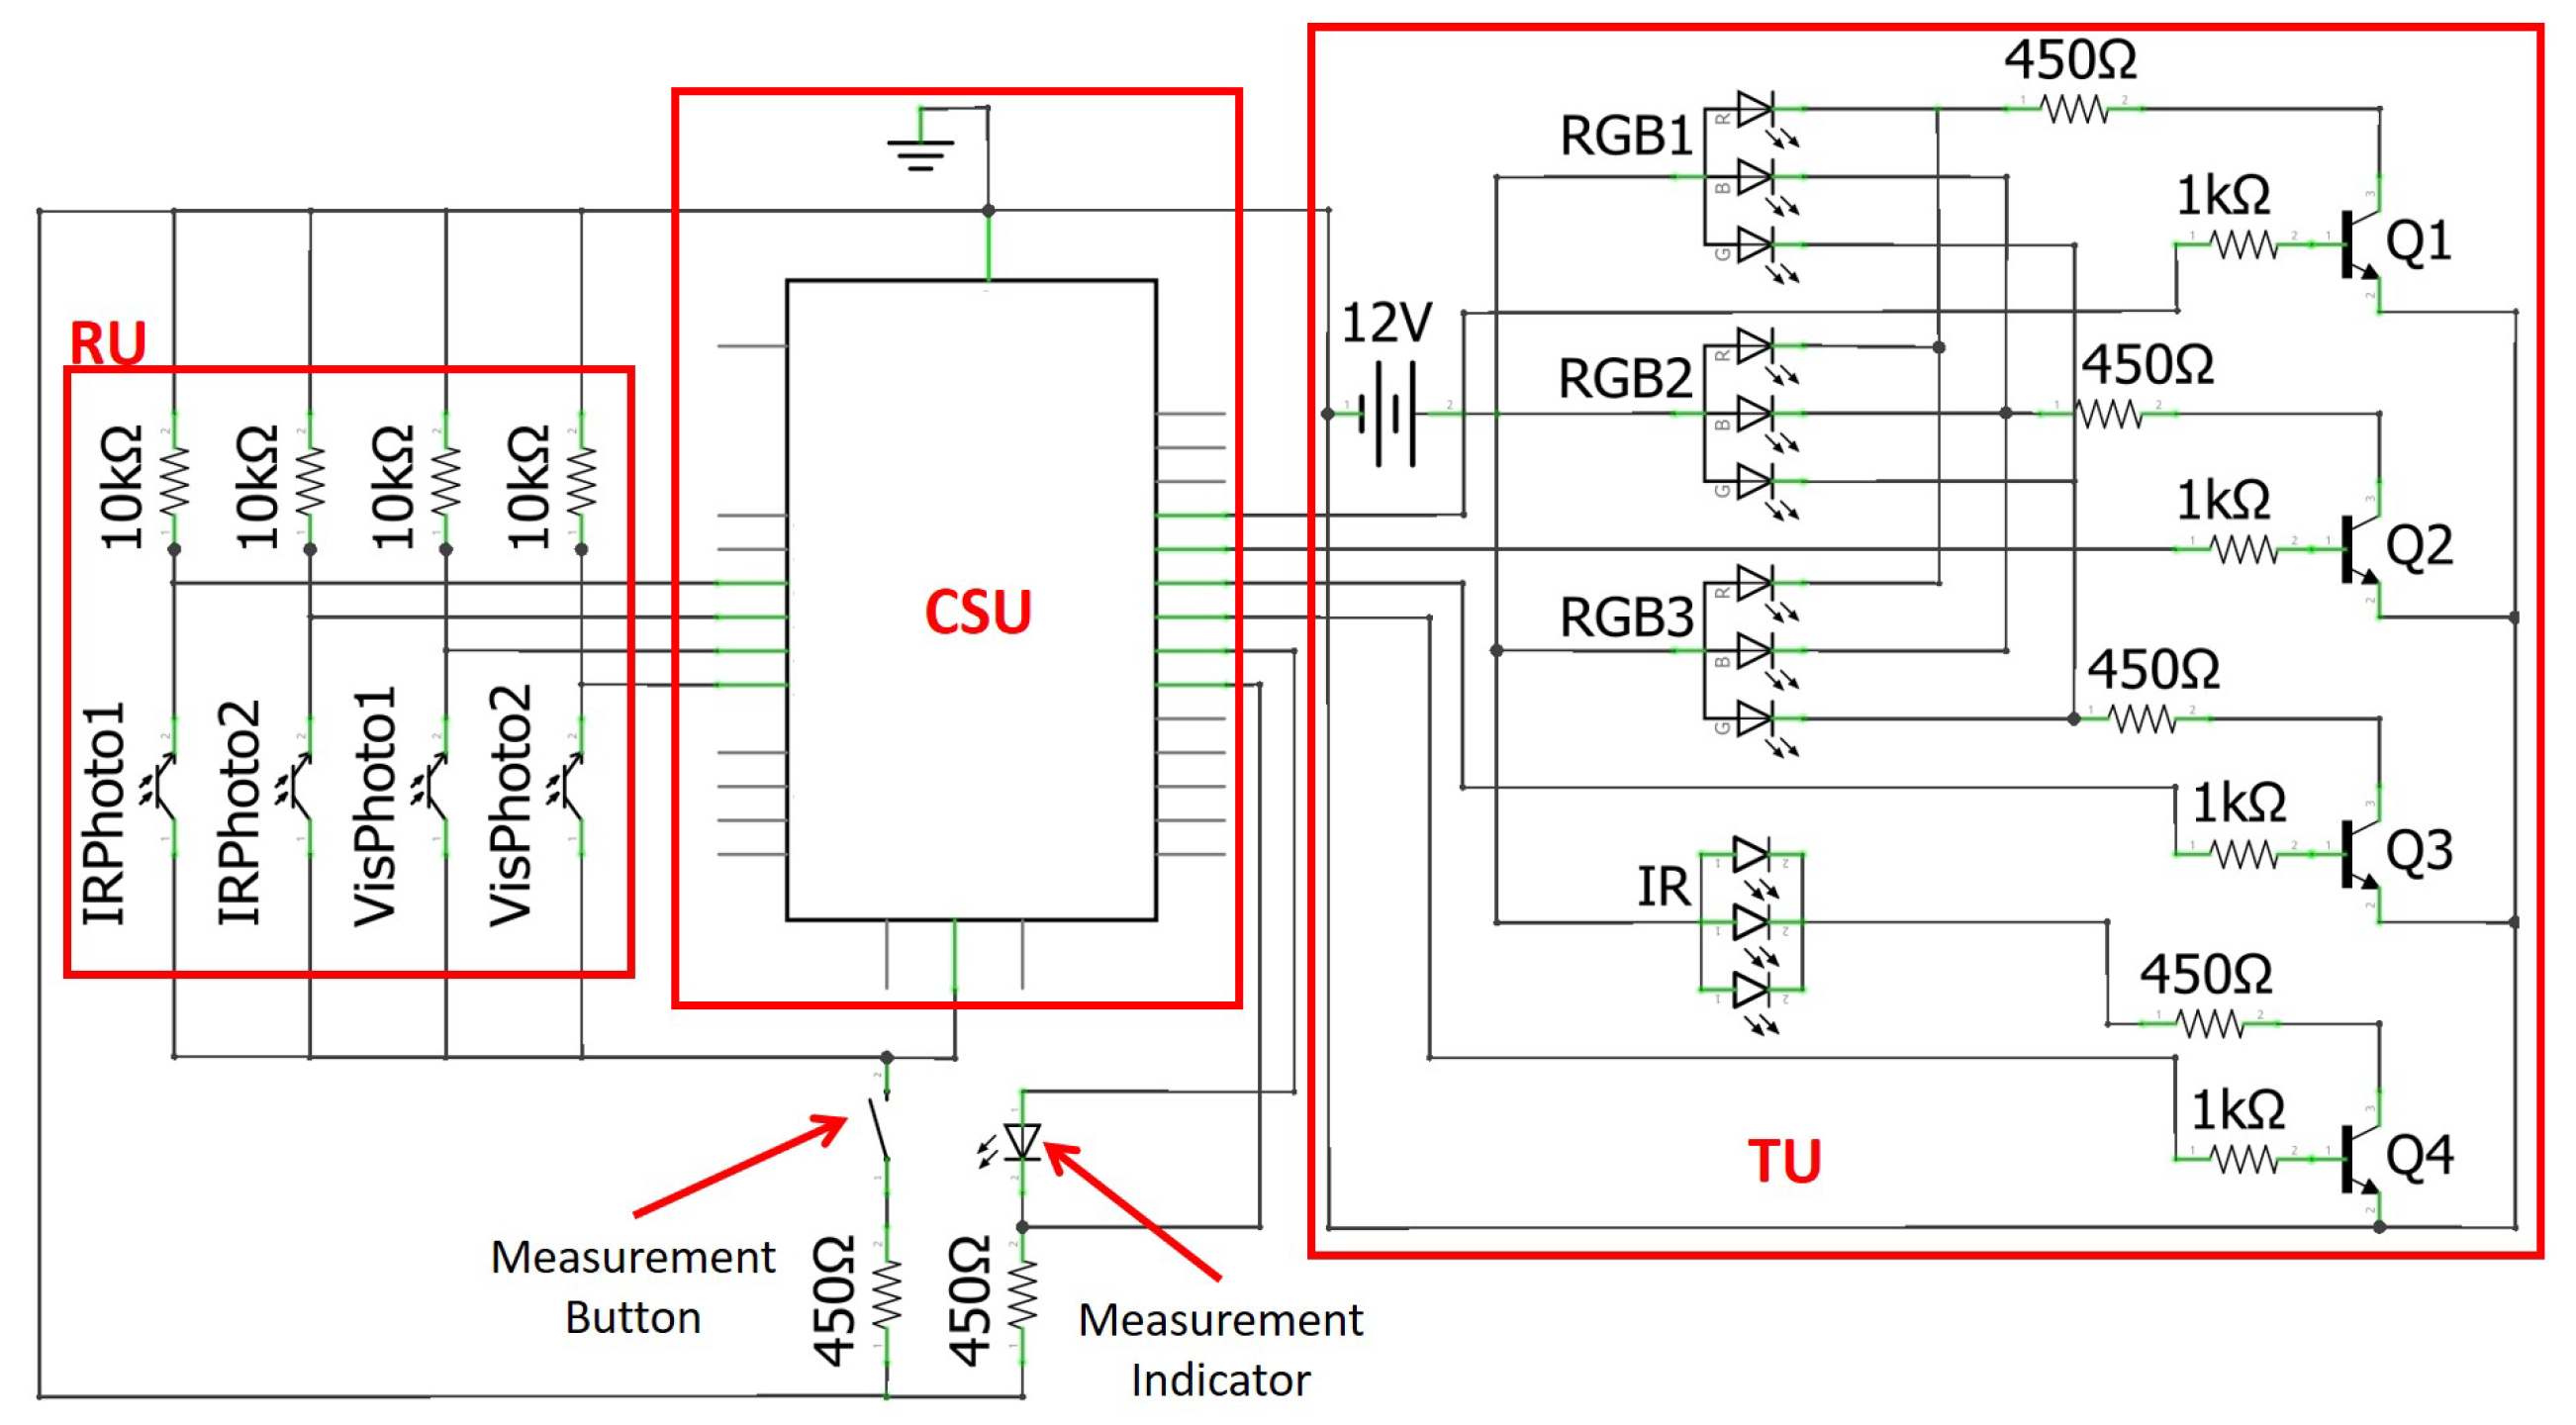
All three units were made from readily-available electronic components assembled onto circuit boards. The circuit diagram for it is shown in Figure 3, with the components corresponding to each unit, the battery, the measurement button, and the measurement indicator labeled. The TU, serving as a portable light source, consisted of three common anode Red-Green-Blue (RGB) and a set of three Infrared (IR) light-emitting diodes (LEDs), shown as RGB1, RGB2, RGB3, and IR, respectively. The RGB LEDs can be activated as separate red, green, and blue LEDs connected in parallel with a common anode, as shown. These RGB LEDs were used instead of nine independent LEDs (three red, three green, and three blue) to keep the circuit and device compact. The IR LEDs were grouped together with a common anode as well, and this group was in-turn placed in parallel with each of the RGB LEDs. Technical details about each of the LEDs are shown in Table 1.
The LEDs were connected to the 12 V battery at the anode. This separate battery provided enough power to maximize the brightness of the emitted light. The red, green, and blue cathodes of the RGB LEDs were connected to one NPN transistor each (shown as Q1, Q2, and Q3), as were the three IR LEDs (Q4). These transistors were connected to the CSU at their base and to each other in a common emitter configuration, so that the CSU could independently activate the red, green, blue, and IR LEDs.
The RU’s role was to detect and measure the intensity of reflected light from the pavement surface. The RU consisted of four photo-transistors: two (labeled VisPhoto1 and VisPhoto2) that were sensitive to light in the visible range for the RGB LEDs, and two (labeled IRPhoto1 and IRPhoto2) in the IR range for the IR LEDs. Two of each were used in order to provide redundancy. Technical details of the photo-transistors are provided in Table 2. The photo-transistors were placed in series with 10 kΩ resistors to create a photo-detecting circuit that generated a voltage proportionate to the magnitude of reflected light received. The CSU recorded this voltage scaled between 0 and 5 V.
The last component of D-SPARC was the CSU, which interfaced with the user to control the RU and TU and store the results to a memory card. The CSU consisted of a microcontroller with a separate 5 V power source and a memory card reader/writer. Additionally, the measurement button and indicator were connected to the CSU. When the user pressed the measurement button, the CSU would initiate data collection and storage, and turn on the indicator until the automated data collection was completed.
2.2. Data Collection Process
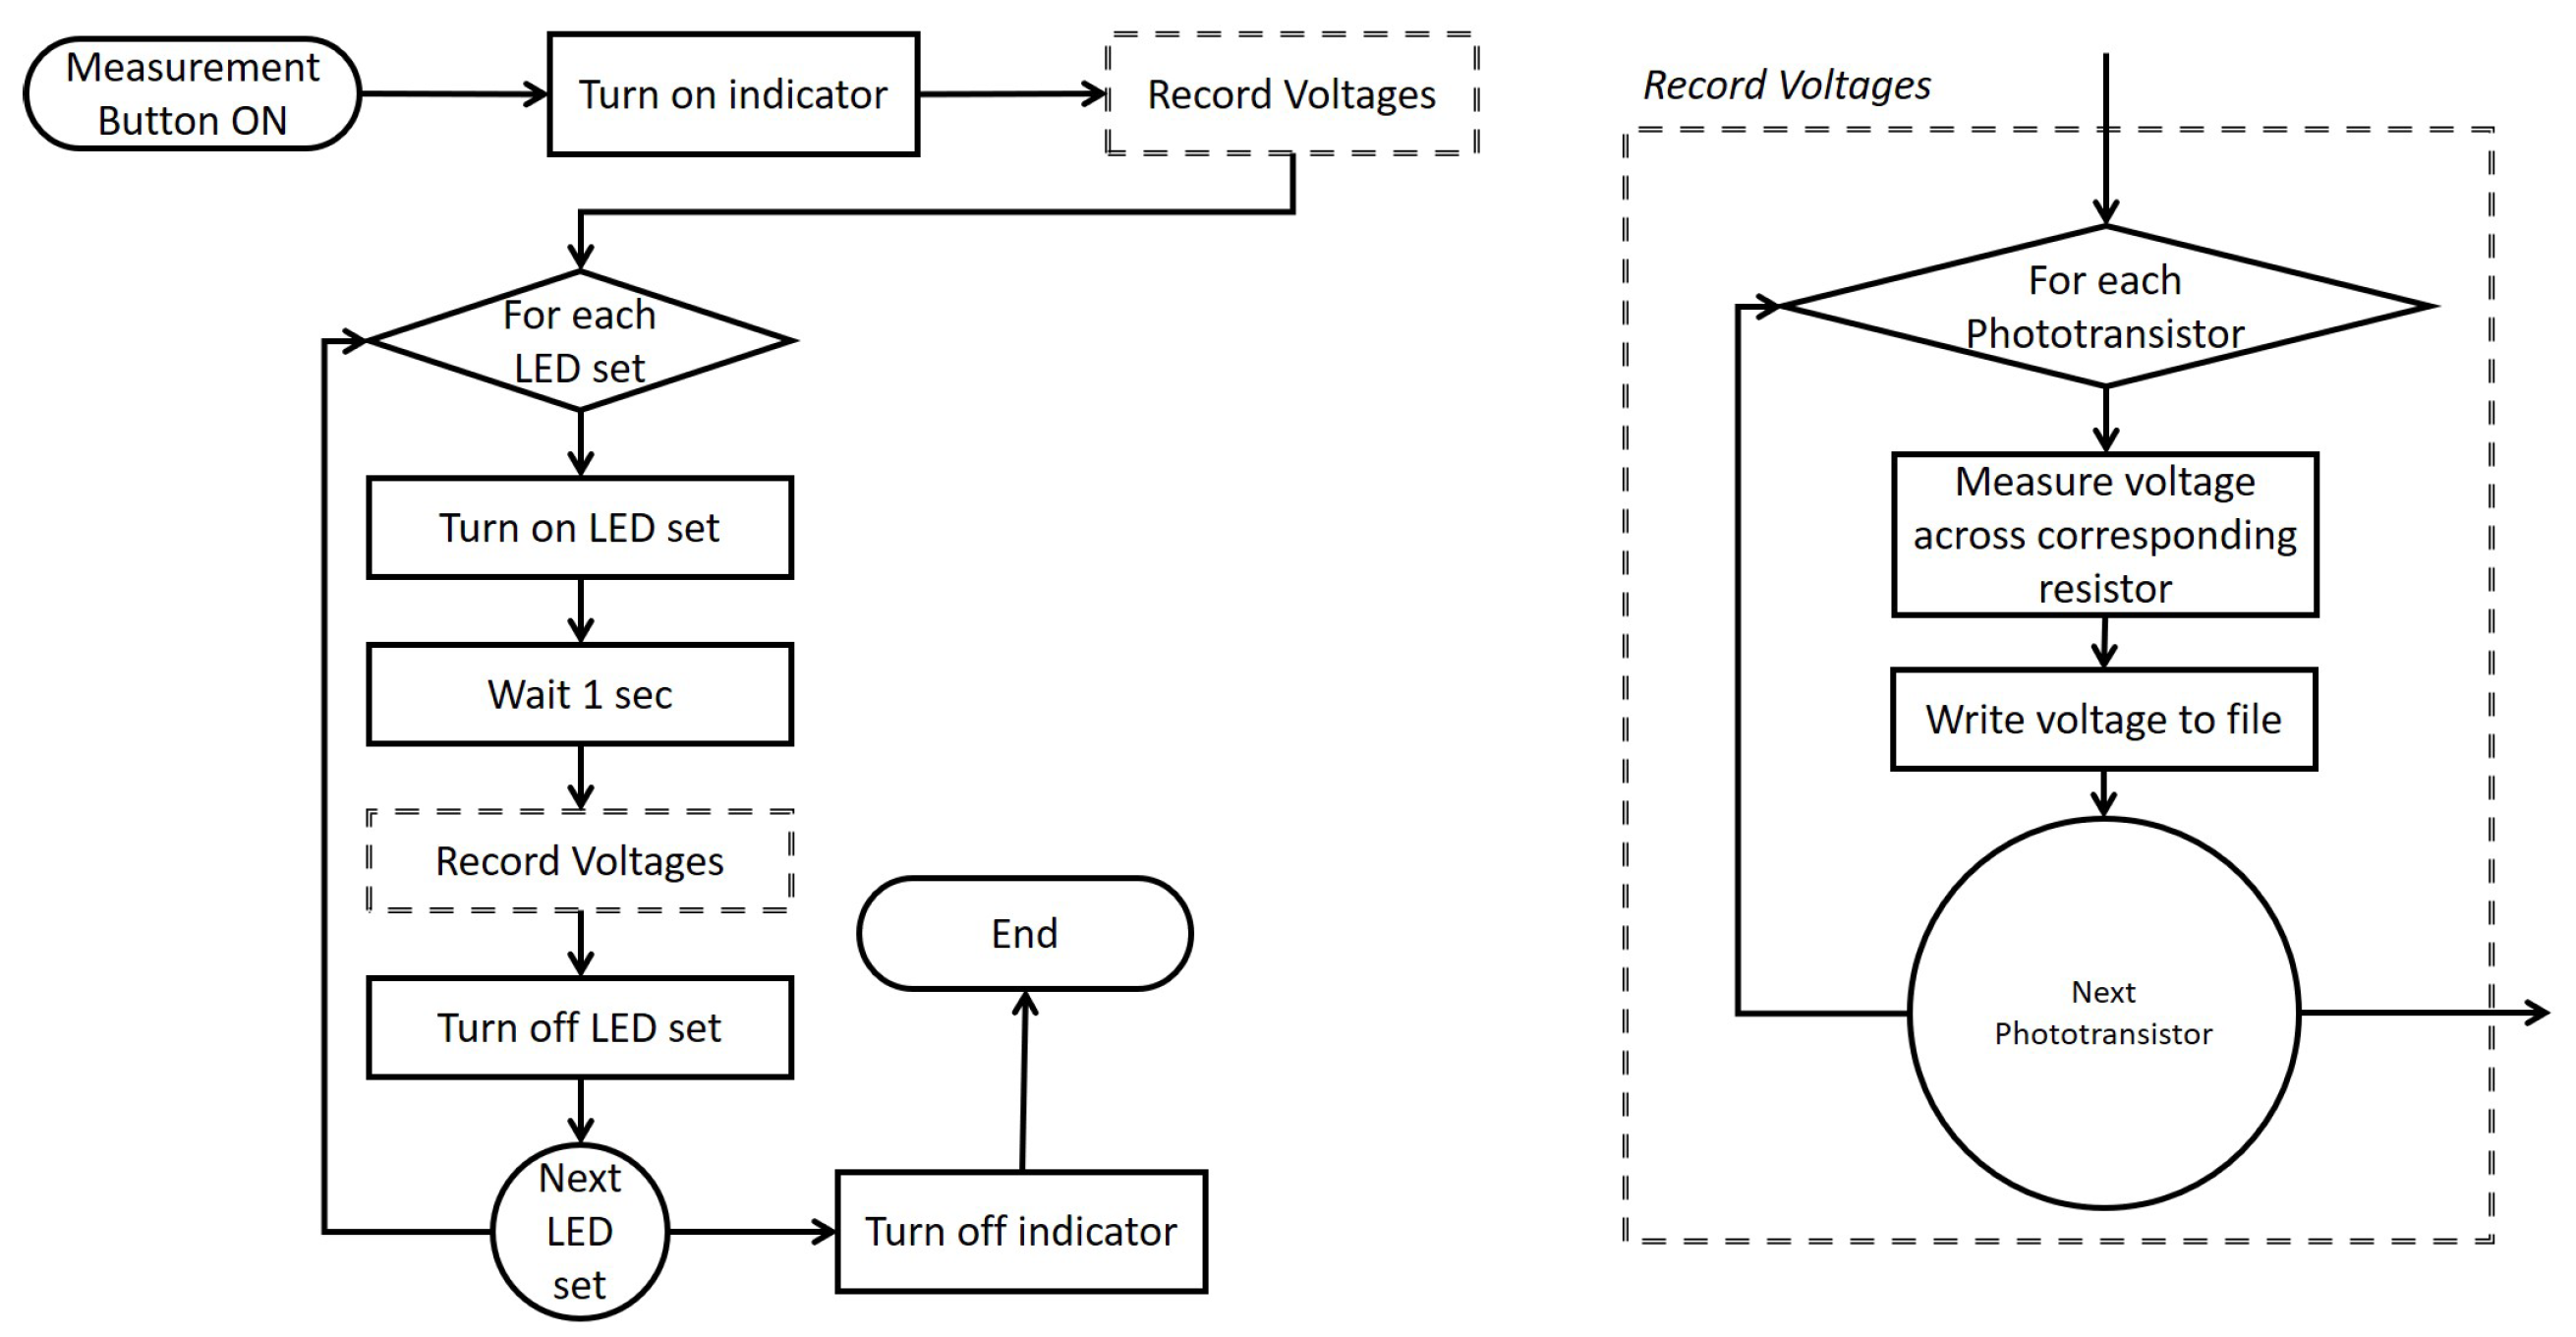
To collect field data, the user holds the box containing the TU and RU components against the pavement surface, so that the opening in top of the box is flush against the pavement surface. Data collection is then initiated by pressing and releasing the measurement button (i.e., LEDs and photo-transistors are activated). The D-SPARC instrument then cycles through the process shown in the flow chart in Figure 4.
During the measurement process, sunlight or any artificial light should not enter the box and contaminate the measurements to the maximum extent possible. Thus, the TU/RU box was covered with a dark cloth to minimize external light sources. Next, the RU measures any radiation from any residual external sources and that emitted by the pavement itself via the phototransistors. This radiation is called the ’background radiation,’ and needs to be subtracted out from the reflected light from the pavement. This is the first ’Record Voltages’ step shown in Figure 4. The background radiation voltages are recorded across the corresponding 10 kΩ resistor of each phototransistor and subsequently written to a file. This process is shown in the flow chart on the right side of Figure 4.
After the background radiation is recorded for the pavement surface, each set of LEDs (R, G, B, and IR) is turned on in sequence. After a set of LEDs is turned on, the instrument waits for one second so that the LEDs reach equilibrium. Phototransistor voltages are then recorded and the LEDs turned off. The next set of LEDs is then be turned on, and the process repeated till all four sets of LEDs are cycled through and voltages recorded for the distinct bandwidths of light. The user can collect multiple measurements by simply pressing the measurement button again and the process described in Figure 4 will be repeated. Typically, a few measurements at a point should be taken and averaged to eliminate noise in the readings.
2.3. Data Processing
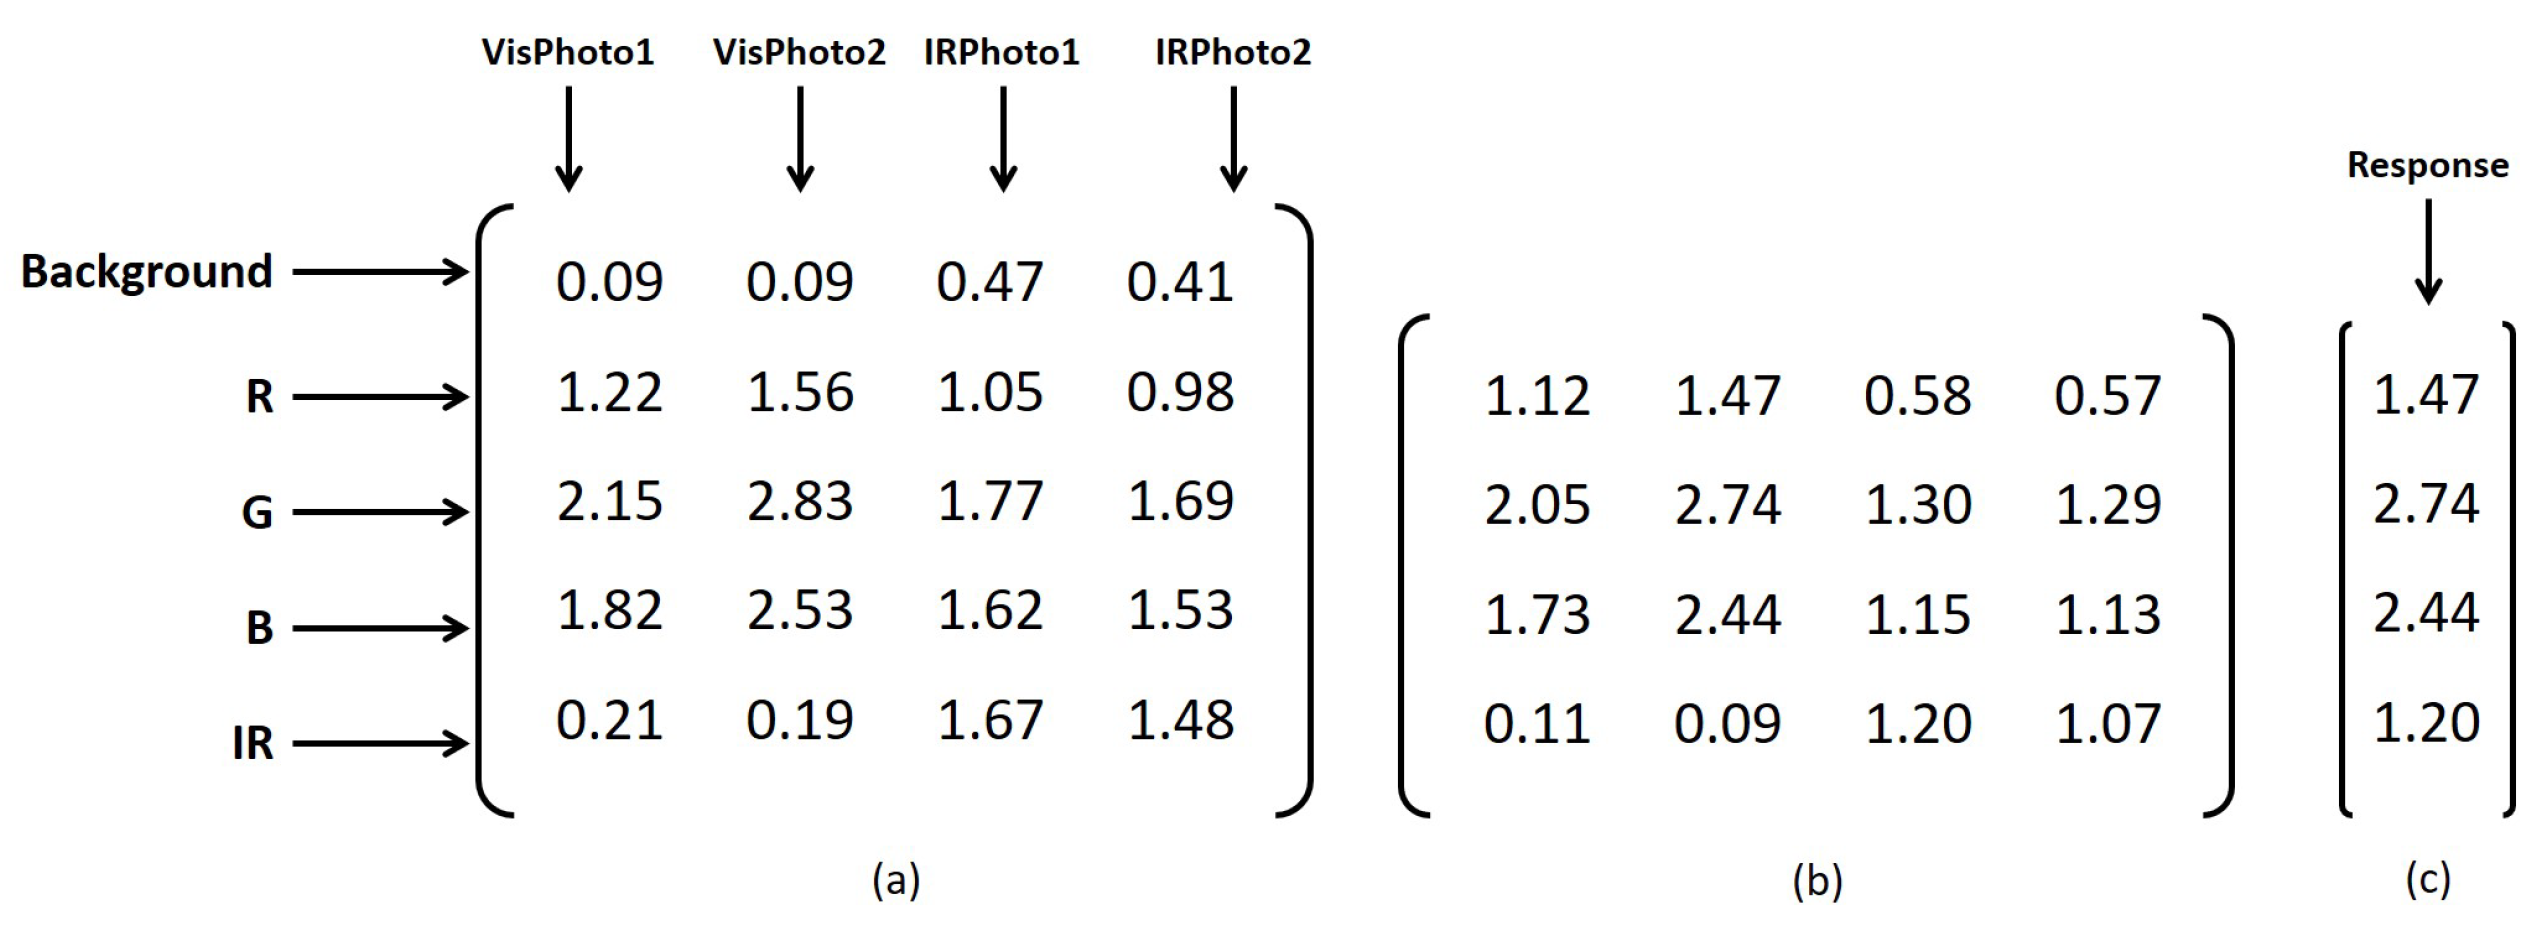
At the end of each measurement cycle, a 5 × 4 matrix of measured voltages (in V) similar to that shown in Figure 5a is recorded and stored in a file. Each row of this matrix consists of the four voltages measured by the four phototransistors. The first row corresponds to the background radiation, and the next four rows to each of the four sets of LEDs (R, G, B, and IR).
The data processing of the measured voltage matrix consists of two steps:
- Remove the background radiation from the measured reflected radiation values; and
- Reduce the four phototransistor responses for each of the set of LEDs to a single, representative response.
In the first step, the first row of the background radiation values is subtracted from each of the remaining four rows to obtain the reflected radiation responses to each LED in the form of a 4 × 4 matrix, similar to the one shown in Figure 5b. The response of the phototransistors was assumed to vary linearly with the intensity of reflected light. In reality, phototransistors respond non-linearly, especially at higher intensities. This assumption was made to simplify the analysis, but will contribute to some error during daytime, when a greater amount of external light from the sun may enter the instrument due to its imperfect opacity. In the second step, the maximum of each row is taken as a representative value, and thus the 5 × 4 unprocessed matrix is reduced to a 4 × 1 vector of the form shown in Figure 5c, with each row representing the response of the RU to each set of LEDs in the TU.
3. Results and Discussion
3.1. Calibration
After processing the acquired data as described above, a 4 × 1 response vector (in V) is obtained, corresponding to the reflected intensity of radiation from red, green, blue, and infrared LEDs, respectively. In order to convert these into the albedo of the surface, the responses were fitted to a calibration function of the form shown in Equation (1), where are regression coefficients with units (except , which has no units). This is the same type of equation used by [16] for aerial-based albedo measurement.
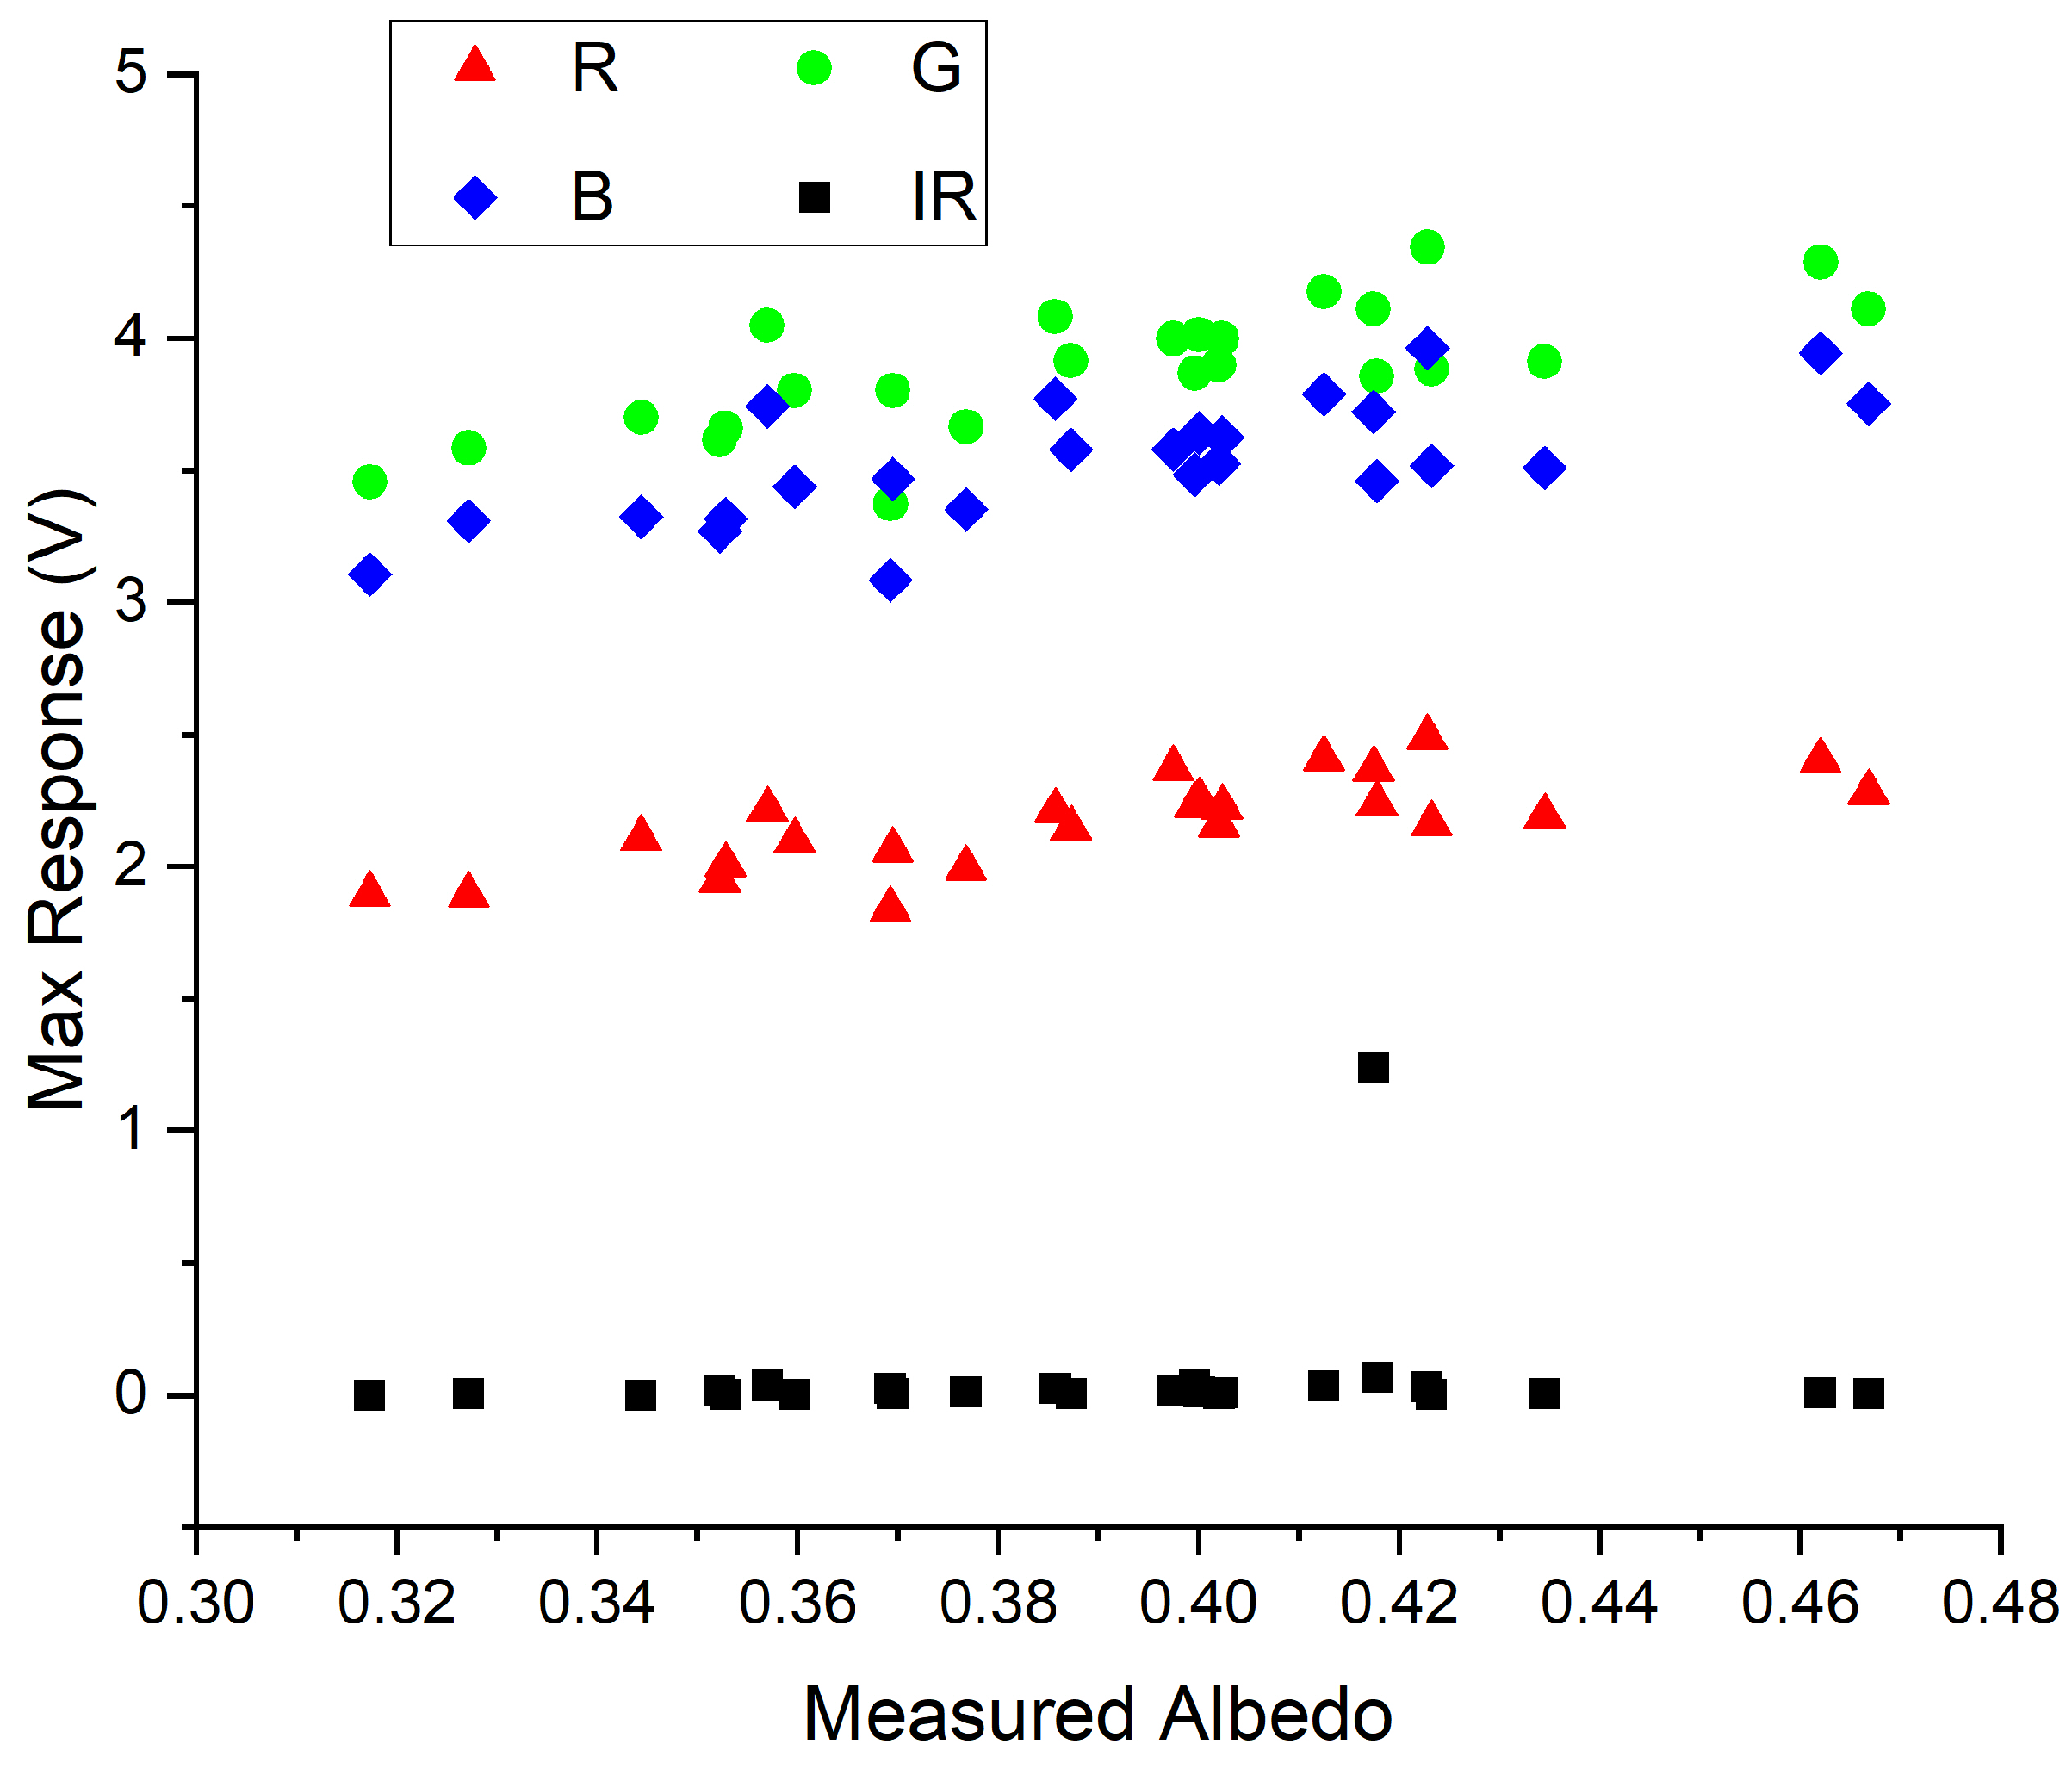
To calibrate D-SPARC device with Equation (1), 25 laboratory specimens of known albedo (varying from 0.30 to 0.50 from the spectrophotometer instrument) were measured with D-SPARC and their responses stored and processed as described previously. Three independent measurements were taken for each specimen and then averaged. The processed results are shown in Figure 6. It can be seen that the green and blue LEDs evoked the strongest response, followed by the red LED, with the IR LED evoking only a small response. This indicates that the concrete specimens reflected a large part of the blue and green light and a small part of the red, while mostly absorbing all the IR light.
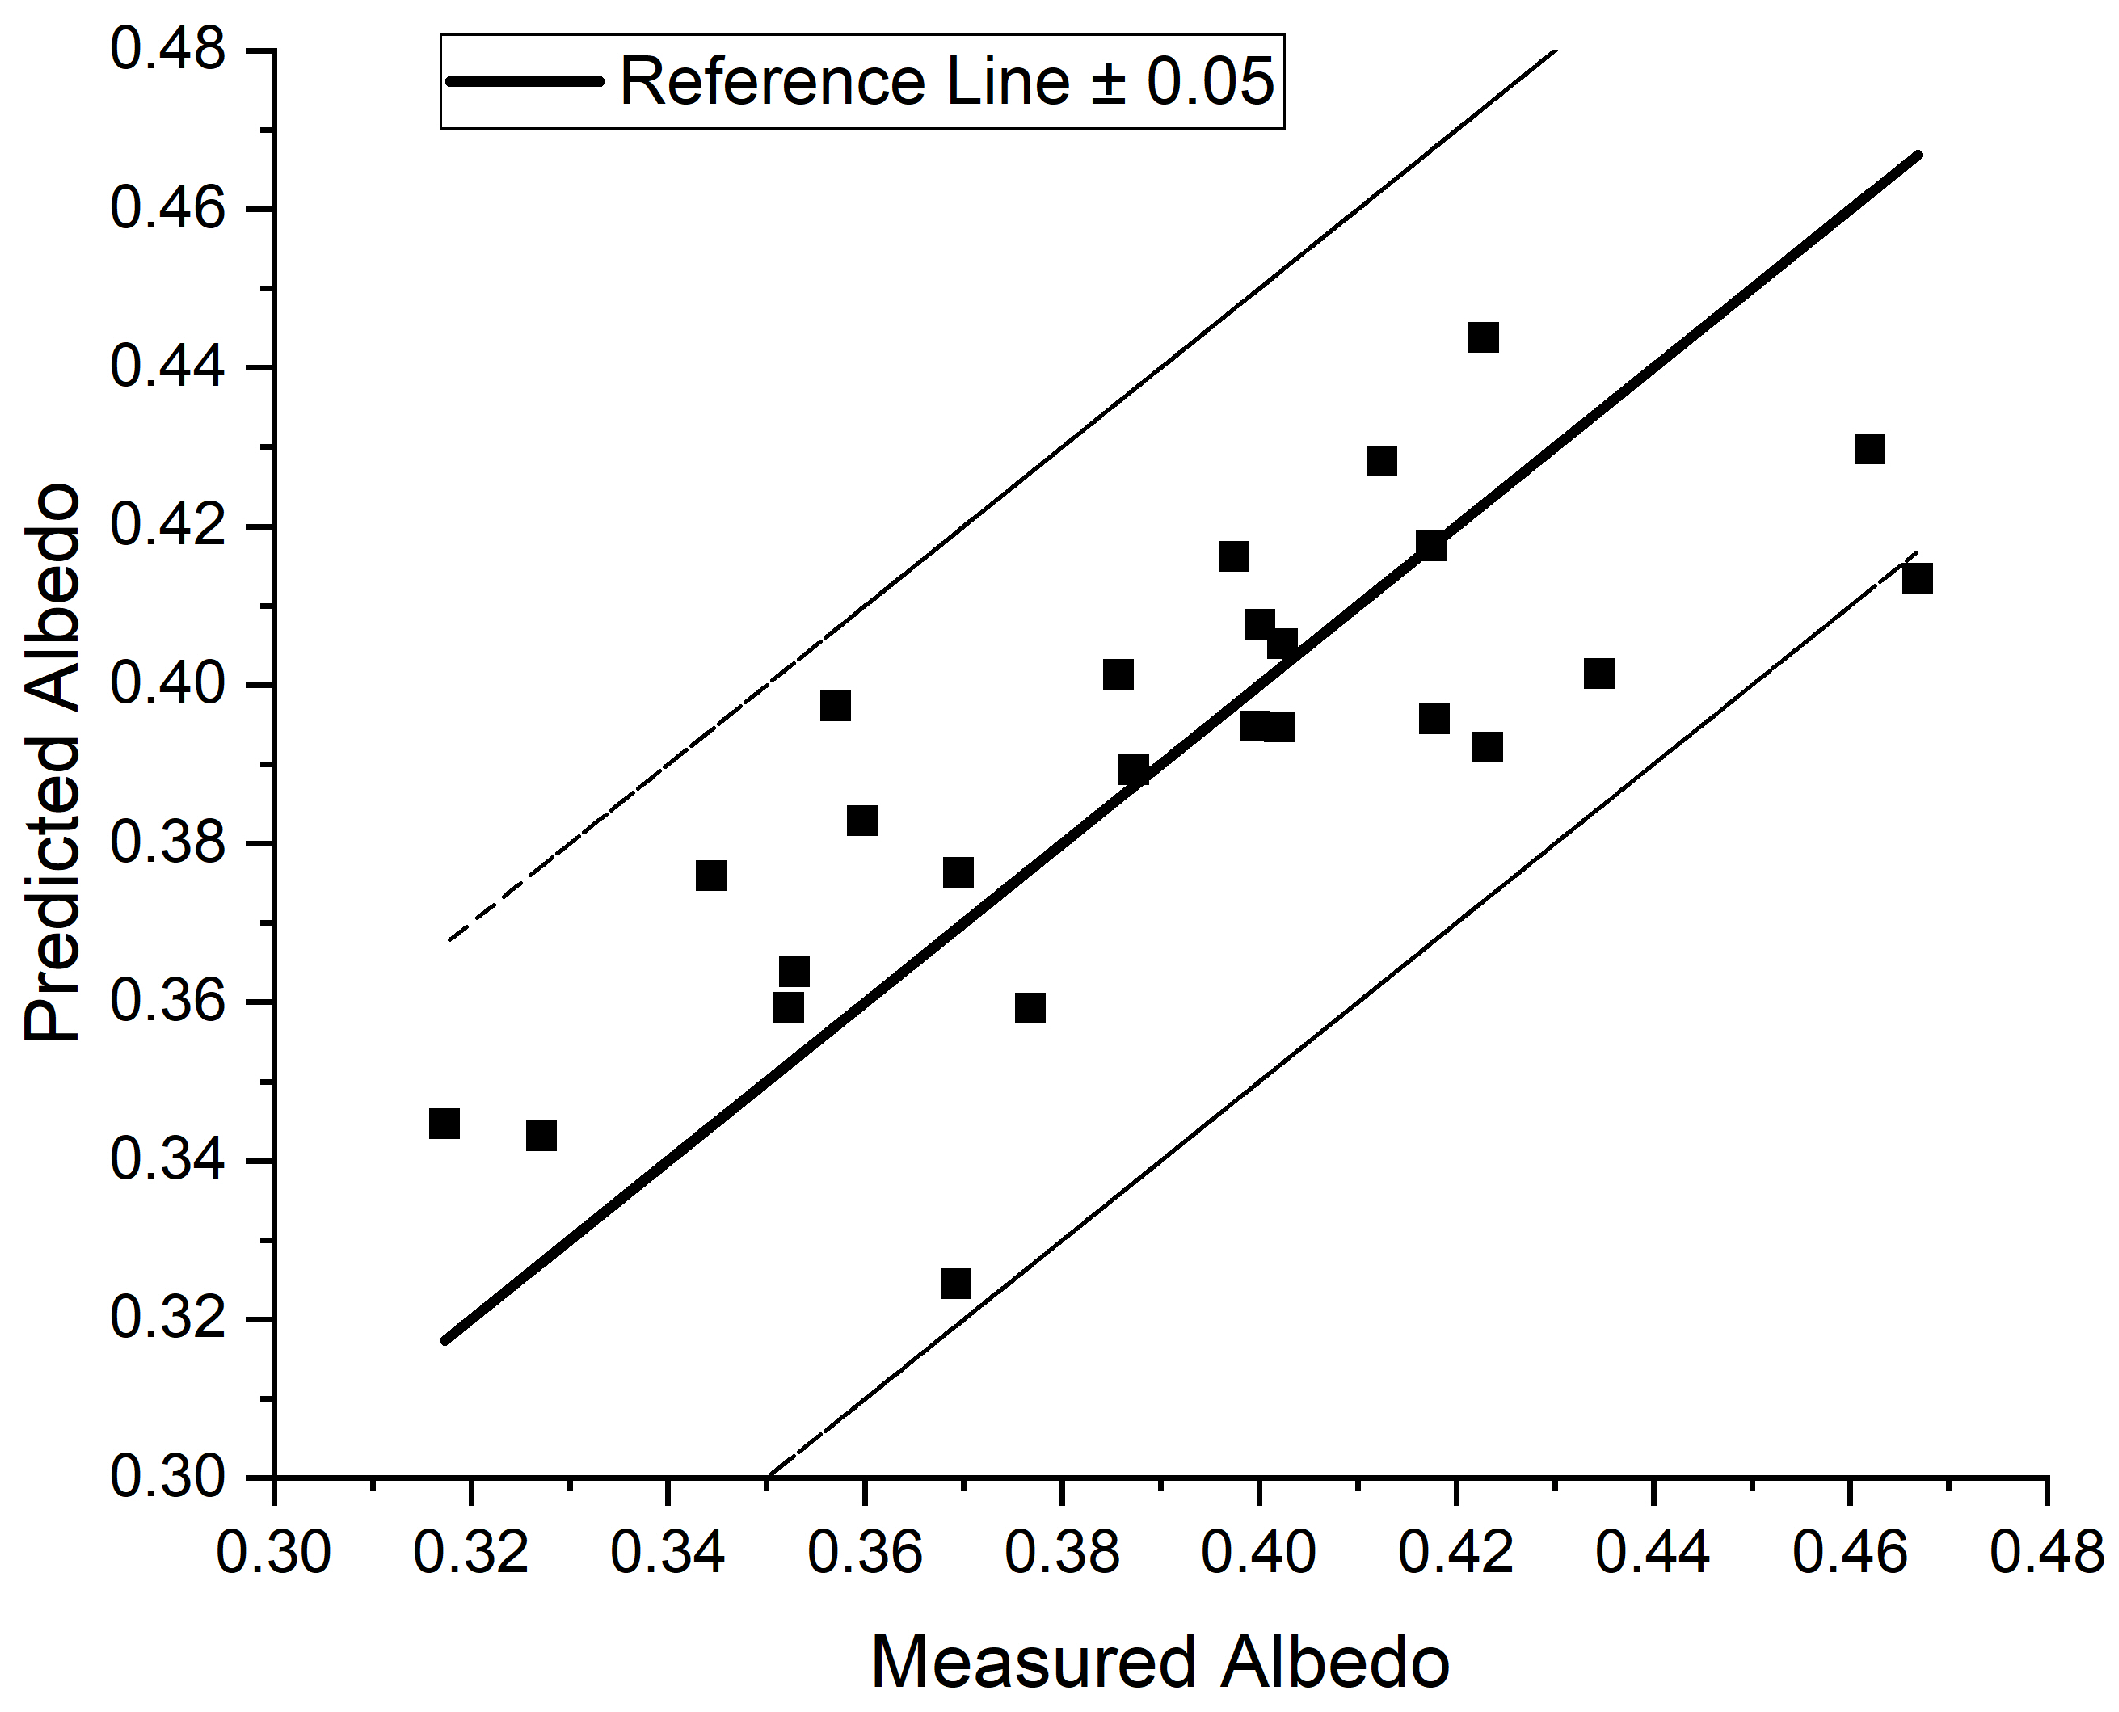
The measured data was fitted to Equation (1) to obtain Equation (2) below. The coefficient of determination () was 0.58. A comparison of the measured and predicted albedo is shown in Figure 7, together with an error band showing an error of . Despite the lower value, D-SPARC was able to accurately predict all the albedos to within .
3.2. Field Verification
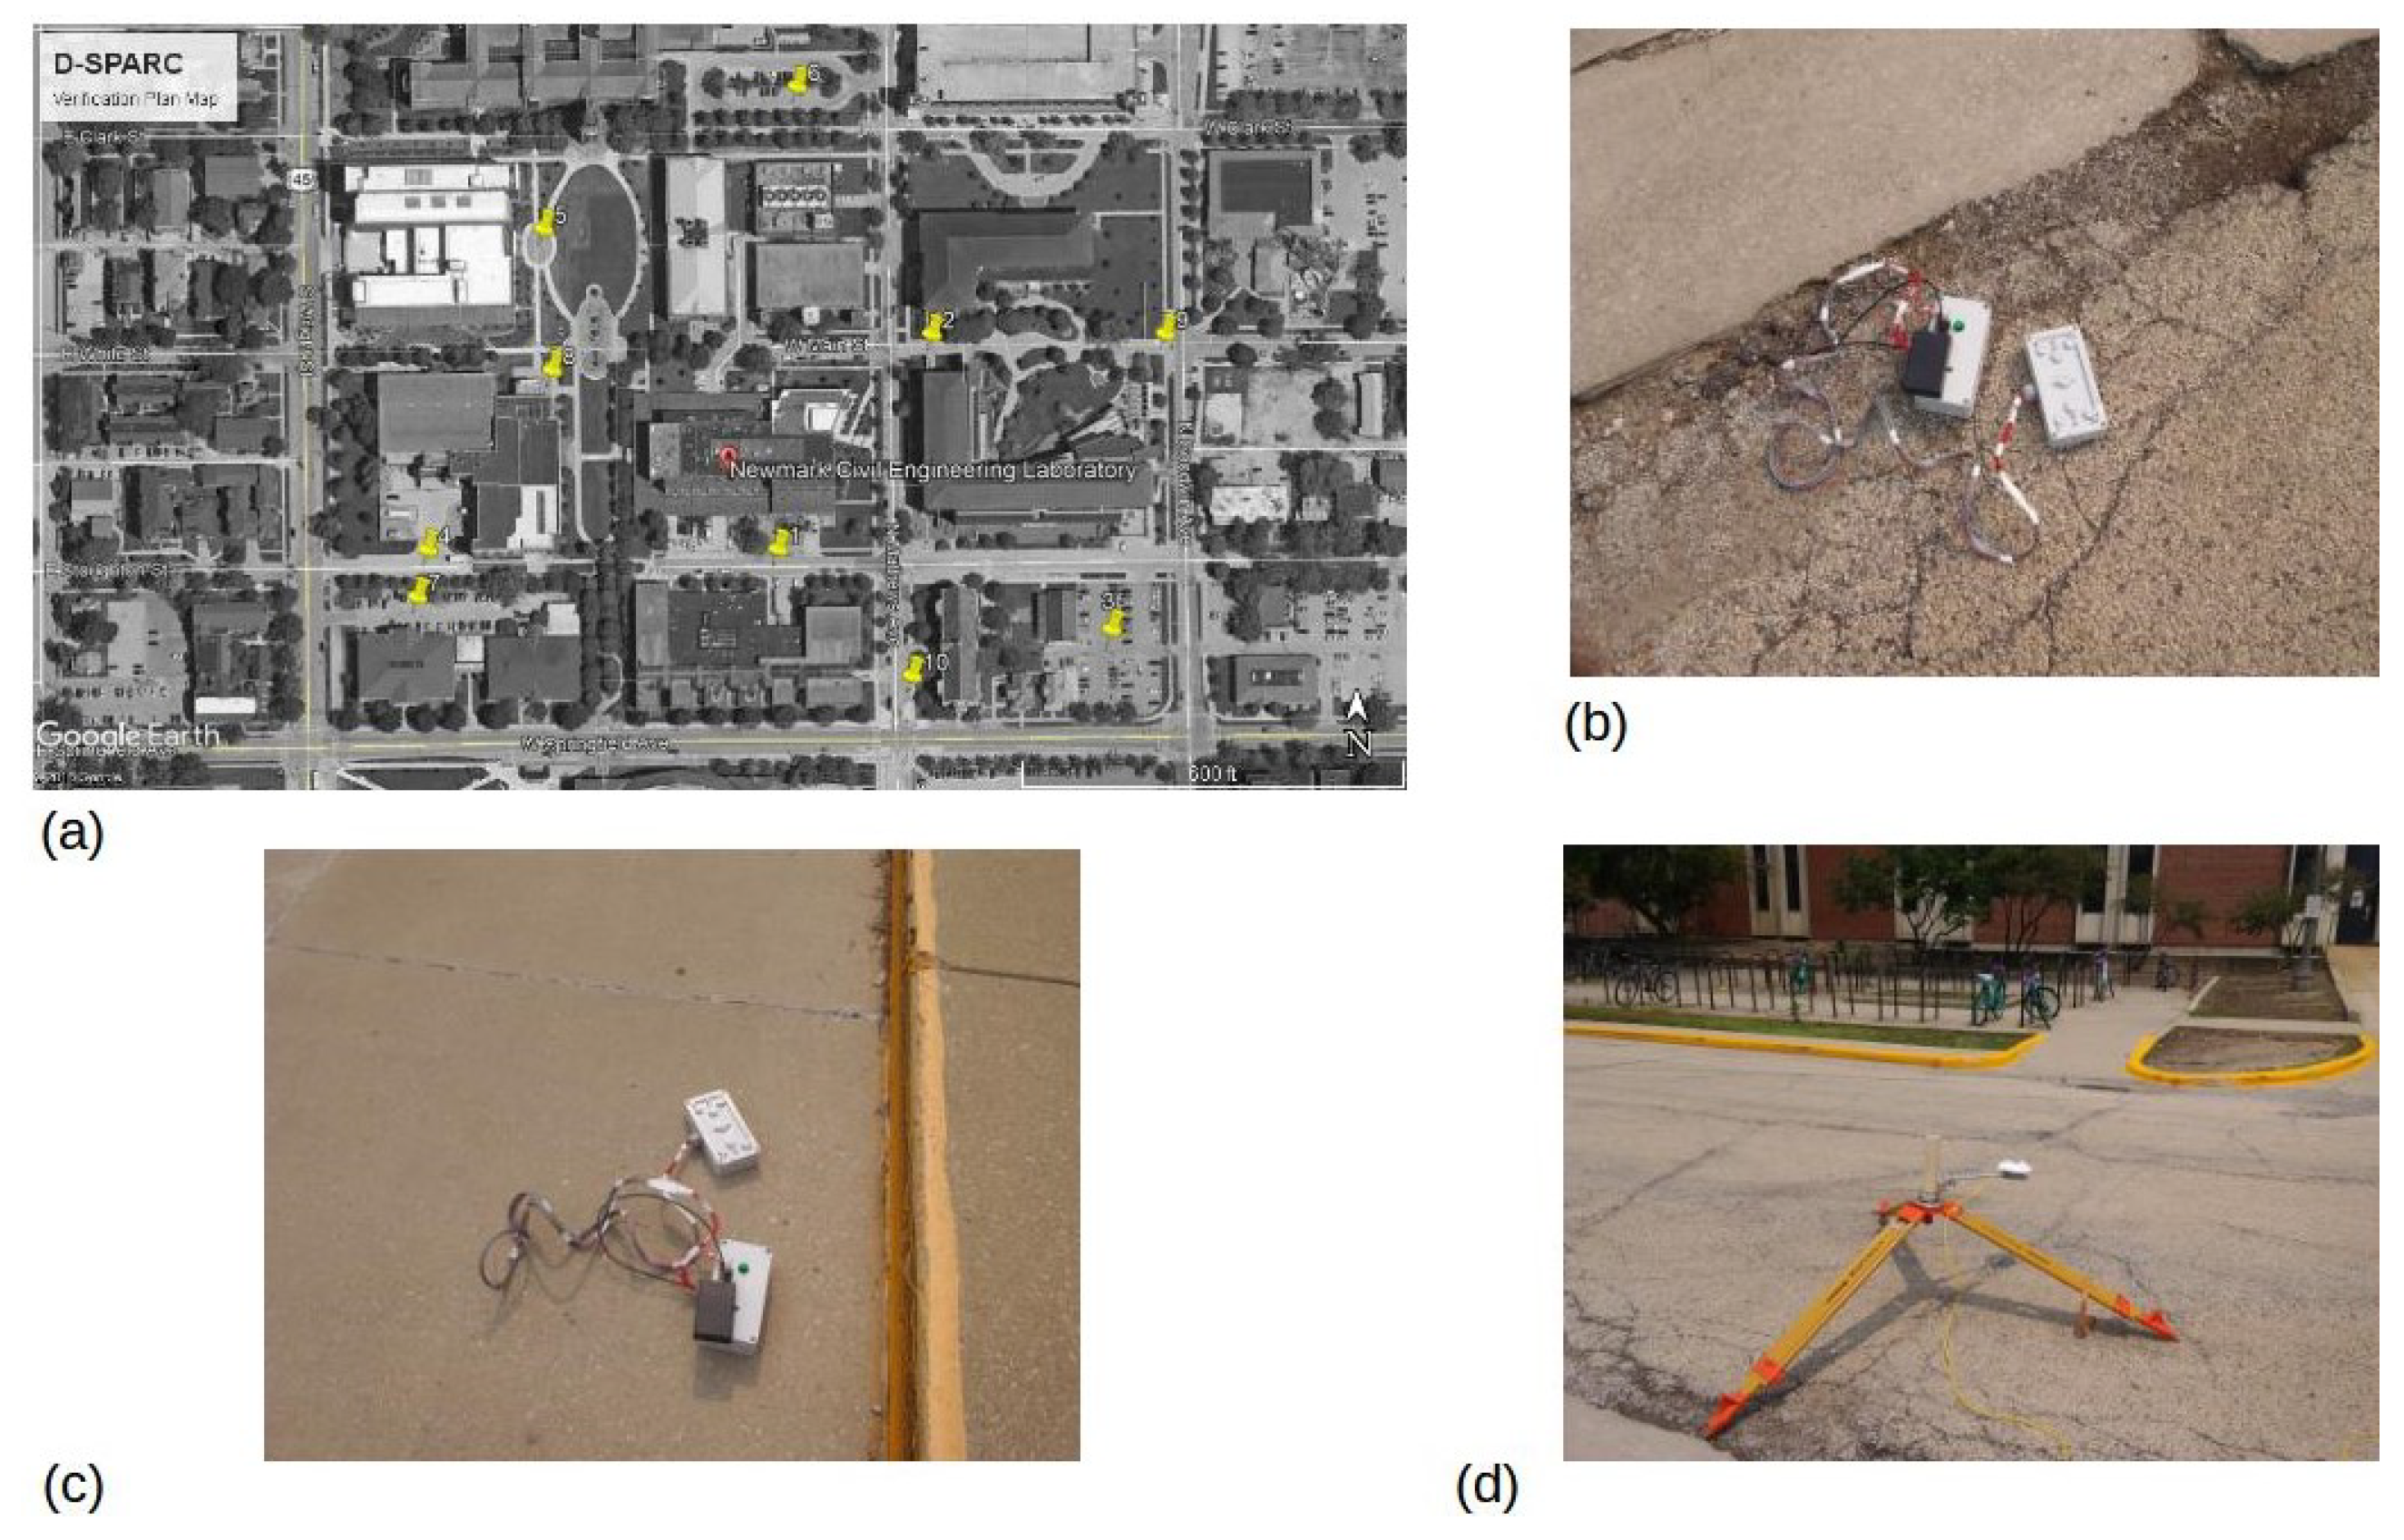
The calibration function was verified in the field through an albedo survey of ten different in-service streets and parking lots paved of asphalt, concrete, and in one case, bricks. All the sites were within a walking area of 0.15 km2 within the campus of the University of Illinois, as shown in Figure 8a. Some examples of albedo being measured over various surfaces using both D-SPARC and an albedometer are also shown in Figure 8c,d. The field survey consisted of three activities:
- Activity 1: The albedo of a site was measured on a clear, sunny day with an albedometer as per ASTM E1918. For each of these section, a 4 m× 4 m homogeneous segment was measured for one minute and the average albedo calculated.
- Activity 2: The albedo of the same sites were estimated using the D-SPARC instrument on a day with broken clouds. At each of the sites, three well-spaced measurements (approximately 1 m apart) were taken and the albedo of each estimated from Equation (2). For each site, the three measurements were averaged. Albedo data derived from this stage was designated as `Day’.
- Activity 3: The same process as in Activity 2 was performed, but measurements were taken at night. Albedo data calculated from this activity was designated as `Night’.
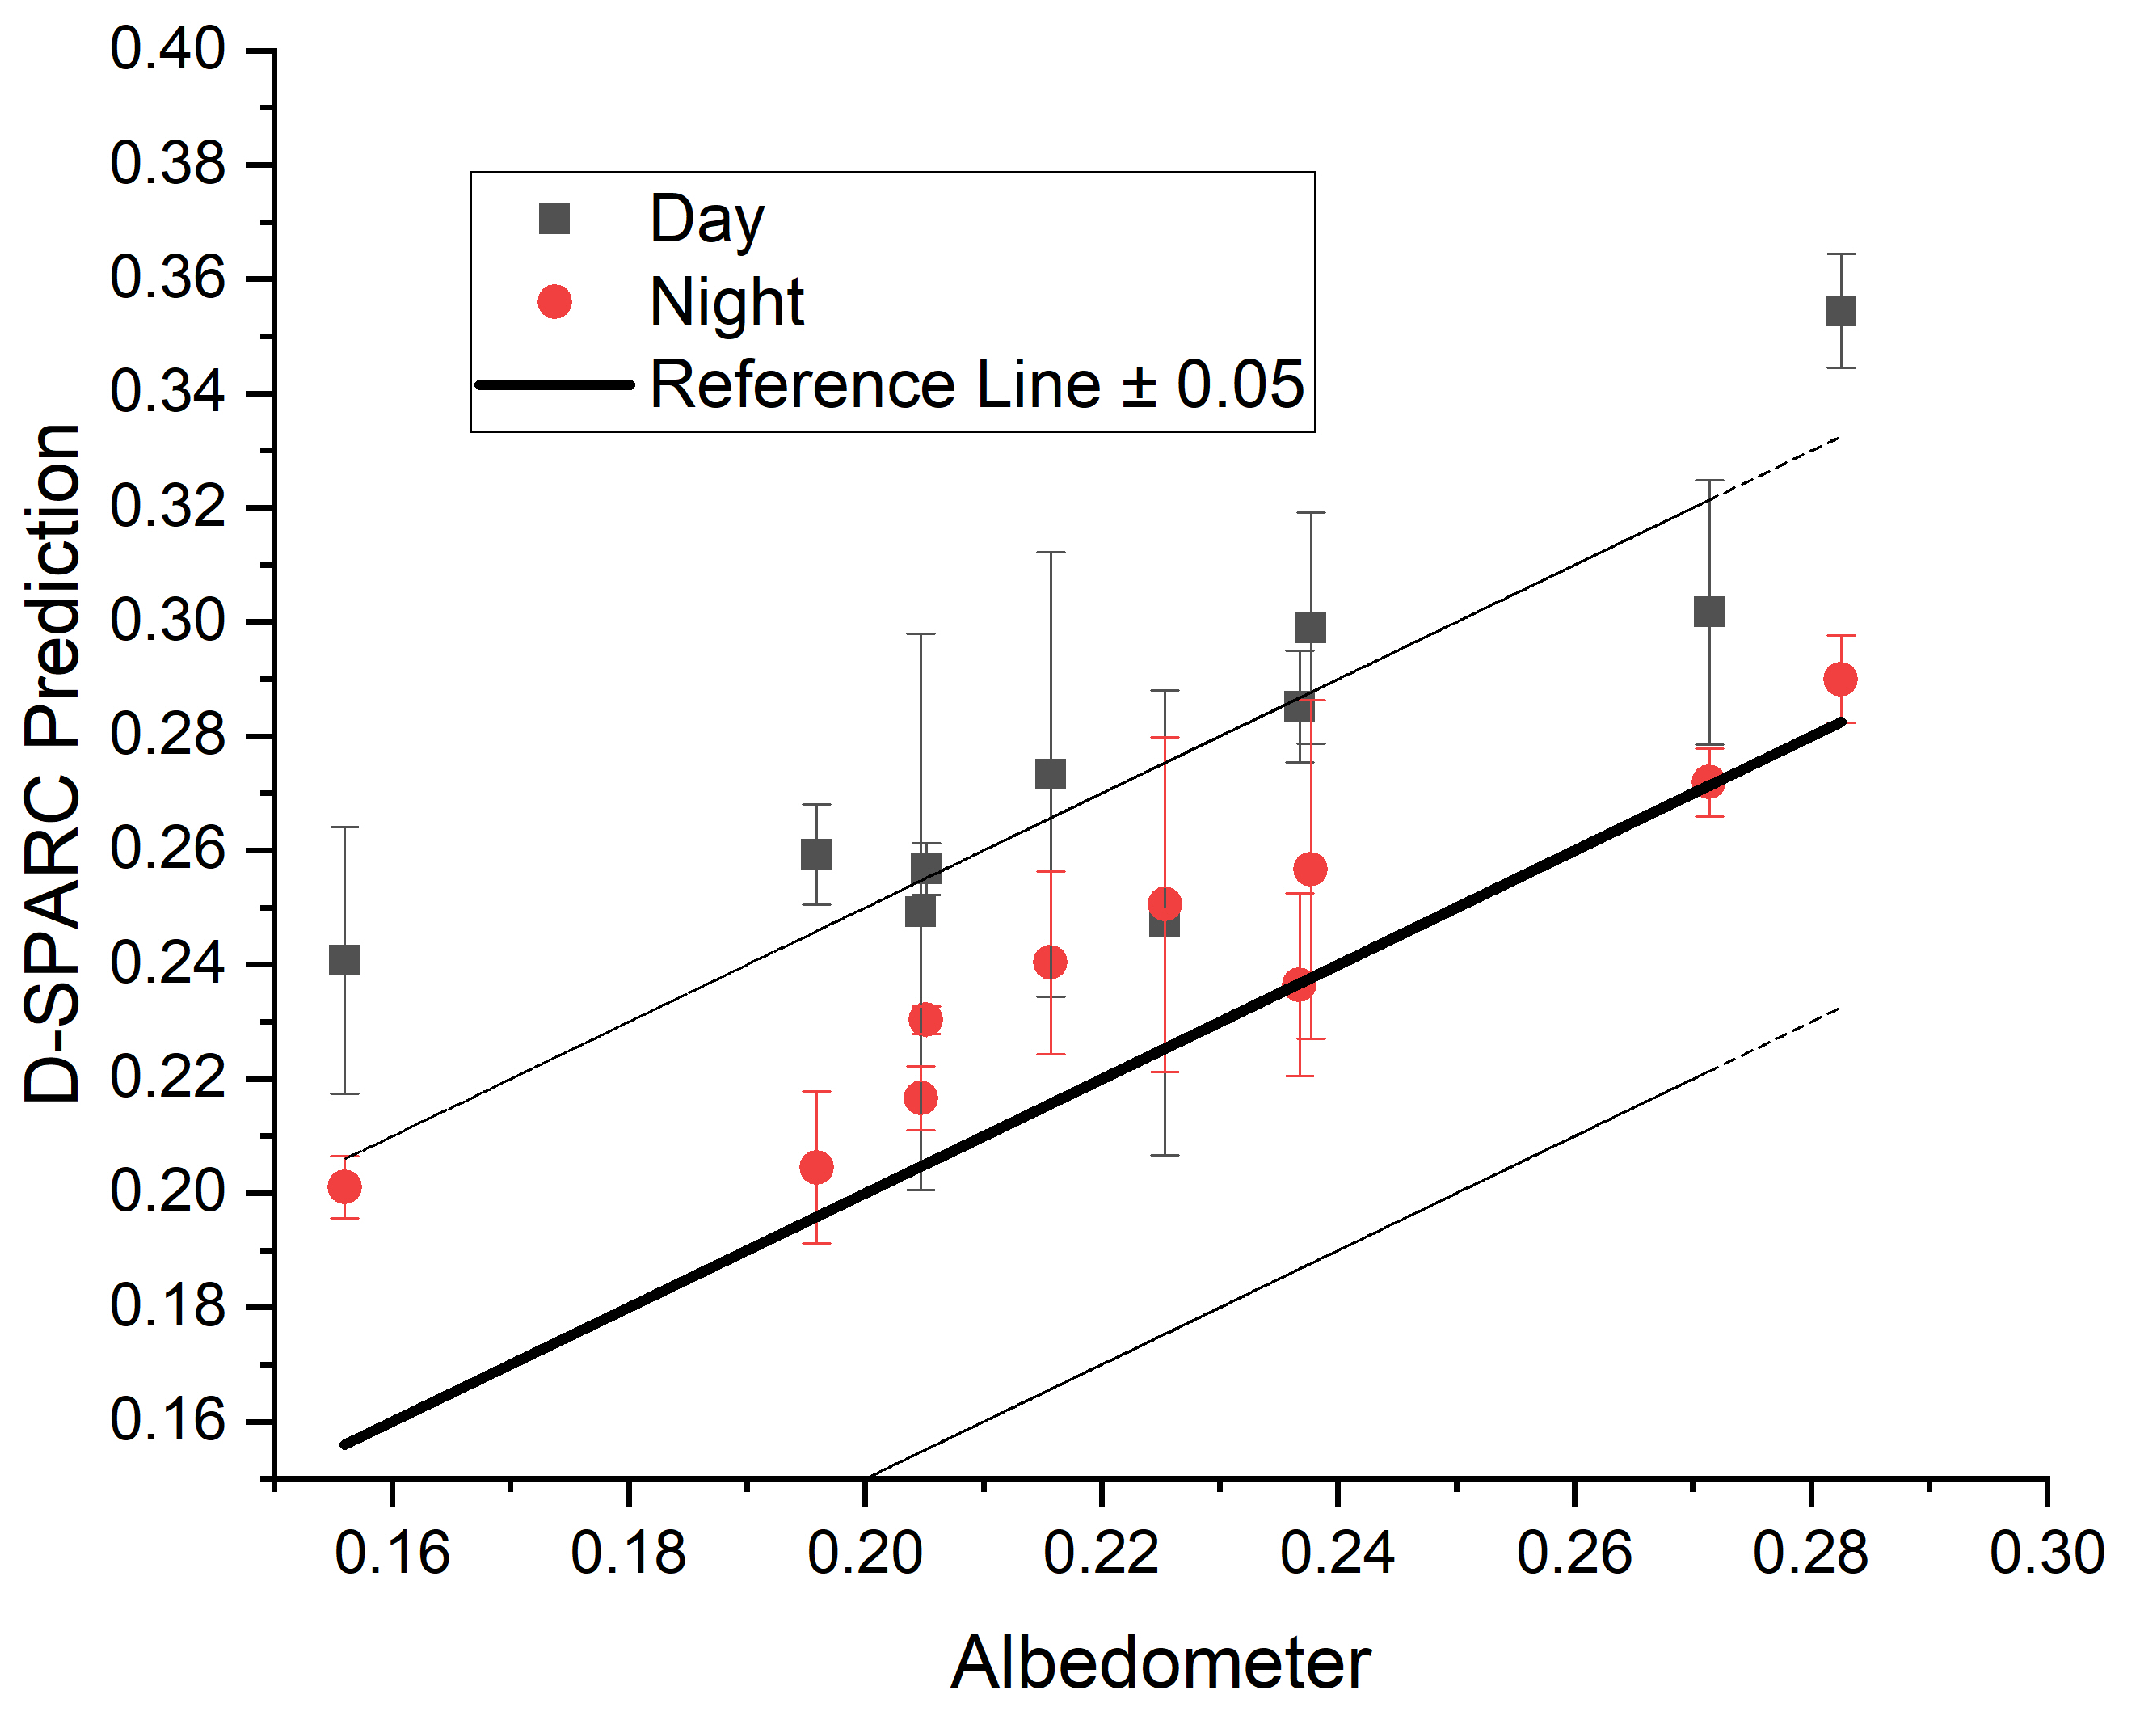
The results from the field survey are shown in Figure 9. The between the albedometer measurements and the D-SPARC predictions at day and night were 0.75 and 0.89, respectively. The root mean square error (RMSE) of the day and night predictions were 0.06 and 0.02, respectively, which compare favorably to the error of 0.06–0.14 reported by [16] as well as [17] in their efforts to estimate albedo from aerial spectral measurements. Although the relative errors in Figure 9 look high, it may be noted that all the measured albedo values were between 0.16 and 0.30, which are low. Thus a high relative error actually results in a small absolute error, which is why RMSE was chosen as the metric for verification.
The error during the day was higher than at night, and moreover the values measured at night were also systemically lower than during the day. This is possibly due to some limited amount of sunlight entering the instrument during the day despite the presence of the dark cloth over the instrument, which was not perfectly opaque. This additional light would lead to a higher error from the linearity assumption made while removing the background radiation from the phototransistor responses, leading to higher predicted values. During the night, all the errors were less than the level of accuracy established during calibration as there was no possibility of any sunlight entering the instrument.
3.3. Discussion and Limitations
The albedo field survey using the D-SPARC device met the primary goals of the study that were originally outlined, as follows:
- D-SPARC was able to measure albedo at any time of the day or night and not just the narrow solar window permitted by ASTM E1918;
- The instrument can be used even in cloudy weather conditions;
- The survey with the albedometer took about 15 min per measurement when performed by an experienced operator, including setting up the instrument at each site and moving between locations. In comparison, performing the same survey using D-SPARC by the same operator took just 4 min per site (with three measurements per site), a significant improvement in productivity. Furthermore, the albedometer required a 4 m × 4 m uniform section of the pavement to be cordoned off, while the D-SPARC instrument can be used on a 180 mm × 90 mm section without the need to block traffic (e.g., on the shoulders).
- The RMSE (0.06 during the day and 0.02 at night) compare favorably with other values reported in literature, and are low enough to provide reasonable accuracy in return for the convenient and fast measurement possible with D-SPARC especially with the desire to acquire network level albedo data.
Additionally, the D-SPARC instrument was built with readily-available and inexpensive electronic components. Finally, it can be operated by a single user, making it convenient and simple to acquire field data. However, D-SPARC still has several limitations. The biggest limitation was the higher errors observed during the day due to sunlight entering the instrument. Different materials that are more opaque to sunlight need to be investigated. Secondly, the range of IR radiation in both the TU and RU was limited, and components capable of handling far IR light need to be incorporated in the future. Finally, D-SPARC was only tested for dry surfaces. The performance when the surfaces are damp (for example, after a spell of rain), needs to be studied in the future.
4. Conclusions
The albedo of pavements is an important optical property impacting the UHI effect in cities, which leads to significant effects for building energy use, air quality, and thermal human comfort. Ground-based field measurements of pavement albedo are usually taken with an albedometer, which presents the following challenges: cordoning off a large (4 m × 4 m) uniform section of the road, limited testing window of a few hours before and after noon, and clear sky conditions. While the first challenge has been tackled by previous studies, this study developed a new ground-based instrument, called Discrete SPectrAl RefleCtometer (D-SPARC) that allows for rapid measurement of pavement albedo at any time of the day or night and under cloudy weather conditions while still providing reasonable accuracy to an aerial systems.
The D-SPARC device has three main components to acquire data for calculation of pavement albedo. The Transmitter Unit (TU) consists of three sets RGB and infrared LEDs that are used to illuminate a 180 mm × 90 mm area of pavement. A Receiver Unit (RU) measures the light reflected by the surface through phototransistors. Finally, a Controller and Storage Unit (CSU) is responsible for manually triggering the data collection system as well as storing the data. The entire instrument is divided into two compact boxes that can easily carried around by a single operator.
The D-SPARC device was first calibrated in the laboratory using specimens of known albedo. The response of the phototransistors to each of the LEDs was used to develop a calibration function, which predicted the lab-measured albedo within an error of . Next, ten field sites were surveyed for their albedo using both an albedometer (daytime only) and the D-SPARC instrument during both the day and night. The RMSE between the albedometer and D-SPARC measurements was 0.06 for the daytime albedo values, and 0.02 at night. These errors compared favorably with recent literature on aerial spectral imaging. The higher error during the day was attributed to some sunlight entering the instrument during the day, which resulted in a non-linear response from the RU. In the future, efforts to reduce this sunlight, as well as incorporation of far IR wavelengths and effect of damp surfaces will be investigated.
5. Patents
An invention disclosure for this work was filed with the University of Illinois at Urbana-Champaign.
Author Contributions
Conceptualization, S.S. and J.R.; methodology, S.S.; software, S.S.; validation, S.S.; formal analysis, S.S.; investigation, S.S.; resources, J.R.; data curation, S.S.; writing—original draft preparation, S.S.; writing—review and editing, J.R.; visualization, S.S.; supervision, J.R.; project administration, J.R.; funding acquisition, J.R. All authors have read and agreed to the published version of the manuscript.
Funding
This research received no external funding.
Institutional Review Board Statement
Not applicable.
Data Availability Statement
Data used in this study is available upon reasonable request to the corresponding author.
Acknowledgments
The authors are grateful to Andrey Mironov, Austin Steinforth, and Christopher Schmitz for their technical inputs to the development of D-SPARC, Sachindra Dahal for his assistance in building the instrument, and Yixuan Wen for his assistance with field measurements. Sen performed this work while at the University of Illinois at Urbana-Champaign.
Conflicts of Interest
The authors have no conflict of interest to declare.
References
- Kleerekoper, L.; Van Esch, M.; Salcedo, T.B. How to make a city climate-proof, addressing the urban heat island effect. Resour. Conserv. Recycl. 2012, 64, 30–38. [Google Scholar] [CrossRef]
- Taha, H. Urban climates and heat islands: Albedo, evapotranspiration, and anthropogenic heat. Energy Build. 1997, 25, 99–103. [Google Scholar] [CrossRef] [Green Version]
- Qin, Y.; Hiller, J.E.; Meng, D. Linearity between pavement thermophysical properties and surface temperatures. J. Mater. Civ. Eng. 2019, 31, 04019262. [Google Scholar] [CrossRef]
- Sen, S.; Roesler, J. An uncoupled pavement-urban canyon model for heat islands. In Proceedings of the 2017 International Symposium on Pavement Life Cycle Assessment, Champaign, IL, USA, 12–13 April 2017; pp. 12–13. [Google Scholar]
- Sen, S.; Khazanovich, L. Limited application of reflective surfaces can mitigate urban heat pollution. Nat. Commun. 2021, 12, 3491. [Google Scholar] [CrossRef] [PubMed]
- Sen, S.; Roesler, J. Ageing albedo model for asphalt pavement surfaces. J. Clean. Prod. 2016, 117, 169–175. [Google Scholar] [CrossRef]
- Sen, S.; Roesler, J. Thermal and optical characterization of asphalt field cores for microscale urban heat island analysis. Constr. Build. Mater. 2019, 217, 600–611. [Google Scholar] [CrossRef]
- Santamouris, M. Using cool pavements as a mitigation strategy to fight urban heat island—A review of the actual developments. Renew. Sustain. Energy Rev. 2013, 26, 224–240. [Google Scholar] [CrossRef]
- Sen, S.; Fernandèz, J.P.R.M.R.; Roesler, J. Reflective parking lots for microscale urban heat island mitigation. Transp. Res. Rec. 2020, 2674, 663–671. [Google Scholar] [CrossRef]
- Sen, S.; Roesler, J. Rapid ground-based measurement of pavement albedo. In Pavement, Roadway, and Bridge Life Cycle Assessment 2020; CRC Press: Boca Raton, FL, USA, 2020; pp. 533–540. [Google Scholar]
- ASTM. E903; Standard Test Method for Solar Absorptance, Reflectance and Transmittance of Materials Using Integrating Spheres, reapproved. ASTM: West Conshohocken, PA, USA, 2007.
- Liang, S. Narrowband to broadband conversions of land surface albedo I: Algorithms. Remote Sens. Environ. 2001, 76, 213–238. [Google Scholar] [CrossRef]
- Brest, C.L.; Goward, S.N. Deriving surface albedo measurements from narrow band satellite data. Int. J. Remote Sens. 1987, 8, 351–367. [Google Scholar] [CrossRef]
- Lucht, W.; Schaaf, C.B.; Strahler, A.H. An algorithm for the retrieval of albedo from space using semiempirical BRDF models. IEEE Trans. Geosci. Remote Sens. 2000, 38, 977–998. [Google Scholar] [CrossRef] [Green Version]
- Chudnovsky, A.; Ben-Dor, E.; Saaroni, H. Diurnal thermal behavior of selected urban objects using remote sensing measurements. Energy Build. 2004, 36, 1063–1074. [Google Scholar] [CrossRef]
- Ban-Weiss, G.A.; Woods, J.; Levinson, R. Using remote sensing to quantify albedo of roofs in seven California cities, Part 1: Methods. Sol. Energy 2015, 115, 777–790. [Google Scholar] [CrossRef] [Green Version]
- Gaitani, N.; Burud, I.; Thiis, T.; Santamouris, M. High-resolution spectral mapping of urban thermal properties with unmanned aerial vehicles. Build. Environ. 2017, 121, 215–224. [Google Scholar] [CrossRef]
- ASTM. C1549; Standard Test Method for Determination of Solar Reflectance Near Ambient Temperature Using a Portable Solar Reflectometer. ASTM: West Conshohocken, PA, USA, 2016.
- ASTM. E1918; Standard Test Method for Measuring Solar Reflectance of Horizontal and Low-Sloped Surfaces in the Field. ASTM: West Conshohocken, PA, USA, 2016.
- Wu, H.; Sun, B.; Li, Z.; Yu, J. Characterizing thermal behaviors of various pavement materials and their thermal impacts on ambient environment. J. Clean. Prod. 2018, 172, 1358–1367. [Google Scholar] [CrossRef]
- Li, H.; Harvey, J.; Kendall, A. Field measurement of albedo for different land cover materials and effects on thermal performance. Build. Environ. 2013, 59, 536–546. [Google Scholar] [CrossRef]
- Pisello, A.; Pignatta, G.; Castaldo, V.; Cotana, F. Experimental analysis of natural gravel covering as cool roofing and cool pavement. Sustainability 2014, 6, 4706–4722. [Google Scholar] [CrossRef] [Green Version]
- Richard, C.; Dore, G.; Lemieux, C.; Bilodeau, J.P.; Haure-Touze, J. Albedo of pavement surfacing materials: In situ measurements. In Proceedings of the 16th International Conference on Cold Regions Engineering, Salt Lake City, UT, USA, 19–22 July 2015; pp. 181–192. [Google Scholar]
- Sreedhar, S.; Biligiri, K.P. Comprehensive laboratory evaluation of thermophysical properties of pavement materials: Effects on urban heat island. J. Mater. Civ. Eng. 2016, 28, 04016026. [Google Scholar] [CrossRef]
- Qin, Y.; He, H. A new simplified method for measuring the albedo of limited extent targets. Sol. Energy 2017, 157, 1047–1055. [Google Scholar] [CrossRef]
- Akbari, H.; Levinson, R.; Stern, S. Procedure for measuring the solar reflectance of flat or curved roofing assemblies. Sol. Energy 2008, 82, 648–655. [Google Scholar] [CrossRef] [Green Version]
- Qin, Y.; Luo, J.; Chen, Z.; Mei, G.; Yan, L.E. Measuring the albedo of limited-extent targets without the aid of known-albedo masks. Sol. Energy 2018, 171, 971–976. [Google Scholar] [CrossRef]
- Sen, S.; Roesler, J.; King, D. Albedo estimation of finite-sized concrete specimens. J. Test. Eval. 2019, 47, 738–757. [Google Scholar] [CrossRef]
Figure 1.
Schematic diagram of the Transmitter Unit (TU), Receiver Unit (RU), and Controller and Storage Unit (CSU) of D-SPARC in (a) plan and (b) profile view.
Figure 1.
Schematic diagram of the Transmitter Unit (TU), Receiver Unit (RU), and Controller and Storage Unit (CSU) of D-SPARC in (a) plan and (b) profile view.

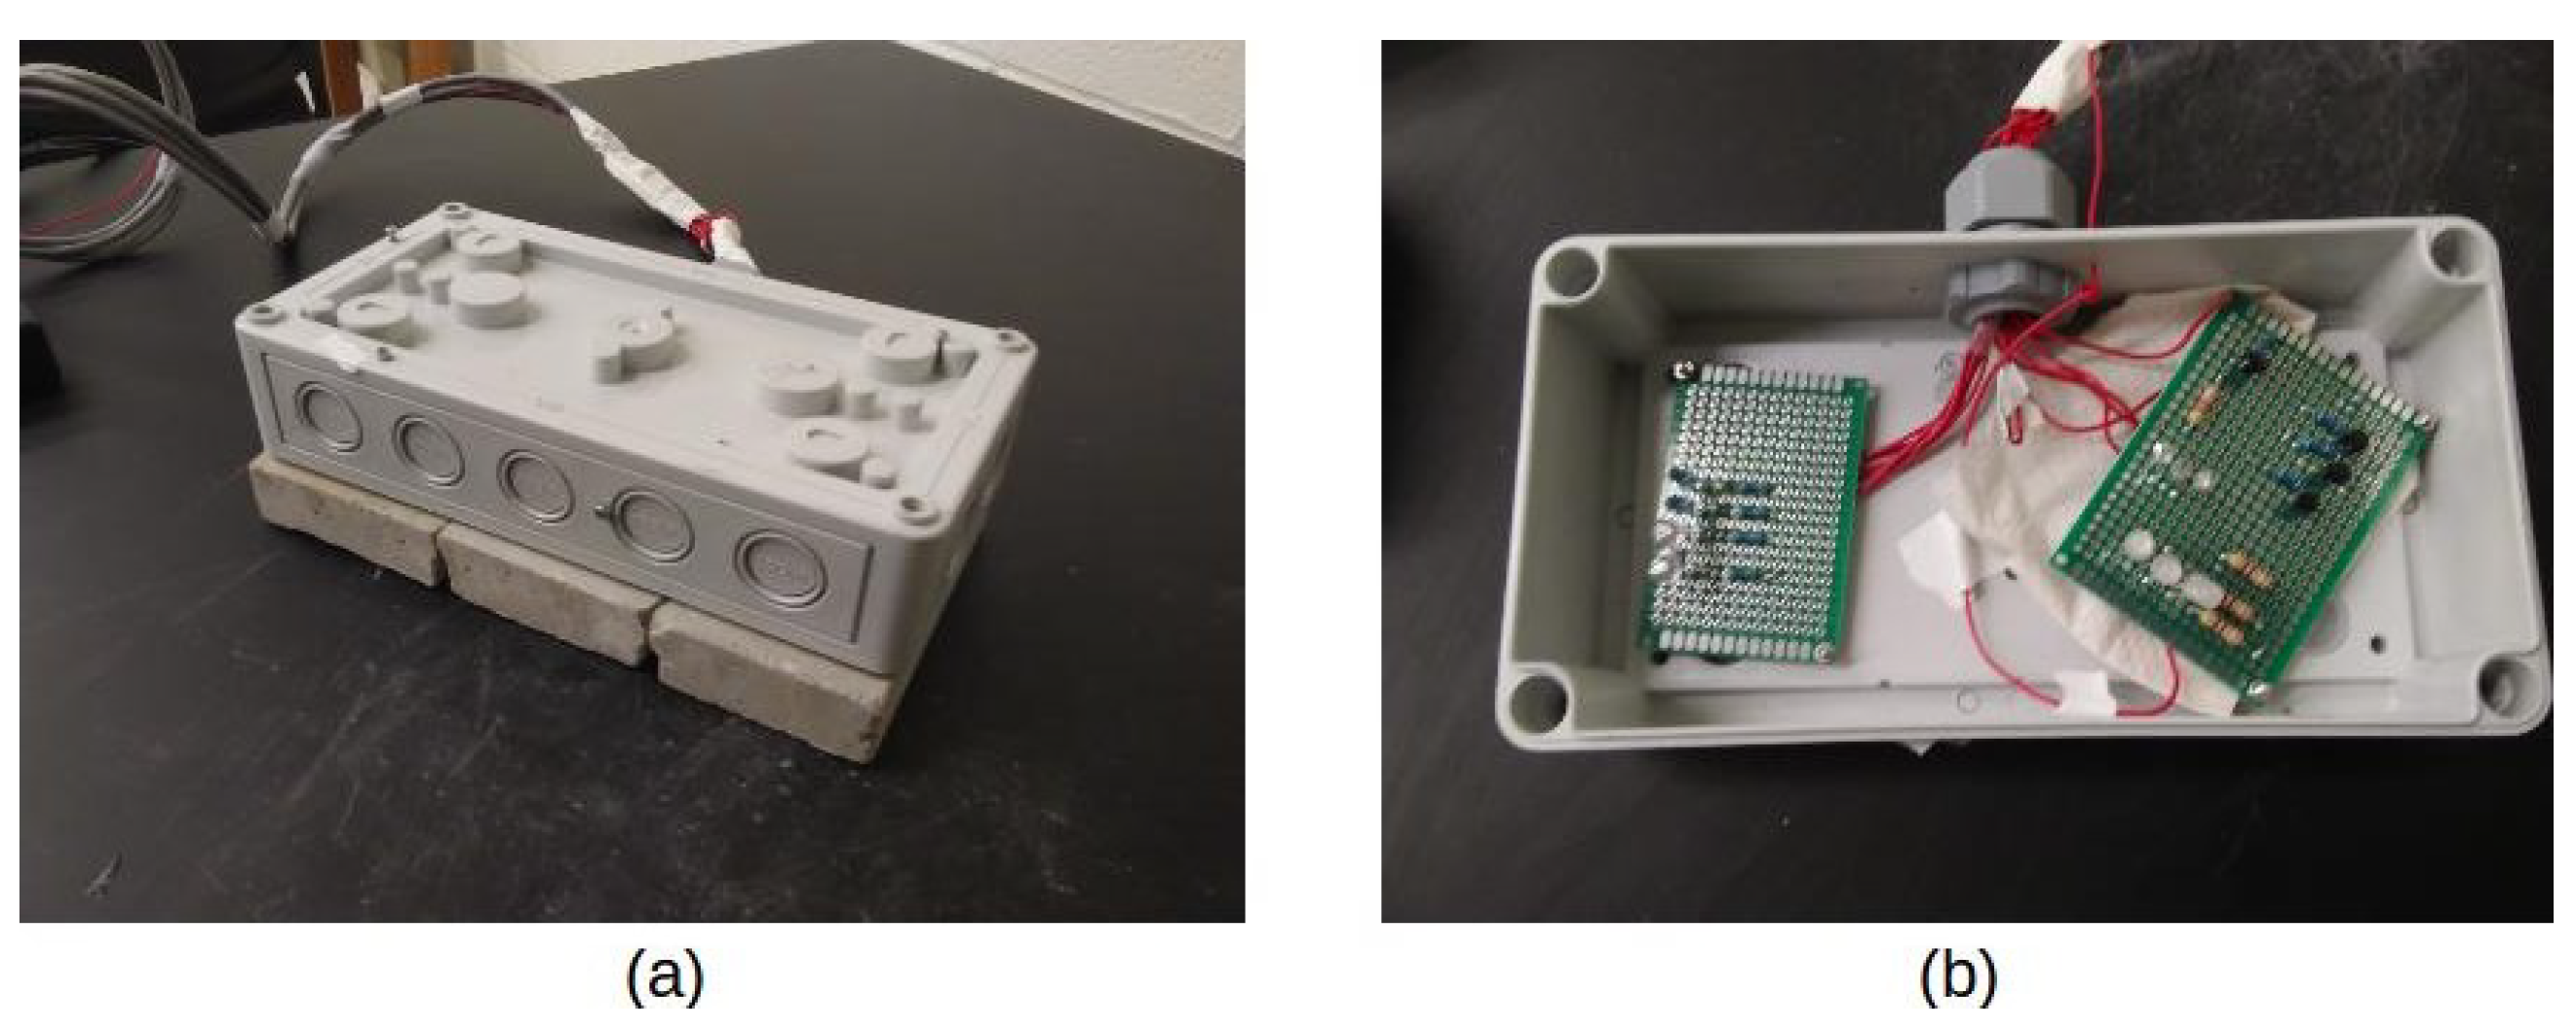
Figure 2.
Image of D-SPARC showing (a) a measurement being performed and (b) the internal layout of the circuit.
Figure 2.
Image of D-SPARC showing (a) a measurement being performed and (b) the internal layout of the circuit.

Figure 3.
Circuit diagram of D-SPARC units and components.

Figure 4.
The D-SPARC data collection process.

Figure 5.
Example of data processing steps with typical data: (a) matrix of measured voltages obtained at the end of each measurement cycle (b) matrix of measured voltages with the background radiation subtracted off and (c) response vector generated after processing the measured voltages.
Figure 5.
Example of data processing steps with typical data: (a) matrix of measured voltages obtained at the end of each measurement cycle (b) matrix of measured voltages with the background radiation subtracted off and (c) response vector generated after processing the measured voltages.

Figure 6.
Maximum reflected radiation responses for each calibration specimen.

Figure 7.
Comparison of measured and predicted albedo from laboratory specimen measurements.

Figure 8.
Field survey of albedo. (a) Selected locations within the University of Illinois campus; (b) using D-SPARC on an aged asphalt pavement (c) using D-SPARC on a concrete pavement; and (d) using an albedometer on an asphalt pavement.
Figure 8.
Field survey of albedo. (a) Selected locations within the University of Illinois campus; (b) using D-SPARC on an aged asphalt pavement (c) using D-SPARC on a concrete pavement; and (d) using an albedometer on an asphalt pavement.

Figure 9.
Measured and predicted albedos from the field survey.


Table 1.
Technical LED details of D-SPARC unit.
| Component | Peak Wavelength (nm) | Spectral Bandwidth (nm) |
|---|---|---|
| RGB LED (red) | 645 | 25 |
| RGB LED (green) | 515 | 30 |
| RGB LED (blue) | 460 | 25 |
| IR LED | 940 | 30 |
Table 2.
Technical details of the D-SPARC photo-transistors.
| Component | Wavelength of Peak Sensitivity (nm) | Range of Spectral Bandwidth (nm) |
|---|---|---|
| Visible range phototransistors (VisPhoto1 and VisPhoto2) | 570 | 440–800 |
| IR range phototransistors (IRPhoto1 and IRPhoto2) | 940 | 400–1100 |
Disclaimer/Publisher’s Note: The statements, opinions and data contained in all publications are solely those of the individual author(s) and contributor(s) and not of MDPI and/or the editor(s). MDPI and/or the editor(s) disclaim responsibility for any injury to people or property resulting from any ideas, methods, instructions or products referred to in the content. |
© 2023 by the authors. Licensee MDPI, Basel, Switzerland. This article is an open access article distributed under the terms and conditions of the Creative Commons Attribution (CC BY) license (https://creativecommons.org/licenses/by/4.0/).
Share and Cite
MDPI and ACS Style
Sen, S.; Roesler, J. D-SPARC: Rapid Field Albedo Measurement. Climate 2023, 11, 64. https://doi.org/10.3390/cli11030064
AMA Style
Sen S, Roesler J. D-SPARC: Rapid Field Albedo Measurement. Climate. 2023; 11(3):64. https://doi.org/10.3390/cli11030064
Chicago/Turabian StyleSen, Sushobhan, and Jeffery Roesler. 2023. "D-SPARC: Rapid Field Albedo Measurement" Climate 11, no. 3: 64. https://doi.org/10.3390/cli11030064
Note that from the first issue of 2016, this journal uses article numbers instead of page numbers. See further details here.