


Observation of an Extremely Dry Atmospheric Air Column above Bern


1
Institute of Applied Physics, University of Bern, 3012 Bern, Switzerland
2
Oeschger Centre for Climate Change Research, University of Bern, 3012 Bern, Switzerland
*
Author to whom correspondence should be addressed.
Climate 2023, 11(3), 63; https://doi.org/10.3390/cli11030063
Submission received: 16 February 2023
/
Revised: 8 March 2023
/
Accepted: 9 March 2023
/
Published: 10 March 2023
(This article belongs to the Special Issue Climate: 10th Anniversary)
Abstract
:The water vapour column density or vertically integrated water vapour (IWV) ranges from about 8 mm in winter to about 25 mm in summer in Bern, Switzerland. However, there can be day episodes when IWV drops to 2 mm or even less so that the atmosphere is extremely dry. We selected an event in February 2021 when the tropospheric water radiometer TROWARA measured a mean IWV value of about 1.5 ± 0.2 mm for a time interval of about one day in Bern. The ECMWF reanalysis ERA5 indicated a slightly higher IWV value of about 2.2 ± 0.4 mm where the uncertainty is the standard deviation of IWV during the time of IWV depression. The ERA5 profiles of relative humidity and specific humidity during this episode are reduced by 50% and more compared to the monthly mean profiles. On a global map, it can be seen that Bern is within a mesoscale dry region on that day with descending wind. Back trajectory analysis gives the result that the dry air masses in Bern came from the North and the trajectories are descending in altitude so that dry air from the mid troposphere came into the lower troposphere. These descending air masses from the North explain the minimum of IWV observed in Bern on 13–14 February 2021. The surface climate in Switzerland was dominated by a cold wave at that time. At the same time, severe cold waves occurred in Greece and Northern America.
1. Introduction
Water vapour contributes to about 60% of the natural greenhouse effect for clear skies [1]. Water vapour is the most important gaseous source of infrared opacity in the atmosphere and acts as a warming blanket for the planet. Cloud and rain droplets are formed by condensation and aggregation of water vapour on cloud condensation nuclei. This condensation of water vapour leads to latent heat release, which is important for atmospheric dynamics and energetics. Finally, atmospheric water vapour is a crucial part of the hydrological cycle consisting of evaporation, transpiration, precipitation and water flow processes.
Water vapour column density or vertically integrated water vapour (IWV) are monitored by various measuring instruments such as ground-based receivers of the Global Navigation Satellite System (GNSS), radiosondes, microwave radiometers, or Fourier transform infrared (FTIR) spectrometers [2]. Various studies indicated that IWV increased by several percents per decade, and this positive trend of IWV conforms with the expected increase of the water vapour abundance due to the increase of the air temperature as a consequence of man-made global warming [2,3,4,5,6]. According to the Clausius–Clapeyron relationship, a warmer atmosphere is associated with an amplification of the water vapour abundance. The expected increase of water vapour is about 7% when the temperature increases by 1 Kelvin. The water vapour feedback for global warming due to man-made emissions of carbon dioxide amounts to up to a factor of two [7].
The spatio-temporal variability of water vapour is high. This is due to the many sources and sinks of tropospheric water vapour and the phase transitions of water. The mean residence time of water vapour in the atmosphere is just about 8 to 10 days [8]. It is part of the present study to learn about the mesoscale variability of atmospheric water vapour which can lead to an extremely dry air column for a period of a day at a certain location. The mesoscale variability is larger than the submesoscale variability of water vapour at 300 m above ground [9]. The boundary layer height, which is strongly controlled by the surface buoyancy flux, the surface latent heat flux, the early-morning heterogeneity of the atmosphere, horizontal advection, and the radiative impact of clouds, contributes to the observed mesoscale variability of water vapour [10].
Vertical advection of dry, ozone-rich air from the stratosphere leads to minima of water vapour and maxima of ozone in the troposphere. The so-called stratospheric intrusions can be observed as thin layers of low relative humidity and high ozone values measured by ground-based lidars at mid latitudes [11]. However, stratospheric intrusions may have a weak effect on IWV, and we suppose that vertical transport of dry ozone-rich air masses may play a role in the generation of dry air columns. Dry, ozone-rich layers were observed in the subtropical middle troposphere and were linked to quasi-isentropic transport from the extratropical UTLS (Upper Troposphere Lower Stratosphere) suggesting a ubiquitous UTLS influence on the subtropical middle troposphere [12].
In the tropics, dry layers are observed in the mid troposphere originating from descending air masses with condensation levels (relative humidity ≥ 100%) in the subtropics [13]. A climatology of mid troposphere dry air layers in warm tropical ocean regions was presented by [14]. According to [15], the dry events in the tropical western Pacific region most often originate in the Northern (winter) Hemisphere as troughs associated with baroclinic waves intensify and expand equatorward, leading to a process analogous to Rossby wave breaking.
In the present study, we analyse IWV above Bern (46.95 N, 7.44 E, 575 m above sea level) in Switzerland. The main contribution of water molecules to IWV comes from the lower troposphere because of the higher air pressure and usually higher specific humidity there. In Switzerland, dry, cold waves occur in winter when cold air comes from the northeast. The circulation is dominated by a high pressure system over northern Russia which transports dry, cold air from Siberia to Europe. The present study focuses on the cold front on 13–16 February 2021, which is called the Greek cold wave, the strongest cold wave in Greece since 2008 [16]. At the same time, a cold wave occurred over North America. The cold wave was caused by a southern migration of the polar vortex and the jet stream, likely caused by a sudden stratospheric warming event that occurred in the prior month [17]. It is interesting that the selected IWV minimum above Bern occurred when two cold waves were observed. Thus, the meandering of the jet stream or the breaking of a planetary Rossby wave might be a precondition for the dry event in February 2021.
2. Instruments and Datasets
2.1. ECMWF Reanalysis (ERA5)
We use hourly IWV data of ERA5 on single levels as provided by the Copernicus data store in cooperation with the European Centre for Medium-range Weather Forecast (ECMWF) [18]. In addition, we use tropospheric profiles of humidity, temperature, wind and ozone, which are provided by ERA5 on pressure levels with a time resolution of 1 h [19]. ERA5 assimilates various satellite products of total ozone and ozone profiles as described by [20]. Assimilation of data from weather satellites, radiosondes and GNSS (Global Navigation Satellite System) stations ensures the high quality of the humidity parameters (e.g., IWV) of ERA5. The horizontal resolution of ERA5 is 0.25 in latitude and longitude. The meteorological fields are provided on 37 pressure levels between 1000 and 1 hPa. For the intercomparison with TROWARA radiometer data in Bern, the ERA5 data were linearly interpolated to latitude and longitude of the radiometer. The TROWARA radiometer data are independent and were not assimilated into ERA5.
2.2. Tropospheric Water Radiometer (TROWARA)
TROWARA is a dual-channel microwave radiometer which measures the brightness temperature at 21.4 and 31.5 GHz since 1994. The design and the construction of TROWARA were described by [21,22]. The instrument is located inside a temperature-controlled room on the roof of the building for Exakte Wissenschaften (EXWI) of the University of Bern (46.95 N, 7.44 E, 575 m.a.s.l.). The atmospheric radiation enters through a microwave transparent window into the room where TROWARA measures it with an elevation angle of the antenna of 40 pointing towards the southeast. This indoor operation of TROWARA avoids a bias due to a water film or rain drops on the antenna. IWV and ILW (integrated cloud liquid water) are retrieved for rain-free periods (ILW mm), while the rain rate is retrieved when it rains (ILW mm) [23,24,25,26]. Further details about the instrument and the retrieval technique are provided by [24,27].
The measurement principle and the retrieval can be briefly described. The radiative transfer equation of a non-scattering atmosphere is
where is the observed brightness temperature, and is the brightness temperature of the cosmic microwave background. denotes the effective mean temperature of the troposphere. is the opacity of the i-th frequency channel (e.g., 21 GHz) along the line of sight of the radiometer [24,28].
Equation (1) is solved for the opacities
where the TROWARA observations provide the radiances .
The opacities are related to IWV, ILW, integrated rain liquid (IRL) and integrated snow liquid (ISL) by
where is the Mie gain. The Mie gain increases rapidly for drop diameters larger than 0.3 mm, reaching values up to 7 at 31.5 GHz, and almost up to 10 at 21.4 GHz [23]. Thus, the opacity due to water vapour is much smaller than the opacity due to rain. Equation (3) cannot be solved without additional information, e.g., measurement of the vertically and horizontally polarized radiance. For example, water vapour, cloud water, and rain water were retrieved from measurements of a triple-frequency, dual-polarisation microwave radiometer [29].
In case of TROWARA, we precisely derive IWV for rain-free periods. IWV during rain is derived from linearly interpolated opacities using the rain-free opacities before and after the rainfall. In a plane-parallel and rain-free atmosphere, the opacity is linearly related to IWV and ILW
where the coefficients a and b partly depend on air pressure. Coincident measurements of radiosondes allow the statistical determination of the coefficients, fine-tuned at times of periods with a clear atmosphere [24]. The coefficient c is the mass absorption coefficient of cloud water. c depends on temperature (and frequency), but not on pressure. It is derived from the physical expression of Rayleigh absorption by clouds [24]. The coefficients and the opacity measurements at 21 and 31 GHz yield the desired parameters IWV and ILW in Equation (4). The time series of IWV and ILW have a time resolution between 6 and 13 s. The high temporal resolution of TROWARA permits the fast distinction between rain (ILW mm) and rain-free (ILW < 0.4 mm) periods.
Recently, we compared IWV from ERA5 and TROWARA for rain-free periods in Bern. The mean difference TROWARA-ERA5 was 0.38 mm ± 0.70 mm obtained for the time interval 2004 to 2016 [30].
3. Results
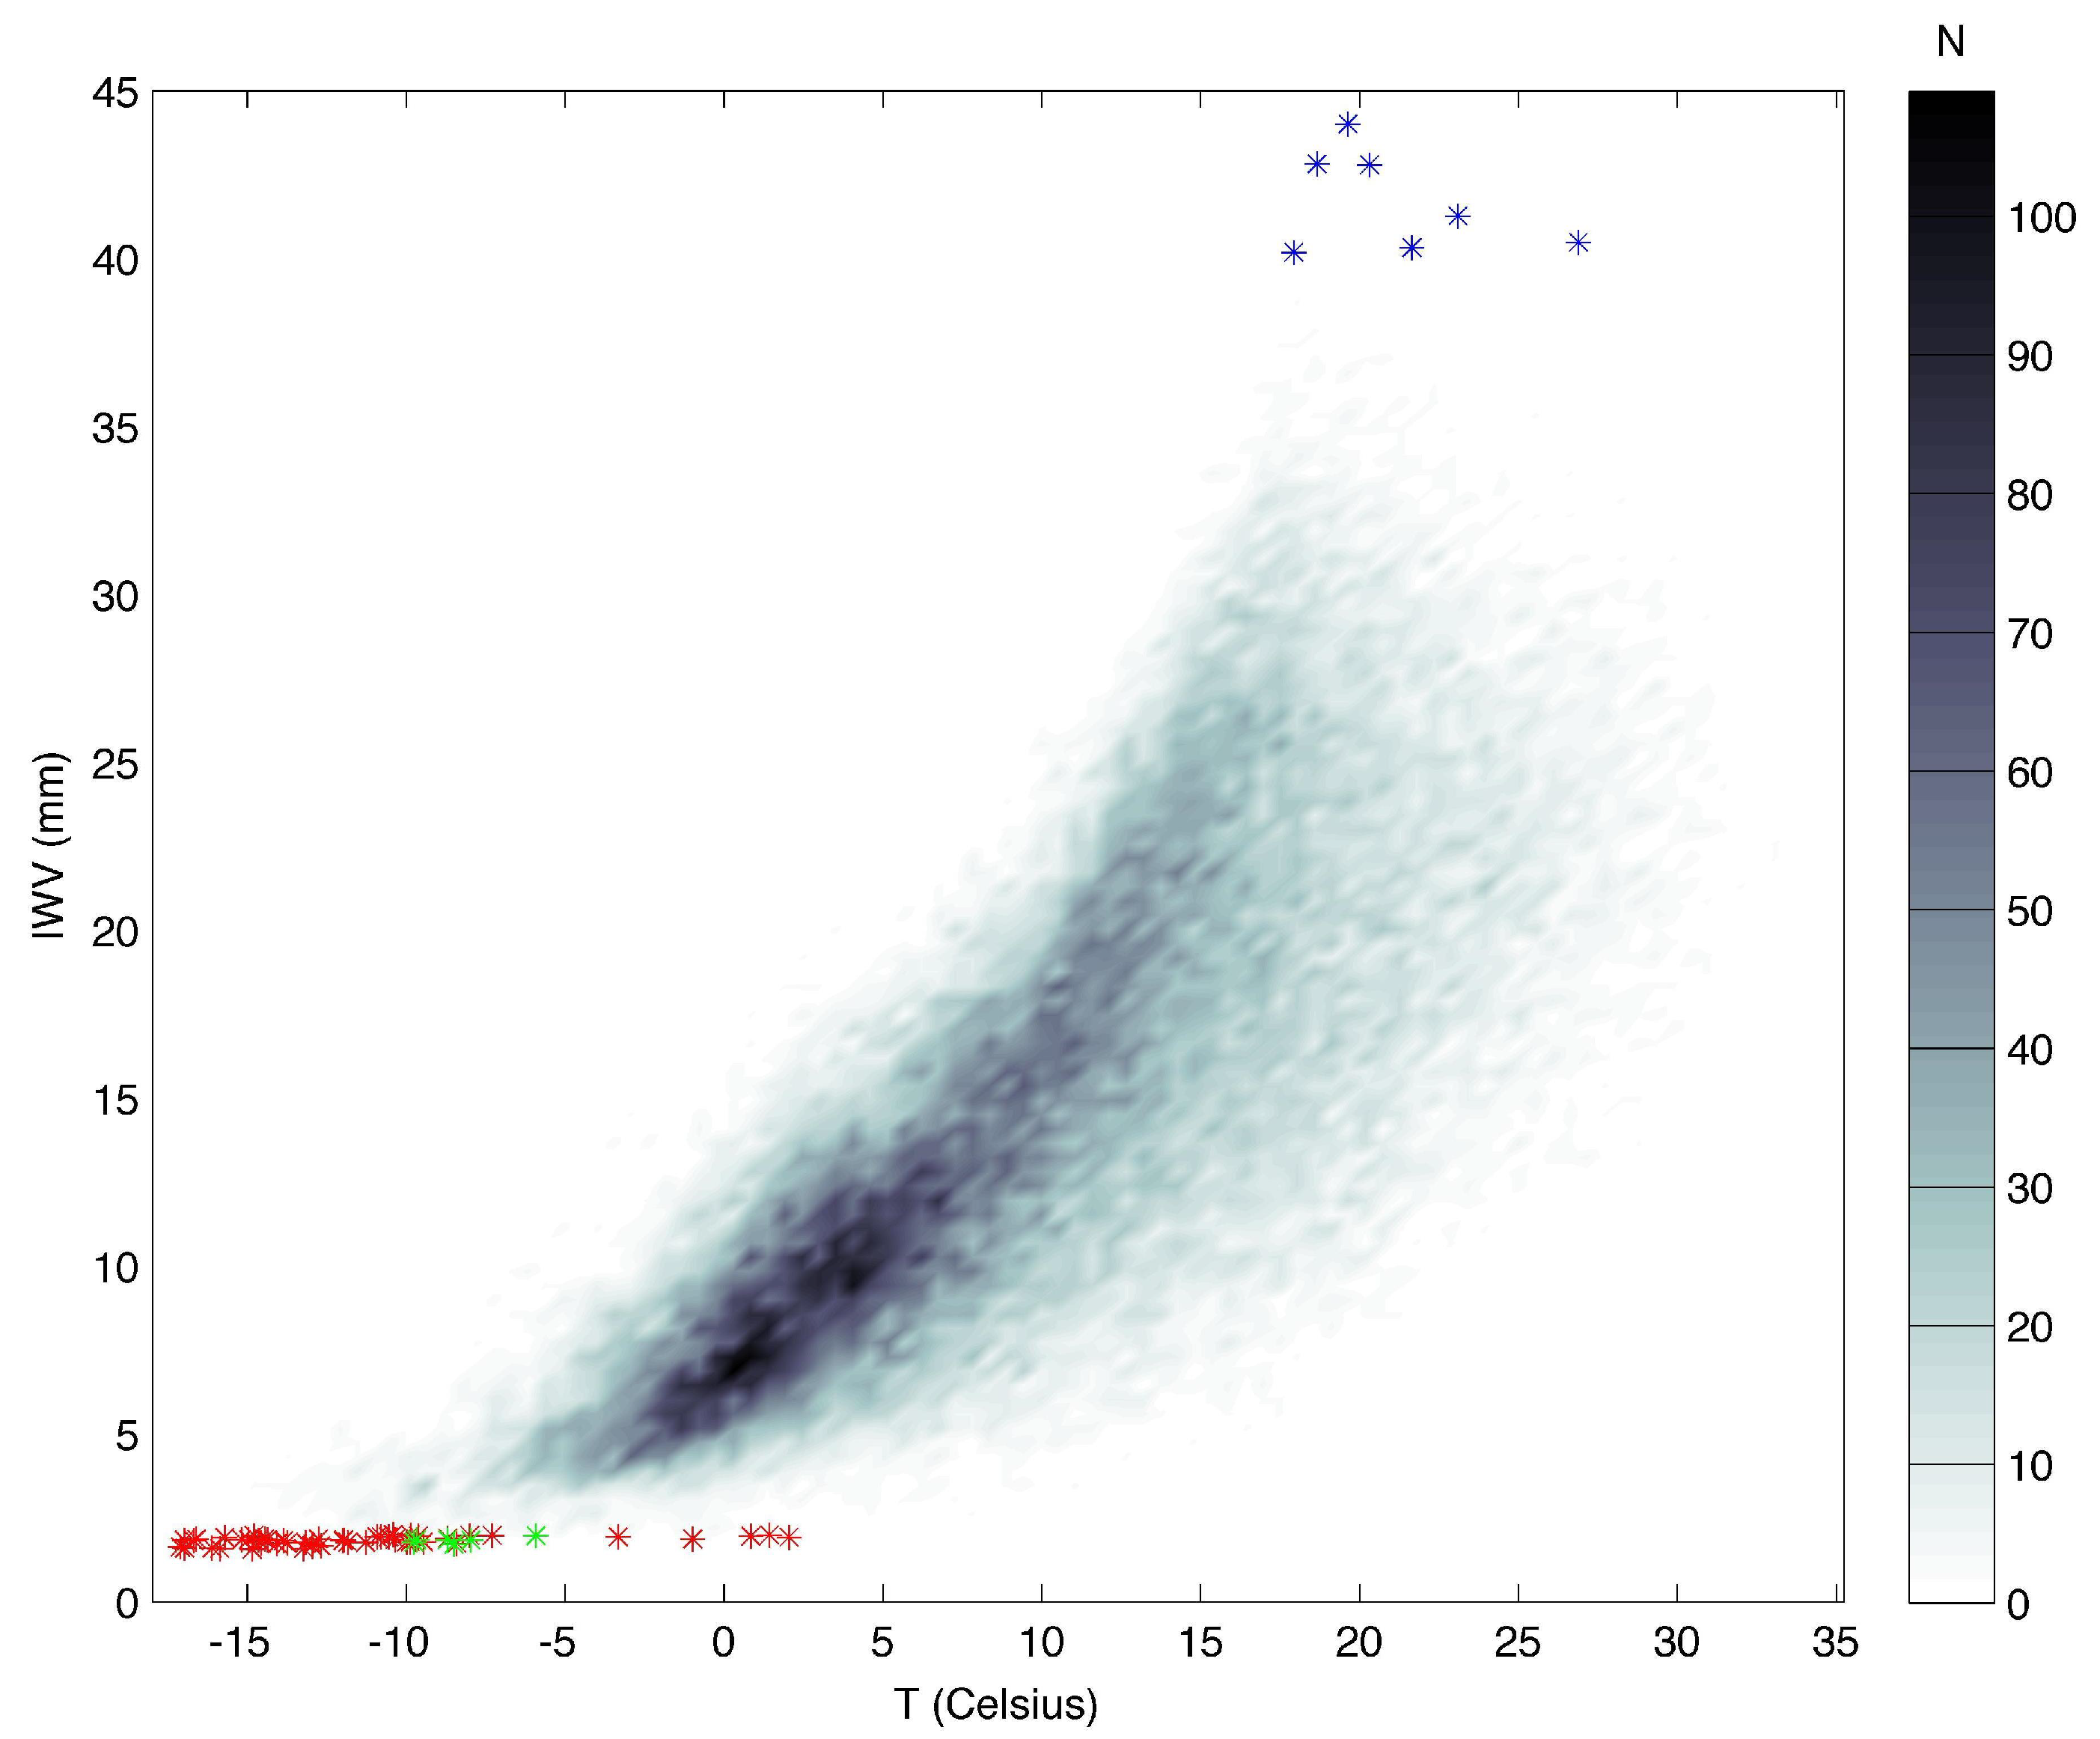
The dependence between IWV and surface air temperature is related to the Clausius–Clapeyron equation and can be roughly explained by “warm air can hold more water vapour than cold air”. Figure 1 shows the distribution of IWV and surface air temperature values from ERA5 between 2009 and 2021. For climate science, the study of extreme values is of special interest. Minimal values of IWV (red and green stars with IWV < 2 mm) occur at low temperatures while maximal values (IWV > 40 mm, blue stars) are at high temperatures. However, the maximal IWV values do not occur at temperatures greater than 30 C. Thus, the statement “warm air can hold more water vapour” is not completely realized in Bern. There must be other processes such as transport and convection which contribute to IWV as well. Similarly, the minimal IWV values in Figure 1 are not restricted to the lowest surface air temperatures. This indicates that not only cold surface air is important to achieve an IWV minimum. We quantify later that the state of the mid troposphere is also important for the IWV value.
The extreme values are just a fraction of 0.1% of the data pairs. Generally, the IWV values of ERA5 are not smaller than 1.5 mm for the time from 2009 to 2021.
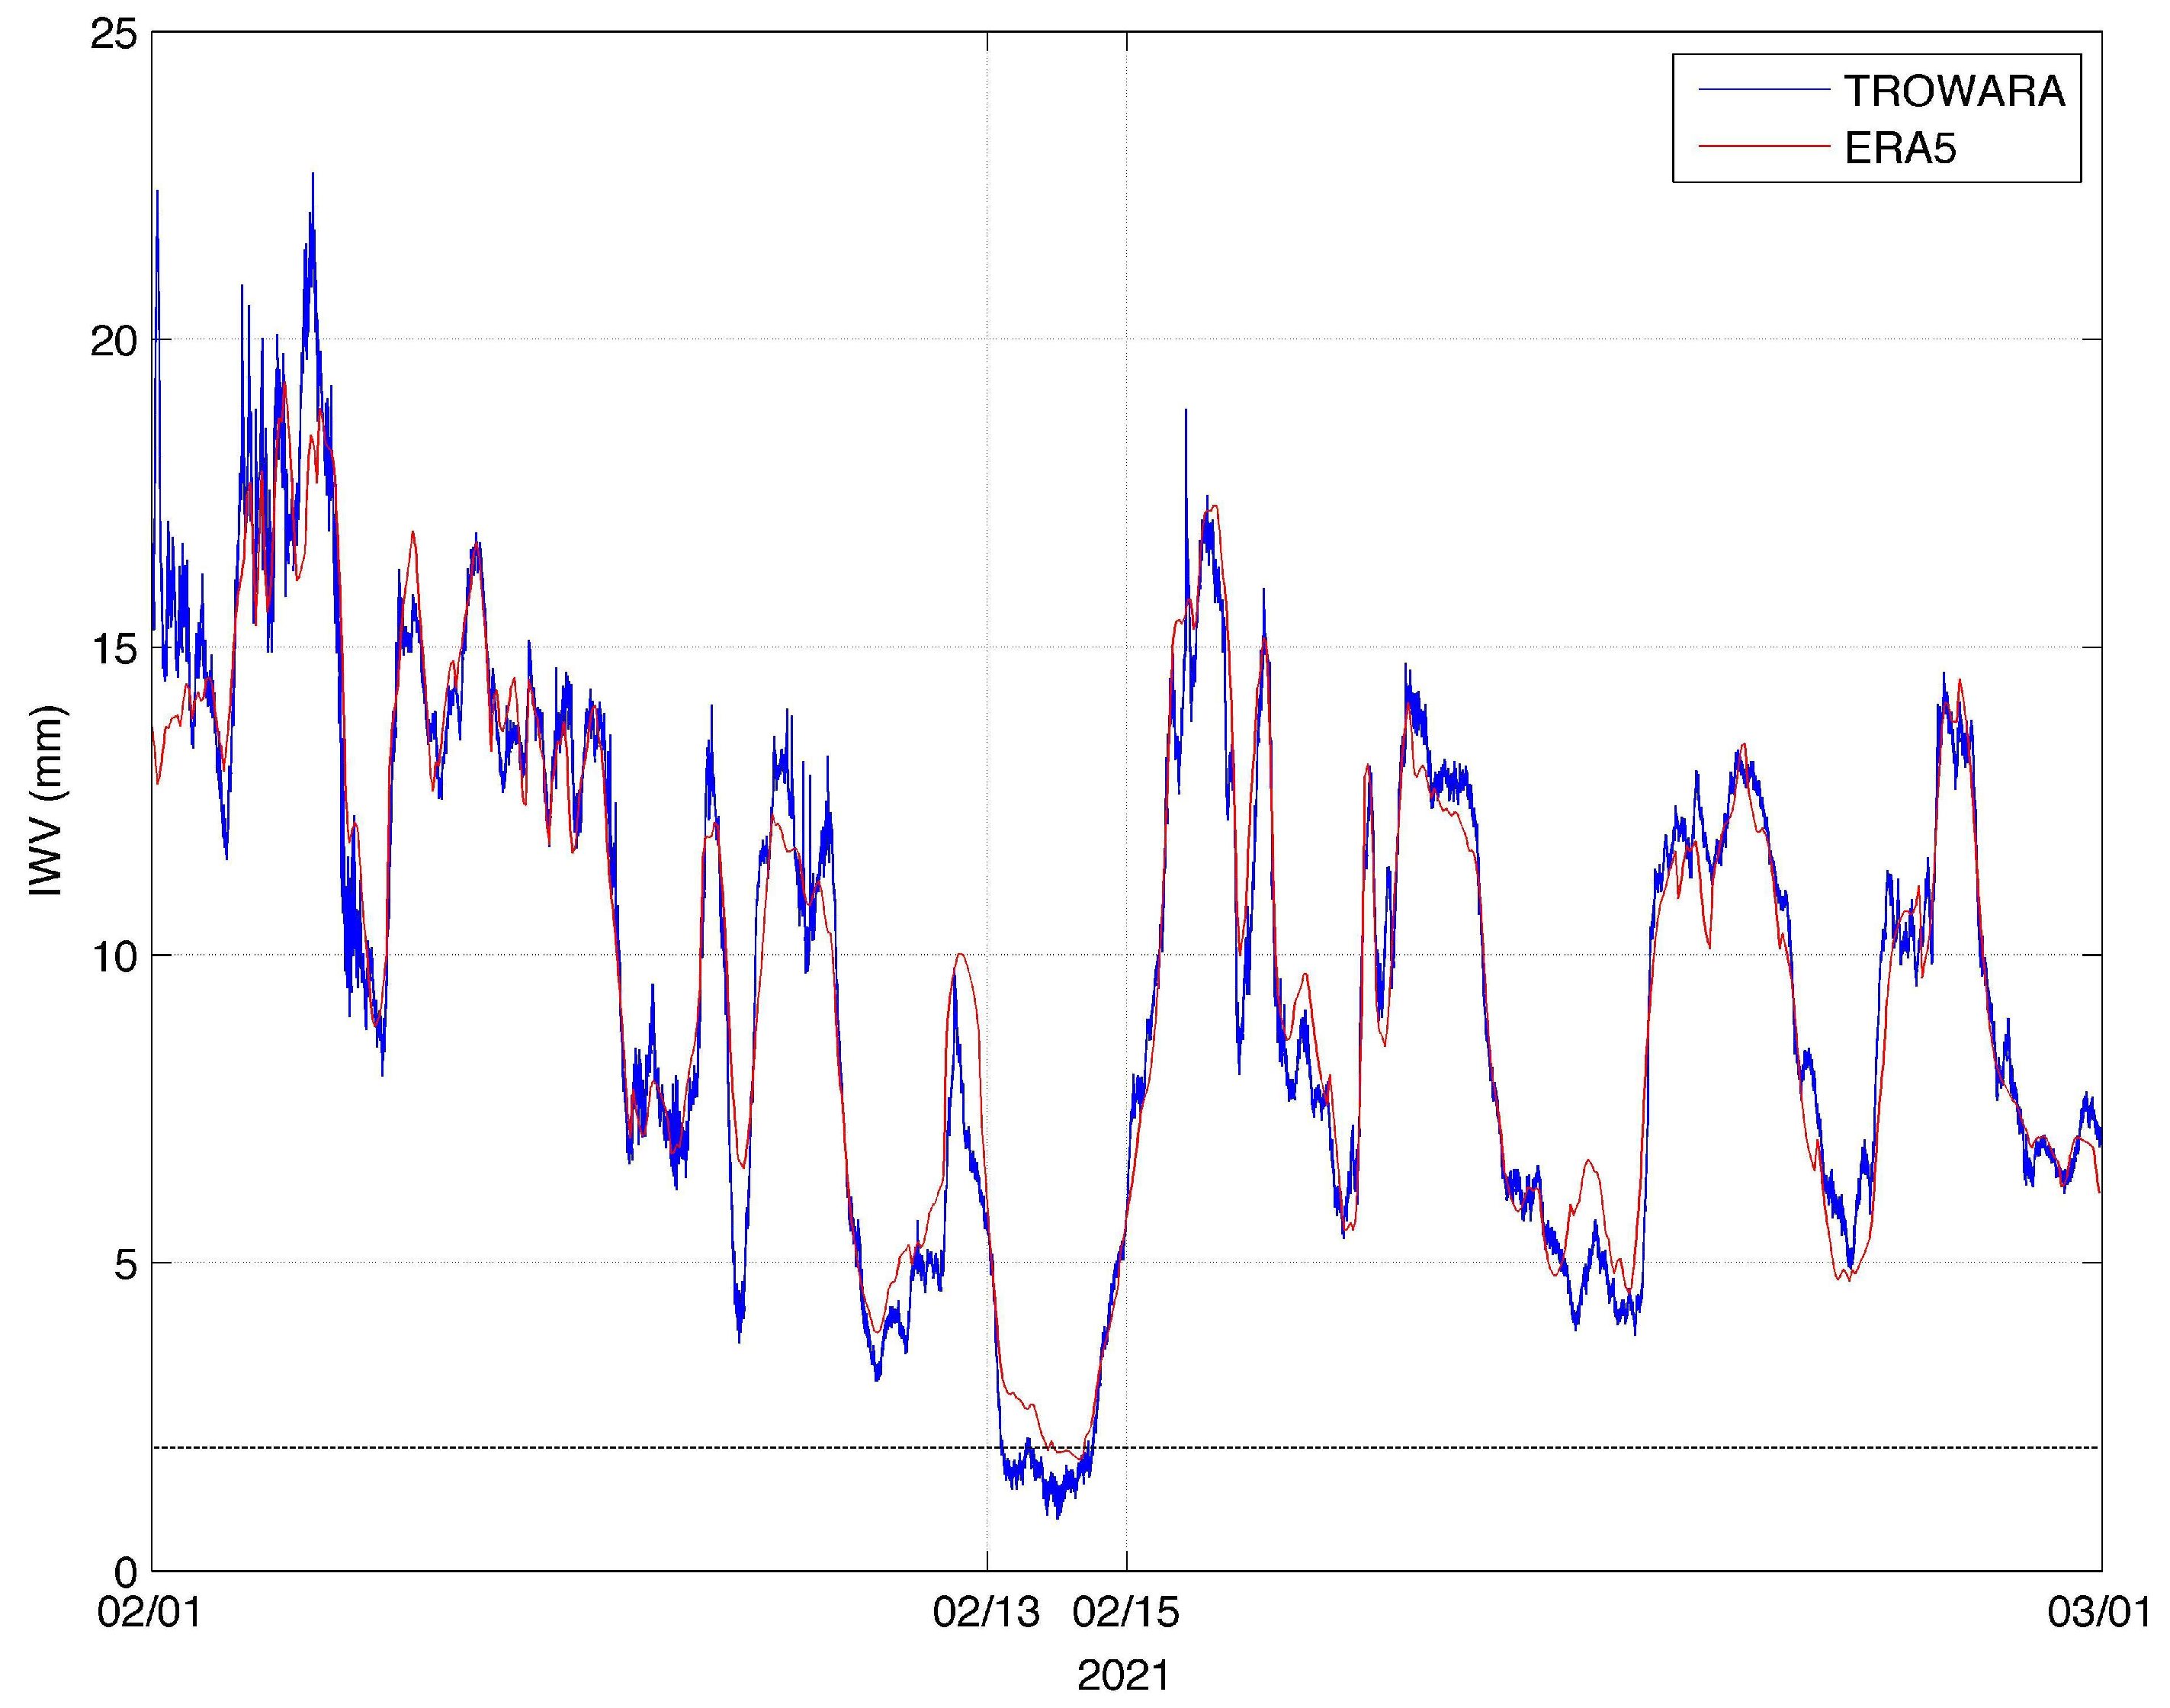
It is beyond the scope of this communication article to analyse all extreme cases. In the following, we focus on the dry event of February 2021 which is denoted by green stars in Figure 1, and we confirm the ERA5 data of this IWV depression in Bern by using our own IWV values observed by the TROWARA radiometer in Bern. The study analyses the IWV observations of the TROWARA radiometer in Bern in February 2021. The time interval has been selected by considering the TROWARA measurements since 2004. Since 2004, there are occasionally depressions in IWV lasting about one day and mostly in the winter season. IWV then reaches small values of 2 or 3 mm. On 13–14 February 2021, minimal values of IWV less than 2 mm and down to 0.83 mm have been reached as Figure 2 shows for TROWARA in blue. The mean value of IWV is about 1.5 mm (for 13 February 2021, 8:30 UT–14 February 2021, 10:30 UT). The IWV curve of ERA5 (red) nicely agrees with TROWARA, but the mean IWV is about 2.2 mm (for 13 February 2021, 8:30 UT–14 February 2021, 10:30 UT). The mean value of IWV of TROWARA is 9.88 mm in the whole month of February 2021, and the standard deviation is 4.32 mm. The measurement noise of TROWARA can be estimated by looking at the high frequency fluctuations of IWV during the period of IWV depression when a cloudless sky was present. The noise amplitude of TROWARA’s IWV is about mm. ERA5 gives a mean IWV value of 9.93 and a standard deviation of 4.06 mm in February 2021. Here, we selected the period of February 2021 for a detailed study about the characteristics and the reasons for the observed depression in IWV.
Since the altitude of the lowest model level of ERA5 is 131 meters above the altitude of Bern (575 m.a.s.l.), the ERA5 IWV values shown in Figure 2 were previously corrected as described by [3]
where the altitude values are in meters.
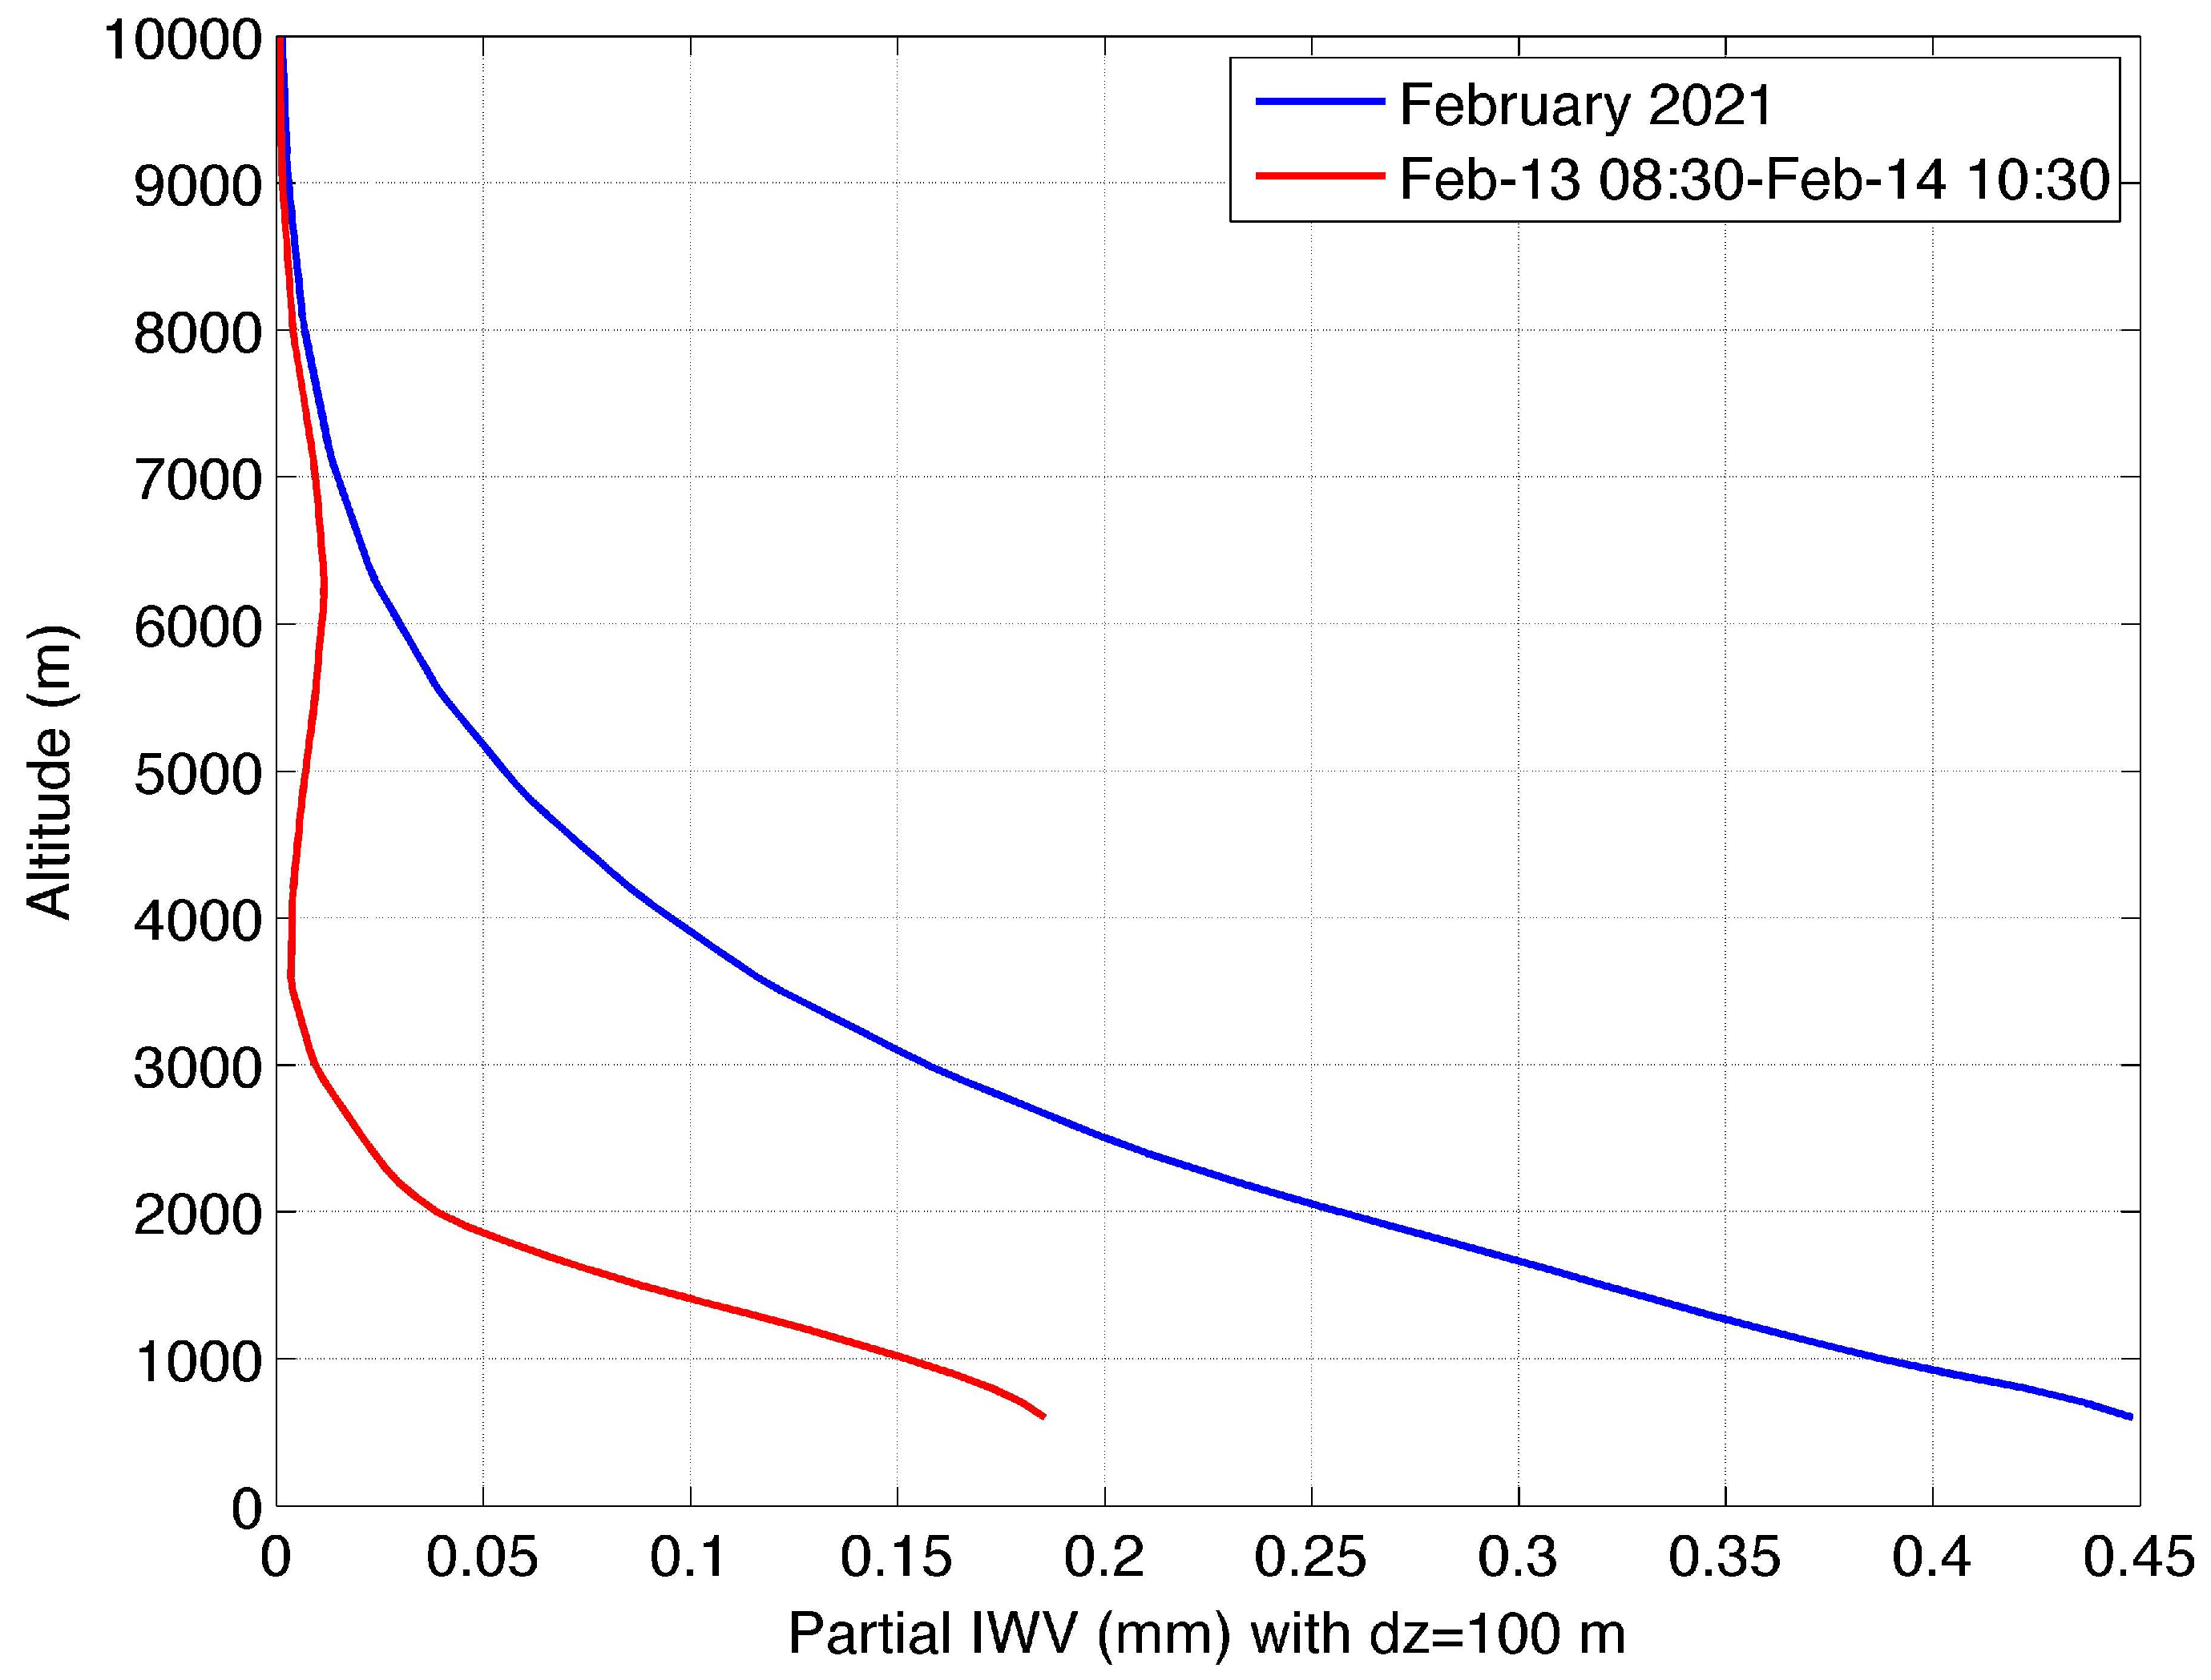
Since ERA5 and TROWARA agree well in Figure 2, we use ERA5 for a description of the atmospheric profiles of humidity and other parameters. We start with partial IWV where we partially integrate the water vapour density profile over altitude intervals of 100 m. Figure 3 shows partial IWV estimated by ERA5 for the time of the IWV depression February 2021, 8:30 UT–14 February 2021, 10:30 UT) in red and the mean profile of partial IWV for the complete February 2021 in blue. The mid troposphere from 2000 to 5000 m contributes in the blue curve 42% of the total IWV where total IWV is 9.9 mm in February 2021. The altitude range below 2000 m contributes 50% of the total IWV. During the dry event, the mid troposphere contributes 15% of the total IWV where total IWV is 2.2 mm for the red curve. The major part of IWV during the dry event originates from the altitudes below 2000 m above sea level, and it amounts to 72% of the total IWV. The decrease of partial IWV in the middle and lower troposphere is essential to explain the IWV minimum.
Now, the behaviour of other atmospheric parameters is investigated by means of atmospheric profiles from ERA5. Figure 4 shows the mean profiles of the whole month of February 2021 in blue and the mean profiles during the time of IWV depression (13 February 2021, 8:30 UT–14 February 2021, 10:30 UT) in red. It is most remarkable that, during the IWV depression, the specific humidity q is reduced by 50% to 97% compared to the complete month (blue line). The severe decrease of q occurs from the surface to the 450 hPa pressure level. The relative humidity RH is decreased between 400 and 900 hPa (red line). A minimum of 2.5% is reached for RH at 650 hPa.
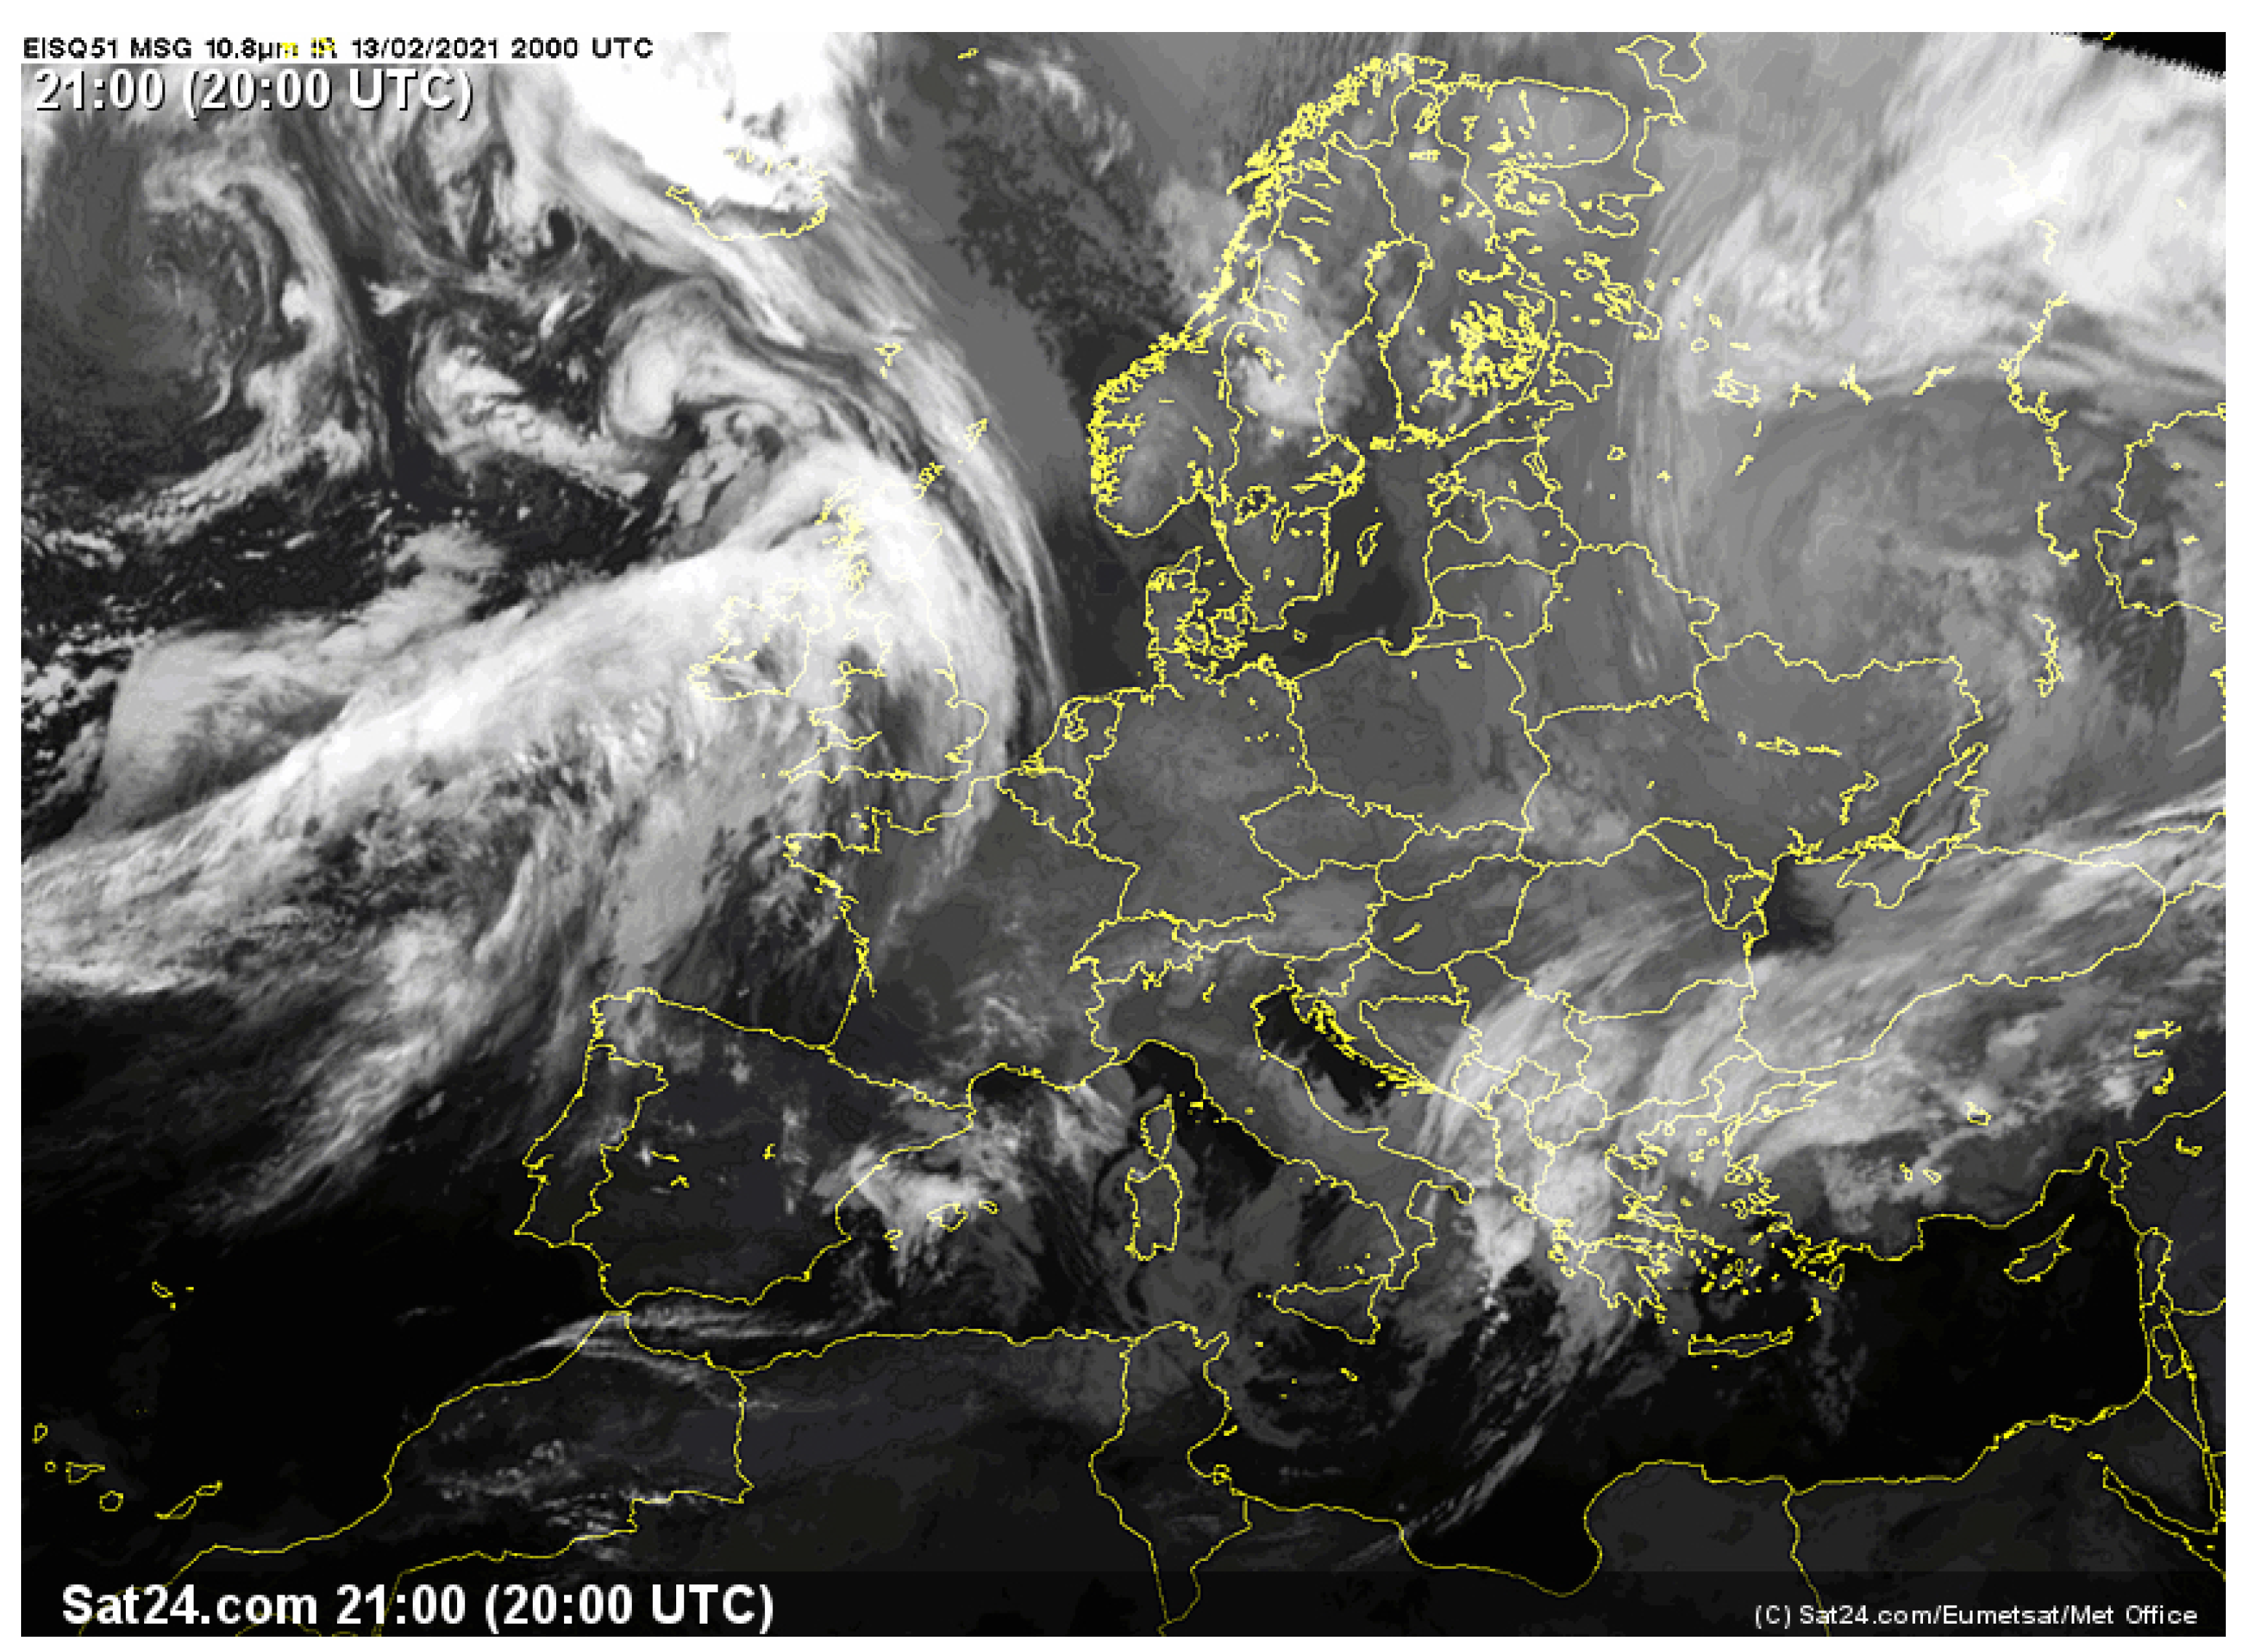
The blue and the red line of the ozone mass mixing ratio are close together in Figure 4, so that a stratospheric intrusion of dry, ozone-rich air during the IWV depression can be excluded. The surface air temperature is during the IWV depression at 268.7 K, which is about 13 degrees lower than the monthly average. The Swiss monthly weather summary reported a cold wave with northeasterly wind (bise) during the time of IWV depression in Bern [31]. Coincident cold waves occurred in Greece [16] and North America [17] with serious damage. MeteoSwiss analysed that a high pressure system over Scandinavia brought cold air from the northeast to Switzerland in the days between the 10th and 15th of February 2021 [32]. This cold wave episode was embedded into a relative warm February for Switzerland. Figure 5 shows the weather situation in Europe on 13 February 2021, 20:00 UTC when minimal IWV was observed over Bern. A clear sky was over Central Europe, e.g., Switzerland and Germany). The small ILW values observed by TROWARA also indicate a cloudless sky over Bern when IWV was minimal. The weather in Bern was dominated by cold and dry air from the northeast.
Coming back to Figure 4, the relative humidity RH at the surface is not decreased during the IWV depression in Bern. Since RH is the quotient of water vapour pressure and saturation vapour pressure, counter and denominator decreased in a similar way. Indeed, the saturation vapour pressure decreased because of the decrease of surface air temperature, and the water vapour pressure decreased because of the decrease of specific humidity so that RH remained quite constant at around 75% in the lower troposphere. Strong southward wind occurred between 200 and 700 hPa during the time of IWV depression (the red line of meridional wind v in Figure 4). The vertical wind w shows no remarkable change in Figure 4).
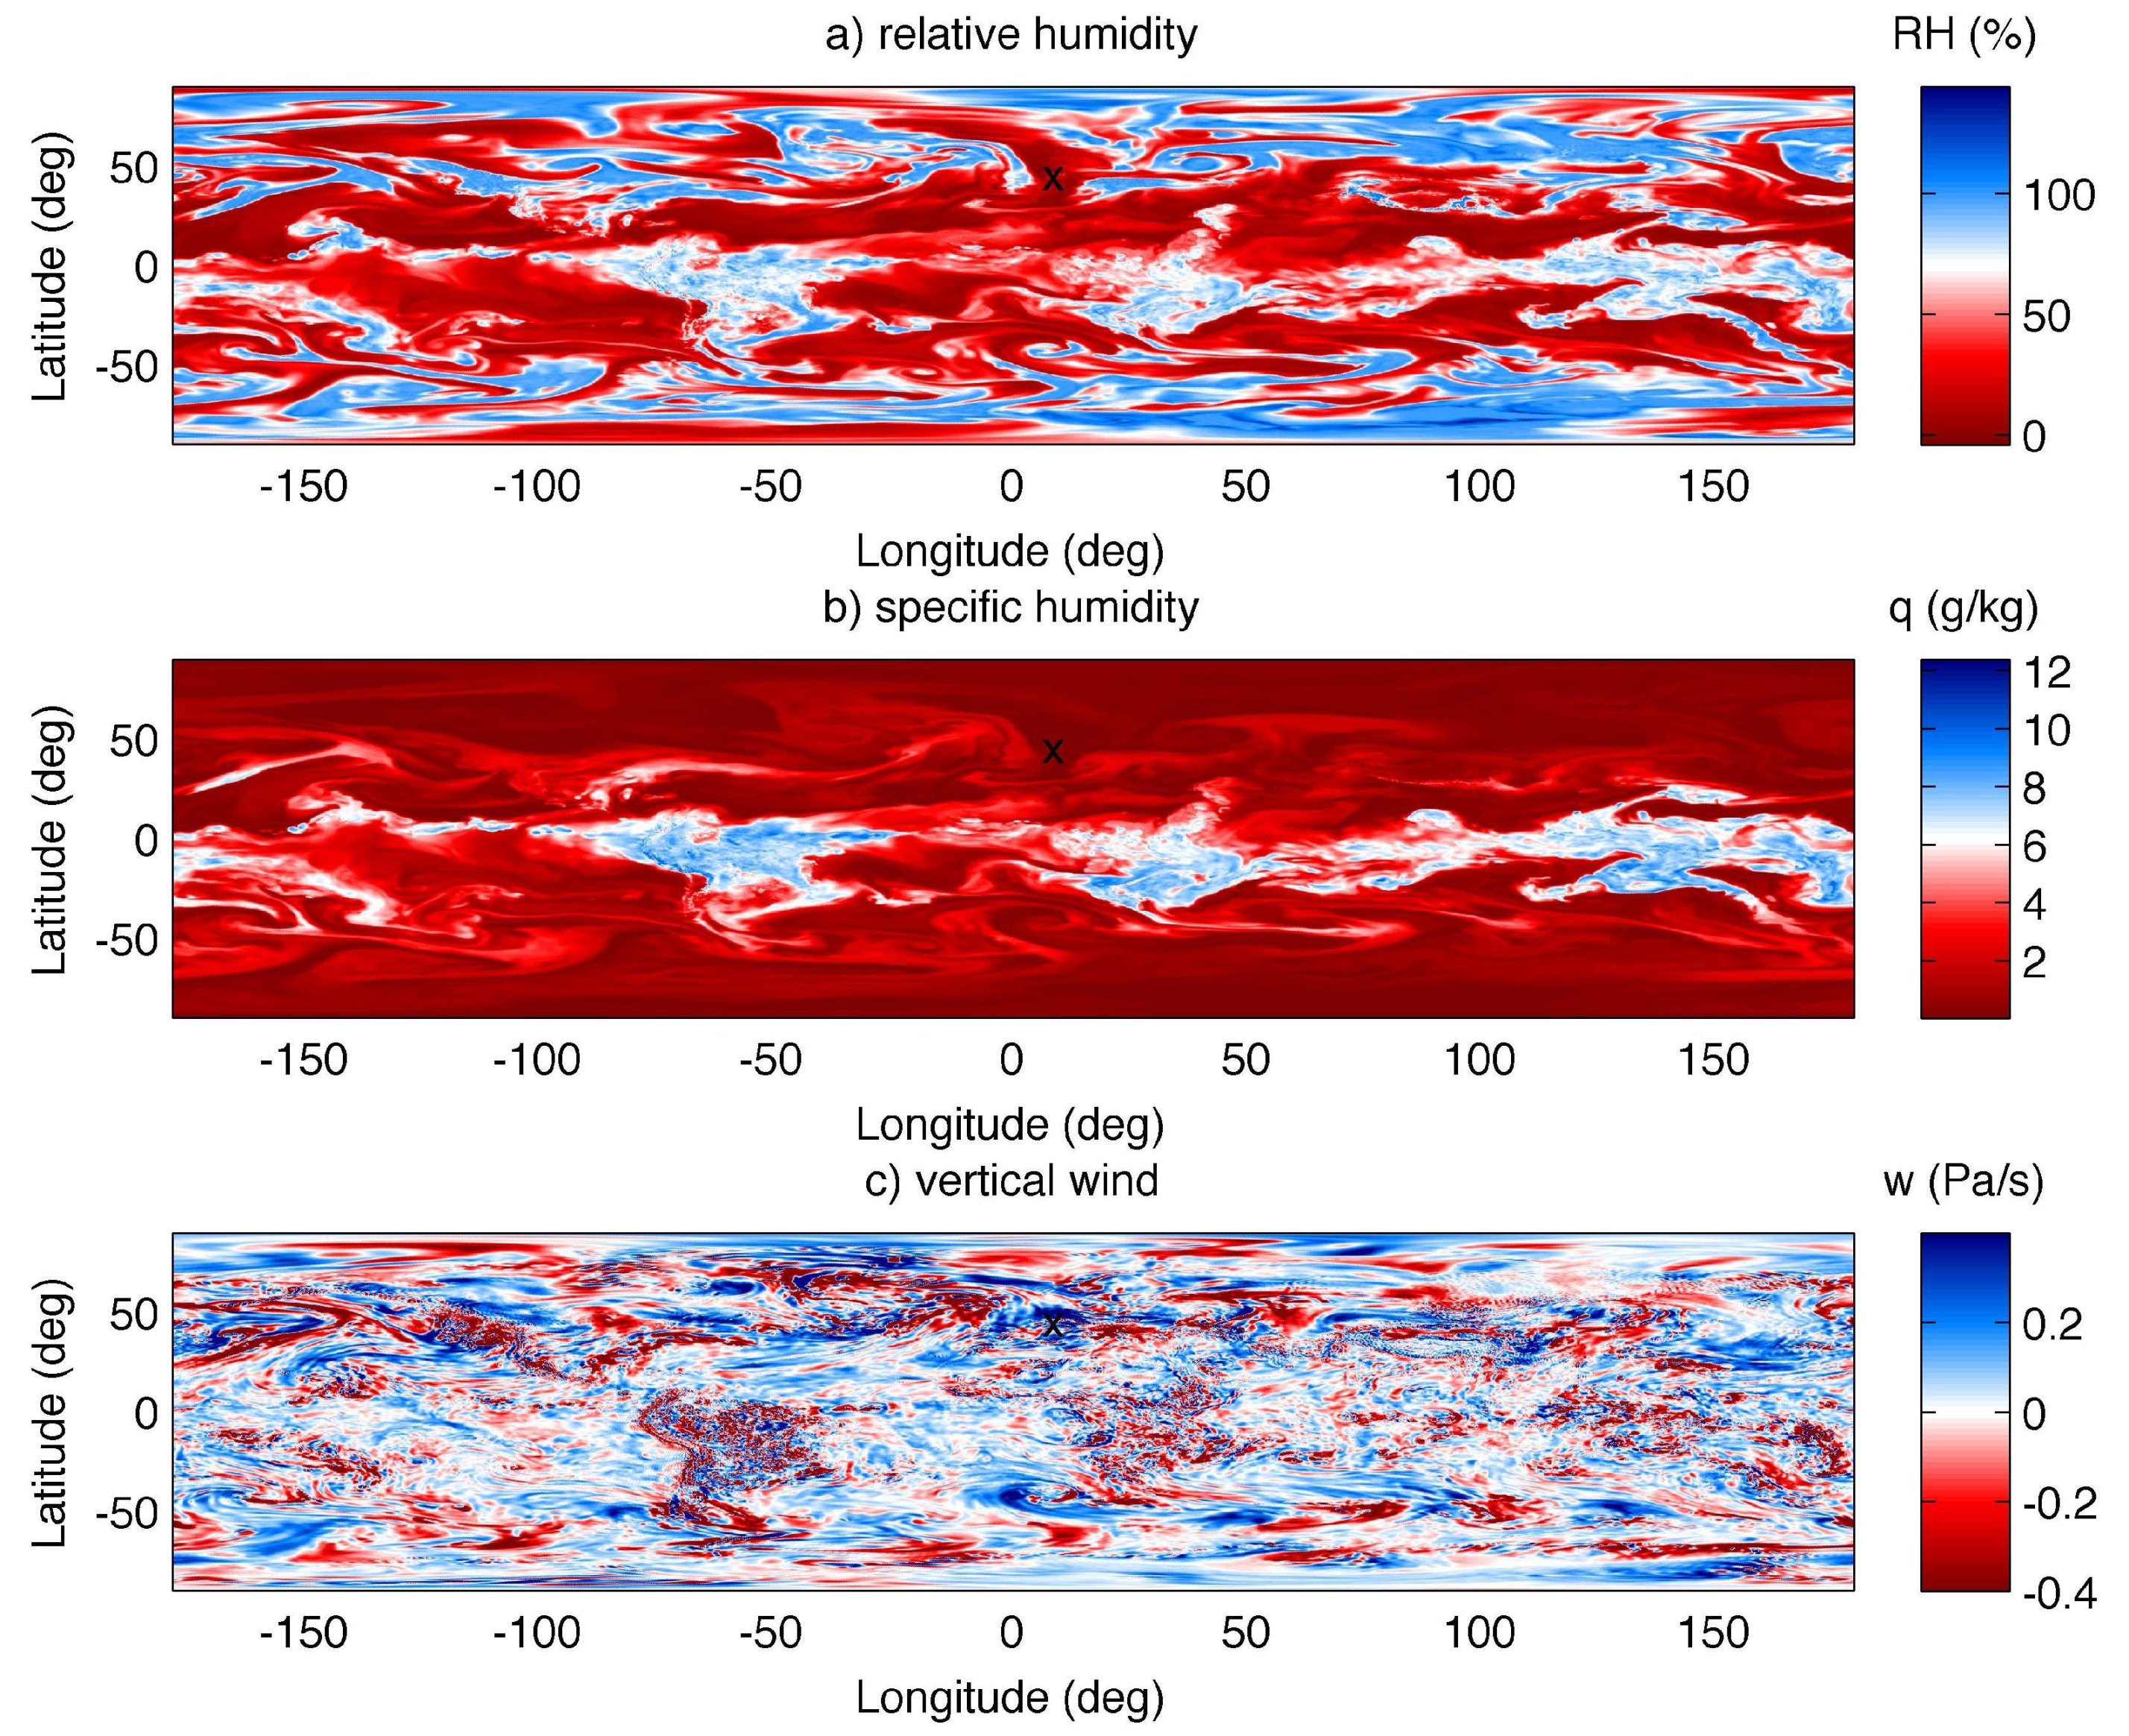
In order to have an impression about the scale size of the IWV depression in Bern, we look at the global fields of relative humidity, specific humidity, and vertical wind at 650 hPa as estimated by ERA5 in Figure 6 for 13 February 2021 20:00 UT. The location of Bern is indicated by the black X. All parameters show mesoscale variations, and Bern is inside a dry region with descending winds (positive values are downward).
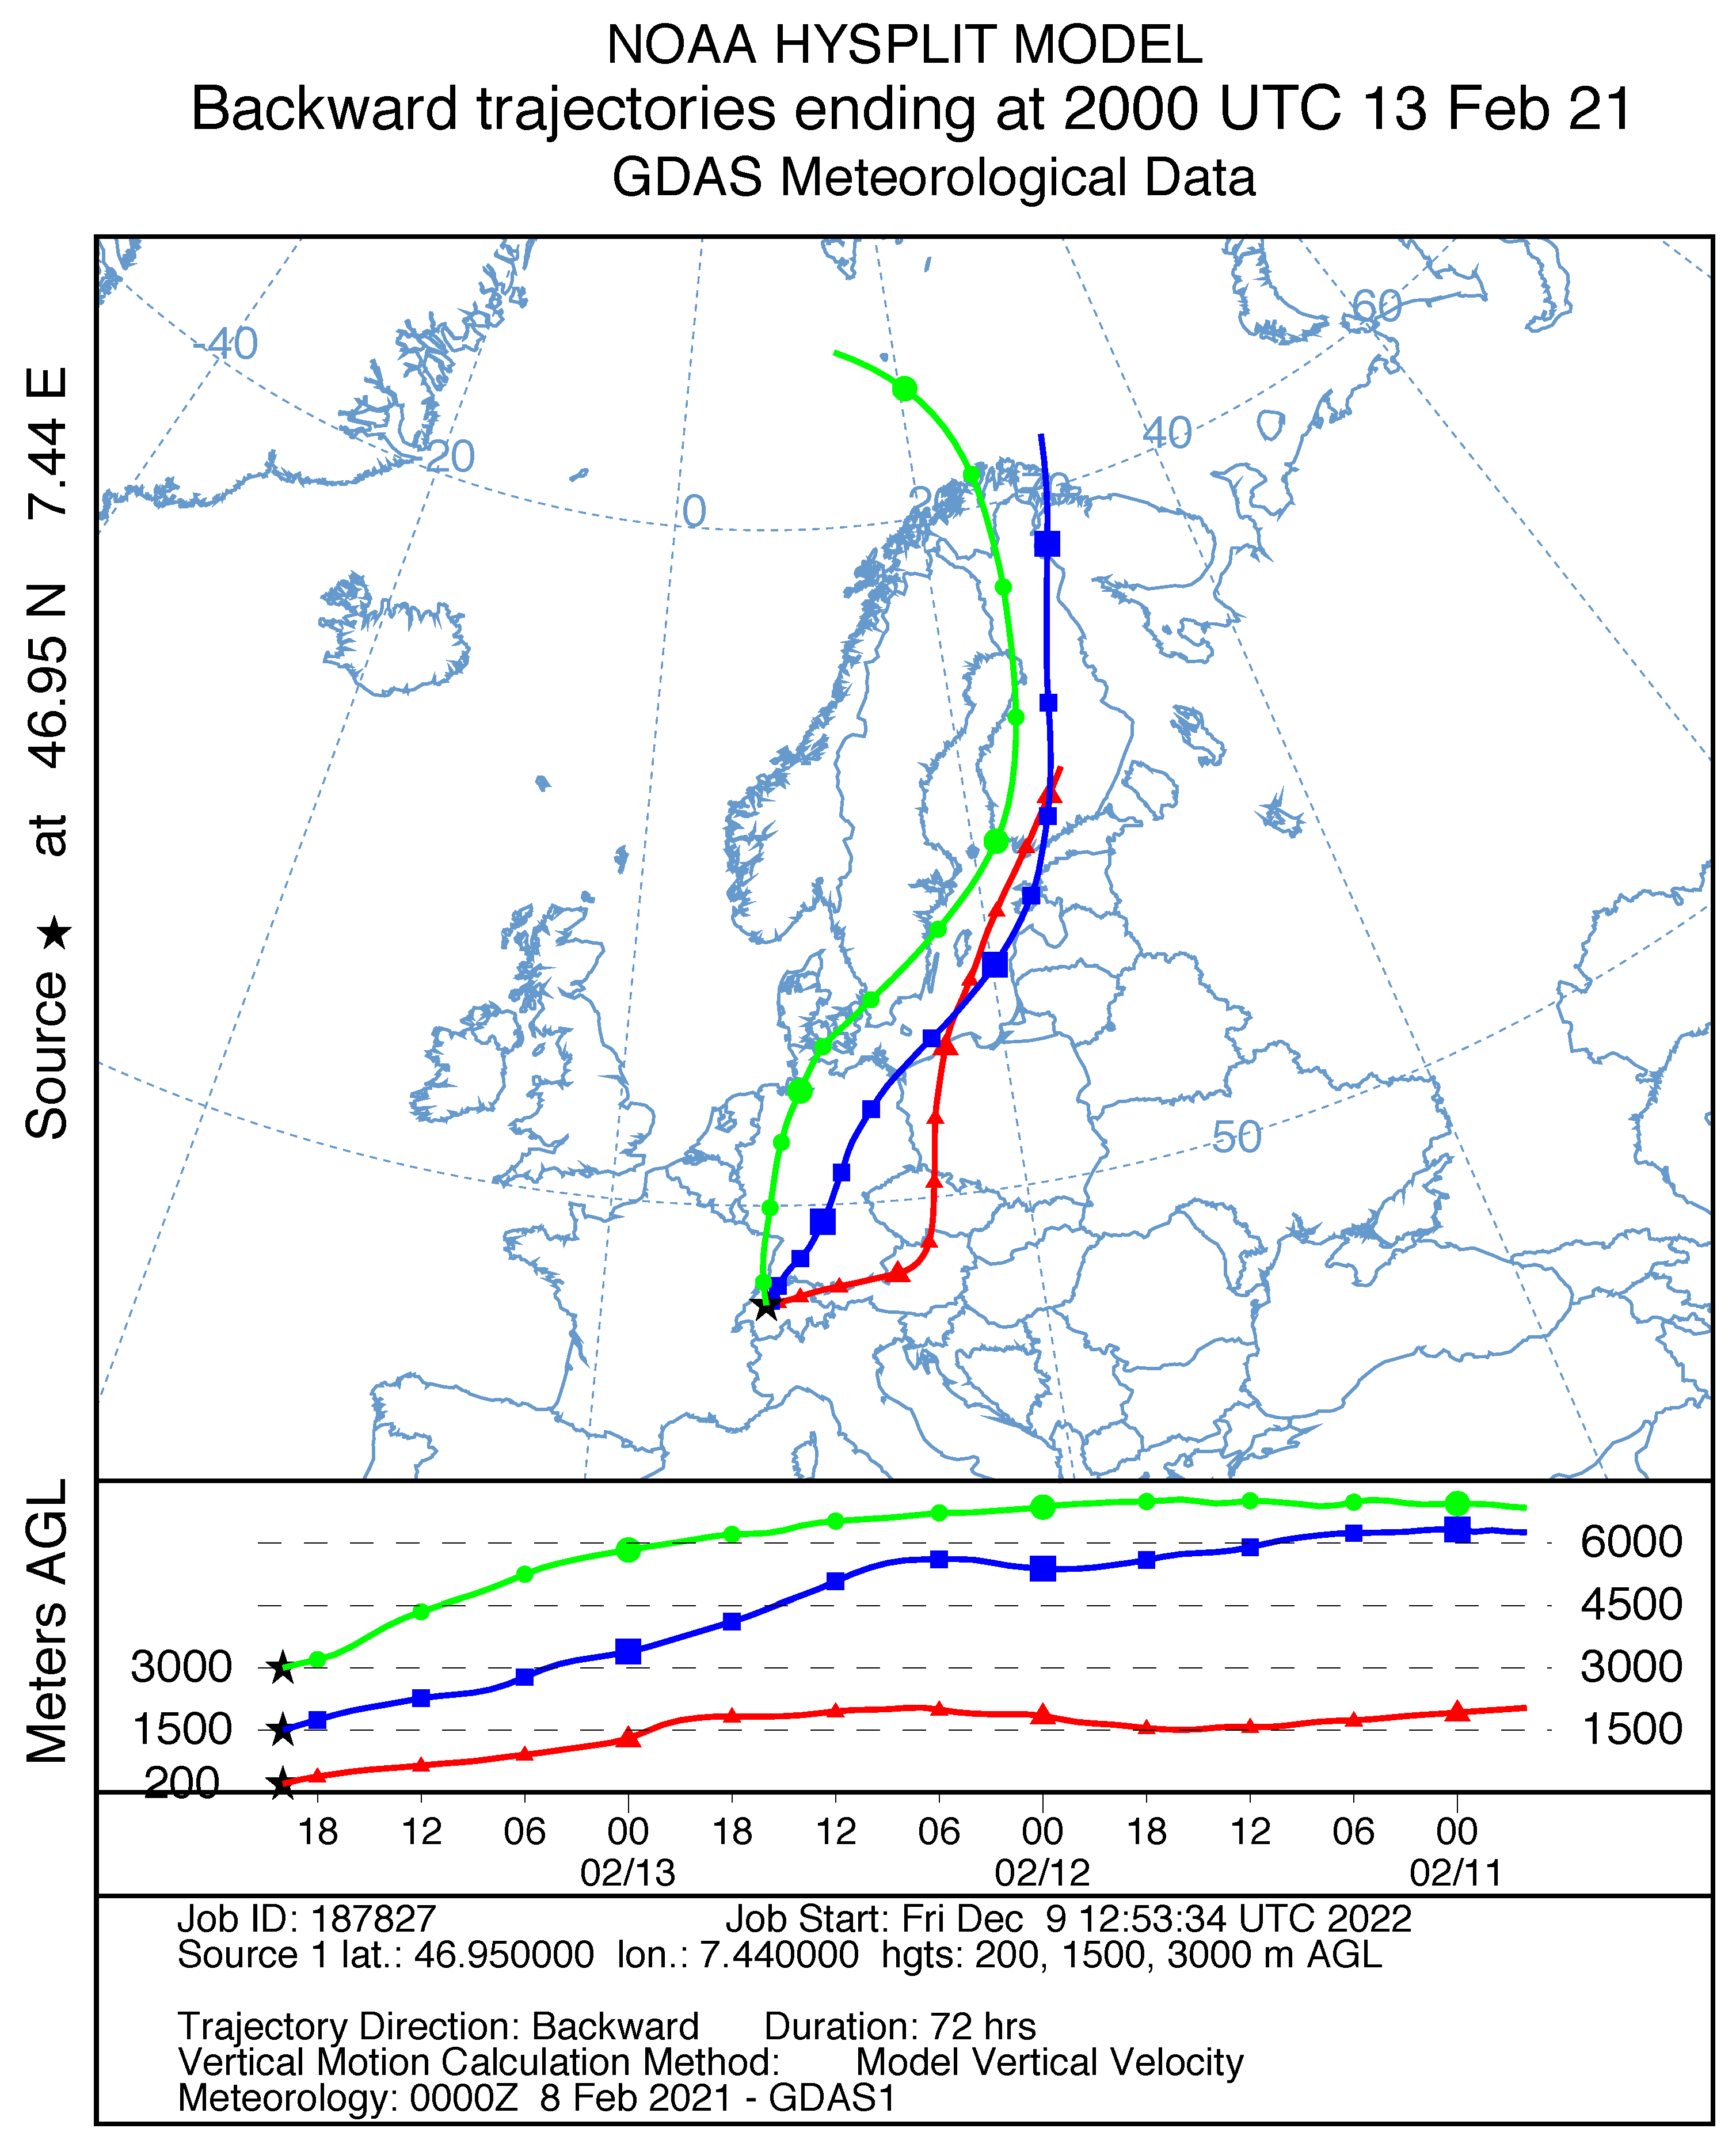
Finally, we computed the back trajectories of the air masses which arrived in Bern during the time of IWV depression (13 February 2021, 20:00 UT). The NOAA HYSPLIT model webpage generated Figure 7. The air masses came to Bern on descending pathways from Northern Europe. The HYSPLIT trajectory model is described by [33]. The archived meteorological parameters for the back trajectory analysis are provided by the Global Data Assimilation System (GDAS) of the National Centers for Environmental Prediction (NCEP), The 3 hourly GDAS data have a resolution of 1 degree in latitude and longitude.
4. Discussion
The outgoing point of this study was the long-term time series of IWV, which is measured by TROWARA in Bern. Since 2004, we noticed that IWV has sometimes during winter depression minimal values of 2–3 mm or even less. Analysis of the surface air temperature and IWV of ERA5 from 2009 to 2021 resulted in the extreme values having IWV >40 mm or IWV <2 mm being only a fraction of 0.1% of the data. Generally, the assumption “warm air can hold more water vapour” is only partly fulfilled in Bern. For example, IWV minima occur not only at the lowest temperatures, and IWV maxima are observed below 30 C. Thus, the Clausius–Clapeyron equation cannot fully explain the dependence of the extreme IWV values on temperature.
We focused later on one dry event in February 2021 in the ERA5 dataset, which was confirmed by the TROWARA radiometer in Bern. The strongest and clearest IWV minimum (IWV = 1.5 ± 0.2 mm) was recorded by TROWARA on 13–14 February 2021, while ERA5 had a slightly higher value of 2.2 ± 0.4 mm. According to ERA5, the IWV minimum is associated with a strong decrease of specific humidity between the surface and 450 hPa. In the literature, dry air layers at mid latitudes can be due to intrusions of dry, ozone-rich air from the stratosphere. This explanation is not supported by the ozone profile of ERA5, which remained unchanged during the time of the IWV depression. The meridional wind was increased in the southward direction during the IWV depression, while the vertical wind did not show a remarkable change.
The surface temperature was decreased by 13 degrees Kelvin during the IWV depression compared to the mean value of February 2021. The Swiss weather report described this event as a short-term cold wave of several days with a northeasterly wind (bise). A high pressure system over Scandinavia brought the cold air to Central Europe. The infrared satellite image during the IWV depression showed a cloudless sky over Switzerland and Germany. It is very remarkable that, at the same time, severe cold waves in Greece and North America occurred [16,17]. Thus, the meandering of the jet stream and the breaking of a Rossby wave might have caused the transport of extremely dry air masses to Switzerland. Such an explanation is a bit similar to the explanation of dry air layers in the tropical mid-troposphere [13,14,15]. Here, the air masses are descending from upper altitudes which are drier than the mid-troposphere.
On a global view, ERA5 shows that the IWV depression in Bern is a mesoscale variation of a dry anomaly with a downward velocity. Three day back trajectories give the result that the air masses were descending, and they came from Northern Europe to Bern, where they realized the observation of an extremely dry air column above Bern. Thus, the IWV depression in Bern was not caused by incidence but by a disturbed jet stream which enabled the transport of dry air from upper altitudes into the lower troposphere above Bern. It is surprising that an IWV value of only 1.5 mm is possible at mid latitudes for a short time in late winter.
In summary, the small IWV value on 13–14 February 2021 is produced by a cold wave in the lower troposphere (“cold air can hold less water vapour than warm air”) and the descending dry air masses from the dry mid-troposphere over Scandinavia. Since the mid troposphere (z = 2000–5000 km) contributes about 42% of IWV in February 2021, it is also important that the mid tropospheric humidity strongly decreases during a dry event. Our case study showed a common situation: Swiss cold waves are often associated with cold and dry air from the north or the northeast, which is delivered by high pressure systems over Scandinavia or Russia in winter. In addition, high pressure systems are often associated with a subsidence of dry air from the mid troposphere to the lower troposphere. The intense cold wave of February 2012 with cold and dry, continental air from Siberia is another example where IWV reached a minimum of 1.6 mm in Bern. Our short study showed that further research on the variability of tropospheric humidity at mid latitudes is interesting, especially the understanding of the meteorological situations that lead to extreme values of IWV.
Author Contributions
Conceptualization, all authors; methodology, K.H.; datasets, all authors; validation, K.H.; formal analysis, all authors; investigation, all authors; data curation, W.W.; writing—original draft preparation, K.H.; writing—review and editing, all authors. All authors have read and agreed to the published version of the manuscript.
Funding
This research received no external funding.
Data Availability Statement
The raw data of TROWARA are archived in the dataportal of the Institute of Applied Physics https://dataportal.mw.iap.unibe.ch/storage/lake/ (accessed on 8 March 2023).
Acknowledgments
We are grateful to our colleagues at IAP who take care of the TROWARA instrument and data archive. We thank ECMWF and Copernicus for ERA5 data and NOAA for the HYSPLIT trajectory model and the graphical user interface. We are grateful to EUMETSAT and MeteoSwiss for meteorological images and weather reports. We thank the reviewers for suggestions and improvements.
Conflicts of Interest
The authors declare no conflict of interest.
References
- Kiehl, J.T.; Trenberth, K.E. Earth’s annual global mean energy budget. Bull. Am. Meteorol. Soc. 1997, 78, 197–208. [Google Scholar] [CrossRef]
- Bernet, L.; Brockmann, E.; von Clarmann, T.; Kämpfer, N.; Mahieu, E.; Mätzler, C.; Stober, G.; Hocke, K. Trends of atmospheric water vapour in Switzerland from ground-based radiometry, FTIR and GNSS data. Atmos. Chem. Phys. 2020, 20, 11223–11244. [Google Scholar] [CrossRef]
- Parracho, A.C.; Bock, O.; Bastin, S. Global IWV trends and variability in atmospheric reanalyses and GPS observations. Atmos. Chem. Phys. 2018, 18, 16213–16237. [Google Scholar] [CrossRef] [Green Version]
- Van Malderen, R.; Pottiaux, E.; Stankunavicius, G.; Beirle, S.; Wagner, T.; Brenot, H.; Bruyninx, C.; Jones, J. Global Spatiotemporal Variability of Integrated Water Vapor Derived from GPS, GOME/SCIAMACHY and ERA-Interim: Annual Cycle, Frequency Distribution and Linear Trends. Remote Sens. 2022, 14, 1050. [Google Scholar] [CrossRef]
- Vaquero-Martínez, J.; Antón, M. Review on the Role of GNSS Meteorology in Monitoring Water Vapor for Atmospheric Physics. Remote Sens. 2021, 13, 2287. [Google Scholar] [CrossRef]
- Alshawaf, F.; Balidakis, K.; Dick, G.; Heise, S.; Wickert, J. Estimating trends in atmospheric water vapor and temperature time series over Germany. Atmos. Meas. Tech. 2017, 10, 3117–3132. [Google Scholar] [CrossRef] [Green Version]
- Held, I.M.; Soden, B.J. Water vapor feedback and global warming. Annu. Rev. Energy Environ. 2000, 25, 441–475. [Google Scholar] [CrossRef] [Green Version]
- Gimeno, L.; Eiras-Barca, J.; Durán-Quesada, A.M.; Dominguez, F.; van der Ent, R.; Sodemann, H.; Sánchez-Murillo, R.; Nieto, R.; Kirchner, J.W. The residence time of water vapour in the atmosphere. Nat. Rev. Earth Environ. 2021, 2, 558–569. [Google Scholar] [CrossRef]
- Mahrt, L. Boundary-layer moisture regimes. Q. J. R. Meteorol. Soc. 1991, 117, 151–176. Available online: https://rmets.onlinelibrary.wiley.com/doi/pdf/10.1002/qj.49711749708 (accessed on 8 March 2023). [CrossRef]
- Couvreux, F.; Guichard, F.; Austin, P.H.; Chen, F. Nature of the Mesoscale Boundary Layer Height and Water Vapor Variability Observed 14 June 2002 during the IHOP-2002 Campaign. Mon. Weather Rev. 2009, 137, 414–432. [Google Scholar] [CrossRef] [Green Version]
- Trickl, T.; Vogelmann, H.; Giehl, H.; Scheel, H.E.; Sprenger, M.; Stohl, A. How stratospheric are deep stratospheric intrusions? Atmos. Chem. Phys. 2014, 14, 9941–9961. [Google Scholar] [CrossRef] [Green Version]
- Randel, W.J.; Rivoire, L.; Pan, L.L.; Honomichl, S.B. Dry layers in the tropical troposphere observed during CONTRAST and global behavior from GFS analyses. J. Geophys. Res. Atmos. 2016, 121, 14142–14158. [Google Scholar] [CrossRef] [Green Version]
- Cau, P.; Methven, J.; Hoskins, B. Origins of Dry Air in the Tropics and Subtropics. J. Clim. 2007, 20, 2745–2759. [Google Scholar] [CrossRef]
- Casey, S.P.F.; Dessler, A.E.; Schumacher, C. Five-Year Climatology of Midtroposphere Dry Air Layers in Warm Tropical Ocean Regions as Viewed by AIRS/Aqua. J. Appl. Meteorol. Climatol. 2009, 48, 1831–1842. [Google Scholar] [CrossRef]
- Yoneyama, K.; Parsons, D.B. A Proposed Mechanism for the Intrusion of Dry Air into the Tropical Western Pacific Region. J. Atmos. Sci. 1999, 56, 1524–1546. [Google Scholar] [CrossRef]
- Wikipedia. February 2021 Greek Cold Wave. Webpage. Available online: https://en.wikipedia.org/wiki/February_2021_Greek_cold_wave (accessed on 8 March 2023).
- Wikipedia. February 2021 North American Cold Wave. Webpage. Available online: https://en.wikipedia.org/wiki/February_2021_North_American_cold_wave (accessed on 8 March 2023).
- Hersbach, H.; Bell, B.; Berrisford, P.; Biavati, G.; Horanyi, A.; Sabater, J.M.; Nicolas, J.; Peubey, C.; Radu, R.; Rozum, I.; et al. ERA5 Hourly Data on Single Levels from 1979 to Present. 2021. Available online: https://cds.climate.copernicus.eu/cdsapp#!/dataset/reanalysis-era5-single-levels?tab=overview (accessed on 8 March 2023). [CrossRef]
- Hersbach, H.; Bell, B.; Berrisford, P.; Hirahara, S.; Horányi, A.; Muñoz-Sabater, J.; Nicolas, J.; Peubey, C.; Radu, R.; Schepers, D.; et al. ERA5 Hourly Data on Pressure Levels from 1979 to Present. 2021. Available online: https://cds.climate.copernicus.eu/cdsapp#!/dataset/10.24381/cds.bd0915c6?tab=overview (accessed on 8 March 2023). [CrossRef]
- Hersbach, H.; Bell, B.; Berrisford, P.; Hirahara, S.; Horanyi, A.; Munoz-Sabater, J.; Nicolas, J.; Peubey, C.; Radu, R.; Schepers, D.; et al. The ERA5 global reanalysis. Q. J. R. Meteorol. Soc. 2020, 146, 1999–2049. [Google Scholar] [CrossRef]
- Peter, R.; Kämpfer, N. Radiometric determination of water vapor and liquid water and its validation with other techniques. J. Geophys. Res. Atmos. 1992, 97, 18173–18183. [Google Scholar] [CrossRef]
- Morland, J. TROWARA-Tropospheric Water Vapour Radiometer. Radiometer Review and New Calibration Model; IAP Research Report 2002-15; Institut für angewandte Physik, Universität Bern: Bern, Switzerland, 2002. [Google Scholar]
- Mätzler, C.; Morland, J. Advances in Surface-Based Radiometry of Atmospheric Water; IAP Research Report 2008-02-MW; Institut für Angewandte Physik, Universität Bern: Bern, Switzerland, 2008. [Google Scholar]
- Mätzler, C.; Morland, J. Refined physical retrieval of integrated water vapor and cloud liquid for microwave radiometer data. IEEE Trans. Geosci. Remote Sens. 2009, 47, 1585–1594. [Google Scholar] [CrossRef]
- Hocke, K.; Navas Guzmán, F.; Cossu, F.; Mätzler, C. Cloud fraction of liquid water clouds above Switzerland over the last 12 years. Climate 2016, 4, 48. [Google Scholar] [CrossRef] [Green Version]
- Wang, W.; Hocke, K.; Mätzler, C. Physical retrieval of rain rate from ground-based microwave radiometry. Remote Sens. 2021, 13, 2217. [Google Scholar] [CrossRef]
- Cossu, F. Study of Atmospheric Water over Bern by Means of Ground-Based Observations and Numerical Simulations. Ph.D. Thesis, Philosophisch-Naturwissenschaftliche Fakultät, Universität Bern, Bern, Switzerland, 2015. [Google Scholar]
- Ingold, T.; Peter, R.; Kämpfer, N. Weighted mean tropospheric temperature and transmittance determination at millimeter-wave frequencies for ground-based applications. Radio Sci. 1998, 33, 905–918. [Google Scholar] [CrossRef]
- Battaglia, A.; Saavedra, P.; Rose, T.; Simmer, C. Characterization of precipitating clouds by ground-based measurements with the triple-frequency polarized microwave radiometer ADMIRARI. J. Appl. Meteorol. Climatol. 2010, 49, 394–414. [Google Scholar] [CrossRef] [Green Version]
- Hocke, K.; Bernet, L.; Wang, W.; Mätzler, C.; Hervo, M.; Haefele, A. Integrated Water Vapor during Rain and Rain-Free Conditions above the Swiss Plateau. Climate 2021, 9, 105. [Google Scholar] [CrossRef]
- SRF Meteo. Weather Report Meteo SRF. Webpage. 2021. Available online: https://www.srf.ch/meteo/meteo-stories/monatsrueckblick-februar-2021-von-der-eiszeit-direkt-in-den-fruehling (accessed on 8 March 2023).
- MeteoSwiss. Klimabulletin Februar 2021. Webpage. Available online: https://www.meteoschweiz.admin.ch/service-und-publikationen/publikationen/berichte-und-bulletins/2021/klimabulletin-februar-2021.html (accessed on 8 March 2023).
- Stein, A.F.; Draxler, R.R.; Rolph, G.D.; Stunder, B.J.B.; Cohen, M.D.; Ngan, F. NOAA HYSPLIT Atmospheric Transport and Dispersion Modeling System. Bull. Am. Meteorol. Soc. 2015, 96, 2059–2077. [Google Scholar] [CrossRef]
- NOAA Air Resources Laboratory. Online READY Web Version of HYSPLIT. Webpage. Available online: https://www.ready.noaa.gov/HYSPLIT_traj.php (accessed on 8 March 2023).
Figure 1.
2D Histogram of IWV and T (temperature at 2 m) for ERA5 data in Bern between January 2009 and December 2021. Extreme values for IWV > 40 mm or IWV < 2 mm are denoted by blue and red stars, respectively. The selected dry event of 13 February 2021 is shown by green stars.
Figure 1.
2D Histogram of IWV and T (temperature at 2 m) for ERA5 data in Bern between January 2009 and December 2021. Extreme values for IWV > 40 mm or IWV < 2 mm are denoted by blue and red stars, respectively. The selected dry event of 13 February 2021 is shown by green stars.

Figure 2.
IWV above Bern during February 2021 as observed by TROWARA (blue) and estimated by ERA5 (red). The horizontal black line is for IWV = 2 mm.
Figure 2.
IWV above Bern during February 2021 as observed by TROWARA (blue) and estimated by ERA5 (red). The horizontal black line is for IWV = 2 mm.

Figure 3.
Partial IWV, which is partially integrated over altitude intervals of 100 m. The red profiles are for the short time period when the IWV depression occurred (for 13 February 2021, 8:30 UT–14 February 2021, 10:30 UT). The blue profile is for the average of the complete February 2021.
Figure 3.
Partial IWV, which is partially integrated over altitude intervals of 100 m. The red profiles are for the short time period when the IWV depression occurred (for 13 February 2021, 8:30 UT–14 February 2021, 10:30 UT). The blue profile is for the average of the complete February 2021.

Figure 4.
ERA5 profiles for specific humidity q, relative humidity RH, ozone mass mixing ratio O, temperature T, meridional wind v (positive values = northward) and vertical wind w (positive values = downward). The red profiles are for the short time period when the IWV depression occurred (for 13 February 2021, 8:30 UT–14 February 2021, 10:30 UT). The blue profiles are for the averages of the complete February 2021.

Figure 5.
Infrared (10.8 m) satellite image from SAT24-EISQ51 over Europe on 13 February 20 UTC showing a clear sky over Switzerland and Germany.
Figure 5.
Infrared (10.8 m) satellite image from SAT24-EISQ51 over Europe on 13 February 20 UTC showing a clear sky over Switzerland and Germany.

Figure 6.
ERA5 global distribution of relative humidity, specific humidity, and vertical wind at 650 hPa on 13 February 2021 20:00 UT. The black X indicates the location of Bern.
Figure 6.
ERA5 global distribution of relative humidity, specific humidity, and vertical wind at 650 hPa on 13 February 2021 20:00 UT. The black X indicates the location of Bern.

Figure 7.
Three day back trajectories of air masses which arrived on 13 February 2021 20:00 UT in Bern. The computation and the plot are provided by the NOAA HYSPLIT webpage [34].
Figure 7.
Three day back trajectories of air masses which arrived on 13 February 2021 20:00 UT in Bern. The computation and the plot are provided by the NOAA HYSPLIT webpage [34].

Disclaimer/Publisher’s Note: The statements, opinions and data contained in all publications are solely those of the individual author(s) and contributor(s) and not of MDPI and/or the editor(s). MDPI and/or the editor(s) disclaim responsibility for any injury to people or property resulting from any ideas, methods, instructions or products referred to in the content. |
© 2023 by the authors. Licensee MDPI, Basel, Switzerland. This article is an open access article distributed under the terms and conditions of the Creative Commons Attribution (CC BY) license (https://creativecommons.org/licenses/by/4.0/).
Share and Cite
MDPI and ACS Style
Hocke, K.; Wang, W. Observation of an Extremely Dry Atmospheric Air Column above Bern. Climate 2023, 11, 63. https://doi.org/10.3390/cli11030063
AMA Style
Hocke K, Wang W. Observation of an Extremely Dry Atmospheric Air Column above Bern. Climate. 2023; 11(3):63. https://doi.org/10.3390/cli11030063
Chicago/Turabian StyleHocke, Klemens, and Wenyue Wang. 2023. "Observation of an Extremely Dry Atmospheric Air Column above Bern" Climate 11, no. 3: 63. https://doi.org/10.3390/cli11030063
Note that from the first issue of 2016, this journal uses article numbers instead of page numbers. See further details here.