
Reviewing the Status of Droughts, Early Warning Systems and Climate Services in South India: Experiences Learned


1
Women Scientist, Agro Climatic Research Centre, Tamil Nadu Agriculture University, Coimbatore 641003, Tamil Nadu, India
2
Vice Chancellor, Tamil Nadu Agriculture University, Coimbatore 641003, Tamil Nadu, India
*
Author to whom correspondence should be addressed.
Climate 2023, 11(3), 60; https://doi.org/10.3390/cli11030060
Submission received: 31 January 2023
/
Revised: 24 February 2023
/
Accepted: 28 February 2023
/
Published: 6 March 2023
(This article belongs to the Special Issue Drought Early Warning)
Abstract
:Drought is one of the most challenging disasters that impact the natural and cultural ecosystems across the world, especially in the climate dependent sectors of arid and semi-arid areas. The aim of this article is to share the experiences gained and enhance the readers’ awareness on the status of drought and process of the early warning systems (EWS) in south India. Drought status of three agroecologically different states is included in this article, such as Kerala, Tamil Nadu and Telangana. As far as Tamil Nadu is concerned, Karur, Thuthukudi, Krishnagiri, Namakkal, Trichy and Thirunelveli districts are water scarce compared to other districts in the state. The districts such as Wayanad, Thiruvananthapuram, Idukki and Palakkad in Kerala have received lesser rainfall compared to the other parts of the state during the period 1981 to 2019. In Telangana, the mandals such as Nagarkurnool, Jogulamba-Gadwal, Wanaparthy, Mahabubnagar Nalgonda and Yedadri are frequently hit by dry spells and droughts. As a case study, weather early warning dissemination, carried out at Parambikulam Aliyar basin, Coimbatore, Tamil Nadu, during Khariff and Rabi seasons, using IMDs medium and extended range forecast is also elaborated in particular in the article. As far as the accuracy of forecast is concerned, probability of false detection (false alarm rate) was found to be 0.81 for Khariff and 0.30 for Rabi season, indicating the need for better performance in the accuracy of dry spell early warning, disaster preparedness and response. In-spite of this, access to early warning has supported the farmers during harvest and land preparation with a utility score of 72% and 59%, respectively. In Parambikulam Aliyar basin, remote sensing products such as MODIS-NDVI, NDWI and TWI was also used to identify the real-time progression of monthly vegetative condition for Kharif and Rabi seasons. NDVI values were used to monitor the district level vegetation condition and compared it with the drought year 2016, the difference in area under barren land was 76% less during Khariff, 2021 and 44% during Rabi, 2021.This study is a compilation of lessons learned from different states and the existing knowledge and practice in early warnings, and recommends the need for a holistic approach in drought and dry spell monitoring along with better accuracy and dissemination to minimize climate-related shocks in agriculture.
Keywords:
droughts; early warning systems (EWS); climate services; monsoon rainfall; South India; AWS; NDVI1. Introduction
It is a reality that the world is facing several record-breaking disasters each year. The UN has warned the world that we are running short of time to prevent the worst of climate crisis. The sixth assessment report of IPCC has cautioned the world on the increased frequency of extreme weather events [1]. Future impacts of climate change, extending from the near term to the long term, are mostly expecting 2 °C warming scenarios across the globe. This may create cascading impacts such as droughts, floods, etc., and may eventually slow down economic growth and further erode food security and trigger new poverty traps. CMIP6-global climate models project a warmer (3–5 °C) climate for South Asia in the twenty-first century [2].
Climate change may likely exacerbate India’s already existing high physical exposure to water insecurities, as 65 percent of India is drought-prone. As a result, livelihoods may suffer due to disruptions in social, cultural, economic, ecological, and physical infrastructures, posing serious risks to the country’s growth. The Bengal famine that happened in India during 1943–44 has affected almost 3 to 4 million people in the country. The significant drought years in the nation from 1970 to 2020, according to the Drought Research Unit of the Indian Meteorological Department (DRU, IMD), were 1972, 1974, 1979, 1982, 1985, 1986, 1987, 2002, 2003, 2009, 2014, 2015 and 2016. Being an agrarian country with a majority of its working population still relying on agriculture, drought is one of the main risks. Drought as a creeping phenomenon was referred by Tannehill as it differs from other natural hazards in numerous ways and its effects often accrue slowly over a considerable period of time, and may linger for years after the termination of the event; the onset and end of drought is difficult to determine [3,4]. It is not only in India, as the severity and frequency of droughts appear to have increased in parts of southern Europe, America and Africa.
Farm income is anticipated to decline by 15 to 25% due to global warming and the losses and damages will only increase as global temperatures rise [5]. The challenges to achieving food security and the SDGs are aggravated by the vulnerability to climate change, mainly because it affects the most vulnerable and have a highly heterogeneous pattern [6,7]. According to the plausible socio-economic and climate change futures, the total global food demand is expected to increase from 35% to 56% between 2010 and 2050 [8]. Nearly all shared socio-economic pathways (SSPs) project an increase in per capita and global food consumption in comparison with the 2010 levels. Apart from the threats from heat stress, harsh climate variability, land degradation, and lack of resources, in recent times, it has become hard to sustain cultivation due to other factors, such as pandemic and other disease outbreaks, sudden market fluctuations, etc. [9,10]. Drought and dry spells are a crucial threat to living beings in general, and stakeholders like farmers in particular. Satellite derived images are used as a valuable data source to understand vegetation conditions, land degradation and aridity. Temperature-condition index (TCI), vegetation-condition index (VCI) and normalized differential water index (NDWI) are some of the essential indices used to understand the changing climatic signals and soil-moisture content in a region. These indices are used to monitor drought-affected regions with the long-term normalized-difference vegetation index (NDVI) values [11].
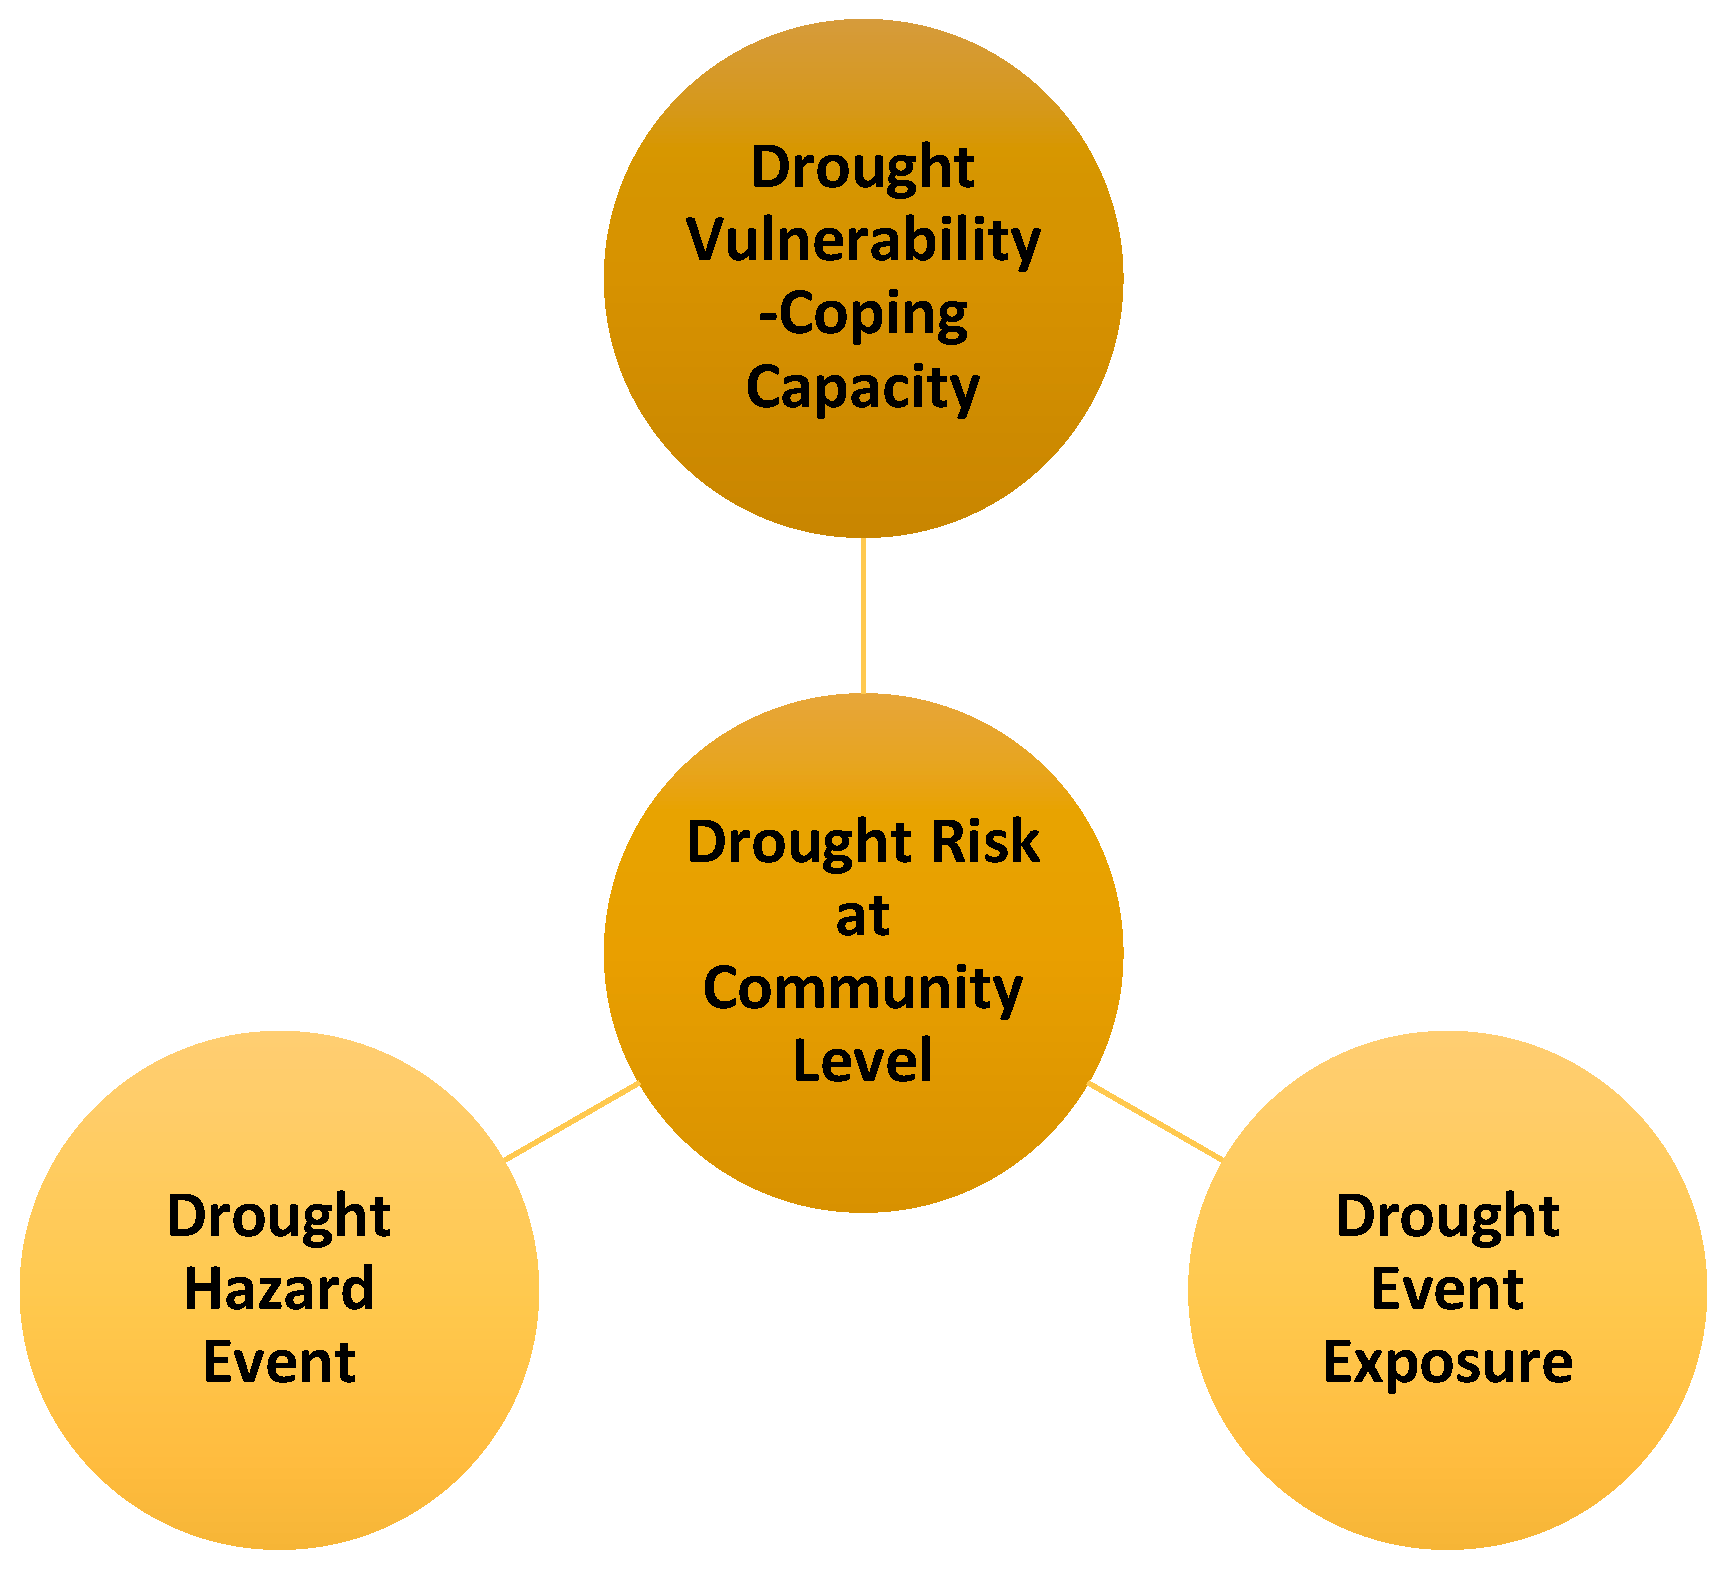
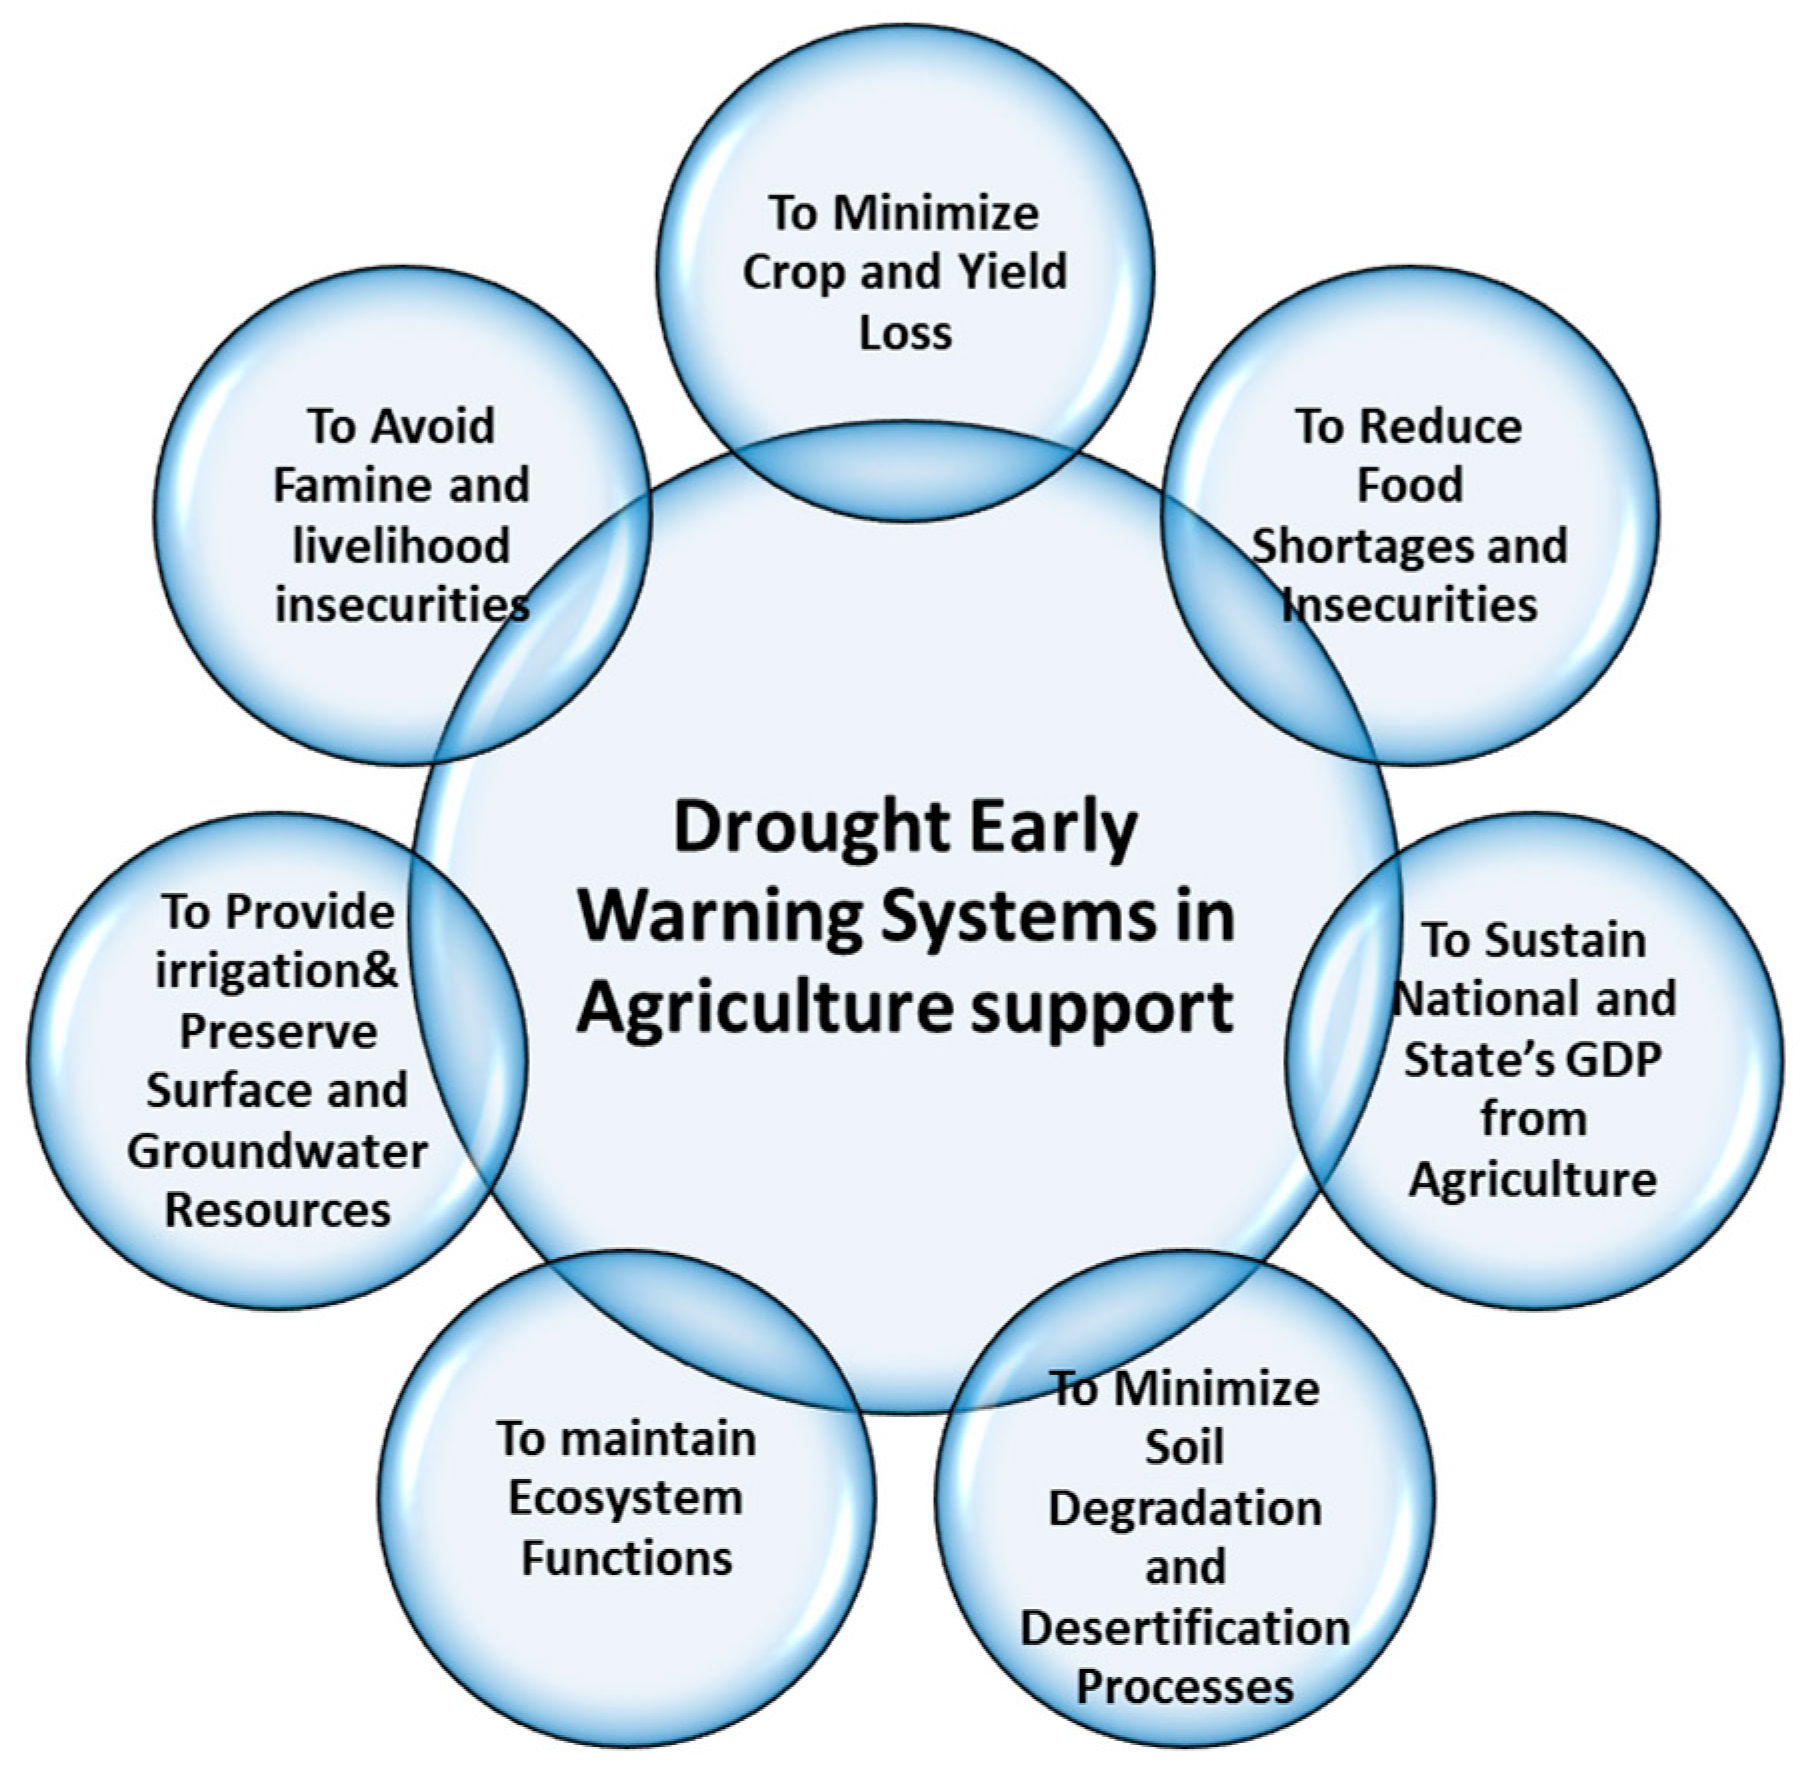
Drought scenarios come with different connotations, such as meteorological drought, hydrological droughts, agricultural drought, ecological drought and socio-economic drought [12]. The impact from droughts can be felt as dry spells for weeks, months, seasons or even years. There are regions that are chronically hit by droughts. The risks from disasters to natural and cultural ecosystems increase when the severity of drought enhances. Risk is thus a byproduct of the hazard event, exposure levels of a region and its resilience capacity to cope up from the shock (Figure 1). The hazard hit ratio vary from place to place. There are certain pockets more vulnerable to drought than others based on the exposure frequency and intensity of the event and its sensitivity. Higher population and household density leads to higher potential resource utilization, which reduces the possibility of recovery under the existing environmental conditions. Vulnerability may be reduced significantly with better coping mechanisms. Hence, the enhancement of a combination of institutional and community-based adaptation, such as early warning systems, can benefit substantially in climate change adaptation (CCA) and disaster risk reduction (DRR) (Figure 2).
A mid-term review is proposed by the UN Office for Disaster Risk Reduction (UNDRR) on the implementation of the Sendai Framework in order to assess progress in integrating DRR into policies, programs and investments at all levels, and identify good practices and gaps [13]. Early warning is one of the crucial areas that was developed to enhance local capacities to tackle disasters. For implementing DRR, collective intelligence needs to be established, where new ways of knowing risks and new forms of collaboration support risk governance and management mechanisms. Early warning is a vital tool to provide timely information on onset, progressions of droughts and its impact to the stakeholders. A regional drought early warning systems (DEWS) comprises the dissemination of a forecast to stakeholders. It is an integrated information system that comprises multiple information sets, such as weather forecasting, monitoring, research and development, capacity-building, and public outreach related to DRR and CCA. It helps in capitalizing the favorable situations and avoiding risky operations during drought. DEWS need to be tailored with locally relevant drought information and support the introduction of new technologies that detect and communicate drought risks and warnings. The officials working on the DEWS must recognize the inherent strengths and weaknesses of the natural and livelihood systems of a region. The Indian Meteorological Department (IMD) uses standardized precipitation index and aridity anomaly index (AAI) to assess monthly, seasonal and weekly meteorological drought status and identify the regions with prevailing or beginning/ending of the extremely/severely/moderately dry/wet conditions [14]. Climate change is expected to cause more economic damages in the form of droughts, affecting water resources and triggering water scarcity [15]. It can be manifested during early season, mid-season or terminal period as a major abiotic stress factor limiting growth and yield in plants.
2. Materials and Methods
In this article, an attempt has been made to document the current status of drought scenarios in three South Indian states, such as Telangana, Tamil Nadu and Kerala, and share the experiences learnt in general and elaborate on the early warning dissemination that has taken place at Parambikulam Aliyar Basin, Coimbatore district in particular.
2.1. Data and Methodology
2.1.1. Rainfall Anomaly Analysis
District-wise mean anomaly in the rainfall distribution from the long-term mean of each state was computed for drought frequency analysis during the historical climate period 1971 to 2017. IMDs-gridded data sets for rainfall (0.25-degree resolution) were obtained and extracted for the states and compiled for the 1971–2017 period. Anomaly was calculated using the following formula.
Rainfall Anomaly (%) = [(Actual Rainfall − Normal Rainfall)/(Normal Rainfall × 100)]
The area can be declared as drought hit when its actual rainfall falls short by 20% or more than the normal mean of around 30 years. The major seasons from which the study area gets its rainfall is south west monsoon season (SWM) and north east (NEM)or retreating monsoon season. However, the changes in the rainfall distribution, frequency and timings are evident in many places. The percentage of normal precipitation is one of the simplest measurements of rainfall departure/deficiency analysis for a region.
2.1.2. Field Visits and Surveys
Field visits were conducted to understand the crop production status. Primary data were gathered through in-depth individual and group interviews. Awareness meetings were conducted for the stakeholders. Early warning dissemination was commenced with the land preparation/sowing time till harvest, covering all sensitive crop growth stages.
2.1.3. Forecast Verification Using IMD Criteria
As a case study, weather early warning dissemination, carried out at Parambikulam Aliyar basin, Coimbatore, Tamil Nadu during Khariff and Rabi seasons using IMDs medium and extended range forecast, is also elaborated in particular in the article. The weather forecast for a specific location may be further enhanced by forecast verification. The IMD’s recommended methodology is used for the verification [16]. Kothayal et al. [17] has provided detailed methodology for weather forecast verification.
Probability of False Detection
Weather forecast was verified using skill scores such as:
False Alarm Ratio
FAR = F/(H + F)
Here, H = (YY)-observed and predicted; F = (NY)—number of false alarms, not observed but predicted); M = (YN)—no of misses, observed, but was not forecasted; and Z = (NN)—neither observed nor predicted. Range of FAR is one to zero, a perfect score = 0, i.e., FAR has a negative orientation. FAR is also very sensitive to the climatological frequency of the event.
2.1.4. MODIS Satellite Data
To monitor the progress of vegetation and for its relative estimation 16 days composite image of surface reflectance product of MODIS, NDVI were downloaded from the website http://edcimswww.cr.usgs.gov./pub/imswelcome/ accessed from the date 1 June 2021 to 29 February 2022, were compared with drought year 2016. Similarly, NDWI5 were also downloaded for the region. As the monsoon of 2021 was above normal and 2016 was a drought year, the vegetation vigor and moisture must be higher in the case of 2021 and it should have higher NDVI, NDWI than 2016. Normalized differential water index was proposed by Gao [18]. Topographic wetness index (TWI) was also used as a proxy to know the soil moisture conditions. Topographic wetness index (TWI) indicates the effect of topography on runoff generation and the amount of flow accumulation at any locations in a river catchment [19]. Calculation of the TWI has been carried out directly through processing of ASTERDEM (30-meter resolution) in ArcGIS. The formula to calculate the TWI can be expressed as follows:
TWI = Ln((Fa_Scaled)/TanSlope)
3. Results and Discussions
Understanding and deriving meaningful insights from data is significant to evaluate spatio-temporal variabilities in disasters. This article is about the lessons learned through field visits during project implementation, data analysis and interpretations on rainfall distribution and literature reviews on current droughts status and strategies to monitor and mitigate it. Analyses using the percentage of deviation of rainfall are very effective when used for a single region or a single season. Positive values indicate greater than median precipitation of the state, and negative values indicate less than median precipitation. The drought status of different states such as Tamil Nadu, Telangana and Kerala are discussed in general and the early warning dissemination that was carried out for Parambikulam Aliyar, in Coimbatore Tamil Nadu is dealt with in this paper as a case study in particular.
3.1. Drought Proofing of three South Indian States in General
3.1.1. Drought Status of Tamil Nadu
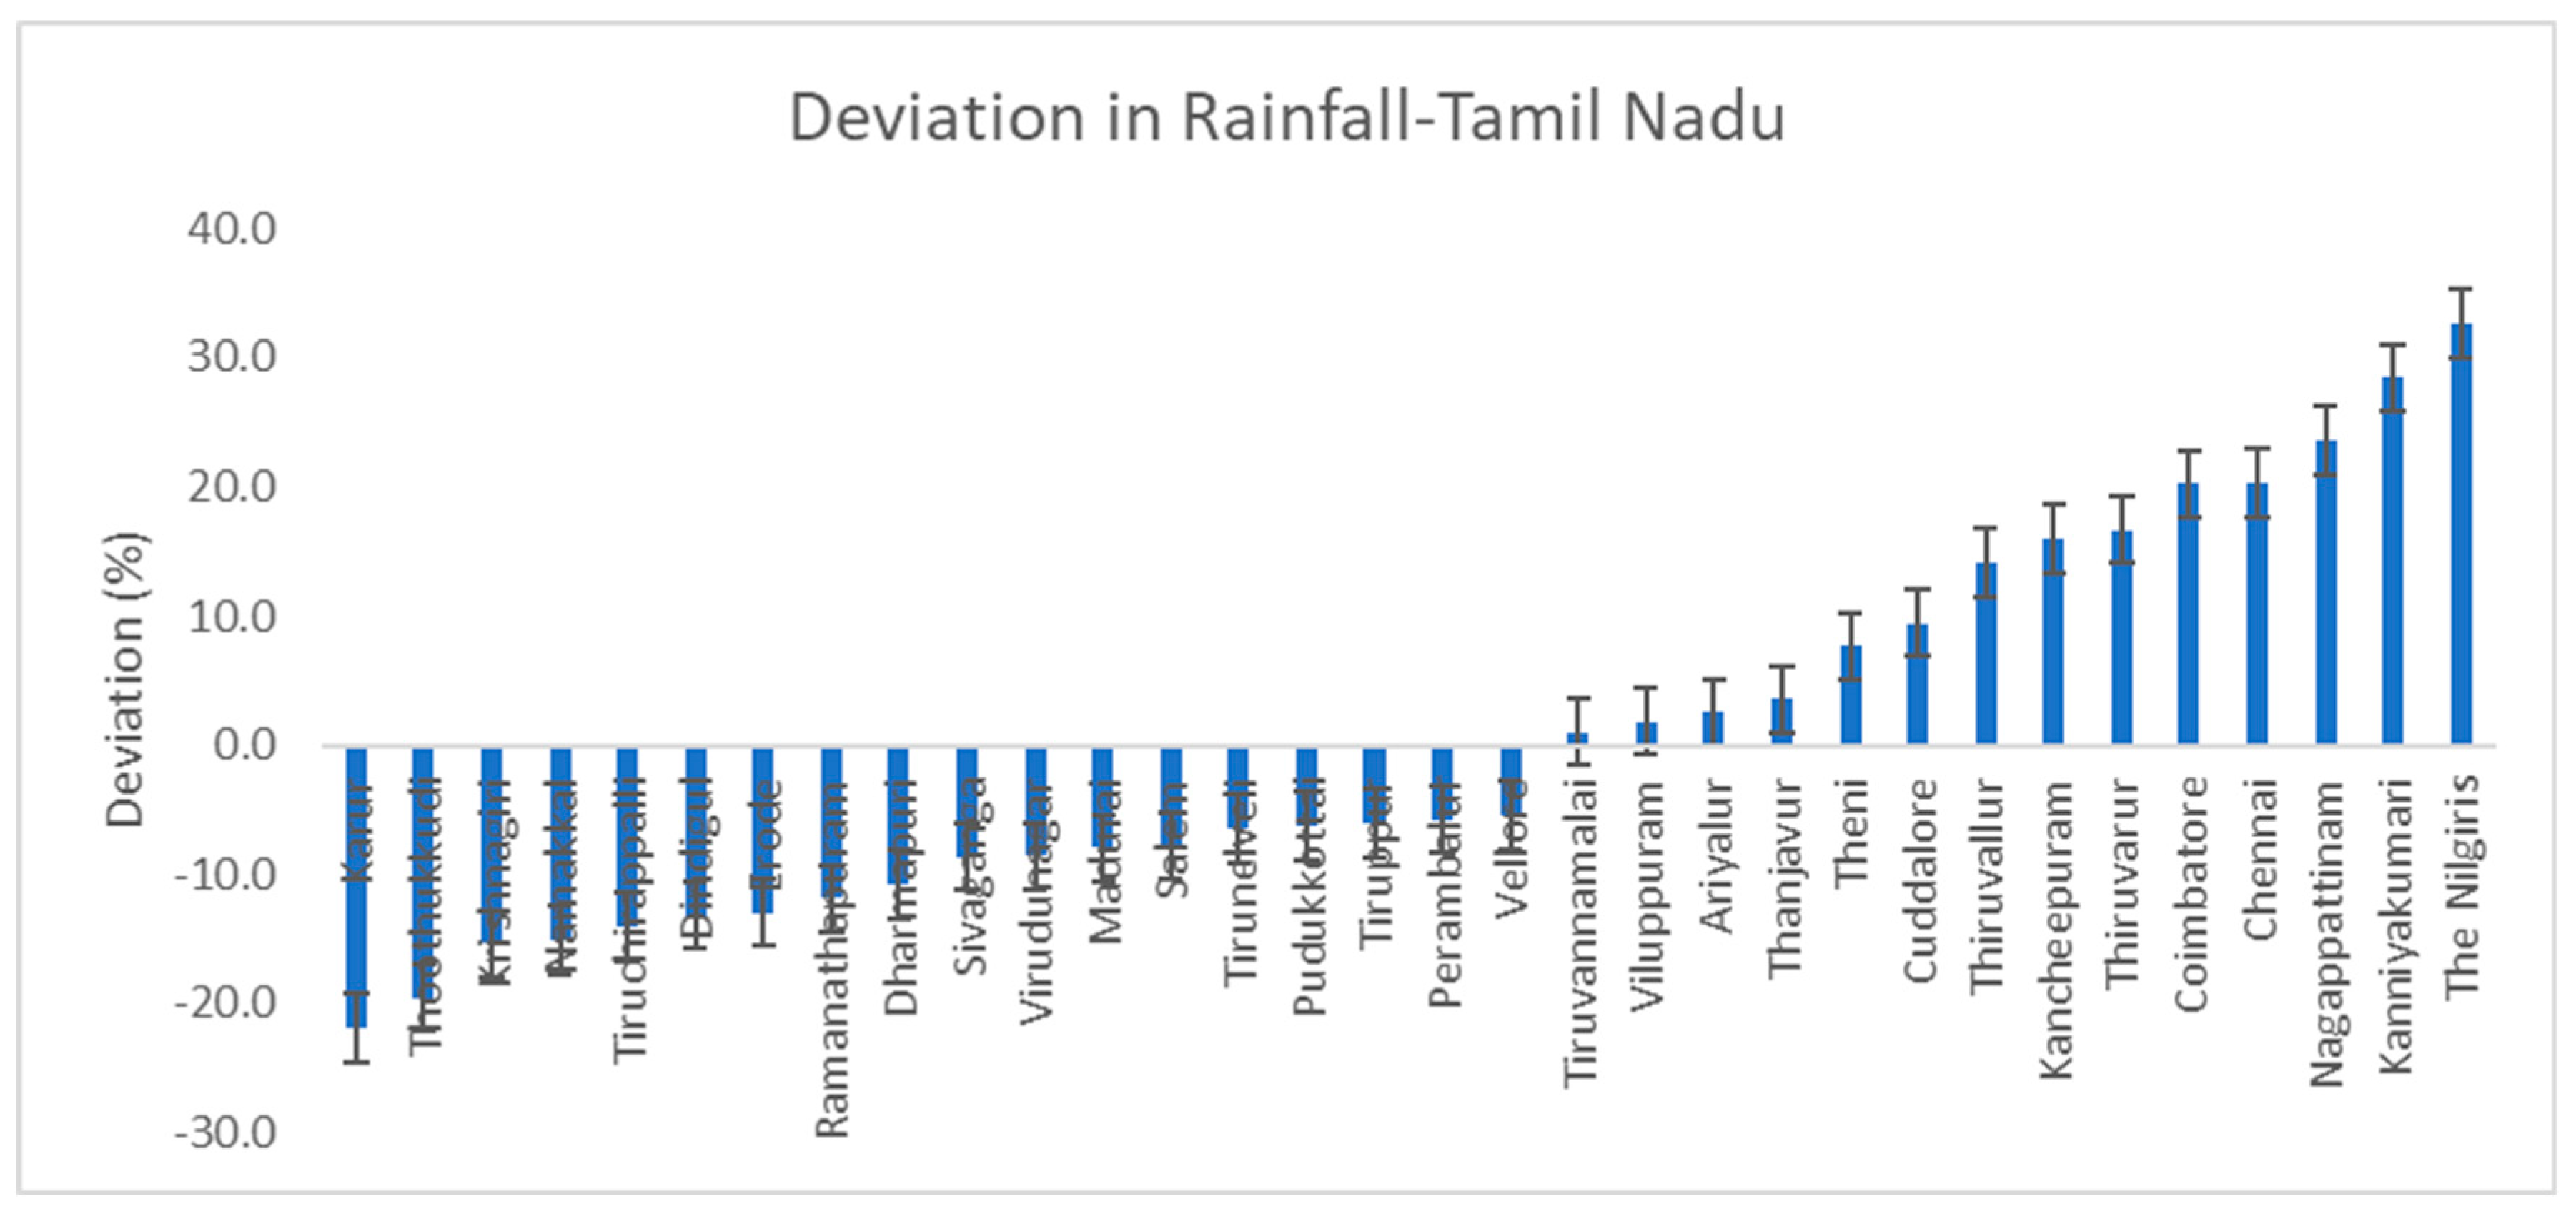
Tamil Nadu is generally characterized by a tropical climate. Due to the semi-arid state’s reliance on monsoon rainfall to replenish its water supplies, monsoon failures cause severe droughts and acute water shortages every 2.5 years [20]. The normal annual rainfall of the state is about 908 mm, of which 48 percent is through the retreating monsoon/north east monsoon and 32 percent is received through the south west monsoon. Drought has posed significant negative damage to standing crops and surface and ground water resources in the state. During the extreme drought in 2002–2003, the net sown area, as well as the total production, dipped significantly; hence, contingency crop planning was introduced in all drought-hit areas. The intensity and extent of drought in the state are felt through very less ground water availability and reservoir levels in the subsequent years. Karur, Thuthukudi, Krishnagiri, Namakkal and Trichy districts are water scarce based on the annual rainfall availability compared to other districts in the state (Figure 3). More number of drought years, with a frequency of 6 to 9 years, were observed in Tirunelveli, Tiruppur, Karur and Tiruchirapalli districts during the period, 1970–2017. The major drought years during this period were 1977–1978, 1983–1984, 2002–2003, 2006–2007, 2009, 2012 and 2016. During the monsoon season, the impacts were severe to the standing crops and livestock, and water crisis erupted in these districts. Even during north east monsoon, 2018, about 17 districts have recorded deficit rainfall ranging from −59 to −19 percent. The district agriculture contingency plan (DACP) was implemented in drought-hit areas by the government, Department of Agriculture (DoA), Department of Irrigation and State Agriculture Universities (SAUs).
Stephen has reported that Coimbatore, Dharmapuri, Madurai, Ramanathapuram, Salem, Tiruchirapalli, Tirunelveli and Kanyakumari are the chronically drought-prone districts of Tamil Nadu [21]. Vengateswari et al. has carried out a district-wise study on drought status and reported that in the north-western zone, Dharmapuri, Krishnagiri, Salem, Namakkal and some parts of Perambulur that receive a mean annual rainfall of 825 mm are drought-prone.
Along with that, Erode, Coimbatore Dindigal, Theni and parts of Karur and Madurai districts in the western zone, with a mean annual rainfall of 718 mm, and districts such as Sivagangai, Ramanathapuram, Virudunagar, Tuticorin, Tirunelveli and some parts of Dindigul and Madurai districts, with a mean annual rainfall of 776 mm in the southern zone, are also drought-prone in the state [22,23,24]. The Department of Agriculture and State Agriculture University combined, suggest appropriate contingency drought mitigation measures to cope with the shortage of rainfall and dry spells. Apart from that, the National Disaster Response Fund (NDRF) was allotted toward drought relief measures in the state in 2016.
3.1.2. Drought Status of Telangana
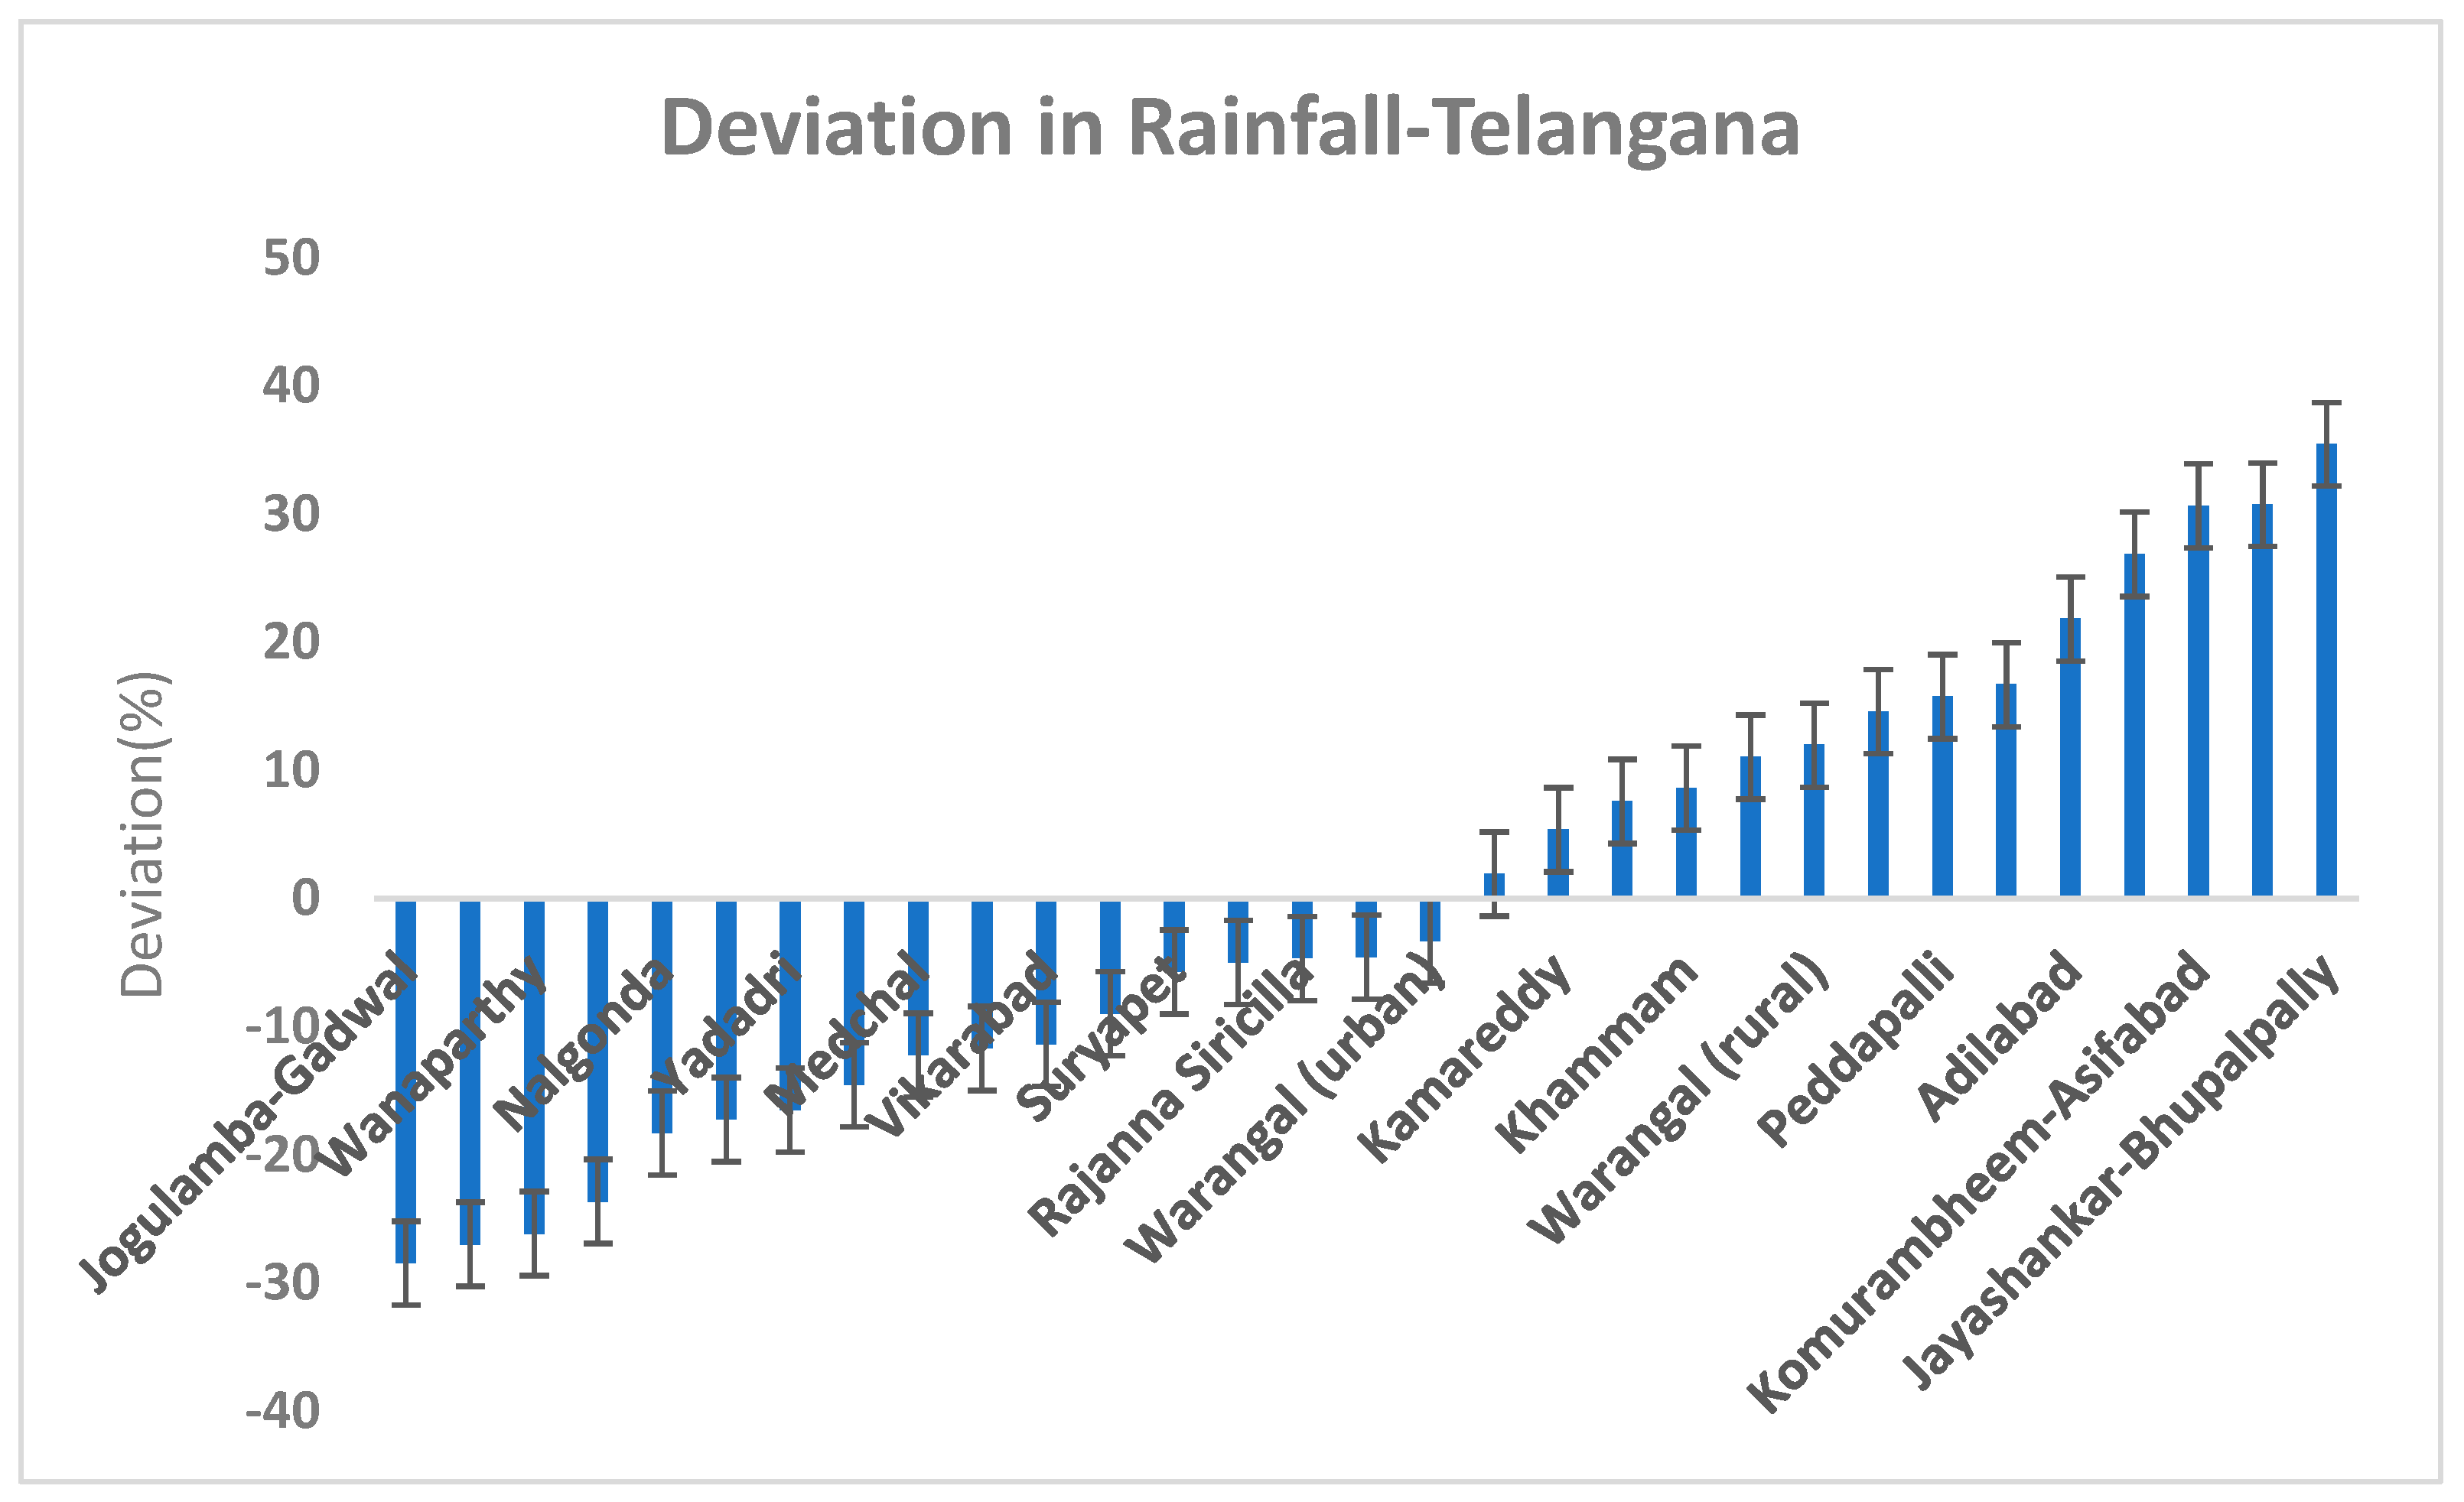
Many districts of Telangana are frequently hit by droughts. Heat wave impacts are also frequently reported from the state. The mean rainfall distribution in Telangana ranges from 680 to 1250 mm, with a mean of around 950 mm. Farmers in vulnerable mandals are struggling to sustain crop production and livelihoods. The mandals such as Nagarkurnool, Jogulamba-Gadwal, Wanaparthy, Mahabubnagar, Nalgonda and Yedadri are frequently hit by dry spells and droughts (Figure 4). Projects under National Adaptation Fund on Climate Change (NAFCC) from the Ministry of Environment and Forest and Climate Change (MoEF & CC), are implementing adaptation plans proposed for these vulnerable mandals in Telangana. The German Corporation for International Cooperation (GIZ), has also worked on climate change adaptation in rural areas, empowering rural population and other concerned officials in Telangana. The State Action Plan on Climate Change-TS projects warming scenarios of +2 °C by 2050 for Telangana, which will exacerbate the existing heat wave impacts, dryness, moisture stress, etc., in the future.
An analysis carried out by Dhanya et al. [25], using standardized precipitation index for one of the major cities of the state of Hyderabad, revealed that the year 1972 (SPI value −2.1) was the most severe drought year on record during the period 1970–2011, with the years 1977, 1985 and 1999 being severe dry years, and the years 1971, 1974, 1976, 1979, 1980, 1986, 1993, 1997, 2002, 2007 and 2009 were under the moderately dry category [25]. It is disturbing to understand that dry spells and aridity add pressures on existing water resources and insecurities. Two ambitious projects of the government of Telangana, namely Mission Bhageeratha and Mission Kakatiya, respectively, were enacted to address problems of drinking water and irrigation water. Mission Kakatiya (Our Village—Our Tank) may play a vital role in the revival and restoration of a chain of tanks system, which were the aspirations of people during the Telangana Movement (Mission Kakatiya GoTS, report, 2018) [26]. Crop contingency plans were introduced in the state by the Central Research Institute for Dryland Agriculture. These documents titled as “District Agriculture Contingency Plans (DACP)” were developed to cope with weather aberrations and minimize their impact on the agricultural sector [27,28]. Farmers were asked to shift from cotton and maize to red gram, sorghum and groundnut during the drought. Rice farmers have responded that the variety of ‘Black Kavuni’ rice is resistant to dry spells and drought during scanty rainfall periods.
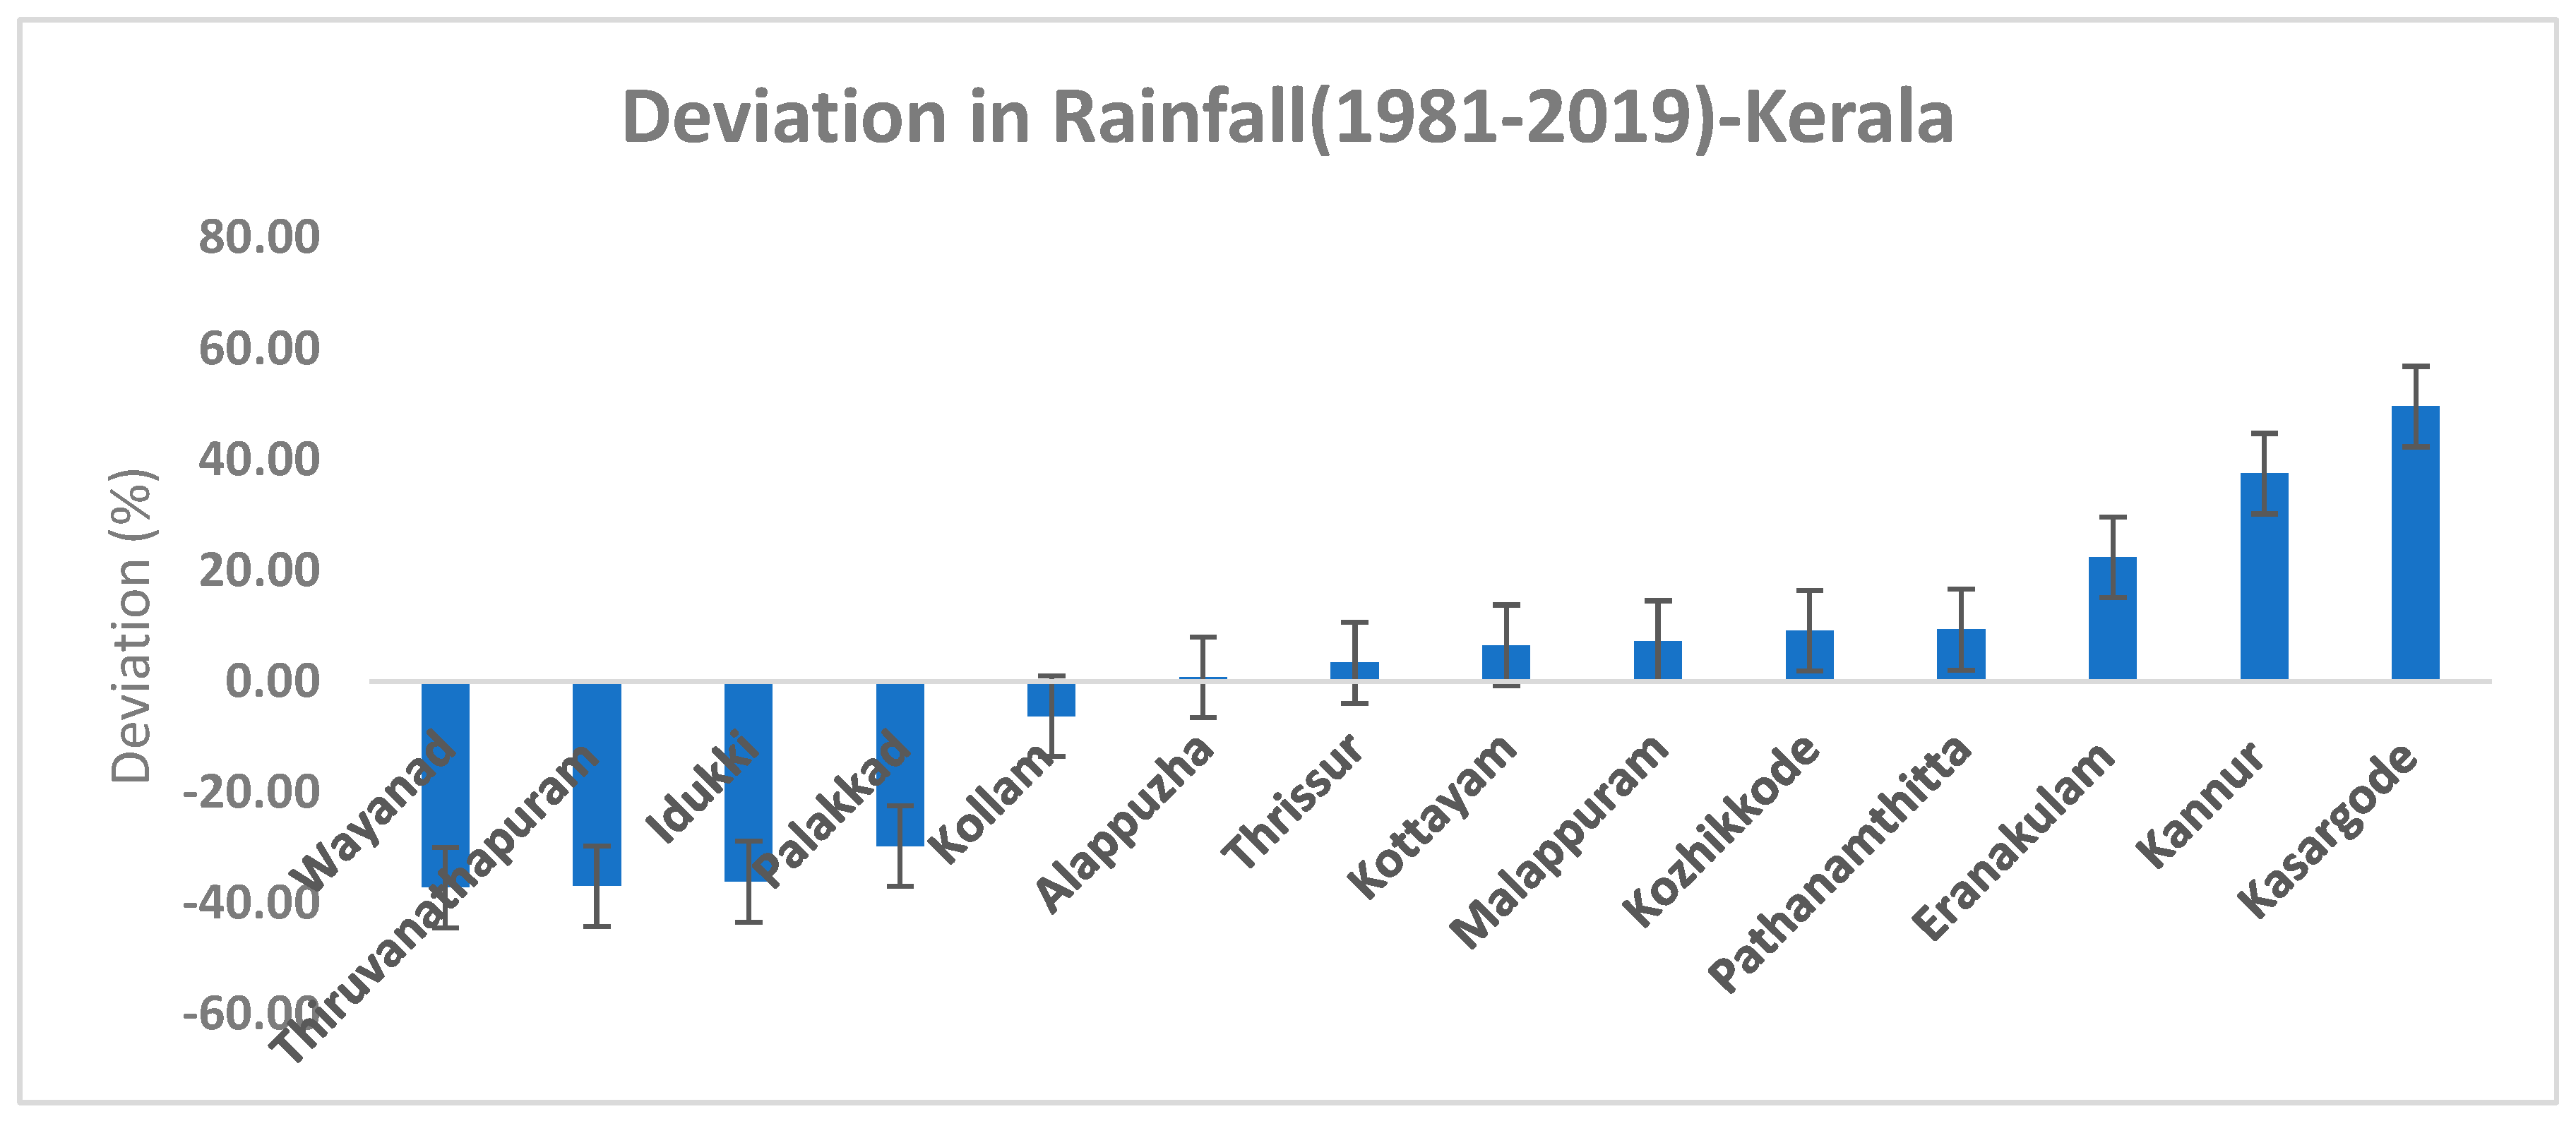
3.1.3. Drought Status of Kerala
The rainfall endowment in Kerala is much better than the other two states. The state has an annual mean precipitation of around 2508 mm, with maximum variability (coefficient of variation) observed in north-east monsoon season (43%), followed by south-west monsoon season (41%). There are, as far as spatial variation in rainfall over Kerala is concerned, the districts such as Wayanad, Thiruvananthapuram, Idukki and Palakkad, which have received lesser rainfall compared to the other parts of the state during 1981–2019 (Figure 5). The experience in the rice farms showed that during the recent drought in 2016, crops were impacted severely. From the farmers’ fields, it was understood that traditional variations are more drought-tolerant. The local rice varieties, such as Kuruvai and Navara, have survived the water shortages during the critical growth period. These traditional drought-resilient rice varieties must be suggested if there is a drought forecast by seasonal weather forecast by IMD.
3.2. Drought Early Warning in Parambikulam Aliyar basin (PAP), Tamil Nadu, a Case Study
IMDs issues medium range weather forecasts twice a week on Tuesdays and Fridays; hence, the weather forecast, along with agromet advisories, were issued to the groundnut and maize farmers of PAP through ICT tools, including social media apps and websites in the vernacular language Tamil. Diffusion of AAS was initiated with the land preparation/sowing time and continued till harvest, covering all sensitive crop-growth stages in both Khariff, the early and late samba season.
Farmers in these areas heavily depend on rainfall for groundnut cultivation. Groundnut was cultivated during Chithirai pattam (April) and Vaikasi pattam (May) in the rainfed areas of the river basin. With respect to groundnut crop production, the major cultivating seasons found in Anamalai block was summer/Zaid season/Chithirai Pattam (sowing in April/May and harvest in August, using the ruling varieties such as TMV 7, CO-2, CO-3, VRI-2, VRI-8, BSR8) and during Khariff/Ani Pattam (sowing in June to harvest in September; TMV7, CO-2,VRI-2). As an adaptation intervention, an automatic weather station was installed at the farmers’ fields to record and provide location-specific weather details. During the period from June 2021 to September 2021, there were two major dry spells observed. The first one extended from the last week of June to the first week of July, and the second major dry spell during Khariff was noted during September, in the third and fourth weeks. Even though the forecast was provided to the farmers, the first dry spell impacted the farmers in a very noticeable way as it was the vegetative stage of the crops. Moreover, irrigation water was not issued at the time.
During Rabi crop maize, the dry spells started from the second week of December and extended till the first week of January 2022. However, farmers were obtaining irrigation water from Aliyar and Palar, Vettakaranpudur feeder canals. The agromet advisories issued at the time included critical irrigation for the crops based on mild, moderate and severe stress in the fields. The use and application of weather updates received in the form of SMS were demonstrated to the farmers. An exclusive website was also created for the dissemination of advisories in both English and in the vernacular language to disseminate weather aberrations. The ways to download and register in mobile apps such as Uzhavan app, Meghadoot apps, etc., were demonstrated to the farmers during awareness meetings. Severe dry conditions were reported by farmers during the years 2016, 2012, and between 2001 and 2003. These years are remembered as drought years; however, farmers were not prepared to face it. In-depth interviews with farmers revealed that the drought of 2016 had impacted the farmers and resulted in crop loss, fodder unavailability, water shortages, etc. This has tempted some of them to shift to other non-agricultural activities. The skill score of the probability of no rain events forecast or dry spell in the area was found to be different for both seasons. The probability of false detection (false alarm rate) was 0.81 and 0.30 for Khariff and Rabi, respectively, indicating that out of a total of 97 observations, 0.81% observed “no rain” events and the forecasts were incorrect during Khariff. This needs to be improved. However, the dry spell detection score was only 30% inaccurate during Rabi season. Dry spell during Khariff season was more unpredictable in the basin.
Utility of Early Warning and Agromet Advisory Services (AAS)
Agromet advisories were sent just before the harvest received its highest percentage score in the utility score. Almost 72% of the surveyed groundnut farmers reported that AAS has helped them during the harvest operation of September 2021 (Figure 6). This utility score is followed by the information acquired during the land preparation, which was followed by 59% of the respondents during the month of April and May, 2021. This aided them to safe guard their produce and minimize loss due to heavy rainfall events. Similar outcomes were also reported by Patel et al., who observed that 81 percent of farmers rated the usefulness of agro-advisory bulletins [29]. Questionnaires were developed in both the vernacular language Tamil and English to collect the farmers’ feedbacks on agro-advisories disseminated through social media, websites and SMS before, during and after the Kharif and Rabi crop seasons of the year 2021–2022. The results revealed that access and availability of AAS have improved significantly in the region and AAS has positively supported the farmers during critical crop growth stages and farm operations. Similar results of the significance of early warnings have been published by many researchers [30,31,32,33,34,35].
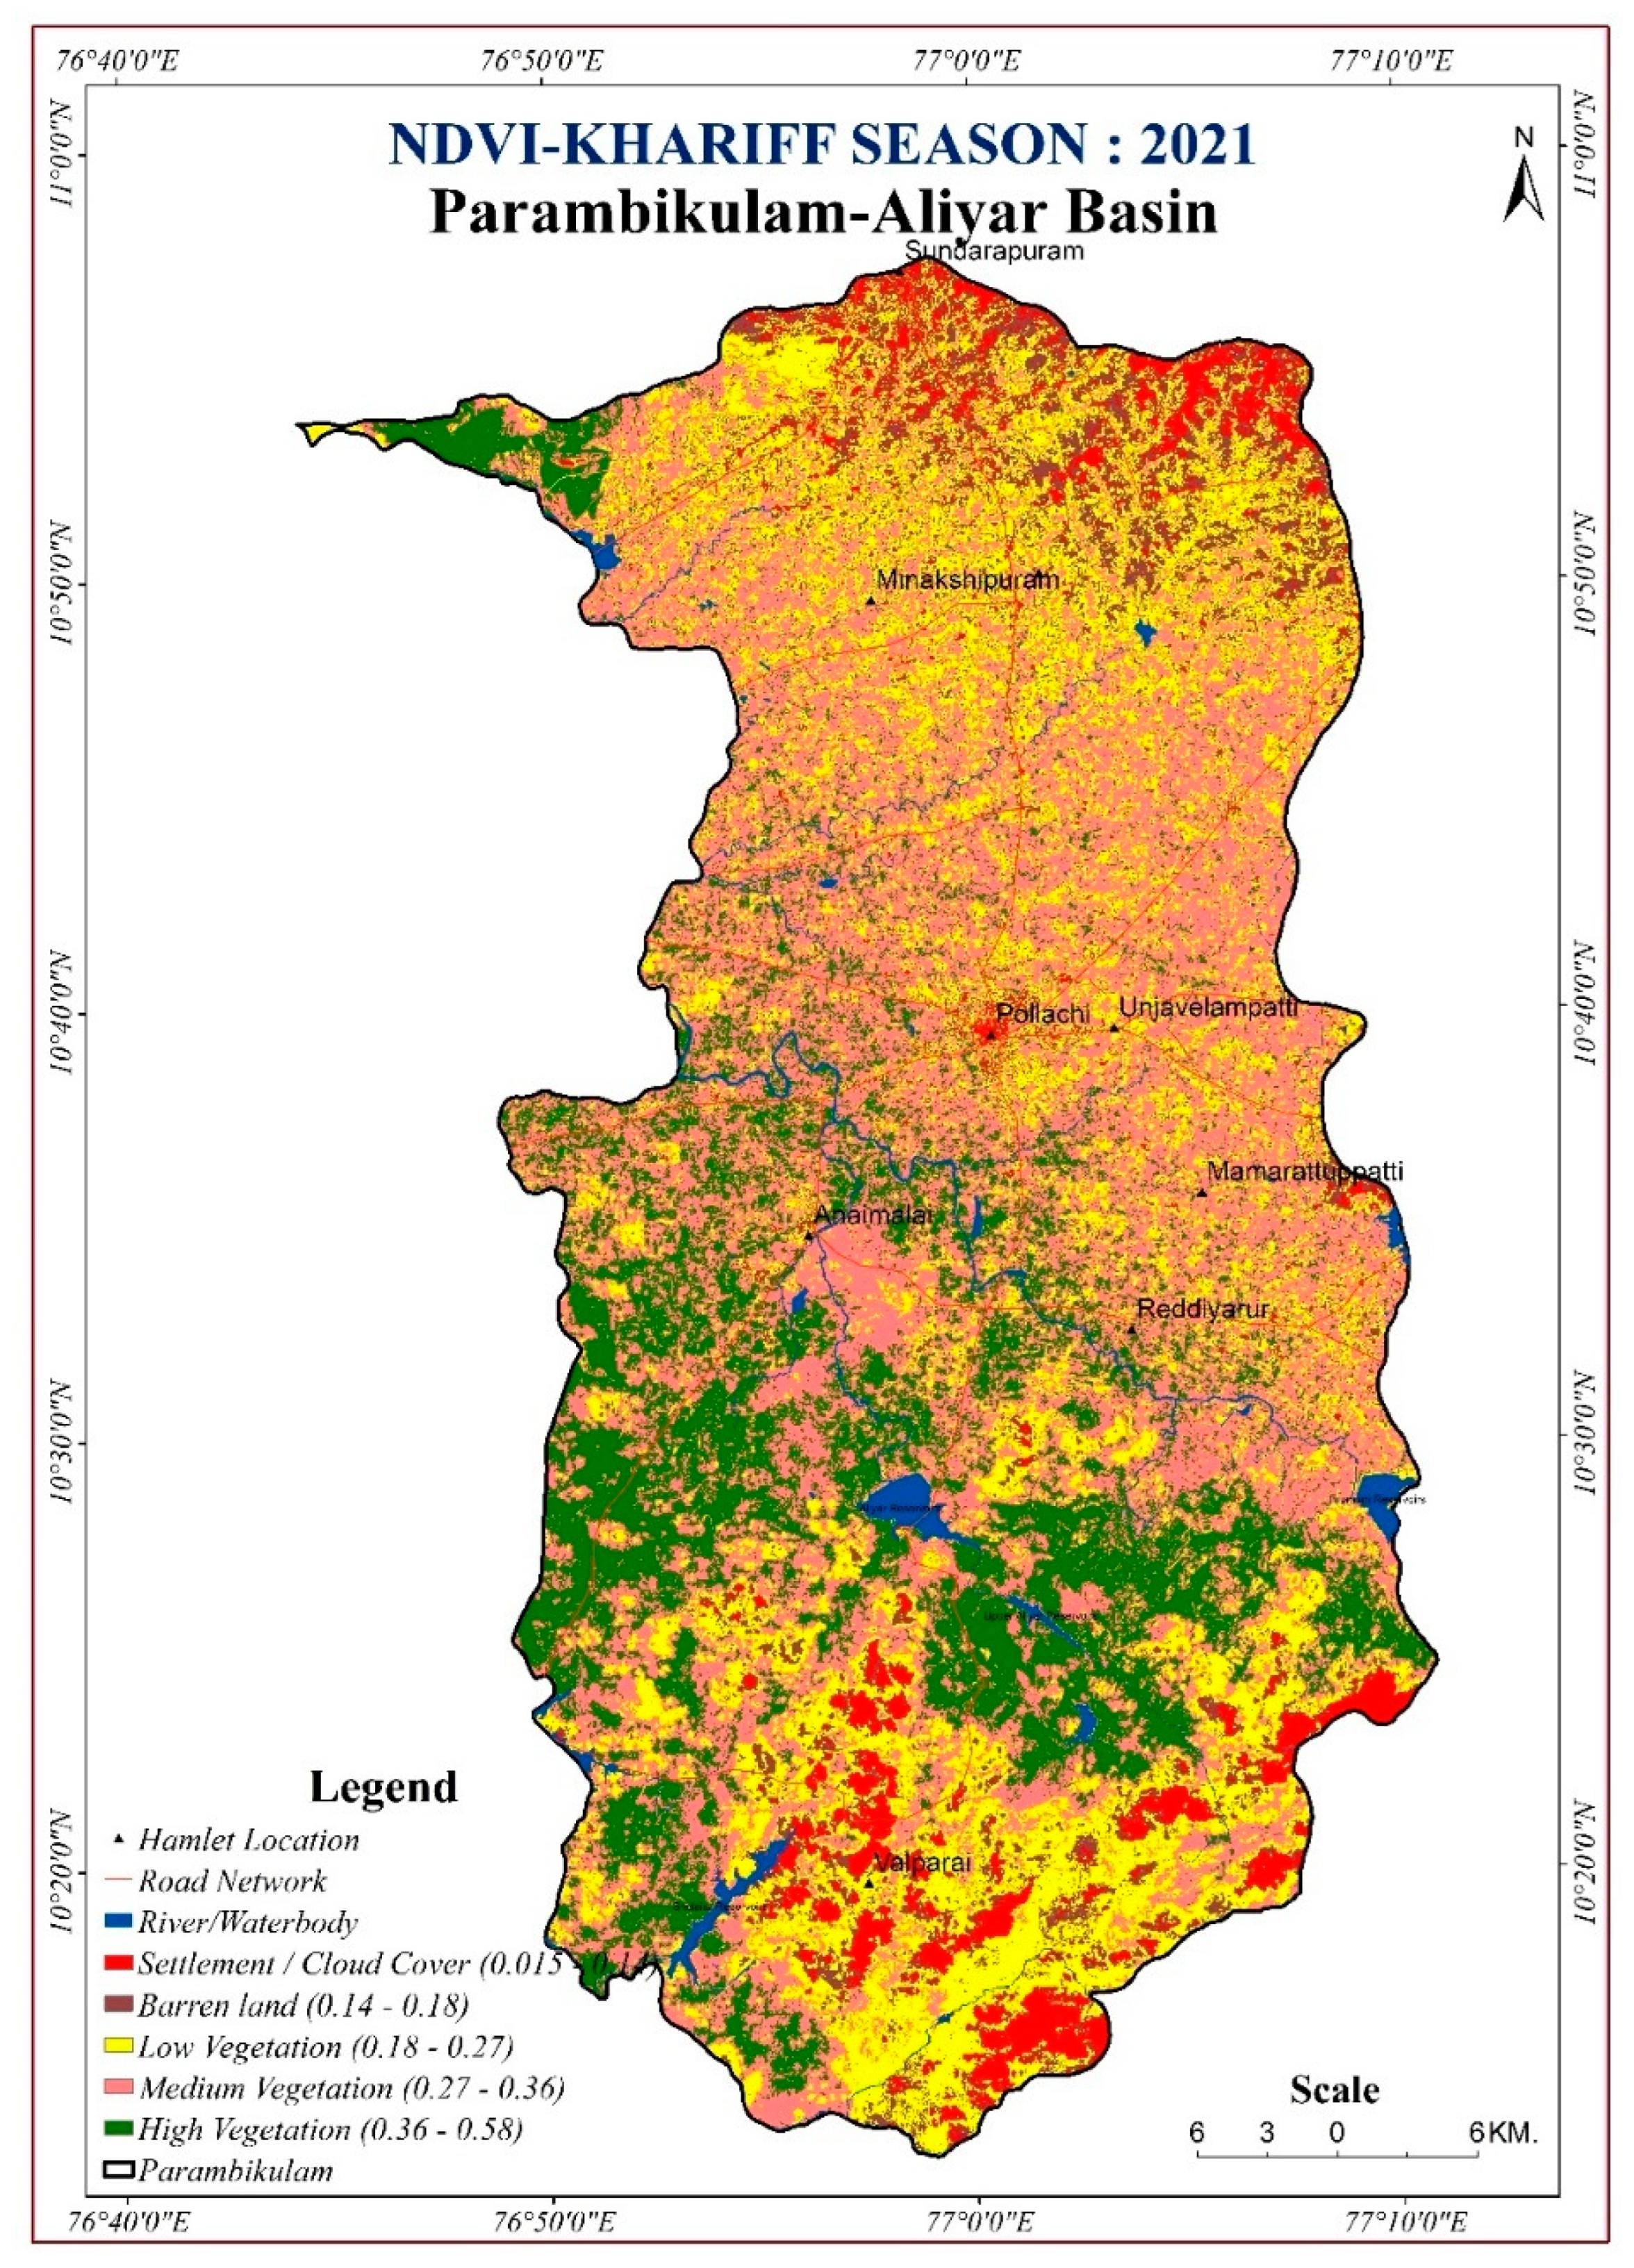
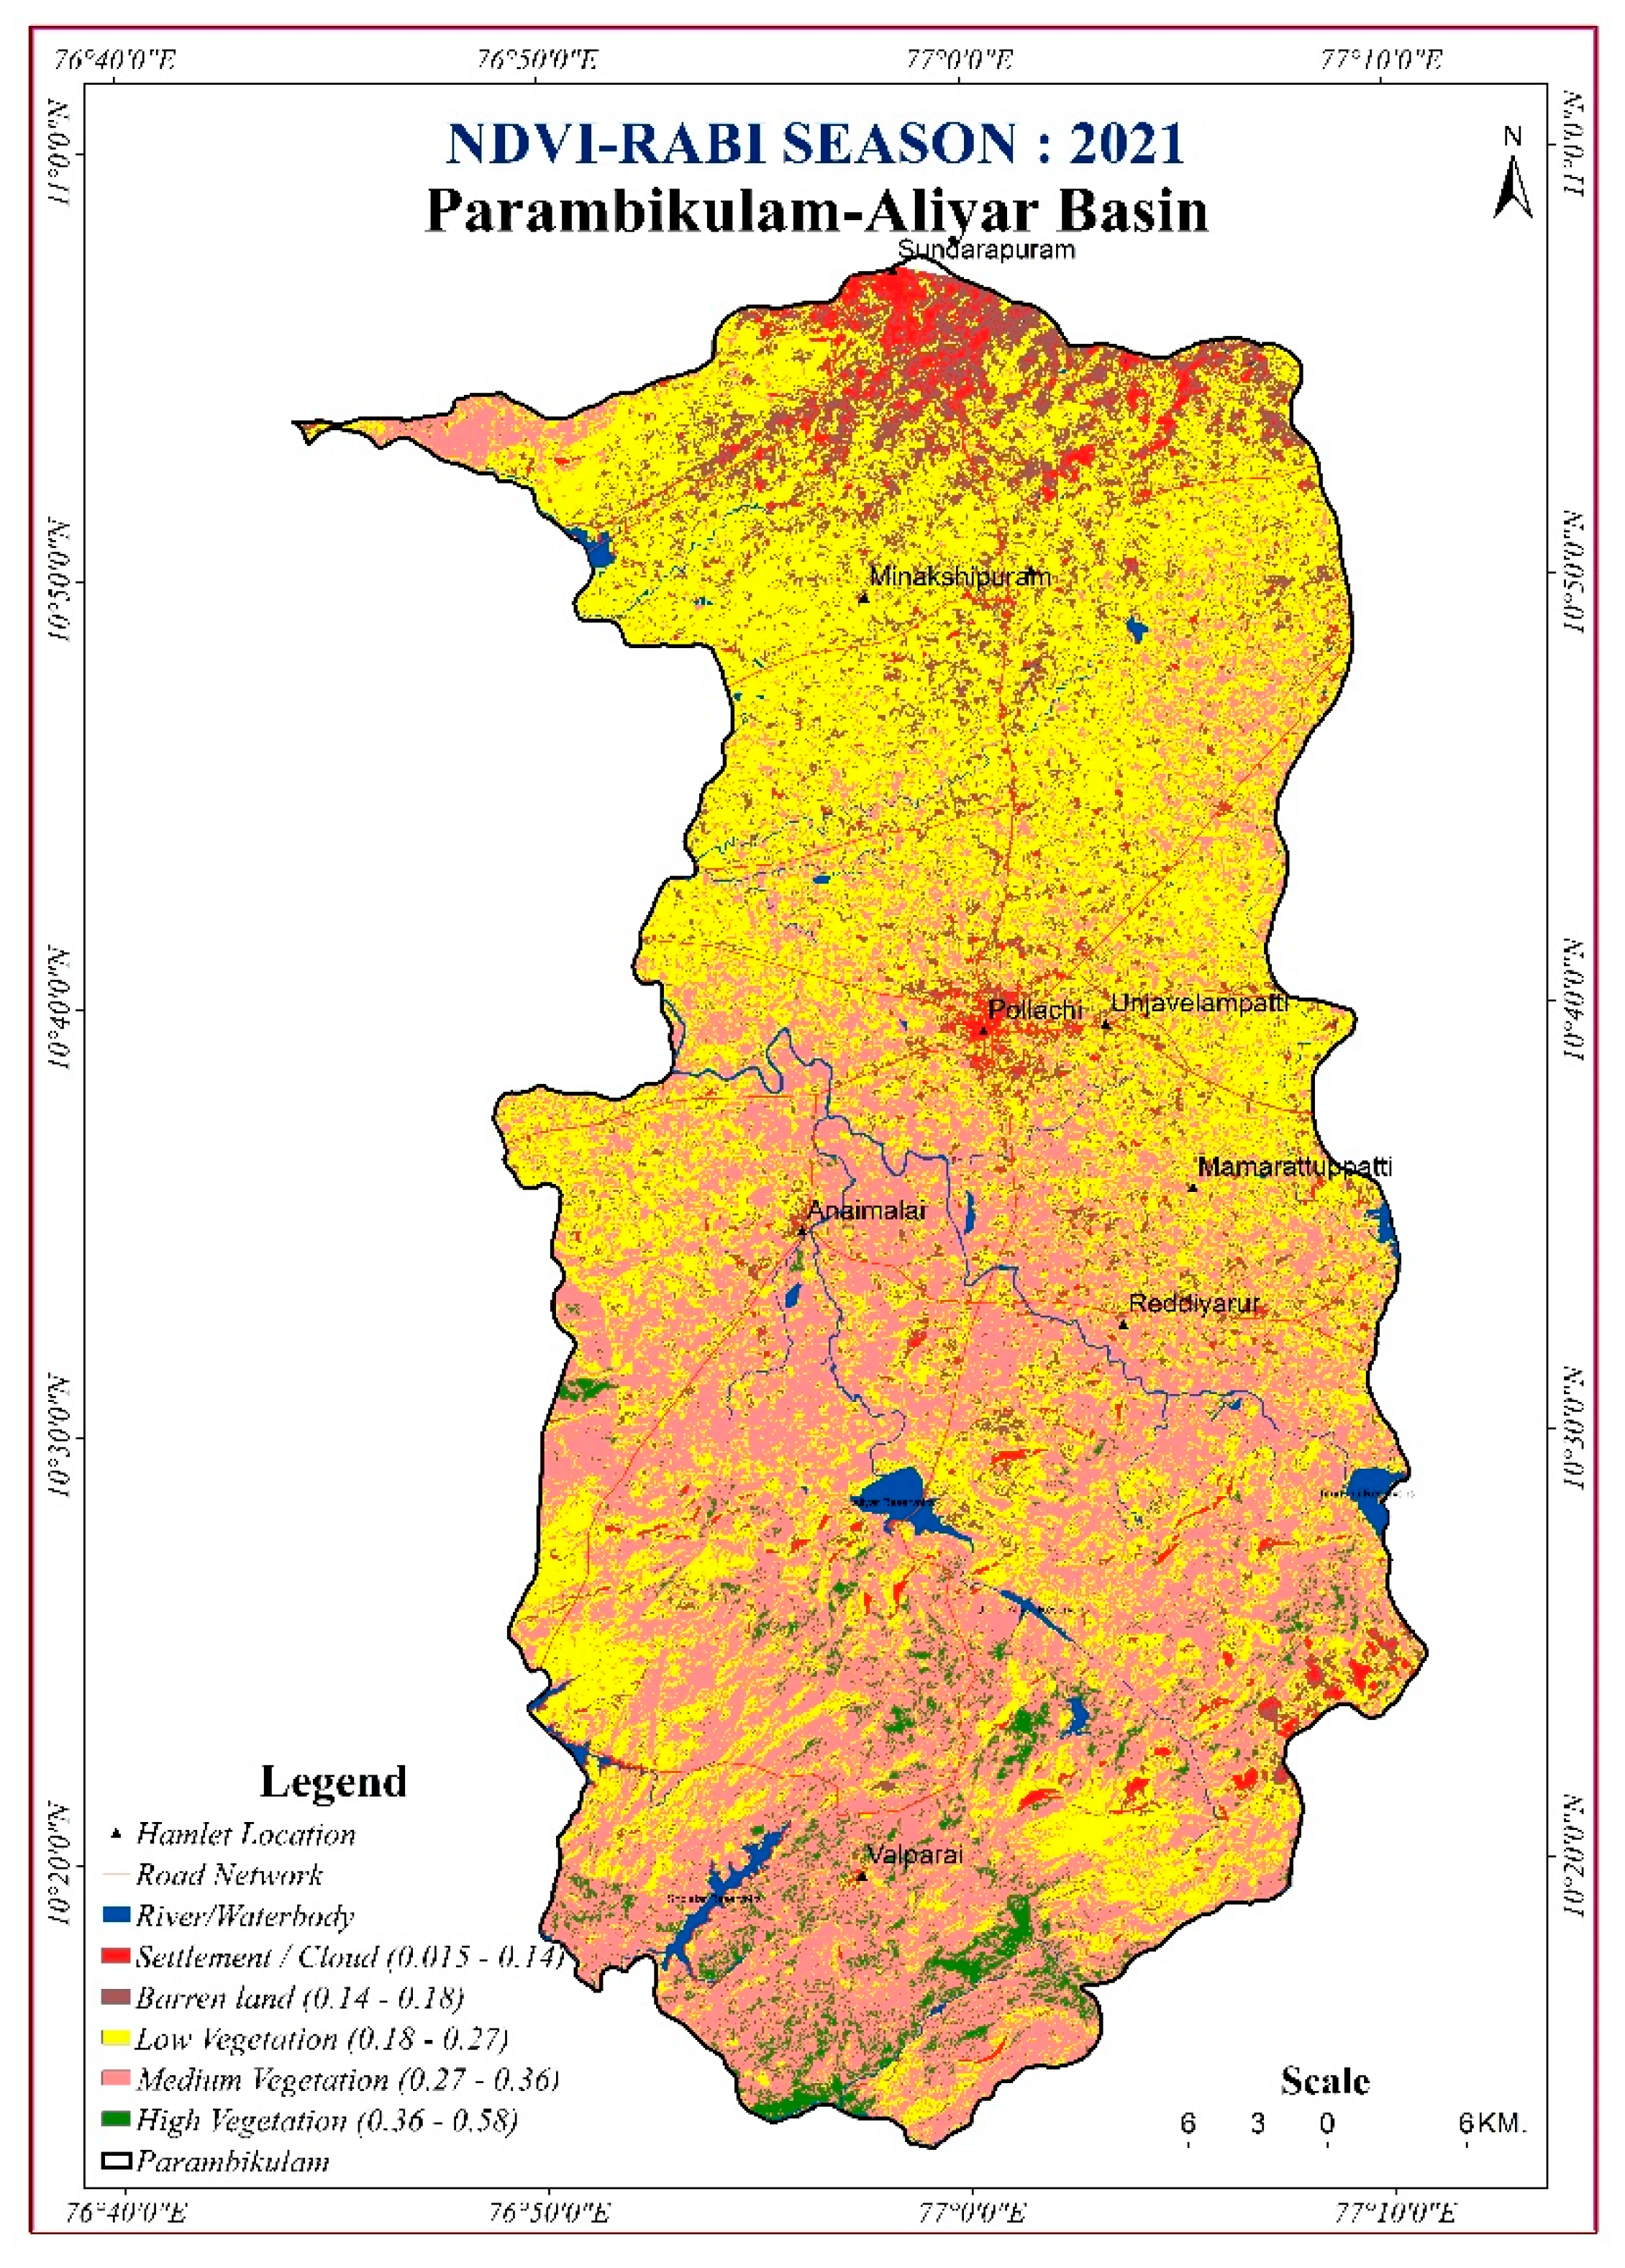
A combination of space technology and land-based observations have been used to monitor crop production during Khariff and Rabi seasons in PAP. Remote sensing products such as NDVI was also used to identify the real-time progression of vegetative conditions. The IMD products and MODIS 16-day composite time series normalized difference vegetation index (NDVI) mean values were computed for each month separately, along with the mean of the agricultural seasons Khariff and Rabi, and were processed to find out crop growth, vigor and progression of vegetation in PAP. The NDVI difference in Khariff 2021 and Rabi 2021 is given in Table 1 (Figure 7 and Figure 8). NDVI was used to monitor the district level vegetation condition and compare it with the drought year 2016. The difference in area under barren land was 76% less during Khariff, 2021 and 44% during Rabi, 2021. That is the kind of variation between barren land during a drought year and an above normal rainfall year. The medium range of vegetation was almost doubled during Khariff, and about a 12% increase was noted during Rabi, 2021, compared to the drought year 2016. The statistical abstracts (2012) of the National Rainfed Area Authority of India has reported that approximately 15 Lakh ha of cultivable land is left fallowed during severe drought years in the state.
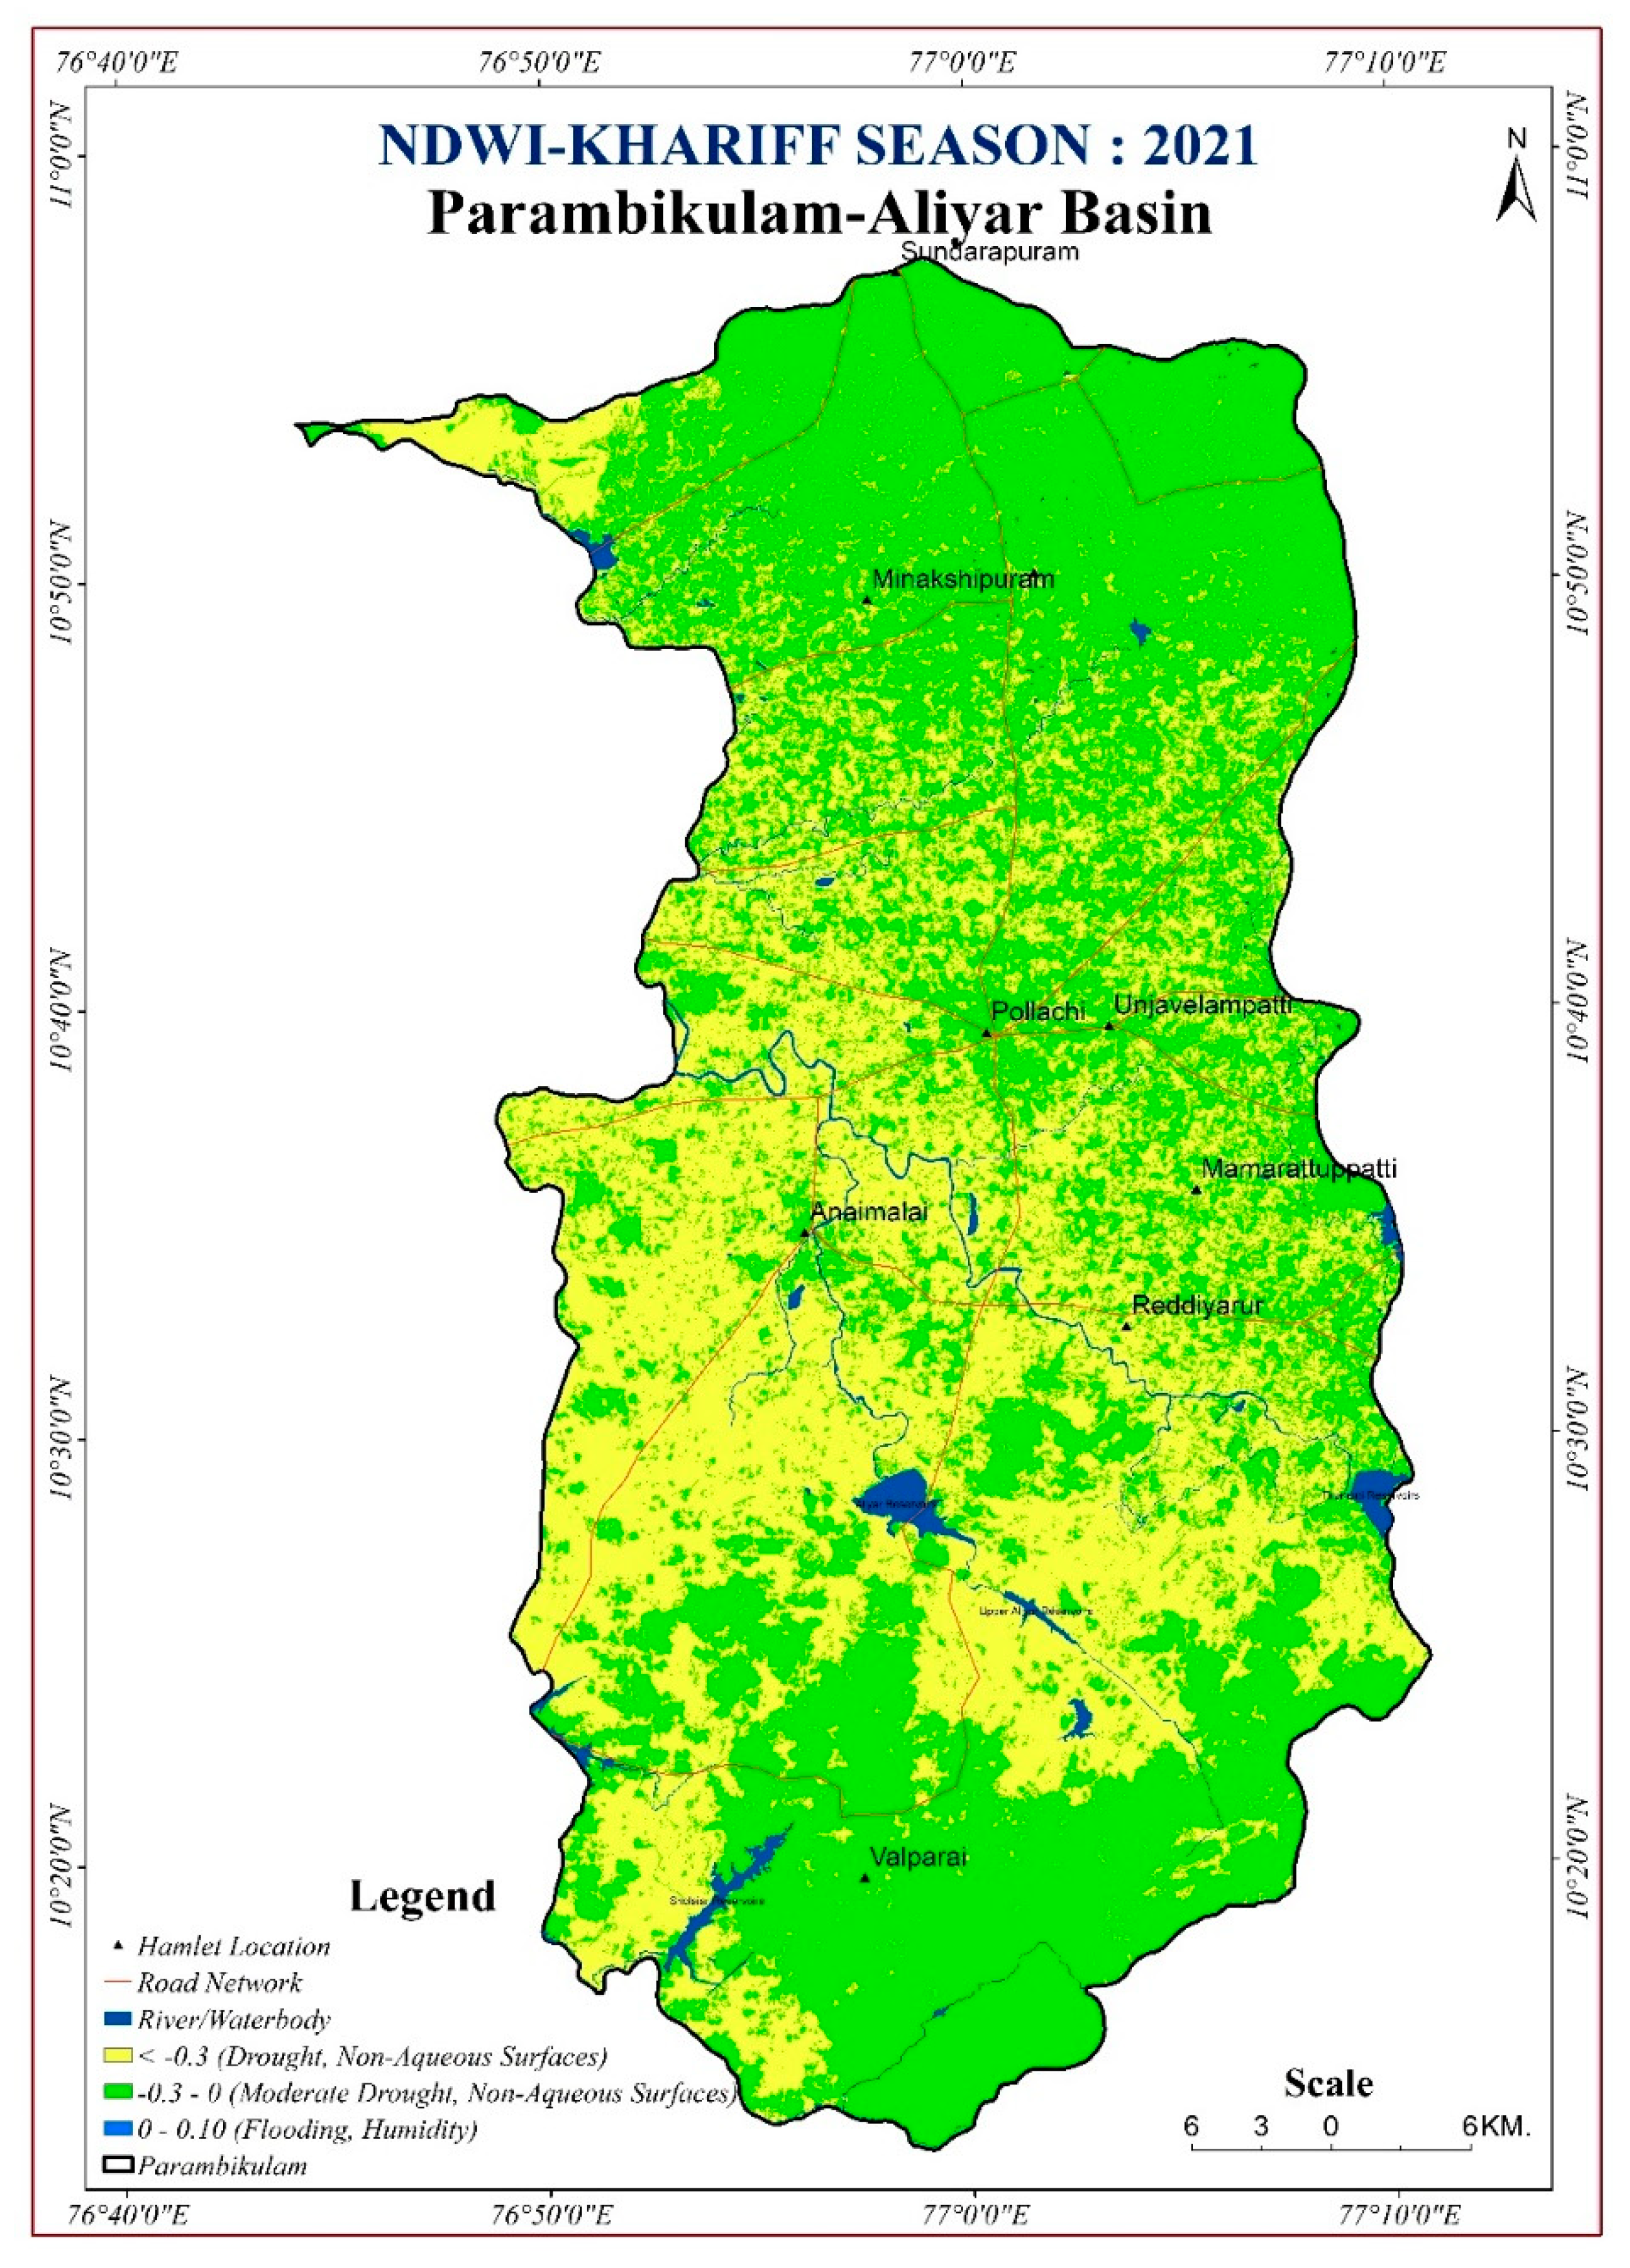
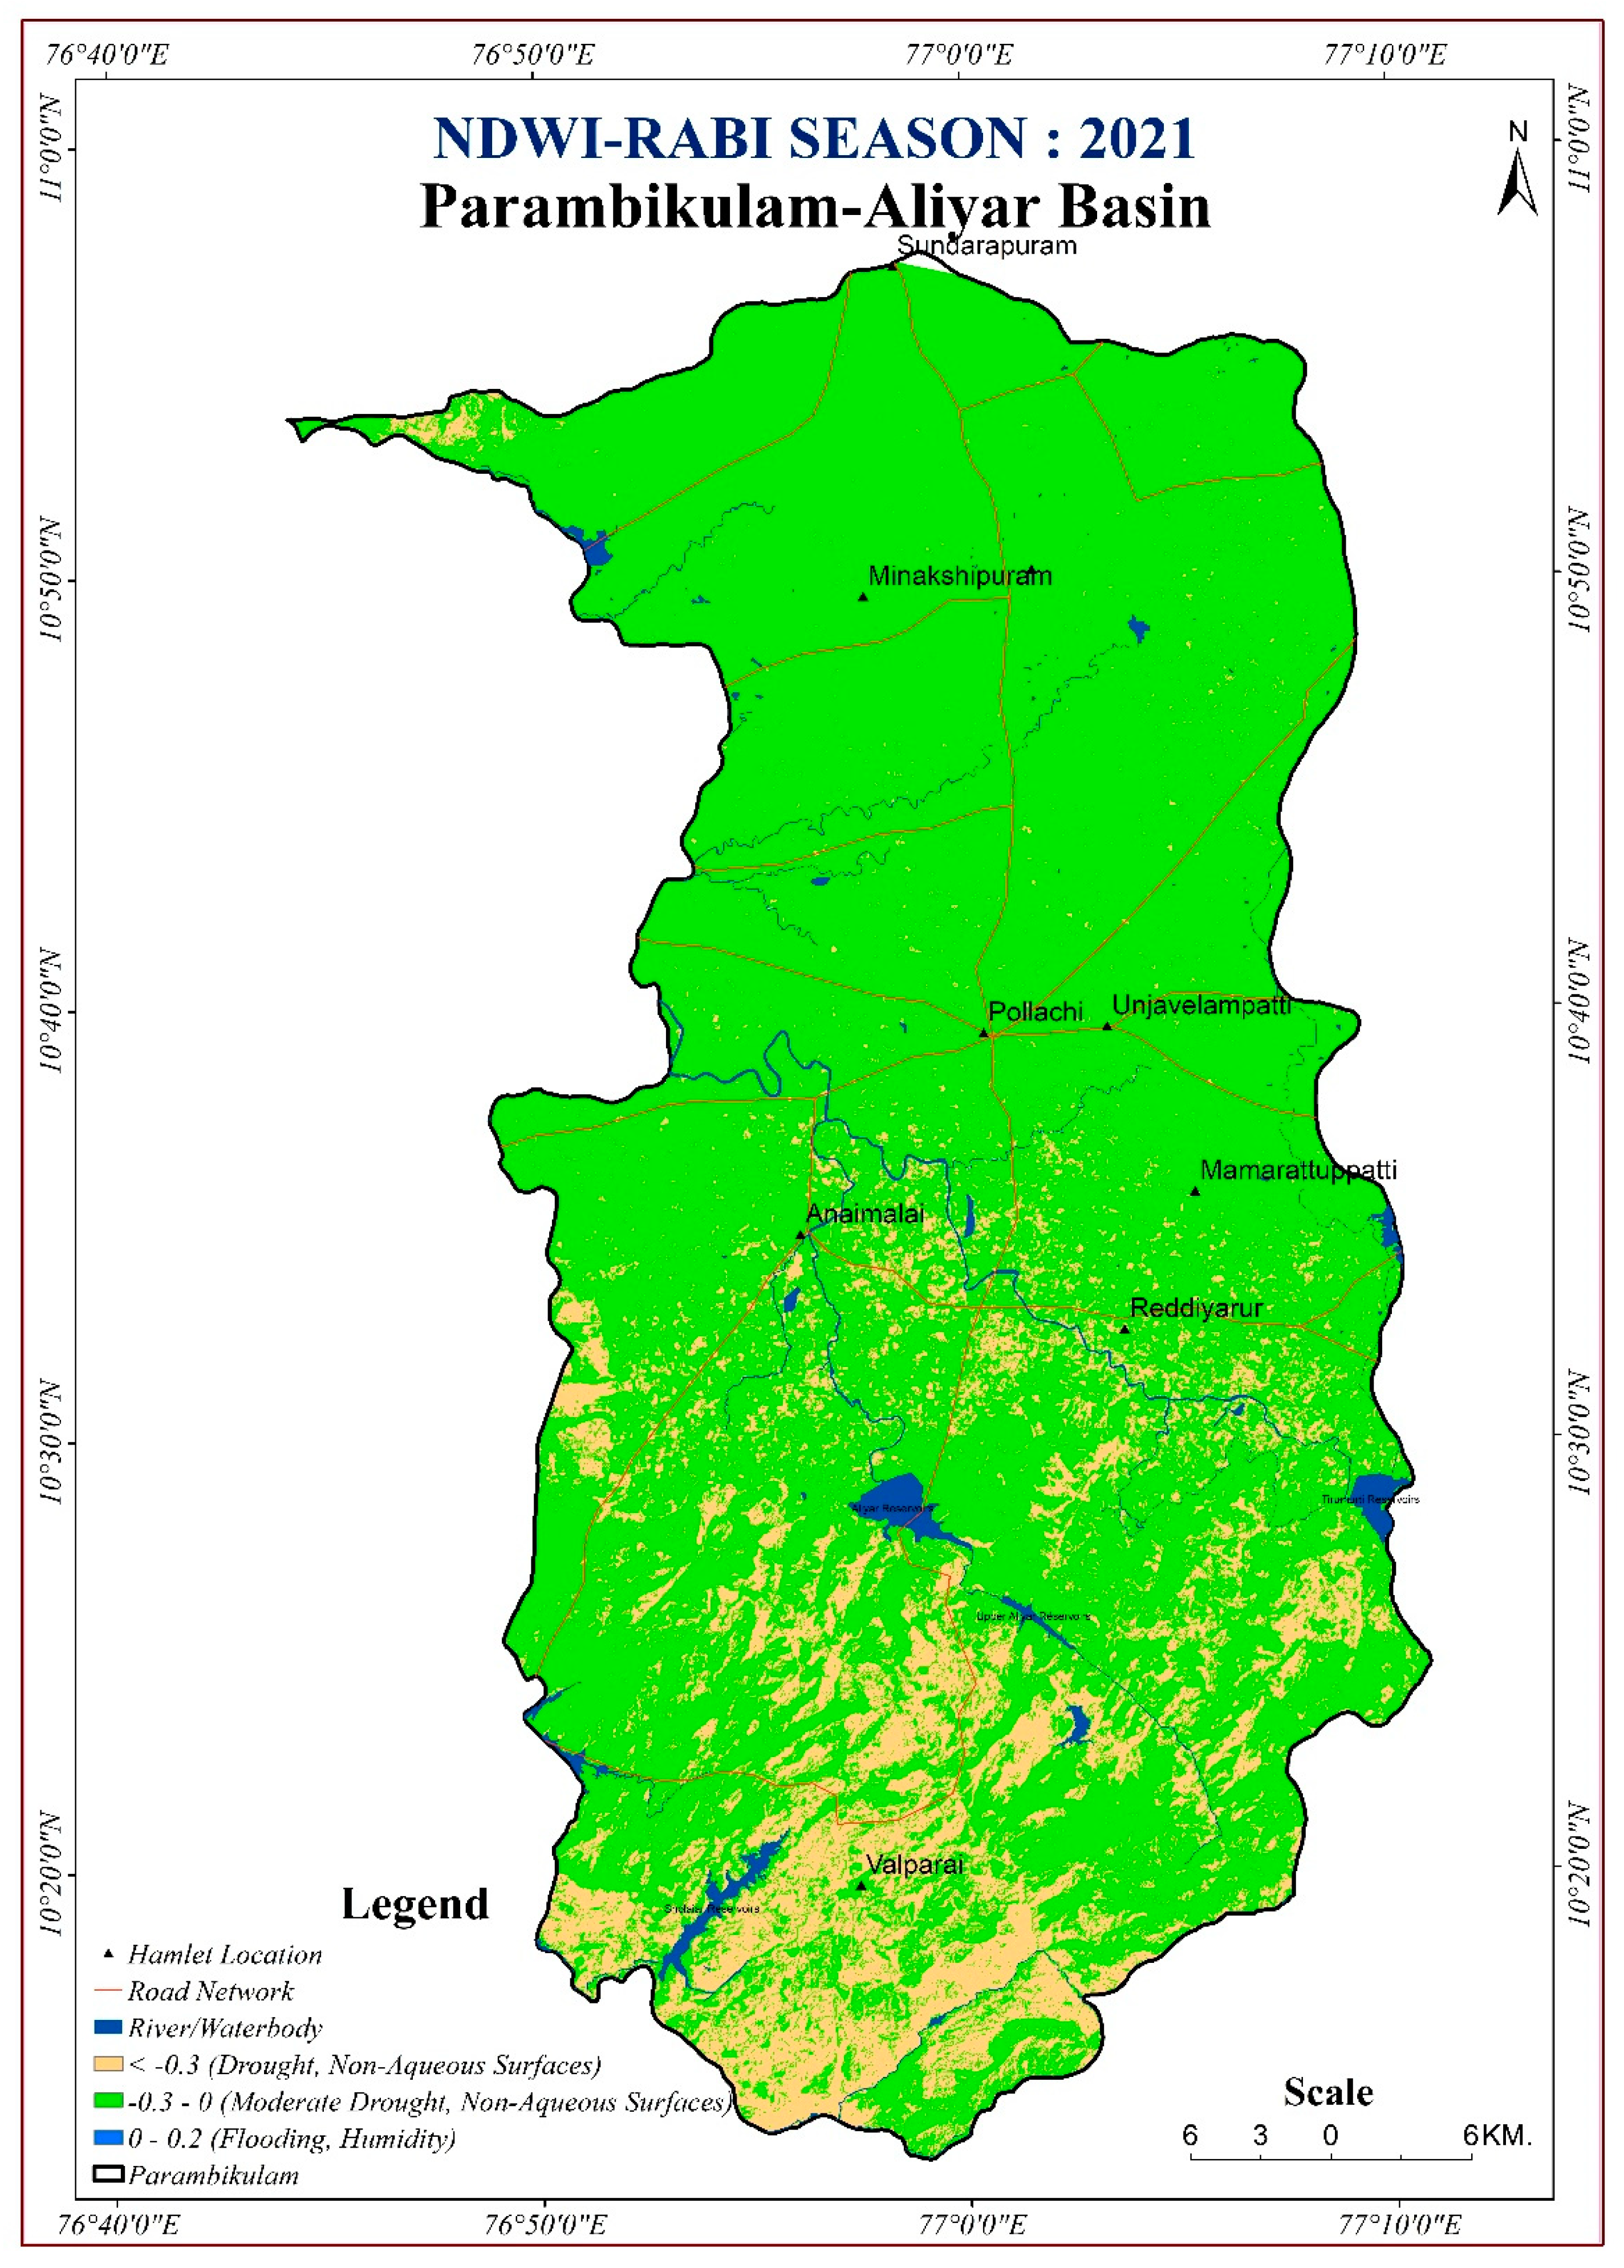
Normalized difference water index (NDWI) uses both the bands in near infrared region and is very sensitive to liquid water content of vegetation canopy and rainfall. Many researchers have attempted to understand the sensitivity of NDWI in detecting and monitoring the agricultural drought situations as NDVI shows a lagged relationship with rainfall distribution. NDWI5 images efficiently picked up the higher water stress in Khariff season than in Rabi, which is evidenced by more yellowness in the images (Figure 9 and Figure 10). It is found from the real time data that more dry spells were present during June, July and September 2021 than in Rabi season. This study concludes that real time data combined with satellite-derived MODIS NDVI, NDWI data can be well utilized for regional level agricultural drought detection and monitoring for early warning [35]. Moreover, the major elements of a drought monitoring and early warning systems include knowledge of the risk, drought monitoring, dissemination of early warning to relevant stakeholders and preparedness and ability to respond.
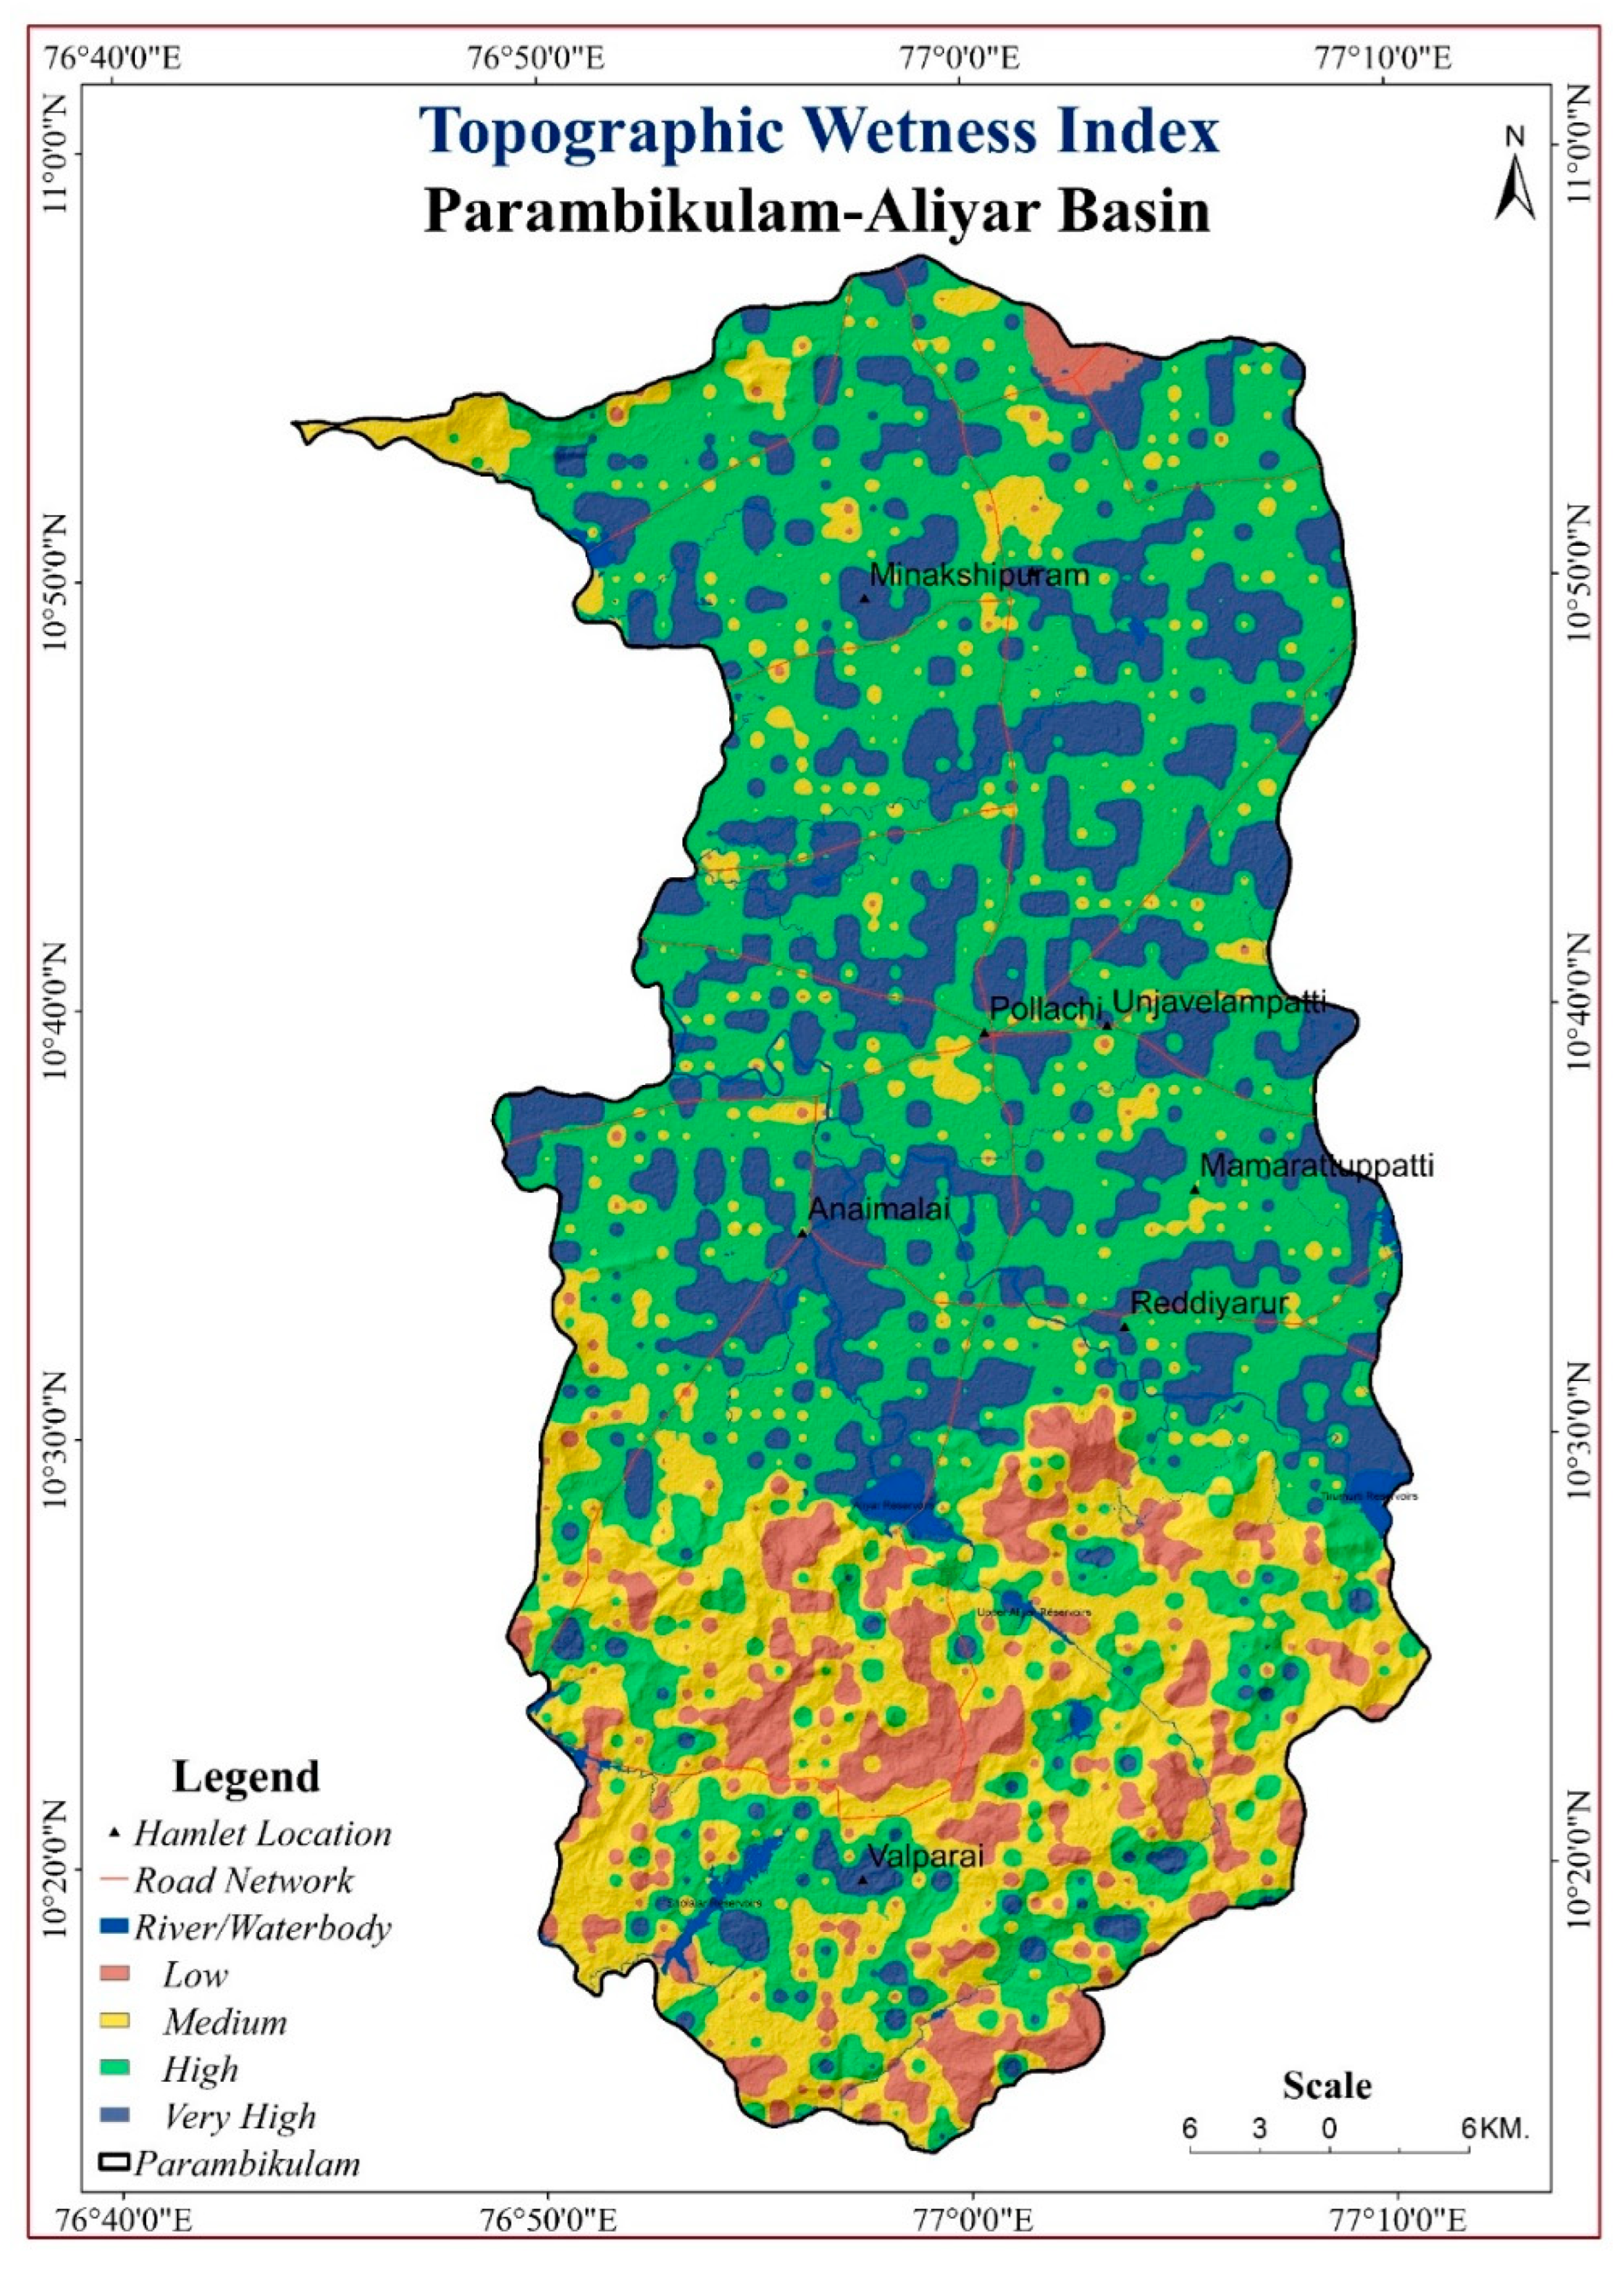
Higher mean TWI regions have a higher vulnerability to water retention or flood. Inversely, the lower TWI regions have lower vulnerability. Drier regions are mostly toward the south of PAP (Table 2). PAP has more of clay loam and sandy clay loam soils. Soil moisture conditions respond to precipitation anomalies on a relatively short scale. Topographic wetness index (TWI) was also used as a proxy to know the soil moisture conditions (Figure 11). This was compared with the in-situ soil moisture values retrieved from automatic weather stations installed at the farmers’ fields. The seasonal variation of soil moisture influenced TWI performance, which was best when conditions were not saturated and not dry. These results aid in the management of crop fields with variable moisture characteristics, especially during dry spells. During dry spells in the early season, agromet advisories were distributed to avoid the top dressing of fertilizers until there is light rainfall and favorable soil moisture conditions. Critical irrigation was also suggested to the registered farmers during the terminal period when there was flowering and grain setting in the farms.
Crop production is a challenging task as it is frequently hit by droughts and dry spells across the world [36,37,38,39,40]. Apart from satellite products, AI and machine learning tools are also used to monitor and forecast drought and dryness in an area. The performance of several different machine learning models, including artificial neural network (ANN) and M5P model tree in forecasting the most widely used drought measure, the standardized precipitation index (SPI) was attempted by Pande (2022), and it was reported that M5P model has higher r values and lesser RMSE values as compared to ANN (4, 5), ANN (5, 6) and ANN (6, 7) models [33,41]. Periodic assessment of drought status and vulnerabilities would help in improving site specific early warning dissemination and planning contingencies for crop and livelihood protection [42,43,44,45,46,47,48].
There are multi-hazard early warning systems operating at different parts of the world. In Europe, demonstration projects funded by the European Union explored the potential for an effective, reliable and cost-efficient early warning system that has a multi-hazard approach and that makes use of location and population-based communication technologies and social media applications [49]. The European Drought Observatory in Europe releases dashboards of interactive drought-relevant information using real-time precipitation, satellite measurements and soil moisture content [50]. In regions like Sub-Saharan Africa, which are susceptible to climate change and have a dearth of in situ data, the use of remote sensing products and their application in decision making is particularly limited due to an inability to access Earth Observations [51]. The early warning explorer here (EWX) was created to remove this important obstacle and enable the use of EOs in decision making for its users. It is now available to Central America, the Caribbean islands, Central Asia, the Middle-East and South America. The USGS’s EWX currently provides access to Eos, such as precipitation estimates, land surface temperature and vegetative greenness, thereby enabling agricultural drought monitoring [52]. For monitoring droughts, MODIS LST is a crucial form of data collection, especially in and during areas of water-limited seasons [53]. In the United States, the Regional Climate Center provides daily and weekly updates on drought impacts and intensity through a website. IWMI research report describes various indices used to evaluate drought impacts [54]. The socioeconomic drought vulnerability index (SDI) measures the vulnerability of individual countries to socioeconomic drought. Three sub-indices, namely, the income diversity index (IDI), employment diversity index (EDI) and the crop range index (CDI), make up the composite index [55]. India can learn and be better equipped from the success stories of other countries in drought monitoring and mitigation.
4. Limitations
Crop production remains by far the most vulnerable and sensitive sector to droughts; however, other areas of agriculture such as impacts on livelihood, livestock and other flora and fauna are not dealt with in this article. This general study on drought assessment for districts can be further refined to a micro level. This will facilitate preparing site-specific action plans for providing relief measures to frequently drought-affected areas. This study is limited to an annual drought analysis; however, a seasonal rainfall analysis can be carried out to understand the drought probability for crop growing seasons and prepare short- and long-term adaptation strategies. The role of satellite-derived index for drought detection has been exemplified by integrating meteorological data in this article; however, there are several indices and machine learning models available to understand the progress of vegetation conditions that can also be incorporated to get a clearer picture in future.
5. Conclusions
Weather forecasts and drought early warning systems have been discussed in this article. Many districts in these three states are not effectively drought-proof and are hence, vulnerable. The concept of early warning systems needs to be strengthened, and assured access to EWS to all stakeholders must be ensured by the concerned officials. IMDs seasonal and extended range forecasts have helped the stakeholders to take proactive and distinct action plans. Individual research projects such as this has supported the small and marginal groundnut (kadalakkai/nilakkadalai) and maize (makka cholam) farming communities during dry spells to make their farming weather-smart in PAP. Even though there are wide gaps in dissemination due to a lack of awareness, access to modern technologies and poor economic conditions, it was noteworthy that the necessity for AAS varies based on the types of crop. There is a need to maintain and improve the network of automatic weather stations (AWS); hence, projects like this support the need externally to fill the gap in EW dissemination. The timely dissemination of these needs to be envisaged in drought-hit areas. Strengthening agriculture extension activities and ESW would enhance the efficacy of EWS. Developing countries require more climate finance for building critical infrastructures, early warning facilities and for a better dissemination of them through ICT tools for climate risk aversion.
Author Contributions
Conceptualization, P.D.; methodology, P.D.; software, P.D.; validation, P.D. and V.G.; formal analysis, D.P; investigation, P.D.; resources, P.D.; data curation, P.D.; writing—original draft preparation, P.D.; writing—review and editing, P.D.; visualization, P.D.; Supervision, V.G.; funding acquisition, P.D. All authors have read and agreed to the published version of the manuscript.
Funding
This research was partially funded by KIRAN-WISE, Department of Science and Technology, Government of India.
Institutional Review Board Statement
Not applicable.
Informed Consent Statement
Not applicable.
Data Availability Statement
Data is deposited.
Acknowledgments
I thank my employers at Environmental Protection Training And Research Institute, Government of Telangana, Tamil Nadu Agriculture University, GoTN, and Kerala Higher Education Council, GoK, and Kerala Department of Science And Technology, GoK for providing me with experience and research support.
Conflicts of Interest
The authors declare no conflict of interest. The funders had no role in the design of the study; in the collection, analyses, or interpretation of data; in the writing of the manuscript, or in the decision to publish the results.
References
- IPCC, Assessment Report 6, 2022. Available online: https://www.ipcc.ch/report/sixth-assessment-report-working-group-ii/ (accessed on 14 November 2022).
- Mishra, V.; Bhatia, U.; Tiwari, A.D. Bias-corrected climate projections for South Asia from Coupled Model Intercomparison Project-6. Sci. Data 2020, 7, 338. [Google Scholar] [CrossRef] [PubMed]
- Tannehill, I.R. Drought, Its Causes and Effects; Princeton University Press: Princeton, NJ, USA, 1947. [Google Scholar]
- IPCC. 2022. Available online: https://www.ipcc.ch/sr15/chapter/spm/chapter (accessed on 16 April 2022).
- FAO. Handbook on Climate Information for Farming Communities, What Farmers Need and What is Available; FAO: Rome, Italy, 2019; p. 184.
- FAO. The State of Food Security and Nutrition in the World 2020: Transforming Food Systems for Affordable Healthy Diets; FAO: Rome, Italy, 2020.
- Van Dijk, M.; Morley, T.; Rau, M.L.; Saghai, Y. A meta-analysis of projected global food demand and population at risk of hunger for the period 2010–2050. Nat. Food 2021, 2, 494–501. [Google Scholar] [CrossRef]
- World Bank. A Year in the Lives of Smallholder Farmers. 2016. Available online: https://www.worldbank.org/en/news/feature/2016/02/25/a-year-in-the-lives-of-smallholder-farming-families (accessed on 21 December 2021).
- Mittal, S.; Mehar, M. Socio-economic factors affecting adoption of modern information and communication technology by farmers in India: Analysis using multivariate probit model. J. Agric. Educ. Ext. 2016, 22, 199–212. [Google Scholar] [CrossRef]
- Chaturvedi, R.K.; Joshi, J.; Jayaraman, M.; Govindasamy, B.; Ravindranath, N.H. Multi model climate change projections for India under representative concentration pathways. Curr. Sci. 2012, 103, 1–12. [Google Scholar]
- Rhee, J.; Im, J.; Carbone, G.J. Monitoring agricultural drought for arid and humid regions using multi-sensor remote sensing data. Remote Sens. Environ. 2010, 114, 2875–2887. [Google Scholar] [CrossRef]
- Wilhite, D.A.; Glanz, M.H. Understanding the drought phenomenon: The role of definitions. Water Int. 1989, 10, 111–120. [Google Scholar] [CrossRef] [Green Version]
- UNDRR. 2023. Available online: https://sendaiframework-mtr.undrr.org/about-sendai-framework-midterm-review (accessed on 25 December 2022).
- Parvaze, S.; Parvaze, S.; Ahmad, L. Meteorological Drought Quantification with Standardized Precipitation Index for Jhelum Basin in Kashmir Valley. Int. J. Adv. Res. Sci. Eng. 2018, 7, 688–697. [Google Scholar]
- Niranjan Kumar, K.; Rajeevan, M.; Pai, D.S.; Srivastava, A.K.; Preethi, B. On the observed variability of monsoon droughts over India. Weather Clim. Extrem. 2013, 1, 42–50. [Google Scholar] [CrossRef] [Green Version]
- IMD. Standard Operating Procedure (SOP) for Agromet Advisory Services. 2020. Available online: https://mausam.imd.gov.in/imd_latest/contents/pdf/gkms_sop.pdf (accessed on 20 February 2021).
- Kothiyal, S.; Singh, R.; Nain, A.; Padalia, H.; Chaturvedi, G. Verification of Medium Range Weather Forecast for Udham Singh Nagar Region in order to Improve Methodology Followed. Int. J. Curr. Microbiol. Appl. Sci. 2017, 6, 1995–2005. [Google Scholar] [CrossRef]
- Gao, B.C. NDWI—A normalized difference water index for remote sensing of vegetation liquid water from space. Remote Sens. Environ. 1996, 58, 257–266. [Google Scholar] [CrossRef]
- Das, S. Geographic information system and AHP-based flood hazard zonation of Vaitarna basin, Maharashtra, India. Arab. J. Geosci. 2018, 11, 576. [Google Scholar] [CrossRef]
- Nathan, K.K. Droughts in Tamil Nadu: A qualitative and quantitative appraisal. Drought Netw. News 1998, 10, 1–6. [Google Scholar]
- Stephen. Contingency and Compensatory Agriculture Plans for Droughts and Floods in India 2012. J. Acad. Ind. Res. 2012, 1, 59–67. [Google Scholar]
- Vengateswari, M.; Geethalakshmi, V.; Bhuvaneswari, K.; Jagannathan, R.; Panneerselvam, S. District level drought assessment over Tamil Nadu. Madras Agric. J. 2019, 106, 225–227. [Google Scholar] [CrossRef]
- Knutson, C.; Hayes, M.; Phillips, T. How to Reduce Drought Risk. A Guide Prepared by the Preparedness and Mitigation Working Group of the Western Drought Coordination Council. National Drought Mitigation Center, Lincoln, Nebraska. 1998. Available online: http://enso.unl.edu/ndmc/handbook/handbook.htm (accessed on 29 September 2021).
- Kokilavani, S.; Geethalakshmi, V.; Balasubramanian, T.N. Evaluation of Weather based Crop Insurance Products for Kharif Rice. Indian J. Sci. Technol. 2015, 8, 1866–1871. [Google Scholar] [CrossRef]
- Dhanya, P.; Jagannathan, R.; Cuba, P.; Jonnalagadda, S.S.; Geethalakshmi, V. Simulated aridity and climate related multi threats to the state of Telangana, South India. Int. J. Ecol. Environ. Sci. 2021, 3, 78–84. [Google Scholar]
- Mission Kakatiya Report. 2018. Available online: https://missionkakatiya.cgg.gov.in/ (accessed on 10 April 2020).
- Vijaya Kumar, P.; Subba Rao, A.V.M.; Sarath Chandran, M.A.; Venkatesh, H.; Rao, V.U.M.; Srinivasa, C. Micro–level Agromet advisory services using block level weather forecast—A new concept–based approach. Curr. Sci. 2017, 112, 227–228. [Google Scholar]
- Srinivasarao, C.; Rao, K.V.; Gopinath, K.A.; Prasad, Y.G.; Arunachalam, A.; Ramana, D.B.V.; Chary, G.R.; Gangaiah, B.; Venkateswarlu, B.; Mohapatra, T. Chapter Two—Agriculture contingency plans for managing weather aberrations and extreme climatic events: Development, implementation and impacts in India. In Advances in Agronomy; Spark, D.L., Ed.; Academic Press: Cambridge, MA, USA, 2020; Volume 159, pp. 35–91. [Google Scholar] [CrossRef]
- Patel, H.R.; Sheikh, A.M.; Venkatesh, H. Status of present day weather forecasting to farmers: A case study of middle Gujarat region. Ann. Agric. Res. 1998, 19, 285–289. [Google Scholar]
- Chaubey, D.; Prakash, V.; Patel, A.B.; Yadav, T.C. Role of Agro-Meteological Advisory Services on Risk Mitigation in Agriculture. Int. J. Pure Appl. Biosci. 2018, 6, 27–32. [Google Scholar]
- Dumanski, J.; Peiretti, R.; Benetis, J.; McGarry, D.; Pieri, C. The paradigm of conservation tillage. Proc. World Assoc. Soil Water Conserv. 2006, P1, 58–64. [Google Scholar]
- Manatsa, D.; Unganai, L.; Gadzirai, C.; Behera, S.K. An innovative tailored seasonal rainfall forecasting production in Zimbabwe. Nat. Hazards 2012, 64, 1187–1207. [Google Scholar] [CrossRef]
- Nyadzi, E.; Nyamekye, A.B.; Werners, S.E.; Biesbroek, R.G.; Dewulf, A.; Van Slobbe, E.; Long, H.P.; Termeer, C.J.; Ludwig, F. Diagnosing the potential of hydro-climatic information services to support rice farming in northern Ghana NJAS-Wageningen. J. Life Sci. 2018, 86, 51–63. [Google Scholar] [CrossRef]
- Hyman, G.; Barona, E.; Biradar, C.; Guevara, E.; Dixon, J.; Beebe, S.; Castano, S.; Alabi, T.; Krishna Gumma, M.; Sivasankar, S.; et al. Atlas DCL CGIAR—Research Program on Dryland Cereals and Legumes Agri-Food Systems (DCL); Harvard Dataverse: Cambridge, MA, USA, 2022. [Google Scholar] [CrossRef]
- Nanditha, J.S.; van der Wiel, K.; Bhatia, U.; Stone, D.; Selton, F.; Mishra, V. A seven-fold rise in the probability of exceeding the observed hottest summer in India in a 2 °C warmer world. Environ. Res. Lett. 2020, 15, 044028. [Google Scholar]
- Lobo, C.; Chattopadhyay, N.; Rao, K. Making smallholder farming climatesmart. Econ. Political Wkly. 2017, 52, 53–58. [Google Scholar]
- Jagadeesha, N.; Ravindrababu, B.T.; Pankaja, H.K.; Rajegowda, M.B. Adoption of Agromet Advisory Services (AAS) for improving livelihood of rural farmers. Int. J. Agric. Sci. 2010, 6, 584–586. [Google Scholar]
- Kalanda-Joshua, M.; Ngongondo, C.; Chipeta, L.; Mpembeka, F. Integrating indigenous knowledge with conventional science: Enhancing localized climate and weather forecasts in Nesa, Malunje, Malawi. Phys. Chem. Earth 2011, 36, 996–1003. [Google Scholar] [CrossRef]
- Kenneth, I.; Cheng, H.W.J.; Kristinn, S.H.; Marcelo, L. Frontier Technologies for Smallholder Farmers: Addressing Information Asymmetries and Deficiencies. Frontier Technology Issues, Department of Economic and Social Affairs, United Nation. 2021. Available online: https://bit.ly/UNDESAfrontiertech (accessed on 3 December 2022).
- Lazo, J.K. Survey of Mozambique Public on Weather, Water, and Climate Information; Technical Notes NCAR/TN-521+ STR; National Center for Atmospheric Research: Boulder, CO, USA, 2015. [Google Scholar]
- Gokceoglu, C.; Sonmez, H.; Nefeslioglu, H.A.; Duman, T.Y.; Can, T. The 17 March 2005 Kuzulu landslide (Sivas, Turkey) and landslidesusceptibility map of its near vicinity. Eng. Geol. 2005, 81, 65–83. [Google Scholar] [CrossRef]
- Pande, C.B.; Al-Ansari, N.; Kushwaha, N.L.; Srivastava, A.; Noor, R.; Kumar, M.; Moharir, K.N.; Elbeltagi, A. Forecasting of SPI and Meteorological Drought Based on the Artificial Neural Network and M5P Model Tree. Land 2022, 11, 2040. [Google Scholar] [CrossRef]
- Machingura, F.; Nyamwanza, A.; Hulme, D.; Stuart, S. Climate information services, integrated knowledge systems and the 2030 Agenda for Sustainable Development. Sustain. Earth 2018, 1, 1–7. [Google Scholar] [CrossRef]
- Maponya, P.; Mpandeli, S.; Oduniyi, S. Climate change awareness in Mpumalanga, province, South Africa. J. Agric. Sci. 2013, 5, 273–285. [Google Scholar] [CrossRef] [Green Version]
- Pulwarty, R.S.; Sivakumar, M.V.K. Information systems in a changing climate: Early warnings and drought risk management. Weather Clim. Extrem. 2014, 3, 14–21. [Google Scholar] [CrossRef] [Green Version]
- McKee, T.B.N.; Doesken, J.; Kleist, J. The relationship of drought frequency and duration to time scales. In Proceedings of the Eighth Conference on Applied Climatology, Anaheim, CA, USA, 17–22 January 1993; pp. 179–184. [Google Scholar]
- Stigter, K.; Winarto, Y.T.; Ofori, E.; Zuma-Netshiukhwi, G.N.; Nanja, D.; Walker, S. Extension agrometeorology as the answer to stakeholder realities: Response farming and the consequences of climate change. Special Issue on Agrometeorology: From Scientific Analysis to Operational Application. Atmosphere 2013, 4, 237–253. [Google Scholar] [CrossRef] [Green Version]
- The Energy and Resources Institute (TERI). Economics of Desertification, Land Degradation and Drought in India: Vol. 1. Macroeconomic Assessment of the Costs of Land Degradation in India. 2016. Available online: https://www.teriin.org/sites/default/files/2018-04/Vol-I%20Macroeconomic%20assessment%20of%20the%20costs%20of%20land%20degradation%20in%20India_0.pdf (accessed on 7 March 2021).
- Available online: https://climate-adapt.eea.europa.eu/en/metadata/case-studies (accessed on 2 February 2023).
- Available online: https://edo.jrc.ec.europa.eu/edov2/ (accessed on 15 February 2023).
- Meque, A.; Abiodun, B.J. Simulating the link between ENSO and summer drought in Southern Africa using regional climate models. Clim. Dyn. 2015, 44, 1881–1900. [Google Scholar] [CrossRef]
- Shukla, S.; Landsfeld, M.; Anthony, M.; Budde, M.; Husak, G.J.; Rowland, J.; Funk, C. Enhancing the Application of Earth Observations for Improved Environmental Decision-Making Using the Early Warning eXplorer (EWX). Front. Clim. 2021, 2, 583509. [Google Scholar] [CrossRef]
- Karnieli, A.; Agam, N.; Pinker, R.T.; Anderson, M.; Imhoff, M.L.; Gutman, G.G.; Panov, N.; Goldberg, A. Use of NDVI and land surface temperature for drought assessment: Merits and limitations. J. Clim. 2010, 23, 618–633. [Google Scholar] [CrossRef]
- U.S. Drought Monitor Forum. Available online: https://droughtmonitor.unl.edu/ (accessed on 18 February 2023).
- IWMI Research Report on Mapping Drought Patterns and Impacts: A Global Perspective. Available online: https://www.iwmi.cgiar.org/Publications/IWMI_Research_Reports/PDF/PUB133/RR133.pdf (accessed on 18 February 2023).
Figure 1.
Drought risk vulnerability realm.

Figure 2.
The significance of DEW as a weather smart option in climate change and agriculture adaptation (CCAA) (Source: Author Formulated).
Figure 2.
The significance of DEW as a weather smart option in climate change and agriculture adaptation (CCAA) (Source: Author Formulated).

Figure 3.
District-wise difference in rainfall distribution from the state’s mean over 1970 to 2017.
Figure 3.
District-wise difference in rainfall distribution from the state’s mean over 1970 to 2017.

Figure 4.
Mandal-wise difference in rainfall distribution from the state’s mean from 1970 to 2014.

Figure 5.
District-wise difference in rainfall distribution from the state’s mean from 1981 to 2019.
Figure 5.
District-wise difference in rainfall distribution from the state’s mean from 1981 to 2019.

Figure 6.
Utility of AAS in specific farm operations (Source: Author formulated from in-depth interviews).
Figure 6.
Utility of AAS in specific farm operations (Source: Author formulated from in-depth interviews).

Figure 7.
Mean NDVI for groundnut crop growing period, Khariff season (June to September 2021) in PAP.
Figure 7.
Mean NDVI for groundnut crop growing period, Khariff season (June to September 2021) in PAP.

Figure 8.
Mean NDVI for groundnut crop growing period, Rabi season (2021) in PAP.

Figure 9.
Mean NDWII for groundnut, Khariff growing season (June to September 2021).

Figure 10.
Mean NDWI for maize growing season Rabi (October to January 2021).

Figure 11.
Topographical wetness index for PAP, 2021.


Table 1.
Classification of vegetation types (area in acres) NDVI, 2021, variations during a normal year and drought year in PAP.
Table 1.
Classification of vegetation types (area in acres) NDVI, 2021, variations during a normal year and drought year in PAP.
| Sl.No | Vegetation Catogaries | Khariff2021 | Khariff2016 | Difference (%) | Rabi2021 | Rabi-2016 | Difference (%) |
| 1 | Barren land | 695.40487 | 2998.8038 | −76.8106 | 4930.524 | 8880.031 | −44.4763 |
| 2 | Low Vegetation | 75140.717 | 206007.23 | −63.5252 | 305519.7 | 189453.7 | 61.26349 |
| 3 | Medium Vegetation | 267719.77 | 139096.09 | 92.47109 | 259649 | 231002.9 | 12.40077 |
| 4 | High Vegetation | 245889.92 | 241028.94 | 2.016762 | 157319.8 | 153873.9 | 2.239421 |
Table 2.
The mean TWI category in the basin.
| Sl.No | TWI Category Range | Area (Km2) | Area (%) |
| 1 | Below 2 | 8.54 | 0.36 |
| 2 | 2–4 | 18.38 | 0.77 |
| 3 | 4–6 | 676.31 | 28.36 |
| 4 | 6–8 | 1136.25 | 47.64 |
| 5 | Above 8 | 545.44 | 22.87 |
| Total | 2384.92 | 100 |
Disclaimer/Publisher’s Note: The statements, opinions and data contained in all publications are solely those of the individual author(s) and contributor(s) and not of MDPI and/or the editor(s). MDPI and/or the editor(s) disclaim responsibility for any injury to people or property resulting from any ideas, methods, instructions or products referred to in the content. |
© 2023 by the authors. Licensee MDPI, Basel, Switzerland. This article is an open access article distributed under the terms and conditions of the Creative Commons Attribution (CC BY) license (https://creativecommons.org/licenses/by/4.0/).
Share and Cite
MDPI and ACS Style
Dhanya, P.; Geethalakshmi, V. Reviewing the Status of Droughts, Early Warning Systems and Climate Services in South India: Experiences Learned. Climate 2023, 11, 60. https://doi.org/10.3390/cli11030060
AMA Style
Dhanya P, Geethalakshmi V. Reviewing the Status of Droughts, Early Warning Systems and Climate Services in South India: Experiences Learned. Climate. 2023; 11(3):60. https://doi.org/10.3390/cli11030060
Chicago/Turabian StyleDhanya, Punnoli, and Vellingiri Geethalakshmi. 2023. "Reviewing the Status of Droughts, Early Warning Systems and Climate Services in South India: Experiences Learned" Climate 11, no. 3: 60. https://doi.org/10.3390/cli11030060
Note that from the first issue of 2016, this journal uses article numbers instead of page numbers. See further details here.