Review

Cut-Off Lows over South Africa: A Review

by
Nkosinathi G. Xulu
1,*,
Hector Chikoore
2,
Mary-Jane M. Bopape
3,
Thando Ndarana
4,
Tshimbiluni P. Muofhe
5,
Innocent L. Mbokodo
6,
Rendani B. Munyai
7,
Mukovhe V. Singo
8,
Tumelo Mohomi
2,
Sifiso M. S. Mbatha
6 and
Marshall L. Mdoka
1
1
Department of Geography and Environmental Studies, University of Zululand, KwaDlangezwa 3886, South Africa
2
Department of Geography and Environmental Studies, University of Limpopo, Sovenga 0727, South Africa
3
South African Environmental Observation Network, National Research Foundation, Pretoria 0083, South Africa
4
Department of Geography, Geoinformatics and Meteorology, University of Pretoria, Hatfield 0028, South Africa
5
Global Change Institute, University of the Witwatersrand, Johannesburg 2000, South Africa
6
Climate Services, South African Weather Service, Private Bag X097, Pretoria 0001, South Africa
7
Department of Social Sciences Education and Economic Management Education, University of Limpopo, Sovenga 0727, South Africa
8
Department of Geography and Environmental Sciences, University of Venda, Thohoyandou 0950, South Africa
*
Author to whom correspondence should be addressed.
Climate 2023, 11(3), 59; https://doi.org/10.3390/cli11030059
Submission received: 3 February 2023 / Revised: 25 February 2023 / Accepted: 2 March 2023 / Published: 5 March 2023

Abstract

:
Every year, cut-off low (COL) pressure systems produce severe weather conditions and heavy rainfall, often leading to flooding, devastation and disruption of socio-economic activities in South Africa. COLs are defined as cold-cored synoptic-scale mid-tropospheric low-pressure systems which occur in the mid-latitudes and cause persistent heavy rainfall. As they occur throughout the year, these weather systems are important rainfall producing systems that are also associated with extreme cold conditions and snowfalls. An in-depth review of COLs is critical due to their high impacts which affect some parts of the country regularly, affecting lives and livelihoods. Here, we provide a comprehensive review of the literature on COLs over the South African domain, whilst also comparing them with their Southern Hemisphere counterparts occurring in South America and Australia. We focus on the occurrence, development, propagation, dynamical processes and impacts of COLs on society and the environment. We also seek to understand stratospheric–tropospheric exchanges resulting from tropopause folding during the occurrence of COLs. Sometimes, COLs may extend to the surface, creating conditions conducive to extreme rainfall and high floods over South Africa, especially when impinged on the coastal escarpment. The slow propagation of COLs appears to be largely modulated by a quasi-stationary high-pressure system downstream acting as a blocking system. We also reviewed two severe COL events that occurred over the south and east coasts and found that in both cases, interactions of the low-level flow with the escarpment enhanced lifting and deep convection. It was also determined from the literature that several numerical weather prediction models struggle with placement and amounts of rainfall associated with COLs, both near the coast and on the interior plateau. Our study provides the single most comprehensive treatise that deals with COL characteristics affecting the South African domain.

1. Introduction

South Africa is located on the southernmost tip of Africa and is predominantly a semi-arid region with high rainfall variability, characterised by frequent extreme weather events. The country is also widely recognised as one of the most vulnerable to climate change due to the low levels of adaptive capacity (particularly among rural communities), combined with a high dependence on rain-fed agriculture [1]. The subcontinent is surrounded by the warm southwest Indian Ocean in the east and the cold South Atlantic Ocean in the west. The disparity in ocean currents is partly responsible for the spatial gradients of rainfall such that arid conditions in the west (cold Benguela current) give way to a subhumid climate in the east (warm Agulhas current). The southwest Indian Ocean plays a vital role in rainfall over South Africa as it is a major source of moisture for the region, transported onshore by trade winds from the Mascarene High pressure system [2]. Furthermore, the spatial vegetation and soil moisture conditions evidently reflect the same west–east gradient over southern Africa.
Most rainfall occurs during the austral summer, but the southwest and coastal regions experience significant rainfall in winter. Several weather systems bring rainfall to the region in summer, including cloud bands from tropical–temperate troughs [3], mesoscale convective systems [4], tropical continental lows [5], and tropical cyclones from the southwest Indian Ocean and Mozambique Channel [6]. During the austral winter, cold fronts, ridging anticyclones [7] and cut-off lows (COLs) are also significant producers of rainfall, especially over the southern districts of South Africa [7,8,9]. Cut-off lows are unique not only due to their severity and impacts but also because they occur throughout the year [8].
This research focuses on a comprehensive review of the literature on characteristics of COLs from a regional perspective, critically evaluating the existing knowledge whilst establishing possible gaps. The paper is organised into thematic areas and begins by defining COLs and understanding the seasonality and contribution of COLs to annual rainfall over South Africa. The historical impacts of COLs are detailed and the treatment of numerical weather prediction (NWP) models is also evaluated (Figure 1).

2. Defining Cut-Off Lows

The definition of COL weather systems varies throughout the literature. They have been defined as cold-cored synoptic-scale mid-tropospheric low-pressure systems which occur in the mid-latitudes but extend to the subtropics, accounting for major severe rainfall and cold events [10,11]. COLs occur when they become isolated from the westerlies and are displaced equatorward [12]. Others define COLs as quasi-stationary, short-lived weather systems [13] that form and develop within the westerly wave, equatorward of the polar jet-stream, forming closed cyclonic circulations in the middle and upper troposphere [9,14]. Due to consistent COL features, most studies define COLs as closed circulations at 500 hPa [15,16] and between 200 and 300 hPa [8,16,17,18,19]. Rainfall in the subtropical regions is influenced by COLs, one of the major synoptic-scale systems [8].
COLs form as low atmospheric pressure regions without a closed isobaric contour in the upper levels. The systems result from deep moist convection caused by cold air aloft (depression) and are detached from the westerlies visualised through an equatorward cyclonic segregation at 500 hPa [19,20]. Through this development, COLs form a closed low system detaching from the westerly wave extending towards the surface, causing unstable and severe weather conditions (i.e., thunderstorms, strong winds, heavy rain, hail or snow [21].
The life cycle of a COL is characterised by four stages as determined by Nieto et al. [17] for the Northern Hemisphere and adapted to Southern Hemispheric COLs by Robeita et al. [16]. The first stage is the development of an upper-level trough and a temperature wave found west of the geopotential wave. The second stage involves the detachment from the westerly wave also referred to as the tear-off stage. The third stage involves the cold air penetrating the centre of the trough moves equatorward independently and is also referred to as the cut-off stage. When the COL dissipates and merges with a deep trough in the westerly zonal jet, this is known as the fourth stage of the weather system [22].
While most weather systems are ‘travelling’ disturbances, a cut-off low is unique as it is slow-moving, resulting in the persistence of anomalous weather conditions for up to 3–4 days on average [8,23]. In some cases that affect southern Africa, the westerly wave develops a blocking high over the Indian Ocean, resulting in COLs developing behind it [24]. Over South Africa, mid-tropospheric COLs are often accompanied by surface ridging anticyclones. Ridging occurs when a South Atlantic anticyclone (St Helena High) extends or propagates eastwards around the southern Africa landmass. Two types of ridging anticyclones have been identified over the South African domain, being equatorward (Type N) or poleward (Type S) of the 40S latitude [25]. When COLs extend to a surface low with no presence of a ridging anticyclone, they have been found to cause more extreme weather conditions [22]. COLs that are linked to surface lows over South Africa are frequent during autumn, over high latitudes and are sprightly and long-lived [8,22].
Quasi-stationary subtropical anticyclones are characterised by minimal frontal activity and weak pressure gradients [24]. The system can be centred over southern Africa and mostly influences subsidence and settled weather over most parts. However, when located south or southwest of the subcontinent, the system can be termed ridging, causing widespread unsettled weather over the eastern coastal areas.
As COLs occur in westerly waves where cold frontal systems are located, they occur throughout the year over South Africa, though with an autumn (March–May) maximum and a secondary peak during the austral spring from September to November [8]. In spring (from September to October or November), COL rainfall is more intense and widespread over the region. In South Africa, the contribution of COL to annual rainfall is significantly higher during the spring and autumn months [9], with the Eastern Cape Province in the south most frequently affected by COL landfalls and heavy rainfall [26].

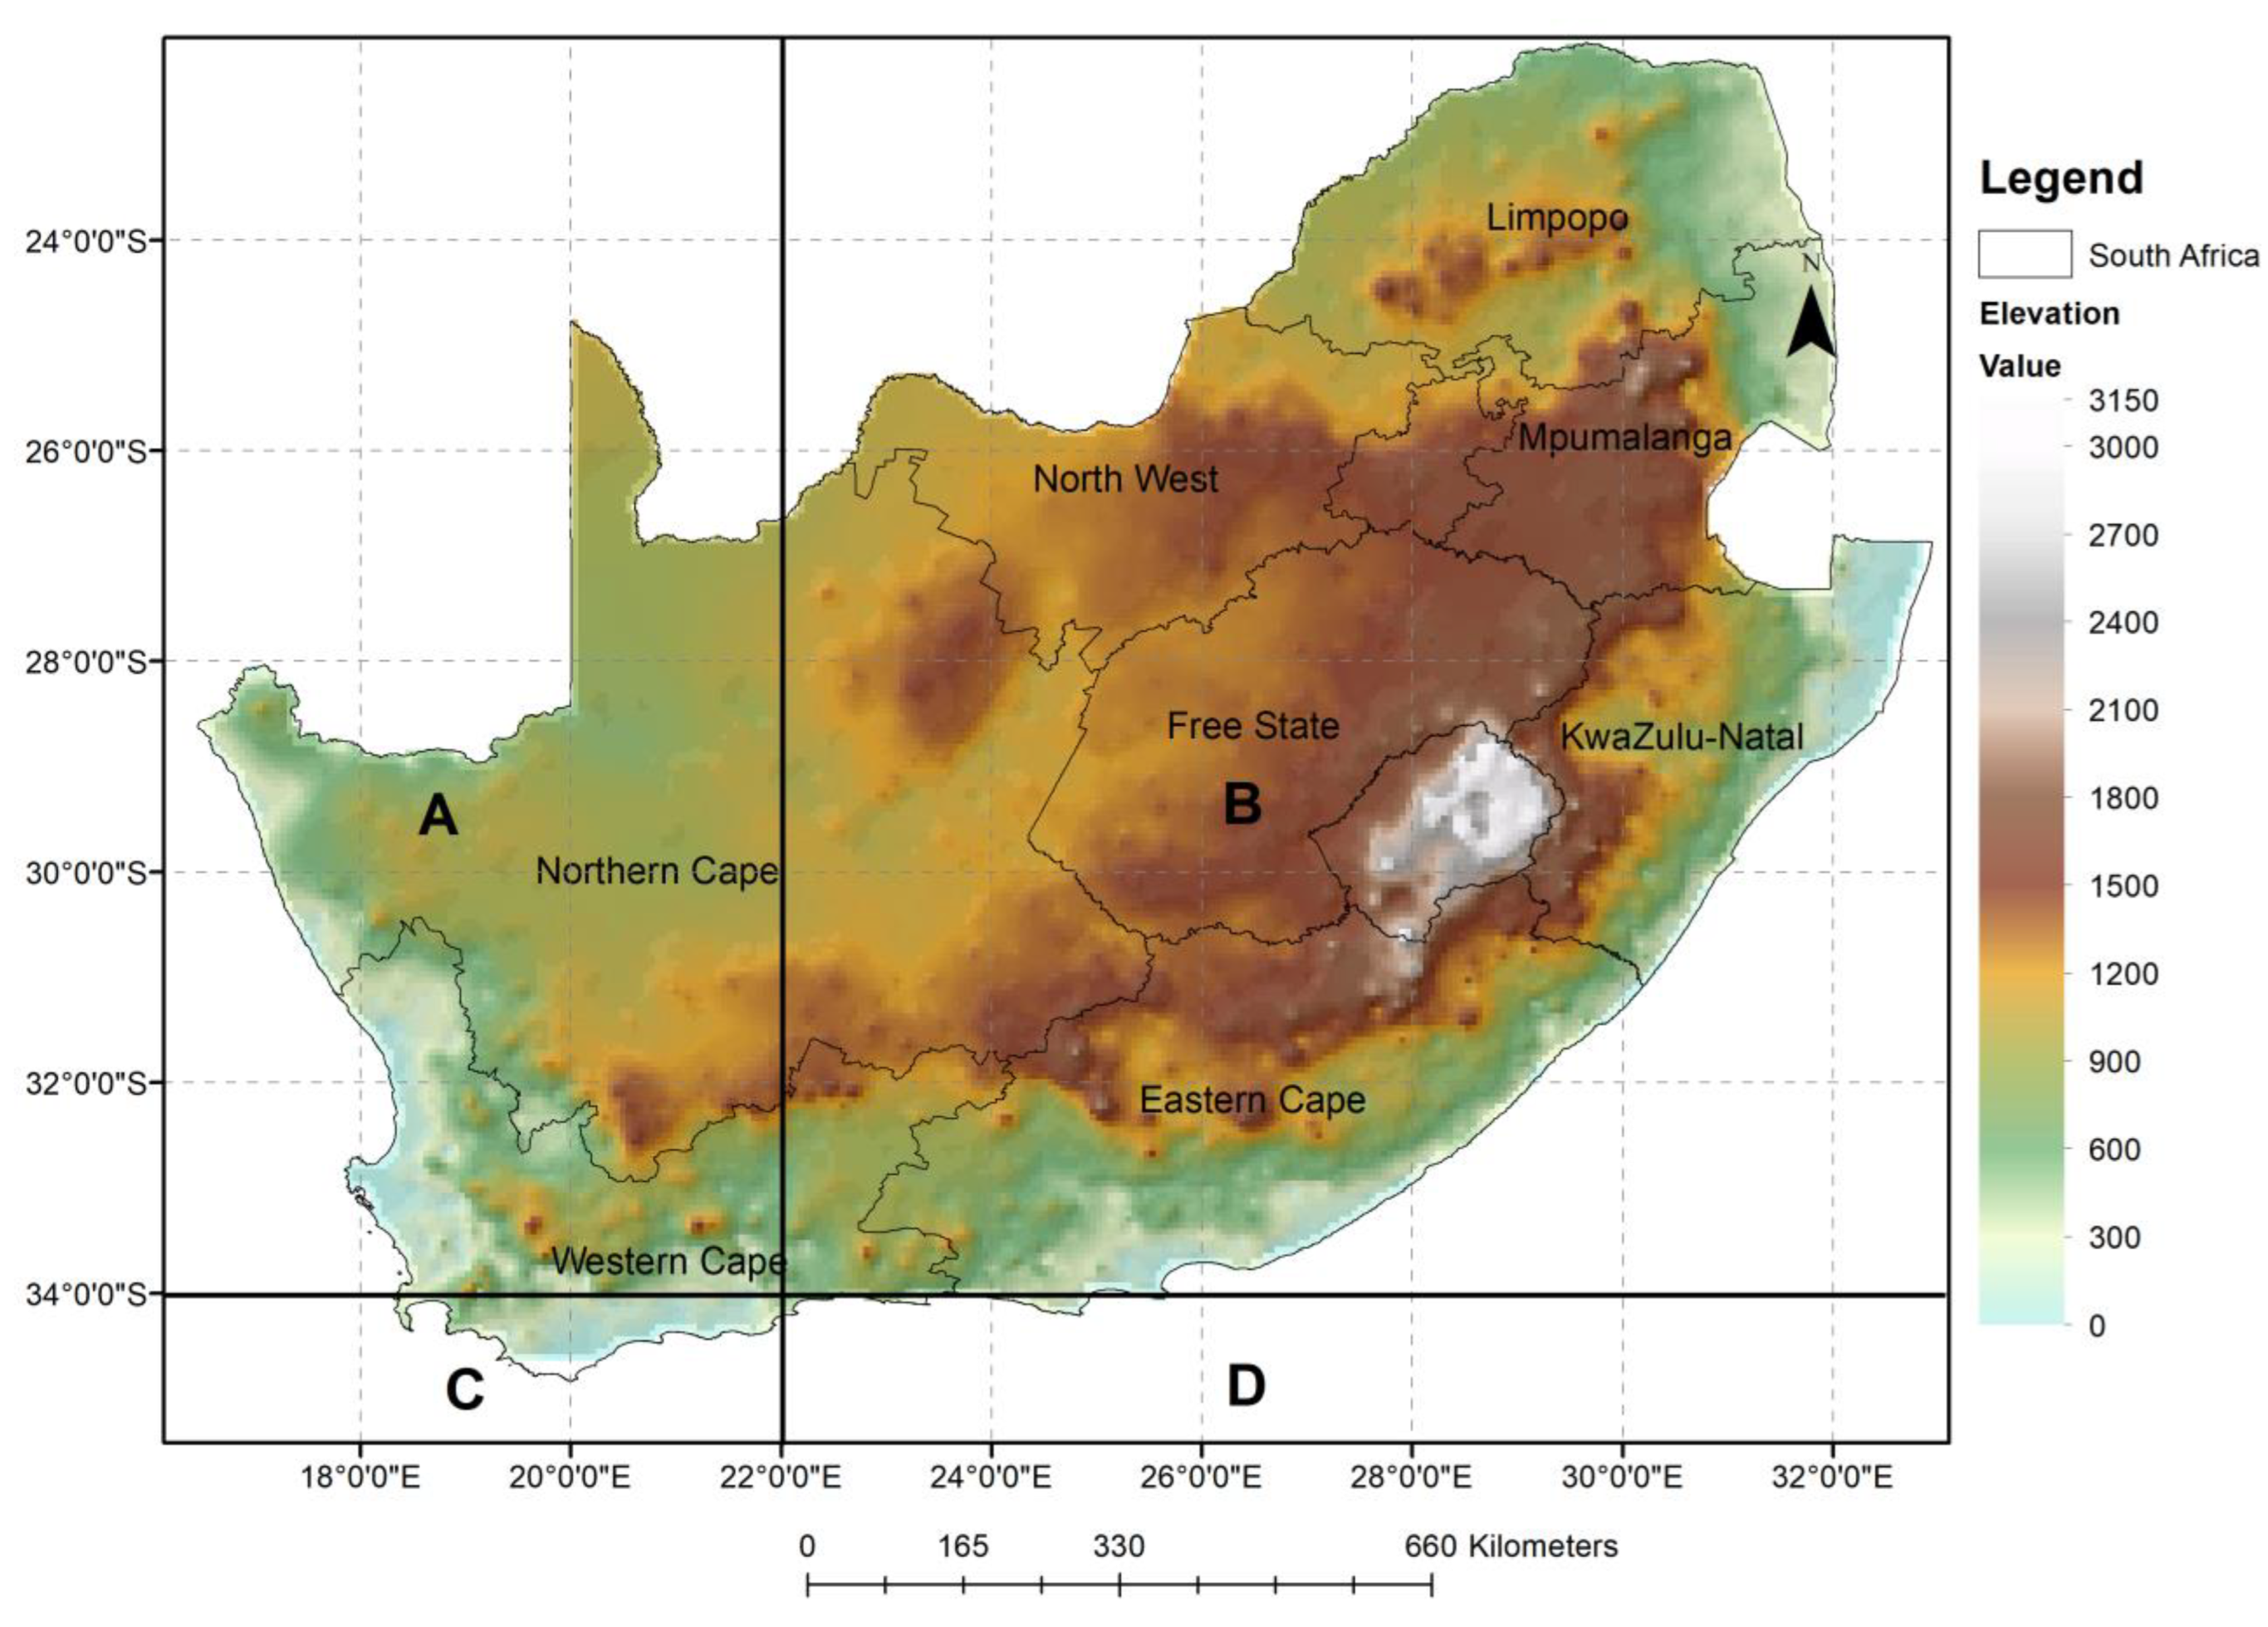
3. Description of Study Area

This study mainly focused on South Africa, which is located on the southern tip of southern Africa and bounded by disparate ocean currents over the Atlantic and Indian Oceans (Figure 2). In the southern Africa region, South Africa is the most affected by COLs, which often lead to severe socio-economic impacts. COLs occasionally bring extreme rainfall to the south of Namibia, Botswana and Zimbabwe, following Singleton and Reason [8]. As shown in Figure 1, COLs exhibit different structures depending on whether they occur over polar, mid-latitudes or tropical latitudes [27]. Over the Southern Hemisphere, COLs also affect the continents of South America and Australia. They are responsible for 50% of April–October rainfall, and 80% of daily rainfall in southeastern Australia [28,29], increasing the frequency of heavy rainfall when compared to other weather systems [30,31]. In Australia, COLs are the second highest distinct synoptic weather system contributor of rainfall dominating the interannual variability [30,31,32,33], and are most frequent during the positive phase of the Southern Annular Mode [18]. Although southern Africa has the lowest number of COL occurrences [16,20,34], intense COLs have been responsible for extreme rainfall events over the subcontinent. It is also noted that studies on COLs over the Southern Hemisphere have increased over the years.
The complex topography of South Africa, characterised by a steep coastal escarpment and a high inland plateau (Figure 2), affects the atmospheric circulation, strongly influencing the occurrence and modification of COLs [10,35,36]. COLs that are located above topographic gradients due to elevated escarpments are affected by orographic forcing, which enhances lifting, resulting in deep convection. Sometimes, low-level jets impinge on the escarpment during COL events or cloud bands, resulting in extreme rainfall and flooding [26,37].

4. Seasonality and Contribution of COLs to Annual Rainfall over South Africa

COLs occur throughout the year, with an average of approximately 11 making landfall over South Africa in a year [8,38]. Despite an all-year climatology, COLs are most frequent during the transition seasons: March–April–May and September–October–November [8]. Comparatively, in the southern Australian region, COLs are most frequent during the period from May to October [39]. In South America (i.e., Peru, Chile, Argentina) they occur frequently in spring and autumn over the region 68–80° W and 30–45° S, with most occurrences in the Pacific region, followed by the Atlantic and continental regions [40,41]. COLs are likely to produce heavy rainfall across parts of South Africa when they occur [9] and contribute significantly to the annual accumulation of rainfall in South Africa. The movement of COLs occurring in the tropics has been found to be more erratic as they tend to move in a westerly direction or decay with an equatorward trajectory [9].

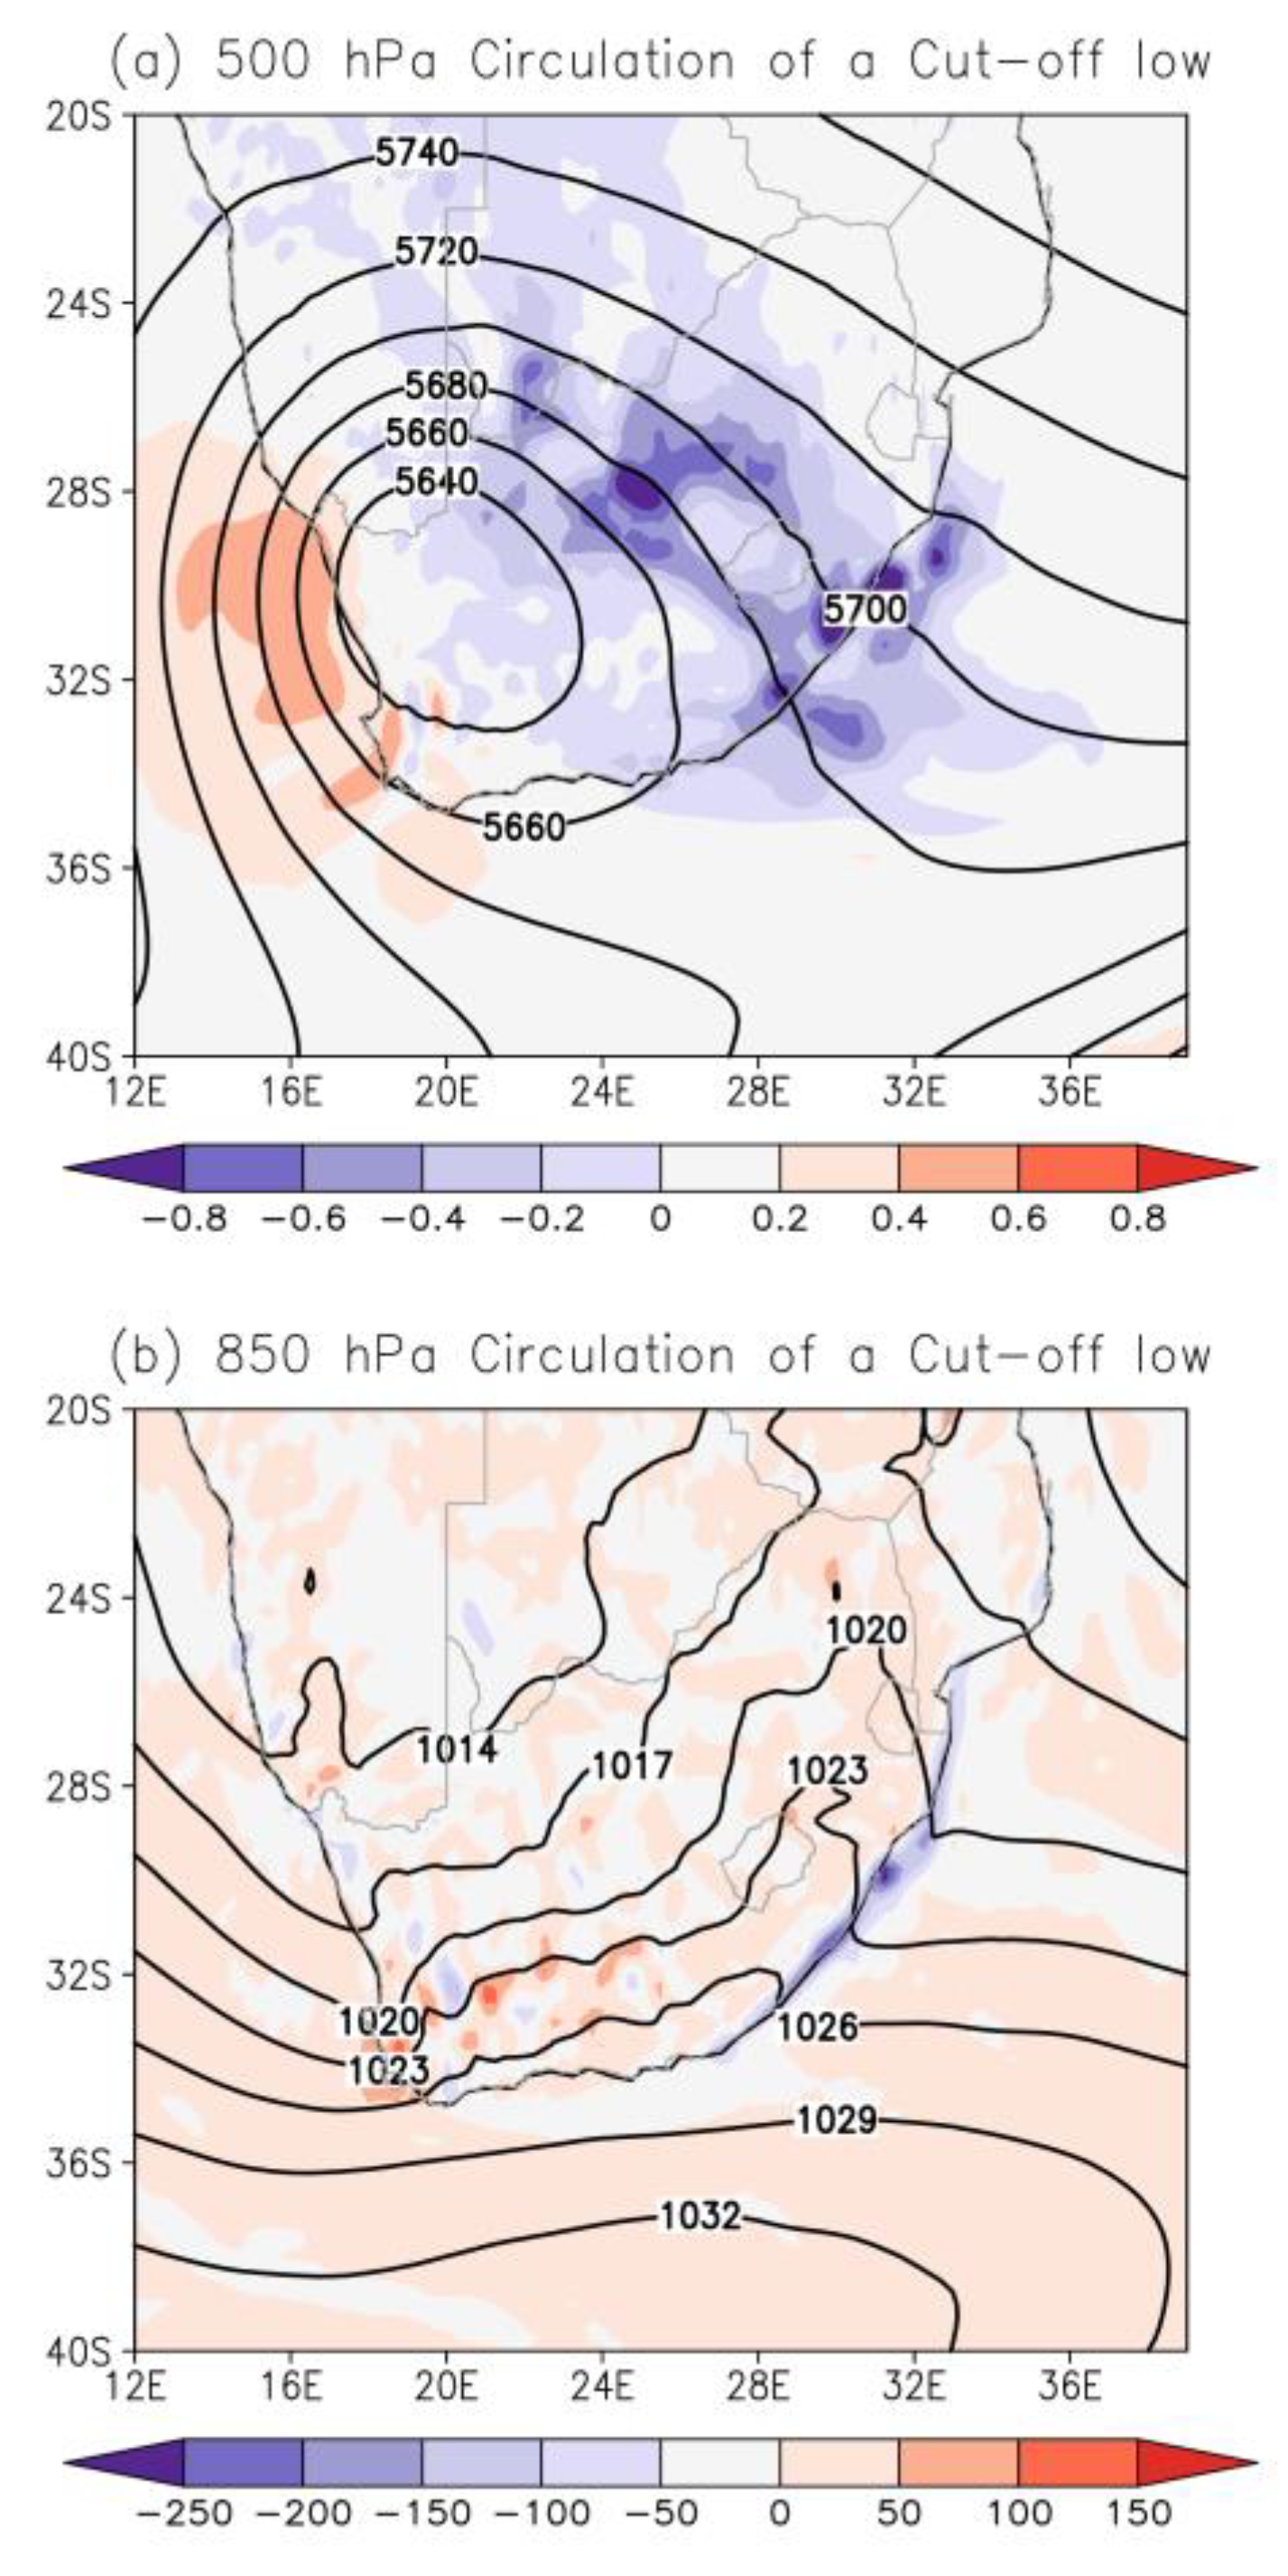
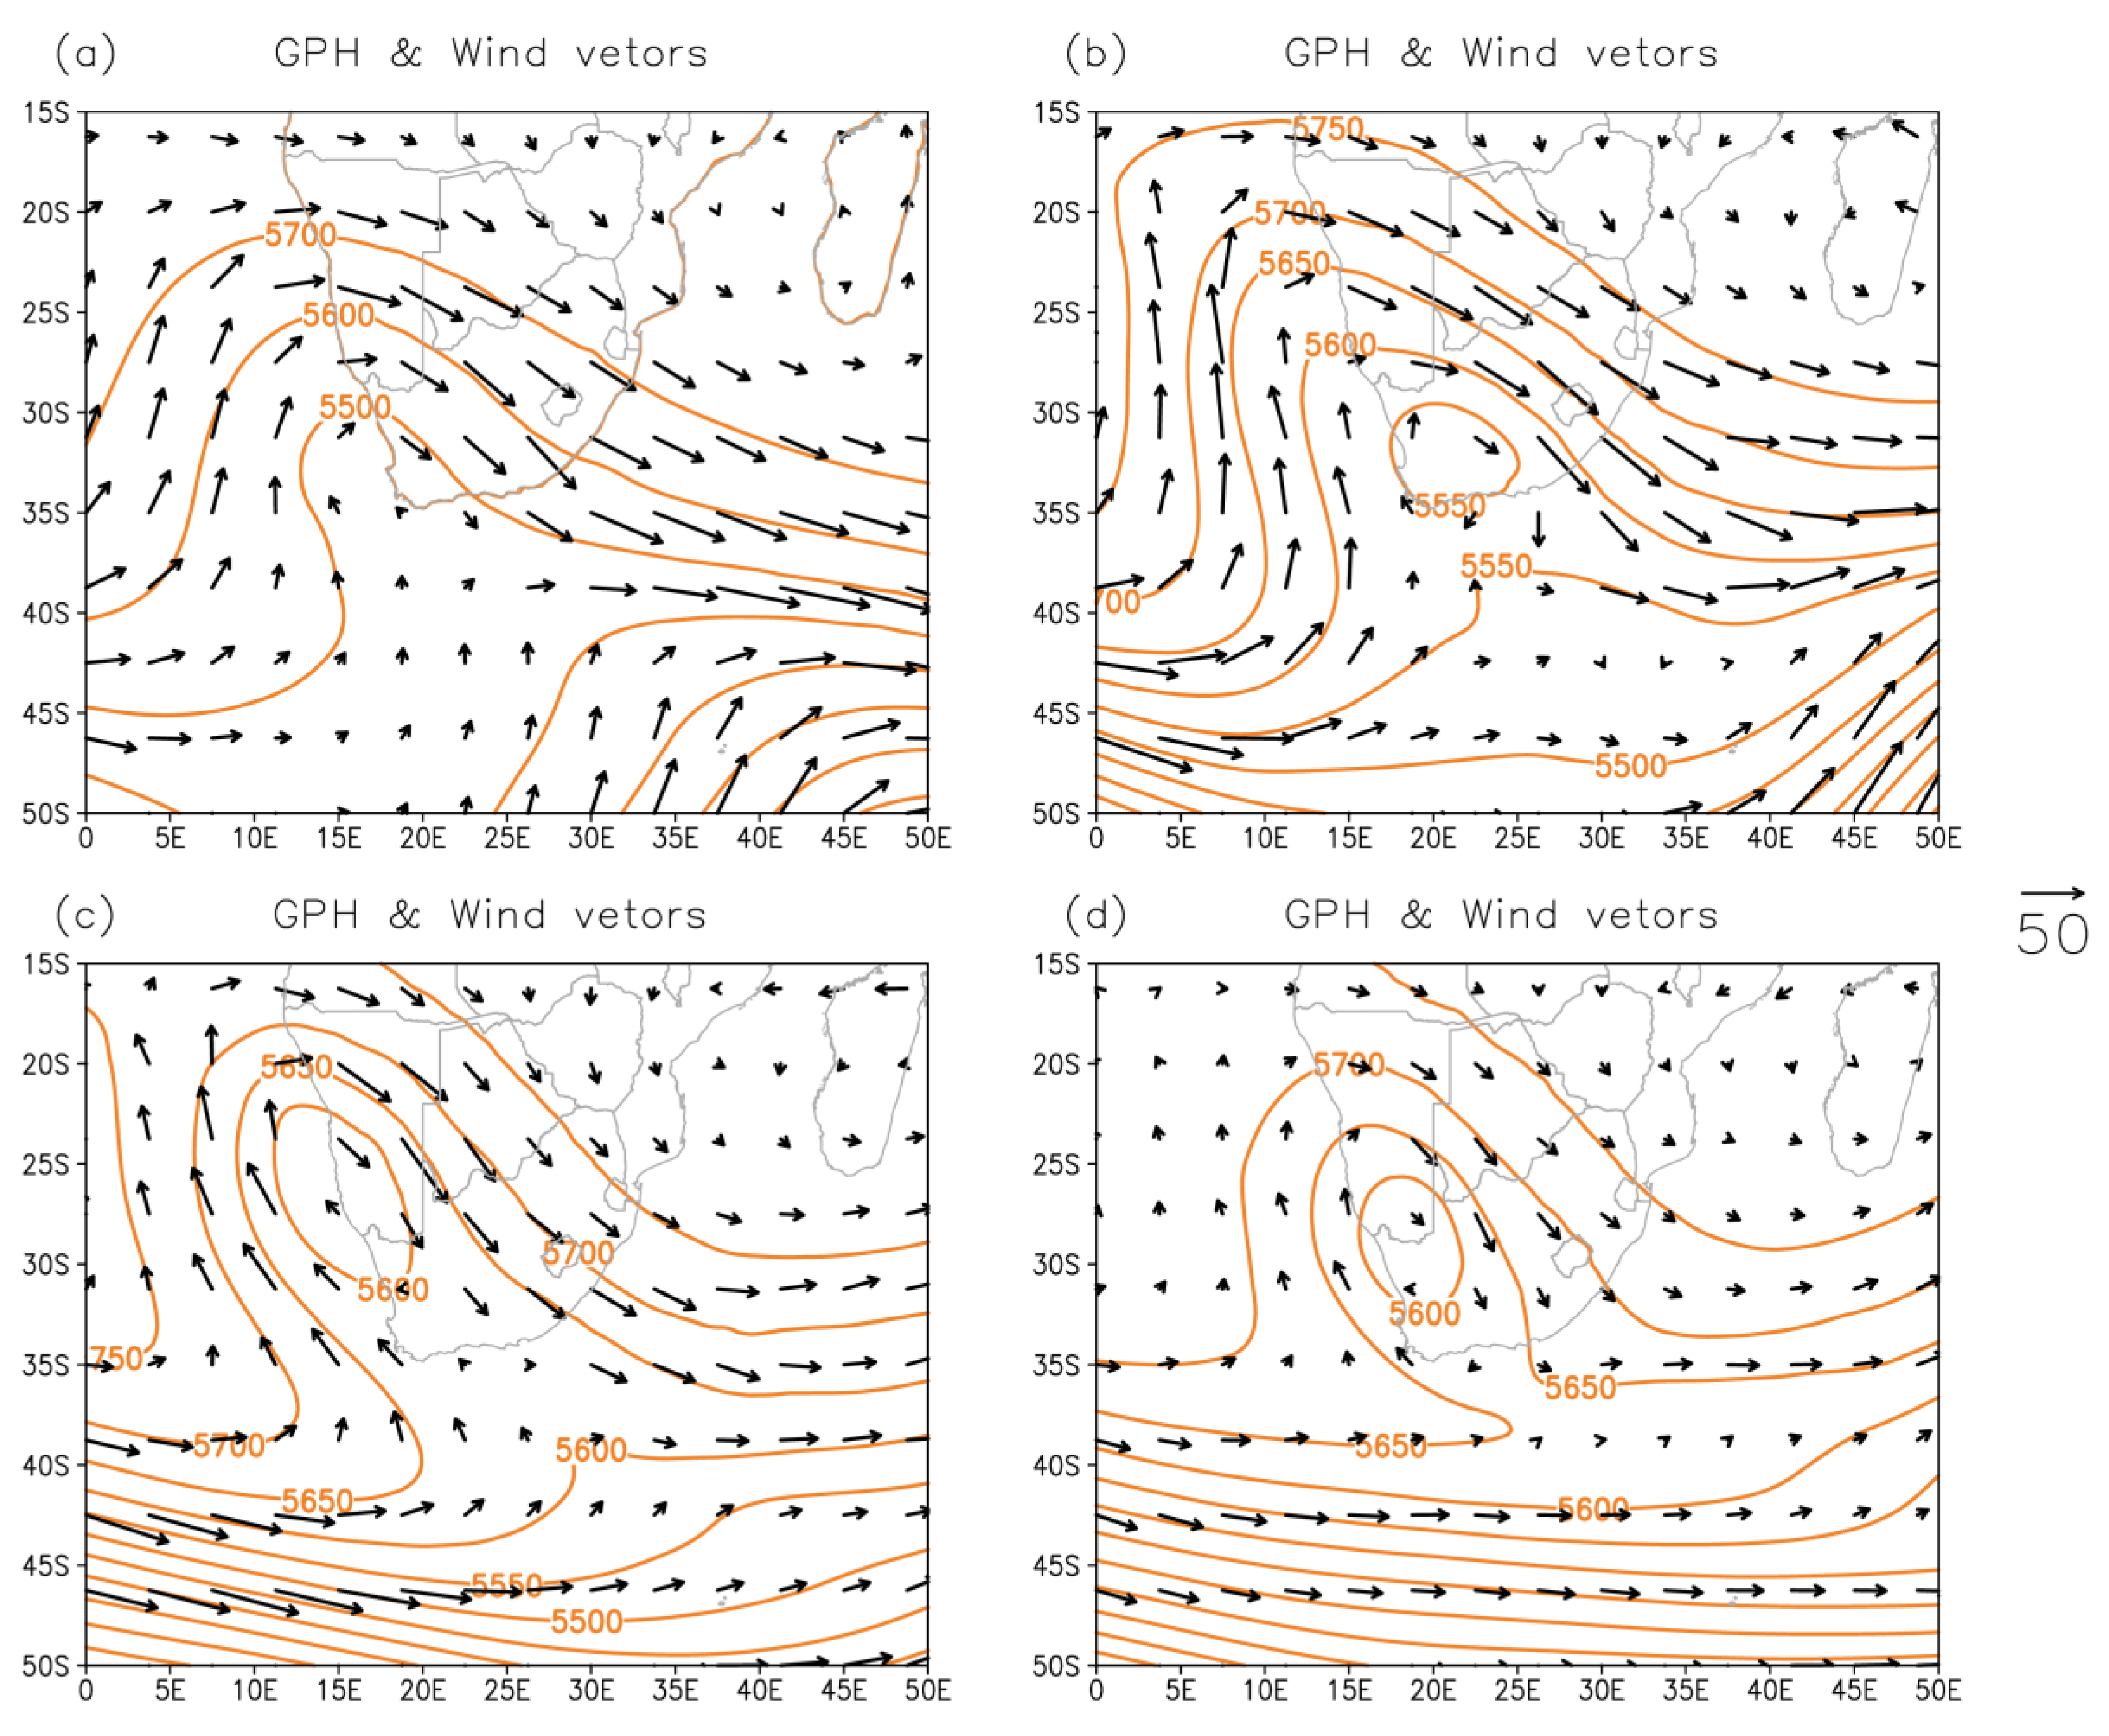
5. Dynamical Processes and Upper-Air Interactions during COLs

Typically, COLs occur in the upper air in the presence of a ridging anticyclone at the surface, with low-level convergence and enhanced lifting in the mid-troposphere (Figure 3). The development of COLs is usually due to the presence of unstable baroclinic Rossby waves (RWs) [9,41,42,43] that form due to the rotation of the planet. RWs (or planetary waves) are identified by their horizontal uniformity, whereby air particles move in a north–south direction with latitudinal circular propagation [24].
RWs can continue to be sufficiently unstable, forming vortices (i.e., depressions, COLs or blocking anticyclones). They are a dominant component of the Ferrel circulation. The existence of these waves explains the low-pressure cells (cyclones) and high-pressure cells (anticyclones) that are important in producing the weather of the middle and higher latitudes.
The closed cyclonic circulation results from a high potential vorticity (PV) anomaly [44] that is caused by the isentropic transport of high PV stratospheric air, which in turn is associated with upper-tropospheric Rossby wave breaking (RWB) processes [34]. COLs are characterised as closed geopotential height contours in the middle levels, associated with significant potential vorticity (PV) anomalies cut off from the stratosphere due to RWB [34,45]. The occurrence of high PV anomalies and RWB in the troposphere is associated with COLs [17,46,47]. RWB is a rapid and irreversible transformation of PV contours [48]. PV anomalies result from the invasion of high PV stratospheric air transported isoentropically and equatorially into the upper troposphere [49].
The upper layers of the troposphere are characterised by high baroclinicity during COLs [50]. The presence of cold air aloft allows for the shrinking of the tropopause. A key role played by COLs is in stratosphere–troposphere exchanges, which sometimes alters the ozone concentration at high altitudes [51,52,53], allowing PV to be useful when tracking COLs [54]. Deep intrusions of stratospheric ozone-rich air downward can be caused by the occurrence of COLs [55]. This stratospheric intrusion can be important at high altitudes, since ozone is a pollutant in the troposphere. The significance of the occurrence of COLs is in the dissipation, exchange and mixing of the tropospheric ozone balance [27,56]. Tropopause folding also enhances the exchange of air between the stratosphere and troposphere, which is rich in ozone [57,58].
Along the tropopause, there are fast-moving streams of wind known as jet streams influencing large-scale global circulations. They result from a strong horizontal temperature gradient along the top of the troposphere due to the difference in high- and low-pressure columns. They are known as subtropical and polar jets over both hemispheres [24]. The portion of the overall jet stream where winds along the jet core flow stronger than in other areas along the jet stream is referred to as the jet streak. The entrance (exit) region of a jet streak is where winds are accelerating into the back/upstream (decelerating out of the front/downstream) side of the streak. Within the entrance region of a jet streak, divergence (of the ageostrophic wind) usually occurs along and to the right of the jet core (i.e., the right-entrance region) [43]. Upper-level divergence causes pressure/height falls at the surface and/or lower-to-middle levels underneath the upper divergence maximum. Southern African weather is largely affected by the subtropical jet, which migrates poleward in the austral summer and equatorward in the austral winter. The powerful winds of the jet stream are responsible for pushing weather patterns around the world. Typically, they move from west to east in a steady fashion. Occasionally, a low-pressure system or storm will be pinched off from the jet stream and become stalled. This is where a cut-off low derives its name from.

6. Impacts of COLs

Extreme weather events usually lead to several incidences of social, environmental and economic impacts. In many cases, the occurrence of flooding due to COLs in South Africa has been declared a national disaster. This follows the need to implement the response requirements of South Africa’s Disaster Management Act, Act No. 57 of 2002, by all three spheres of government. The South African Weather Service (SAWS) has records, archives and information on weather extremes and their impacts in South Africa dating back to the 1500s in a publication called Caelum. This is a publication that is updated monthly and uses information collected mainly from media sources such as newspapers. The Caelum publication describes notable weather and weather-related events that made it to media publication and is shared with South Africa’s National Disaster Management Centre (NDMC) as well as other research institutions on request. Information stored in this document includes dates of the weather events, their socio-economic impacts and the regions affected.
Of all rainfall-producing systems occurring over South Africa, COLs have the most devastating impact, claiming many lives each year. In April 2022, at least 443 people died and 40,000 were displaced when floods from a COL ravaged the east coast of KwaZulu-Natal [59]. Approximately 4000 homes were destroyed by floods in the area, whilst schools, clinics and roads were destroyed by the same system [59]. As far back as 1981, over 100 people drowned in COL-induced floods in Laingsburg [60]. Other common impacts of COLs recorded in the SAWS Caelum include negative impacts on agricultural yields, water-borne diseases (e.g., cholera, diarrhea) and damage to power stations because of heavy rainfall and strong winds associated with these weather systems. It is evident that COL occurrence over South Africa has impacts that include widespread flooding, damage to bridges and roads and displacement of vulnerable affected communities. While Caelum is a good source of information on extreme weather-related impacts, it has been criticised for lacking proper quality-control schemes and for under-reporting impacts in certain regions.
COLs can cause flooding over South Africa due to persistent heavy rainfall [8], resulting in severe infrastructure damage and halting local economic activities [10]. Flooding can have an overwhelming toll on the socio-economic exercises of any community, particularly in developing countries, where human strength and preparedness for climate extremes are exceptionally low [61,62].
The slow-moving nature of COLs contributes to their high impact, as happens when anticyclonic conditions persist. COL movements tend to be quasi-stationary, causing large rainfall accumulation over a particular region and, thus, contributing to flooding events over South Africa [26]. Some regions experience worse weather than others—with snowfall (e.g., Andean highlands), flash floods, mudslides and disruption to transportation and electricity supply. In addition, the deep moist convection taking place within COLs can produce short bursts of extreme rainfall, leading to 20% of all flash-flooding events over South Africa [8].
Whilst COLs are more frequent over South Africa than tropical revolving systems, they may be comparable to tropical cyclones in terms of producing severe weather, heavy rainfall, floods and destruction. However, not all COLs are associated with severe weather. The occurrence of COLs over South Africa induces forest fire suppression due to flooding, snow and extreme cold conditions. Other impacts of COLs include economic losses which run into billions of South African Rand, due to the destruction of electrical power transmission lines, roads and bridges. It is important to note that although some of the recent COLs have led to destruction and fatalities, some of them have not been as intense. Thus, any deluge of rainfall from these systems was exacerbated by human factors that led to flash flooding, mudslides, infrastructure collapse, etc. For example, rural–urban migration has led to illegal infrastructure developments, more sewer demands or the blocking of drainage systems and riverbank farming, especially in wetlands or on unstable platforms [63].
As a result, several studies have documented case studies of severe COLs which produced extreme rainfall and devastating impacts [10,26,35,64,65]. From our review, it appears most high-impact events associated with COLs occur along the coast and cause damage to properties, infrastructure and the environment. We focus here on two such COL cases [8,10] which resulted in anomalous weather and very high impacts, including the loss of lives and livelihoods in East London (Eastern Cape) on the south coast and Durban (Kwa-Zulu Natal) on the east coast. In both cases, the role of the coastal escarpment was dominant. The study used the geopotential height, vertical velocity (omega), wind vector and total rainfall from the ECMWF ERA5 reanalysis [42] to analyse these events.

6.1. Case 1: 14–17 August 2002

On 15 August 2002, an intense COL spinning independently from the westerly wave was well developed over East London in the Eastern Cape province (Figure 4, Figure 5 and Figure 6), where 317.2 mm rainfall was measured [66]. The event dumped devastating rainfall, which was approximately four times the monthly average in 24 h [26]. The region experienced a relatively high amount of moisture uplift induced by the presence of low pressure aloft, low temperatures at the surface and high convection rates. A low-level jet was impinged on the escarpment, enhancing lifting and convection and resulting in extreme rainfall for a short duration [26]. The conditions over East London during this period were anomalously cold and wet. The SAWS Caelum reported that this COL led to the death of 14 people, 3000 were left homeless and the estimated cost of all damage was around ZAR 2 million.

6.2. Case 2: 22–25 April 2019

This slow-propagating COL produced intense rainfall and severe flooding over parts of South Africa [10]. There was the presence of a Type S ridging high pressure system at the surface. This occurrence took place during 22–25 April 2019 (Figure 7, Figure 8 and Figure 9), which was an Easter weekend in South Africa. The independent spinning of the COL that detached from the westerly wave was evident. During this period, there are usually high peaks or road travel. The COL dumped prolonged rainfall of approximately 150–200 mm in 48 h [67] and resulted in 80 deaths and damage to infrastructure, settlements, roads and the water and electricity supply in KwaZulu-Natal province due to localised flooding [68]. While Caelum did not report any estimated costs associated with the damage caused by this COL, it did document that several bridges and roads were washed away, and many businesses were lost because of the severe flooding and mudslides that occurred. Townships, informal settlements and developed urban areas were also severely affected. The unusual flooding and destruction over developed urban areas was an indicator of possible poor planning, maintenance and decaying infrastructure.

7. Forecasting Cut-Off Lows

The forecasting and research communities have become increasingly interested in COLs over the past several decades [36,69]. In order to make numerical weather and climate predictions, understanding the characteristics of COLs and their variability is of particular importance [53]. Information about the potential impacts is made possible by impact-based forecasts and warnings [70]. This indicates that there will be an increase in climate- and weather-related challenges in the future. A better consideration of the physical processes that influence temperature and rainfall variability, changes and trends over South Africa, such as COL dynamics, may prove to be very useful in adapting to projected future climate changes. This may also improve the reliability of forecasting anomalous events caused by COLs, leading research institutions and weather services to become interested in COLs in the twenty-first century [21,36,43].
However, there has been a lack of efficient tools and effective warning methods [64] for societies who are usually non-scientists and the most affected by weather extreme events. Since COLs produce severe and destructive weather, it is imperative that meteorologists forecast them accurately and with adequate lead time. Information about the potential impacts is made possible by impact-based forecasts and warnings [70] which are important considering the weather and climate challenges in the future. Better consideration of physical processes that influence temperature and rainfall variability, changes and trends over South Africa may also improve the reliability of forecasting anomalous events caused by COLs, leading to positive implications for quality of life, economic well-being and growth in South Africa. Furthermore, investigating teleconnection patterns (e.g., ENSO) and the predictability of COLs is crucial [69].
With advanced prediction systems, accurate rainfall and position forecasts of COLs are still a challenge due to their irregular trajectories [10]. More recently, climate models have been used to simulate COLs with more frequency and accuracy (e.g., [10,36,71,72]). The weather research forecast (WRF) regional model was used to simulate the characteristics of COL rainfall over the western cape and the influence of topography on cut-off lows over southern Africa [36]. The WRF successfully captured COLs’ seasonal and annual climatology [36], as well as the influence of the western and eastern topography over South Africa, which enhances and suppresses rainfall, respectively [36]. The use of models is largely influenced by COL intensification and frequency in a changing climate, impacting regional climate variability. The use of ensemble models has been found to have improved outcomes compared to using an individual model. It has been recently documented that the spatial distribution, temporal and lifetime distributions of COLs are realistically simulated by the Coupled Model Intercomparison Project Phase 6 (CMIP6) models [69]. Ensemble prediction systems tend to produce reliable forecasts, especially if they have accurate initial conditions. However, a recent study by Muofhe et al. [10] found that the Unified Model used operationally by the South African Weather Service simulates rainfall differently, with higher skill during the formation stage of the systems of COLs over South Africa due to its low skill when placing COL centres. In addition, understating the frequency of COL occurrence may be an important factor for government and disaster management to become more proactive than reactive when forecast alerts or warnings are issued.

8. Conclusions

In South Africa, COLs are one of the most important rainfall-producing synoptic-scale weather systems that occur year round [10] and occur from 20°S to 50°S. It was indicated that COLs can induce heavy rainfall conditions over parts of South Africa, causing mass destruction to infrastructure, economy, lives and livelihoods. The loss of lives during the occurrences of COL over South Africa still raises a need for the future improvement of early warning systems, tools and communication of climate information. During COL occurrences, rainfall was found to be anomalously high and usually complemented by snow, very cold or flooding conditions. It has been reported that in some parts of South Africa, occurrences of extreme rainfall events (e.g., COLs) reduce the severity of dry conditions when they occur during the austral summer [73]. Furthermore, investigations about COLs forming surface lows and thereafter becoming barotropic as they weaken (strengthen) and less (more) intense [8,36] still requires attention in future assessments.
There has been a focus on studying specific and individual COL events, which have largely contributed to model development and theories [62]. However, more studies focusing on climatology and model forecasting of COLs must be conducted using the more recent high-resolution reanalyses and trackers. Moreover, work focusing on dynamical evolution has been minimal. Therefore, there is a need to investigate the dynamic structure of global COLs. In this paper, COL occurrences over South Africa have been widely documented and reviewed. Each COL occurrence over South Africa has unique characteristics and impacts, resulting in harsh conditions over affected parts. COL blocking is another form of quasi-stationary west–east tracking, causing unsettled weather for an extended period in the process. In Australia, cut-off low formation and intensification depend heavily on the development and maintenance of the frequent blocking high events over the Tasman Sea [39].
As COLs are the leading cause of weather-related deaths in South Africa, it is critical that timely and accurate weather warnings are issued by the national meteorological service and civil protection and disaster management authorities. The ability of developing countries to adapt to climate stresses tends to be hindered by widespread poverty, political instability and civil war. These are major issues, as several climate change models project that some regions will experience an increase in extreme weather conditions. Our review has shown that NWP models have struggled with forecasting the amounts and location of extreme rainfall. As some of the greatest impacts have occurred in poorly built informal settlements, urban planners and disaster managers are encouraged to review infrastructure in vulnerable coastal areas towards natural disaster risk reduction.

Author Contributions

Conceptualization, N.G.X. and H.C.; validation, I.L.M. and M.L.M.; formal analysis, N.G.X.; investigation, I.L.M.; writing—original draft preparation, N.G.X.; writing—review and editing, H.C., T.M., M.L.M. and T.P.M.; visualization, R.B.M., S.M.S.M., R.B.M. and M.V.S.; supervision, H.C., M.-J.M.B. and T.N.; project administration, N.G.X. All authors have read and agreed to the published version of the manuscript.

Funding

This research was funded by the Water Research Commission Project, Project Account PJ87.

Data Availability Statement

The ECMWF ERA5 reanalysis data can be obtained online via a web portal (https://climate.copernicus.eu/, accessed on 15 January 2023).

Acknowledgments

The authors would like to thank the anonymous reviewers for all their constructive comments and input. The data analysed in this study were obtained from the ECMWF ERA5 reanalysis.

Conflicts of Interest

The authors declare no conflict of interest.

References

  1. Engelbrecht, F.A.; Monteiro, P.M. The IPCC Assessment Report Six Working Group 1 report and southern Africa: Reasons to take action. S. Afr. J. Sci. 2021, 117, 1–7. [Google Scholar] [CrossRef] [PubMed]
  2. Xulu, N.G.; Chikoore, H.; Bopape, M.-J.; Nethengwe, N. Climatology of the Mascarene High and Its Influence on Weather and Climate over Southern Africa. Climate 2020, 8, 86. [Google Scholar] [CrossRef]
  3. Hart, N.C.; Reason, C.J.; Fauchereau, N. Cloud bands over southern Africa: Seasonality, contribution to rainfall variability and modulation by the MJO. Clim. Dyn. 2013, 41, 1199–1212. [Google Scholar] [CrossRef]
  4. Blamey, R.C.; Reason, C.J.C. The role of mesoscale convective complexes in southern Africa summer rainfall. J. Clim. 2013, 26, 1654–1668. [Google Scholar] [CrossRef]
  5. Webster, E.M. A Synoptic Climatology of Continental Tropical Low Pressure Systems over Southern Africa and Their Contribution to Rainfall over South Africa. Ph.D. Thesis, University of Pretoria, Pretoria, South Africa, 2019. [Google Scholar]
  6. Chikoore, H.; Vermeulen, J.H.; Jury, M.R. Tropical cyclones in the Mozambique channel: January–March 2012. Nat. Hazards 2015, 77, 2081–2095. [Google Scholar] [CrossRef]
  7. Engelbrecht, F.; Adegoke, J.; Bopape, M.-J.; Naidoo, M.; Garland, R.; Thatcher, M.; McGregor, J.; Katzfey, J.; Werner, M.; Ichoku, C.; et al. Projections of rapidly rising surface temperatures over Africa under low mitigation. Environ. Res. Lett. 2015, 10, 085004. [Google Scholar] [CrossRef] [Green Version]
  8. Singleton, A.T.; Reason, C.J.C. A Numerical Model Study of an Intense Cutoff Low Pressure System over South Africa. Mon. Weather Rev. 2007, 135, 1128–1150. [Google Scholar] [CrossRef]
  9. Favre, A.; Hewitson, B.; Lennard, C.; Cerezo-Mota, R.; Tadross, M. Cut-off Lows in the South Africa region and their contribution to precipitation. Clim. Dyn. 2013, 41, 2331–2351. [Google Scholar] [CrossRef]
  10. Muofhe, T.P.; Chikoore, H.; Bopape, M.-J.M.; Nethengwe, N.S.; Ndarana, T.; Rambuwani, G.T. Forecasting Intense Cut-Off Lows in South Africa Using the 4.4 km Unified Model. Climate 2020, 8, 129. [Google Scholar] [CrossRef]
  11. Zhao, S.; Sun, J. Study on cut-off low-pressure systems with floods over Northeast Asia. Meteorol. Atmos. Phys. 2007, 96, 159–180. [Google Scholar] [CrossRef]
  12. Palmen, E.; Newton, C. Atmospheric Circulation Systems; Academic Press: New York, NY, USA, 1969. [Google Scholar]
  13. Pinheiro, H.R.; Hodges, K.I.; Gan, M.A. An intercomparison of subtropical cut-off lows in the Southern Hemisphere using recent reanalyses: ERA-Interim, NCEP-CFRS, MERRA-2, JRA-55, and JRA-25. Clim. Dyn. 2020, 54, 777–792. [Google Scholar] [CrossRef] [Green Version]
  14. Muñoz, C.; Schultz, D.; Vaughan, G. A midlatitude climatology and interannual variability of 200-and 500-hPa cut-off lows. J. Clim. 2020, 33, 2201–2222. [Google Scholar] [CrossRef] [Green Version]
  15. Hu, K.X.; Lu, R.Y.; Wang, D.H. Seasonal climatology of cut-off lows and associated precipitation patterns over Northeast China. Meteor. Atmos. Phys. 2010, 106, 37–48. [Google Scholar] [CrossRef]
  16. Reboita, M.S.; Nieto, R.; Gimeno, L.; Da Rocha, R.P.; Ambrizzi, T.; Garreaud, R.; Krüger, L.F. Climatological features of cutoff low systems in the Southern Hemisphere. J. Geophys. Res. Atmos. 2010, 115, 1–15. [Google Scholar] [CrossRef] [Green Version]
  17. Nieto, R.; Gimeno, L.; de la Torre, L.; Ribera, P.; Gallego, D.; García-Herrera, R.; García, J.A.; Nuñez, M.; Redaño, A.; Lorente, J. Climatological features of cut-off low systems in the Northern Hemisphere. J. Clim. 2005, 18, 3085–3103. [Google Scholar] [CrossRef] [Green Version]
  18. Risbey, J.; Pook, M.; McIntosh, P.; Wheeler, M.; Hendon, H. On the remote drivers of rainfall variability in Australia. Mon. Weather Rev. 2009, 137, 3233–3253. [Google Scholar] [CrossRef]
  19. Pinheiro, H.R.; Hodges, K.I.; Gan, M.A. Sensitivity of identifying cut-off lows in the Southern Hemisphere using multiple criteria: Implications for numbers, seasonality and intensity. Clim. Dyn. 2019, 53, 6699–6713. [Google Scholar] [CrossRef] [Green Version]
  20. Fuenzalida, H.A.; Sánchez, R.; Garreaud, R.D. A climatology of cutoff lows in the Southern Hemisphere. J. Geophys. Res. Atmos. 2005, 110, 1–10. [Google Scholar] [CrossRef] [Green Version]
  21. Pinheiro, H.R.; Hodges, K.I.; Gan, M.A.; Ferreira, S.H.; Andrade, K.M. Contributions of downstream baroclinic development to strong Southern Hemisphere cut-off lows. Q. J. R. Meteorol. Soc. 2021, 148, 214–232. [Google Scholar] [CrossRef]
  22. Barnes, M.A.; Ndarana, T.; Landman, W.A. Cut-off lows in the southern Hemisphere and their extension to the surface. Clim. Dyn. 2021, 56, 3709–3732. [Google Scholar] [CrossRef]
  23. Price, J.D.; Vaughan, G. Statistical studies of cut-off low systems. Ann. Geophys. 1992, 10, 96–102. [Google Scholar]
  24. Tyson, P.D.; Preston-Whyte, R.A. The Weather and Climate of Southern Africa; Oxford University Press: Cape Town, South Africa, 2000; 396p. [Google Scholar]
  25. Ndarana, T.; Lekoloane, L.E.; Rammopo, T.S.; Reason, C.J.; Bopape, M.J.M.; Chikoore, H.; Engelbrecht, F.A. Downstream development during ridging South Atlantic Ocean anticyclones. Clim. Dyn. 2023, 1–19. [Google Scholar] [CrossRef]
  26. Singleton, A.T.; Reason, C.J.C. Variability in the characteristics of cut-off low pressure systems over subtropical southern Africa. Int. J. Climatol. 2006, 27, 295–310. [Google Scholar] [CrossRef]
  27. Baray, J.L.; Baldy, S.; Diab, R.D.; Cammas, J.P. Dynamical study of a tropical cut-off low over South Africa, and its impact on tropospheric ozone. Atmos. Environ. 2003, 37, 1475–1488. [Google Scholar] [CrossRef]
  28. Pook, M.J.; McIntosh, P.C.; Meyers, G.A. The synoptic decomposition of cool-season rainfall in the southeastern Australian cropping region. J. Appl. Meteorol. Clim. 2006, 45, 1156–1170. [Google Scholar] [CrossRef]
  29. Buckley, B.W.; Leslie, L.M.; Sullivan, W.; Leplastrier, M.; Qi, L. A rare East Indian Ocean autumn season tropical cut-off low: Impacts and a high-resolution modelling study. Meteorol. Atmos. Phys. 2007, 96, 61–84. [Google Scholar] [CrossRef]
  30. Risbey, J.S.; Pook, M.J.; McIntosh, P.C.; Ummenhofer, C.C.; Meyers, G. Characteristics and variability of synoptic features associated with cool season rainfall in southeastern Australia. Int. J. Clim. 2009, 29, 1595–1613. [Google Scholar] [CrossRef]
  31. Lavender, S.L.; Abbs, D.J. Trends in Australian rainfall: Contribution of tropical cyclones and closed lows. Clim. Dyn. 2013, 40, 317–326. [Google Scholar] [CrossRef]
  32. Pook, M.J.; Risbey, J.S.; McIntosh, P.C. A comparative synoptic climatology of cool-season rainfall in major grain-growing regions of southern Australia. Theor. Appl. Climatol. 2013, 117, 521–533. [Google Scholar] [CrossRef]
  33. Hauser, S.; Grams, C.M.; Reeder, M.J.; McGregor, S.; Fink, A.H.; Quinting, J.F. A weather system perspective on winter–spring rainfall variability in southeastern Australia during El Niño. Q. J. R. Meteorol. Soc. 2020, 146, 2614–2633. [Google Scholar] [CrossRef]
  34. Ndarana, T.; Waugh, D.W. The link between cut-off lows and Rossby wave breaking in the Southern Hemisphere. Q. J. R. Meteorol. Soc. 2010, 136, 869–885. [Google Scholar] [CrossRef]
  35. Muofhe, T.P. Characteristics of Deep Moist Convection and Rainfall in Cut-Off Lows over South Africa. Master Dissertation, University of Venda, Thohoyandou, South Africa, 2019. [Google Scholar]
  36. Abba-Omar, S.; Abiodun, B.J. Simulating the characteristics of cut-off low rainfall over the Western Cape using WRF. Clim. Dyn. 2021, 56, 1265–1283. [Google Scholar] [CrossRef]
  37. Chikoore, H.; Bopape, M.-J.M.; Ndarana, T.; Muofhe, T.P.; Gijben, M.; Munyai, R.B.; Manyanya, T.C.; Maisha, R. Synoptic structure of a sub-daily extreme precipitation and flood event in Thohoyandou, north-eastern South Africa. Weather Clim. Extremes 2021, 33, 100327. [Google Scholar] [CrossRef]
  38. Taljaard, J.J. Change of rainfall distribution and circulation patterns over southern Africa in summer. J. Climatol. 1986, 6, 579–592. [Google Scholar] [CrossRef]
  39. Qi, L.; Wang, Y.; Leslie, L.M. Numerical simulation of a cut-off low over southern Australia. Meteorol. Atmos. Phys. 2000, 74, 103–115. [Google Scholar] [CrossRef]
  40. Campetella, C.M.; Possia, N.E. Upper-level cut-off lows in southern South America. Meteorol. Atmos. Phys. 2007, 96, 181–191. [Google Scholar] [CrossRef]
  41. Godoy, A.A.; Possia, N.E.; Campetella, C.M.; Skabar, Y.G. A cut-off low in southern South America: Dynamic and thermodynamic processes. Rev. Bras. Meteorol. 2011, 26, 503–514. [Google Scholar] [CrossRef] [Green Version]
  42. Hersbach, H.; Bell, B.; Berrisford, P.; Hirahara, S.; Horanyi, A.; Muñoz-Sabater, J.; Nicolas, J.; Peubey, C.; Radu, R.; Schepers, D.; et al. The ERA5 global reanalysis. Q. J. R. Meteorol. Soc. 2020, 146, 1999–2049. [Google Scholar] [CrossRef]
  43. Ndarana, T.; Rammopo, T.S.; Bopape, M.J.; Reason, C.J.; Chikoore, H. Downstream development during South African cut-off low pressure systems. Atmos. Res. 2021, 249, 105315. [Google Scholar] [CrossRef]
  44. Hoskins, B.; McIntyre, M.E.; Robertson, A.W. On the use and significance of isentropic potential vorticity maps. Q. J. R. Meteorol. Soc. 1985, 111, 877–946. [Google Scholar] [CrossRef]
  45. Ndarana, T.; Rammopo, T.S.; Chikoore, H.; Barnes, M.A.; Bopape, M.-J. A quasi-geostrophic diagnosis of the zonal flow associated with cut-off lows over South Africa and surrounding oceans. Clim. Dyn. 2020, 55, 2631–2644. [Google Scholar] [CrossRef]
  46. Bell, G.D.; Bosart, L.F. A case study diagnosis of the formation of an upper-level cutoff cyclonic circulation over the eastern United States. Mon. Weather Rev. 1993, 121, 1635–1655. [Google Scholar] [CrossRef]
  47. van Delden, A.; Neggers, R. A case study of tropopause cyclogenesis. Meteorol. Appl. 2003, 10, 187–199. [Google Scholar] [CrossRef] [Green Version]
  48. Mcintyre, M.E.; Palmer, T.N. Breaking planetary waves in the stratosphere. Nature 1983, 305, 593–600. [Google Scholar] [CrossRef]
  49. Hoskins, B.J.; Hodges, K.I. A new perspective on Southern Hemisphere storm tracks. J. Clim. 2005, 18, 4108–4129. [Google Scholar] [CrossRef]
  50. Hoskins, B.J. Atmospheric frontogenesis models: Some solutions. Q. J. R. Meteorol. Soc. 1971, 97, 139–153. [Google Scholar] [CrossRef]
  51. Price, J.D.; Vaughan, G. The potential for stratosphere-troposphere exchange in cut-off-low systems. Q. J. R. Meteorol. Soc. 1993, 119, 343–365. [Google Scholar] [CrossRef]
  52. Rondanelli, R.; Gallardo, L.; Garreaud, R.D. Rapid changes in ozone mixing ratios at Cerro Tololo (30°10′ S, 70°48′ W, 2200 m) in connection with cut-off lows and deep troughs. J. Geophys. Res. Atmos. 2002, 107, ACL-6. [Google Scholar] [CrossRef]
  53. Pinheiro, H.; Ambrizzi, T.; Hodges, K.; Gan, M.; Andrade, K.; Garcia, J. Are Cut-off Lows simulated better in CMIP6 compared to CMIP5? Clim. Dyn. 2022, 59, 2117–2136. [Google Scholar] [CrossRef]
  54. Wernli, H.; Sprenger, M. Identification and ERA-15 climatology of potential vorticity streamers and cutoffs near the extratropical tropopause. J. Atmos. Sci. 2007, 64, 1569–1586. [Google Scholar] [CrossRef]
  55. Ancellet, G.; Beekmann, M.; Papayiannis, A. Impact of a cutoff development on downward transport of ozone in the stratosphere. J. Geophys. Res. 1994, 99, 3451–3463. [Google Scholar] [CrossRef]
  56. Gimeno, L.; Trigo, R.M.; Ribera, P.; Garcia, J.A. Special issue on cut-off low systems (COL). Meteorol. Atmos. Phys. 2006, 96, 1. [Google Scholar] [CrossRef]
  57. Ebel, A.; Hass, H.; Jakobs, H.; Laube, M.; Memmesheimer, M.; Oberreuter, A.; Geiss, H.; Kuo, Y.-H. Simulation of ozone intrusion caused by a tropopause fold and cut-off low. Atmos. Environ. Part A Gen. Top. 1991, 25, 2131–2144. [Google Scholar] [CrossRef]
  58. Langford, A.; Masters, C.; Proffitt, M.; Hsie, E.; Tuck, A. Ozone measurements in a tropopause fold associated with a cut-off low system. Geophys. Res. Lett. 1996, 23, 2501–2504. [Google Scholar] [CrossRef]
  59. South African Government. National State of Disaster-In-Numbers—18 April 2022. 2022. Available online: https://www.gov.za/speeches/national-state-disaster-numbers-%E2%80%93-18-april-2022-18-apr-2022-0000 (accessed on 29 June 2022).
  60. Mac Mahon, A.G.; Swart, J.P. The Laingsburg flood disaster. S. Afr. Med J. 1983, 63, 865–866. [Google Scholar]
  61. Nath, P.K.; Behera, B. A critical review of impact of and adaptation to climate change in developed and developing economies. Environ. Dev. Sustain. 2010, 13, 141–162. [Google Scholar] [CrossRef]
  62. Llasat, M.C.; Martín, F.; Barrera-Escoda, A. From the concept of “Kaltlufttropfen” (cold air pool) to the cut-off low. The case of September 1971 in Spain as an example of their role in heavy rainfalls. Meteorol. Atmos. Phys. 2006, 96, 43–60. [Google Scholar] [CrossRef]
  63. Mashao, F.M.; Mothapo, M.C.; Munyai, R.B.; Letsoalo, J.M.; Mbokodo, I.L.; Muofhe, T.P.; Matsane, W.; Chikoore, H. Extreme Rainfall and Flood Risk Prediction over the East Coast of South Africa. Water 2022, 15, 50. [Google Scholar] [CrossRef]
  64. Pyle, D.M.; Jacobs, T.L. The Port Alfred floods of 17–23 October 2012: A case of disaster (mis) management? Jàmbá J. Disaster Risk Stud. 2016, 8, a207. [Google Scholar] [CrossRef] [PubMed] [Green Version]
  65. Barnes, M.A.; Turner, K.; Ndarana, T.; Landman, W.A. Cape storm: A dynamical study of a cut-off low and its impact on South Africa. Atmos. Res. 2021, 249, 105290. [Google Scholar] [CrossRef]
  66. Molekwa, S.; Engelbrecht, C.J.; Rautenbach, C.D. Attributes of cut-off low induced rainfall over the Eastern Cape Province of South Africa. Theor. Appl. Climatol. 2014, 118, 307–318. [Google Scholar] [CrossRef] [Green Version]
  67. ENCA. Travelers Warned as Wet Weather Continues in Parts of SA. 2019. Available online: https://www.enca.com/news/wet-weather-affect-many-travel-plans (accessed on 11 May 2022).
  68. CNN. 70 People Killed in South Africa Floods. 2019. Available online: https://edition.cnn.com/2019/04/24/africa/51-dead-south-africa-flood-intl/index (accessed on 11 May 2020).
  69. Pinheiro, H.R.; Ambrizzi, T.; Hodges, K.I.; Gan, M.A. Understanding the El Niño Southern Oscillation Effect on Cut-Off Lows as Simulated in Forced SST and Fully Coupled Experiments. Atmosphere 2022, 13, 1167. [Google Scholar] [CrossRef]
  70. WMO. Impact-Based Forecasting Informs Anticipatory Action. 2021. Available online: https://public.wmo.int/en/media/news/impact-based-forecasting-informs-anticipatory-action (accessed on 15 January 2023).
  71. Bozkurt, D.; Rondanelli, R.; Garreaud, R.; Arriagada, A. Impact of warmer eastern tropical Pacific SST on the March 2015 Atacama floods. Mon. Weather Rev. 2016, 144, 4441–4460. [Google Scholar] [CrossRef] [Green Version]
  72. Reyers, M.; Shao, Y. Cut-off lows of the coast of the Atacama Desert under present day conditions and in the Last Glacial Maximum. Glob. Planet. Chang. 2019, 181, 102983. [Google Scholar] [CrossRef]
  73. Mpungose, N.; Thoithi, W.; Blamey, R.C.; Reason, C.J.C. Extreme rainfall events in southeastern Africa during the summer. Theor. Appl. Clim. 2022, 150, 185–201. [Google Scholar] [CrossRef]
Figure 1. Conceptual framework demonstrating the literature focus on the study of COLs.
Climate 11 00059 g001
Figure 2. Map showing four South African COL regions and elevation (after Singleton and Reason [8]). COLs exhibit unique characteristics in regions A, B, C and D.
Climate 11 00059 g002
Figure 3. (a) Typical 500 hPa geopotential height (m) and omega (Pa/m) and (b) near-surface MSLP (hPa) and divergence (×10−6 s−1) circulation associated with a cut-off low over South Africa [24]. The variables plotted here were obtained from the ECMWF ERA5 reanalysis [42].
Climate 11 00059 g003
Figure 4. Geopotential height (m) and wind vector (m/s) at 500 hPa during (a) 14, (b) 15, (c) 16, (d) 17 August 2002.
Climate 11 00059 g004
Figure 5. Geopotential height (m) 500 hPa and total rainfall (mm) during (a) 14, (b) 15, (c) 16, (d) 17 August 2002.
Climate 11 00059 g005
Figure 6. Geopotential height (m) and omega (Pa/m) 500 hPa during (a) 14, (b) 15, (c) 16, (d) 17 August 2002.
Climate 11 00059 g006
Figure 7. Geopotential height (m) and wind vector (m/s) at 500 hPa during (a) 22, (b) 23, (c) 24, (d) 25 April 2019.
Climate 11 00059 g007
Figure 8. Geopotential height (m) 500 hPa and total rainfall (mm) during (a) 22, (b) 23, (c) 24, (d) 25 April 2019.
Climate 11 00059 g008
Figure 9. Geopotential height (m) and omega (Pa/m) at 500 hPa during (a) 22, (b) 23, (c) 24, (d) 25 April 2019.
Climate 11 00059 g009
Disclaimer/Publisher’s Note: The statements, opinions and data contained in all publications are solely those of the individual author(s) and contributor(s) and not of MDPI and/or the editor(s). MDPI and/or the editor(s) disclaim responsibility for any injury to people or property resulting from any ideas, methods, instructions or products referred to in the content.

