1. Introduction
Human activity recognition (HAR) is a field that has garnered significant research attention, as the automated detection of human activities has numerous practical applications, including surveillance, health monitoring, human–machine interaction, entertainment, and intelligent environments [
1,
2]. Current approaches for HAR are either vision-based or sensor-based [
2]. Vision-based approaches offer high accuracy but have several drawbacks, such as privacy issues, limited monitoring range, and high cost. Sensor-based approaches, on the other hand, are more diverse. They can be further divided into three categories, wearable sensing, object-tagged sensing, and dense/infrastructure-mediated sensing, each with its advantages and disadvantages.
However, it is usually expensive and time-consuming to fully equip residences with suitable sensors. Furthermore, a disadvantage of most existing systems is that their components cannot be completely inconspicuously integrated into the home environment, often making residents feel monitored [
3].
The objective of our work is to identify human activities on a more general level. We would rather not distinguish between the individual activities but determine the occurrence of any activity within a residence. Thus, instead of HAR, we consider the broader human activity event recognition (HAER) problem in this work. The information about activity events in the household shall later be used for emergency detection, especially in the context of ambient assisted living (AAL) systems, for example, by detecting atypically long periods of inactivity, which potentially indicate an emergency [
4,
5].
To address the HAER problem, we propose a novel dense sensing approach that exploits data from smart water meters instead of introducing additional sensors into the households. Smart water meters are already present in many German households and provide detailed information in particular on cumulative water consumption, which can be used to infer human activity. Using smart water meter data has several advantages, including the fact that water consumption is vital to human survival and can be easily measured in almost all households [
6]. It is easy to access and prepare the data without major effort and cost. Further, the water meter measurements contain only a low level of noise. Possible causes of noise in a water sensor are dripping taps, leaking pipes, and/or quantization noise.
The literature describes that smart water meter data are used to optimize water supply systems [
7,
8,
9] or provide residents with accurate information about their water consumption [
7,
8,
10,
11,
12,
13,
14,
15]. Using smart water meter data for HAR/HAER or in the AAL domain has not been widely explored. When using water meter measurements in the context of an AAL system, it is crucial to optimize the precision of the HAER because the precision affects the ability to detect potential emergencies. In contrast to the HAER problem, a single false positive classification for the water supply optimization problem is acceptable. Optimizing the recall is of subordinate importance for emergency detection using an inactivity profile since emergency detection only considers the absence of activities; false negative (FN) classifications, therefore, do not influence the general ability of emergency detection, as long as there are still some regular true positive (TP) classifications. FN classifications only affect the granularity of how quickly emergencies can be detected.
We aim to develop a methodology for HAER that can run on an edge system in real time directly inside the residential environment (e.g., on a single-board computer). Thus, the water consumption data do not need to be sent to third parties, improving privacy. Additionally, the system does not require a continuously active internet connection, which increases the system’s availability. Only in the case of an emergency would an external communication be required.
The main contribution of this article is to present a new approach for human activity event recognition (HAER) within a residence using smart water meter measurements. By using smart water meter measurements, non-intrusive monitoring of human activity can be performed using existing data sources. Our method is designed for (near-)real-time activity detection in a streaming setting using edge computing. Further, this article presents a new publicly available data set of water consumption measurements from 17 German households, which we collected using commercially available smart water meters.
The remaining paper is structured as follows: we review the literature on analyzing water consumption in private households in
Section 2 and provide an overview of the different features used for water consumption analysis and the purposes for which water consumption is analyzed. Since we could not identify suitable data sets with water consumption data measured using a smart water meter in the literature, we collected a new data set in 17 German households as part of this work. We present the method of collection, as well as the gathered data set itself, in
Section 3. Subsequently, in
Section 4, we address the necessary data pre-processing steps before introducing a novel approach for HAER based on measurements from smart water meters in
Section 5. We then evaluate this approach in
Section 6. The paper ends with a discussion in
Section 7 and a conclusion and outlook in
Section 8.
2. Related Work
One of the earliest works in household water consumption analysis can be traced to Bennett and Linstedt [
16]. In 1975, the authors investigated wastewater treatment and disposal systems and extensively analyzed household water consumption. The authors collected water consumption data in five households using analog flow meter recorders on wax discs and manual activity records. Based on these records, Bennett and Linstedt then analyzed the water use of individual appliances and inferred various household water-use characteristics to understand wastewater generation better [
16]. For example, the authors examined the typical water consumption within a day and the average daily water consumption per person [
16].
Later, De Oreo et al. [
10] presented in 1996 one of the first modern approaches to disaggregate water consumption data using digital data loggers. In their work, the authors spotted specific water flow patterns that could be assigned to activities or individual appliances (toilet, dishwasher, washing machine) [
10].
The focus of most related work is to analyze water consumption measurements either to manage and optimize water supply networks [
7,
8,
9], to help residents and planners conserve water by obtaining insight into the households’ water consumption [
7,
8,
10,
11,
12,
13,
14,
15], for leak detection [
9], or for HAR or activity of daily living (ADL) detection [
6,
17,
18,
19]. The papers by Salomons et al. [
20] and Cardell-Oliver et al. [
21] critically address the disaggregation of water measurements or smart water metering by noting privacy issues [
20,
21].
In the literature review, we identified no related work that exploits water consumption data to detect activity events in the sense of a binary classification problem. We can assume that HAER is a sub-problem of the HAR problem. In other words, if we can perform HAR based on water consumption data, this implies HAER. However, the reverse is not true in general.
Several publications on the analysis of water consumption data are attributed to the research group of the Australian professor Cardell-Oliver. The authors use various analytical methods on a data set of smart meter readings from Western Australia to conclude residents’ routine behavior to motivate them to conserve water. The researchers also raise privacy concerns arising from smart meters [
9,
14,
21,
22].
Instead of analyzing water flow rates, the works by Froehlich et al. [
17,
23] and Thomaz et al. [
13] analyze water pressure. Froehlich et al. addressed water data disaggregation for HAR. They developed a method called “HydroSense” that aims to detect the unique pressure waves that occur when fixtures (e.g., a tap) are opened or closed. Using a dynamic Bayesian approach, the authors combined template matching, grammar, and prior probabilities to determine the probability of a specific event. They achieved an overall accuracy between 76% and 96% for households [
17,
23]. Thomaz et al. attempted to identify human activities, especially in bathrooms and kitchens. For this, they used a vector space model (VSM)-based method on water pressure measurements. The evaluation with 23 participants achieved an overall accuracy of 70% in recognizing eleven high-level activities in the kitchen and bathroom [
13].
Chen et al. investigated activity disaggregation on high-resolution synthetic water flow data (and additional medium-resolution smart-meter measurements). The study aimed to provide residents with a more in-depth insight into their water use. Chen et al. focused on detecting toilets, showers, and washing machines. The authors used different approaches: HMM, kNN-GMM, ANN-GMM, and SVM-GMM. For shower recognition, they achieved a precision of around 95% with a recall between 77–81%. For the washing machine, they achieved a precision between 78 and 86% with a recall between 89–96% [
11]. Using a combination of hidden Markov model (HMM), artificial neural networks (ANN), and dynamic time wrapping (DTW) algorithms, Nguyen et al. tried to detect event patterns in water consumption and thus achieve CO
savings in the water network (especially at the pumps) by providing optimizations in households, such as determining when to water the garden [
8].
Koketsu et al. used water consumption data to identify the rhythm of the daily life of elderly people, determine deviations, and contact relatives if necessary. They concluded that although regularities in daily water consumption can be identified, more research is needed to implement comprehensive monitoring of the elderly [
6]. The design of a similar system of a “daily-use water monitoring platform for the elderly” is also described by the authors Yanyan et al. However, the paper omitted a discussion of the actual implementation [
19].
Hu et al. presented another approach for monitoring the daily activities of the elderly based on data from a three-axis accelerometer mounted on the surface of the main water pipe in the house. They describe the detection of different ADLs (wash, cook, flush, bath) using a support vector machine (SVM) or fusion model. However, the precision and recall of the detection vary widely based on the individual ADLs [
18]. Moreover, based on vibration data, Kim et al. presented a “Nonintrusive Autonomous Water Monitoring System” [
12].
The existing approaches for analyzing water consumption measurements differ primarily in the data (sensor types, features, temporal resolution, and measurement resolution) on which the analysis or disaggregation is conducted. A comprehensive overview of the water consumption data used in related studies, their particular features and resolution, and the respective collection method is presented in
Table 1.
The majority of studies use flow rate sensors [
6,
8,
9,
10,
11,
16,
19,
21,
22,
24,
25]. However, there are also studies using other features, such as water pressure [
13,
17] or measurements of a three-axis accelerometer mounted on the surface of the main water pipe in the house [
12,
18].
Another essential point of differentiation for studies based on water flow is the temporal resolution of the measured values. Here, the literature distinguishes among high, medium, and low resolutions. There is no final specification for the distinction between high, medium, and low resolutions. Following Clifford et al. [
7] and Cardell-Oliver [
22], a high resolution means values measured within seconds (≤1 min), a medium resolution means values measured up to once a day (>1 min; ≤1 day), and a low resolution means lower resolutions than once a day (>1 day). Research on water disaggregation mainly uses medium- [
6,
9,
11,
14,
19,
22] or high-resolution [
8,
10,
11,
24] data. Low-resolution data are mainly used for general flow analysis, seasonal changes, or billing purposes.
A further point to note is that none of the approaches with the goal of HAR or ADL detection uses measurements from commercial smart meters as the data basis; the authors either used special flow meters [
6,
19] or even used different features than water flow [
17,
18]. An extensive discussion of the various resolutions of smart meter water measurements can be found in Clifford et al. [
7].
Another aspect highlighted in our literature review is the absence of commonly used benchmark datasets for water use in the scientific literature. Instead, researchers generally collect their own data sets (except for a group led by Cardell-Oliver [
9,
14,
21,
22]), making it difficult to compare results across studies. Furthermore, the primary data sets are typically not available as open data. This is in contrast to the disaggregation of electrical power consumption data, where publicly available datasets (e.g.,
REDD [
26] or
UK-DALE [
27]) are common. Notably, the scientific literature pays less attention to the disaggregation of water consumption data compared to the disaggregation of power consumption data.
3. Data Recording
As described in
Section 2, there are no publicly available open data sets on water consumption that have been collected using commercial smart meters. Therefore, as part of this work, we recorded a new data set from 17 German households. The new data set is available as open data on
Zenodo at
https://doi.org/10.5281/zenodo.7506076.
In the following, the data set’s collection, the data set’s structure, and the collected data’s quality are described in detail.
3.1. Methodology of Data Collection
3.1.1. Measuring Instruments
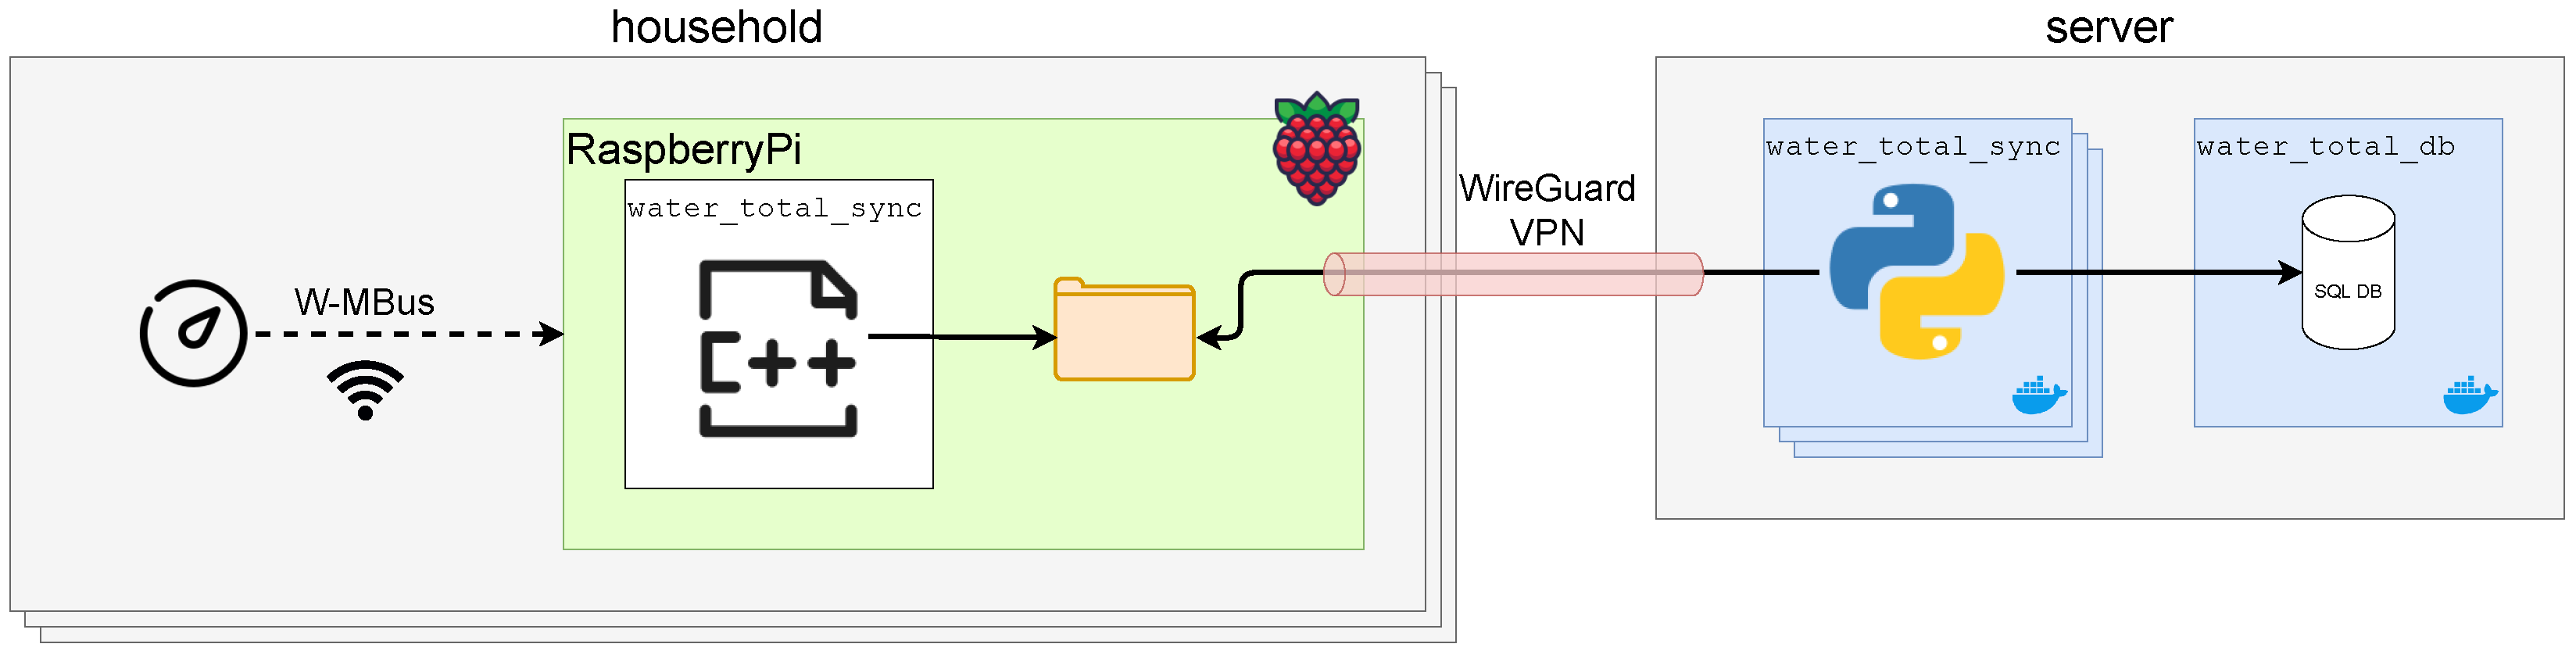
We recorded the cumulative household water consumption over time using the commercially available smart meters Hydrus 1.3, DN 20,00 from Diehl Metering. The installation of the water meters was carried out by the local water utility. These smart meters feature a wireless M-Bus communication interface and periodically transmit the current cumulative meter reading in an interval of at least 8 s via the open metering system (OMS) protocol on 868 MHz.
3.1.2. Data Transmission and Storage
The data from the smart meters can be received in the local vicinity of the water meter, depending on the signal strength of the wireless M-Bus. To continuously monitor the cumulative water consumption of each household, we installed a Raspberry Pi with an appropriate antenna capable of receiving the OMS signals at 868 MHz in each of the test households. These signals were decoded and decrypted directly on the Raspberry Pi. We annotated the sample with the current timestamp from an NTP-synchronized clock source. The measurements were temporarily stored on the Raspberry Pi. Using a secure VPN connection, the measured values were regularly transferred to a central database on a server in a data center.
Figure 1 shows the software architecture and data flow for acquisition and transmission.
3.1.3. Ethics and Privacy Considerations
Privacy and ethics are a focus of the project, as sensitive data relating to subjects’ daily lives will be collected and processed. To follow ethical norms and values and be as transparent as possible, a reflection on the project, especially on how the data were collected and processed, was conducted in advance based on a guideline from the Ethics Commission DGP e.V. [
28].
To ensure data security, all data in our project are stored on internal servers. All measured data were stored pseudonymized by default. Furthermore, we implemented data privacy management according to Jakob et al. [
29].
3.2. Data Set Description
In the period from September 2020 to September 2022, the following data were collected in a total of 17 households in Germany:
where:
The
parameters are based on information provided by the residents at the beginning of the collection. There was no change in the statistical
parameters during the collection period.
The parameter describes the NTP-synchronized timestamp generated on the Raspberry Pi when receiving the measured values. Since (1) the Raspberry Pi does not have a real-time clock and (2) transmission delays and processing delays are not considered, minor time shifts may occur.
In the following, the time series of the value is denoted as , where = m.
To ensure that no household can be de-identified by the
parameter, we
k-anonymized this parameter [
30]. Therefore, we divided up the information about the number of residents living in the household into pairs of four groups (1, 2, 3, and ≥4). This results in a 3-anonymous data set. In addition, we performed a vertical shift of the measured value time series
in a household-specific range between 0 and 100 m
by adding a constant value to each measurement.
The root folder of the Zenodo archive contains the documents readme.md, info.txt, and info.json, as well as the 17 folders for the individual households. The readme.md provides basic information on the data set and its use. The documents main.txt and main.json contain the metadata for the measurements of all households in both human- and machine-readable format.
For each test household, there is a separate folder with the documents info.txt and info.json. These contain household-specific metadata. The total water consumption measurements are stored in smartmeter.csv.
The statistical characteristics of each test household are shown in
Table 2.
3.3. Data Quality Reflection
In the following, we consider the quality of the gathered data set.
3.3.1. Recording Gaps
First, it can be noted that there are long recording gaps (several days/weeks) in the measurements. The gaps are mainly caused by technical failures, especially the failure of the Raspberry Pi or the receiving antennas. Furthermore, measurement gaps may have been caused by unstable radio signals or interference signals on the transmission frequency of the smart meters.
Due to household access restrictions, access to the test hardware was limited during the survey period, so technical problems could only be solved late in some cases. Therefore, long gaps must be expected when using the data set. The longest continuous timespans without recording gaps are shown in
Table 3, split by test household and by the expected measurement frequency.
3.3.2. Faulty Timestamps
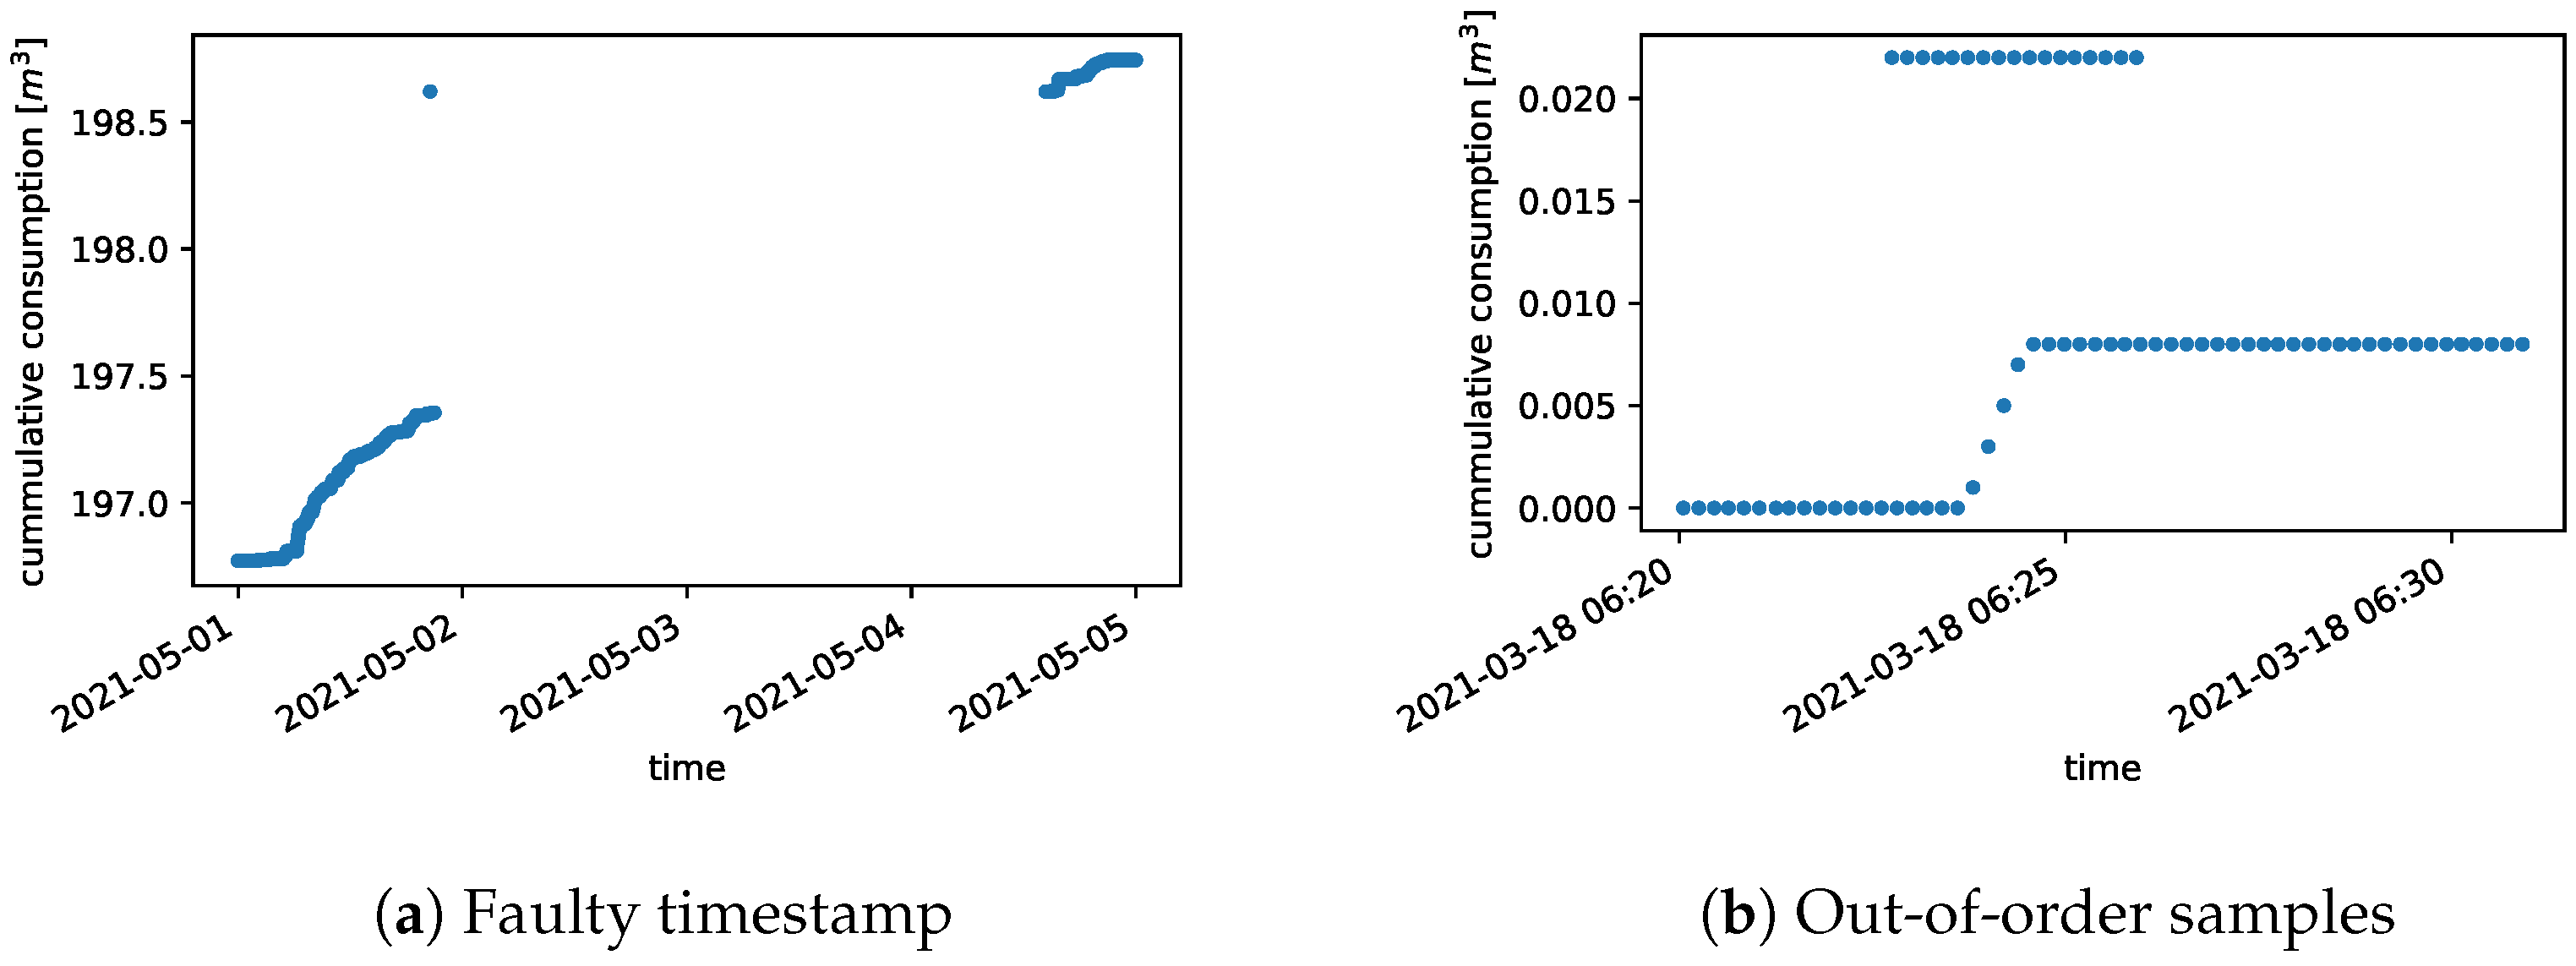
From the smart meter’s perspective, a private household is always a water consumer and not a water producer. Thus, by definition, the time series of measured values of cumulative consumption must be monotonically increasing. However, we find this is not the case when analyzing the data records. The reason for this may be out-of-order samples with obviously faulty timestamps. Two examples of faults are shown in
Figure 2.
On the one hand, it can be seen that the last sample before a gap sometimes has an obviously incorrect timestamp (e.g., in
Figure 2a). On the other hand, as shown in
Figure 2b, some out-of-order samples occur even in gap-free sequences.
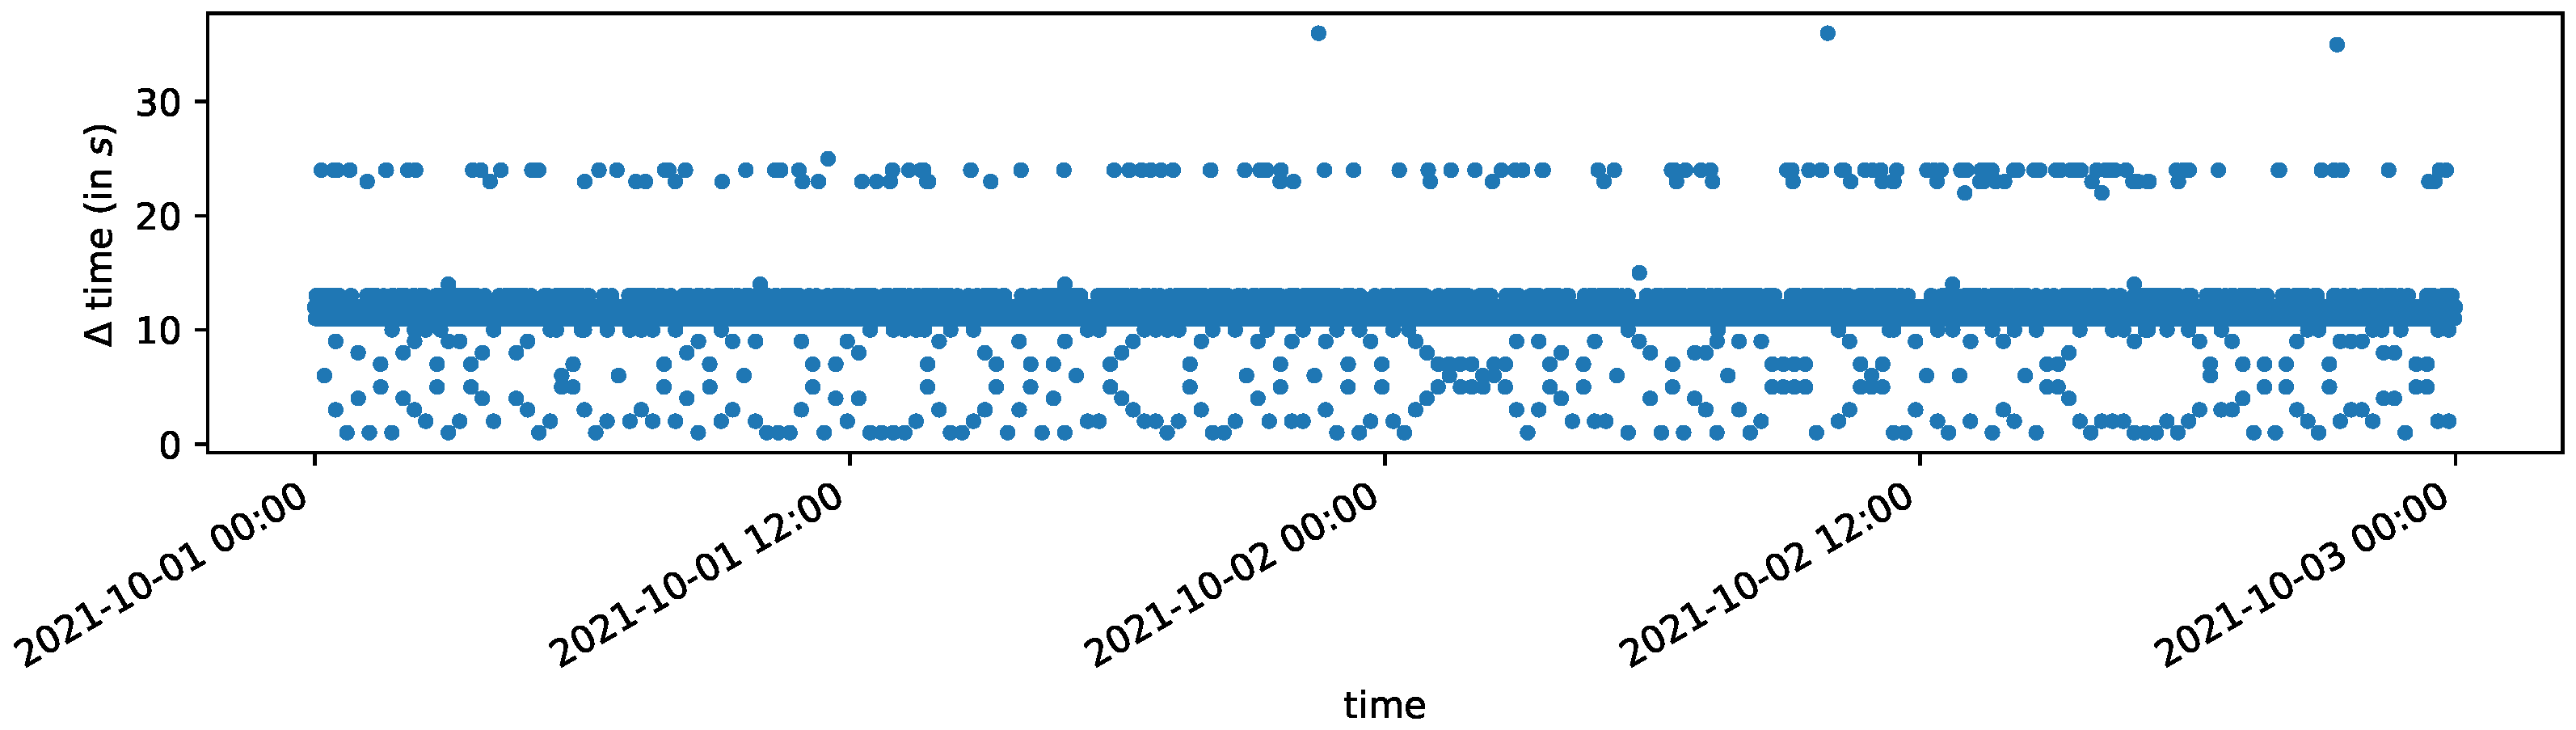
Another point to be considered in the context of the reflection on the data quality is the temporal resolution of the measured values. Theoretically, this should be at least 0.125 Hz–i.e., at least one sample every 8 s. However, if we look at the data from the recordings, we can observe that the temporal resolution is subject to major variation and is less than 0.125 Hz. In the entire data set, we obtain a median sample rate of
Hz (one sample every 12 s).
Figure 3 shows the time intervals between two consecutive samples for an example period of two days.
4. Data Pre-Processing
We must first perform pre-processing steps to detect human activity from the smart water meter data. These steps include removing faulty samples from the raw data (
Section 4.1), resampling the data (
Section 4.2), and interpolating gaps (
Section 4.3). With smoothing, we finish the data pre-processing in
Section 4.4.
4.1. Data Cleaning
In
Section 3.3, we showed that the raw data contain faulty samples. In particular, faulty time stamps or out-of-order samples occur in a few cases. To clean these faulty out-of-order samples, we use the monotonic property of the cumulative water consumption series and the property that the water supply of a private household is limited.
4.1.1. Monotonic Increasing
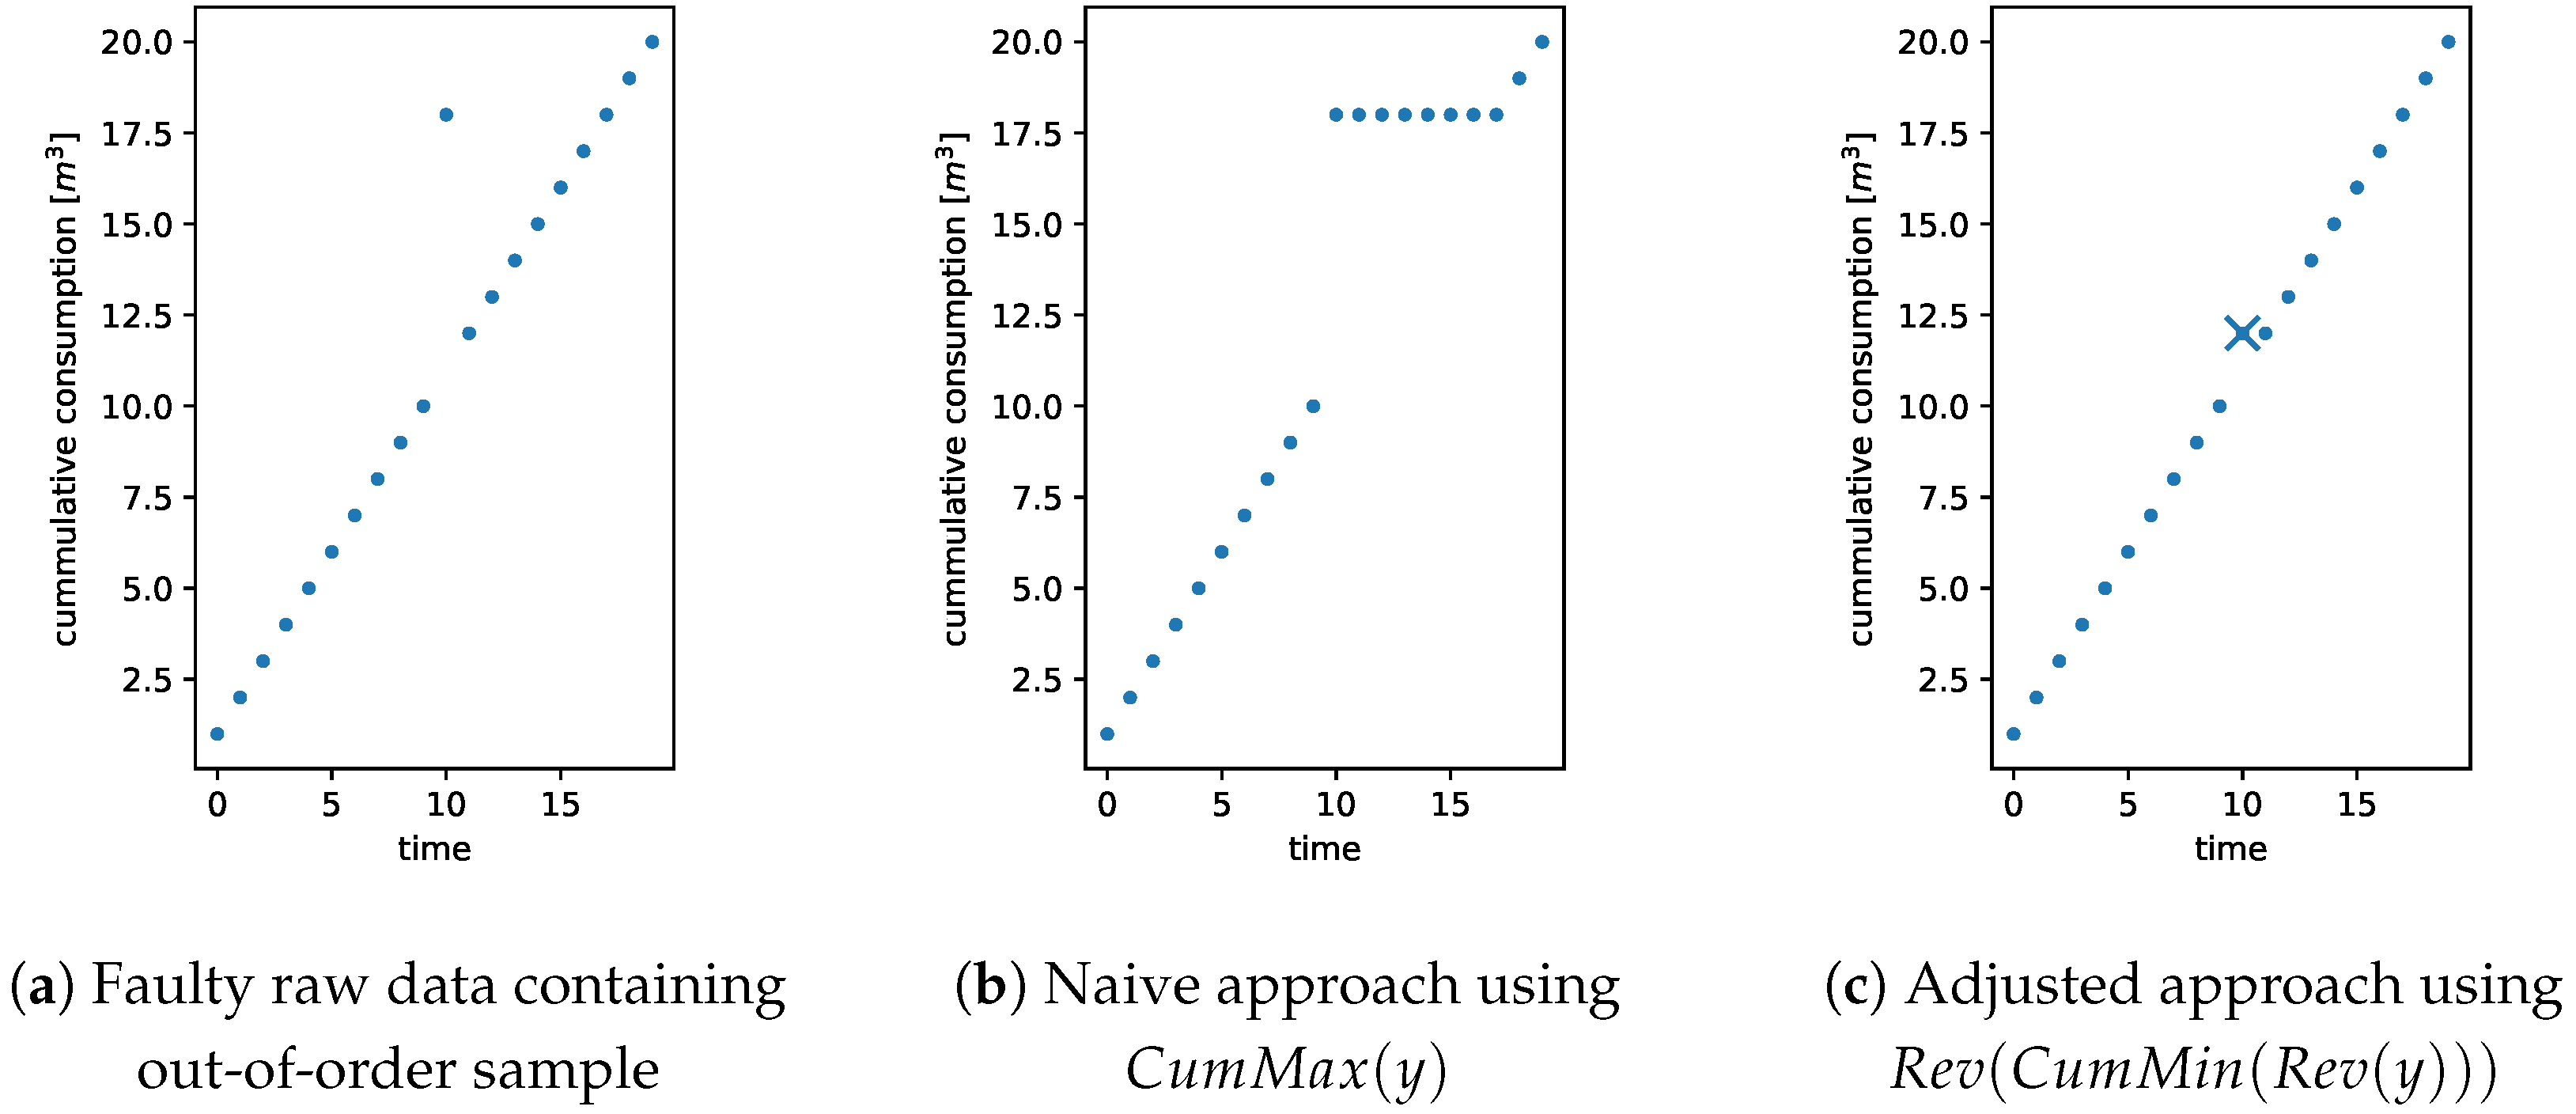
Some measurement samples contain a faulty timestamp and arrive out of order, resulting in transient spikes in the cumulative water consumption time series, as shown in
Figure 4a. These samples violate the monotonic constraint and should be removed.
A naive method for handling these samples is to replace the time series with the cumulative maximum of the time series; however, this also modifies all correct samples after a spike, as shown in
Figure 4b.
To address this issue, we propose a different approach. First, we reverse the time series, then compute the cumulative minimum, and reverse the result again. Finally, we remove the sample at the spike location, depicted with an × in
Figure 4c. This method effectively removes the faulty samples without affecting the correct samples.
4.1.2. Filter Unrealistic High Water Flow Rates
During the data cleaning process, we use the physical constraints of the household water supply system to filter out unrealistic, high-consumption samples that are likely to be faulty data. Specifically, we remove all samples where the flow rate is higher than 30 L per minute.
Over the entire data set, we notice 0.011 % of faulty samples that violate the plausibility constraints, monotonicity, and maximum flow rate.
4.2. Resampling
As shown in
Section 3.3, the measurement frequency is not constant at 0.125 Hz. To standardize the frequency, we perform downsampling using the
resampling rule because
is a cumulative series.
For this work, we use a measurement resolution of Hz, i.e., one measurement per 15 s. By using a resolution slightly smaller than the median sample rate of the entire data set ( Hz), minor variations in the time axis can be well-compensated for and there are fewer gaps.
4.3. Gap Interpolation
The resampled data may contain gaps due to measurement gaps or removed samples from the pre-processing steps from
Section 4.1. Some of these gaps can be interpolated to improve the data continuity. However, to ensure that the interpolation does not influence the subsequent activity-recognition steps, we only interpolate gaps where there have been no changes in the cumulative consumption between time points.
To determine which gaps can be interpolated, we use the following criterion: if for a gap in the interval , we interpolate the values for the gap by setting for all . This gap criterion ensures that the interpolated values accurately reflect the underlying consumption.
We limited interpolation to gaps of no more than 1 h.
4.4. Smoothing
The water meter outputs the measured values with quantization errors. A constant flow rate of liter per timestep produces the following sequence of volume readings: liter. The quantization to -liter precision transforms the readings to the sequence liter. To compute the flow rate, we perform the first derivative of this sequence. The result is the faulty sequence liter per timestep, instead of the correct sequence .
To remove the transient spikes of flow rates caused by the quantization error, we smooth the time series of flow rates with a rolling median filter. We choose the rolling median filter because the median filter preserves the location and shape of edges, whereas a rolling mean filter would smear the edges.
We use a rolling median with a window size of 3 samples. The result of the rolling median filter is a majority vote for each sliding window. A negative consequence of the filter is the removal of short water consumption activities, such as filling a glass of water.
5. Detecting Human Actions Using Smart Water Meter Measurements
The main objective of our work is to use smart water meter measurements for HAER within a residence. Previous research has shown that it is possible to identify human actions by observing their interactions with specific objects or devices [
31,
32,
33]. We are considering the interaction with household water tapping points (e.g., taps, showers, toilet flushes, washing machines). Therefore, we have to consider different types of water consumption in private households:
| Type I | Direct water usage, where the resident actively starts and stops water use (e.g., tap, shower). |
| Type II | Water consumption that is partially autonomous but requires prior direct user interaction (e.g., washing machine, dishwasher). |
| Type III | Water consumption that does not require user interaction (e.g., automated garden watering). |
When inferring human actions from household water consumption, it must be ensured that only the start and stop of water consumption for Type I consumption and only the start of water consumption for Type II consumption are interpreted as human action. Type III consumption must not be interpreted as a human activity at all. Since Type III consumption is rare in Germany, we ignore this category. Moreover, automatically controlled or programmable Type II consumers are not considered in this article.
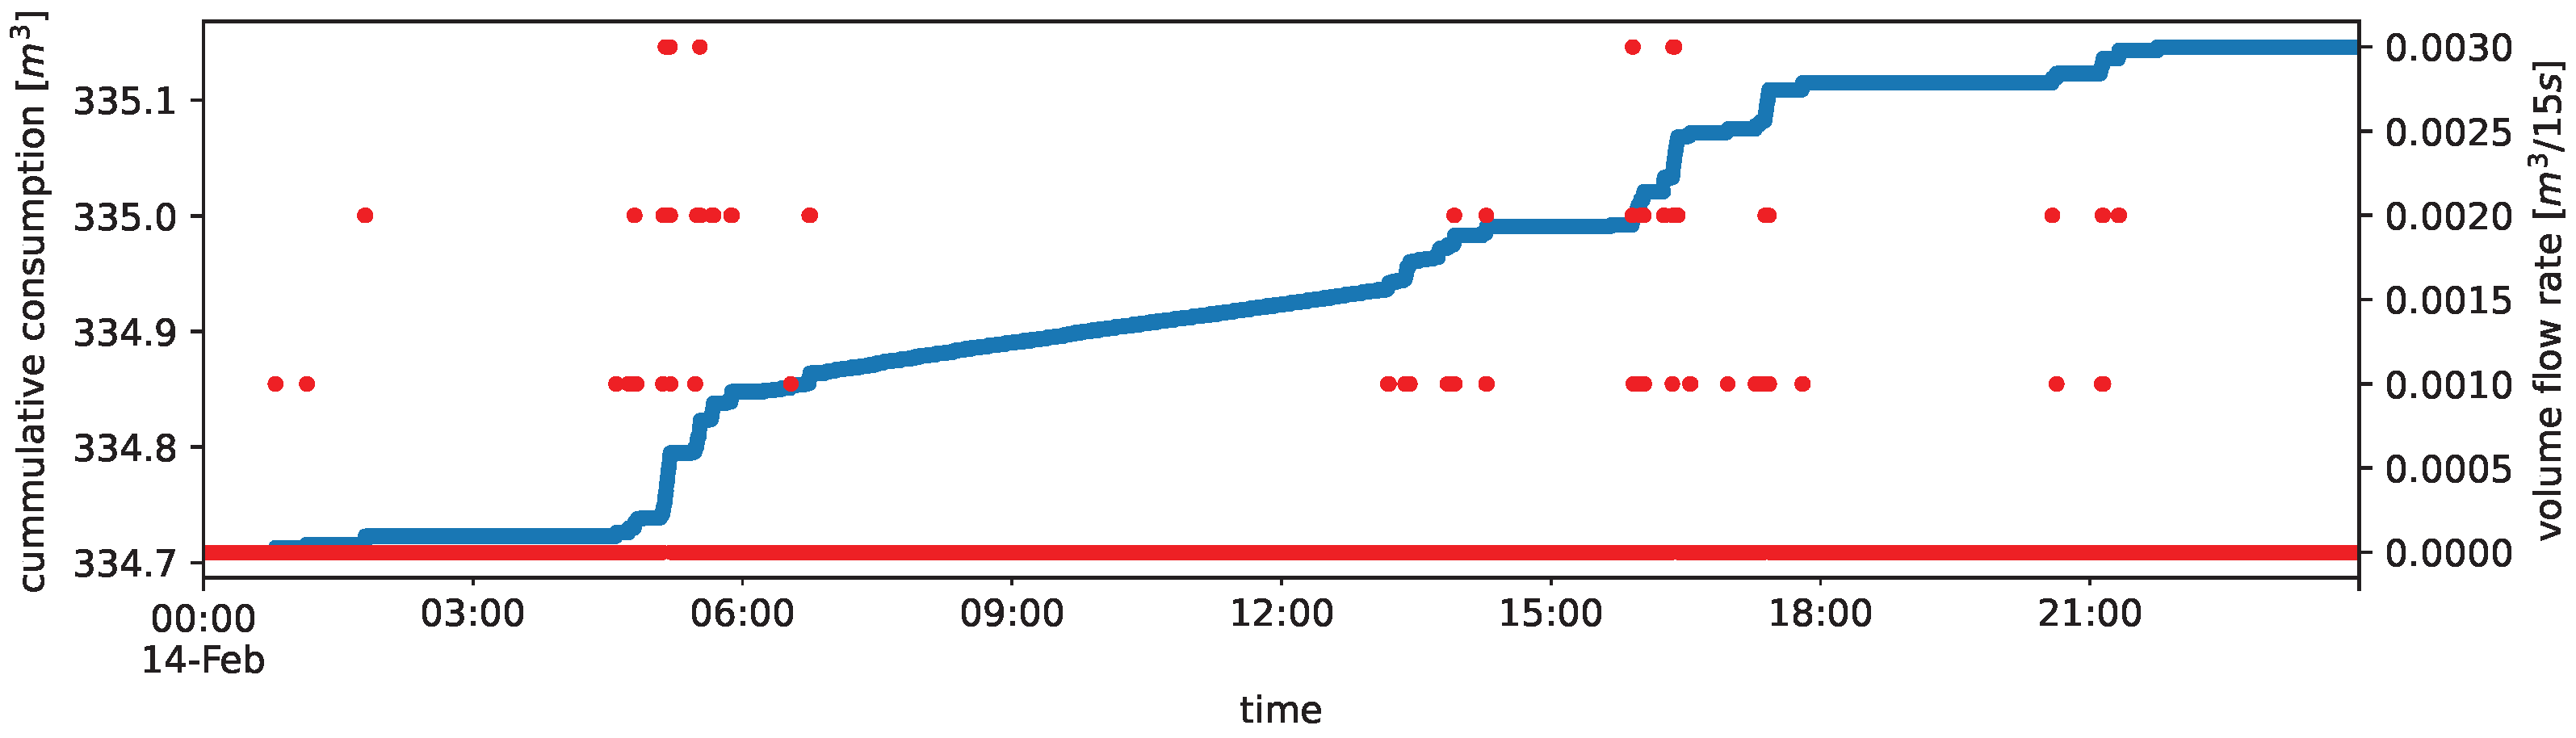
To quantify the intensity of human water usage of Type I and Type II consumption, we convert the pre-processed cumulative water consumption time series into a time series of volume flow rates . The conversion process computes the difference between consecutive samples regarding the timespans between the consecutive samples.
Figure 5 shows, for an exemplary data extract over one day, both the cumulative measured values
and the volume flow rates time series
derived from the measurements.
If we assume that when the pipe system in the household is completely sealed, the incoming volume flow rate at time
t is equal to the sum of the individual outgoing volume flow rates of all water tapping points in the residence at time
t. The following applies:
where
P is the set of all water tapping points in the residence and
is the individual volume flow rate of the tapping point
at time
t, with the same temporal and quantitative resolution as
. From this definition, it follows that:
This means that at any time
t where water is being used throughout the house, water must be used at least at one tapping point
.
For Type I consumption, per the definition, at least the start and end of any consumption is the result of human activity. For Type II consumption, at least the start of consumption must result from human action. In summary, we can consider a human activity at any time t if the following conditions are fulfilled:
- (i)
and
- (ii)
This means that we consider those times t with human activity at which a water flow () takes place and at the previous time there was no water flow (). This assumption is because, for example, a constantly running water tap does not imply constant human activity, but only turning on the tap requires human action.
In practice, however, it cannot be assumed that water pipes and water tapping points are completely sealed and that measurements are always accurate. Furthermore, minor leaks, such as a dripping tap, cannot be measured since the 1-liter quantization resolution of the series
is smaller than the leaking volume. Consequently, we have to further adjust Equation (
1) by adding a noise term
that describes the leaks or measurement deviations at time
t:
On this assumption, the following now applies:
If
, the implication in Equation (
2) does not apply anymore without restrictions. Therefore, to determine when water is consumed, at least one tapping point,
, must apply. Since the term
depends on multiple factors (e.g., the pipe system, leaking tapping points) and is not constant, it cannot be specified clearly. Therefore, we define a global fixed threshold value
, for which
holds.
Further, we assume that we consider only such times t as human actions for which both of the following apply:
- (i)
and
- (ii)
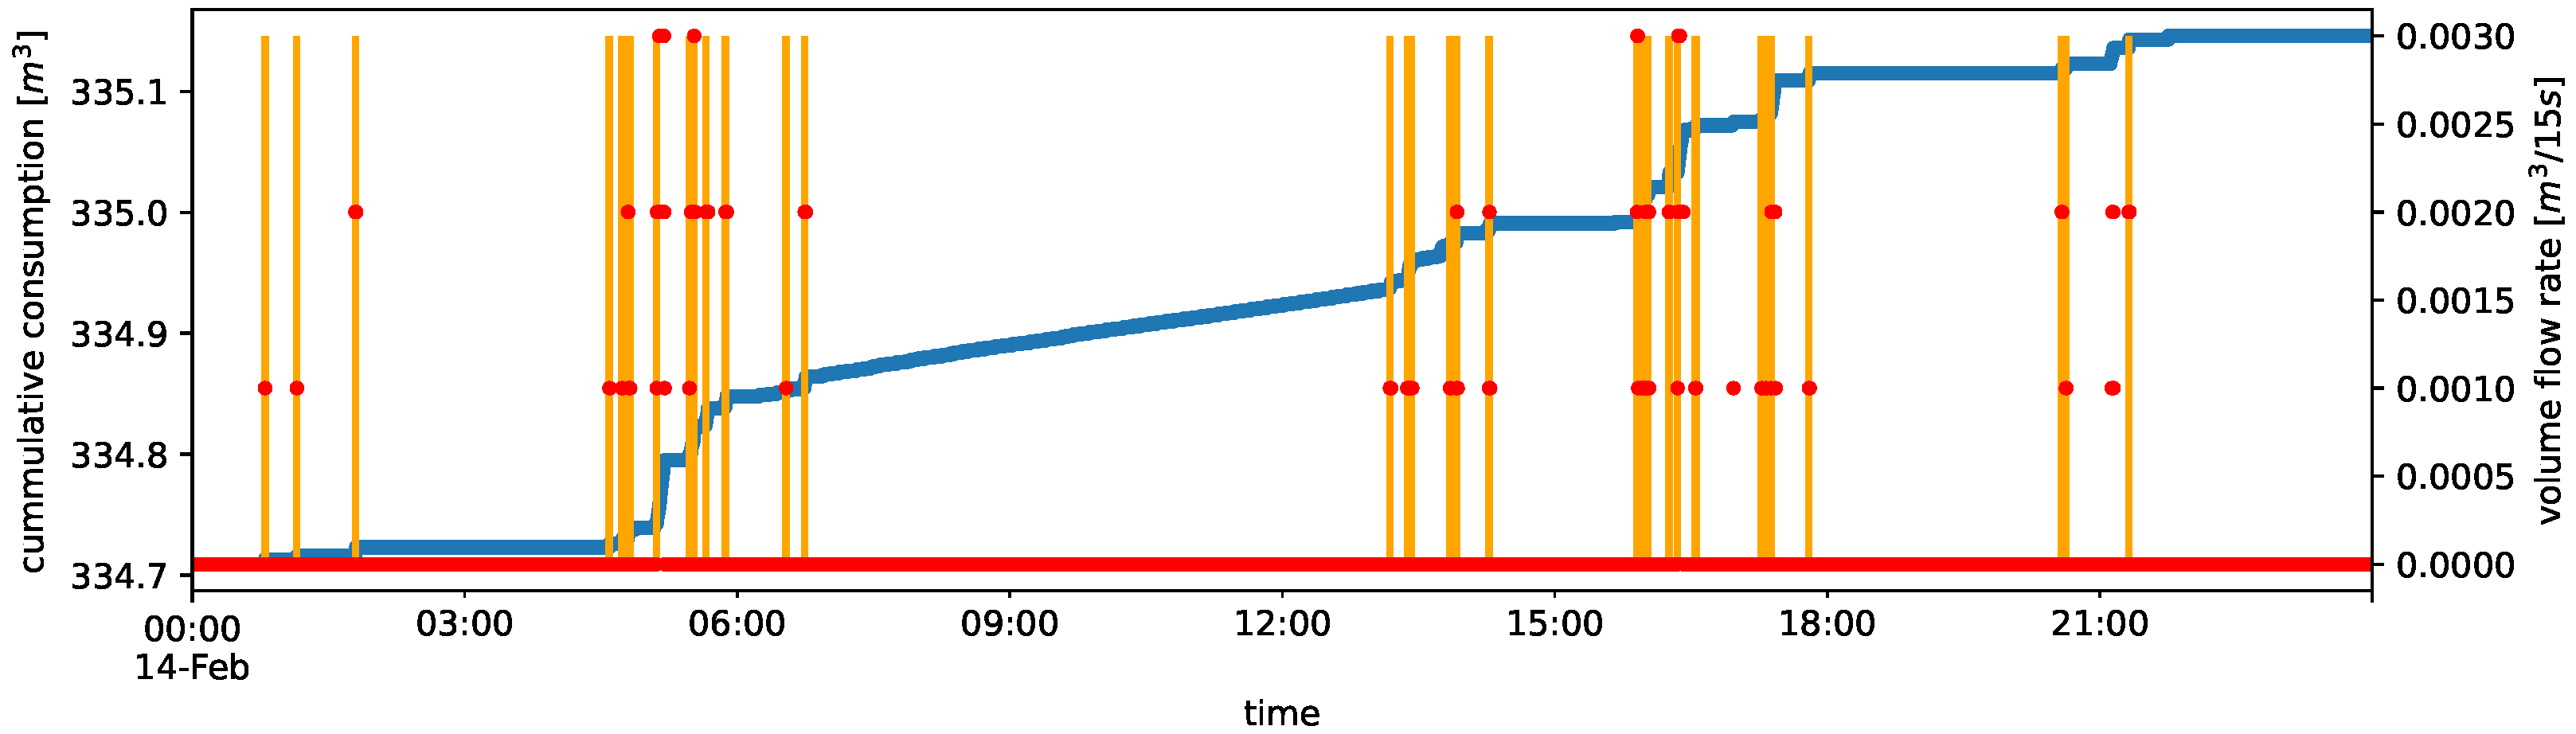
In
Figure 6, the times for which the two conditions mentioned above are fulfilled using a sampling frequency of
Hz with
are plotted with orange lines. At each of these time points, human activity can be assumed.
7. Discussion
Our research focuses on HAER based on water consumption readings. We use the flowrate feature (
), which is common in the related literature [
6,
8,
9,
10,
11,
16,
19,
21,
22,
24,
25], but unlike many other studies [
6,
17,
18,
19], we consider the HAER problem as a binary classification problem. In other words, we do not distinguish between different consumption methods or types of activity, but rather determine whether there is an activity at a given time
t or no activity. Thus, instead of HAR, the presented approach is suitable for HAER, which is novel in the research field for using smart water meter data.
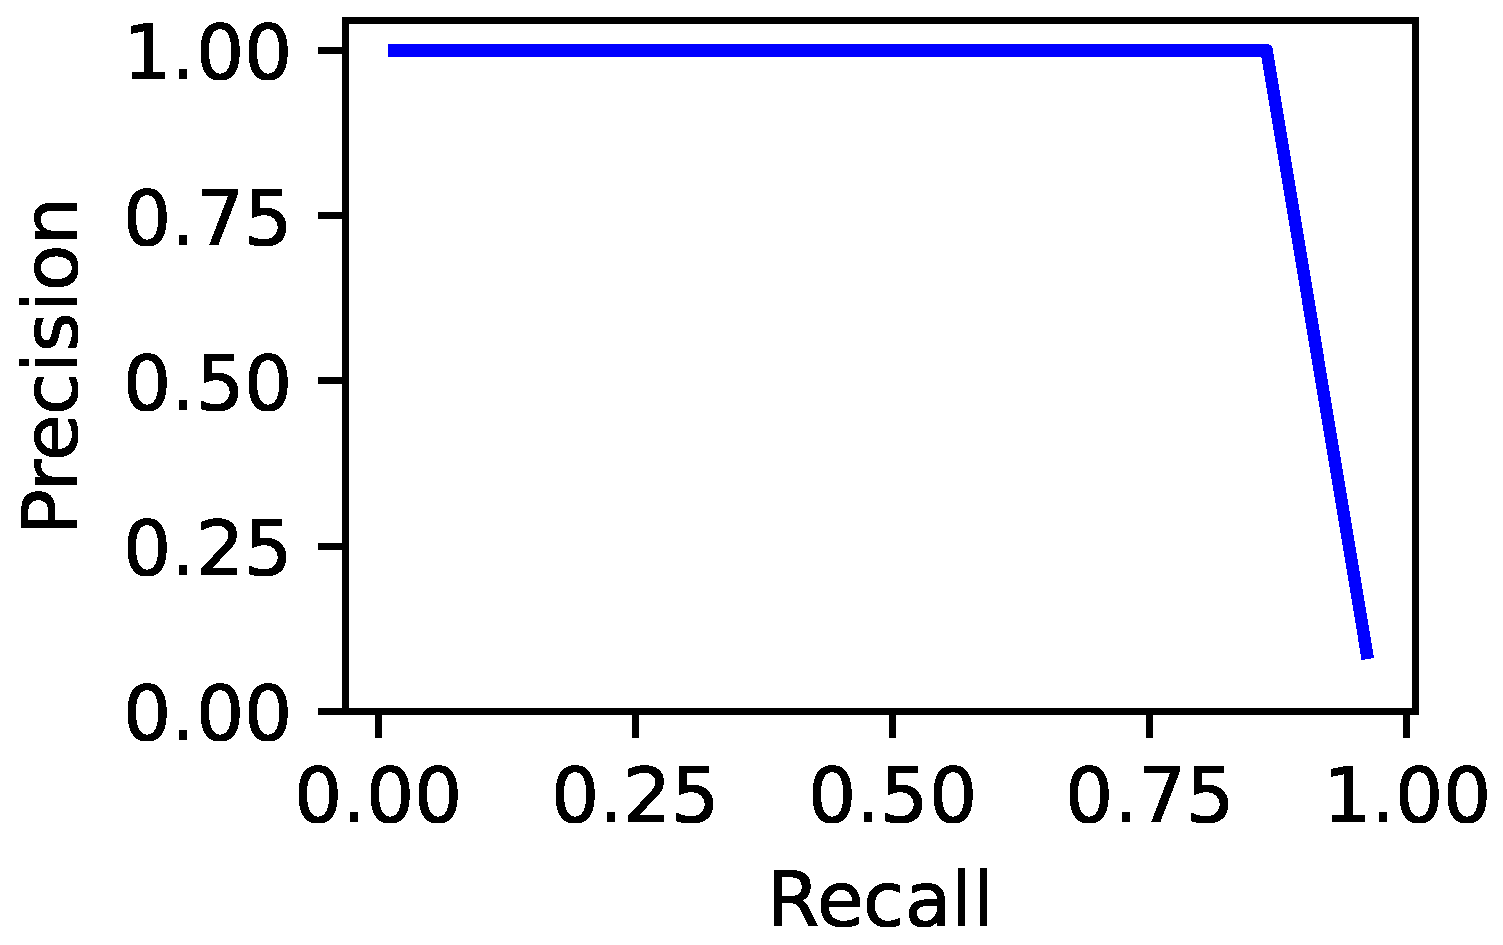
Our approach showed an increased precision () compared to previous work on HAR, which was our main research goal. However, it should be noted that the evaluation data set was collected in actual households but under controlled/laboratory-like conditions, with no overlap of different activities and a limited range of activity types. As a result, the recall () of our approach may be biased. In future work, the recall should therefore be re-examined with a more comprehensive evaluation dataset.
As an extension to the precision–recall curve, we have performed a further evaluation in
Section 6.2 in two households to investigate whether FP classifications occur over an extended period of time. This evaluation again demonstrates the high precision of the HAER with a total of zero FP classifications. However, it should be noted that periods of absence during which a washing machine or a dishwasher was active were not included in the evaluation. In general, it must be stated that our method for HAER is potentially prone to errors caused by Type II or Type III consumption. This means that if, for example, a washing machine is running, HAER performance may be impaired during this time. In particular, it must be considered that, for example, a washing machine intakes water several times during a washing cycle, but generally only the first intake process is directly related/close in time to the human activity of switching on the washing machine; all other intakes occur with a time delay. The same applies to further Type II consumers.
A further limitation is that Type II devices may be started with a timer or via a smart home, and thus be considered equally a Type III consumer. This cannot be distinguished from a direct human activity with the presented approach.
From a practical standpoint, one major benefit of using smart water meter data for HAER is that it is a fully non-intrusive way of monitoring people within the household. Since smart water meters are already common in many households, this method of HAER does not require any additional sensors to be installed, but solely works with re-using existing data. However, it should be noted that not all commercially available smart water meters offer the high temporal resolution of the smart meter used in this work.
Since water consumption is vital for humans, we can show that re-using the smart water meter data provides a fine-grained activity profile. With
Section 6.3 we showed that the median overall household
of inactivity time was 06:58; for 13 out of 17 households, the
of inactivity time was less than 10 h. This finding is particularly relevant when further work is conducted to investigate using the activity information from the smart water meter for an AAL system in emergency detection. Using household-specific inactivity thresholds (e.g., 10 h) it is possible, using the disaggregated HAER information from the smart water meter, to detect potential emergencies within the household by detecting atypically long periods of inactivity [
4]. In particular, it must then be considered that inactivity also results from the absence of residents.
One of the major benefits of the proposed approach is its ability to perform HAER using only a short timespan of water flow data. With a sample rate of 15 s, the cumulative water consumption of the last 60 s is sufficient to perform the pre-processing of the data as presented in
Section 4 and then to perform the classification according to
Section 5. This makes it possible to cache the measurements locally in the household (e.g., using a ring buffer) and to perform HAER on an edge system (e.g., a single-board computer) in a streaming mode. This edge computing eliminates the need to transmit water consumption data to an external third party, which increases privacy. There is also no need for a constantly active internet connection, which can increase the system availability/reliability. Only dedicated emergency situations require external communication to notify third parties.
8. Conclusions and Further Work
On the one hand, this article outlines the data collection of a comprehensive data set of water consumption measurements. We used commercial smart meters in 17 German households between September 2020 and September 2022 to record water consumption measurements with a median sample rate of
Hz, which is the second-highest among data sets collected using smart meters in the related literature [
8,
9,
11,
14,
21,
22]. Only Nguyen et al. [
8] describe that their system can achieve a higher sample rate. However, our data set also contains long gaps and faulty records, which may negatively impact its quality, as discussed in detail within
Section 3.3. A further significant impediment to the possibility of reusing the dataset is the absence of label data. The collected data set is now publicly available on
Zenodo for further research.
On the other hand, we have presented a novel approach for HAER using water consumption measurements collected from commercial smart meters. This noninvasive approach facilitates the monitoring of human activity events within a household without the need for installing additional sensors. Given that water is a vital necessity for humans and is regularly consumed, such as in toilet use, our findings demonstrate the potential of utilizing smart water meter data to generate fine-grained activity profiles of household residents.
Our approach assumes that a change in the water flow rate from no flow () to a positive flow above a certain threshold () indicates human activity. Our method requires several data pre-processing steps before human action detection can be performed.
By using separately collected labeled data from three households over a period of 428 minutes, we could show that our approach can detect human activity events with high precision () and recall (). In addition, we could also show that activity events are regularly detected during a typical daily routine.
In future work, the approach should be verified with additional data sets and benchmarked against other approaches for HAR/HAER, such as those based on water pressure measurements. Furthermore, it should be investigated how potential errors/bias can be compensated for, primarily caused by Type II or Type III consumption.
Using advanced algorithms, the inferred information about human activities within the residence can later be used for intelligent AAL systems. For example, information about human activity derived from water consumption could replace the acknowledgment function of home emergency call systems or be used for emergency detection without proprietary sensors.


