
AI-Based Techniques for Ad Click Fraud Detection and Prevention: Review and Research Directions

Abstract
:1. Introduction
2. Background
2.1. E-Commerce
- Businesses look for suitable online advertisers to advertise their brands, products, and services;
- Online advertisers, in conjunction with online advertisement providers, place the online ads of the business over the Internet;
- Providers then run different ad campaigns to target the end users of the products and services advertised by businesses;
- By following the links of businesses and companies provided in ad campaigns, users can browse the e-stores of these businesses and companies to purchase their products and services.
2.2. Online Advertising Architecture
2.2.1. Advertiser
2.2.2. Publisher/Provider
2.2.3. Advertising Campaigns
2.2.4. Ad Networks
2.2.5. Users
2.2.6. Attackers
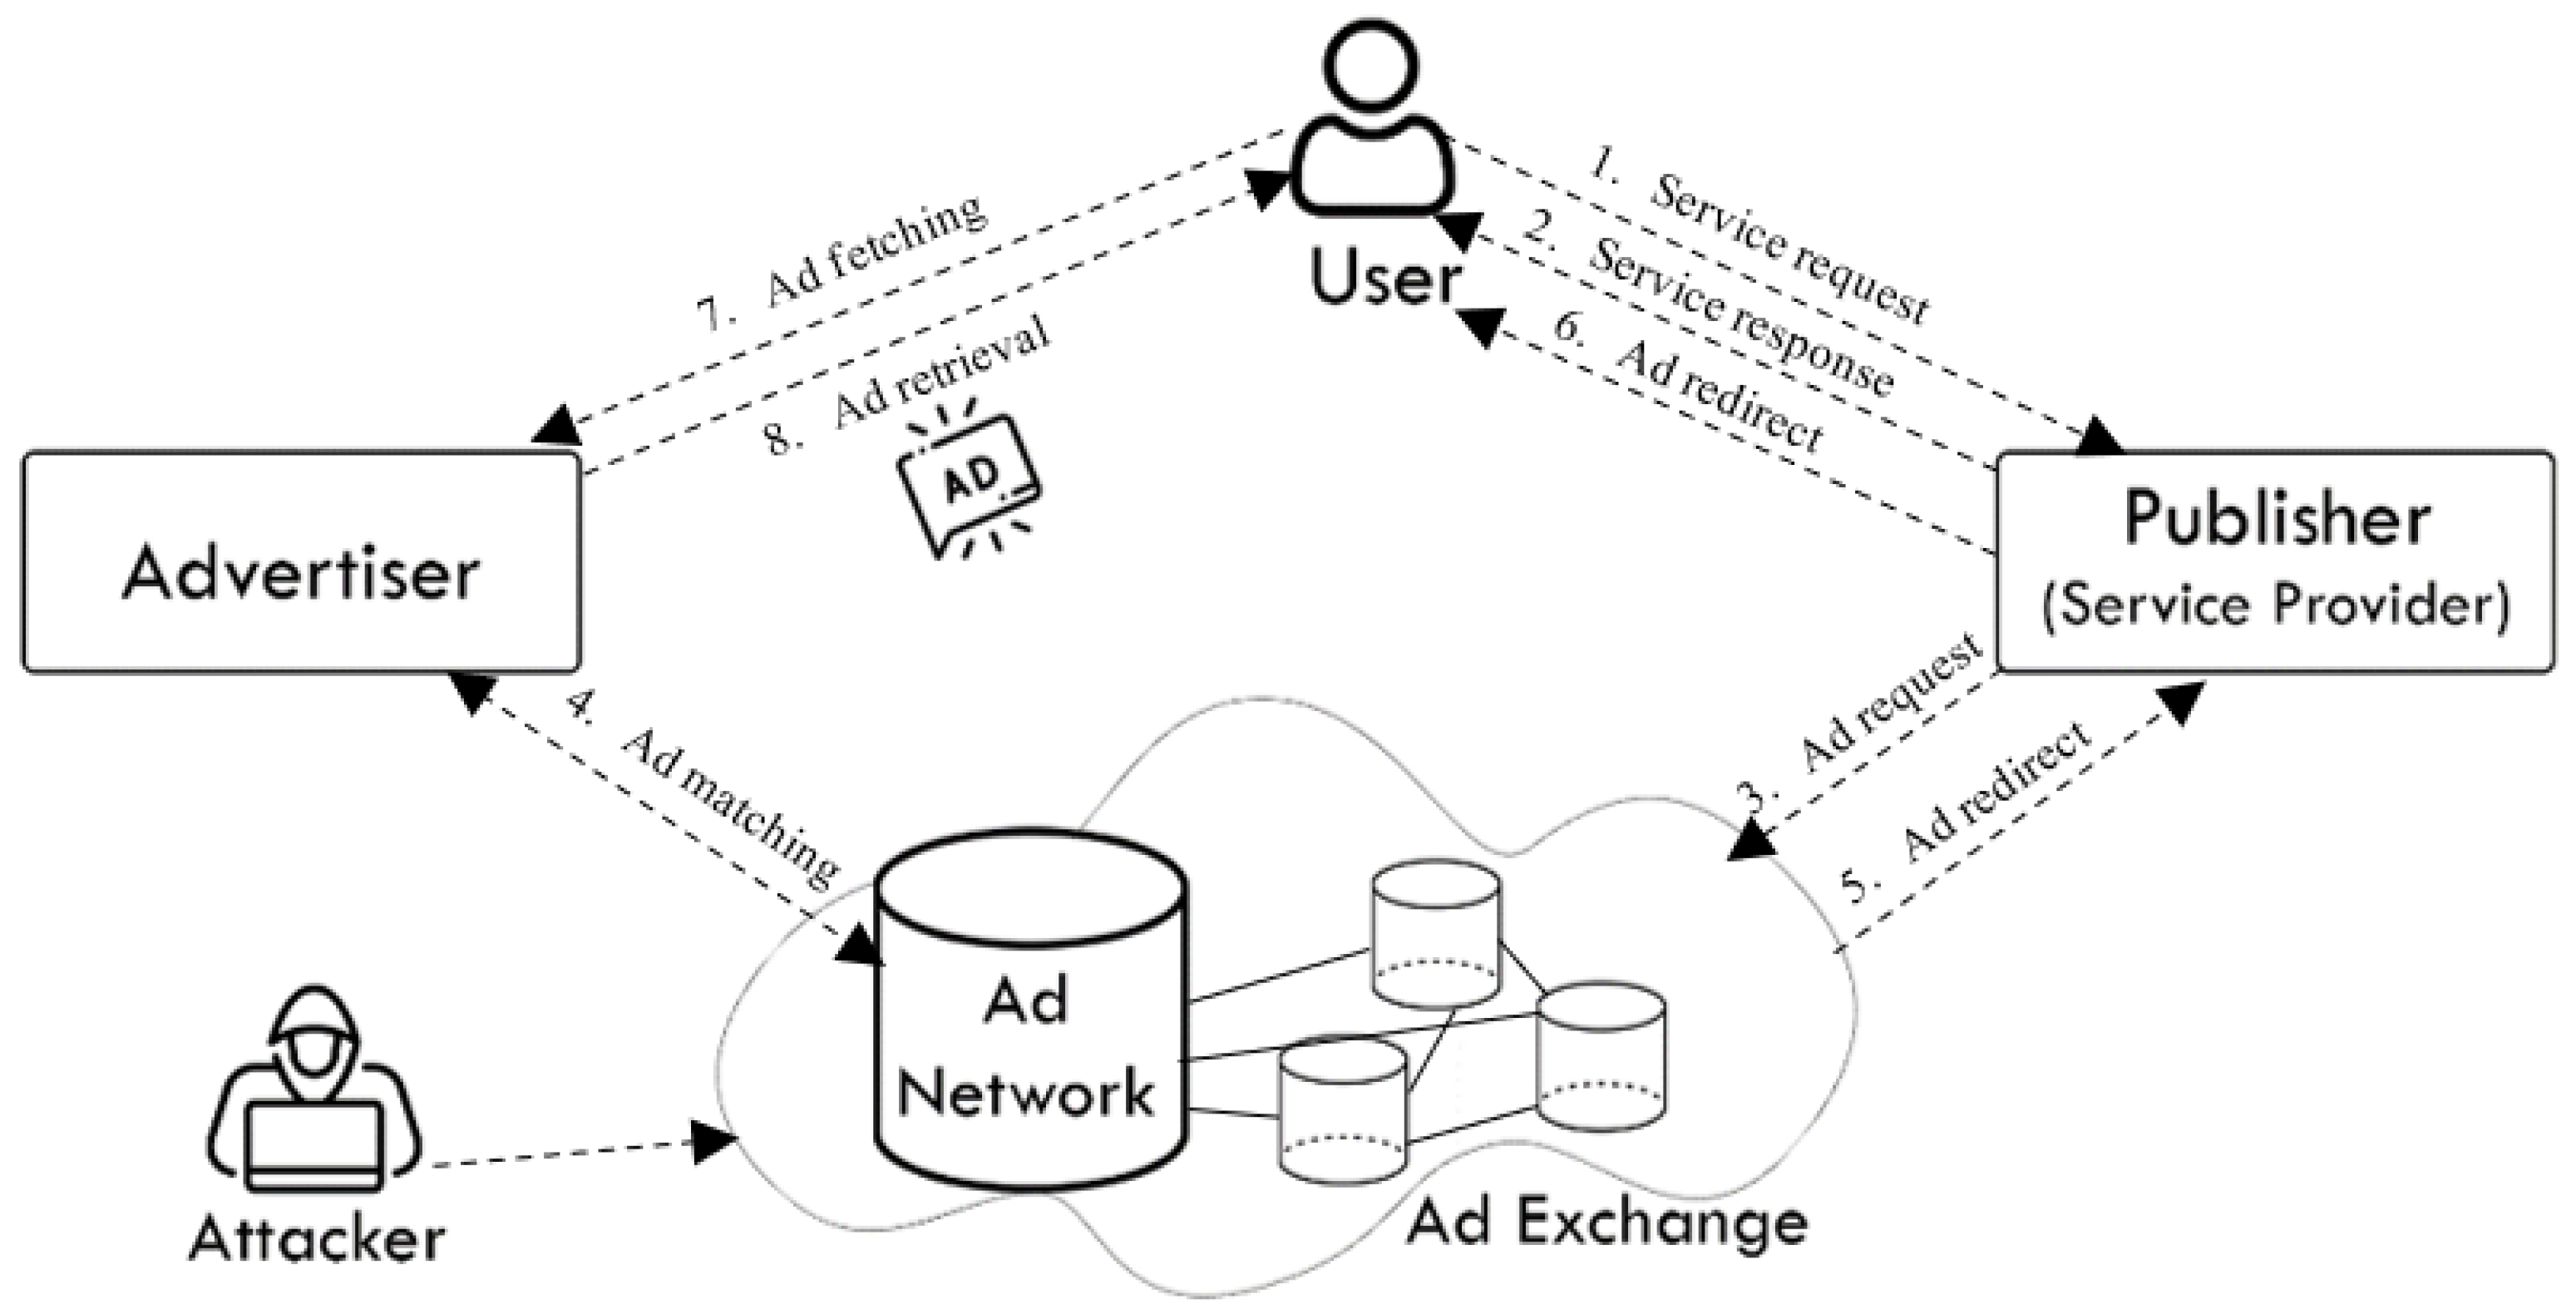
- Service request: Initially, when a user requests a service offered by a publisher (1), the publisher receives it immediately;
- Service response: Upon receiving that request, it returns the original content/service requested (2);
- Ad request: Moreover, it asks the ad network to present the user with ads that match their query and profile as results for their search (3);
- (4) Ad matching: In the real-time auction that takes place on the ad exchange, the ad network uses profile information to determine which ads will generate the most revenue;
- Ad redirects: Upon selecting an advertisement or series of advertisements, the ad network directs the provided information to the user, who then instructed by the provider to fetches the ads (5–6);
- Ad fetching and retrieval: A final step is for the user to select, fetch (7), retrieve (8) the advertisement they wish to view.
2.3. Typical Online Advertising Services
- PPC;
- Programmatic advertising services;
- Social media advertising services.
2.3.1. Pay-per-Click Advertising Services
2.3.2. Programmatic Advertising Services
2.3.3. Social Media Advertising Services
2.4. Online Advertising and Fraud
2.4.1. Click Fraud
2.4.2. Source of Click Fraud
3. Literature Review
- Case studies that leveraged AI techniques, including ML and DL;
- Studies that investigated the detection of click fraud in the advertising industry (There are several types of fraud that harm the advertising industry, including impressions fraud, publisher fraud, and click fraud. We will mainly examine studies on click fraud);
- Conducted in the last 10 years (2012–2022);
- Written in English.
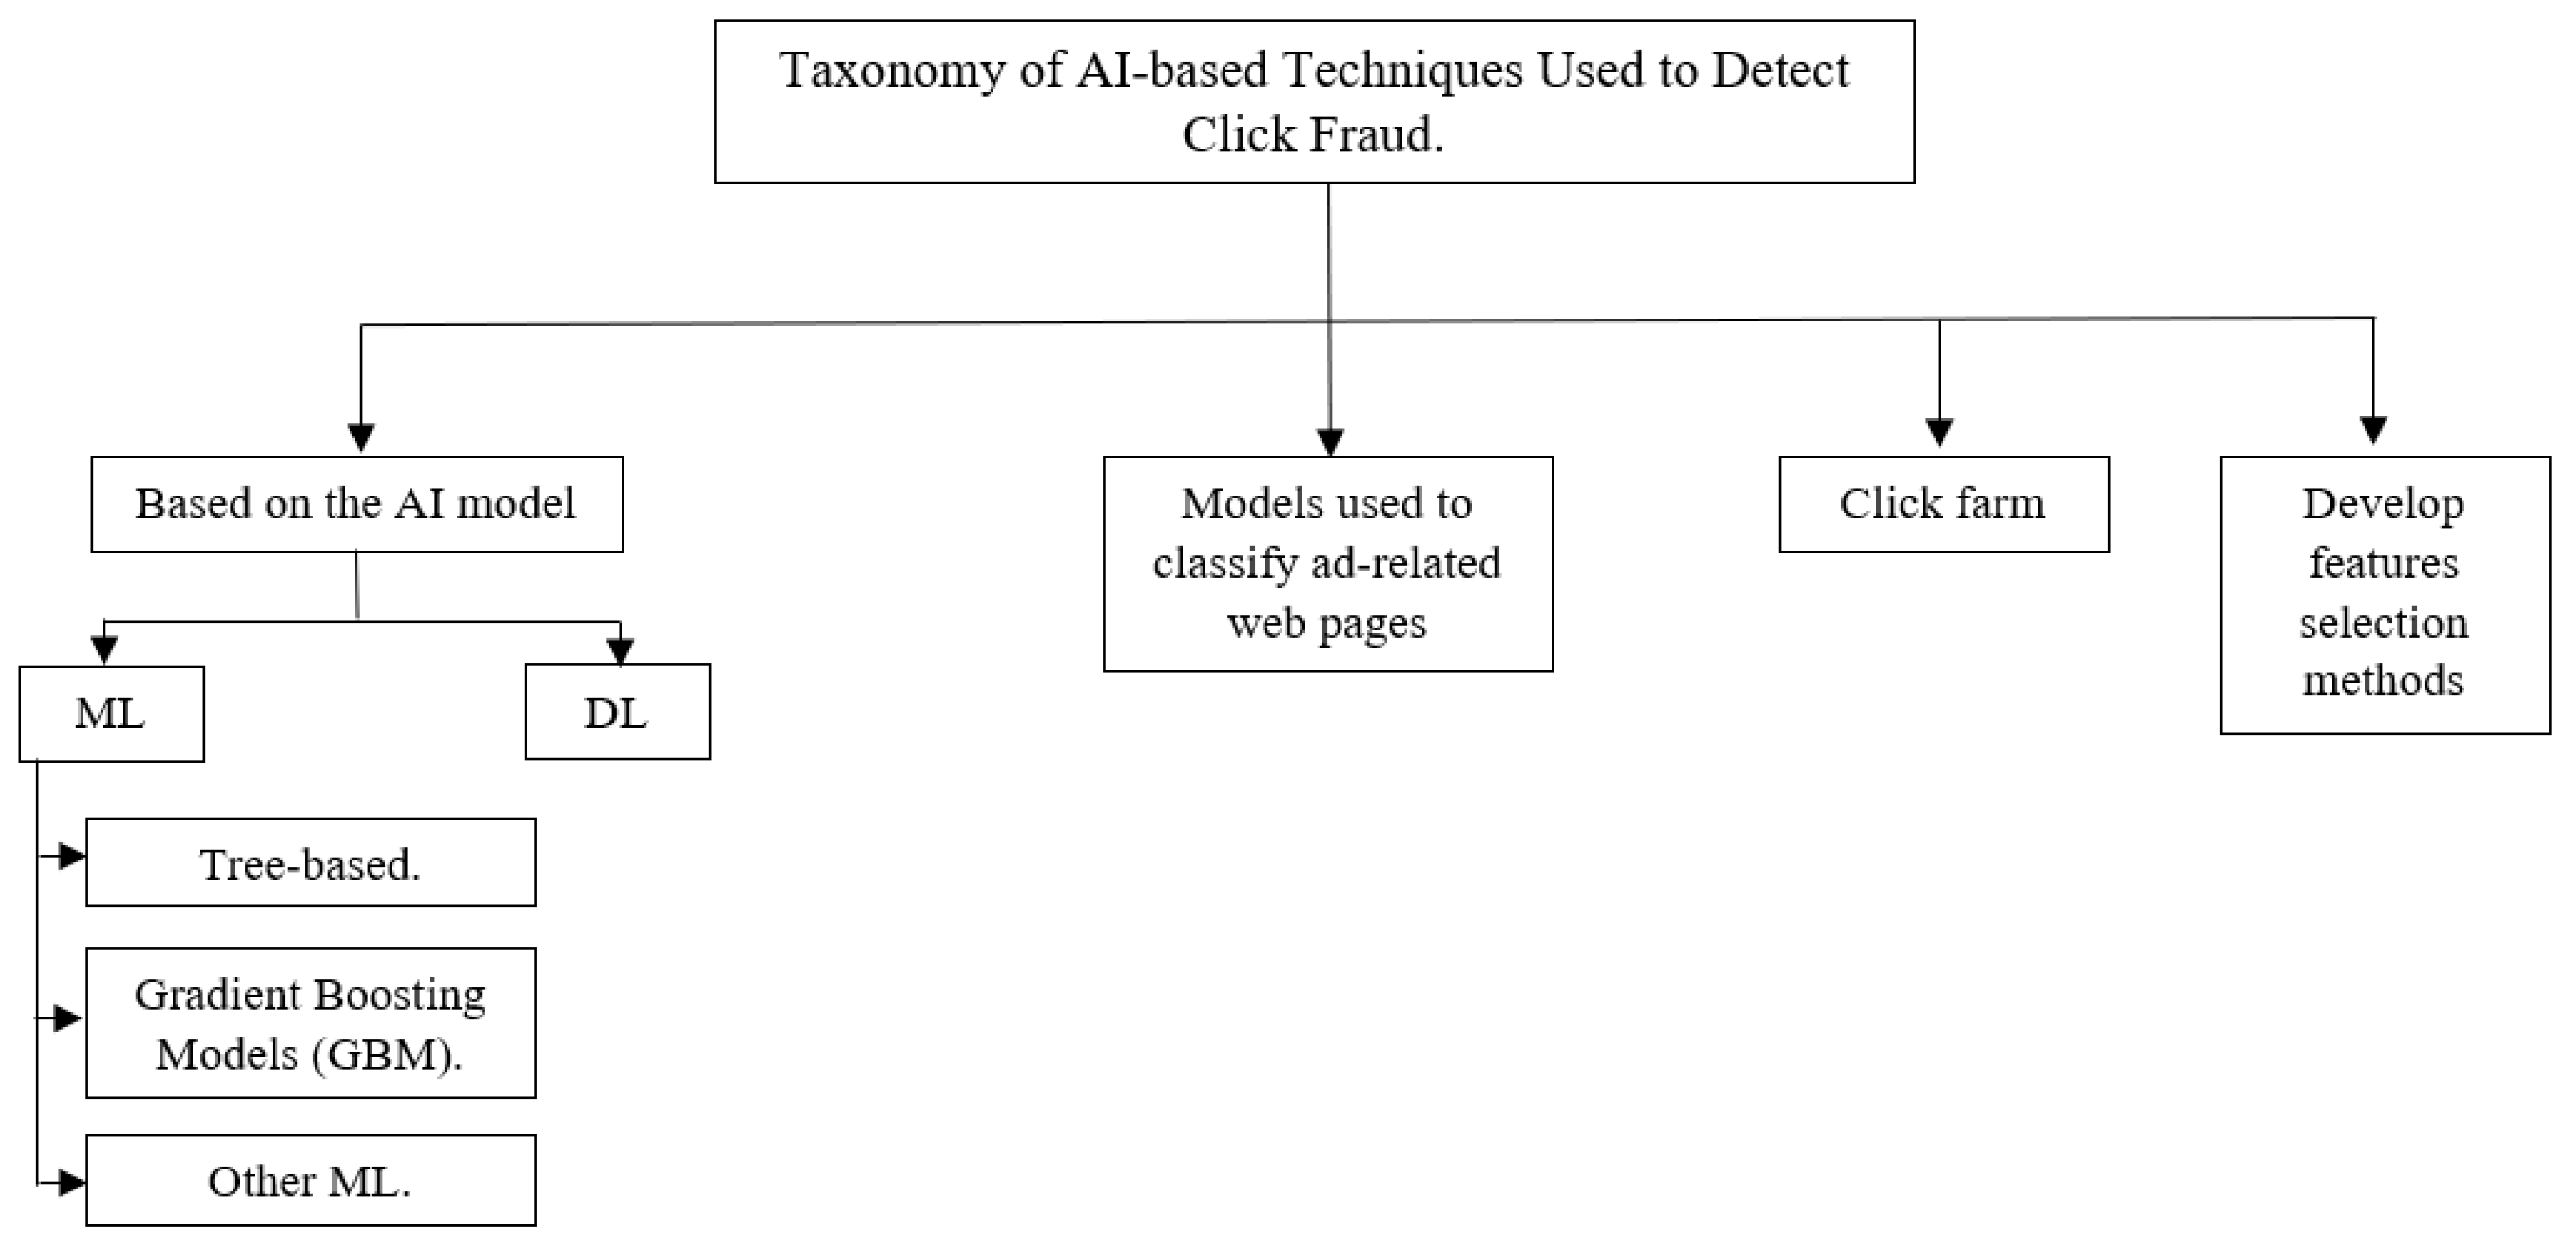
3.1. ML-Based Click Fraud Detection Techniques
3.1.1. Tree-Based Techniques
3.1.2. Gradient Boosting Models (GBM) Techniques
3.1.3. Other ML Techniques
3.2. DL-Based Click Fraud Detection Techniques
3.3. Models Used to Classify Ad-Related Web Pages
3.4. Click Farm
3.5. Develop Feature Selection (FS) Methods
4. Common Datasets in the Field of Click Fraud Detection Using AI Techniques
4.1. FDMA 2012 BuzzCity Dataset
4.1.1. Dataset Description
4.1.2. Raw Features
4.2. TalkingData AdTracking Dataset
4.2.1. Dataset Description
4.2.2. Raw Features
4.3. Avazu Click-Through Rate Prediction Dataset
4.3.1. Dataset Description
4.3.2. Raw Features
4.4. Challenges in the Common Datasets in the Field of Click Fraud Detection
5. Common Features in Click Fraud Detection Using AI Techniques
5.1. Descriptions of the Most Commonly Used Features in Ad Click Fraud Detection
5.2. Discussion of the Features Used
5.2.1. Temporal Features
5.2.2. Spatial Features
5.2.3. Clicker Behavior Features
5.2.4. Medium and IP Features
5.2.5. Ad-Related Features
5.3. Insights Derived
- Fraud detection relies heavily on features gathered from fine-grained time-series analysis [26,30,31,37,38,40,54,69,73]. The use of basic statistical calculations of temporal characteristics may preserve strong predictive ability across time while reducing the likelihood of overfitting the training data. The interval of the day (e.g., night and morning) is the most influential factor in [39], followed by the type of day. Time of day appears to be the least influential attribute;
- Fraudulent clicks are more frequent in some countries (or finer-grained geographical locations) than in others. Geographical features, such as clicks from high-risk countries, might be used as fraud indicators [34];
- The clicker’s behavior on the advertised site (i.e., the user’s browsing behavior data) is a critical aspect in verifying the clicker’s identity [33,38,50]. Unfortunately, only a few previous studies have focused on investigating and monitoring clicker behavior on an advertiser’s site; it is undoubtedly a significant signal that distinguishes fraudulent clicks from genuine ones;
- Another useful method for identifying fraudulent clicks is to observe mouse events. When visiting a website on a nonmobile platform, a human user must perform a mouse action at least once. The lack of mouse action identifies this click as invalid. However, this may not be the case for mobile platform users. Therefore, some methods were developed exclusively to test mouse event behavior on nonmobile platforms [36];
- One basic method for detecting fraudulent clicks is to check whether the computer supports JavaScript [36];
- Clicks that come from suspicious sites are highly likely to be fraudulent clicks [36];
- Historical features explain aggregated user behavior over time, and they are far more reliable than contextual features; however, contextual aspects are essential for predicting click identity for new users and advertisements [37];
- Ad placement control features, such as the acceptable number of ads on the screen, the visibility of the ad on the screen so that it is not hidden behind another element, the size of the ad displayed on the screen, and the distance between the ad and other clickable elements, such as buttons, are key aspects of click fraud detection [38].
6. Discussion
- There is a limited number of publicly available datasets, which may restrict the potential for wider and more in-depth investigations of PPC and click fraud. As a result, there is a need for fresh and diverse public datasets;
- All public datasets suffer heavily from negative class imbalance, which causes models to overclassify the greater class(es) because of the increased likelihood of their appearance; as a result, the model is biased toward the majority group. Dealing with this imbalance would require extensive processing;
- Clickers’ behavior after visiting an advertiser’s website has not been sufficiently explored, which is certainly an important factor in distinguishing human clicks from bot clicks. Most studies have not investigated behavioral aspects, as these are either not accessible in the (mainly public) datasets or are neglected and not of interest;
- Checking the legality of an IP address and whether it is on an IP blacklist may be valuable, but given the intelligence and sophistication of bots, it should not be heavily relied on, especially that bot creators use residential IP addresses to mask their bots as normal traffic. Bots can also spoof the IP addresses of other legitimate users;
- Integrating features as a combination of two or three features may be a promising step toward the more effective detection of click fraud and must be used with caution because it has been used in very few studies;
- According to Lyu et al. [95], current feature interaction models and techniques are broadly categorized as follows: (1) naive methods, which do not model feature interactions and use only raw features; (2) memorized methods, which explicitly present feature interactions as novel features and allocate trainable embeddings for them; and (3) factorized methods, in which raw features are transformed into latent vectors and feature interactions are implicitly modeled across factorization functions. Most prior efforts to detect ad click fraud used the first two types of approaches; thus, including the third type and modeling feature interactions using factorization functions may yield excellent outcomes for click classification;
- Using numerous DL models may lead to superior classification and prediction performance and effectiveness. These can also be used to directly extract features, such as deep NNs, and an efficient feature set;
- Finally, detecting click fraud is a never-ending cat-and-mouse game, as bot creators are always seeking new methods to defeat bot detection systems. The process of building systems to identify and prevent click fraud should continue because bots are constantly evolving over time. Advanced solutions to prevent and deal with them are required.
7. Conclusions
Author Contributions
Funding
Institutional Review Board Statement
Informed Consent Statement
Data Availability Statement
Conflicts of Interest
Appendix A

| Ref. | Algorithms | Dataset | Used Features | Used Metrics (For the Best Preforming Model) |
|---|---|---|---|---|
| [35] | GBM + RF. | FDMA2012 BuzzCity Dataset. | % Clicks in periods, % Referred in periods, % Agent in periods, First 15 min precent, Second 15 min precent Third 15 min precent, Last 15 min precent, Avg and Std spiky ReAgCnIpCi, Avg and Std spiky ReAgCnIpCi in: (Morning, Afternoon, Night), Avg spiky referred URL, Avg and Std spiky Cid, Avg and Std spiky Cid, Avg spiky referred URL in: (Morning, Afternoon, Evening, Night), Avg and Std spiky agent, Avg and Std spiky IP, Avg and Std spiky ReAgCnIp, Avg and Std spiky Ag in: (Morning, Afternoon, Evening, Night), Cat number, Avg and Std, #Clicks, Avg and Std null Referrer in periods, Avg and Std #Clicks in 1 h, %Clicks certain Ctry, Unique agent, Unique, IP, #Clicks, Avg and Std null agent, Avg and Std null Referrer, Publisher ID, Unique Cid, Unique Ctry, and Unique Referrer. | Average Precision (AP) = 59.38% |
| [28] | DT. | Private -Crawled Dataset. 24,801,406 Ad-Paths. | Node roles, Node domain regs, Node frequency, and Node-pair frequency. | For “click-fraud pages”: False Detection (FD) = 14.61%, False Positive (FP) = 13. And for “click-fraud domain-paths” FD = 3.65%, FP = 125. |
| [29] | RF. | FDMA2012 BuzzCity Dataset. | #Clicks, #Clicks same IP, Unique IP, Category, Agent, Cid, Cntr, Long Click profile, Short click profile, and URL profile. | Accuracy: validation-set = 49.99%. and the test-set = 42.01%. |
| [30] | RF, REP tree, BN, Decision Table and NB. | Private Dataset. | #Advertisers, #Clicks, #Referrers, #Ips, #Clicks in night, #Clicks in morning, #Clicks in afternoon, #Clicks in evening, Click ratio on advertiser, Click/IP ratio, Click/cookie ratio, Var #Clicks same IP, Mean_Period_Click, Std_Period_Click, Popular area, Most_hour_click, Avg_Len_UA, and Avg_Lev_Referrer. | RF.Precision = 98.5%, and RF.Recall = 98.5%. |
| [31] | J48, RepTree, and RF. | FDMA2012 BuzzCity Dataset. | No_of_clicks_per_1min_Avg, No_of_clicks_per_1min_Max, No_of_clicks_per_1min_Var, No_of_clicks_per_1min_Skew, No_of_clicks_per_5min_Avg, No_of_clicks_per_5min_Max, No_of_clicks_per_5min_Var, No_of_clicks_per_5min_Skew, No_of_clicks_per_1hr _Avg, No_of_clicks_per_1hr _Max, No_of_clicks_per_1hr _Var, No_of_clicks_per_1hr _Skew, No_of_clicks_per_3hrs _Avg, No_of_clicks_per_3hrs _Max, No_of_clicks_per_3hrs _Var, No_of_clicks_per_3hrs _Skew, No_of_clicks_per_6hrs _Avg, No_of_clicks_per_6hrs _Max, No_of_clicks_per_6hrs _Var, No_of_clicks_per_6hrs _Skew, Max #Clicks same IP, #Clicks unique IP, Click ratio on IP, Entropy #Clicks same IP, Var #Clicks same IP, Avg #Clicks same agent, Max #Clicks same Agent, Var #Clicks same agent, Skew #Clicks same agent, Max #Clicks same Ctry, Var #Clicks same Ctry, Skew #Clicks same Ctry, Max #Clicks same Cid, Var #Clicks same Cid, Skew #Clicks same Cid, and Channel. | Ensemble model. Accuracy = 59.39%. |
| [32] | LR, and ERT. | FDMA2012 BuzzCity dataset. | #Clicks same IP ratio per 1 min, #Clicks ad ratio per 1 min, #Clicks agent ratio per 1 min, #Clicks ctry per 1 min, #Clicks Referrer ratio per 1 min, Channel, Publisher account, Publisher address, Click per (ad, device, ctry, and referrer) ratio, Gap interval btw clicks, Click fraction from top 20 ctry, Click fraction from non-top 20 ctry, Click fraction from UN/NA ctry, Click fraction from UN/NA referrer, and Click fraction from UN/NA Agent. | ERT.Average Precision (AP) = 55.64%. |
| [33] | SVM, LR, BN, MLP, C4.5, RepTree, and RF. | FDMA2012 BuzzCity Dataset. | Same as used features in [31], in addition to: Click ratio on IP, #Cid, Cid Entropy, Cid/Click Ratio, #Ctry, #Referrer, Ctry/Click Ratio, Ctry Entropy, Channel_ Prior, Referrer/Click Ratio, and Non-Referrer/Click Ratio. | C4.5.Precision = 98.12%, Recall = 98.52, and F1-score = 98.32%. |
| [34] | Single: FT tree, REP tree, Bayes network, RPROP. Ensemble: LAD tree, NB tree, RF, Random subspace, Rotation Forest, Tree ensemble. Ensemble of ensemble: Blending. | FDMA2012 BuzzCity Dataset. | Unique Referrer, Unique Cid, Unique Ctry, #Clicks, Count IP in hour, Count IP&Agent in sec, Count IP&Agent in day, Count sub-IP in sec, Count sub-IP in min, Count sub-IP in hour, Count sub-IP in day, Count sub2-IP in day, Avg IP&Agent in min, Avg IP&Agent in day, Avg Cid in min, Agent-1, and Agent-2. | Ensembles of ensemble models.AP = 52.3%. |
| [36] | C4.5. | Real-World Collected Dataset: 9.9 thousand clicks. | Mouse clicks count, Mouse clicks on other pages, Mouse clicks on links, #Mouse scroll, #Mouse scroll on other pages, #Mouse moves, #Mouse moves on other pages, Page views, Visit duration, Execution efficiency, Browser Type, Legitimacy of IP, Publisher’s reputation, and Unique Ctry. | FP = 79%, False Negative Rate (FNR) = 5.6%, and Accuracy = 99.1%. |
| [73] | RF. | 508,005 HTTP requests. | # low entropy params # high entropy params Stddev(# param values to # apps) # unique params Avg(# params) Avg(# param values to # apps) # likely enum params Avg(depth in tree) # likely non-enum params Avg(tree height) # num-enum params % children with redirection Avg(response size) Stdev(# body urls) Stdev(depth in tree) Stdev(request size), Has parent, # enum params, status codes, the length of the requests, the length of the replies, timestamp, and publisher ID. | TPR = 71.8%, FPR = 00.1%, and Accuracy = 85.9%. |
| [37] | DT, and LR. | Facebook Ads Impression Dataset. | Confidential Features. | DT + LR. Normalized Entropy (NE) = 95.65%. |
| [38] | C4.5. | Apple iOS Apps 2012 Dataset: 13,267 game Apps. | App ID, Developer ID, Price, Category ID, App popularity, Release Date, Current Version, #Apps, Avg App Rating, Avg Number of App Versions, Avg pos_reviews, %Free apps, Number of Ad-controls, Visibility of Ad-controls, Size of Ad-control, Misplace of Ad-control on tiny screen, and User interest. | Precision = 87.6%, Recall = 71.3%, and F1-score = 76.8%. |
| [76] | RFE, and HDDT. | FDMA2012 BuzzCity Dataset. | Avg #Clicks per: (1 min, 5 min, 10 min, 1 hr, 2 h, and 6 h), Var #Clicks per: (1 min, 5 min, 10 min, 1 h, 2 h, and 6 h), Var #Clicks same agent, Var #Clicks same IP, Click ratio on: (IP, agent, cid, ctry, and referrer), Var #Clicks same Cid, and Var #Clicks same Ctry. | HDDT.Accuracy = 64.07%. |
| [39] | Decision Trees (DT), Naive Bayes (NB), and Support Vector Machines (SVM) | FDMA2012 user-click dataset. | Clicktime: Day, Hour of the day, Period of day, Type of day, and Month. | DT.Precision = 29.24% |
| [74] | NB, SVM, K-Nearest Neighbors (KNN), C4.5, and Random Forest (RF) | Websites dataset: 87 ad requests. Click dataset: 54 clicks. | To distinguish between an ad-related URL and a non-ad-related URL: 1st dataset: URL structure characteristics, additional URLs contained in the URL, and other page characteristics destination IP, content type, content length, status code, and location URL The number of query parameters, and their average length. 2nd dataset: NA. | RF.Avg. Accuracy = 99.61%, RF.Precision = 98.05%, RF.FP Rate= 0.27% |
| [40] | RF | FDMA2012 BuzzCity dataset. | Gap interval btw clicks in 1 h, #Clicks same IP in sec, Unique IP, #Clicks, and Click ratio on ctry. | Avg. Precision= 36.20% |
| [43] | GBDT. | Private Dataset: 0.13 billion impression records, 8.5 million click records and about 1.85 million conversion records. | Clicks, Unique IP, Unique Ad-project, Unique Ad-position, Unique agent, Click ratio on: (IP, cookie Unique Ad-project, Unique Ad-position, and Unique agent.) , #Clicks in periods (evening and night), Var Period Click, Mean (var) clicks, cookie, agent, creative, project, and position in hrs, Mean (var) clicks, cookie, agent, creative, project, and position in mins, Mean (var) clicks, cookie, agent, creative, project, and position in sec, Mean (var) of intervals, Agent ID, and Channel. | In user classifier: Precision = 85.02%, Recall = 98.31%, and F1-score = 91.18%. In traffic classifier: Precision = 96.53%, Recall = 94.89%, and F1-score = 95.70%. |
| [44] | LR, DT, GBDT, and XGBOOST. | AdMaster Dataset. Train-set: 4,800,000. Test-set: 1,200,000 | Click time, UAgent frequency, IP_Cookie frequency, IP frequency, Publisher ID, Campaign ID, Publisher frequency, Cookie frequency, and Born Cookie. (Note: There is insufficient description on the features involved in training the model.) | DT.Accuracy = 94.8%, DT.F1-score = 98.83%, and DT.Run-Time = 4621.50 s. |
| [63] | KNN, SVM, and ANN. | Private Dataset: 3247 instances. Train-set= 30%, and Test-set= 70%. | Var #Clicks per time intervals, #Clicks, #Clicks unique IP, Click ratio on IP, Suspicious click ratio, and App down ratio. | KBB.Accuracy = 98.26%, and F1-score = 99%. |
| [64] | AE. | TalkingData Dataset. | Ip, App Id, Agent, OS, Channel Id, click_time, Attributed time, and Is attributed. | In balanced dataset: Accuracy = 68%, Precision = 62.3%, Recall = 98%, and NPV (Negative predictive value) = 94%. In Un-balanced dataset: Accuracy = 91%, Precision = 100%, Recall = 92%, and NPV = 5%. |
| [65] | Cost sensitive neural BPNN (CSBPNN) + ABC. | FDMA2012 BuzzCity dataset. | #Clicks, Second 15 min precent, Avg spiky ReAgCnIpCi, Avg spiky ReAgCnIpCi in: (Afternoon, Night), Avg spiky referred URL, Avg spiky referred URL in night, Avg spiky agent, Avg spiky IP, Std #Clicks in min, Std #Clicks in hr, Ctry precent, and Status. | Accuracy = 99.14, Precision = 88.27%, Recall = 91.87%, and F1 score = 90.03%. |
| [53] | K-NN + TF-IDF algorithm. | Private online shop dataset. 30,000 Instances. Train-set: 80%, Validation-set: 10%, and Test-set: 10%. | #Mouse scroll, Mouse scrolling, #Mouse moves, Mouse movements, Page views, Pages in history, #Visits, Keystroke data, ISP, HTTP referrer, Screen resolution, Screen orientation, Language, IP, and Fingerprint | Accuracy = 97.11%. |
| [54] | SVM, K-NN, AdaBoost, DT, and Bagging. | Waseet Dataset: 500 clicks. | Gap interval in: (1 min, 1 s > 1 min, >1 s), Agent, Session ID, IP, #Clicks, Is clicked (Note: There is insufficient description on the features involved in training the model.) | KNN.Precision = 97.6%, KNN.Recall = 97.6%, KNN.TPR = 97.6%, and KNN.FPR = 0.034%. |
| [41] | NB, DT, RF. | Private Dataset: 98570 CloudBot records and 164786 human records. | #Peer nodes, #Packets, #Bytes, #Flows, Max, Min, Med, Mean, Var, and STD of flows in packets, Max, Min, Med, Mean, Var, and STD of bytes in flow, Max, Min, Med, Mean, Var, and STD of bytes in flow duration, Max, Min, Med, Mean, Var, and STD of application layer protocol fields, Max segment size, TCP window size, TCP window scale, NOP, Time to Live, and Port. | RF.Precision = 90.8%, RF.TP = 29162, and RF.FP = 2954. |
| [55] | SVM. | Click dataset, and User Dataset. | IP, Click time, Click frequency, real evaluation score, click stream density, Gap interval btw clicks, Surfing time, total time spent (after click), students’ evaluation information, and #Clicks. (Note: There is insufficient description on the features involved in training the model.) | Accuracy = 97.8%, Time complexity = 10%, and Arrival Rate = above 95%. |
| [56] | LR. | Public Kaggle AdTrackin TalkingData Dataset. | IP, App Id, OS, Agent, Channel Id. and Click time: minutes and seconds. | Normality Test (NT) = 0.0567, and Variance Test (VT) = 0.0598 |
| [66] | ANN, AE, GAN, LR, SVM, RF, and Multinomial NB. | Public Kaggle AdTrackin TalkingData Dataset. | IP, Agent, Channel Id, App Id, OS, Click time, and Is attributed. | LR.Accuracy = 99.91%, LR.Recall = 99%, and LR.Precision = 99%. |
| [45] | LightGBM | Public Kaggle AdTrackin TalkingData Dataset. | OS, App Id, Agent, Channel Id, Day, Count: (IP, Hour, Day), (IP, App Id), ((IP, App Id, OS). Group by | Count unique: IP|Channel Id, (IP, Day |Hour, IP|App Id, (IP, App Id)|OS, IP|Agent, App|Channel, (IP, Agent, OS) Channel Id. Group by|Variance: ((IP, App Id, OS)|hour, ((IP, App Id, Channel Id)|Day, ((IP, App Id, Channel Id)|Hour, and Next_click: (click_time, Channel) | Accuracy = 98%. |
| [67] | Sequential Minimal Optimization, Bagging, RF, Logistic Model Tree, and CNN. | Private- signals dataset: 50,000 click, constitutes 4,957,200 labelled time-domain signals. | Time-domain features 1-norm, Infinity norm, Fresenius Norm, Max, Min, RMS, RMSE, Mean, PNum, TNum, SMA, Skew, Kurt, ATP, and ATT. Frequency-domain features, including Amplitude spectrum, Power spectrum, Formant of the signal spectrum, etc. (Note: There is insufficient description on the Frequency-domain involved in training the model.) | CNN.Accuracy = 84.21%. |
| [75] | SVM, RF, NN. | Taobao platform dataset: 1100 instances. | Main good features: Store markdown, Sales, #Successful transactions, Collection, and Collection conversion rate. On-line shop feature: Deposit, Operating duration, Reputation level, Avg reputation score, Number of fans, Favourable rating, Number of reviews, Rate of reviews with pictures, Rate of additional reviews, and Collection conversion rate of. | Ensemble model.Accuracy = 97.4%, Ensemble model.Precision = 99.6%, Ensemble model. Recall = 90.1%, Ensemble model. F1-score = 94.5%, and Ensemble model.AUC = 98.8%. |
| [46] | GTB. | FDMA2012 BuzzCity Dataset. | Avg spiky ReAgCnIpCi in: (Morning, Afternoon, Night), Std spiky ReAgCnIpCi in: (Morning, Afternoon, Night), #Clicks, Avg and Std #Clicks in min, Avg and Std #Clicks URL is null, %Clicks (Morning, Afternoon, Evening, Night), Avg and Std same URL_Ag_Ctry_Cid in 1 min, #Period_clicks/#clicks, %Brand_clicks/#clicks, and %Ctry_clicks/#clicks. | AP = 60.5%, Recall = 57.8%, and F1-score = 59.1%. |
| [68] | DNN. | Private Mobile-ad Dataset. | User ID, app ID, ad ID, geographical attributes: encrypted IP and city, action type, action time, device ID, device system models, and screen size. +MORE extracted features based on Window T. (Note: There is insufficient description on the features involved in training the model.) | Avg (For the whole dataset): Precision = 63%, and AUC = 95.65% |
| [69] | CSCNN. | FDMA2012 BuzzCity dataset. | Unique agent in periods T2, Avg and Std of Unique agent in periods T1, Agents’ ratio in T2, Std same agent T2, Max same agent T2, Agent Entropy T2, Unique IP in periods T2, Avg and Std of Unique IP in periods T1, IPs’ ratio in T2, Std same IP T2, Max same IP T2, IP Entropy T2, #Clicks in T2, Unique Cid in periods T2, Avg and Std of Unique Cid in periods T1, Cids’ ratio in T2, Std same Cid T2, Max same Cid T2, Cid Entropy T2, Unique Ctry in periods T2, Avg and Std of Unique Ctry in periods T1, Ctry ratio in T2, Std same Ctry T2, Max same Ctry T2, Ctry Entropy T2, Unique Referred periods T2, Avg and Std of Unique Referred in periods T1, Referred ratio in T2, Std same Referred T2, Max same Referred T2, Referred Entropy T2, Unique IP&Agent periods T2, Avg and Std of Unique IP&Agent in periods T1, IP&Agent ratio in T2, Std same IP&Agent T2, Max same IP&Agent T2, and IP&agent Entropy T2. | Precision = 89%, Recall = 93%, F1-scrore = 92%, G-mean = 96.5%, and AUC = 93%. |
| [47] | SVM, KNN, DT, RF, and GBDT | University- dataset: 32119 instances, 8713 fraud clicks, 23406 benign clicks. | Referred URL, Server IP, IP, Agent, and Click time | GBDT.Accuracy = 97.20%, False Negative Rate (FNR) = 15.20%, True Negative Rate (TNR) = 93.10%, False Positive Rate (FPR)= 76.90%, and True Positive Rate (TPR) = 96.80%. |
| [48] | XGBoost | Private Dataset. Train: 75%, Test: 25%. | Day, Hour, IP, App Id, OS, and Agent. | Accuracy = 91%, Precision = 87%, Recall= 96%, and F1-score = 91%. |
| [49] | MLP, NB, KNN, ML), Linear-SVC, and Heuristics | Public Kaggle AdTrackin TalkingData Dataset. | For MLP: App Id, Agent, OS, App Id, Channel, Hour, Day, and click count. For other models: App Id, Agent, OS, App Id, Channel, Hour, Day, Avg hourly click CvR, Avg App CvR, Avg OS CvR, Avg Agent CvR, Avg Channel CvR, #Clicks same IP, #Clicks unique IP, IP only one, Avg IP CvR, #Click IP&Hour&Day, #Click IP&App, #Click IP&App&OS, and Var click day by IP&App&Channel. | MLP.Precision = 95.43%, Training Time per Click = 284 ms, and Prediction Time per Click = 9.63 ms. |
| [42] | RF. | FDMA2012 BuzzCity dataset. | Same as Ref. [35] | Accuracy = 93%, acc+ = 93.24%, acc- = 92.15%, and G_means = 90.37% |
| [77] | RF. | 1st Dataset: Public Kaggle AdTrackin TalkingData Dataset. 2nd Dataset: Avazu Click-Through Rate Dataset. 3rd Dataset: Criteo Dataset: 756,554. | 1st Dataset: IP, App, Device, OS, Channel, Click day, Click hour, Click min, Click sec, Click ID, attributed_time, and is_attributed. 2nd Datset: Hour, Site_Id, Site_cat, Site_domain, App, App_Id, App_cat, App_domain, device_Id, Device_Ip, Devic_model, Device_type, Device_conn_type, hour_of_click: day, hour, and month, Click_frequency_in_10hrs, C14-C21 (anonymized categorical variables). (Note: There is insufficient description on the 3rd dataset’s features involved in training the model.) | ARFI: For 1st Dataset: Accuracy = 95.121%, Precision = 95.150%, Recall = 95.120%, F1-score = 95.010% and AUC = 91.401%. For 2nd Dataset: Accuracy = 83.328%, Precision = 79.260%, Recall = 83.330%, F1-score = 78.130% and AUC = 54.040%. For 3rd Dataset: Accuracy = 70.270%, Precision = 67.670%, Recall = 70.270%, F1-score = 67.210% and AUC = 59.381%. MRFI: For 1st Dataset: Accuracy = 95.121%, Precision = 95.150%, Recall = 95.120%, F1-score = 95.010% and AUC = 91.401%. For 2nd Dataset: Accuracy = 83.328%, Precision = 79.260%, Recall = 83.330%, F1-score = 78.130% and AUC = 54.040%. For 3rd Dataset: Accuracy = 70.270%, Precision = 67.670%, Recall = 70.270%, F1-score = 67.210% and AUC = 59.381%. |
| [70] | FCNN. | For Click monitoring = 300,000 logs, and for Lead monitoring = 263,000 logs. | For click monitoring: Date, Click time, Web Id, OS, Browser Type, ISP, Language, IP, #Mouse scroll, Mouse scrolling, Mouse movements, #Page views, and Keystroke data. For Lead monitoring: (In addition to the same “click monitoring” features): #Mouse moves, #Pages in history, #Pasted word, #Text_field clicked, and Filled form. | Accuracy = 99.5%, Precision = 99.5%, Recall = 99.5%, and F1-score = 99.5%. |
| [71] | VAEs. | 20,000 Mobile apps. | #Axis APIs, #View-Size APIs, #Rand Num APIs, DDG size, and Rand condition. | RunTime: 18.42 s. |
| [50] | CF + XGBoost. | Three data sets: Public Kaggle AdTrackin TalkingData Dataset. Avazu Dataset, and Kad Dataset: 1000 samples. | 1st dataset: IP, App Id, OS, channel Id, Day, Hour, Minute, Second, and Unique IP in different time intervals. 2nd dataset: Site_Id, Site_cat, Site_domain, App, App_Id, App_cat, App_domain, Agent, Agent ID, IP, Conn type, Day, Hour, Month, Click frequency: (in 10 h.) 3rd dataset: Day, Hour, Second, Month, Age, Income, Daily Internet Usage, City, Cntry, Gender, and Is clicked. | For the 1st dataset: Precision = 96.45%, Recall = 96%, F1 = 96%, and AUC = 93.87%. 2nd dataset: Precision = 93%, Recall = 93%, F1 = 93%, and AUC = 87.37%. 3rd dataset= Precision = 95%, Recall = 94%, F1 = 94%, and AUC = 93.43%. |
| [57] | LR. | Public Kaggle AdTrackin TalkingData Dataset. | IP, and Click time. | NA. |
| [72] | LR, RNN, LightGBM, AdaBoost, XGBoost, and GB. | Public Kaggle AdTrackin TalkingData Dataset. | Ip, App Id, Agent, OS, Channel Id, Click frequency, Hour, Day, Attributed time, Click ID, IP/App Id, IP/Agent, IP/OS, IP/Channel Id, IP/Hour, IP/Day, and IP/Attributed time. | LR.Accuracy: 98.69%, Precison: 99%, Recall: 99%, and F1-score: 99%. |
| [51] | XGBoost, Gradient Boosting, and AdaBoost. | Two public Kaggle datasets: AdTrackin TalkingData and Advertising. | 1st dataset: Ip, App Id, Agent, OS, Channel Id, Click time, Attributed time, and the IP feature was combined with all other features in combination of one/two attributes: IP/App Id, IP/Agent, IP/OS, IP/Channel Id, IP/Click time, and IP/ Attributed time. 2nd datset: Daily time, Age, Area, Ad Id, City, Ctry, Click time, and Is clicked. | XGBoost.Accuracy for 1st dataset: 96%, and for 2nd dataset: 93%. |
| [58] | Multimodal and Contrastive Learning. | Private Dataset from Alibaba. Train-set: 2.54 million clicks, and Test-set: 0.75 million clicks. | NA. | Precision = 98.7%, Recall = 85.4%, F1-score = 91.6%, and AUC = 93.3%. |
| [59] | HMSM. | Private Dataset. | Click time, Event Id, Event Timestamp, Event count, Max event count, Unique event, Unique event groups, Surfing time, and Day type. (Note: There is insufficient description on the features involved in training the model.) | Accuracy = 94%, precision = 99 %, recall of 95 %, specificity of 91%, and F-score of 97%. |
| [78] | RF. | 1st Dataset: Public Kaggle AdTrackin TalkingData Dataset. 2nd Dataset: Avazu Click-Through Rate Dataset. 3rd Dataset: Criteo Dataset: 1,000,000. | 1st Dataset: IP, App Id, Agent, OS, Channel Id, Day, Hour, Minute, Second, Click ID, Attributed time, and Is attributed. 2nd Datset Site_Id, Site_cat, Site_domain, App, App_Id, App_cat, App_domain, Agent, Agent ID, IP, Conn type, Day, Hour, Month, Click frequency: (in 10 h), and C14-C21 (anonymized categorical variables). (Note: There is insufficient description on the 3rd dataset’s features involved in training the model.) | For 1st Dataset: Accuracy = 91.04%, AUC = 88.35%, Recall = 83.02%, Precision = 81.27%, F1-score = 82.14%. For 2nd Dataset: Accuracy = 77.99%, AUC = 56.48%, Recall = 23.98%, Precision = 30.69%, F1-score = 26.92%. For 3rd Dataset: Accuracy = 64.63%, AUC = 62.79%, Recall = 57.83%, Precision = 45.19%, F1-score = 50.74%. |
| [60] | LR and GNB. | Public Kaggle AdTrackin TalkingData Dataset. | IP, Agent, Channel Id, App Id, Attributedtime, OS, Click time, Is attribute, #Clicks daily, and Click frequency. | GNB.Accuracy = 99.76%, GNB.Recall = 99%, and GNB. F1-Score = 100%. |
| [61] | Catboost. | Private Dataset “mobile.de”: Train-set: 200,000 records. Test-set: 240,000 records. And a part of the public Kaggle AdTrackin TalkingData Dataset. | 1st dataset: (Confidential 27 features). 2nd dataset: IP, App Id, Agent, OS, Channel Id, click time, Day, and hour. | On 1st dataset: F1-Score = 71.27%, Precision = 73.35%, Recall = 68.95%, and AUC = 98.09%. On 2nd dataset: F1-Score = 98.88%, Precision = 99.02%, Recall = 98.73%, and AUC = 99.94%. |
| [62] | QDPSKNN. | FDMA2012 BuzzCity Dataset (click dataset only) | Same as Ref. [35] | 1st dataset: Precision = 75.1%, Recall = 70.1%, F1-Score = 72.5%, and G-mean = 73.3%. |
| [52] | Deep Convolutional Neural Network (DCNN), SVM, RF, DT, AdaBoost, and GBT. | FDMA2012 BuzzCity Dataset. | Same as Ref. [35] | GTB.Precision = 79.8%, GTB.Recall = 70.8%, GTB.F1-score = 72.4%, and GTB.AUC = 92.4%. |
Appendix B
| Features | Descriptions |
|---|---|
| Temporal Features | |
| Click time | Timestamp of ad click in Coordinated Universal Time |
| Hour | Hour of day when the click was made |
| Minute | Minute of hour when the click was made |
| Second | Second of minute when the click was made |
| Period | Period of day when the click was made: midnight, early morning, morning, midday, evening, and night |
| #Clicks in periods | Total number of clicks in the evening (18:00–24:00) and at night (00:00–06:00) |
| % Clicks in periods | Percentage of clicks belonging to each publisher in the morning (during the hours 06:00:00–12:00:00 of the day), afternoon (during the hours 12:00:00–17:00:00 of the day), evening (during the hours 17:00:01–20:00:00 of the day), and night (during the hours 20:00–24:00:00 and 00:00:00–06:00:00 of the day) |
| %Referredin periods | Percentage of distinct referred URLs belonging to each publisher in the morning (during the hours 06:00:00–12:00:00 of the day), afternoon (during the hours 12:00:00–17:00:00 of the day), evening (during the hours 17:00:01–20:00:00 of the day), and night (during the hours 20:00–24:00:00 and 00:00:00–06:00:00 of the day) |
| %Agentin periods | Percentage of distinct agents belonging to each publisher in the morning (during the hours 06:00:00–12:00:00 of the day), afternoon (during the hours 12:00:00–17:00:00 of the day), evening (during the hours 17:00:01–20:00:00 of the day), and night (during the hours 20:00–24:00:00 and 00:00:00–06:00:00 of the day) |
| Month | Month of the year when the click was made |
| Day | Day of the week when the click was made |
| Day type | Weekday or weekend |
| Date | Date of the day when the click was made |
| Long click profile | #Clicks per day generated from the same IP address were measured in intervals lower than 5 s, from 5 s to 10 s, from 10 s to 20 s, from 20 s to 30 s, and so on up to 300 s; must be at least 10 clicks in the same IP |
| Short click profile | #Clicks per day generated from the same IP address were measured in intervals lower than 5 s, from 5 s to 10 s, from 10 s to 20 s, from 20 s to 30 s, and so on up to 300 s; must be at least five clicks in the same IP |
| URL profile | #Clicks per day generated from the same IP address were measured in intervals lower than 5 s, from 5 s to 10 s, from 10 s to 20 s, from 20 s to 30 s, and so on up to 300 s; must be at least five clicks in the same IP |
| Avg #Clicks per 1 min, 5 min, 10 min, 1 h, 2 h, 3 h, and 6 h | Average number of clicks for each partner during time intervals of 1 min, 5 min, 10 min, 1 h, 2 h, 3 h, and 6 h |
| Max #Clicks per 1 min, 5 min, 1 h, 3 h, and 6 h | Max number of clicks for each partner during time intervals of 1 min, 5 min, 10 min, 1 h, 2 h, 3 h, and 6 h |
| Var #Clicks per time intervals (1 min, 5 min, 10 min, 1 h, 2 h, 3 h, and 6 h) | Variance number of clicks for each partner during time intervals of 1 min, 5 min, 10 min, 1 h, 2 h, 3 h, and 6 h |
| Skew #Clicks per 1 min, 5 min, 1 h, 3 h, and 6 h | Skewness number of clicks for each partner during time intervals of 1 min, 5 min, 10 min, 1 h, 2 h, 3 h, and 6 h |
| #Clicks per 1 min | Number of clicks for each partner per 1 min |
| #Visitors per 1 min | Number of visitors for each partner per 1 min |
| #Ads per 1 min | Number of ads for each partner per 1 min |
| #Agent per 1 min | Number of agents for each partner per 1 min |
| #Ctry per 1 min | Number of countries for each click per 1 min |
| #Referrer per 1 min | Number of referrer URLs for each partner per 1 min |
| #Clicks same IP ratio per 1 min | Percentage of the number of clicks from the same device IP per 1 min |
| #Clicks ad ratio per 1 min | Percentage of clicks from the ad banner per 1 min |
| #Clicks agent ratio per 1 min | Percentage of clicks from the device agent per 1 min |
| #Clicks ctry per 1 min | Percentage of clicks from the country per 1 min |
| #Clicks referrer ratio per 1 min | Percentage of clicks from the referrer URL per 1 min |
| Gap interval btw clicks | Time difference between two successive clicks |
| Gap interval btw clicks in 1 h, over 1 min, 1 s > 1 min | Time difference between two successive clicks in 1 h, less than 1 s, from 1 s to 1 min, and over 1 min) |
| Avg, STD, count IP in s | Average, standard deviation, and total IP visits per second |
| Avg, STD, count IP in min | Average, standard deviation, and total IP visits per minute |
| Avg, STD, count IP in h | Average, standard deviation, and total IP visits per hour |
| Count IP in hour | Total number of visits (>2) by IP each hour |
| Count IP&agent in s | Total number of visits (>2) by IP + agent per second |
| Count IP&agent in day | Total number of visits (>2) by IP + agent per day |
| Count sub-IP in s | Total number of visits (>2) by subnetwork (divided by 1,000,000) per second |
| Count sub-IP in min | Total number of visits (>2) by subnetwork (divided by 1,000,000) per minute |
| Count sub-IP in h | Total number of visits (>2) by subnetwork (divided by 1,000,000) per hour |
| Count sub-IP in day | Total number of visits (>2) by subnetwork (divided by 1,000,000) per day |
| Count sub2-IP in day | Total number of visits (>2) by subnetwork (divided by 1000) per day |
| Avg IP&agent in min | Average visit by IP + agent per minute |
| Avg IP&agent in day | Average visit by IP + agent per day |
| Avg Cid in min | Average visit by campaign ID per minute |
| #Clicks same IP in s | Number of clicks from the same IP address occurring every 10 s, every 20 s, every 30 s, and so on up to the interval [590 s, 600 s] |
| Mean (var) clicks, cookie, agent, creative, project, and position in h | Mean (variance) of clicks, cookie, agent, creative, project, and position in hours |
| Mean (var) clicks, cookie, agent, creative, project, and position in min | Mean (variance) of clicks, cookie, agent, creative, project, and position in minutes |
| Mean (var) clicks, cookie, agent, creative, project, and position in s | Mean (variance) of clicks, cookie, agent, creative, project, and position in seconds |
| Mean (var) of intervals | Mean (variance) of click intervals |
| Attributed time | Time of the first action performed by the user after clicking (e.g., download app) |
| First 15 min percent | Number of clicks from the 1st to the 14th minute divided by the number of clicks |
| Second 15 min percent | Number of clicks from the 15th to the 29th minute divided by the number of clicks |
| Third 15 min percent | Number of clicks from the 30th to the 44th minute divided by the number of clicks |
| Last 15 min percent | Number of clicks from the 45th to the 59th minute divided by the number of clicks |
| Avg and STD spiky ReAgCnIpCi | Average and standard deviation of the number of the same referred URL, agent, country, IP, and Cid being duplicated in 1 min |
| Avg and STD spiky ReAgCnIpCi in morning, afternoon, and night | Average and standard deviation of the number of the same referred URL, agent, country, IP, and Cid being duplicated in 1 min in the morning (during the hours 06:00:00–12:00:00 of the day), afternoon (during the hours 12:00:00–17:00:00 of the day), evening (during the hours 17:00:01–20:00:00 of the day), and night (during the hours 20:00–24:00:00 and 00:00:00–06:00:00 of the day) |
| Avg and STD spiky referred URL | Average and standard deviation of the number of times the same referred URL is duplicated in 1 min |
| Avg and STD spiky Cid | Average and standard deviation of the number of times the same campaign ID is duplicated in 1 min |
| Avg and STD spiky Cid | Average and standard deviation of the number of times the same country is duplicated in 1 min |
| Avg spiky referred URL in morning, afternoon, evening, and night | Average and standard deviation of the number of the same agent being duplicated in the morning (during the hours 06:00:00–12:00:00 of the day), afternoon (during the hours 12:00:00–17:00:00 of the day), evening (during the hours 17:00:01–20:00:00 of the day), and night (during the hours 20:00–24:00:00 and 00:00:00–06:00:00 of the day) |
| Avg and STD spiky agent | Average and standard deviation of the number of times the same agent is duplicated in 1 min |
| Avg and STD spiky IP | Average and standard deviation of the number of times the same IP is duplicated in 1 min |
| Click frequency | Click frequency at different time intervals |
| Avg and STD spiky ReAgCnIp | Average and standard deviation of the number of the same referred URL, agent, country, and IP being duplicated in 1 min |
| Avg and std spiky ReAgCn | Average and standard deviation of the number of the same referred URL, agent, and country being duplicated in 1 min |
| Avg and STD spiky Ag in morning, afternoon, evening, and night | Average and standard deviation of the number of times the same agent being duplicated in 1 min in the morning (during the hours 06:00:00–12:00:00 of the day), afternoon (during the hours 12:00:00–17:00:00 of the day), evening (during the hours 17:00:01–20:00:00 of the day), and night (during the hours 20:00–24:00:00 and 00:00:00–06:00:00 of the day) |
| Cat number | Total number of clicks for a publisher in each category (which includes ad: adult sites, co: community, es: entertainment and lifestyle, gd: glamour and dating, in: information, mc: mobile content, pp: premium portal, and se: search and portals and services) |
| Avg and STD #Clicks | Average and standard deviation of the total clicks that occurred every minute for a particular publisher |
| Avg and STD null referrer in periods | Average and standard deviation of the clicks with null URL referrer, in the morning (during the hours 06:00:00–12:00:00 of the day), afternoon (during the hours 12:00:00–17:00:00 of the day), evening (during the hours 17:00:01–20:00:00 of the day), and night (during the hours 20:00–24:00:00 and 00:00:00–06:00:00 of the day) |
| Avg and STD#Clicks in 1 h | Average and standard deviation of a publisher’s total clicks acquired in 1 h |
| Avg hourly click CvR | Average conversion rate of all clicks in 1 h. |
| #Clicks at T2 | Total number of clicks made in the past by the same publisher across T2; T2: first 15 min (0–14), second 15 min (15–29), third 15 min (30–44), last 15 min (45–59), night (0:00–5:59), morning (6:00–11:59), afternoon (12–17:59), evening (18:00–23:59), and 3 days. |
| Avg clicks at night, morning, afternoon, and evening | Average number of clicks during the night (24:00–5:59), morning (6:00–11:59), afternoon (12:00–17:59), and evening. |
| %Clicks at night, morning, afternoon, and evening | Percentage of the number of clicks during the night (24:00–5:59), morning (6:00–11:59), afternoon (12:00–17:59), and evening (18:00–23:59). |
| Mean period click | Mean of the number of clicks in four periods: night (24:00–5:59), morning (6:00–11:59), afternoon (12:00–17:59), and evening (12:00–17:59) (18:00–23:59). |
| STD period click | Standard deviation of clicks in four periods: night (24:00–5:59), morning (6:00–11:59), afternoon (12:00–17:59), and evening (12:00–17:59) (18:00–23:59). |
| Var period click | Variance of clicks in four periods: night (24:00–5:59), morning (6:00–11:59), afternoon (12:00–17:59), and evening (12:00–17:59) (18:00–23:59). |
| Most hour click | Maximum number of clicks in 1 h for each publisher. |
| Avg and STD same URL_Ag_Ctry_Cid in 1 min | Average and standard deviation of clicks generated by each publisher in 1 min when the same field (referred URL, agent, Ctry, IP, and Cid) is duplicated. |
| #Period_clicks/#clicks | Total number of clicks produced by each publisher between the hours of (0–14), (15–29), (30–44), and (45–59) divided by the total number of clicks. |
| Spatial Features | |
| Ctry | Countries from which the clicks received by each publisher were made |
| #Ctry | Total number of countries from which every publisher received clicks |
| %Ctry | Percentage of countries from which every publisher received clicks |
| Unique Ctry | Distinct countries. |
| %Clicks certain Ctry | Percentage of clicks coming from different countries (AZ, ID, IN, US, NG, TR, RU, TH, SG, UK, and others) out of the total clicks for a particular publisher |
| Popular area | The most common area where clicks are generated. |
| Ctry/click ratio | Average click ratio for each country. |
| Ctry entropy | Entropy of the click distribution in each country. |
| Max #Clicks same Ctry | Total number of clicks originating from the same country; the maximum of this is then obtained. |
| Var #Clicks same Ctry | Total number of clicks originating from the same country; the variance of this is then obtained. |
| Skew #Clicks same Ctry | Total number of clicks originating from the same country; the skewness of this is then obtained. |
| Click fraction from top 20 ctry | Fraction of the number of clicks from the top 20 countries (top 20 click-producing countries) |
| Click fraction from non-top 20 ctry | Fraction of the number of clicks from the other/non-top 20 countries (least 20 click-producing countries) |
| Click fraction from UN/NA ctry | Fraction of the number of clicks from unknown/empty countries |
| City | Cities from which the clicks received by each publisher were made. |
| Area | City district in which the user resides. |
| Unique Ctry at period T2 | Number of different countries associated with the publisher at T2; T2: first 15 min (0–14), second 15 min (15–29), third 15 min (30–44), last 15 min (45–59), night (0:00–5:59), morning (6:00–11:59), afternoon (12–17:59), evening (18:00–23:59), and 3 days. |
| Avg and STD of unique Ctry at period T1 | Average and standard deviation of the number of different countries for publishers at T1; T1: per minute, 5 min, 15 min, hour, 3 h, 6 h, and 1 day. |
| Ctry ratio at T2 | Ratio of different countries to clicks at T2; T2: first 15 min (0–14), second 15 min (15–29), third 15 min (30–44), last 15 min (45–59), night (0:00–5:59), morning (6:00–11:59), afternoon (12–17:59), evening (18:00–23:59), and 3 days. |
| STD same Ctry T2 | Standard deviation of the number of clicks for different countries at T2; T2: first 15 min (0–14), second 15 min (15–29), third 15 min (30–44), last 15 min (45–59), night (0:00–5:59), morning (6:00–11:59), afternoon (12–17:59), evening (18:00–23:59), and 3 days. |
| Max same Ctry T1 | Maximum number of clicks for different countries at T1; T1: per minute, 5 min, 15 min, hour, 3 h, 6 h, and 1 day. |
| Ctry entropy T2 | Number of clicks entropy corresponding to different countries at T2; T2: first 15 min (0–14), second 15 min (15–29), third 15 min (30–44), last 15 min (45–59), night (0:00–5:59), morning (6:00–11:59), afternoon (12–17:59), evening (18:00–23:59), and 3 days. |
| #Click from differ Ctry | Number of clicks from different countries. |
| User Behavior Features | |
| Event ID | Unique identifier of the action taken by the user after clicking on the ad, such as watching a video or making a purchase |
| Event timestamp | The time the user’s action occurred after clicking on the ad |
| Event count | Number of times the user has undertaken a particular action |
| Max event count | Sum of the number of times the user has undertaken a particular action; its maximum is then obtained. |
| Unique event | Number of times the user has undertaken a previously unknown and unique given action |
| Unique event groups | Number of times the user has undertaken a previously unknown and unique given action within a certain event group (e.g., a group of mouse events and a group of text events) |
| Surfing time | Duration of time the user has spent surfing the advertiser’s website in seconds |
| Mouse clicks count | Total number of clicks made on the advertised website |
| Mouse clicks on other pages | Total number of clicks done on pages other than the landing page. |
| Mouse clicks on links | Total number of clicks on hyperlinks |
| #Mouse scroll | Total number of scroll events |
| Mouse scrolling | Monitoring page scrolling, such as scroll-up and scroll-down |
| #Mouse scroll on other pages | Total number of scroll events done on pages other than the landing page |
| #Mouse moves | Total number of mouse movement events, such as the number of left, center, and right mouse button clicks |
| #Mouse moves on other pages | Total number of scroll movements done on pages other than the landing page |
| Mouse movements | Monitoring the data of mouse movements, such as mouse right clicks, mouse double clicks, mouse movements, and area of the moved mouse |
| #Page views | Total number of pages viewed by the user |
| #Pages inlanguages | Total number of pages in the browser history |
| #Visits | Total number of visits to the ad web pages |
| Visit duration | Amount of time the user spends on the site |
| Execution efficiency | Client’s JavaScript code execution time for a given task |
| User interest | Determine whether the user interest ratio is below a predefined threshold |
| Keystroke data | Monitoring the keys struck on a keyboard, such as the number of pressed keys and the number of switches between text fields on the page using the tab key |
| #Pasted word | Number of pasted words from the clipboard |
| #Text_field clicked | Number of text fields clicked |
| Filled form | Monitor form fill events, such as the number of controls in the form that must be filled, the number of fields replaced with new values in the controls, the number of texts changed while editing, the number of fields filled with no keys pushed, and the number of fields filled quickly |
| Medium Features | |
| Avg Len UA | Average user agent length |
| Avg Len referrer | Average referrer URL length |
| Agent | Phone/device models and types used by clickers |
| Agent ID | Unique identifier of a given device agent to distinguish between phone and computer platforms |
| Unique agent | Distinct device agents |
| Unique agent at period T2 | In T2, the number of distinct devices related to the publisher at T2: first 15 min (0–14), second 15 min (15–9), third 15 min (30–44), last 15 min (45–9), night (0:00–5:59), morning (6:00–11:59), afternoon (12–17:59), evening (18:00–23:59), and days |
| Avg and STD of unique agent at period T1 | Average and standard deviation of the number of different devices for publishers at T1: per minute, 5 min, 15 min, 1 h, 3 h, 6 h, and 1 day |
| Agent’s ratio at T2 | Ratio of different devices to clicks at T2; T2: first 15 min (0–14), second 15 min (15–29), third 15 min (30–44), last 15 min (45–59), night (0:00–5:59), morning (6:00–11:59), afternoon (12–17:59), evening (18:00–23:59), and 3 days |
| STD same agent T2 | Standard deviation of the number of clicks for different devices at T2; T2: first 15 min (0–14), second 15 min (15–29), third 15 min (30–44), last 15 min (45–59), night (0:00–5:59), morning (6:00–11:59), afternoon (12–17:59), evening (18:00–23:59), and 3 days |
| Max same agent T2 | Maximum number of clicks for different devices at T1; T1: per minute, 5 min, 15 min, 1 h, 3 h, 6 h, and 1 day. |
| Agent entropy T2 | Number of clicks entropy corresponding to different devices at T2; T2: first 15 min (0–14), second 15 min (15–29), third 15 min (30–44), last 15 min (45–59), night (0:00–5:59), morning (6:00–11:59), afternoon (12–17:59), evening (18:00–23:59), and 3 days |
| Agent entropy | Entropy of the click distribution on agent attribute |
| Avg #Clicks same agent | Number of clicks made by the same device agent; the average of this is then obtained. |
| Max #Clicks same agent | Number of clicks made by the same device agent; the maximum of this is then obtained. |
| Var #Clicks same agent | Number of clicks made by the same device agent; the variance of this is then obtained. |
| Skew #Clicks same agent | Number of clicks made by the same device agent; the skewness of this is then obtained. |
| Click fraction from UN/NA agent | Fraction of the number of clicks from the unknown/empty device model/agent used by the user to click |
| Agent-1 | Statistics for click data sorted by click time and agent as follows: Clicks are arranged by click time, followed by agents. Each click log row is then compared with the following click log row. If the device is the same, the current row is preserved; otherwise, it is eliminated. The filter row portion is then computed over the row total for each publisher. |
| Agent-2 | Statistics for click data sorted by agent only, calculated in the same way as Agent-1 (above feature) |
| Browser type | Names of the browsers used by the ad clickers |
| OS | OS version ID of the user’s phone/computer |
| Web ID | A unique identifier and a mechanism for Internet service providers and members to recognize who they are connecting with |
| App ID | Unique identifier of a given application that contains an advertisement |
| App price | Price of the application that contains an advertisement |
| Category ID | A unique identifier of the category to which the application belongs |
| App popularity | Popularity of the application among users, from the number of times it has been downloaded and its ratings |
| Release date | Application launch date |
| Current version | Current version number of the application |
| ISP | Internet service provider for the user’s connection |
| Conn type | Denotes whether the connected individual is a generator, distributor, or a user, as well as whether the connection connects with the grid, a local network, or an embedded network |
| HTTP referrer | The heading HTTP referrer |
| Screen resolution | Screen resolution of the user agent |
| Screen orientation | Screen orientation (vertical or horizontal) of the user agent |
| Language | Information on the language of the agent, browser, or app |
| Session ID | A unique identifier for the session by the user |
| %Brand | Percentage of clicks coming from each agent brand (e.g., MAUI, Nokia, generic, Apple, Blackberry, Samsung, Sony, LG, and other brands) out of the total clicks for a particular publisher |
| UAgent frequency | User agent frequency at different time intervals |
| IP_Cookie frequency | Reveals the number of cookies in each IP address at different time intervals A cookie is a piece of data from a website that is stored within a web browser and can be accessed by the website later. |
| Max segment size | A Transmission Control Protocol (TCP) header option field parameter. |
| TCP window size | In each instance, determines the window size and frequency of appearance in synchronized packets during the TCP handshake |
| TCP window scale | A TCP header option field parameter typically used in conjunction with window size to assist in determining the OS type |
| NOP | The no-option (NOP) number is one byte in size and is used to fill the TCP options field in order to boost the packet length by a fourfold factor. Each operating system has its own set of TCP NOP settings. |
| Time to live | A timer value that tells the recipient how long to hold before discarding and expiring the packet A timer value that instructs the recipient how long to keep the packet until dismissing and expiring it |
| Port | Examine whether the click generator (human or bot) has a proclivity to use specific ports, such as TCP or User Datagram Protocol (UDP). |
| Avg App CvR | Average conversion rate of the app ID |
| Avg OS CvR | Average conversion rate of the OS ID |
| Avg agent CvR | Average conversion rate of the agent ID |
| Avg channel CvR | Average conversion rate of the channel ID |
| Unique IP&agent periods T2 | Number of different IPs + agents associated with the publisher at T2; T2: first 15 min (0–14), second 15 min (15–29), third 15 min (30–44), last 15 min (45–59), night (0:00–5:59), morning (6:00–11:59), afternoon (12–17:59), evening (18:00–23:59), and 3 days |
| Avg and STD of unique IP&agent at period T1 | Average and standard deviation of the number of different IPs + agents for publishers at T1; T1: per minute, 5 min, 15 min, 1 h, 3 h, 6 h, and 1 day |
| IP&agent ratio at T2 | Ratio of different IPs + agents to clicks at T2; T2: first 15 min (0–14), second 15 min (15–29), third 15 min (30–44), last 15 min (45–59), night (0:00–5:59), morning (6:00–11:59), afternoon (12–17:59), evening (18:00–23:59), and 3 days |
| STD same IP&agent T2 | Standard deviation of the number of clicks for different IPs + agents at T2; T2: first 15 min (0–14), second 15 min (15–29), third 15 min (30–44), last 15 min (45–59), night (0:00–5:59), morning (6:00–11:59), afternoon (12–17:59), evening (18:00–23:59), and 3 days |
| Max same IP&agent T1 | Maximum number of clicks for different IPs + agents at T1; T1: per minute, 5 min, 15 min, 1 h, 3 h, 6 h, and 1 day |
| IP&agent entropy T2 | Number of clicks entropy corresponding to different IPs + agents at T2; T2: first 15 min (0–14), second 15 min (15–29), third 15 min (30–44), last 15 min (45–59), night (0:00–5:59), morning (6:00–11:59), afternoon (12–17:59), evening (18:00–23:59), and 3 days |
| %Brand_clicks/#clicks | Percentage of clicks received by each brand divided by the total number of clicks produced by each publisher. |
| Avg and STD null agent | Average and standard deviation of the total clicks with null as agent that occurred every minute for a particular publisher |
| IP Features | |
| IP | IP addresses’ clicks |
| Server IP | IP address of the ad server |
| Unique IP | Distinct IP addresses’ clicks per publisher |
| Unique IP at different time intervals | Distinct IP addresses’ clicks per publisher in 1 h and 10 h |
| Unique IP parts | Distinct parts of the IP addresses |
| Legitimacy of IP | Whether the originating IP address is on a blacklist |
| Unique IP at period T2 | Number of different IP addresses associated with the publisher at T2; T2: first_15 min (0–14), second_15 min (15–29), third_15 min (30–44), last_15 min (45–59), night (0:00–5:59), morning (6:00–11:59), afternoon (12–17:59), evening (18:00–23:59), and 3 days |
| Avg and STD of unique IP at period T1 | Average and standard deviation of the number of different IP addresses for publishers at T1; T1: per minute, 5 min, 15 min, 1 h, 3 h, 6 h, and 1 day |
| IPs’ ratios at T2 | Ratio of different IP addresses to clicks at T2; T2: first 15 min (0–14), second 15 min (15–29), third 15 min (30–44), last 15 min (45–59), night (0:00–5:59), morning (6:00–11:59), afternoon (12–17:59), evening (18:00–23:59), and 3 days |
| STD same IP T2 | Standard deviation of the number of clicks for different IP addresses at T2: first 15 min (0–14), second 15 min (15–29), third 15 min (30–44), last 15 min (45–59), night (0:00–5:59), morning (6:00–11:59), afternoon (12–17:59), evening (18:00–23:59), and 3 days |
| Max same IP T2 | Maximum number of clicks for various IP addresses at T1; T1: per minute, 5 min, 15 min, 1 h, 3 h, 6 h, and 1 day |
| IP entropy T2 | Number of clicks entropy corresponding to different IP addresses at T2; T2: first 15 min (0–14), second 15 min (15–29), third 15 min (30–44), last 15 min (45–59), night (0:00–5:59), morning (6:00–11:59), afternoon (12–17:59), evening (18:00–23:59), and 3 days |
| IP frequency | IP frequency at different time intervals |
| Number of Clicks Features | |
| #Clicks | Total number of clicks, count of rows in the click log. |
| #Clicks daily | Total number of clicks, count of rows in the click log on a daily basis |
| Click ID | A unique identifier for the ad click by the user |
| Avg and STD #Clicks in min | Average and standard deviation of the total clicks that occurred every minute for a particular publisher. |
| Avg and STD #Clicks in h | Average and standard deviation of the total clicks that occurred every minute for a particular publisher |
| Avg and STD #Clicks URL is null | Average and standard deviation of the total clicks produced by each publisher with null as a referrer that occurred every minute during the night, morning, afternoon, and evening |
| #Clicks same IP | Number of clicks originating from the same computer IP address |
| #Clicks unique IP | Number of clicks originating from different/unique computer IP addresses |
| IP only one | Whether an IP address has only one ad click |
| Avg IP CvR | Average conversion rate of an IP having #clicks |
| Max #Clicks same IP | Number of clicks originating from the same computer IP address; the maximum of this is then obtained. |
| Entropy #Clicks same IP | Number of clicks originating from the same computer IP address; the entropy of this is then obtained. |
| Var #Clicks same IP | Number of clicks originating from the same computer IP address; the variance of this is then obtained. |
| Click ratio on advertiser, IP, cookie, agent, cid, ctry, referrer, Unique Ad-project, Unique Ad-position, and Unique agent | Click ratio for each #Clicks/#Advertisers, #Clicks/#IP, #Clicks/#cookie, #Clicks/#agent, #Clicks/#Cid, #Clicks/#Country, #Clicks/#Referrer, #Clicks/# Unique Ad-project, #Clicks/# Unique Ad-position, and #Clicks/# Unique Ad-agent |
| Click per ad, device, ctry, and referrer ratio | Percentage of the number of clicks per ad, device, and country |
| Suspicious click ratio | Percentage of the duration of suspicious clicks per publisher |
| #Clicks in channel | Total number of clicks produced by each publisher across all channels |
| %Ctry_clicks/#clicks | Percentage of clicks from every country divided by the total number of clicks produced by each publisher |
| Avg and std null referrer | Average and standard deviation of the total clicks with null as the referrer URL that happened for a particular publisher in every minute |
| #Click IP&Hour&Day | Total number of clicks grouped by IP address, day, and hour of the click |
| #Click IP&App | Total number of clicks grouped by IP address and app ID of the click |
| #Click IP&App&OS | Total number of clicks grouped by IP address, OS, and app ID of the click |
| Var click day by IP&App&Channel | Variance in click days for an IP, app, and channel |
| Provider/Advertiser/Ad Features | |
| Publisher ID | Unique identifier of the particular publisher of an advertisement campaign |
| Campaign ID | Unique identifier of a given advertisement campaign |
| Ad ID | Unique identifier of a given advertisement for all commercial assets |
| #Cid | Total number of campaign IDs associated with the clicks received by each publisher |
| Cid entropy | Entropy of the click distribution on campaign IDs |
| Cid/click ratio | Average percentage of the number of clicks for each campaign |
| Unique Cid | Distinct number of campaign IDs |
| Max #Clicks same Cid | Number of clicks received by the same campaign ID; the maximum of this is then obtained. |
| Var #Clicks same Cid | Number of clicks received by the same campaign ID; the variance of this is then obtained. |
| Skew #Clicks same Cid | Number of clicks received by the same campaign ID; the skewness of this is then obtained. |
| Publisher address | Mailing address of the publisher |
| Publisher account | Bank account associated with the publisher |
| Publisher’s reputation | Whether the click occurs from an untrustworthy website |
| Visibility of ad controls | Determine whether the ad is clearly visible on the screen and not hidden behind a button or is off-screen |
| Size of ad control | Determine whether an ad is too small on the screen, making it difficult for users to read or locate it |
| Misplace of Ad-control on tiny screen | Examine to verify that the distance between an ad control and a clickable non-ad item is less than a certain threshold |
| Unique ad project | Number of unique ad projects |
| Unique ad position | Number of unique ad positions |
| Publisher frequency | Publisher ID frequency at different time intervals |
| Other Features | |
| Channel ID | Unique identifier of a given ad publisher |
| Channel | Channel type of the publisher, which includes ad: adult sites, co: community, es: entertainment and lifestyle, gd: glamour and dating, in: information, mc: mobile content, pp: premium portal, and se: search and portals and services. |
| Referred URL | The URL referrer’s web page that contains the ad content |
| #Referrer | Total number of URL referrers from which every publisher received clicks |
| Unique referrer | Distinct URL referrers |
| Channel_ Prior | Prior fraud probability in each category |
| Referrer/click ratio | Average click ratio for each referrer URL |
| Non-referrer/click ratio | Total number of non-referred URL clicks with respect to the total clicks received for each publisher |
| Click fraction from UN/NA referrer | Fraction of the number of clicks from unknown/empty referrer URLs |
| Developer ID | Unique identifier of a given developer who developed the app that contained the advertisement |
| #Apps | Number of apps developed by the same developer |
| Avg app rating | Average rating of the app by users |
| Avg app versions | Average number of versions of the application |
| Avg pos_reviews | Average rate of positive reviews and helpfulness of the application |
| %Free apps | Percentage of free apps developed by the same developer |
| No. of ad controls | Recognize the number of ads displayed on the screen; it must be one ad per phone screen and three ads per tablet screen at most. |
| App down ratio | Ratio of app downloads per publisher |
| Is attributed | Target class of prediction, indicating whether the action was done after clicking |
| Is clicked | Target class of prediction, indicating whether the ad was clicked |
| Status | Status that describes the click’s legitimacy (benign/fraud) |
| Fingerprint | An identification based on the JavaScript language parameters accessible in the browser |
| Store markdown | Difference between a product’s initial and current prices |
| #Successful transactions | Amount of goods exchanged after the seller has delivered the goods and the buyer has validated receipt of the goods |
| Deposit | Margin offered to the Taobao platform by the online retailer |
| Dynamic score | A careful examination of the store based on three criteria: commodity quality, service attitude, and logistical service |
| Number of additional reviews | Number of reviews written by purchasers after they have used a product or service for a length of time |
| Collection conversion rate | Ratio of the number of successful transactions of major goods in a store to the number of collections throughout time |
| Avg reputation score | A shop’s reputation score during the period of its operation |
| Rate of reviews with pictures | Number of reviews with photos divided by the total number of reviews for the store |
| Rate of additional reviews | Number of added reviews divided by all of the store’s reviews |
| Collection conversion rate of secondary goods | Ratio of secondary products sales at a store to the number of collections over time |
| Operating duration | Length of time the store has been operating since its formation |
| Reputation level | A store’s reputation level over the period of its operation |
| Favorable rating | When visitors have a positive opinion or reaction to something, it means that they agree with it and appreciate it. |
| Site ID | A unique identification number assigned by the ministry to a site listed in the site registry |
| Site cat | The category to which the site belongs, such as e-commerce |
| App cat | The category to which the app belongs, such as entertainment |
| App dom | A method used within the common language infrastructure to isolate running software applications so that they do not interfere with one another |
| Age | Age of the Internet user who clicked on the ad |
| Gender | Gender of the Internet user who clicked on the ad |
| Income | Income of the Internet user who clicked on the ad |
| Daily Internet usage | Daily Internet consumption of the user |
| Daily time | Duration of time a user spends on the Internet on a daily basis |
| Unique Cid at period T2 | Number of different campaign IDs associated with the publisher at T2; T2: first 15 min (0–14), second 15 min (15–29), third 15 min (30–44), last 15 min (45–59), night (0:00–5:59), morning (6:00–11:59), afternoon (12–17:59), evening (18:00–23:59), and 3 days |
| Avg and STD of unique Cid at period T1 | Average and standard deviation of the number of different campaign IDs for publishers at T1; T1: per min, 5 min, 15 min, 1 h, 3 h, 6 h, and 1 day |
| Cids’ ratio at T2 | Ratio of different campaign IDs to clicks at T2; T2: first 15 min (0–14), second 15 min (15–29), third 15 min (30–44), last 15 min (45–59), night (0:00–5:59), morning (6:00–11:59), afternoon (12–17:59), evening (18:00–23:59), and 3 days |
| STD same Cid T2 | Standard deviation of the number of clicks for different campaign IDs at T2; T2: first 15 min (0–14), second 15 min (15–29), third 15 min (30–44), last 15 min (45–59), night (0:00–5:59), morning (6:00–11:59), afternoon (12–17:59), evening (18:00–23:59), and 3 days |
| Max same Cid T1 | Maximum number of clicks for different campaign IDs at T1; T1: per minute, 5 min, 15 min, 1 h, 3 h, 6 h, and 1 day |
| Cid entropy T2 | Number of clicks entropy corresponding to different campaign IDs at T2; T2: first 15 min (0–14), second 15 min (15–29), third 15 min (30–44), last 15 min (45–59), night (0:00–5:59), morning (6:00–11:59), afternoon (12–17:59), evening (18:00–23:59), and 3 days |
| Unique referred periods T2 | Number of different referred URLs associated with the publisher at T2; T2: first 15 min (0–14), second 15 min (15–29), third 15 min (30–44), last 15 min (45–59), night (0:00–5:59), morning (6:00–11:59), afternoon (12–17:59), evening (18:00–23:59), and 3 days |
| Avg and std of unique referred at period T1 | Average and standard deviation of the number of different referred URLs for publishers at T1; T1: per minute, 5 min, 15 min, hour, 3 h, 6 h, and 1 day |
| Referred ratio at T2 | Ratio of different referred URLs to clicks at T2; T2: first 15 min (0–14), second 15 min (15–29), third 15 min (30–44), last 15 min (45–59), night (0:00–5:59), morning (6:00–11:59), afternoon (12–17:59), evening (18:00–23:59), and 3 days |
| STD same referred T2 | Standard deviation of the number of clicks for different referred URLs at T2; T2: first 15 min (0–14), second 15 min (15–29), third 15 min (30–44), last 15 min (45–59), night (0:00–5:59), morning (6:00–11:59), afternoon (12–17:59), evening (18:00–23:59), and 3 days |
| Max same referred T1 | Maximum number of clicks for different referred URLs at T1; T1: per minute, 5 min, 15 min, hour, 3 h, 6 h, and 1 day |
| Referred entropy T2 | Number of clicks entropy corresponding to different referred URLs at T2; T2: first 15 min (0–14), second 15 min (15–29), third 15 min (30–44), last 15 min (45–59), night (0:00–5:59), morning (6:00–11:59), afternoon (12–17:59), evening (18:00–23:59), and 3 days |
| #Axis APIs | Number of APIs for determining the actual click coordinates generated by users |
| #View-size APIs | Number of APIs for determining the size of an ad view; acquiring the size of an ad view in order to position the coordinates of the false click within the ad view |
| #Rand num APIs | Number of APIs for generating random numbers |
| DDG size | Size of the data dependence graph (DDG); the larger the size of the DDG, the more the data have been processed, indicating fraudulent behavior |
| Rand condition | Random numbers in condition expression |
| Node roles | Identifying exploited servers by nodes, especially those with URLs that do not follow well-known advertising URL patterns Each URL discovered during data crawling is referred to as a node. |
| Node domain regs | Determine node domain registration times, as most malware domains expire within a year after registration Each URL discovered during data crawling is referred to as a node. |
| Node frequency | The popularity and reliability of node domains are measured; recognize each node’s domain and calculate the number of distinct publishers linked to this domain every day. Each URL discovered during data crawling is referred to as a node. |
| Node pair frequency | Analyze the frequency of two adjacent nodes on ad paths Each URL discovered during data crawling is referred to as a node. |
| Cookie frequency | Cookie frequency at different time intervals A cookie is a piece of data from a website that is stored within a web browser and can be accessed by the website later. |
| Born cookie | The time the cookie was generated A cookie is a piece of data from a website that is stored within a web browser and can be accessed by the website later. |
| #Peer nodes | Number of peer nodes, derived from raw traffic information Peers are other nodes that operate in the same manner as the nodes in the network. |
| #Packets | Number of packets transmitted through the network |
| #Bytes | Sum of the number of bytes for all the packets transmitted through the network |
| #Flows | Number of flows made over the network |
| Max, min, med, mean, var, and STD of flows in packets | Maximum, minimum, median, mean, variance, and standard deviation of the number of packets in each flow |
| Max, min, med, mean, var, and STD of bytes in flow | Maximum, minimum, median, mean, variance, and standard deviation of the number of bytes in each flow |
| Max, min, med, mean, var, and STD of bytes in flow duration | Maximum, minimum, median, mean, variance, and standard deviation of the number of bytes in each flow duration |
| Max, min, med, mean, var, and STD of application layer protocol fields | Maximum, minimum, median, mean, variance, and standard deviation of the number of unique method types, number of unique hosts and URLs and their corresponding numbers of packets and bytes in HTTP requests, and number of unique server names appearing in the TLS client hello and their corresponding numbers of packets and bytes |
| 1 norm | Maximum value of the absolute values for every column in the signals’ matrix Note: This value was determined using the signals provided by the mobile phone’s sensors. |
| Infinity norm | Maximum value of the absolute values for each row in the signals’ matrix Note: This value was determined using the signals provided by the mobile phone’s sensors. |
| Fresenius norm | Square root of the sum of squares of all the elements in the signals’ matrix Note: This value was determined using the signals provided by the mobile phone’s sensors. |
| Max, min, RMS, RMSE, mean, PNum, TNum, SMA, skew, kurt, ATP, and ATT | Maximum value, minimum value, root mean square value, root mean square error, average value of each tap, number of local peaks, number of local troughs, signal magnitude area, asymmetry of the curve, peakedness of the curve, average time to a peak, and average time to a trough of the time-domain signal in each dimension. Note: These values were determined using the signals provided by the mobile phone’s sensors. |
| Amplitude spectrum | A power spectrum’s square root, which is used to define broadband signals and disturbances. Note: This value was determined using the signals provided by the mobile phone’s sensors. |
| Power spectrum | Describes the distribution of power into frequency elements that make up the signal. Note: This value was determined using the signals provided by the mobile phone’s sensors. |
| Formant of the signal spectrum | Commonly used to describe the wide peak or the local maximum in a spectrum |
References
- Clickcease. The State of Click Fraud in SME Advertising. 2022. Available online: https://www.clickcease.com/blog/wp-content/uploads/2020/09/SME-Click-Fraud-2020.pdf (accessed on 1 August 2022).
- Aljabri, M.; Aljameel, S.S.; Mohammad, R.M.A.; Almotiri, S.H.; Mirza, S.; Anis, F.M.; Aboulnour, M.; Alomari, D.M.; Alhamed, D.H.; Altamimi, H.S. Intelligent techniques for detecting network attacks: Review and research directions. Sensors 2021, 21, 7070. [Google Scholar] [CrossRef] [PubMed]
- Aljabri, M.; Alahmadi, A.A.; Mohammad, R.M.A.; Aboulnour, M.; Alomari, D.M.; Almotiri, S.H. Classification of Firewall Log Data Using Multiclass Machine Learning Models. Electronics 2022, 11, 1851. [Google Scholar] [CrossRef]
- Aljabri, M.; Altamimi, H.S.; Albelali, S.A.; Al-Harbi, M.; Alhuraib, H.T.; Alotaibi, N.K.; Alahmadi, A.A.; Alhaidari, F.; Mohammad, R.M.A.; Salah, K. Detecting Malicious URLs Using Machine Learning Techniques: Review and Research Directions. IEEE Access 2022, 10, 121395–121417. [Google Scholar] [CrossRef]
- Aljabri, M.; Alhaidari, F.; Mohammad, R.M.A.; Mirza, S.; Alhamed, D.H.; Altamimi, H.S.; Chrouf, S.M.B. An Assessment of Lexical, Network, and Content-Based Features for Detecting Malicious URLs Using Machine Learning and Deep Learning Models. Comput. Intell. Neurosci. 2022, 2022, 3241216. [Google Scholar] [CrossRef] [PubMed]
- Cheq. The Impact of Invalid Traffic on Marketing. 2022. Available online: https://cheq.ai/wp-content/uploads/2022/01/The-Impact-of-Invalid-Traffic-on-Marketing_REPORT_2-4.pdf (accessed on 3 August 2022).
- Khan, A.G. Electronic Commerce: A Study on Benefits and Challenges in an Emerging Economy. Glob. J. Manag. Bus. Res. 2016, 16, 1–5. [Google Scholar]
- Pantelimon, F.-V.; Georgescu, T.M.; Posedaru, B.-S. The Impact of Mobile e-Commerce on GDP: A Comparative Analysis between Romania and Germany and how Covid-19 Influences the e-Commerce Activity Worldwide. Inform. Econ. 2020, 24, 27–41. [Google Scholar] [CrossRef]
- Semerádová, T.; Weinlich, P. Impacts of Online Advertising on Business Performance; IGI Global: Hershey, PA, USA, 2019; ISBN 1799816206. [Google Scholar]
- Bala, M.; Verma, D. A critical review of digital marketing. Int. J. Manag. IT Eng. 2018, 8, 321–339. [Google Scholar]
- Layton, R.A. Towards a theory of marketing systems. Eur. J. Mark. 2011, 45, 259–276. [Google Scholar] [CrossRef]
- Zumstein, D.; Kotowski, W. Success Factors of E-Commerce-Drivers of the Conversion Rate and Basket Value. In Proceedings of the 18th International Conference e-Society, Sofia, Bulgaria, 2–4 April 2020; pp. 43–50. [Google Scholar]
- Evans, D.S. The online advertising industry: Economics, evolution, and privacy. J. Econ. Perspect. 2009, 23, 37–60. [Google Scholar] [CrossRef] [Green Version]
- Dean, J. Big Data, Data Mining, and Machine Learning: Value Creation for Business Leaders and Practitioners; John Wiley & Sons: Hoboken, NJ, USA, 2014; ISBN 1118618041. [Google Scholar]
- Pooranian, Z.; Conti, M.; Haddadi, H.; Tafazolli, R. Online advertising security: Issues, taxonomy, and future directions. IEEE Commun. Surv. Tutor. 2021, 23, 2494–2524. [Google Scholar] [CrossRef]
- Aksu, H.; Babun, L.; Conti, M.; Tolomei, G.; Uluagac, A.S. Advertising in the IoT Era: Vision and Challenges. IEEE Commun. Mag. 2018, 56, 138–144. [Google Scholar] [CrossRef] [Green Version]
- Aslam, B.; Karjaluoto, H. Digital advertising around paid spaces, E-advertising industry’s revenue engine: A review and research agenda. Telemat. Inform. 2017, 34, 1650–1662. [Google Scholar] [CrossRef]
- Ha, L. Online advertising research in advertising journals: A review. J. Curr. Issues Res. Advert. 2008, 30, 31–48. [Google Scholar] [CrossRef]
- King, A.B. Website Optimization; O’Reilly Media, Inc.: Sebastopol, CA, USA, 2008; ISBN 0596515081. [Google Scholar]
- Chen, G.; Xie, P.; Dong, J.; Wang, T. Understanding programmatic creative: The role of AI. J. Advert. 2019, 48, 347–355. [Google Scholar] [CrossRef]
- Chaffey, D.; Smith, P.R. eMarketing eXcellence: Planning and Optimizing Your Digital Marketing; Routledge: London, UK, 2013; ISBN 0203082818. [Google Scholar]
- Yagci, T. Blended Learning via Mobile Social Media & Implementation of “EDMODO” in Reading Classes. Adv. Lang. Lit. Stud. 2015, 6, 41–47. [Google Scholar]
- Zhu, X.; Tao, H.; Wu, Z.; Cao, J.; Kalish, K.; Kayne, J. Fraud Prevention in Online Digital Advertising; Springer: Berlin/Heidelberg, Germany, 2017; ISBN 3319567934. [Google Scholar]
- Narayanan, M.; Asur, S.; Nair, A.; Rao, S.; Kaushik, A.; Mehta, D.; Athalye, S.; Malhotra, A.; Almeida, A.; Lalwani, R. Social media and business. Vikalpa 2012, 37, 69–112. [Google Scholar] [CrossRef] [Green Version]
- Rutz, O.J.; Bucklin, R.E.; Sonnier, G.P. A latent instrumental variables approach to modeling keyword conversion in paid search advertising. J. Mark. Res. 2012, 49, 306–319. [Google Scholar] [CrossRef] [Green Version]
- Weideman, M.; Kritzinger, W. Parallel search engine optimisation and pay-per-click campaigns: A comparison of cost per acquisition. S. Afr. J. Inf. Manag. 2017, 19, 1–13. [Google Scholar]
- Wood, A.K.; Ravel, A.M. Fool me once: Regulating fake news and other online advertising. S. Cal. L. Rev. 2017, 91, 1223. [Google Scholar]
- Stone-Gross, B.; Stevens, R.; Zarras, A.; Kemmerer, R.; Kruegel, C.; Vigna, G. Understanding fraudulent activities in online ad exchanges. In Proceedings of the 2011 ACM SIGCOMM Conference on Internet Measurement Conference, Berlin, Germany, 2–4 November 2011; pp. 279–294. [Google Scholar]
- Li, Z.; Zhang, K.; Xie, Y.; Yu, F.; Wang, X.F. Knowing your enemy: Understanding and detecting malicious Web advertising. In Proceedings of the 2012 ACM Conference on Computer and Communications Security-CCS, Raleigh, NC, USA, 16–18 October 2012; pp. 674–686. [Google Scholar] [CrossRef]
- Berrar, D. Random forests for the detection of click fraud in online mobile advertising. In Proceedings of the 1st International Workshop on Fraud Detection in Mobile Advertising (FDMA), Singapore, 4 November 2012; pp. 1–10. Available online: http://berrar.com/resources/Berrar_FDMA2012.pdf (accessed on 17 August 2022).
- Yan, J.H.; Jiang, W.R. Research on information technology with detecting the fraudulent clicks using classification method. Adv. Mater. Res. 2014, 859, 586–590. [Google Scholar] [CrossRef]
- Perera, K.S.; Neupane, B.; Faisal, M.A.; Aung, Z.; Woon, W.L. A novel ensemble learning-based approach for click fraud detection in mobile advertising. Lect. Notes Comput. Sci. 2013, 8284, 370–382. [Google Scholar] [CrossRef]
- Oentaryo, R.J.; Lim, E. Mining Fraudulent Patterns in Online Advertising. In Proceedings of the First International Network on Trust (FINT) Workshop 2013, Singapore, 21–23 November 2013; pp. 21–23. [Google Scholar]
- Perera, B.K. A Class Imbalance Learning Approach to Fraud Detection in Online Advertising. Citeseer 2013. Available online: https://pdfs.semanticscholar.org/24ca/e6b0d1d192e6421905dc65fe8efa2d4343d9.pdf (accessed on 22 August 2022).
- Oentaryo, R.; Lim, E.P.; Finegold, M.; Lo, D.; Zhu, F.; Phua, C.; Cheu, E.Y.; Yap, G.E.; Sim, K.; Nguyen, M.N.; et al. Detecting click fraud in online advertising: A data mining approach. J. Mach. Learn. Res. 2014, 15, 99–140. [Google Scholar]
- Phua, C.; Cheu, E.-Y.; Yap, G.-E.; Sim, K.; Nguyen, M.-N. Feature engineering for click fraud detection. In Proceedings of the 2012 Workshop on Fraud Detection in Mobile Advertising (FDMA), Singapore, 4 November 2012; Volume 2010, pp. 1–10. Available online: http://palanteer.sis.smu.edu.sg/fdma2012/doc/FirstWinner-Starrystarrynight-Paper.pdf%5Cnpapers2://publication/uuid/9290A6CF-A861-4058-99F4-D39706B0619A (accessed on 27 August 2022).
- Xu, H.; Liu, D.; Koehl, A.; Wang, H.; Stavrou, A. Click fraud detection on the advertiser side. Lect. Notes Comput. Sci. 2014, 8713, 419–438. [Google Scholar] [CrossRef]
- He, X.; Pan, J.; Jin, O.; Xu, T.; Liu, B.; Xu, T.; Shi, Y.; Atallah, A.; Herbrich, R.; Bowers, S.; et al. Practical lessons from predicting clicks on ads at Facebook. In Proceedings of the Eighth International Workshop on Data Mining for Online Advertising, New York, NY, USA, 24–27 August 2014. [Google Scholar] [CrossRef]
- Vani, M.S.; Bhramaramba, R.; Vasumati, D.; Babu, O.Y. TUI based touch-spam detection in mobile applications to increase the security from advertisement networks. Int. J. Adv. Comput. Commun. Control 2014, 2, 17–22. [Google Scholar]
- Beránek, L.; Nýdl, V.; Remeš, R. Click Stream Data Analysis for Online Fraud Detection in E-Commerce; Inproforum: České Budějovice, Czech Republic, 2016; pp. 175–180. [Google Scholar]
- Berrar, D. Learning from automatically labeled data: Case study on click fraud prediction. Knowl. Inf. Syst. 2016, 46, 477–490. [Google Scholar] [CrossRef]
- Guo, Y.; Shi, J.; Cao, Z.; Kang, C.; Xiong, G.; Li, Z. Machine learning based cloudbot detection using multi-layer traffic statistics. In Proceedings of the 2019 IEEE 21st International Conference on High Performance Computing and Communications; IEEE 17th International Conference on Smart City; IEEE 5th International Conference on Data Science and Systems (HPCC/SmartCity/DSS), Zhangjiajie, China, 10–12 August 2019; pp. 2428–2435. [Google Scholar] [CrossRef]
- Li, Z.; Jia, W. The Study on Preventing Click Fraud in Internet Advertising. J. Comput. 2020, 31, 256–265. [Google Scholar] [CrossRef]
- Wang, K.; Xu, G.; Wang, C.; He, X. A Hybrid Abnormal Advertising Traffic Detection Method. In Proceedings of the 2017 IEEE International Conference on Big Knowledge (ICBK), Hefei, China, 9–10 August 2017; pp. 236–241. [Google Scholar] [CrossRef]
- Wang, J.; Wu, C.; Ji, S.; Gu, Q.; Li, Z. Fraud Detection via Coding Nominal Attributes. In Proceedings of the 2017 2nd International Conference on Multimedia Systems and Signal Processing, Taichung, Taiwan, 13–16 August 2017; pp. 42–45. [Google Scholar] [CrossRef]
- MINASTIREANU, E.-A.; MESNITA, G. Light GBM Machine Learning Algorithm to Online Click Fraud Detection. J. Inf. Assur. Cybersecur. 2019, 2019, 1–12. [Google Scholar] [CrossRef]
- Sisodia, D.; Sisodia, D.S. Gradient boosting learning for fraudulent publisher detection in online advertising. Data Technol. Appl. 2021, 55, 216–232. [Google Scholar] [CrossRef]
- Dash, A.; Pal, S. Auto-Detection of Click-Frauds using Machine Learning Auto-Detection of Click-Frauds using Machine Learning. Int. J. Eng. Sci. Comput. 2020, 10, 27227–27235. [Google Scholar]
- Viruthika, B.; Das, S.S.; Manishkumar, E.; Prabhu, D. Detection of advertisement click fraud using machine learning. Int. J. Adv. Sci. Technol. 2020, 29, 3238–3245. [Google Scholar] [CrossRef]
- Srivastava, A. Real-Time Ad Click Fraud Detection. 2020, pp. 1–63. Available online: https://scholarworks.sjsu.edu/etd_projects/916 (accessed on 4 September 2022).
- Thejas, G.S.; Dheeshjith, S.; Iyengar, S.S.; Sunitha, N.R.; Badrinath, P. A hybrid and effective learning approach for Click Fraud detection. Mach. Learn. Appl. 2021, 3, 100016. [Google Scholar] [CrossRef]
- Gohil, N.P.; Meniya, A.D. Click Ad Fraud Detection Using XGBoost Gradient Boosting Algorithm; Springer: Cham, Switzerland, 2021; Volume 1235, ISBN 978-981-15-6647-9. [Google Scholar]
- Sisodia, D.; Sisodia, D.S. Feature space transformation of user-clicks and deep transfer learning framework for fraudulent publisher detection in online advertising. Appl. Soft Comput. 2022, 125, 109142. [Google Scholar] [CrossRef]
- Gabryel, M. Data Analysis Algorithm for Click Fraud Recognition. Commun. Comput. Inf. Sci. 2018, 920, 437–446. [Google Scholar] [CrossRef]
- Almahmoud, S.; Hammo, B.; Al-Shboul, B. Exploring Non-Human Traffic in Online Digital Advertisements: Analysis and Prediction; Springer: Cham, Switzerland; Volume 3, ISBN 9783030283742.
- Pan, L.; Mu, S.; Wang, Y. User click fraud detection method based on Top-Rank- k frequent pattern mining. Int. J. Mod. Phys. B 2019, 33, 1950150. [Google Scholar] [CrossRef] [Green Version]
- Sadashiva, T.G. Click Fraud Detection in Online and In-App Advertisements: A Learning Based Approach. Ph.D. Thesis, Florida International University, Miami, FL, USA, 2019. [Google Scholar]
- Borgi, M. Advertisement Click Fraud Detection System: A Survey; Springer: Singapore, 2021; Volume 10, ISBN 9789811696695. [Google Scholar]
- Li, W.; Zhong, Q.; Zhao, Q.; Zhang, H.; Meng, X. Multimodal and Contrastive Learning for Click Fraud Detection. arXiv 2021, arXiv:2105.03567. [Google Scholar]
- Aberathne, I.; Walgampaya, C. Real time mobile ad investigator: An effective and novel approach for mobile click fraud detection. Comput. Inform. 2021, 40, 606–627. [Google Scholar] [CrossRef]
- Mikkili, B.; Sodagudi, S. Advertisement Click Fraud Detection Using Machine Learning Algorithms. Smart Innov. Syst. Technol. 2022, 282, 353–362. [Google Scholar] [CrossRef]
- Dekou, R.; Savo, S.; Kufeld, S.; Francesca, D.; Kawase, R. Machine Learning Methods for Detecting Fraud in Online Marketplaces. In Proceedings of the 2021 International Workshop on Privacy, Security, and Trust in Computational Intelligence, Gold Coast, QLD, Australia, 1–5 November 2021; Volume 3052. [Google Scholar]
- Sisodia, D.; Sisodia, D.S. Quad division prototype selection-based k-nearest neighbor classifier for click fraud detection from highly skewed user click dataset. Eng. Sci. Technol. Int. J. 2022, 28, 101011. [Google Scholar] [CrossRef]
- Mouawi, R.; Awad, M.; Chehab, A.; El Hajj, I.H.; Kayssi, A. Towards a Machine Learning Approach for Detecting Click Fraud in Mobile Advertizing. In Proceedings of the 2018 International Conference on Innovations in Information Technology (IIT), Al Ain, United Arab Emirates, 18–19 November 2018; pp. 88–92. [Google Scholar] [CrossRef]
- Renström, M.; Holmsten, T. Fraud Detection on Unlabeled Data with Unsupervised Machine Learning. 2018, p. 62. Available online: http://kth.diva-portal.org/smash/get/diva2:1217521/FULLTEXT01.pdf (accessed on 7 September 2022).
- Zhang, X.; Liu, X.; Guo, H. A click fraud detection scheme based on cost sensitive BPNN and ABC in mobile advertising. In Proceedings of the 2018 IEEE 4th International Conference on Computer and Communications (ICCC), Chengdu, China, 7–10 December 2018; pp. 1360–1365. [Google Scholar] [CrossRef]
- Thejas, G.S.; Boroojeni, K.G.; Chandna, K.; Bhatia, I.; Iyengar, S.S.; Sunitha, N.R. Deep learning-based model to fight against Ad click fraud. In Proceedings of the 2019 ACM Southeast Conference, Kennesaw, GA, USA, 18–20 April 2019; pp. 176–181. [Google Scholar] [CrossRef] [Green Version]
- Shi, C.; Song, R.; Qi, X.; Song, Y.; Xiao, B.; Lu, S. ClickGuard: Exposing Hidden Click Fraud via Mobile Sensor Side-channel Analysis. In Proceedings of the ICC 2020—2020 IEEE International Conference on Communications (ICC), Dublin, Ireland, 7–11 June 2020. [Google Scholar] [CrossRef]
- Hu, J.; Li, T.; Zhuang, Y.; Huang, S.; Dong, S. GFD: A Weighted Heterogeneous Graph Embedding Based Approach for Fraud Detection in Mobile Advertising. Secur. Commun. Netw. 2020, 2020, 1–12. [Google Scholar] [CrossRef]
- Liu, X.; Zhang, X.; Miao, Q. A Click Fraud Detection Scheme Based on Cost-Sensitive CNN and Feature Matrix; Springer: Singapore, 2020; Volume 1210, ISBN 978-981-15-7529-7. [Google Scholar]
- Gabryel, M.; Scherer, M.M.; Sułkowski, Ł.; Damaševičius, R. Decision Making Support System for Managing Advertisers by Ad Fraud Detection. J. Artif. Intell. Soft Comput. Res. 2021, 11, 331–339. [Google Scholar] [CrossRef]
- Zhu, T.; Meng, Y.; Hu, H.; Zhang, X.; Xue, M.; Zhu, H. Dissecting Click Fraud Autonomy in the Wild. In Proceedings of the 2021 ACM SIGSAC Conference on Computer and Communications Security, Virtual, 15–19 November 2021; pp. 271–286. [Google Scholar] [CrossRef]
- Harsha, C.; Aswale, S.; Pawar, V.N. Advertisement Click Fraud Detection Using Machine Learning Techniques. In Proceedings of the 2021 International Conference on Technological Advancements and Innovations (ICTAI), Tashkent, Uzbekistan, 10–12 November 2021; Volume 10, ISBN 9789811696695. [Google Scholar]
- Crussell, J.; Stevens, R.; Chen, H. MAdFraud: Investigating ad fraud in Android applications. In Proceedings of the MobiSys 2014—12th Annual International Conference on Mobile Systems, Applications, and Services, Bretton Woods, NH, USA, 16–19 June 2014; pp. 123–134. [Google Scholar] [CrossRef]
- Iqbal, S.; Zulkernine, M.; Jaafar, F.; Gu, Y. Protecting internet users from becoming victimized attackers of click-fraud. J. Softw. Evol. Process 2016, 30, e1871. [Google Scholar] [CrossRef]
- Jiang, C.; Zhu, J.; Xu, Q. Dissecting click farming on the Taobao platform in China via PU learning and weighted logistic regression. Electron. Commer. Res. 2022, 22, 157–176. [Google Scholar] [CrossRef]
- Taneja, M.; Garg, K.; Purwar, A.; Sharma, S. Prediction of click frauds in mobile advertising. In Proceedings of the 2015 Eighth International Conference on Contemporary Computing (IC3), Noida, India, 20–22 August 2015; pp. 162–166. [Google Scholar] [CrossRef]
- Thejas, G.S.; Rameshwar Grag, S.S.; Iyengar, N.R.S. MRFI and ARFI: Hybrids of Filter and Wrapper Feature Selection Approaches. IEEE Access 2021, 9, 128687–128701. [Google Scholar] [CrossRef]
- Thejas, G.S.; Hariprasad, Y.; Iyengar, S.S.; Sunitha, N.R.; Badrinath, P.; Chennupati, S. An extension of Synthetic Minority Oversampling Technique based on Kalman filter for imbalanced datasets. Mach. Learn. Appl. 2022, 8, 100267. [Google Scholar] [CrossRef]
- Buzzcity Mobile Advertisement Dataset. 2014. Available online: https://larc.smu.edu.sg/buzzcity-mobile-advertisement-dataset (accessed on 14 September 2022).
- TalkingData. TalkingData AdTracking Fraud Detection Challenge. 2017. Available online: https://www.kaggle.com/c/talkingdata-adtracking-fraud-detection (accessed on 14 September 2022).
- Click-Through Rate Prediction. 2014. Available online: https://www.kaggle.com/c/avazu-ctr-prediction (accessed on 12 November 2022).
- Ramanathan, M. An Ensemble Model for Click through Rate Prediction. 2019. Available online: https://scholarworks.sjsu.edu/etd_projects/697 (accessed on 14 September 2022).
- Zhou, X.; Yan, P. Avazu Click—Through Rate Prediction Problem description. 2015. Available online: http://techblog.youdao.com/wp-content/uploads/2015/03/Avazu-CTR-Prediction.pdf (accessed on 15 September 2022).
- Larsen, B.S. Synthetic Minority Over-sampling Technique (SMOTE). Retrieved August 2021, 13, 2021. [Google Scholar]
- Sadeghpour, S.; Vlajic, N. Click fraud in digital advertising: A comprehensive survey. Computers 2021, 10, 164. [Google Scholar] [CrossRef]
- About JavaScript. Available online: https://developer.mozilla.org/en-US/docs/Web/JavaScript/About_JavaScript (accessed on 16 September 2022).
- Bot & Ad Fraud Statistics. Available online: https://www.fraudlogix.com/bot-adfraud-statistics/ (accessed on 17 September 2022).
- The Global PPC Click Fraud Report 2020–2021. 2021. Available online: https://www.searchenginejournal.com/the-global-ppc-click-fraud-report-2020-21/391493/ (accessed on 17 September 2022).
- Google PageRank Checker. Available online: https://sitechecker.pro/page-rank/ (accessed on 17 September 2022).
- Cresci, S. A Decade of Social Bot Detection. Commun. ACM 2020, 63, 72–83. [Google Scholar] [CrossRef]
- Sites, E. Ad Fraud Bot Behavior on E-Commerce Sites. Available online: https://cheq.ai/wp-content/uploads/2021/12/Ad-fraud-bot-behavior-on-e-commerce-sites.pdf (accessed on 18 September 2022).
- Qi, S.; AlKulaib, L.; Broniatowski, D.A. Detecting and Characterizing Bot-like Behavior on Twitter; Springer: Cham, Switzerland, 2018; Volume 10899, ISBN 9783319933719. [Google Scholar]
- Ad Fraud % by Device Type. 2022. Available online: https://www.fraudlogix.com/stats/ad-fraud-by-device-type/ (accessed on 12 November 2022).
- Chu, Z.; Gianvecchio, S.; Wang, H. Bot or Human? A Behavior-Based Online Bot Detection System; Springer: Cham, Switzerland, 2018; ISBN 9783030048334. [Google Scholar]
- Lyu, F.; Tang, X.; Guo, H.; Tang, R.; He, X.; Zhang, R.; Liu, X. Memorize, Factorize, or be Naive: Learning Optimal Feature Interaction Methods for CTR Prediction. In Proceedings of the 2022 IEEE 38th International Conference on Data Engineering (ICDE), Kuala Lumpur, Malaysia, 9–12 May 2022; pp. 1450–1462. [Google Scholar] [CrossRef]
- Statista. Advertising Revenue of Google from 2001 to 2021. Available online: https://www.statista.com/statistics/266249/advertising-revenue-of-google/ (accessed on 23 September 2022).


| No. of Publishers | ||||||
|---|---|---|---|---|---|---|
| Dataset | Time Period | No. of Clicks | Fraud | Observation | OK | Total |
| Train | 9–11 Feb 2012 | 3,173,834 | 72 (2.34%) | 80 (2.60%) | 2929 (95.07%) | 3081 |
| Validation | 23–25 Feb 2012 | 2,689,005 | 85 (2.77%) | 84 (2.74%) | 2895 (94.48%) | 3064 |
| Test | 8–10 Mar 2012 | 2,598,815 | 82 (2.73%) | 71 (2.37%) | 2847 (94.90%) | 3000 |
| Attribute | Description |
|---|---|
| publisherid | Unique identifier of a publisher. |
| bankaccount | Bank account associated with a publisher (anonymized; may be missing/unknown). |
| address | Mailing address of a publisher (anonymized; may be missing/unknown) |
| status | Label of a publisher, which falls into three categories:
|
| Attribute | Description |
|---|---|
| id | Unique identifier of a particular click. |
| numericip | Public IP address of a clicker/visitor. |
| deviceua | Phone model/agent used by a clicker/visitor. |
| publisherid | Unique identifier of a publisher. |
| campaignid | Unique identifier of a given advertisement campaign. |
| usercountry | Country from which the clicker/visitor is. |
| clicktime | Timestamp of a given click (in yyyy-mm-dd format). |
| referredurl | URL where ad banners are clicked (anonymized; may be missing/unknown). |
| channel | Publisher’s channel type, which consists of:
|
| No. of Publishers | ||||
|---|---|---|---|---|
| Dataset | Time Period | No. of Clicks | Fraudulent | Non-Fraudulent |
| Train | 6 Nov 2017 | 184,903,890 | 509,235.8975 (0.25%) | 203,185,123.103 (99.75%) |
| Test | 9 Nov 2017 | 18,790,469 | ||
| Attribute | Description |
|---|---|
| ip | Ip address of click. |
| app | App id for marketing. |
| device | Device type id of user mobile phone. |
| os | OS version id of user mobile phone. |
| channel | Channel id of mobile ad publisher. |
| click_time | Ad timestamp of click (UTC). |
| attributed_time | If user download the app after clicking an ad, this is the time of the app download. |
| is_attributed | the target that is to be predicted, indicating the app was downloaded. |
| Class of Clicks | |||
|---|---|---|---|
| Dataset | No. of Clicks | Non-Clicked | Clicked |
| Train | 40,000,000 | 40,140,000 (0.25%) | 4,460,000 (10%) |
| Test | 4,600,000 | ||
| Attribute | Definition |
|---|---|
| ID | The unique identifier for all details that corresponds to one occurrence of an advertisement. This is a continuous variable. |
| Hour | The hour, in YYMMDDHH format. We could break this down and add additional features during the cleaning process. This is a continuous variable. |
| Banner_pos | The position in the screen where the advertisement was displayed. This shows the prominent place for an advertisement to get the attention of the user. This is a categorial integer |
| Site_id | The identifier to unique identify a site in which the advertisement was displayed. This is a hashed value. |
| Site_domain | The domain information of the website in which the advertisement was displayed. |
| Site_category | This is a categorical variable representing the field to which the website belongs to. This can be used 27 to understand if any site category has more visitor attraction during any particular time. |
| App_id | The identifier to unique identify a mobile application in which the advertisement was displayed. This is a hashed value. |
| App_domain | The domain information of the application in which the advertisement was displayed. |
| App_category | This is a categorical variable representing the field to which the application belongs to. This can be used to understand if any app category has more visitor attraction during any particular time. This is similar to the site category and can be compared relatively to check if app has more clicks over the website. |
| Device_id | The unique identifier that marks the device from which the click was captured. This is a hashed continuous variable and can be repeated in the data set. |
| Device_ip | The ipv4 address of the device from which the click was received. Hashed to a different value for privacy reasons to avoid trace back to the device. |
| Device_model | The model of the device. We choose not to use this value. |
| Device_type | The type of the device, is a categorical variable and has around 7 categories. |
| Device_conn_type | This is a hashed value about the connection type. We do not use this value for forming the vector. |
| C1 | An anonymous variable. It has influence over the prediction. |
| C14–C21 | Anonymous categorical variables that might have information about the advertisers’ profile and the users’ profile like the age, gender, etc. |
| Click | The target variable, 0 means an advertisement was not clicked and 1 means the ad was clicked. This is a categorical variable, binary typed. |
Disclaimer/Publisher’s Note: The statements, opinions and data contained in all publications are solely those of the individual author(s) and contributor(s) and not of MDPI and/or the editor(s). MDPI and/or the editor(s) disclaim responsibility for any injury to people or property resulting from any ideas, methods, instructions or products referred to in the content. |
© 2022 by the authors. Licensee MDPI, Basel, Switzerland. This article is an open access article distributed under the terms and conditions of the Creative Commons Attribution (CC BY) license (https://creativecommons.org/licenses/by/4.0/).
Share and Cite
Alzahrani, R.A.; Aljabri, M. AI-Based Techniques for Ad Click Fraud Detection and Prevention: Review and Research Directions. J. Sens. Actuator Netw. 2023, 12, 4. https://doi.org/10.3390/jsan12010004
Alzahrani RA, Aljabri M. AI-Based Techniques for Ad Click Fraud Detection and Prevention: Review and Research Directions. Journal of Sensor and Actuator Networks. 2023; 12(1):4. https://doi.org/10.3390/jsan12010004
Chicago/Turabian StyleAlzahrani, Reem A., and Malak Aljabri. 2023. "AI-Based Techniques for Ad Click Fraud Detection and Prevention: Review and Research Directions" Journal of Sensor and Actuator Networks 12, no. 1: 4. https://doi.org/10.3390/jsan12010004