Article

Evaluating Edge Computing and Compression for Remote Cuff-Less Blood Pressure Monitoring

1
Faculty of Applied Engineering, University of Antwerp, 2020 Antwerp, Belgium
2
Embedded Systems, ALTEN Sweden AB, 118 46 Stockholm, Sweden
3
School of Innovation, Design, and Engineering, Mälardalen University, 722 20 Västerås, Sweden
4
Flanders Make Strategic Research Centre, 3920 Lommel, Belgium
*
Authors to whom correspondence should be addressed.
J. Sens. Actuator Netw. 2023, 12(1), 2; https://doi.org/10.3390/jsan12010002
Submission received: 11 November 2022 / Revised: 16 December 2022 / Accepted: 20 December 2022 / Published: 26 December 2022
(This article belongs to the Section Actuators, Sensors and Devices)

Abstract

:
Remote health monitoring systems play an important role in the healthcare sector. Edge computing is a key enabler for realizing these systems, where it is required to collect big data while providing real-time guarantees. In this study, we focus on remote cuff-less blood pressure (BP) monitoring through electrocardiogram (ECG) as a case study to evaluate the benefits of edge computing and compression. First, we investigate the state-of-the-art algorithms for BP estimation and ECG compression. Second, we develop a system to measure the ECG, estimate the BP, and store the results in the cloud with three different configurations: (i) estimation in the edge, (ii) estimation in the cloud, and (iii) estimation in the cloud with compressed transmission. Third, we evaluate the three approaches in terms of application latency, transmitted data volume, and power usage. In experiments with batches of 64 ECG samples, the edge computing approach has reduced average application latency by 15%, average power usage by 19%, and total transmitted volume by 85%, confirming that edge computing improves system performance significantly. Compressed transmission proved to be an alternative when network bandwidth is limited and edge computing is impractical.

1. Introduction

Traditional health diagnostic services are unable to meet the demand for low-cost, high-quality healthcare due to the growing population. The development of a remote mobile health monitoring system is now possible because of recent advancements in the field of mobile devices and communication. Such a system can be used by physicians to deliver these services at all times, improving the patient’s experience and reducing the burden on the public health system [1]. The monitoring system sends measurements to the cloud for processing in a standard sensor-cloud architecture, which is a suitable approach for low information rates. When this architecture is adopted for high-frequency measurements, however, it fails to provide the service in terms of performance guarantees. The communication channel’s capacity is generally limited, and constant data transmission in high frequency requires a significant amount of energy. Due to these challenges, computational capability has shifted from the cloud to the edge. Edge computing increases system efficiency by processing data at a device that is physically closer to the sensor. Despite the fact that there has been a lot of research performed on this topic, issues associated with high data volumes need to be further investigated [2]. The advantages of edge computing include decreased energy consumption for battery operated devices, short response time and network bandwidth saving [3]. One example of a healthcare use case with big data is long-term electrocardiogram (ECG) monitoring. The required bandwidth depends on the sampling rate, resolution, and the number of leads, but a typical ECG recording device samples at 100–1000 Hz with a resolution of 8–16 bits per data sample. This results in a data volume of 8.64 MB up to 172.8 MB for one day of single-lead ECG transmission. This amount of data requires a significant amount of transmission time, resulting in increased energy usage [4].
In order to assess the benefits of edge computing for real-time ECG monitoring, we use an existing algorithm to estimate blood pressure (BP) through ECG monitoring. The algorithm is integrated in a sensor-edge-cloud system with three variations: (i) edge processing, (ii) cloud processing, and (iii) cloud processing with compressed transmission. The third approach using compression is used as a hybrid approach between edge processing and cloud compressing in order to understand the results better. These approaches are then evaluated based on application latency, communication latency and data-volume, and energy usage. By combining a performance evaluation of edge computing with cuff-less blood pressure monitoring, researchers in both fields of study can benefit from this study to make more informed decisions about architectures for real-time monitoring. Section 2 describes the background on cuff-less blood pressure estimation as a use case example in remote health monitoring with high frequency sampling requirement. It also describes some of the methods, algorithms and results suitable for such a use case. Section 3 explains our system model and implementation details. Finally, Section 4 presents the main results and discussion.

2. Background

2.1. Cuff-Less Blood Pressure Estimation

Traditionally, blood pressure (BP) is measured using an inflating cuff around the arm. Each measurement consists of systolic blood pressure (SBP), diastolic blood pressure (DBP), and mean arterial pressure (MAP). This method is reliable and precise but cumbersome for long-term BP monitoring at home due to the inflation and deflation of the cuff. To solve this issue, new techniques based on physiological signals such as ECG and photoplethysmogram emerged. By applying machine learning (ML) algorithms to this data, it is possible to estimate BP with great accuracy. Recently, researchers have shown more interest in ECG-only estimation as devices that measure two signals are more complex and energy-consuming [5].
The first method for ECG-only BP estimation was reported by Simjanoska et al. [6]. This study has extracted five features from the ECG signal that represent the signal complexity in order to classify the measurement. The classifier consists of seven different algorithms, where the results are merged with a meta-classifier. The classification result is merged with the feature vector and fed into three random forest regression models to estimate SBP, DBP, and MAP. The work by Mousavi et al. [7] derived only one feature vector from the ECG signal. This feature is the magnitude of the Fast Fourier Transform of a single peak-to-peak interval, reduced in dimension by the principal component analysis algorithm. Four different regression algorithms (i.e., decision tree, generalized neural network, relevance vector, and random forest) were applied on this feature to compare their estimation accuracy. After training and testing these four algorithms, random forest regression proved to be the most accurate method. In a follow-up study, Mousavi et al. [8] used a different approach for feature extraction. For each ECG segment, the McSharry dynamic ECG model is optimized with the particle swarm optimization (PSO) algorithm to produce a synthetic ECG segment close to the measured segment. Next, model parameters are used as the feature vector for regression with AdaboostR (Adaptive Boosting Regression combines a large number of weak estimators (e.g., decision tree regression) into a strong estimator function by taking a weighted sum of their results). This study used ECG signals from the CVES dataset (Cerebral Vasoregulation in Elderly with Stroke: https://physionet.org/content/cves/1.0.0/, accessed on 10 March 2022) with randomly generated BP values. Therefore, their estimation error results may not be accurate.
Later research did not use explicit feature extraction in the estimation algorithms. Landry et al. [9] fed the ECG signal directly into a nonlinear autoregressive exogenous (NARX) model with an artificial neural network (ANN). A NARX model calculates output values based on the previous output values, and the current and past input values using a nonlinear function (e.g., ANN). The output of the model is the continuous BP waveform, from which SBP and DBP values are derived. MAP was not estimated in this study but would be straightforward to derive from the BP waveform. Fan et al. [5] was the first to use long short term memory (LSTM) networks for ECG-only BP estimation. After noise removal, segmentation, and normalization of the ECG signal, the segments are fed into a bidirectional LSTM (BiLSTM) network. The result of this LSTM layer is used by three separate fully connected (FC) networks with an attention layer to estimate SBP, DBP, and MAP. Fan et al. [10] published a similar method with a BiLSTM shared layer and three task-specific networks without attention layers that was able to achieve very similar results. Likewise, Miao et al. [11] used a two-layer LSTM network in parallel with a ResNet-50 network modified for time-series data. The results of both networks are concatenated and used by a two-layer FC network. The final output is combined with patient-specific BP baseline values for estimating SBP, DBP, and MAP. Some methods are limited to classification of ECG signals into normotension, prehypertension, and hypertension. Liu et al. [12] proposed a ResNet-18 based method to achieve this goal with an overall accuracy of 87.89 % based on the Cuff-Less Blood Pressure Estimation Data Set.
The datasets and reported results for each of these methods are listed in Table 1. Results are mostly reported as mean absolute error (MAE) of the estimation, but some studies use the mean error (ME). The standard deviation of the estimation error was always given. Studies that used the MIMIC II, MIMIC III or Cuff-Less Blood Pressure Estimation Data Set can be compared without major issues as MIMIC III is an extension of its precursor MIMIC II [13]. The Cuff-Less Blood Pressure Estimation Data Set was derived from MIMIC II and processed to remove noise and corrupted signals [14]. Everything considered the method developed by Landry et al. [9] will be used throughout this study. Its implementation is well reported, allowing for a straightforward reproduction.

2.2. Compression Algorithms for ECG Signals

Removing data redundancies in ECG signals reduces transmitted data volume, which can improve battery lifetime, device size, and portability. Compression algorithms are classified into two groups: lossless and lossy. Lossless compression algorithms ensure that decompression results in an exact replica. Lossy algorithms remove more information from the original signal to increase the ratio between the uncompressed size and the compressed size (i.e., the compression ratio). Typically, the reconstruction quality of a lossy algorithm is sufficient for consumer applications. However, in clinical applications, lossless methods are highly recommended by medical regulatory boards. Lossy compression could remove relevant medical information or introduce patterns that seem relevant during automated analysis [15]. On the other hand, the compression ratio of lossless methods is typically poor (i.e., 1–2). Lossy compression makes up for its small reconstruction error by a significantly higher compression ratio [4].
Second, algorithms can be classified by their method of extracting relevant information. Direct compression methods predict the next sample based on previous samples and output the prediction error. The error is generally smaller in magnitude than the original sample, and thus requiring less storage space. Transform-based methods employ domain transformations (e.g., Wavelet) to detect relevant information with an improved compression ratio at the cost of higher computational complexity. These first two techniques are followed by entropy coding such as Huffman coding or Golomb–Rice coding to replace fixed-size samples with variable-size samples. At last, parameter extraction derives relevant information than can be analyzed later without decompression or decompressed by a model of the signal [15]. This can be interpreted as edge computing; in essence, both approaches extract parameters from the data on the edge device without transforming it to the original signal on the cloud server.
Tsai and Kuo [16] proposed an efficient lossless ECG compression method suitable for this study. First, samples are predicted based on the four last samples with an adaptive linear predictor. The current region of the signal is classified as flat, steep, or peaking, which defines the predictor function used to predict the next sample. Next, the prediction error is encoded by a content-adaptive Golomb–Rice code. Inputs are first mapped to positive integers and divided by 2 k . The quotient encoded in unary code and the remainder encoded in binary code are then concatenated, isolated by a single ‘0’ bit. Error samples are coded in windows of 40 samples (i.e., the width of the QRS complex), allowing to calculate the parameter k as the binary logarithm of the average absolute error in that window. At last, k and 40 coded error samples are placed in a frame for transmission. The first frame also contains the original value of the first sample to initialize the decompression algorithm. The study tested the method on the MIT/BIH arrhythmia dataset and reported a mean compression ratio of 2.84 for lead V1 and 2.77 for lead V2. We chose this compression algorithm because it was designed for computational efficient compression on embedded devices and for its compression ratio that is comparable to other compression algorithms in research. On top of this, its implementation details are described in detail, which is important for using it in our own application.

3. System and Experiment Design
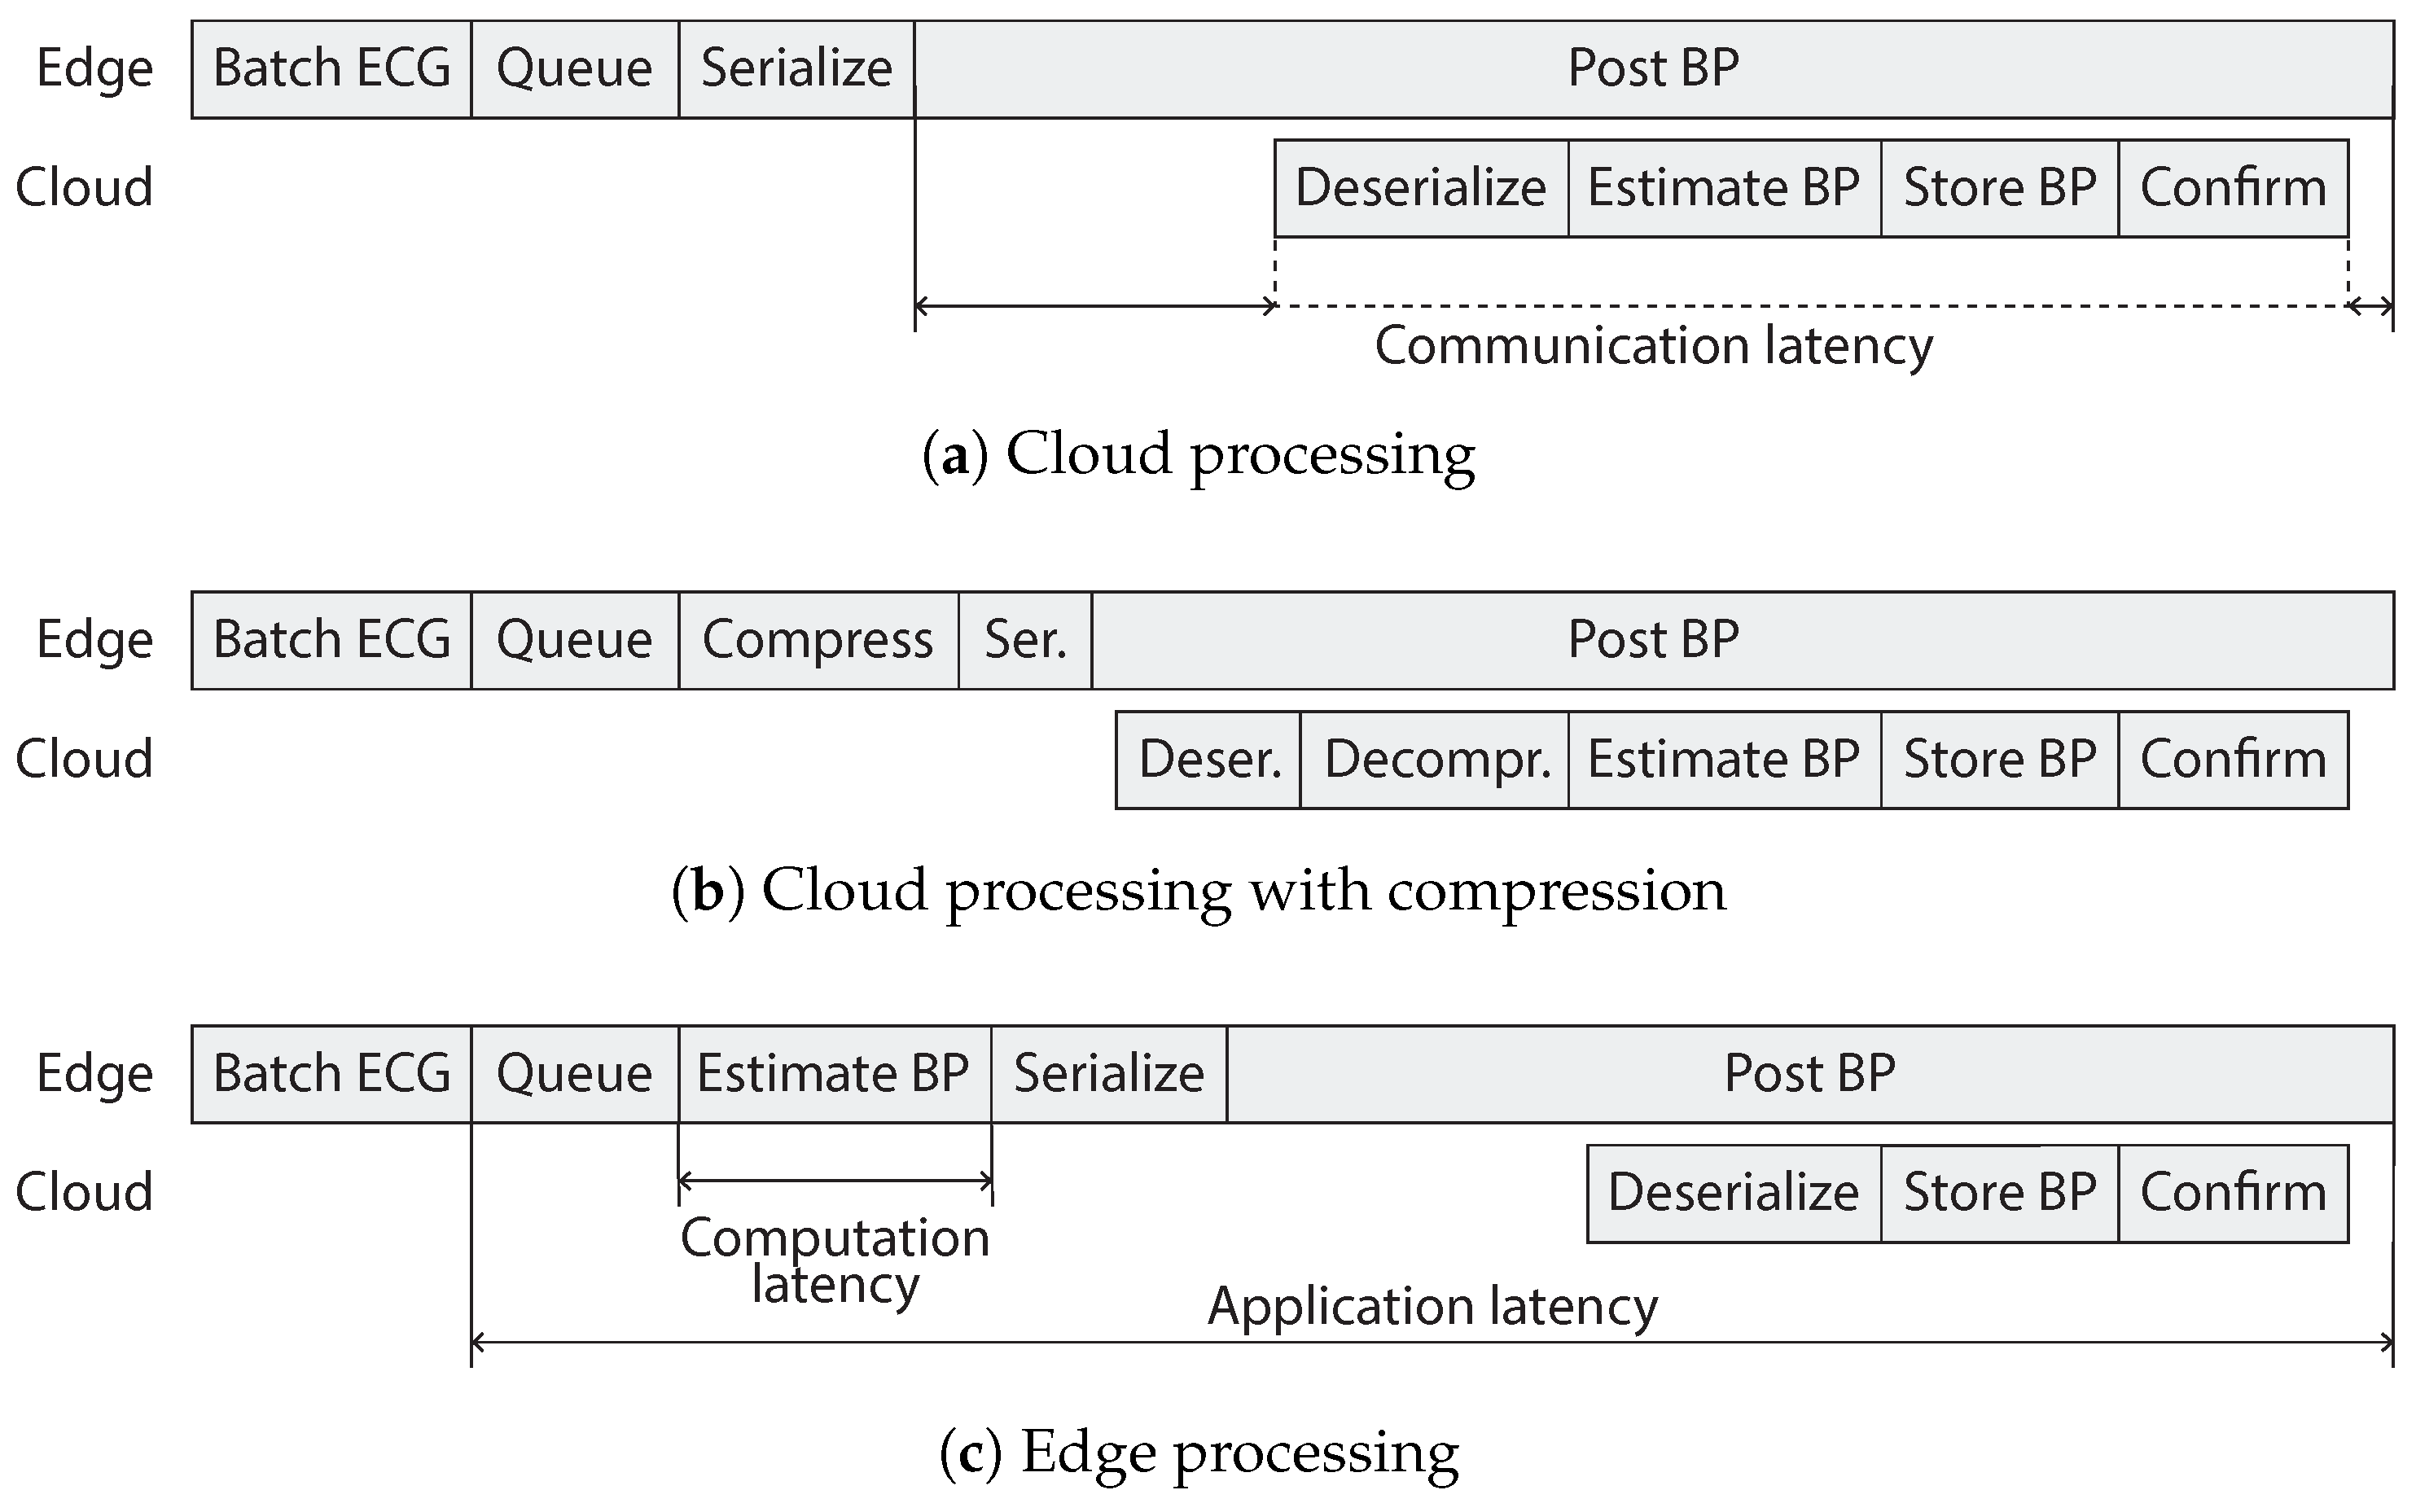
The system goal is to monitor the BP of a patient through ECG monitoring. Therefore, it must measure the ECG of that patient, infer the BP, and store the results in the cloud for later analysis. This problem can be solved using three approaches. The first uses a traditional cloud approach that transmits all ECG data to the cloud, where BP is calculated and stored in a database. The second approach uses compression to reduce transmission volume, while BP is still estimated in the cloud. The third approach use edge devices that performs the BP estimation and transmits the results to the cloud for storage. In order to limit the scope of this experiment, we assume that there is only one monitoring device communicating with the cloud server.

3.1. System Design

The system is developed as shown in Figure 1. The MAX30001 EVSYS board holds a MAX30001 ECG sensor and a MAX32630FTHR microcontroller as UART to SPI interface. The controller streams byte frames of 16 samples with a sample rate of 128 Hz to an Nvidia Jetson Nano that acts as an edge device, responsible for the collection, processing, and transmission of data. In this study, we assume that both the sensor device and the edge device are mobile and battery powered. E.g., a smart watch with ECG sensor and a smartphone for processing, or a single monitoring device. When we mention the mobile device further on, the sensor device and edge device can be abstracted as a single mobile system. These tasks are realized by two threads with a synchronized queue to pass data. The sense thread parses incoming byte frames and batches ECG samples in segments of an adjustable size. When a segment is ready, it is passed to the second thread, processed, and transmitted to the cloud server with an HTTP POST request. Messages between edge and cloud are serialized as Protocol Buffers for their low overhead. The cloud consists of two containers: an HTTP server and an InfluxDB time-series database. The HTTP server is instantiated on start-up and creates a new thread for each incoming request. This thread processes the received information and stores the BP estimations in the database. All functionalities on edge and cloud were implemented using Python.

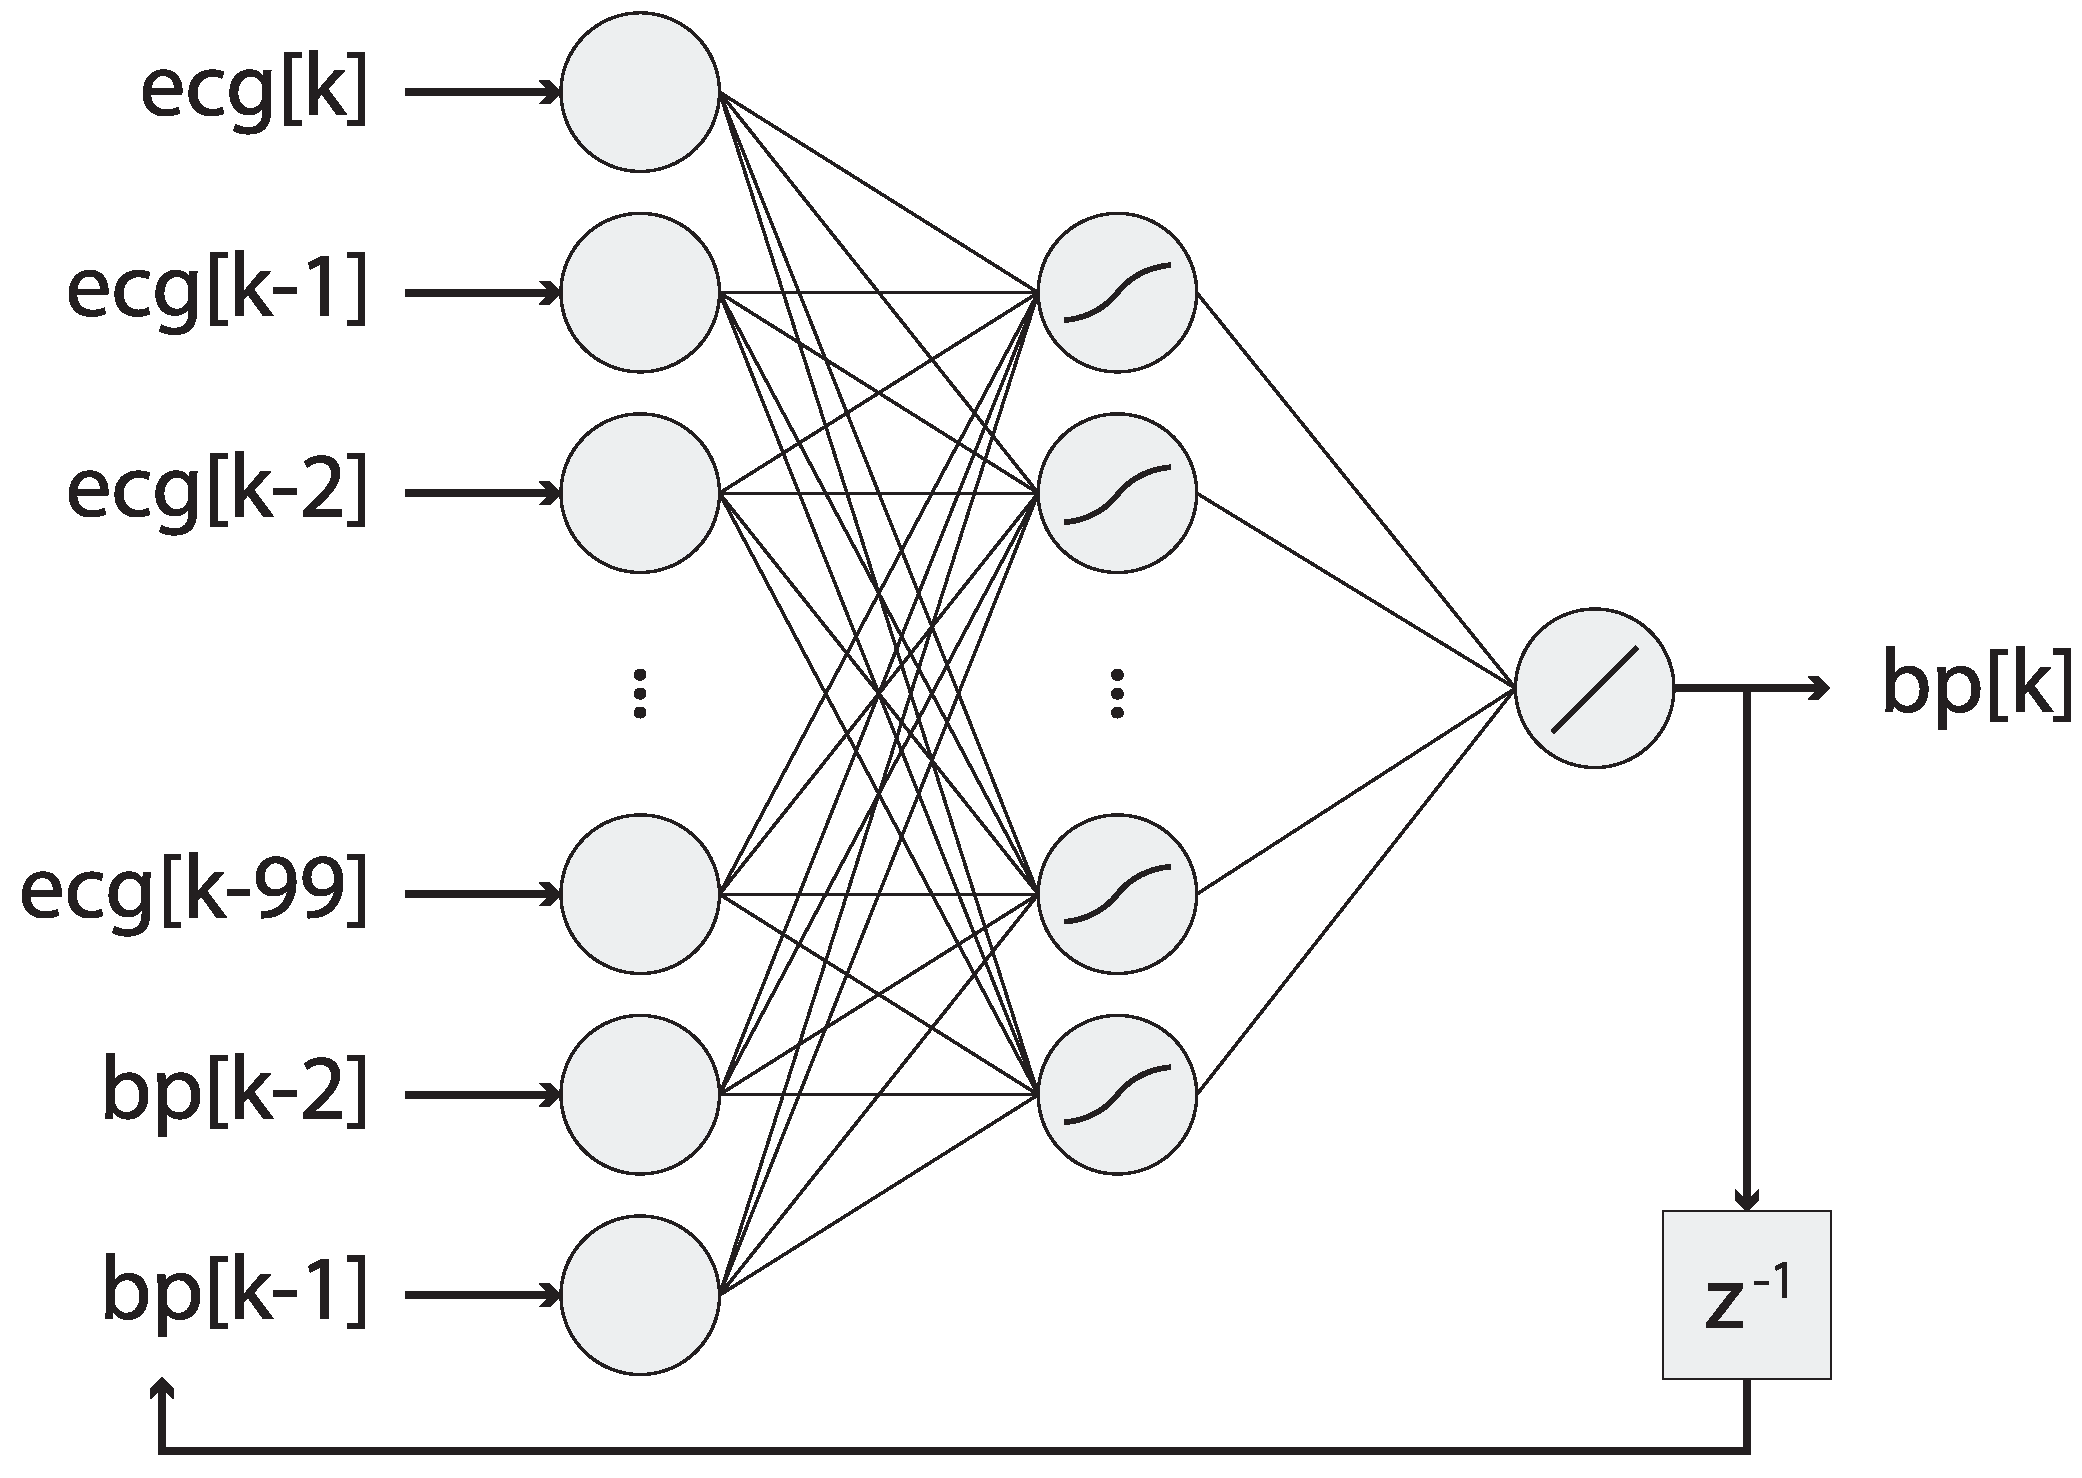
3.2. Bloodpressure Estimator

Blood pressure is inferred from the ECG signal with a NARX model with an ANN. The ANN in the model is a multilayer perceptron with 100 current and past ECG inputs and 2 delayed BP inputs as shown in Figure 2. The hidden layer consists of 10 neurons with a hyperbolic tangent activation function, while the output layer has only 1 neuron with a linear activation function. The number of ECG inputs (i.e., 100) was chosen to ensure that the ECG peak is still in the input values while predicting the BP peak. As those peaks are typically less than 0.8 s apart, 100 samples at 125 Hz is sufficient to realize this [9]. Since the MAX30001 samples the ECG at 128 Hz, the margin is slightly reduced to 0.78 s which is still sufficient. Therefore, no modifications were made to the original network for this application.
As stated, the NARX model derives the BP waveform from the ECG signal. However, we are only interested in the SBP and DBP waveforms. Assuming that the BP waveform has a maximum period of 1 s, the SBP and DBP can be derived by keeping a buffer of 128 past samples (i.e., 1 s) of the BP waveform. Every second, the SBP and DBP can be extracted from the buffer as the maximum and minimum values respectively. Consequently, the sample rate of the information is reduced to 1 Hz thus reducing the data volume by a factor of 128. Training and testing of the model are performed in Matlab as described by Landry et al. [9] on the Cuff-Less Blood Pressure Estimation Data Set [14]. Trained parameters are exported from Matlab and used by a Pytorch implementation of the NARX model to allow for integration with the other software components. The estimation accuracy is not within the scope of this work. The proposed algorithm is deterministic and its performance does not rely on its training parameters, and thus it will not affect overall system performance. Therefore, training time was limited for convenience.

3.3. Metric Definitions

The main metrics for the performance evaluation are application latency, communication latency and volume, and power usage. Application latency (Figure 3c) is defined as the time required to compute and store the BP values starting at the time the segment is placed in the queue. Communication latency (Figure 3a) is the time required to transmit a segment of data to the cloud and send confirmation back. This includes the time required to ingest the network packets before they are processed, as Cooke and Fahmy [17] have done in their study. The communication volume is measured as the number of bytes per message sent to the cloud, without HTTP headers. Power usage is the overall power usage of the edge device. In order to acquire more insight into the latency metrics, additional time measurements of significant steps as shown in Figure 3 are collected during the process. Each time measurement is measured with nanosecond precision relative to a single system clock, therefore no clock synchronization between edge and cloud is required. Clock rate differences could have a small effect on the measurements, but these effects are negligible compared to other effects such as network latency and thread scheduling.

3.4. Experiments

A total of 20 tests of 10 minutes each are performed for the three approaches with batch sizes 32, 64, 128, 256, and 512. The edge processing approach was tested with and without GPU acceleration. Each test is executed for 10 minutes such that randomness can be averaged out. During the tests, the cloud containers were deployed to Azure Container Instances in the closest available data center, of which the HTTP server responsible for estimation received 1 CPU core and 1 GB of memory. The edge device (i.e., Nvidia Jetson Nano with ARM Cortex-A57 MPCore processor and 4 GB of memory) was connected to the Internet through a WiFi connection to a 4G modem. For these experiments it would be impractical to have the ECG sensor attached to a person. Therefore, we used the test mode of the MAX30001, which connects the on-board ADC to an internal oscillator producing an ECG-like signal. This test signal is then processed and transmitted to the edge device just like a real signal. On the edge device, the received samples are replaced by pre-recorded samples from the Cuff-Less Blood Pressure Estimation Data Set [14].

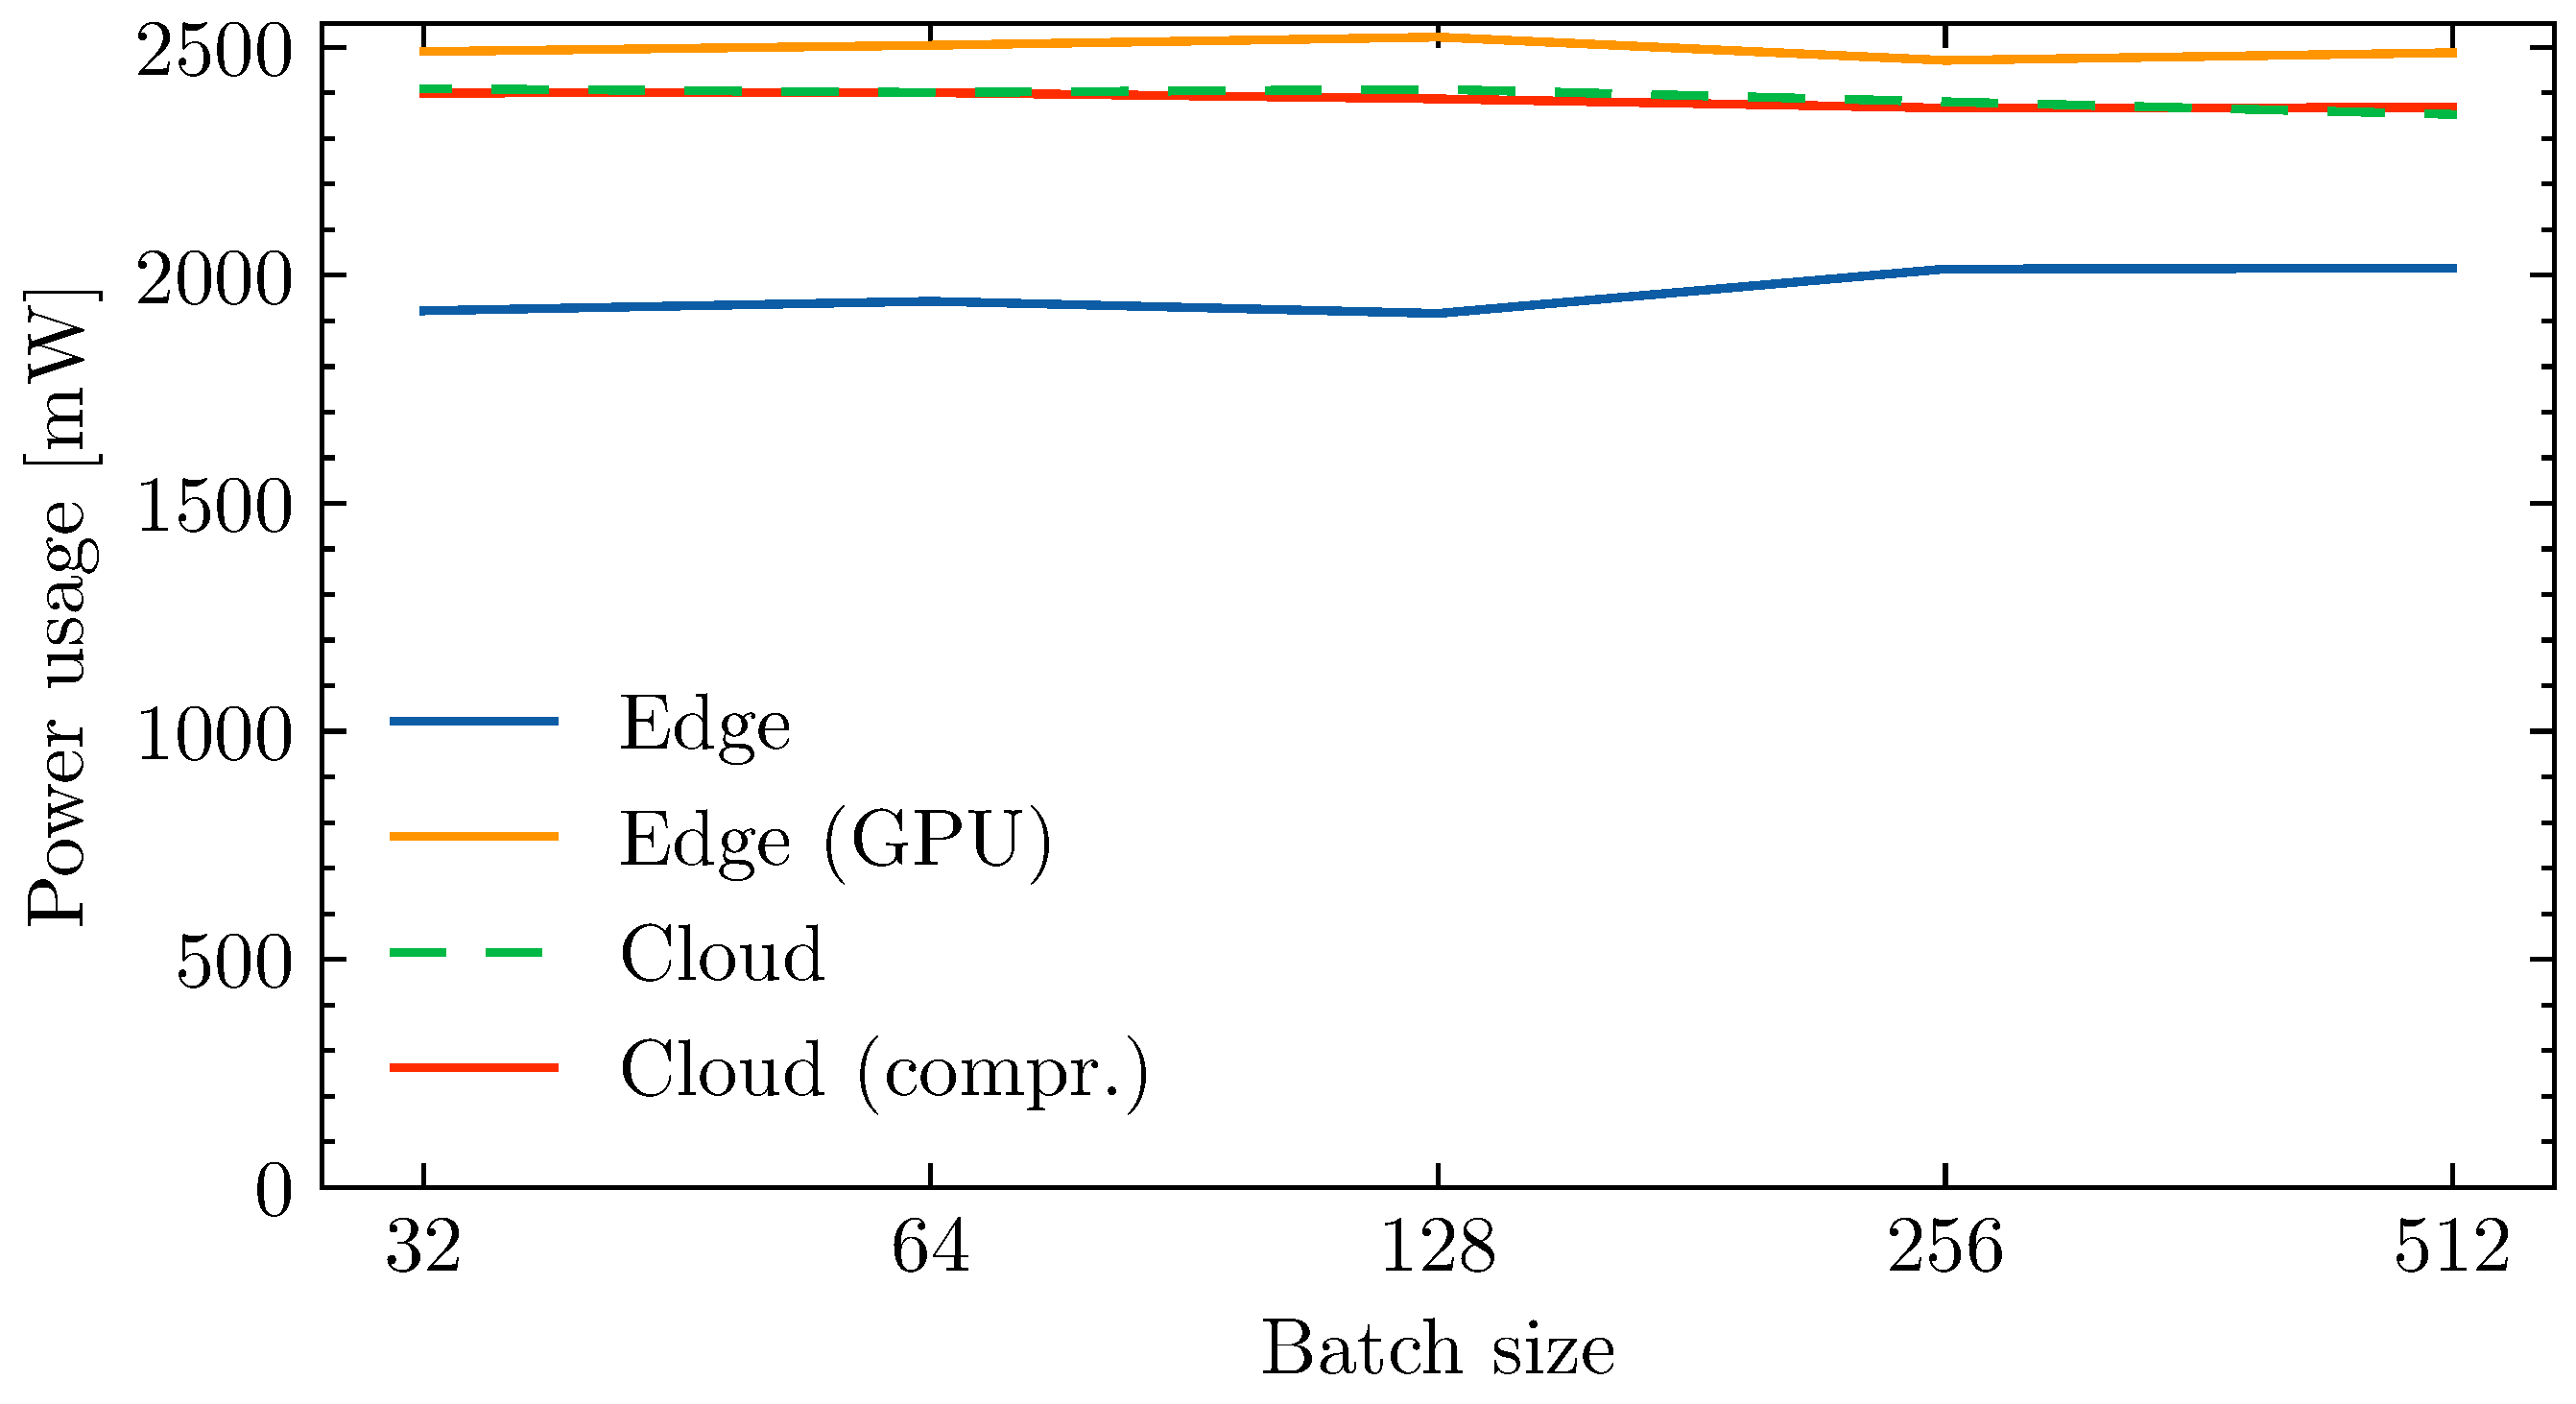
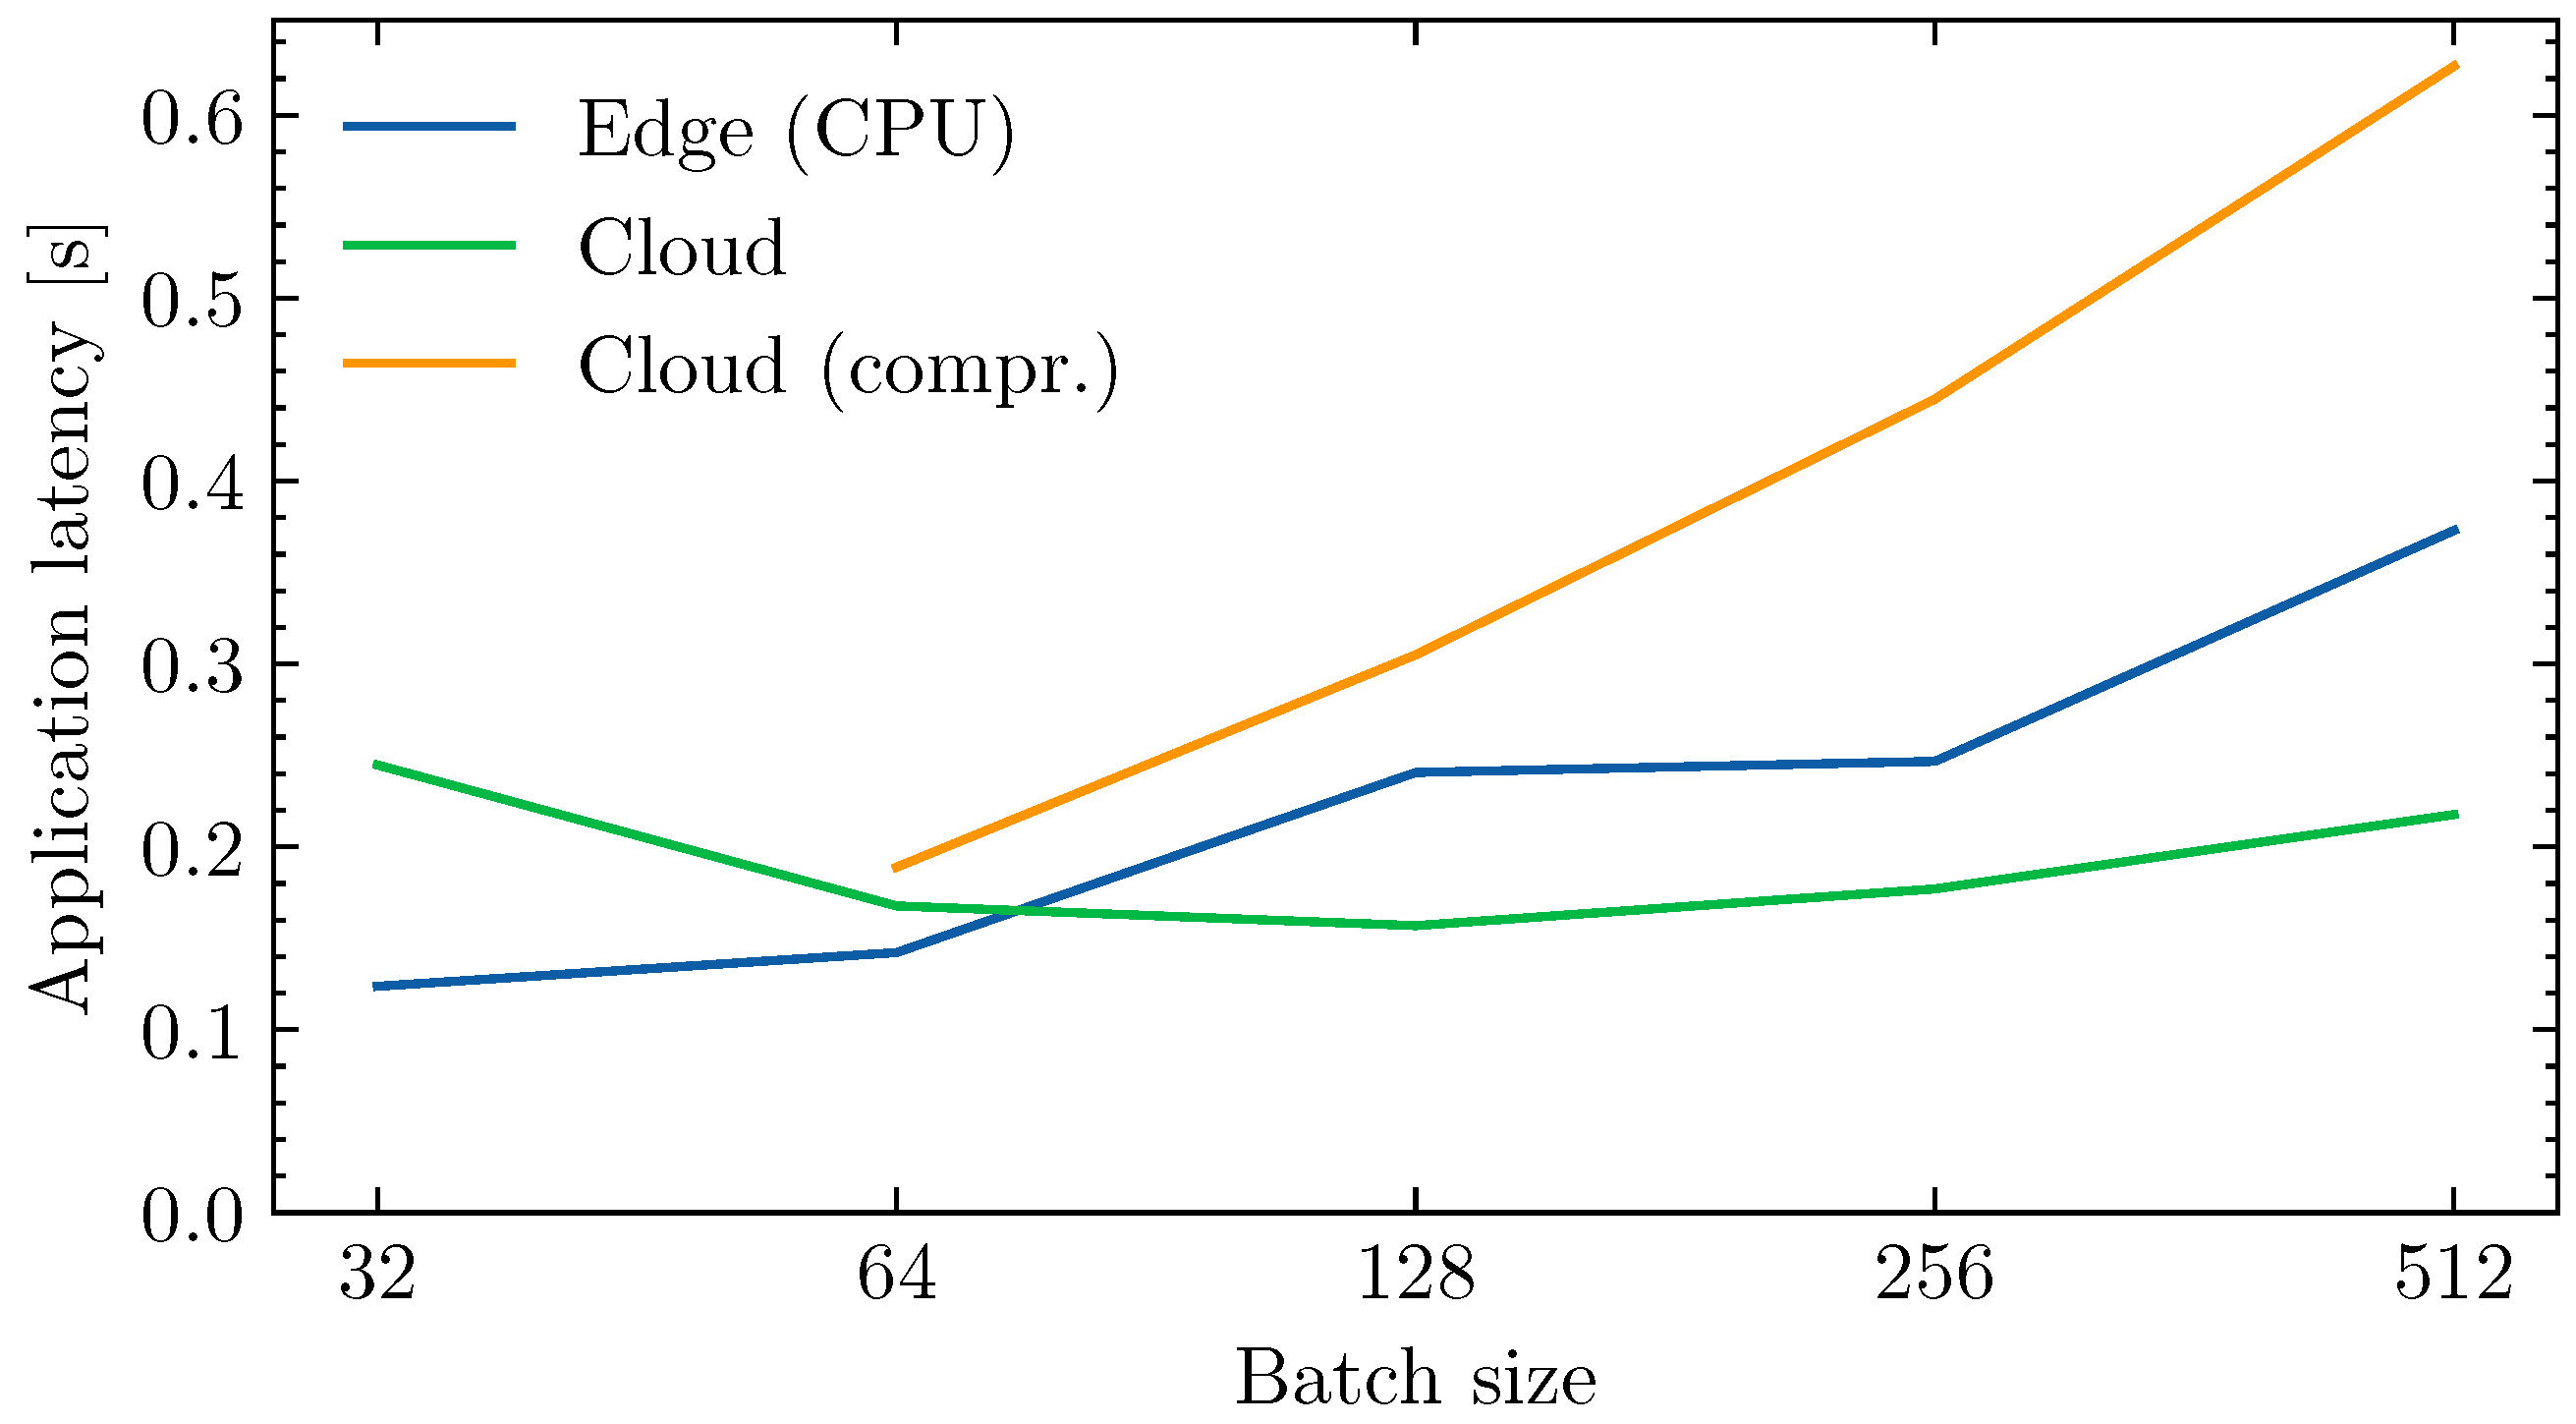
4. Results and Discussion

This section explains the results of real world experiments. The power usage of the edge device confirms that an edge-enabled system consumes less power, as stated in the introduction. As Figure 4 shows, the edge approach requires significantly less power than the other approaches. Because fewer data have to be transmitted to the cloud, the transmission time is reduced, thus reducing the power consumption. This reduction is significantly greater than the additional power required to do the estimation locally. However, when edge computing is performed with GPU acceleration, the power consumed by the edge device is even greater than the cloud approaches. By using the GPU for accelerating the estimation algorithm, the GPU on the device is activated increasing the overall power usage. As power consumption seems to be unaffected by compression, it is plausible that increased efforts to compress the data in the cloud cancels out the benefit of reduced transmission times.
Figure 5 presents the mean application latency of each experiment. The test with cloud computing, compressed transmission, and a batch size of 32 samples has been excluded as the application latency diverged to infinity. In that test, the application latency was longer than the batch period, causing the queue to be filled and the application latency to increase over time. A mild form of this effect can be seen for cloud computing with 32-sample batches. In this case (Figure 6), the queue fills up after each random spike of the communication latency, but the system is able to catch up when communication latency is low. These observations suggest that the batch size must be large enough such that the application latency is shorter than the batch period, but should still be kept small to avoid unnecessary application latency. Additionally, a larger batch will introduce more latency not included in these measurements as the age of the first sample in the batch increases. Overall, application latency is optimal for edge computing with a small batch size of 32 samples of BP data. For the cloud approach, the optimal batch is larger and contains 128 samples of ECG data.
Application latency is a complex measurement, including multiple data operations that affect the measurement differently. In order to understand the results better, it is interesting to break the measurement down as shown in Table 2 for batch size 128. For these, the cloud computing approach resulted in the lowest latency, mainly due to lower computation time. Compression does not reduce application latency; it introduces additional operations and increases the latency of existing operations. The communication latency for the edge approach is slightly higher in this case, probably due to network indeterminism. The network between the mobile device and the cloud node is used by millions of other devices, which causes the network performace to be time-variant. In this case, the network performance was degraded due to more traffic caused by other devices. In order to understand these results, both communication and computation latency are isolated and discussed on their own.
Naturally, message size increases with the number of samples in that message. With edge computing, the message consists of BP values at a significantly lower sample rate than the ECG signal, reducing the size. Applying compression to the ECG data limits the message size, but only when the batch size is large enough. Due to the introduced overhead during compression, data size is only reduced for batches with more than 128 samples. As batch size increases, the compression ratio increases to 2.04 for 512 samples. Compared to the reported ratio of Tsai and Kuo [16] (i.e., 2.77), the lower compression ratio we achieved could be attributed to shorter signals and differences in test data. Although message size increases with batch size, the total transmitted volume over 10 min decreases with batch size as there is less overhead in the message. The edge computing approach with batch size 512 is the most efficient regarding transmission volume, transmitting only 11.31 Kb over 10 min (see Figure 7).
Surprisingly, communication latency does not reflect the increase in message size. When the size of the messages is increased, more data need to be transmitted which should increase the time required to transmit it, and thus also the latency. Because this increase is not visible in the data, we can assume that the transmission time is negligible compared to the network latency between edge and cloud. Additionally, while messages with compression are smaller in size, meaning that transmitting them should be faster, their communication latency is higher. This effect can be explained with a separate test: if data segments with increasing size are not processed in the cloud, the round trip time (RTT) of the HTTP requests is nearly constant. This was tested by transmitting 1500 data packets varying in size from 0 bytes to 2 13 bytes and measuring the average RTT for each size; RTT showed no clear trend and varied within a range of just 8.1 ms. This may be explained by the fact that the transmission time of packets (with size in this order of magnitude) is negligible compared to the latency introduced by the internet. Consequently, the observed increase in communication latency for cloud computing with compression should be caused by another factor. Its cause could be explained by looking at the CPU scheduling on the cloud server. The CPU used by the cloud node is shared with other cloud nodes that run on the same host, thus every node is preempted at regular intervals to allow every node to execute its applications and enforce the reserved CPU time. As message size increases, the decompression stage takes longer to decompress the message, using more of the CPU time allowed for the node. This causes new packets to be in the receive buffer for a longer time before they are processed, increasing the communication latency.
The computation latency, the time required to estimate BP from ECG, presented in Figure 8, clearly shows a computational complexity of O(n). As the algorithm processes ECG data sample by sample, this was to be expected. Naturally, the latency is higher when computation is performed on the edge device, as the cloud server is more powerful. The use of compression causes a slight increase in computation time, which could also be a consequence of thread scheduling.
The most striking result to emerge from the data is that GPU acceleration does not decrease but increase the computation time. A separate experiment was performed to study this effect in detail. A fully connected network with 102 inputs, a variable number of hidden neurons, and one output neuron was constructed, similar to the one that is used in the BP estimation. The average calculation time was then measured for an increasing number of hidden neurons with 500 random input vectors per iteration, both with and without GPU acceleration. As can be seen in Figure 9, calculation with GPU acceleration is only faster for networks with more than 2 11 hidden neurons. The calculations to be performed on the GPU are defined by CUDA kernels. Launching a kernel and transferring data between CPU and GPU causes significant overhead on the calculations if the amount of work performed by the kernel is too small [18]. As the network in this study has just 10 hidden neurons and the use of the GPU increases power usage, the GPU should not be used for this application. Optimizing the GPU acceleration can be performed using several techniques such as increasing the amount of work per kernel call, but these optimizations exceed the scope of this study.
In summary, these results confirm that edge computing is beneficial for reducing power usage, data transmission, and application latency. Additionally, results are immediately available on the edge device for local use. Yet, these findings cannot be extrapolated to all remote monitoring applications that extract information from an ECG signal. Both the data reduction and computation latency are affected by the estimation algorithm. If an algorithm does not reduce the data enough or is too complex for a mobile device, it may not be beneficial to use an edge-based approach. Specifically for the estimation in this study, it was shown that GPU acceleration does not reduce computation times, which is important to consider if an edge-enabled system would be developed using this method. In an effort to generalize this experiment, multiple estimation algorithms could be inserted in the same setup. However, this would not only require the performance to be compared but also the estimation accuracy. With only a single estimation method comparing the accuracy of estimations is not required as the method is deterministic and transmission or lossless compression does not alter the data. Cloud computing with ECG compression only shows an improvement in transmitted volume compared to regular cloud computing but is still worse than edge computing. The compression is not efficient and effective enough to improve power usage and application latency. Despite these poor results, compression could still be good if ECG data should be stored in the cloud as well. In that case, it could still reduce transmission volumes. Although measures were taken to improve experiment validity (e.g., 10-min tests), results should still be interpreted with caution as essential features such as privacy and security were not accounted for and network characteristics can have a large effect on the system.

5. Conclusions

This work focused on developing a system for wireless IoT health monitoring, such as remote cuff-less BP monitoring, on which we evaluated the benefits of edge computing and compressed transmission. The information on the development of such a system and the performance of this specific case study, can help other researchers make decisions during the development of health monitoring systems. Although this study focused on BP monitoring, the findings may be relevant for big data applications in general. Our results confirmed that edge computing reduces application latency by 15%, total transmitted data volume by 85%, and power usage by 19% with a batch size of 64 ECG samples. This reduces network congestion and increases battery life of the mobile device. We also proved that the method proposed by Landry et al. [9] does not benefit from GPU acceleration in any way. Experiments also showed that compressed transmission is a reasonable solution to reduce network congestion when edge computing is impractical. Although this disturbance factor is also present in a real system, one source of weakness in this study that could have affected the time measurements is thread scheduling, which could be solved by using dedicated hardware. An effort to optimize the GPU acceleration could improve the benefits of edge computing even further for this use case. More broadly, further research can explore how other methods that extract information from ECG fit into the edge computing paradigm.

Author Contributions

This paper was written as part of the Master’s thesis of W.G., H.F. and J.D. acted as academic supervisors and mainly provided support with writing. D.S. and D.M. acted as external supervisors and provided the thesis subject and assistance in executing the study itself which included planning, conceptualization, resources, and investigation. All authors have read and agreed to the published version of the manuscript.

Funding

This work was supported by the Swedish Research Council (Vetenskapsrådet) through the MobiFog starting grant.

Institutional Review Board Statement

Not applicable.

Informed Consent Statement

Not applicable.

Data Availability Statement

Publicly available datasets with electrocardiogram and blood pressure measurements were analyzed in this study. These are available in the Physionet repository [13] and in the UCI Machine Learning repository [14].

Conflicts of Interest

The authors declare no conflict of interest.

Abbreviations

The following abbreviations are used in this manuscript:
BPBlood pressure
ECGElectrocardiogram
GPUGraphics Processing Unit
SBPSystolic blood pressure
DBPDiastolic blood pressure
MAPMean arterial pressure
MLMachine learning
NARXNonlinear autoregressive exogenous
ANNArtificial neural network
LSTMLong short term memory
BiLSTMBidirectional long short term memory
FCFully connected
MAEMean absolute error
MEMean error
RTTRound trip time

References

  1. Dumka, A.; Sah, A. Chapter 6—Smart ambulance system using concept of big data and internet of things. In Healthcare Data Analytics and Management; Dey, N., Ashour, A.S., Bhatt, C., James Fong, S., Eds.; Advances in Ubiquitous Sensing Applications for Healthcare; Academic Press: Cambridge, MA, USA, 2019; pp. 155–176. [Google Scholar] [CrossRef]
  2. Hartmann, M.; Hashmi, U.S.; Imran, A. Edge computing in smart health care systems: Review, challenges, and research directions. Trans. Emerg. Telecommun. Technol. 2019, 33, e3710. [Google Scholar] [CrossRef]
  3. Abdellatif, A.A.; Mohamed, A.; Chiasserini, C.F.; Tlili, M.; Erbad, A. Edge Computing for Smart Health: Context-Aware Approaches, Opportunities, and Challenges. IEEE Netw. 2019, 33, 196–203. [Google Scholar] [CrossRef] [Green Version]
  4. Jha, C.K.; Kolekar, M.H. Electrocardiogram Data Compression Techniques for Cardiac Healthcare Systems: A Methodological Review. IRBM 2021, 43, 217–228. [Google Scholar] [CrossRef]
  5. Fan, X.; Wang, H.; Xu, F.; Zhao, Y.; Tsui, K.L. Homecare-Oriented Intelligent Long-Term Monitoring of Blood Pressure Using Electrocardiogram Signals. IEEE Trans. Ind. Inform. 2020, 16, 7150–7158. [Google Scholar] [CrossRef]
  6. Simjanoska, M.; Gjoreski, M.; Gams, M.; Madevska Bogdanova, A. Non-Invasive Blood Pressure Estimation from ECG Using Machine Learning Techniques. Sensors 2018, 18, 1160. [Google Scholar] [CrossRef] [PubMed] [Green Version]
  7. Mousavi, S.S.; Hemmati, M.; Charmi, M.; Moghadam, M.; Firouzmand, M.; Ghorbani, Y. Cuff-Less Blood Pressure Estimation Using Only the ECG Signal in Frequency Domain. In Proceedings of the 2018 8th International Conference on Computer and Knowledge Engineering (ICCKE), Mashhad, Iran, 25–26 October 2018; pp. 147–152. [Google Scholar] [CrossRef]
  8. Mousavi, S.S.; Charmi, M.; Firouzmand, M.; Hemmati, M.; Moghadam, M. A New Approach Based on Dynamical Model of The ECG Signal to Blood Pressure Estimation. In Proceedings of the 2019 4th International Conference on Pattern Recognition and Image Analysis (IPRIA), Tehran, Iran, 6–7 March 2019; pp. 210–215. [Google Scholar] [CrossRef]
  9. Landry, C.; Peterson, S.D.; Arami, A. Estimation of the Blood Pressure Waveform using Electrocardiography. In Proceedings of the 2019 41st Annual International Conference of the IEEE Engineering in Medicine and Biology Society (EMBC), Berlin, Germany, 23–27 July 2019; pp. 7060–7063. [Google Scholar] [CrossRef]
  10. Fan, X.; Wang, H.; Zhao, Y.; Li, Y.; Tsui, K. An Adaptive Weight Learning-Based Multitask Deep Network for Continuous Blood Pressure Estimation Using Electrocardiogram Signals. Sensors 2021, 21, 1595. [Google Scholar] [CrossRef] [PubMed]
  11. Miao, F.; Wen, B.; Hu, Z.; Fortino, G.; Wang, X.P.; Liu, Z.D.; Tang, M.; Li, Y. Continuous blood pressure measurement from one-channel electrocardiogram signal using deep-learning techniques. Artif. Intell. Med. 2020, 108, 101919. [Google Scholar] [CrossRef] [PubMed]
  12. Liu, W.; Wang, X.K.; Wang, L.H. Noninvasive Blood Pressure Classification based on ECG with ResNet Algorithm. In Proceedings of the 2021 IEEE International Conference on Consumer Electronics-Taiwan (ICCE-TW), Penghu, Taiwan, 15–17 September 2021; pp. 1–2. [Google Scholar] [CrossRef]
  13. Johnson, A.E.W.; Pollard, T.J.; Shen, L.; Lehman, L.w.H.; Feng, M.; Ghassemi, M.; Moody, B.; Szolovits, P.; Anthony Celi, L.; Mark, R.G. MIMIC-III, a freely accessible critical care database. Sci. Data 2016, 3, 160035. [Google Scholar] [CrossRef] [PubMed] [Green Version]
  14. Kachuee, M.; Kiani, M.M.; Mohammadzade, H.; Shabany, M. Cuff-less high-accuracy calibration-free blood pressure estimation using pulse transit time. In Proceedings of the 2015 IEEE International Symposium on Circuits and Systems (ISCAS), Lisbon, Portugal, 24–27 May 2015; pp. 1006–1009. [Google Scholar] [CrossRef]
  15. Tiwari, A.; Falk, T.H. Lossless electrocardiogram signal compression: A review of existing methods. Biomed. Signal Process. Control 2019, 51, 338–346. [Google Scholar] [CrossRef]
  16. Tsai, T.H.; Kuo, W.T. An Efficient ECG Lossless Compression System for Embedded Platforms with Telemedicine Applications. IEEE Access 2018, 6, 42207–42215. [Google Scholar] [CrossRef]
  17. Cooke, R.A.; Fahmy, S.A. Quantifying the latency benefits of near-edge and in-network FPGA acceleration. In Proceedings of the Third ACM International Workshop on Edge Systems, Analytics and Networking; EdgeSys’20; Association for Computing Machinery: Heraklion, Greece, 2020; pp. 7–12. [Google Scholar] [CrossRef]
  18. Tarjan, D.; Skadron, K.; Micikevicius, P. The Art of Performance Tuning for Cuda and Manycore Architectures. In Birds-of-a-feather session at Supercomputing (SC). 2009. Available online: https://www.cs.virginia.edu/~skadron/Papers/cuda_tuning_bof_sc09_final.pdf (accessed on 29 April 2022).
Figure 1. The sensor-edge-cloud architecture is composed of a MAX30001 EVSYS as ECG sensor, an Nvidia Jetson Nano as the edge device, and an HTTP server with InfluxDB database deployed to Azure Cloud Instances.
Jsan 12 00002 g001
Figure 2. The NARX model for BP estimation is a multilayer perceptron with one hidden layer that feeds back its output to the input of the network. The hidden layer has a hyperbolic tangent activation function and the output layer has a linear activation function.
Jsan 12 00002 g002
Figure 3. An overview of time-related metrics annotated on timelines that show the most significant steps in the application for the three different approaches.
Jsan 12 00002 g003
Figure 4. The mean power consumption of the edge device for different approaches and batch sizes confirms that edge computing is beneficial for reducing power usage.
Jsan 12 00002 g004
Figure 5. The mean application latency shows the mean time required to estimate BP from a batch of ECG samples and store the result in the cloud.
Jsan 12 00002 g005
Figure 6. When peaks in the communication latency occur, the application latency tends to increase quickly right after. Consequently, we can state that the variability in application latency is mostly dependent on the connectivity between the edge device and the cloud.
Jsan 12 00002 g006
Figure 7. The mean communication latency compared to the volume of transmitted data shows no relationship between them for edge computing and cloud computing without compression.
Jsan 12 00002 g007
Figure 8. The mean computation latency is higher for edge computing than for cloud computing. As expected, enabling compression does not affect computation latency.
Jsan 12 00002 g008
Figure 9. The average computation time of a fully connected network with 102 input neurons, a variable amount of hidden neurons, and one output neuron is only lower with GPU acceleration if the hidden layer has more than 2 11 hidden neurons.
Jsan 12 00002 g009
Table 1. Survey of algorithms for cuff-less blood pressure estimation through ECG measurement.
ReferenceECG LeadFeature ExtractionInferenceDatasetResult MetricResults
[6]I, II or IIIStacked ML classifier Random forest regressionSelf recordedMAESBP: 7.72 ± 10.22 mmHg DBP: 9.45 ± 10.03 mmHg MAP: 8.13 ± 8.84 mmHg
[7]IIRandom forest regressionMIMIC II v3.0MAESBP: 12.75 ± 12.15 mmHg DBP: 6.04 ± 6.42 mmHg MAP: 7.01 ± 7.00 mmHg
[8]V5/V6 or V1/V2AdaBoostRCVESMESBP: 1.125 ± 3.125 mmHg
[9]Not reportedNARXMIMIC II v3.0MESBP: −4.0 ± 5.9 mmHg DBP: 1.13 ± 2.9 mmHg
[5]IIBiLSTMMIMIC II v3.0MAESBP: 7.16 ± 10.83 mmHg DBP: 3.89 ± 5.90 mmHg MAP: 4.24 ± 6.47 mmHg
[11]IIRes-LSTMMIMIC IIIMAESBP: 7.10 ± 9.99 mmHg DBP: 4.61 ± 6.29 mmHg MAP: 4.66 ± 6.36 mmHg
[10]IIBiLSTMMIMIC II v3.0MAESBP: 7.69 ± 12.3 mmHg DBP: 4.36 ± 6.88 mmHg MAP: 4.76 ± 7.52 mmHg
[12]IIResNet-18Cuff-Less Blood Pressure Estimation Data Set87.89% accuracy (classification)
Note: Methods that used feature extraction are marked with ✓. Others are marked with ✗.
Table 2. Mean latencies in milliseconds of three experiments with batch size 128.
MethodEdgeCloudCloud (Compr.)
Queue14.1181.1183.703
Computation81.80811.59114.445
Communication72.0967.585130.546
Compression--55.513
Decompression--16.612
Application240.673156.918304.981
Disclaimer/Publisher’s Note: The statements, opinions and data contained in all publications are solely those of the individual author(s) and contributor(s) and not of MDPI and/or the editor(s). MDPI and/or the editor(s) disclaim responsibility for any injury to people or property resulting from any ideas, methods, instructions or products referred to in the content.

